Article

Eco-Hydrological Change and Its Implications for Sustainable Dryland Management in Xinjiang, China: A Multi-Source Remote Sensing Assessment


1
Xinjiang Center for Ecological Meteorology and Satellite Remote Sensing, Urumqi 830011, China
2
Department of Geography, Xinjiang Normal University, Urumqi 830054, China
3
Institute of Remote Sensing Satellite, China Academy of Space Technology, Beijing 100095, China
4
National Satellite Meteorological Centre, Beijing 100081, China
5
National Center for Space Weather, Beijing 100081, China
*
Author to whom correspondence should be addressed.
Sustainability 2026, 18(11), 5478; https://doi.org/10.3390/su18115478 (registering DOI)
Submission received: 5 April 2026 / Revised: 1 May 2026 / Accepted: 2 May 2026 / Published: 29 May 2026

Abstract

Dryland sustainability depends on how vegetation productivity and water-use processes respond to climatic variability and human intervention. Focusing on Xinjiang, China, this study assessed eco-hydrological change from 2000 to 2023 using multi-source remote sensing and climatic datasets. We integrated vegetation productivity and water-use efficiency into a composite EcoIndex, combined anomaly-based diagnostics with eco-hydrological synchrony analysis, and used pixel-level random forest attribution to identify dominant climatic and anthropogenic controls. The results show clear regional differentiation. Northern Xinjiang remained primarily climate-driven and maintained relatively stronger vegetation–water coupling, whereas Southern Xinjiang exhibited more pronounced human-induced restructuring, especially in oasis and cultivated areas. Eastern Xinjiang functioned as a transitional zone with weak coupling and high sensitivity to multiple pressures. Across Xinjiang, 63.27% of the area was classified as climate-dominated, 22.41% as human-dominated, and 14.32% as mixed influence. The results indicate that improvements in vegetation condition do not necessarily imply improved eco-hydrological coordination, and that mixed-influence zones may represent early-warning areas of sustainability risk. This study provides a spatial diagnostic framework for supporting sustainable land and water management, regional adaptation planning, and resilience-oriented governance in arid and semi-arid regions.

1. Introduction

Dryland ecosystems, constituting over 40% of the Earth’s terrestrial surface, represent some of the most ecologically fragile regions globally, where vegetation–water interactions are tightly constrained by hydroclimatic variability and increasingly perturbed by anthropogenic activities [1,2,3]. Among these landscapes, Xinjiang stands as a prototypical model, situated at the nexus of major continental orographic systems and expansive arid basins, offering a unique natural laboratory for examining eco-hydrological dynamics under multifactorial forcing regimes [4,5].
The functioning of vegetation in arid regions is fundamentally governed by the availability and partitioning of water resources. Long-term forest monitoring has further shown that soil moisture variability is closely associated with precipitation, temperature, and site conditions, making soil water availability a key mediator of forest–soil water interactions [6]. Climatic factors—precipitation patterns, soil moisture availability, and temperature regimes—establish the primary scaffolding for ecosystem productivity and resilience [7,8,9]. However, superimposed upon this climatic baseline are increasingly pervasive human-induced transformations, including agricultural expansion, urbanization, groundwater extraction, and hydrological engineering, which recalibrate natural water balances and vegetation responses [9,10]. Recent eco-hydrological alteration studies also emphasize the need to jointly detect regime shifts and attribute their climatic and anthropogenic controls, particularly when differentiated vulnerabilities may lead to divergent ecosystem trajectories [10]. These intertwined pressures manifest through complex, often nonlinear, eco-hydrological feedbacks, challenging conventional assumptions of stability and sustainability across dryland systems [11,12].
While vegetation indices such as NDVI have been widely employed to monitor ecosystem dynamics, their reliance on structural greenness proxies often obscures underlying physiological stresses and resource-use inefficiencies [13,14]. Similarly, water-use efficiency (WUE) metrics, though indicative of carbon–water trade-offs, may fail to capture subtle decouplings in coupled vegetation–water systems, particularly under transitional or multifactorial disturbance conditions [15,16]. A growing body of research underscores the necessity for integrative diagnostic frameworks that simultaneously account for vegetation vigor, resource-use efficiency, and systemic coupling strength, thereby providing a more holistic lens for understanding eco-hydrological stability and its erosion under compounded climatic and anthropogenic pressures [17].
In this context, Xinjiang’s pronounced spatial heterogeneity—spanning glacial-fed montane systems, irrigated oases, and hyper-arid desert margins—presents a compelling platform to investigate these dynamics [18,19,20]. Northern Xinjiang, characterized by orographic precipitation and mountain hydrology, offers relatively resilient ecosystems; Southern Xinjiang, increasingly shaped by intensive agricultural and urban development, illustrates human-mediated restructuring of eco-hydrological balances; and Eastern Xinjiang, constrained by extreme aridity, provides insight into ecosystems operating near environmental thresholds. Understanding the differentiated vulnerabilities and transitions across these subregions is critical for anticipating broader patterns of ecological resilience or collapse under ongoing environmental change [21,22].
However, three research gaps remain in current eco-hydrological assessments of dryland regions. First, many studies still rely on single vegetation or hydrological indicators, making it difficult to distinguish improvement in vegetation condition from improvement in vegetation–water coordination. Second, trend detection and driver attribution are often treated separately, limiting the ability to connect observed ecosystem changes with climatic and anthropogenic controls. Third, regional heterogeneity within large arid areas is often insufficiently resolved, especially in terms of identifying where climatic dominance, human dominance, and mixed influence produce different vulnerability pathways. These gaps constrain the use of existing assessments for early-warning diagnosis and region-specific dryland management.
To address these challenges, this study integrates multi-source remote sensing and climatic datasets spanning 2000–2023, constructing a composite diagnostic index (EcoIndex) that fuses vegetation productivity and water-use efficiency dimensions. Through standardized anomaly construction, ensemble-based pixel-wise attribution modeling, and continuous coupling diagnostics, we systematically disentangle the spatial and temporal contours of climatic and anthropogenic controls across Xinjiang’s landscapes [23,24]. Unlike traditional approaches that isolate singular indicators or assume linear driver–response relationships, our framework captures the emergent properties of coupled eco-hydrological systems, offering enhanced sensitivity to early signals of destabilization and transition [25,26].
Specifically, we seek to: (1) characterize the spatiotemporal evolution of vegetation–water interactions through EcoIndex dynamics and ecohydrological synchrony indices; (2) detect long-term trends and transitional patterns in ecosystem functionality, distinguishing areas of resilience, decline, and latent instability; (3) attribute dominant drivers of eco-hydrological change to climatic or anthropogenic forces at a pixel level, revealing the spatial reorganization of control regimes [27]; and (4) identify emergent mixed influence zones where coupled socio-ecological fragility is increasingly apparent. By bridging vegetation state, resource-use behavior, and driver attribution within an integrated analytical framework, we aim to refine the understanding of dryland eco-hydrological resilience under multifactorial stressors.
Beyond advancing methodological rigor, the insights from this study have critical implications for adaptive management and policy interventions in arid and semi-arid environments. Recognizing where climatic scaffolding persists, where anthropogenic perturbations dominate, and where transitional vulnerabilities surface is essential for prioritizing conservation efforts, designing sustainable land use strategies, and anticipating regime shifts under accelerating climatic and societal transformations [28,29]. More broadly, such spatially differentiated diagnosis is also relevant to climate-change adaptation and climate-neutrality agendas, which increasingly emphasize region-specific transition pathways rather than uniform policy responses [30]. Xinjiang’s evolving eco-hydrological landscape thus serves not only as a regional case study but also as a broader exemplar of the complex trajectories shaping dryland ecosystem stability in the Anthropocene [31].

2. Materials and Methods

2.1. The Study Area

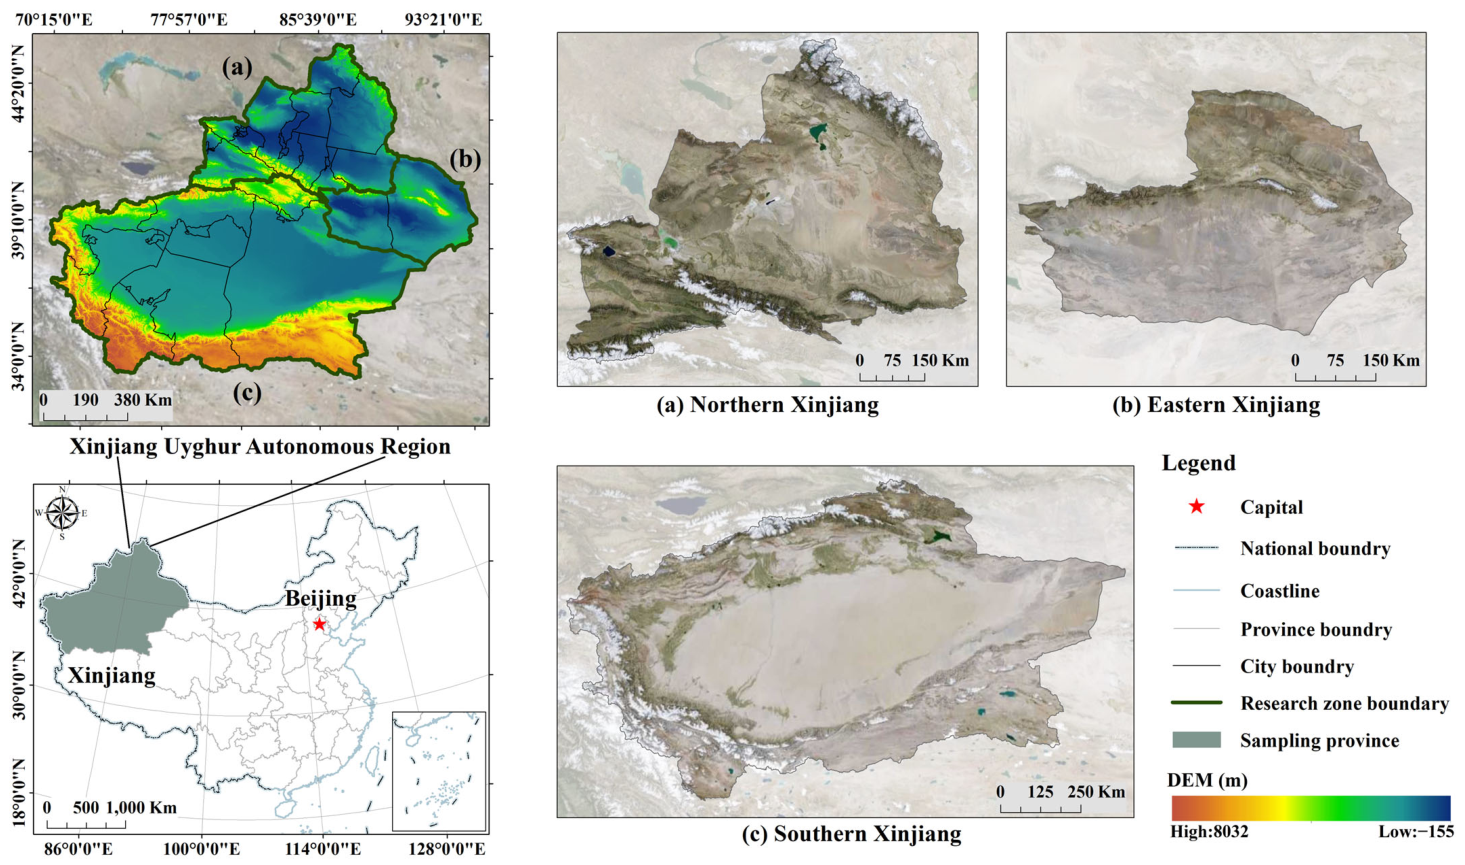
Situated at the heart of the Eurasian drylands, Xinjiang encapsulates a prototypical arid continental landscape, where interactions among major orographic systems and expansive basins orchestrate hydroclimatic and ecological heterogeneity [32]. The Tianshan Mountains demarcate distinct northern, southern, and eastern ecohydrological subregions, where gradients in elevation, precipitation regimes, and water availability jointly regulate vegetation distribution [33,34]. Orographic precipitation and glacial meltwater dominate hydrological inputs in montane zones, while basin regions depend predominantly on episodic rainfall, subsurface flow, and increasingly, anthropogenic water redistribution. This pronounced spatial heterogeneity positions Xinjiang as a natural laboratory for exploring vegetation–water interactions under multifactorial climatic and land-use regimes [35].
Within this framework, the three subregions display divergent ecohydrological trajectories shaped by the interplay of climatic and anthropogenic forces. Northern Xinjiang supports vertically stratified vegetation communities nourished by mountain-fed hydrology, though increasingly challenged by glacial retreat and shifts in snowmelt timing. Southern Xinjiang’s oasis ecosystems are sustained through extensive hydrological engineering and groundwater extraction, creating marked contrasts between irrigated and natural landscapes. In Eastern Xinjiang, extreme aridity, coupled with spatially discontinuous water resources, imposes significant constraints on vegetation persistence. Recent studies in Xinjiang have also reported pronounced spatial heterogeneity in oasis ecological quality and vegetation water-use responses to drought, further supporting the need to interpret eco-hydrological dynamics through regional differentiation rather than a single province-wide pattern [36,37]. Collectively, these gradients delineate a dynamic ecohydrological continuum, offering a natural experiment to unravel coupled vegetation–water system behaviors across disparate regimes [38]. The geographical location, topographic setting, and ecohydrological subregional divisions of Xinjiang are shown in Figure 1.

2.2. Data Sources and Processing

This study integrated a suite of remote sensing and climatic datasets spanning 2000 to 2023 to systematically characterize vegetation–water interactions across Xinjiang. Land cover dynamics were tracked using the China Land Cover Dataset (CLCD), providing a consistent environmental baseline for interpreting vegetation productivity and water use dynamics [39]. Ecosystem water loss and carbon assimilation were quantified through MODIS-derived evapotranspiration (ET) and gross primary productivity (GPP) products, critical indicators in arid ecohydrological systems [40,41]. Vegetation vigor and phenological variations were captured by the normalized difference vegetation index (NDVI), while human-induced transformations were assessed using an intercalibrated annual nighttime light product as a proxy for urbanization, infrastructure expansion, and other human activity intensity. Specifically, nighttime light intensity was expressed in radiance units of n W   c m 2   s r 1 , and temporally harmonized annual composites were used to reduce cross-sensor inconsistency and saturation-related bias. Hydroclimatic controls were characterized by precipitation (PR), soil moisture (SOIL), and average temperature (TEMP) from the TerraClimate database, offering high-resolution insights into water and energy balance dynamics [42]. The structure, purpose, and spatial resolution of these datasets are summarized in Table 1, establishing a comprehensive framework for subsequent ecohydrological analyses.
All datasets were sourced from publicly accessible repositories, including the China Land Cover Dataset archived on Zenodo (CLCD; Version 1.0.0; DOI: 10.5281/zenodo.4417810), NASA’s MODIS product archives (ET, GPP, NDVI), NOAA’s Earth Observation Group (nighttime lights), and the TerraClimate monthly climate and water-balance dataset for precipitation, soil moisture, and temperature. To ensure spatial and temporal coherence, all datasets were transformed to a common geographic coordinate system, clipped to the Xinjiang boundary, and resampled to a unified 825 m grid. Continuous variables, including ET, GPP, NDVI, nighttime light intensity, precipitation, soil moisture, and temperature, were resampled using bilinear interpolation, whereas categorical land-cover data were resampled using the nearest-neighbor method to preserve class labels. For temporal aggregation, monthly or higher-frequency products were converted to annual values according to variable type: ET, GPP, precipitation, and soil moisture were aggregated as annual sums or annual means following their physical meaning and product definition, whereas NDVI, nighttime light intensity, and temperature were summarized as annual means. Anomalous readings, such as occasional negative nighttime light values, were corrected through thresholding and neighborhood-based interpolation. This preprocessing framework minimized artifact propagation and preserved intrinsic spatiotemporal signals, thereby establishing a robust analytical foundation for subsequent ecohydrological assessments [43,44].
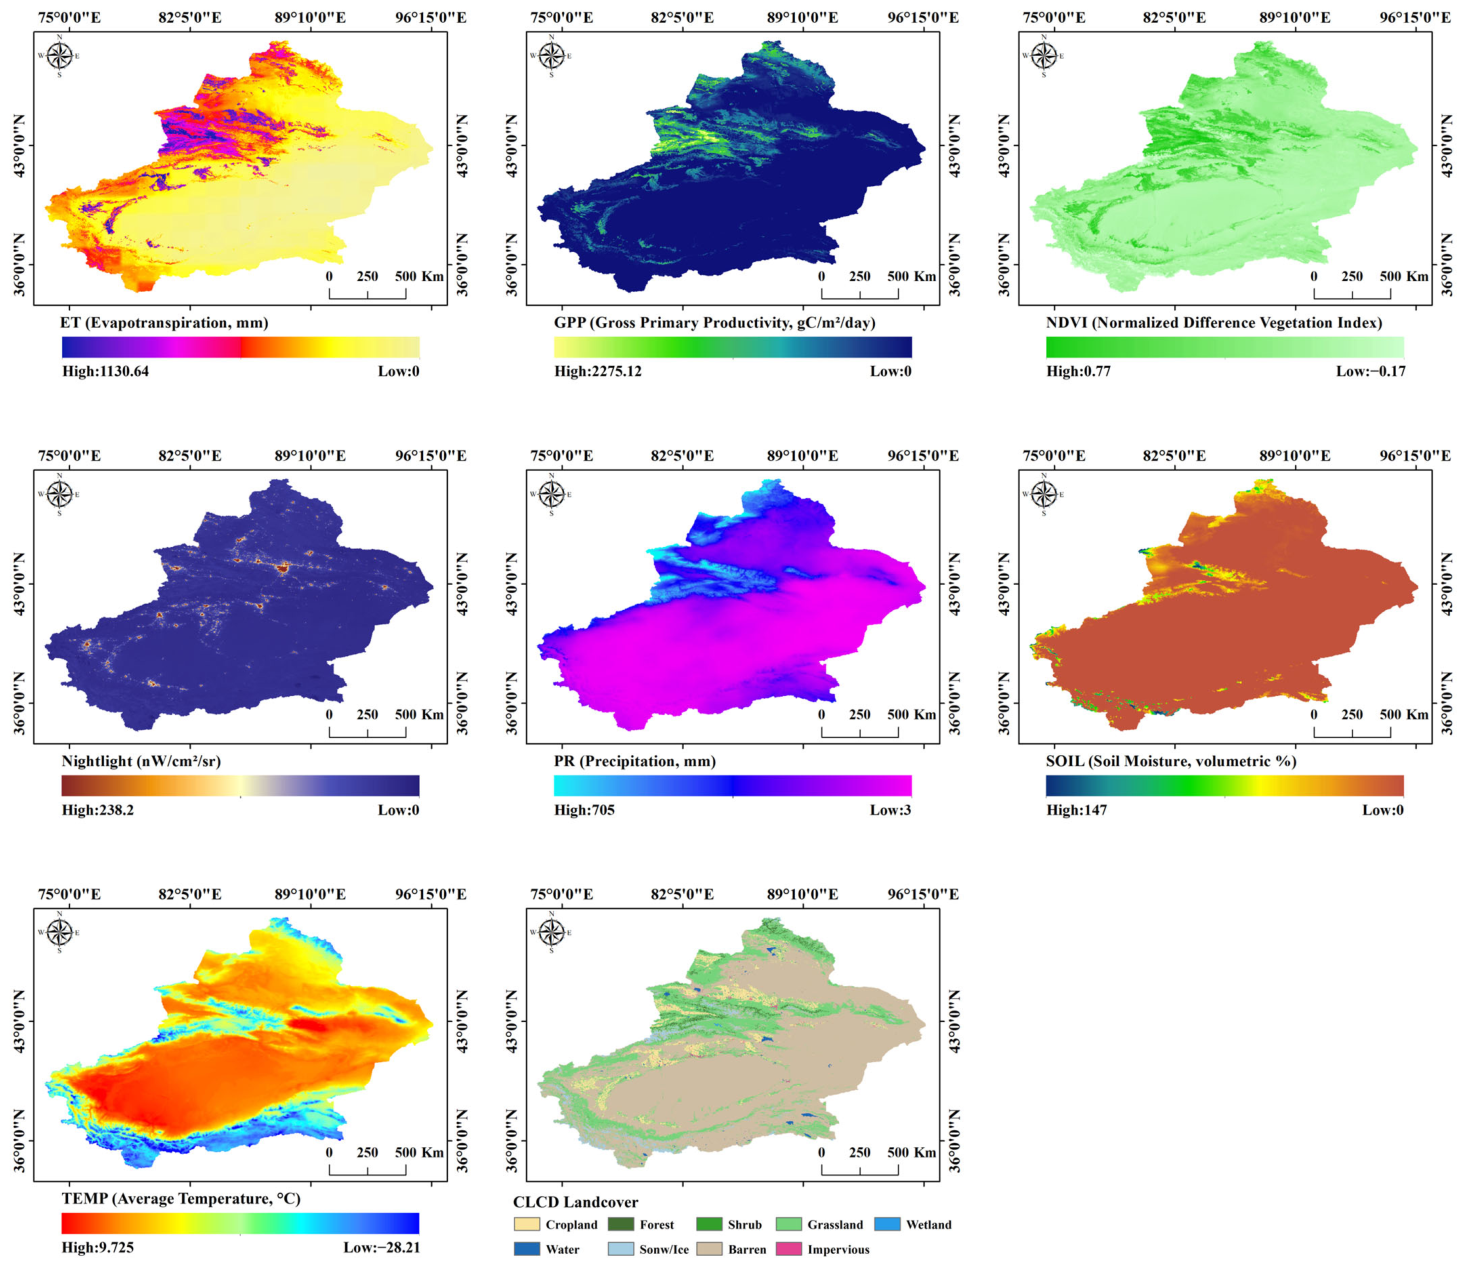
The spatial configuration of ecohydrological and anthropogenic indicators in 2023 (Figure 2) delineates a pronounced northwest-southeast gradient across Xinjiang. High ET, GPP, and NDVI values concentrate along montane corridors and river-fed oases, predominantly in Northern Xinjiang, whereas extensive barren surfaces dominate Southern and Eastern Xinjiang. Nighttime light emissions are highly localized around major urban centers such as Urumqi, Korla, and Kashgar, reflecting concentrated anthropogenic activities within vast sparsely populated hinterlands. Hydroclimatic variables—precipitation and soil moisture—exhibit a coherent decline from northwest to southeast, synchronized with rising temperatures across lowland basins, underscoring the intrinsic aridity gradient that governs regional ecosystem productivity [45,46].
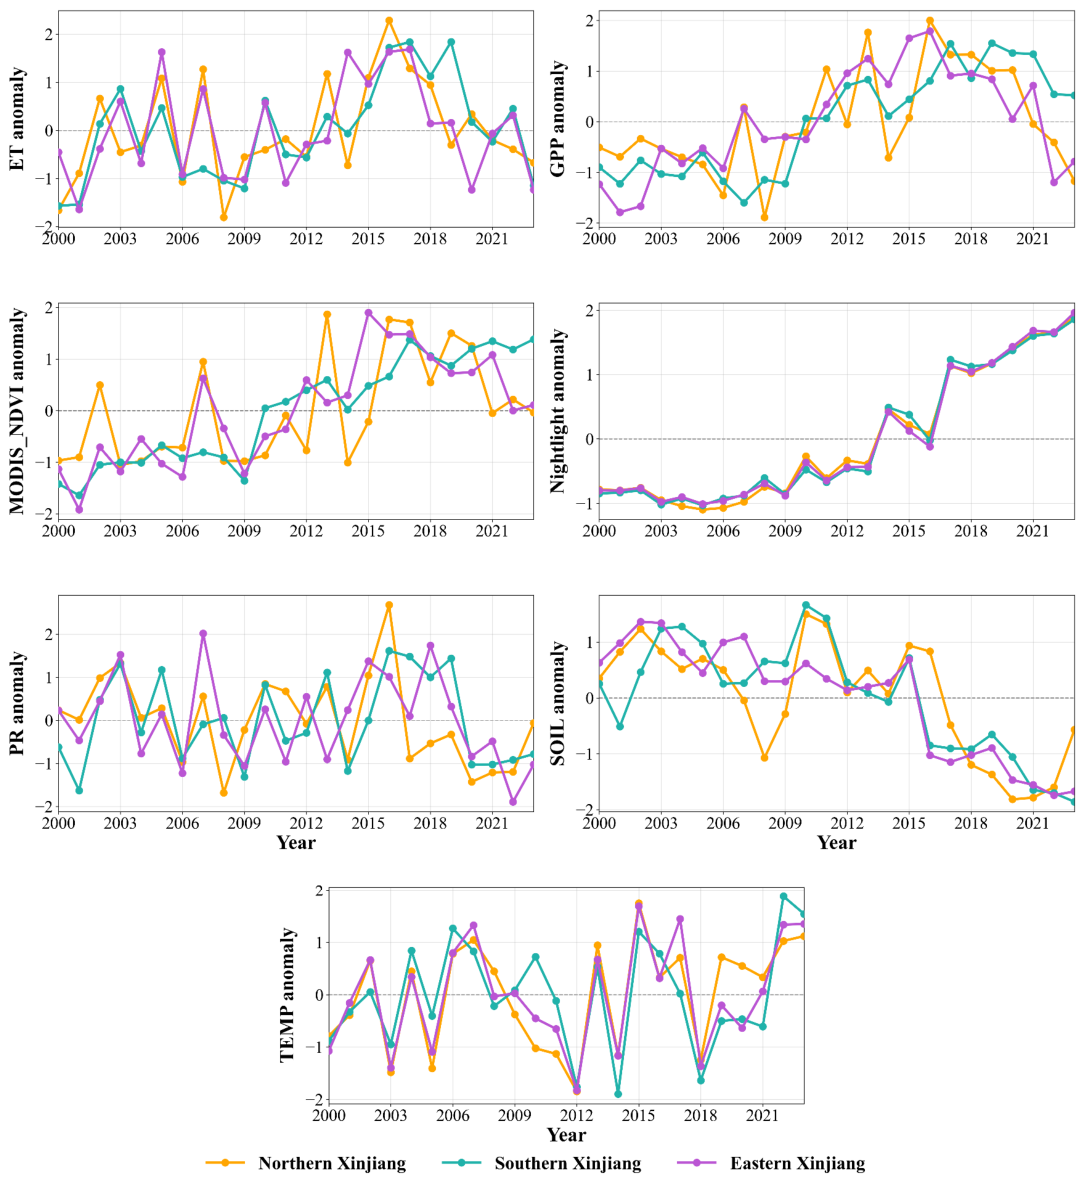
Temporal trajectories from 2000 to 2023 (Figure 3) further reveal divergent ecohydrological dynamics among subregions. In Northern Xinjiang, relatively stable ET and GPP trajectories, coupled with modest NDVI increases and progressive soil moisture depletion, suggest ecosystems operating near climatic equilibrium despite intensifying anthropogenic pressures, as evidenced by the sharp rise in nighttime luminosity. Southern Xinjiang exhibits transient peaks in ET and GPP around 2015–2017, followed by steep declines, indicating that ephemeral climatic amelioration was insufficient to counteract chronic water scarcity and thermal stress [47]. Eastern Xinjiang remains the most vulnerable subregion, characterized by persistently low ecohydrological activity despite marginal gains in vegetation indices and nighttime light, reflecting structural climatic constraints and limited anthropogenic modulation [48].
Collectively, these patterns underscore a hierarchical ecohydrological regime shaped by the interplay of climatic forcing and human activity. Regional disparities in vegetation–water coupling capacity are being amplified under ongoing warming and aridification, with Northern Xinjiang demonstrating relative resilience, Southern Xinjiang entering transitional instability, and Eastern Xinjiang remaining acutely constrained by extreme hydrothermal deficits [49,50]. The juxtaposition of near-equilibrium biophysical systems against accelerating anthropogenic transformation suggests that Xinjiang’s arid ecosystems are approaching critical thresholds in sustainable water-vegetation dynamics.

2.3. Algorithm

All algorithmic procedures were implemented on annual raster stacks harmonized to the same 825 m grid. A common valid-pixel mask was first generated using the intersection of valid observations from GPP, ET, NDVI, nighttime light intensity, PR, SOIL, TEMP, and CLCD. Pixels with missing values, invalid land-cover labels, or non-positive ET values were excluded from calculations involving WUE. Unless otherwise stated, all continuous variables were standardized using the mean and standard deviation calculated from valid observations over the full 2000–2023 period within Xinjiang. This ensured that the derived indicators were comparable across both space and time. The main computational sequence was: (1) annual WUE calculation; (2) standardization of WUE and NDVI; (3) EcoIndex construction using fixed eigenvector weights; (4) quadrant transition classification; (5) ESI calculation; (6) trend detection using Sen’s slope and Mann–Kendall testing; and (7) random forest-based attribution and dominance classification.

2.3.1. Construction of Integrated Ecohydrological Indices and Coupling Diagnostics

(1)
Composite Assessment via Ecohydrological Principal Index (EcoIndex)
A dual-layered ecohydrological diagnostic framework was constructed, comprising a composite principal index (EcoIndex) and dynamic coupling metrics, to holistically capture the spatial-temporal nuances of vegetation–water interactions under multifactorial drivers. The rationale for integration stems from the need to jointly capture vegetation productivity and resource-use efficiency—two axes that individually provide partial, but together offer holistic insights into ecosystem adaptive responses in arid regions. Remote sensing-based ecohydrological indicator studies have similarly emphasized the value of WUE and related efficiency metrics for characterizing coupled carbon–water–energy processes across heterogeneous ecosystems [43]. Singular indicators may fail to reveal the nuanced trade-offs or synergies between carbon fixation and water conservation, whereas a combined framework better traces critical thresholds, degradation trajectories, and functional shifts [51,52].
Water Use Efficiency (WUE) can be interpreted differently across agricultural, physiological, and ecosystem studies. In agricultural contexts, WUE is often related to crop production or economic output per unit of water consumption, whereas in plant physiological studies, it may refer to carbon gain relative to water loss at the leaf or plant scale. In this study, WUE specifically refers to ecosystem-scale water use efficiency, defined as the apparent carbon gain per unit of total ecosystem water loss. It is therefore used to characterize the ecohydrological trade-off between vegetation productivity and evapotranspiration. WUE was derived as:
W U E = G P P E T
where GPP denotes gross primary productivity and ET represents total evapotranspiration. Because ET includes both vegetation transpiration and soil/canopy evaporation, the WUE used in this study should not be interpreted as Transpiration Efficiency, which generally refers more specifically to carbon gain or biomass production per unit of transpired water. WUE thus emerges as a pivotal diagnostic axis, bridging biophysical function with resource constraints under aridification stress.
To integrate WUE with the Normalized Difference Vegetation Index (NDVI)—a proxy for structural vegetation greenness—a Maximum Variance Projection (MVP) approach was employed. Instead of simple averaging or arbitrary weighting, MVP seeks an optimal linear combination that maximizes the variance along the principal ecohydrological trajectory. Let the standardized vectors of WUE and NDVI be denoted as
X = [ X 1 X 2 ]   w h e r e   X 1 = W U E ,   X 2 = N D V I
The covariance matrix S is constructed as
S = [ 1 r r 1 ]
where r is the Pearson correlation coefficient between WUE and NDVI after standardization.
The objective is to solve for the optimal projection vector l = [ l 1 l 2 ] that maximizes the projected variance:
max 1 V a r ( l X ) = l S l     s u b j e c t   t o     l = 1
This leads to a classical eigenvalue decomposition problem:
S l = λ l
The eigenvector associated with the largest eigenvalue λ max = 1 + r yields the coefficients l 1 and l 2 , which respectively quantify the relative contribution of WUE and NDVI to the composite index, ensuring maximal information retention.
Finally, the EcoIndex is formulated as
E c o I n d e x = l 1 × W U E + l 2 × N D V I
where both WUE′ and NDVI′ are z-score standardized variables. This construction ensures that EcoIndex captures dominant ecohydrological variations by optimally integrating resource-use efficiency and structural vegetation dynamics. For reproducibility, the MVP coefficients were estimated once using all valid WUE and NDVI samples from the 2000–2023 annual raster stack, rather than being recalculated separately for each year. The eigenvector corresponding to the largest eigenvalue of the covariance matrix was then fixed and applied to all annual images. If the two eigenvector coefficients were both negative, the sign of the eigenvector was reversed so that larger EcoIndex values consistently represented stronger vegetation greenness and higher ecosystem-scale water-use efficiency. This fixed-weight strategy avoids artificial interannual changes caused by recalculating the projection direction and ensures temporal comparability of EcoIndex values.
In the present implementation, the full-period MVP yielded nearly balanced eigenvector coefficients, with 0.707 for WUE′ and 0.707 for NDVI′. Thus, the EcoIndex used in all annual analyses was calculated as EcoIndex = 0.707 × WUE′ + 0.707 × NDVI′. To examine the temporal stability of the weighting scheme, the annual correlation between WUE′ and NDVI′ was calculated for each year. The annual correlations remained positive throughout the study period, ranging from 0.382 to 0.641, indicating that the dominant projection direction consistently represented the joint enhancement of vegetation greenness and ecosystem-scale water-use efficiency. Therefore, the fixed full-period eigenvector provides a stable and temporally comparable projection direction. These small interannual variations indicate that the fixed full-period eigenvector provides a stable projection direction and avoids artificial temporal fluctuations caused by recalculating weights year by year.
In addition to the composite EcoIndex, two complementary diagnostic frameworks were developed to capture vegetation–water interactions across both continuous and categorical dimensions. First, the Ecohydrological Functional Classification partitions the temporal derivatives of WUE and NDVI into four distinct regimes—co-enhancement, co-degradation, stress release, and emerging stress—allowing discrete functional transitions to be spatially and temporally mapped. Second, the Vectorized Synergy Quantification leverages the cosine similarity between standardized WUE and NDVI vectors to continuously track coordination strength, sensitively reflecting synchronization or decoupling of ecohydrological processes under climatic and anthropogenic influences. Together, these dual-resolution metrics offer a rigorous lens for deciphering both gradual and abrupt dynamics in arid ecosystem functioning.
These dual pathways enable a dual-resolution interrogation of ecohydrological dynamics, simultaneously revealing functional state transitions and tracing the stability of vegetation–water coupling. This hybrid diagnostic system, grounded in vector field theory, transcends the limitations of single-variable analyses, providing a mathematically rigorous lens to assess how arid ecosystems adapt—or destabilize—under complex multi-scale forcings.
(2)
Continuous Assessment via Ecohydrological Synchrony Index (ESI)
The degree of coordination between vegetation vigor and water use efficiency was quantified using an Ecohydrological Synergy Index (ESI), derived from the cosine similarity between the normalized WUE and NDVI vectors across spatial units:
E S I = i = 1 n W U E n o r m ( i ) × N D V I n o r m ( i ) i = 1 n W U E n o r m ( i ) 2 × i = 1 n N D V I n o r m ( i ) 2
where W U E n o r m ( i ) and N D V I n o r m ( i ) are the standardized WUE and NDVI values at pixel i, and n is the number of valid observations. An ESI value approaching unity indicates a high degree of co-variation between vegetation productivity and water use efficiency, signifying an optimal ecohydrological coupling. To generate spatially explicit annual ESI maps, the cosine similarity was calculated within a 3 × 3 local spatial window centered on each valid pixel. For each year, standardized WUE and NDVI values within the local window were arranged as two vectors, and their cosine similarity was assigned to the central pixel. At least five valid pixels were required within the 3 × 3 window; otherwise, the central pixel was assigned as no data. This local-window implementation preserves the spatial structure of vegetation–water synchrony and allows ESI to be mapped annually across Xinjiang.
(3)
Categorical Assessment via Quadrant Transition Mapping
To capture functional shifts in vegetation–water relationships, annual first differences in WUE and NDVI were calculated as
Δ W U E = W U E t W U E t 1 ,     Δ N D V I = N D V I t N D V I t 1
Based on the joint signs of Δ W U E and Δ N D V I , each pixel was classified into one of four ecohydrological functional quadrants. The ecological interpretation of the four quadrant types is summarized in Table 2.
In implementation, quadrant classification was performed pixel by pixel for each pair of consecutive years. Positive and negative changes were determined from the annual first differences in standardized WUE and standardized NDVI. To avoid assigning categories to numerical noise, a minimum-change threshold of 0.05 standardized units was applied to both WUE′ and NDVI′. Pixels with absolute annual changes below 0.05 for both indicators were treated as insignificant changes and left unclassified. Pixels were assigned to one of the four quadrants only when the annual change in at least one of the two standardized indicators exceeded this threshold. The same thresholding rule was applied consistently to all years and subregions.
The areal proportions of each quadrant were calculated annually to track shifts in ecohydrological functional states over the 24-year period.
This dual characterization framework allows for both continuous (cosine similarity) and categorical (quadrant classification) assessment of vegetation–water interactions, enabling refined detection of regional ecohydrological transitions under climatic and anthropogenic forcing.

2.3.2. Detection of Temporal Trends in Ecohydrological Processes

To systematically diagnose the temporal evolution of ecohydrological dynamics, a two-tiered detection framework was implemented, capturing both long-term change magnitudes and trend significance. This approach ensures a robust dissection of persistent ecohydrological shifts across the study period.
The rate of change for EcoIndex and Ecohydrological Synergy Index (ESI) was quantified using the non-parametric Sen’s Slope estimator, which provides a robust median-based estimate unaffected by outliers or data normality assumptions. For a given time series X , the slope is computed as
S l o p e = m e d i a n ( X j X i j i ) , 1 i < j n
where n is the number of observations, and X i , X j are sequential values. The Sen’s Slope thus offers a stable measure of the underlying temporal gradient, serving as a foundational metric for assessing the direction and velocity of ecohydrological changes.
Subsequently, the significance of detected trends was evaluated using the Mann–Kendall Test, a rank-based method that evaluates monotonic trends without assuming linearity. The test statistic S is given by
S = i = 1 n 1 j = i + 1 n s g n ( X j X i )
where the sign function is defined as
s g n ( x ) = { 1 , i f   x > 0 0 , i f   x = 0 1 , i f   x < 0
The significance of S was then evaluated against the null hypothesis of no trend, providing a rigorous basis for inferring persistent ecohydrological changes across Xinjiang during the period 2000–2023. In this study, statistical significance was evaluated at p < 0.05. Pixels with p < 0.05 and positive Sen’s slope were classified as “Up”, pixels with p < 0.05 and negative Sen’s slope were classified as “Down”, and pixels with p ≥ 0.05 were classified as “Stable”.

2.3.3. Attribution of Ecohydrological Dynamics via Ensemble Driver Modeling

To quantitatively disentangle the climatic and anthropogenic forces shaping vegetation–water interactions, a driver attribution model based on ensemble regression was developed. Rather than assuming linear relations, a Random Forest (RF) framework was adopted for its robustness to nonlinearities, interactions, and collinearity, properties critically aligned with the inherent complexity of arid ecosystem dynamics. Similar machine-learning attribution frameworks have been used to quantify the relative roles of climate and human activities in vegetation change, especially where nonlinear driver–response relationships limit the applicability of traditional regression models [53].
The modeling process considered five primary predictors: precipitation (PR), soil moisture (SOIL), average temperature (TEMP), nighttime light intensity (NL), and land cover class transitions (LC). For each year t and pixel i, standardized anomalies were computed as
X i , t = X i , t X ¯ i σ X , i
where X i , t represents the original variable value, X ¯ i is the long-term mean, and σ X , i is the standard deviation over the period 2000–2023. The response variable, EcoIndex anomaly E ^ I i , t , was constructed in a parallel manner.
The Random Forest model establishes an ensemble of decision trees { T b } b = 1 B , where each tree partitions the predictor space { P R , S O I L , T E M P , N L , L C } into regions minimizing intra-node variance of E I . The prediction function takes the form:
E ^ I i , t = 1 B b = 1 B T b ( X i , t )
where B Impurity denotes the reduction in variance achieved by splits on variable v across all trees.
In implementation, the RF model was fitted using annual standardized anomalies as samples. For each valid pixel, the predictor vector consisted of PR, SOIL, TEMP, NL, and CLCD anomalies, and the response variable was the EcoIndex anomaly. The RF model was configured with a fixed random seed to ensure reproducibility. The main parameters were set as follows: number of trees = 500, maximum tree depth = unlimited, minimum samples per leaf = 1, minimum samples for split = 2, bootstrap sampling = yes, and random seed = 42. Model performance was evaluated using out-of-bag (OOB) prediction generated by bootstrap sampling in the random forest model. The coefficient of determination (R2) and root mean square error (RMSE) were calculated between observed and OOB-predicted EcoIndex anomalies. Because the response variable was the standardized EcoIndex anomaly, RMSE is reported in standardized units. The RF model showed acceptable predictive performance, with an OOB R2 of 0.712 and an RMSE of 0.318 for Xinjiang overall. Regionally, the model performed best in Northern Xinjiang (R2 = 0.746, RMSE = 0.291), followed by Southern Xinjiang (R2 = 0.681, RMSE = 0.336) and Eastern Xinjiang (R2 = 0.637, RMSE = 0.354). Predictor importance was calculated from the impurity reduction in each variable and then normalized so that the importance values of all predictors summed to one for each model. For dominance classification, the climatic importance was defined as the maximum normalized importance among PR, SOIL, and TEMP, whereas the anthropogenic importance was defined as the maximum normalized importance between NL and CLCD. A pixel was classified as climate-dominated when climatic importance exceeded anthropogenic importance by more than δ, and as human-dominated when anthropogenic importance exceeded climatic importance by more than δ. Pixels with an absolute difference smaller than or equal to δ were classified as mixed influence. In this study, δ was set to 0.05, meaning that a difference in more than five percentage points in normalized group-level importance was required to assign a clear climatic or anthropogenic dominance label.
At each pixel, the dominant control mechanism was attributed based on the maximum normalized importance among climatic (PR, SOIL, TEMP) and anthropogenic (NL, LC) predictors. Pixels satisfying:
max ( I m p o r t a n c e ( P R ) , I m p o r t a n c e ( S O I L ) , I m p o r t a n c e ( T E M P ) ) > m a x ( I m p o r t a n c e ( N L ) , I m p o r t a n c e ( L C ) )
where classified as climatically dominated, and vice versa. In cases where the maximum importance difference fell below a threshold ϵ , a mixed influence label was assigned, capturing areas under coupled natural-anthropogenic regulation.
By integrating anomaly normalization, ensemble-based prediction, and impurity-driven attribution, this method circumvents the restrictive assumptions of traditional regression analyses, providing a mathematically rigorous and ecologically meaningful dissection of ecohydrological control regimes across Xinjiang’s complex environmental gradients.

3. Results

3.1. Spatiotemporal Dynamics of Eco-Structural Traits in Xinjiang (2000–2023)

Capturing the spatial and temporal dynamics of ecological functioning demands not isolated snapshots, but an integrative understanding of how productivity and resource-use efficiency co-evolve across stress gradients. Rather, it demands a layered understanding of how productivity and resource use efficiency interact, diverge, and realign over time. In arid and semi-arid landscapes such as Xinjiang, where environmental thresholds are frequently tested, subtle shifts in eco-hydrological relationships may signal broader ecological transitions long before they manifest visibly. Against this backdrop, a systematic examination of EcoIndex trajectories, quadrant-based directional patterns, and eco-hydrological synchrony provides a composite lens through which the stability, resilience, and emerging vulnerabilities of the region’s ecosystems can be inferred [54,55].
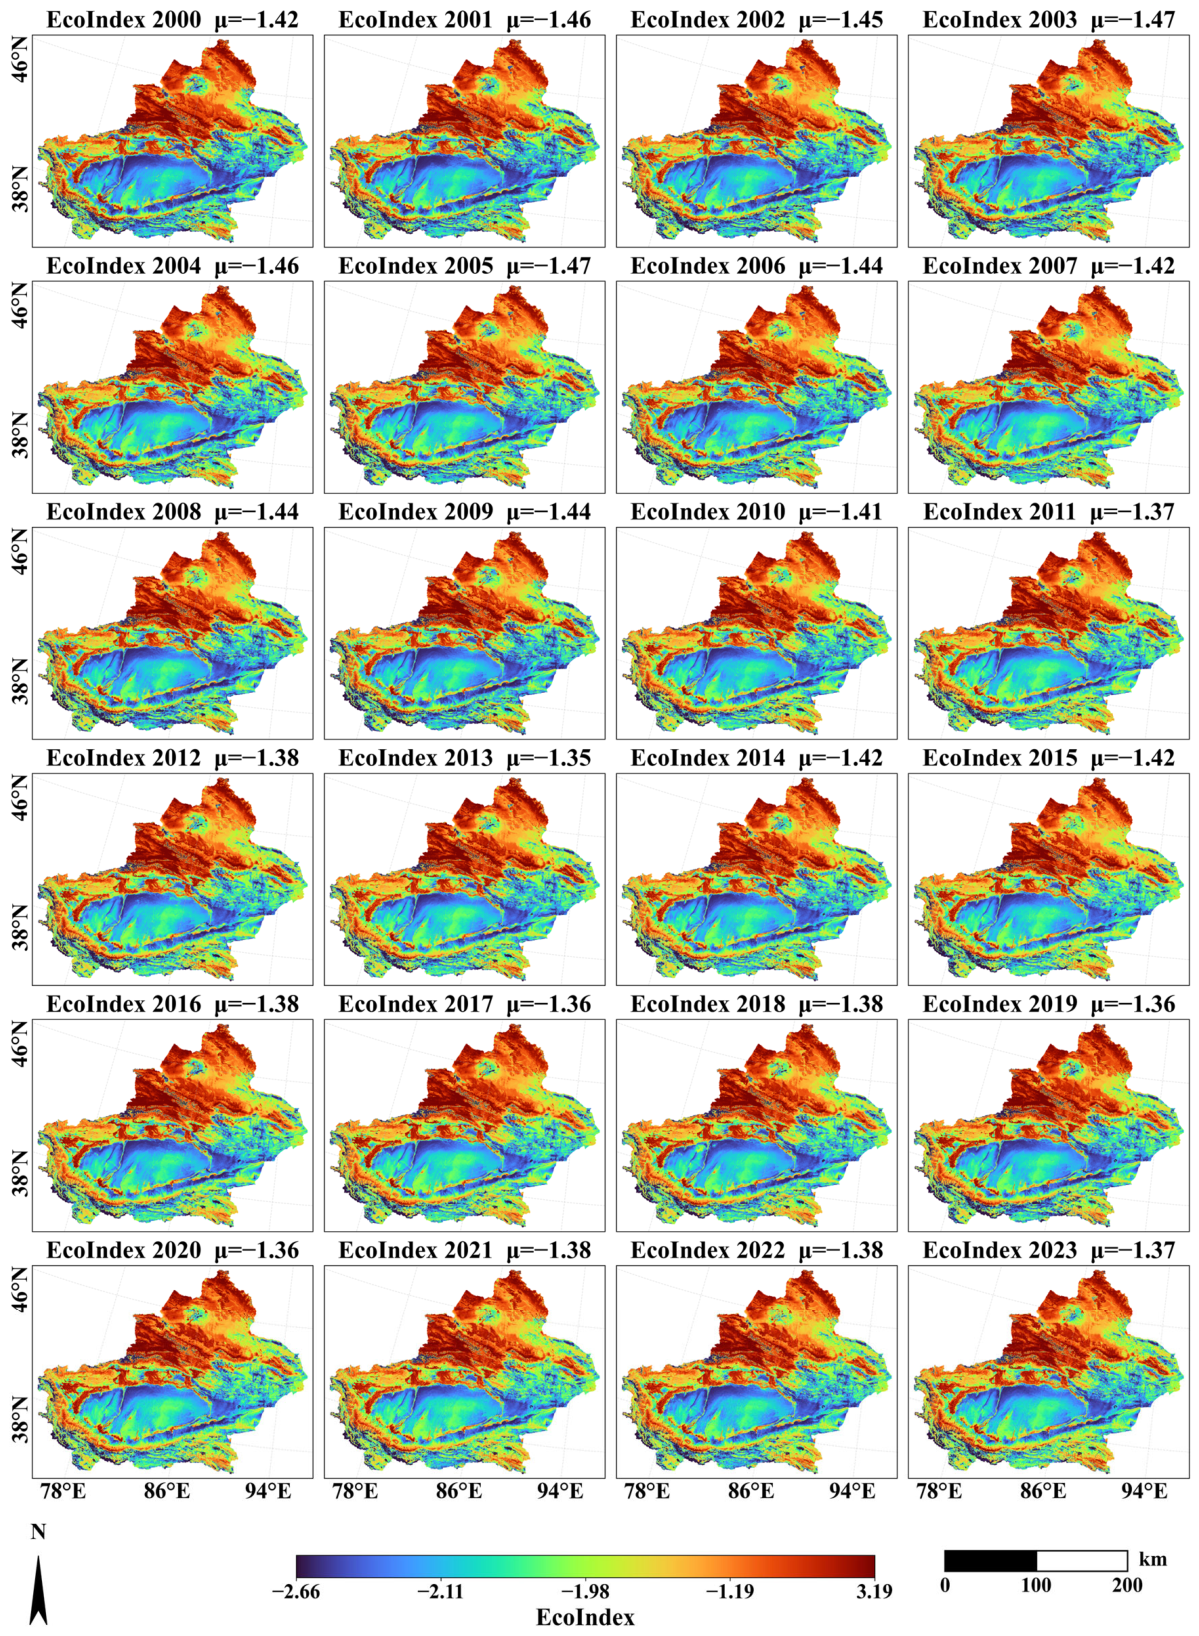
The spatial and temporal evolution of EcoIndex across Xinjiang between 2000 and 2023 reveals a coherent yet differentiated ecological response pattern (Figure 4). At the regional scale, Northern Xinjiang consistently exhibited higher EcoIndex levels, characterized by robust vegetation performance coupled with favorable water use conditions, particularly across the Ili River Basin and the Altay mountainous zones. In contrast, Southern and Eastern Xinjiang persistently maintained lower EcoIndex values, reflecting the prevailing arid climate and the inherent limitations of ecological functioning within desert and marginal landscapes. This tripartite configuration, demarcating the three major ecohydrological provinces, remained remarkably stable throughout the study period, underscoring the dominant control exerted by climatic and geographical factors on regional ecosystem states.
Temporally, the EcoIndex displayed relatively stable interannual variability, without evidence of abrupt regime shifts across the 24-year period. Elevated EcoIndex values were particularly prominent during the early 2000s, coinciding with favorable ecological conditions across extensive areas of Northern Xinjiang. A secondary peak emerged in the early 2010s, aligning with observable greening trends in transitional ecotones between mountainous and basin regions. Although occasional interannual anomalies were present, the amplitude of EcoIndex fluctuations remained moderate overall, suggesting that Xinjiang’s ecosystems exhibit a degree of inherent resilience when integrating both vegetation productivity and water use efficiency signals.
By synthesizing vegetation and hydrological dynamics, the EcoIndex effectively captured ecological variations that would be less discernible through singular indicators such as NDVI or WUE. Whereas traditional vegetation indices primarily reflect photosynthetic vigor and canopy structure, and water use metrics often respond sensitively to external hydrometeorological forcing, the compositional structure of the EcoIndex enables a more holistic reflection of biological productivity in relation to resource utilization efficiency. This integrative capability proved particularly valuable within transitional and marginal zones, where singular indicators alone often yield inconsistent or contradictory assessments.
Further regional differentiation highlights this advantage. Northern Xinjiang consistently displayed elevated EcoIndex values with limited interannual volatility, reflecting ecosystem robustness under relatively favorable hydroclimatic regimes. In Southern Xinjiang, although constrained by baseline aridity, localized improvements were observed along oasis fringes during hydrologically favorable years. Eastern Xinjiang, while maintaining predominantly low EcoIndex levels, exhibited scattered micro-scale enhancements within upland terrains. These subtle yet meaningful spatial patterns—often obscured within univariate frameworks—were distinctly revealed through the multivariate architecture of the EcoIndex, demonstrating its utility in diagnosing nuanced ecosystem dynamics across complex arid and semi-arid landscapes.
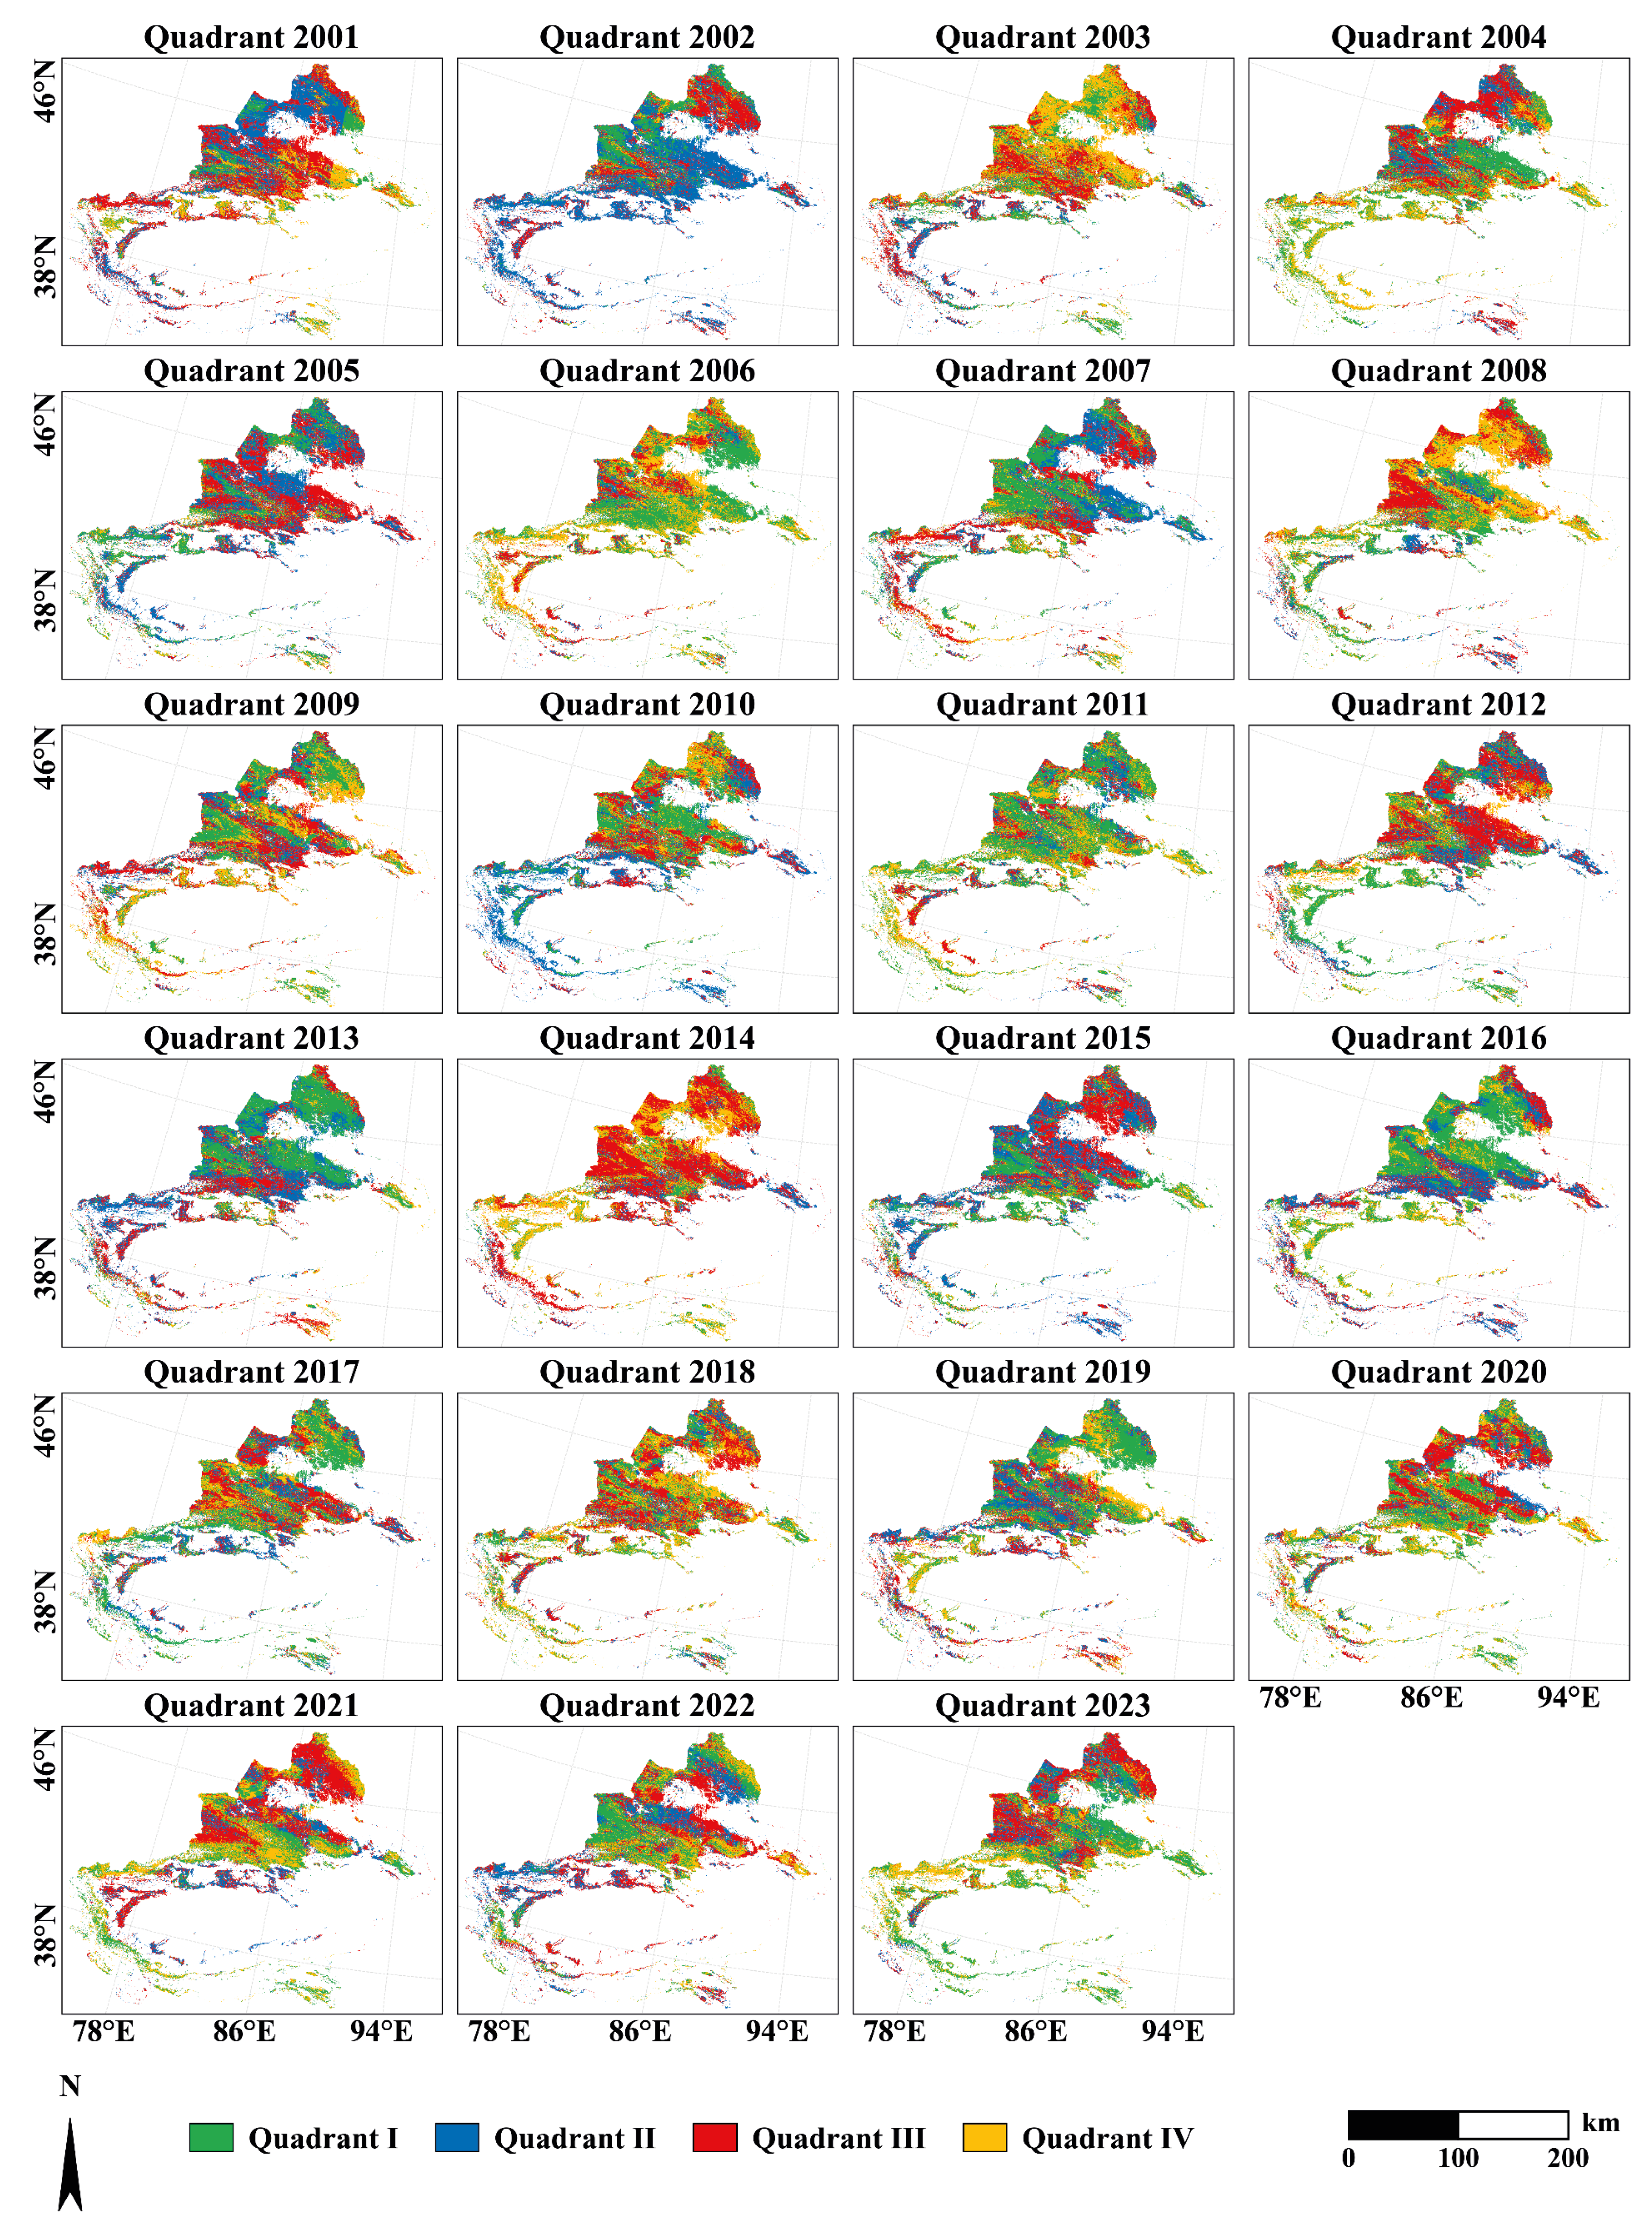
The quadrant-based spatial trajectories of eco-hydrological coupling across Xinjiang between 2001 and 2023 (Figure 5) reveal a dynamic yet structurally coherent ecological adjustment process. Throughout the study period, co-degradation areas (Quadrant III) remained spatially dominant in the southern and eastern sectors, aligning with the inherent climatic aridity and ecological fragility of these regions. Nevertheless, the spatial footprint of co-enhancement zones (Quadrant I) exhibited a gradual yet discernible expansion in the northern plains and mountainous transition belts, suggesting an underlying ecological improvement where vegetation productivity and water use efficiency simultaneously advanced.
Spatially, the Ili River Basin, the northern Tianshan foothills, and the Altay region repeatedly anchored high proportions of co-enhancement signals, while the Tarim Basin and surrounding desert margins were persistently characterized by co-degradation and emerging stress patterns. Compared to a relatively fragmented distribution in the early 2000s, co-enhancement patches coalesced more systematically over time, particularly post-2010, reflecting the emergence of regional ecological clusters rather than isolated occurrences. Simultaneously, a progressive contraction of stress release (Quadrant II) zones across marginal lands implies that improvements in vegetation status increasingly require concurrent water-use optimization, rather than vegetation vigor alone.
The temporal evolution of quadrant proportions further substantiates this spatial transformation. In the early years (e.g., 2001–2003), co-degradation accounted for over 35% of the study area, overshadowing the relatively limited co-enhancement extent. However, subsequent years witnessed a slow but persistent rebalancing: co-enhancement proportions gradually rose, reaching their relative maxima around 2014 and maintaining a plateau thereafter. Emerging stress areas fluctuated more sharply, with episodic expansions (e.g., 2003, 2012) often preceding regional-scale ecosystem adjustments. Interestingly, stress release proportions—which were initially extensive in transitional zones—showed a contracting trend, hinting at an evolving ecological coupling where water-vegetation decoupling became less frequent.
Rather than indicating abrupt transitions, these patterns suggest a spatially mosaic yet temporally smoothing process of eco-hydrological recalibration. While Northern Xinjiang benefited from relatively favorable background conditions, the gradual emergence of ecological niches even in Southern and Eastern Xinjiang—though spatially limited—points toward a silent restructuring of the underlying resource-ecology coupling regime. These findings imply that ecosystem responses in Xinjiang are less abrupt than they may appear in any single-year snapshot, and that resilience mechanisms operate through a distributed, quadrant-wise realignment rather than wholesale landscape shifts.
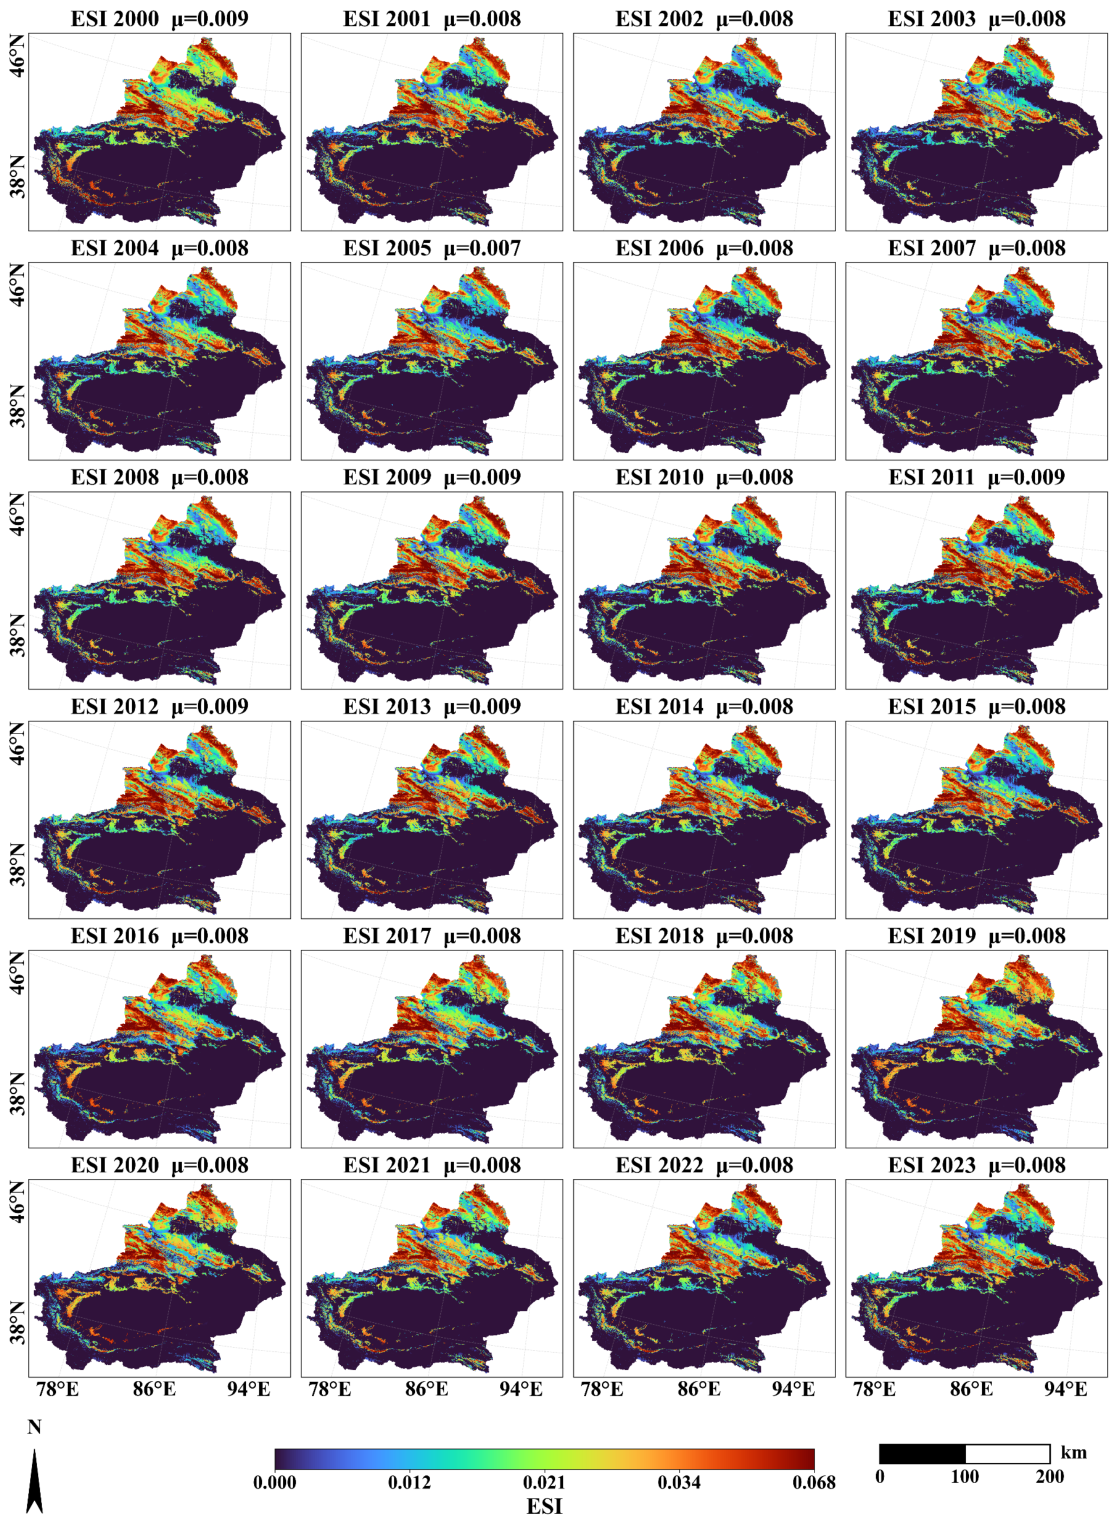
As illustrated in Figure 6, the spatial and temporal evolution of the Eco-Hydrological Synchrony Index (ESI) further dissects the dynamic coupling between vegetation productivity and water use efficiency across Xinjiang. While the EcoIndex captured integrated ecological conditions (Figure 4) and quadrant transitions (Figure 5) depicted directional trends in resource balance, the ESI isolates the internal coherence of these two subsystems.
Throughout the 24-year period, ESI values were generally low across most parts of Xinjiang, reflecting the inherent climatic limitations and the frequent decoupling between vegetation growth and water availability. Northern Xinjiang, particularly in the Ili River Valley and the Altay foothills, maintained comparatively higher ESI levels, indicating sustained eco-hydrological synchrony in favorable microclimates. In contrast, Southern Xinjiang and the desert-dominated areas of Eastern Xinjiang showed persistently low ESI values, with widespread patches approaching near-zero synchrony, echoing the underlying environmental harshness.
Temporal fluctuations in ESI revealed subtle yet meaningful shifts. Episodic enhancements in ESI were observable during specific years, notably around 2010 and 2016, suggesting phases where climatic or hydrological conditions temporarily favored coupled ecosystem functioning. However, such improvements remained spatially confined and temporally transient, emphasizing the fragility of synchrony under variable external drivers. Notably, compared with EcoIndex fluctuations, ESI exhibited a narrower dynamic range, reinforcing the notion that while productivity and efficiency metrics may vary, their functional coupling is more resistant to short-term perturbations. Together with the broader EcoIndex and quadrant analyses, the ESI patterns delineate an integrated narrative: while spatial differentiation in ecological condition remains stable, eco-hydrological synchrony exhibits local variability, with transitions often occurring silently beneath the apparent resilience. The decoupling zones identified by low ESI values correspond well with marginal or unstable regions in the EcoIndex maps, suggesting that structural ecosystem vulnerability may first manifest as synchrony breakdown before emerging as macroscopic functional decline.
Taken together, the spatiotemporal patterns revealed across EcoIndex, quadrant transitions, and ESI distributions outline a region where ecological steadiness is punctuated by gradual but consequential realignments. While the overall structural configuration of Xinjiang’s ecosystems appears enduring, internal adjustments—whether through shifts in coupling efficiency or emerging spatial heterogeneities—hint at latent dynamics shaping future trajectories. Recognizing these undercurrents not only refines our understanding of arid ecosystem behavior but also sharpens the lens through which ecological stability and transition potential are discerned in environments operating at the margins of climatic and hydrological sustainability.
To further examine the reliability of the two diagnostic indicators, an internal consistency validation was conducted for EcoIndex and ESI. EcoIndex showed strong positive correlations with its component variables, including NDVI (r = 0.854) and WUE (r = 0.847), and also showed a positive association with GPP (r = 0.773). Spatially, high EcoIndex values were mainly distributed in vegetated and oasis regions, including the Ili River Basin, Altay region, and major oasis belts, whereas low values were concentrated in the Tarim Basin and Eastern Xinjiang, consistent with the known hydroclimatic gradient. For ESI, the index showed a positive correlation with local WUE–NDVI synchrony (r = 0.736). In high-ESI pixels, 68.4% of annual WUE and NDVI changes occurred in the same direction, whereas this proportion decreased to 31.7% in low-ESI pixels. These consistency checks indicate that EcoIndex preserves the intended vegetation-productivity and water-use-efficiency information, while ESI captures the degree of coordination between vegetation greenness and ecosystem-scale water-use efficiency.

3.2. Temporal Trends of Eco-Hydrological Dynamics in Xinjiang (2000–2023)

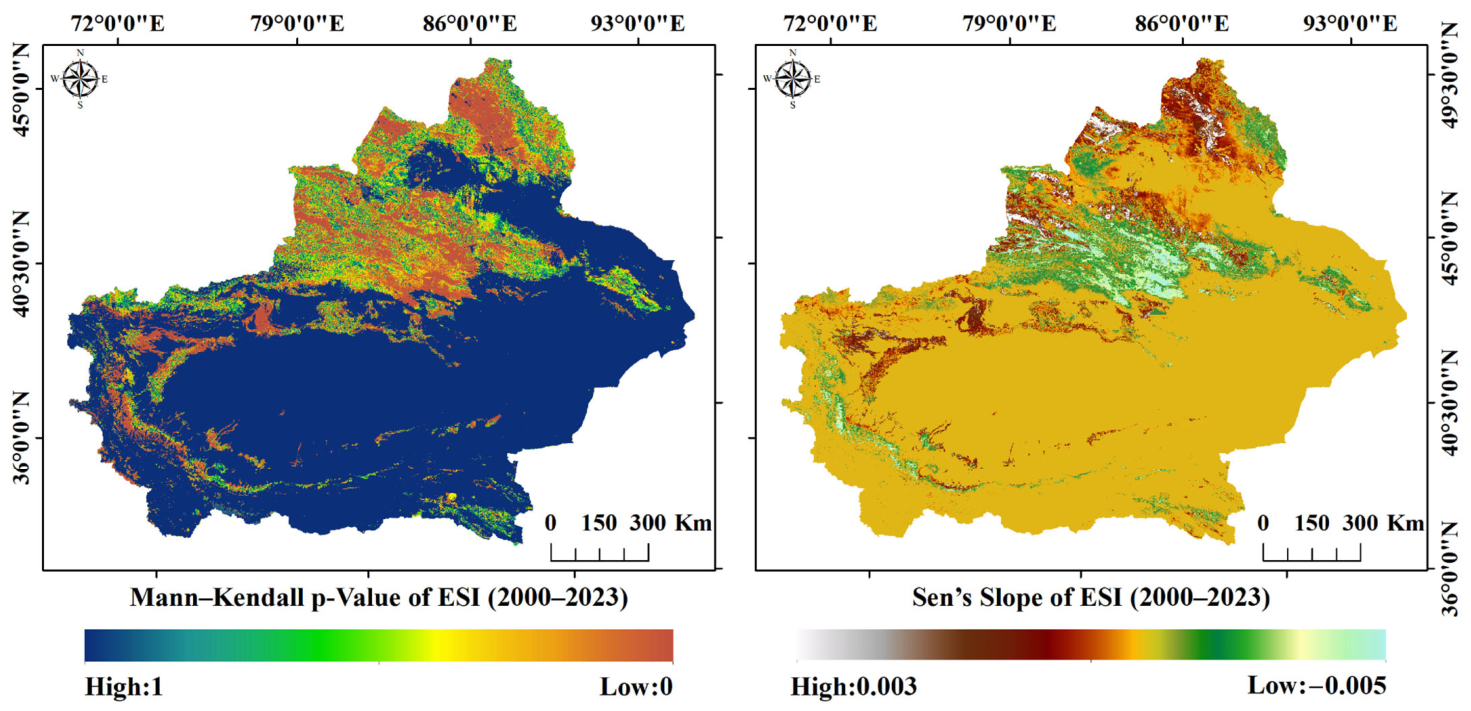
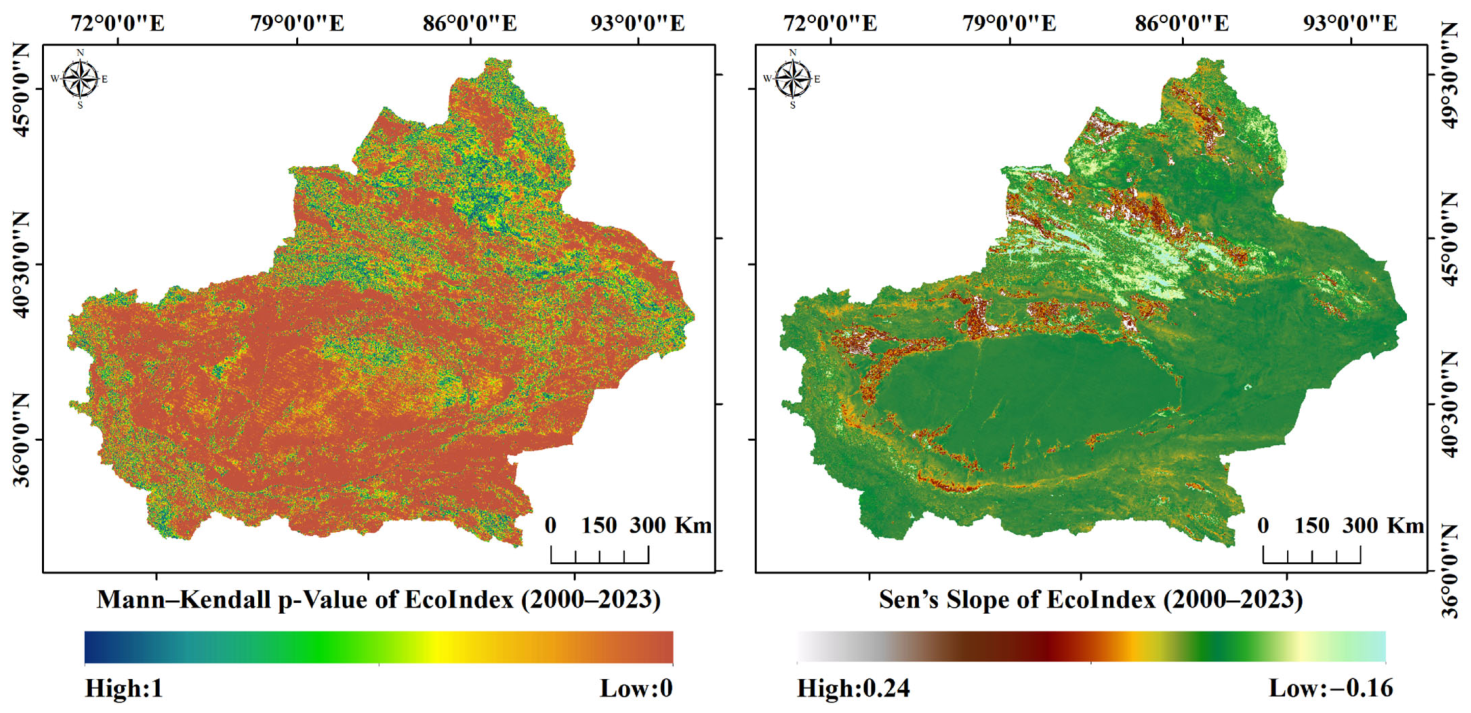
To further interrogate the trajectory of eco-hydrological evolution, trend diagnostics based on Sen’s slope and Mann–Kendall significance testing were applied to EcoIndex and ESI, revealing both the direction and statistical significance of long-term changes (Figure 7 and Figure 8). Sen’s slope was used to quantify the magnitude of monotonic change, whereas the Mann–Kendall test was used to determine whether the detected trend was statistically significant. Because the quadrant classes are categorical transition states derived from the annual signs of WUE and NDVI changes, they are not suitable for direct slope estimation. Therefore, trend analyses were confined to the two continuous indicators, EcoIndex and ESI. This design keeps the trend diagnostics methodologically consistent and avoids assigning artificial linear trends to categorical transition classes.
For the spatial statistics, pixels with a positive Sen’s slope and a significant Mann–Kendall trend were classified as “Up”, whereas pixels with a negative Sen’s slope and a significant Mann–Kendall trend were classified as “Down”. Pixels without statistically significant trends were classified as “Stable”. This classification allows the spatial extent of improvement, degradation, and stability to be compared consistently between EcoIndex and ESI and among the three subregions.
The spatial distribution of temporal trends reveals a composite landscape of gradual adjustments and subtle structural shifts (Table 3). Across Xinjiang as a whole, the EcoIndex exhibited widespread positive signals, with 44.01% of the region showing improvement, 3.35% showing degradation, and 52.64% remaining stable. In contrast, ESI changed more conservatively, with only 5.17% of the region showing improvement and 3.11% showing decline. This contrast indicates that improvements in integrated ecological condition were more spatially extensive than improvements in vegetation–water synchrony. In other words, greening or enhanced resource-use performance does not necessarily imply stronger eco-hydrological coordination. Regionally, Southern Xinjiang showed the largest proportion of EcoIndex improvement (54.91%), followed by Eastern Xinjiang (37.50%) and Northern Xinjiang (18.60%). For ESI, Northern Xinjiang had the highest improvement proportion (13.93%), whereas Southern and Eastern Xinjiang remained low (2.86% and 0.20%, respectively).
Disaggregated analyses highlight marked regional differentiation. Southern Xinjiang showed the largest extent of EcoIndex improvement, with 54.91% of its area exhibiting significant positive trends, indicating widespread enhancement of integrated ecological conditions, particularly around oases and cultivated areas. However, only 2.86% of Southern Xinjiang showed ESI improvement, suggesting that ecological improvement in this region was not accompanied by a comparable strengthening of vegetation–water synchrony. Northern Xinjiang displayed a different pattern: although the proportion of EcoIndex improvement was lower (18.60%), it had the highest proportion of ESI improvement (13.93%), consistent with relatively favorable hydroclimatic conditions and more stable vegetation–water interactions across the Ili River Basin and Altay foothills. Eastern Xinjiang presented a dualistic behavior: despite 37.50% of the area showing EcoIndex improvement, ESI gains remained negligible (0.20%), suggesting that vegetation greening can occur independently of improved water-use coordination under extreme aridity.
A comparative perspective between the two indices reveals additional structural insights. At the overall scale, the mean positive Sen’s slope for EcoIndex was 0.0107, whereas that for ESI was 0.0005. Across the three subregions, positive EcoIndex slopes ranged from 0.0041 to 0.0401, while positive ESI slopes ranged from 0.0004 to 0.0006. This contrast reinforces that integrated ecological conditions changed more strongly than eco-hydrological synchrony. Conversely, degradation slopes were relatively shallow in both indices, although the negative EcoIndex slopes remained larger in magnitude than the corresponding ESI slopes, implying that vegetation–water synchrony changed more conservatively than integrated ecological condition.
These findings collectively suggest that while Xinjiang’s ecosystems possess a latent capacity for ecological enhancement, the synchronization between vegetation productivity and hydrological processes remains fragile. Vegetation improvements do not automatically translate into enhanced eco-hydrological functioning, particularly in marginal landscapes. The observed spatial mismatches between EcoIndex and ESI trajectories imply that vulnerabilities may develop silently within ecosystem structures, manifesting subtly before culminating in overt functional declines. From a methodological perspective, the joint use of EcoIndex and ESI provides a transferable diagnostic framework: EcoIndex identifies where integrated ecological conditions are improving or degrading, whereas ESI tests whether such changes are accompanied by stronger vegetation–water coordination. This distinction can support future eco-hydrological assessments in other dryland regions where apparent greening and functional water-use stability may diverge.

3.3. Attribution of Climatic and Anthropogenic Drivers of Eco-Hydrological Changes Across Xinjiang

Deciphering the evolving eco-hydrological equilibrium of arid landscapes necessitates a dissection of the forces that simultaneously sculpt and disrupt vegetation–water interactions. Embedded within Xinjiang’s vast environmental heterogeneity, an integrated attribution framework was deployed, coupling standardized anomaly construction, ensemble-based machine learning, and pixel-wise dominance classification to reveal the contours of climatic and anthropogenic controls. In this framework, precipitation (PR), soil moisture (SOIL), and temperature (TEMP) were treated as climatic or natural hydroclimatic drivers, whereas nighttime light intensity (NL) and land cover change (CLCD) were treated as anthropogenic proxies. Rather than isolating singular variables, this approach captures multi-scale interplay, allowing an examination of how natural gradients and human imprints progressively recalibrate ecosystem functioning.
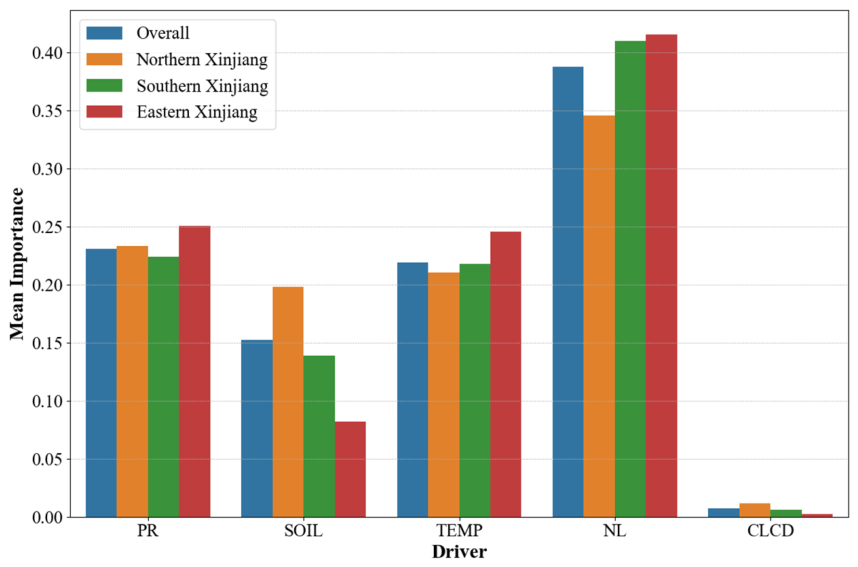
The comparative importance of climatic and anthropogenic drivers across Xinjiang is summarized by the mean normalized predictor-importance values in Figure 9, while Table 4 provides the corresponding regional mean and median statistics for each predictor. Therefore, Figure 9 should be compared with the mean-importance columns of Table 4 rather than with the median values. It should be noted that Figure 9 does not represent the areal share of natural and anthropogenic impacts; rather, it reports the mean normalized importance of individual predictors in the random forest attribution model. Therefore, PR, SOIL, and TEMP jointly represent the climatic or natural hydroclimatic control group, while NL and CLCD represent the anthropogenic control group. At the province-wide scale, precipitation (PR) and soil moisture (SOIL) emerged as consistently dominant regulators of eco-hydrological dynamics, surpassing the contributions of thermal regimes (TEMP) and human-induced factors (NL and CLCD). Yet this apparent climatological primacy conceals finer regional mosaics: Northern Xinjiang, buffered by orographic precipitation and glacial hydrology, displayed a pronounced reliance on precipitation (mean importance 0.295), with anthropogenic signals relegated to minor roles. Conversely, Southern Xinjiang presented an attenuated climatic dominance; the higher importance of nighttime lights and land cover shifts indicates that human activities exert stronger effects in oasis and cultivated areas, where irrigation, land reclamation, urban expansion, and infrastructure construction can alter vegetation–water relationships. In Eastern Xinjiang, the importance values were more evenly distributed among climatic and anthropogenic predictors, indicating that no single driver exerted overwhelming explanatory dominance under severe aridity and fragmented human activity.
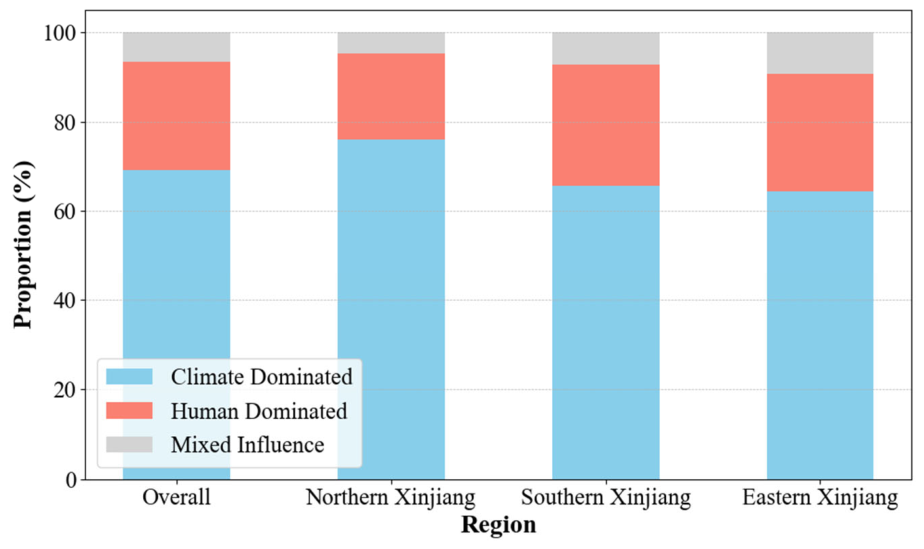
Based on the variable-level importance patterns shown in Figure 9, the spatial reorganization of dominant forces was further summarized through pixel-level categorical classification, delineating climatic, anthropogenic, and mixed dominance zones (Figure 10, Table 5). Unlike Figure 9, which compares the relative importance of individual predictors, Figure 10 and Table 5 describe the areal proportions of the three dominance types. Across Xinjiang, climatic control remained spatially expansive, accounting for 63.27% of the territory, yet regional disparities were stark. Northern Xinjiang retained a robust climatic stronghold (75.08%), congruent with its hydrological endowments and relatively restrained land-use transformation. Southern Xinjiang, despite its arid base state, exhibited a surge in anthropogenic dominance (30.64%). In this study, anthropogenic dominance does not indicate a single type of human activity, but means that anthropogenic proxies, mainly nighttime light intensity and land cover change, explained more EcoIndex variability than the climatic predictors. These signals are likely associated with irrigation expansion, groundwater extraction, hydrological network modification, oasis urbanization, agricultural intensification, construction land expansion, and local forestation, deforestation, or vegetation restoration. Such interventions can alter water redistribution, evapotranspiration demand, soil moisture availability, groundwater conditions, and land-surface structure, thereby reshaping vegetation–water coupling. Eastern Xinjiang emerged as a zone of blurred control boundaries; 20.71% of its area exhibited mixed influence, indicating fragmented hydro-ecological feedbacks where neither climate nor human agency achieves unequivocal primacy.
The comparison between the climatic group and anthropogenic group was interpreted at two levels: first, by comparing the individual predictor importance values in Figure 9 and Table 4; second, by assigning each pixel to climatic, anthropogenic, or mixed dominance types according to the maximum group-level importance contrast, as summarized in Figure 10 and Table 5.
These emergent patterns, albeit subtle, may portend systemic recalibrations in eco-hydrological equilibria as environmental pressures and anthropogenic intensifications coalesce. Climatic forces, historically entrenched, continue to scaffold the broader eco-functional landscape. However, anthropogenic signatures, though spatially punctuated, are carving discernible fractures—especially where resource concentration and demographic pressures converge. The emergence of mixed influence zones signals more than transitional instability; it suggests that coupling disruptions are not merely additive, but are entangled with thresholds beyond which eco-hydrological resilience may erode asymmetrically. The subtle realignments observed—imperceptible through conventional vegetation or climate indicators alone—foreshadow a recalibration of ecological equilibria under the intertwined trajectories of environmental change and human agency.

4. Discussion

Before structural patterns of vegetation–water dynamics can be fully interpreted, it becomes essential to understand the shifting interplay between natural climatic scaffolding and anthropogenic interventions across arid landscapes. While climatic regimes establish the foundational constraints of ecosystem functionality, emerging spatial signals reveal growing deviations, reconfigurations, and latent instabilities within these frameworks. The following sections synthesize climatic forcing patterns, anthropogenic disruptions, transitional fragilities, and methodological considerations, offering a multidimensional lens through which Xinjiang’s evolving eco-hydrological architecture can be examined.

4.1. Climatic Forcing as the Structural Backbone of Eco-Hydrological Dynamics

The spatial and temporal patterns delineated across Xinjiang unequivocally highlight the predominance of climatic forcing in orchestrating eco-hydrological dynamics. Precipitation and soil moisture, acting as primary vectors of water availability, emerge as the principal regulators shaping vegetation functionality—sustaining biological productivity while governing the efficiency of resource utilization under arid stress gradients [56,57]. This overarching climatic scaffold, though modulated by geographical heterogeneity and localized disturbances, leaves a resilient imprint across the regional landscape.
The critical role of water-centric controls in arid ecosystems is well established; however, disentangling vegetation responses to varying hydroclimatic pressures demands diagnostic frameworks that move beyond traditional univariate proxies. Metrics such as NDVI capture greenness fluctuations but fail to reveal underlying physiological constraints, while WUE indicators, though informative regarding carbon–water trade-offs, often lack sensitivity to decoupled or nonlinear system responses. In contrast, integrative indices that concurrently encapsulate vegetation state and water-use behavior provide a more faithful representation of coupled dynamics, particularly under multifactorial environmental pressures where subtle shifts may prelude systemic recalibrations [11,51].
Across Northern Xinjiang, the dominant influence of precipitation aligns with orographic precipitation regimes and glacial-fed hydrological systems, reinforcing the notion that water input magnitude and distribution underpin the structural integrity of vegetation–water couplings [58,59]. In hyper-arid basins, despite exceedingly low precipitation, the persistence of climatic dominance further underscores the preeminent role of water limitations, as even marginal hydroclimatic variations exert disproportionate impacts on ecosystem functionality. These patterns collectively affirm that climatic scaffolding remains the fundamental backbone of eco-hydrological regulation, onto which both natural variability and anthropogenic perturbations are superimposed.
Yet the stability of this backbone is neither absolute nor immutable. The nuanced deviations detected across spatial and temporal scales suggest that, while climatic forcing dictates the baseline eco-functional template, its dominance is increasingly challenged where additional pressures converge. Capturing the thresholds and trajectories of such transitions requires diagnostic approaches sensitive to the integrated state of vegetation–water systems, capable of detecting early deviations before overt ecological degradation manifests—a necessity made more urgent by the accelerating pace of climatic variability and anthropogenic expansion across dryland regions globally [60].

4.2. Anthropogenic Disruptions and the Amplification of Localized Eco-Hydrological Instabilities

While climatic scaffolding persists at regional scales, human activities have increasingly superimposed disruptive signals onto the eco-hydrological fabric, particularly within intensively managed oases and infrastructural corridors. In Xinjiang, such interventions include irrigated agriculture, groundwater withdrawal, hydrological engineering and canal-network regulation, ecological water conveyance, oasis expansion, construction land growth, and local forestation, deforestation, or vegetation restoration. Previous work has shown that irrigated agriculture in oasis–desert systems can reshape water balance, soil water conditions, groundwater dynamics, and surface-water–groundwater interactions [61]. These interventions act through several eco-hydrological pathways: irrigation and ecological water conveyance redistribute water spatially; groundwater extraction alters subsurface water availability; hydrological engineering changes runoff routing and water allocation; construction and land conversion modify land-surface structure and impervious surfaces; and forestation or vegetation restoration changes transpiration demand and vegetation water consumption. In Southern Xinjiang, the expansion of irrigated agriculture and urban infrastructure has systematically reconfigured natural water fluxes, decoupling vegetation functionality from ambient hydroclimatic constraints. Nighttime light intensity (NL) and land cover transitions (CLCD), initially concentrated around urban nuclei, have propagated outward across broader landscapes (Figure 9, Table 4), signaling the diffusion of anthropogenic perturbations into previously climate-dominated zones [62].
This amplification is neither spatially uniform nor temporally linear. Anthropogenic disturbances interact with climatic variability to generate feedback loops that intensify eco-hydrological instability, often pushing systems beyond adaptive thresholds. Alterations in water redistribution—through intensive irrigation, groundwater extraction, and land surface modification—diminish the coupling strength between carbon assimilation and water utilization, shifts that often elude detection by singular proxies such as NDVI or WUE.
Diagnostic frameworks integrating multi-dimensional vegetation–water dynamics thus become crucial for detecting early destabilizations, particularly where human pressures accumulate nonlinearly atop climatic stressors. In this context, EcoIndex, by jointly capturing vegetation state and resource-use efficiency, reveals emerging decoupling signals before overt degradation manifests (Figure 5).
Areas exhibiting elevated anthropogenic dominance—such as those surrounding Korla, Aksu, and Kashgar—demonstrate reduced hydro-ecological buffering capacity, as reflected by declining or fluctuating EcoIndex trajectories. The juxtaposition of intensive resource extraction, landscape fragmentation, and altered water redistribution engenders vulnerabilities that propagate both vertically through soil–plant–atmosphere continua and laterally across landscape mosaics.
These patterns suggest that the anthropogenic signature constitutes not merely an additive disturbance but a transformative force reconfiguring eco-hydrological relationships. The human-dominated zones in Southern Xinjiang, accounting for 30.64% of the region (Table 5), underscore the magnitude and persistence of this restructuring, exceeding transitions observed in Northern or Eastern Xinjiang. Recognizing the spatial intensification of human-driven eco-hydrological disruptions remains pivotal for anticipating regime shifts under accelerating climatic and societal transformations.

4.3. Emergent Mixed Influence Zones and Coupled Socio-Ecological Fragility

Beyond regions of clear climatic or anthropogenic dominance, transitional zones characterized by mixed influence have become increasingly prominent across Xinjiang’s eco-hydrological landscape, particularly in Eastern Xinjiang. Situated at the margins of hydrological sufficiency and socio-economic expansion, these areas embody systemic vulnerabilities where neither natural nor human forces exerts unequivocal control. Instead, fragmented climatic signals and localized anthropogenic pressures interact, producing unstable feedbacks that progressively erode traditional resilience frameworks.
Mixed influence zones do not simply represent intermediate disturbance states but signify the emergence of coupled socio-ecological fragilities, where multiple stressors interact nonlinearly. Even modest perturbations—climatic anomalies or incremental land-use changes—can cascade through vegetation–water–human systems, amplifying disruption beyond localized scales. Fluctuating EcoIndex trajectories and weakened vegetation–water synchrony (Figure 6) provide early evidence of this progressive destabilization.
Capturing these complex transitional dynamics challenges conventional monitoring paradigms. Singular vegetation or water-use metrics often obscure intertwined system behaviors, whereas integrated diagnostic approaches, such as EcoIndex, offer greater sensitivity by concurrently assessing biophysical stress and resource-use shifts.
The high prevalence of mixed influence zones in Eastern Xinjiang, where 20.71% of the area exhibits no clear driver dominance (Table 5), underscores the systemic scale of emerging fragility. These zones spatially align with areas of intermediate or oscillating driver importance (Figure 9), reflecting an increasingly tenuous balance between climatic scaffolding and anthropogenic restructuring. Such regions display heightened sensitivity to both exogenous climatic shocks and endogenous socio-economic transformations, positioning them as critical frontiers for early-warning detection.
Importantly, the manifestation of fragility within mixed influence zones often proceeds not through abrupt collapse but through the gradual erosion of vegetation–water–human coupling strength across interconnected ecological, hydrological, and socio-economic dimensions. Recognizing these subtle transitions is pivotal for anticipating regime shifts in dryland systems under intensifying coupled pressures [63].

4.4. Methodological Reflections and Analytical Robustness

Disentangling the multi-dimensional drivers of eco-hydrological change across heterogeneous drylands demands methodological frameworks capable of accommodating complexity without compromising analytical fidelity. In this context, the integration of standardized anomaly construction, ensemble-based machine learning, and pixel-wise attribution modeling provided a nuanced lens through which spatial heterogeneity, driver dominance, and transitional dynamics could be concurrently assessed. By normalizing environmental variability and emphasizing relative departures from long-term baselines, the framework minimized spurious correlations while enhancing sensitivity to subtle system shifts, particularly in environmentally transitional zones.
The construction of composite diagnostic indices that concurrently capture vegetation state and resource-use dynamics further augmented analytical granularity, enabling the detection of emergent instabilities beyond the reach of conventional univariate metrics. EcoIndex, by bridging vegetation productivity and hydrological efficiency dimensions, proved especially valuable in capturing early signals of decoupling within mixed influence zones (Figure 6), where traditional indicators often obscure nonlinear transitions. This multidimensional perspective substantially elevates the interpretive power of eco-hydrological assessments, particularly under coupled natural–human pressure regimes characterized by complex feedbacks and delayed responses [64,65].
Nevertheless, methodological limitations warrant careful consideration. The attribution framework, while effective at isolating dominant driver signals (Figure 9, Table 4), remains contingent upon the quality, spatial consistency, and temporal depth of input datasets. Temporal aggregation procedures, spatial resampling artifacts, and the omission of dynamic socio-economic variables may introduce biases or attenuate sensitivity, particularly in rapidly evolving frontier landscapes. Moreover, while random forest regression models offer robustness against overfitting and accommodate non-linearities, they inherently lack explicit causal inference capabilities, constraining interpretations to associative rather than mechanistic linkages.
Addressing these limitations will require methodological advances along multiple fronts. Incorporating temporally continuous attribution methods, such as rolling-window ensemble learning, and causal discovery algorithms capable of inferring feedback hierarchies could enhance the mechanistic interpretability of driver–response relationships. Concurrently, developing finer-resolution socio-ecological datasets—capturing land management histories, hydrological interventions, and demographic dynamics—would enable more holistic attribution of eco-hydrological changes. Advances in explainable machine learning, particularly those reconciling feature importance with process-based reasoning, offer promising pathways toward more mechanistically grounded eco-hydrological diagnostics.
Embedding these innovations within integrative observational frameworks, capable of dynamically tracking vegetation–water–human system interactions, will be critical for enhancing early detection of systemic vulnerabilities. In dryland ecosystems increasingly shaped by the coalescence of climatic variability and anthropogenic perturbations, refining eco-hydrological diagnostic architectures remains pivotal for anticipating regime shifts and informing adaptive management strategies under accelerating environmental and societal change.

5. Conclusions

The eco-hydrological dynamics of Xinjiang’s drylands are fundamentally scaffolded by climatic forcing, with precipitation and soil moisture serving as primary regulators of vegetation functionality. However, emerging spatial deviations indicate that this baseline climatic control is increasingly modified by anthropogenic perturbations, particularly in zones of intensive land use expansion. Patterns of driver importance and vegetation–water coupling reveal that systemic stability is being gradually reconfigured under the combined pressures of natural variability and human interventions.
Regional disparities have become pronounced. Northern Xinjiang, supported by orographic precipitation and moderate anthropogenic pressure, remains largely climate-driven, with vegetation–water synchrony sustained. Southern Xinjiang, in contrast, exhibits extensive human-induced restructuring, as reflected by elevated nighttime light contributions and widespread coupling erosion, particularly along oasis margins. Eastern Xinjiang emerges as a transitional zone, where fragile balances between climatic limitations and selective anthropogenic activities render ecosystems highly sensitive to perturbations.
Leveraging multi-source eco-hydrological and remote sensing datasets, this study integrated vegetation productivity and water-use dynamics into a composite EcoIndex, and applied pixel-level random forest attribution to disentangle climatic and anthropogenic controls. This framework enhanced the detection of early decoupling signals and captured the spatial emergence of mixed influence zones—areas often overlooked by traditional univariate metrics.
Moving forward, safeguarding eco-hydrological resilience will require embedding integrative diagnostic frameworks within adaptive management strategies. Recognizing differentiated vulnerabilities across Xinjiang’s regions—and responding preemptively to early signs of systemic fragility—will be pivotal for sustaining ecosystem functionality under accelerating climatic and societal transformations.

Author Contributions

Conceptualization, Q.Z. and A.Z.; methodology, Q.Z., Y.J., and D.Z.; formal analysis, Y.J. and D.Z.; data curation, Y.J.; visualization, Y.J. and D.Z.; writing—original draft preparation, Q.Z.; writing—review and editing, Q.Z., Y.J., D.Z., and A.Z.; supervision, A.Z.; project administration, A.Z.; funding acquisition, A.Z. All authors have read and agreed to the published version of the manuscript.

Funding

This research was funded by the Xinjiang Uygur Autonomous Region Natural Science Foundation General Project (No. 2022D01A26), the National Key R&D Program of China (No. 2023YFB3907500), the National Natural Science Foundation of China (No. 41830108), the Innovation Team of XPCC’s Key Area (No. 2018CB004), and the Major Projects of High-Resolution Earth Observation (No. 30-H30C01-9004-19/21).

Institutional Review Board Statement

Not applicable.

Informed Consent Statement

Not applicable.

Data Availability Statement

Publicly available datasets were analyzed in this study. The data sources include the China Land Cover Dataset archived on Zenodo (CLCD; Version 1.0.0; DOI: 10.5281/zenodo.4417810), NASA MODIS Collection 6.1 products for ET, GPP, and NDVI, NOAA Earth Observation Group nighttime lights dataset, and the TerraClimate monthly climate and climatic water balance dataset, as described in Section 2.2.

Conflicts of Interest

The authors declare no conflicts of interest.

References

  1. Ma, Z.; Dong, C.; Tang, Z.; Wang, N. Altitude-Dependent Responses of Dryland Mountain Ecosystems to Drought under a Warming Climate in the Qilian Mountains, NW China. J. Hydrol. 2024, 630, 130763. [Google Scholar] [CrossRef]
  2. Olsoy, P.; Mitchell, J.; Glenn, N.; Flores, A. Assessing a Multi-Platform Data Fusion Technique in Capturing Spatiotemporal Dynamics of Heterogeneous Dryland Ecosystems in Topographically Complex Terrain. Remote Sens. 2017, 9, 981. [Google Scholar] [CrossRef]
  3. Peterson, G.; Westfall, D. Managing Precipitation Use in Sustainable Dryland Agroecosystems. Ann. Appl. Biol. 2004, 144, 127–138. [Google Scholar] [CrossRef]
  4. Bai, H.; Li, L.; Wu, Y.; Liu, C.; Gong, Z.; Feng, G.; Sun, G. Study on the Influence of Meteorological Elements on Growing Season Vegetation Coverage in Xinjiang, China. Electron. Res. Arch. 2022, 30, 3463–3480. [Google Scholar] [CrossRef]
  5. Bai, J.; Wang, N.; Hu, B.; Feng, C.; Wang, Y.; Peng, J.; Shi, Z. Integrating Multisource Information to Delineate Oasis Farmland Salinity Management Zones in Southern Xinjiang, China. Agric. Water Manag. 2023, 289, 108559. [Google Scholar] [CrossRef]
  6. Dinca, L.; Badea, O.; Guiman, G.; Braga, C.; Crisan, V.; Greavu, V.; Murariu, G.; Georgescu, L. Monitoring of Soil Moisture in Long-Term Ecological Research (LTER) Sites of Romanian Carpathians. Ann. For. Res. 2018, 61, 171–188. [Google Scholar] [CrossRef]
  7. Aboudrare, A.; Debaeke, P.; Bouaziz, A.; Chekli, H. Effects of Soil Tillage and Fallow Management on Soil Water Storage and Sunflower Production in a Semi-Arid Mediterranean Climate. Agric. Water Manag. 2006, 83, 183–196. [Google Scholar] [CrossRef]
  8. Azad, M.; Jalali, M.; Sattari, M.; Mastouri, R. Evaporation and Precipitation Prediction for Future Time Frames via Combined Machine Learning-Climate Change Models: Quri Gol Wetland Case. J. Agric. Sci.-Tarim Bilim. Derg. 2025, 30, 447–469. [Google Scholar] [CrossRef]
  9. Bai, X.; Fan, Z.; Yue, T. Dynamic Pattern-Effect Relationships between Precipitation and Vegetation in the Semi-Arid and Semi-Humid Area of China. Catena 2023, 232, 107425. [Google Scholar] [CrossRef]
  10. Dong, Z.; Ji, X.; Ma, K. Detection and Attribution of Eco-Hydrological Alteration Based on Deep Learning-Driven Gap-Filled Runoff in a Large-Scale Catchment. J. Hydrol.-Reg. Stud. 2025, 58, 102228. [Google Scholar] [CrossRef]
  11. Abel, C.; Horion, S.; Tagesson, T.; Brandt, M.; Fensholt, R. Towards Improved Remote Sensing Based Monitoring of Dryland Ecosystem Functioning Using Sequential Linear Regression Slopes (SeRGS). Remote Sens. Environ. 2019, 224, 317–332. [Google Scholar] [CrossRef]
  12. Adil, M.; Lu, S.; Yao, Z.; Zhang, C.; Lu, H.; Bashir, S.; Maitah, M.; Gul, I.; Razzaq, S.; Qiu, L. No-Tillage Enhances Soil Water Storage, Grain Yield and Water Use Efficiency in Dryland Wheat (Triticum aestivum) and Maize (Zea mays) Cropping Systems: A Global Meta-Analysis. Funct. Plant Biol. 2024, 51, FP23267. [Google Scholar] [CrossRef]
  13. Al-Kindi, K.; Al Nadhairi, R.; Al Akhzami, S. Dynamic Change in Normalised Vegetation Index (NDVI) from 2015 to 2021 in Dhofar, Southern Oman in Response to the Climate Change. Agriculture 2023, 13, 592. [Google Scholar] [CrossRef]
  14. Anees, S.; Mehmood, K.; Rehman, A.; Rehman, N.; Muhammad, S.; Shahzad, F.; Hussain, K.; Luo, M.; Alarfaj, A.; Alharbi, S.; et al. Unveiling Fractional Vegetation Cover Dynamics: A Spatiotemporal Analysis Using MODIS NDVI and Machine Learning. Environ. Sustain. Indic. 2024, 24, 100485. [Google Scholar] [CrossRef]
  15. Adak, T.; Kumar, G.; Chakravarty, N.V.K.; Katiyar, R.K.; Deshmukh, P.S.; Joshi, H.C. Biomass and Biomass Water Use Efficiency in Oilseed Crop (Brassica juncea L.) under Semi-Arid Microenvironments. Biomass Bioenergy 2013, 51, 154–162. [Google Scholar] [CrossRef]
  16. Qin, L.; Yuan, Y.; Shang, H.; Yu, S.; Liu, W.; Zhang, R. Impacts of Global Warming on the Radial Growth and Long-Term Intrinsic Water-Use Efficiency (iWUE) of Schrenk Spruce (Picea Schrenkiana Fisch. et Mey) in the Sayram Lake Basin, Northwest China. Forests 2020, 11, 380. [Google Scholar] [CrossRef]
  17. Alvarez-Cabria, M.; Barquín, J.; Peñas, F. Modelling the Spatial and Seasonal Variability of Water Quality for Entire River Networks: Relationships with Natural and Anthropogenic Factors. Sci. Total Environ. 2016, 545, 152–162. [Google Scholar] [CrossRef] [PubMed]
  18. Chen, C.; Dong, T.; Wang, Z.; Wang, C.; Song, W.; Zhang, H. Exploring Optimal Features and Image Analysis Methods for Crop Type Classification from the Perspective of Crop Landscape Heterogeneity. Remote Sens. Appl.-Soc. Environ. 2024, 36, 101308. [Google Scholar] [CrossRef]
  19. Huang, T.; Ou, G.; Wu, Y.; Zhang, X.; Liu, Z.; Xu, H.; Xu, X.; Wang, Z.; Xu, C. Estimating the Aboveground Biomass of Various Forest Types with High Heterogeneity at the Provincial Scale Based on Multi-Source Data. Remote Sens. 2023, 15, 3550. [Google Scholar] [CrossRef]
  20. Li, S.; Li, X.; Gong, J.; Dang, D.; Dou, H.; Lyu, X. Quantitative Analysis of Natural and Anthropogenic Factors Influencing Vegetation NDVI Changes in Temperate Drylands from a Spatial Stratified Heterogeneity Perspective: A Case Study of Inner Mongolia Grasslands, China. Remote Sens. 2022, 14, 3320. [Google Scholar] [CrossRef]
  21. Kafy, A.-A.; Bakshi, A.; Saha, M.; Al Faisal, A.; Almulhim, A.; Rahaman, Z.; Mohammad, P. Assessment and Prediction of Index Based Agricultural Drought Vulnerability Using Machine Learning Algorithms. Sci. Total Environ. 2023, 867, 161394. [Google Scholar] [CrossRef]
  22. Abdullah, S.; Barua, D. Combining Geographical Information System (GIS) and Machine Learning to Monitor and Predict Vegetation Vulnerability: An Empirical Study on Nijhum Dwip, Bangladesh. Ecol. Eng. 2022, 178, 106577. [Google Scholar] [CrossRef]
  23. Attia, A.; Govind, A.; Qureshi, A.S.; Feike, T.; Rizk, M.S.; Shabana, M.M.A.; Kheir, A.M.S. Coupling Process-Based Models and Machine Learning Algorithms for Predicting Yield and Evapotranspiration of Maize in Arid Environments. Water 2022, 14, 3647. [Google Scholar] [CrossRef]
  24. Du, L.-T.; Ma, L.-L.; Pan, H.-Z.; Qiao, C.-L.; Meng, C.; Wu, H.-Y.; Tian, J.; Yuan, H.-Y. Carbon-Water Coupling and Its Relationship with Environmental and Biological Factors in a Planted Caragana Liouana Shrub Community in Desert Steppe, Northwest China. J. Plant Ecol. 2022, 15, 947–960. [Google Scholar] [CrossRef]
  25. Al Saadi, F.; Parra-Rivas, P. Transitions between Dissipative Localized Structures in the Simplified Gilad-Meron Model for Dryland Plant Ecology. Chaos 2023, 33, 033129. [Google Scholar] [CrossRef]
  26. Pandey, A.; Islam, A.; Parida, B.; Dwivedi, C. Permafrost Destabilization Induced Hazard Mapping in Himalayas Using Machine Learning Methods. Adv. Space Res. 2025, 75, 6188–6206. [Google Scholar] [CrossRef]
  27. Castillo-Riffart, I.; Galleguillos, M.; Lopatin, J.; Perez-Quezada, J. Predicting Vascular Plant Diversity in Anthropogenic Peatlands: Comparison of Modeling Methods with Free Satellite Data. Remote Sens. 2017, 9, 681. [Google Scholar] [CrossRef]
  28. Abraham, A.; Kundapura, S. Assessing the Impacts of Land Use, Land Cover, and Climate Change on the Hydrological Regime of a Humid Tropical Basin. Nat. Hazards Rev. 2023, 24, 05023009. [Google Scholar] [CrossRef]
  29. Acharki, S.; Raza, A.; Vishwakarma, D.; Amharref, M.; Bernoussi, A.; Singh, S.; Al-Ansari, N.; Dewidar, A.; Al-Othman, A.; Mattar, M. Comparative Assessment of Empirical and Hybrid Machine Learning Models for Estimating Daily Reference Evapotranspiration in Sub-Humid and Semi-Arid Climates. Sci. Rep. 2025, 15, 2542. [Google Scholar] [CrossRef] [PubMed]
  30. Georgescu, L.; Balsalobre-Lorente, D.; Zlati, M.; Fortea, C.; Antohi, V.; Barbuta-Misu, N. Cluster Analysis of the Transition to Climate Neutrality in the European Union. Sustain. Dev. 2025, 33, 1498–1519. [Google Scholar] [CrossRef]
  31. Alsafadi, K.; Bashir, B.; Mohammed, S.; Abdo, H.G.; Mokhtar, A.; Alsalman, A.; Cao, W. Response of Ecosystem Carbon-Water Fluxes to Extreme Drought in West Asia. Remote Sens. 2024, 16, 1179. [Google Scholar] [CrossRef]
  32. Chen, Y.; Li, J.; Ju, W.; Ruan, H.; Qin, Z.; Huang, Y.; Jeelani, N.; Padarian, J.A.; Propastin, P. Quantitative Assessments of Water-Use Efficiency in Temperate Eurasian Steppe along an Aridity Gradient. PLoS ONE 2017, 12, e0179875. [Google Scholar] [CrossRef]
  33. Bai, Y.; Zha, T.; Bourque, C.P.-A.; Jia, X.; Ma, J.; Liu, P.; Yang, R.; Li, C.; Du, T.; Wu, Y. Variation in Ecosystem Water Use Efficiency along a Southwest-to-Northeast Aridity Gradient in China. Ecol. Indic. 2020, 110, 105932. [Google Scholar] [CrossRef]
  34. Cai, P.; Li, C.; Luo, G.; Zhang, C.; Ochege, F.U.; Caluwaerts, S.; De Cruz, L.; De Troch, R.; Top, S.; Termonia, P.; et al. The Responses of the Ecosystems in the Tianshan North Slope under Multiple Representative Concentration Pathway Scenarios in the Middle of the 21st Century. Sustainability 2020, 12, 427. [Google Scholar] [CrossRef]
  35. Fu, B. Ecological and environmental effects of land-use changes in the Loess Plateau of China. Chin. Sci. Bull.-Chin. 2022, 67, 3768–3779. [Google Scholar] [CrossRef]
  36. Zhang, J.; Zhang, P.; Deng, X.; Ren, C.; Deng, M.; Wang, S.; Lai, X.; Long, A. Study on the Spatial and Temporal Trends of Ecological Environment Quality and Influencing Factors in Xinjiang Oasis. Remote Sens. 2024, 16, 1980. [Google Scholar] [CrossRef]
  37. Kong, J.; Zan, M.; Chen, Z.; Xue, C.; Yang, S. Study on the Response of Vegetation Water Use Efficiency to Drought in the Manas River Basin, Xinjiang, China. Forests 2024, 15, 114. [Google Scholar] [CrossRef]
  38. Reddy, K.S.; Maruthi, V.; Pankaj, P.K.; Kumar, M.; Pushpanjali; Prabhakar, M.; Reddy, A.G.K.; Reddy, K.S.; Singh, V.K.; Koradia, A.K. Water Footprint Assessment of Rainfed Crops with Critical Irrigation under Different Climate Change Scenarios in SAT Regions. Water 2022, 14, 1206. [Google Scholar] [CrossRef]
  39. Agarwal, S.; Nagendra, H. Classification of Indian Cities Using Google Earth Engine. J. Land Use Sci. 2019, 14, 425–439. [Google Scholar] [CrossRef]
  40. Alemu, H.; Senay, G.; Kaptue, A.; Kovalskyy, V. Evapotranspiration Variability and Its Association with Vegetation Dynamics in the Nile Basin, 2002–2011. Remote Sens. 2014, 6, 5885–5908. [Google Scholar] [CrossRef]
  41. Xie, S.; Mo, X.; Hu, S.; Liu, S. Contributions of Climate Change, Elevated Atmospheric CO2 and Human Activities to ET and GPP Trends in the Three-North Region of China. Agric. For. Meteorol. 2020, 295, 108183. [Google Scholar] [CrossRef]
  42. Ali, S.; Xu, Y.; Jia, Q.; Ma, X.; Ahmad, I.; Adnan, M.; Gerard, R.; Ren, X.; Zhang, P.; Cai, T.; et al. Interactive Effects of Plastic Film Mulching with Supplemental Irrigation on Winter Wheat Photosynthesis, Chlorophyll Fluorescence and Yield under Simulated Precipitation Conditions. Agric. Water Manag. 2018, 207, 1–14. [Google Scholar] [CrossRef]
  43. Bejagam, V.; Sharma, A. Remote Sensing-Based Multi-Scale Characterization of Ecohydrological Indicators (EHIs) in India. Ecol. Eng. 2023, 187, 106841. [Google Scholar] [CrossRef]
  44. Chen, S.; Fu, Y.; Hao, F.; Li, X.; Zhou, S.; Liu, C.; Tang, J. Vegetation Phenology and Its Ecohydrological Implications from Individual to Global Scales. Geogr. Sustain. 2022, 3, 334–338. [Google Scholar] [CrossRef]
  45. Adebayo, O.; Singh, A.; Bista, P.; Angadi, S.; Ghimire, R. Compost Addition Improves Soil Water Storage and Crop Water Productivity in Cover Crop Integrated Sorghum Production System under a Limited Irrigation Management. Irrig. Sci. 2025, 43, 1559–1573. [Google Scholar] [CrossRef]
  46. Ali, S.; Jan, A.; Manzoor; Sohail, A.; Khan, A.; Khan, M.I.; Inamullah; Zhang, J.; Daur, I. Soil Amendments Strategies to Improve Water-Use Efficiency and Productivity of Maize under Different Irrigation Conditions. Agric. Water Manag. 2018, 210, 88–95. [Google Scholar] [CrossRef]
  47. Jiang, Z.; Ni, X.; Xing, M. A Study on Spatial and Temporal Dynamic Changes of Desertification in Northern China from 2000 to 2020. Remote Sens. 2023, 15, 1368. [Google Scholar] [CrossRef]
  48. Liu, X.; de Sherbinin, A.; Zhan, Y. Mapping Urban Extent at Large Spatial Scales Using Machine Learning Methods with VIIRS Nighttime Light and MODIS Daytime NDVI Data. Remote Sens. 2019, 11, 1247. [Google Scholar] [CrossRef]
  49. Arshad, S.; Kazmi, J.; Prodhan, F.; Mohammed, S. Exploring Dynamic Response of Agrometeorological Droughts towards Winter Wheat Yield Loss Risk Using Machine Learning Approach at a Regional Scale in Pakistan. Field Crops Res. 2023, 302, 109057. [Google Scholar] [CrossRef]
  50. Bahrami, H.; Homayouni, S.; McNairn, H.; Hosseini, M.; Mahdianpari, M. Regional Crop Characterization Using Multi-Temporal Optical and Synthetic Aperture Radar Earth Observations Data. Can. J. Remote Sens. 2022, 48, 258–277. [Google Scholar] [CrossRef]
  51. Abdi, B.; Kolo, K.; Shahabi, H. Assessment of Land Degradation Susceptibility within the Shaqlawa Subregion of Northern Iraq-Kurdistan Region via Synergistic Application of Remotely Acquired Datasets and Advanced Predictive Models. Environ. Monit. Assess. 2024, 196, 1103. [Google Scholar] [CrossRef]
  52. Burrell, A.; Evans, J.; Liu, Y. Detecting Dryland Degradation Using Time Series Segmentation and Residual Trend Analysis (TSS-RESTREND). Remote Sens. Environ. 2017, 197, 43–57. [Google Scholar] [CrossRef]
  53. Shi, Y.; Jin, N.; Ma, X.; Wu, B.; He, Q.; Yue, C.; Yu, Q. Attribution of Climate and Human Activities to Vegetation Change in China Using Machine Learning Techniques. Agric. For. Meteorol. 2020, 294, 108146. [Google Scholar] [CrossRef]
  54. Edwin, I.; Chukwuka, O.; Ochege, F.; Ling, Q.; Chen, B.; Nzabarinda, V.; Ajaero, C.; Hamdi, R.; Luo, G. Quantifying Land Change Dynamics, Resilience and Feedback: A Comparative Analysis of the Lake Chad Basin in Africa and Aral Sea Basin in Central Asia. J. Environ. Manag. 2024, 361, 121218. [Google Scholar] [CrossRef]
  55. Kaur, H.; Huggins, D.; Rupp, R.; Abatzoglou, J.; Stöckle, C.; Reganold, J. Agro-Ecological Class Stability Decreases in Response to Climate Change Projections for the Pacific Northwest, USA. Front. Ecol. Evol. 2017, 5, 74. [Google Scholar] [CrossRef]
  56. Acharki, S.; Singh, S.; do Couto, E.; Arjdal, Y.; Elbeltagi, A. Spatio-Temporal Distribution and Prediction of Agricultural and Meteorological Drought in a Mediterranean Coastal Watershed via GIS and Machine Learning. Phys. Chem. Earth 2023, 131, 103425. [Google Scholar] [CrossRef]
  57. Aguilar, R.; Zurita-Milla, R.; Izquierdo-Verdiguier, E.; de By, R. A Cloud-Based Multi-Temporal Ensemble Classifier to Map Smallholder Farming Systems. Remote Sens. 2018, 10, 729. [Google Scholar] [CrossRef]
  58. Ablat, X.; Liu, G.; Liu, Q.; Huang, C. Application of Landsat Derived Indices and Hydrological Alteration Matrices to Quantify the Response of Floodplain Wetlands to River Hydrology in Arid Regions Based on Different Dam Operation Strategies. Sci. Total Environ. 2019, 688, 1389–1404. [Google Scholar] [CrossRef]
  59. Akbas, E.; Celik, R.; Esit, M.; Deger, I. Climate Change Impacts on Hydrological and Meteorological Variables in Diyarbakır Province: Trend Analysis and Machine Learning-Based Drought Forecasting. Theor. Appl. Climatol. 2025, 156, 295. [Google Scholar] [CrossRef]
  60. Al-Ghobari, H.M.; Mohammad, F.S.; El Marazky, M.S.A.; Dewidar, A.Z. Automated Irrigation Systems for Wheat and Tomato Crops in Arid Regions. Water SA 2017, 43, 354–364. [Google Scholar] [CrossRef]
  61. Yin, X.; Feng, Q.; Zheng, X.; Wu, X.; Zhu, M.; Sun, F.; Li, Y. Assessing the Impacts of Irrigated Agriculture on Hydrological Regimes in an Oasis-Desert System. J. Hydrol. 2021, 594, 125976. [Google Scholar] [CrossRef]
  62. de Almeida, C.; Galvao, L.; Ometto, J.; Jacon, A.; Pereira, F.; Sato, L.; Silva, C.J.; Brancalion, P.; de Aragao, L. Advancing Forest Degradation and Regeneration Assessment Through Light Detection and Ranging and Hyperspectral Imaging Integration. Remote Sens. 2024, 16, 3935. [Google Scholar] [CrossRef]
  63. Huang, D.; Cao, S.; Zhao, W.; Zhao, P.; Chen, J.; Yu, M.; Zhu, Z. Urban Greening amidst Global Change: A Comparative Study of Vegetation Dynamics in Two Urban Agglomerations in China under Climatic and Anthropogenic Pressures. Ecol. Indic. 2024, 159, 111739. [Google Scholar] [CrossRef]
  64. Araya, A.; Kisekka, I.; Prasad, P.V.V.; Holman, J.; Foster, A.J.; Lollato, R. Assessing Wheat Yield, Biomass, and Water Productivity Responses to Growth Stage Based Irrigation Water Allocation. Trans. ASABE 2017, 60, 107–121. [Google Scholar] [CrossRef]
  65. An, X. Responses of Water Use Efficiency to Climate Change in Evapotranspiration and Transpiration Ecosystems. Ecol. Indic. 2022, 141, 109157. [Google Scholar] [CrossRef]
Figure 1. Geographical location, topography, and ecohydrological subregional divisions of Xinjiang, China. Figure 1 illustrates the geographical setting of Xinjiang, a climatically diverse arid region divided by the Tianshan Mountains into three distinct ecohydrological subregions—Northern (mountain-fed hydrology), Southern (anthropogenically modified oases), and Eastern (hyper-arid basins)—highlighting the interplay of topography, hydroclimate, and human influence on vegetation–water dynamics.
Sustainability 18 05478 g001
Figure 2. Spatial Distribution of Key Variables in Xinjiang for 2023. The 2023 spatial patterns of ecohydrological and anthropogenic indicators in Xinjiang reveal a distinct northwest-southeast aridity gradient, with montane ecosystems and oases in the north exhibiting higher vegetation productivity (ET, GPP, NDVI), while hyper-arid southern/eastern basins show minimal biological activity, all against a backdrop of sharply localized urbanization (nighttime lights) and declining moisture availability (precipitation, soil moisture) toward the southeast.
Sustainability 18 05478 g002
Figure 3. Overlapped Interannual Dynamics of Standardized Indicators across Xinjiang Subregions from 2000 to 2023. Each regional time series was standardized within the corresponding indicator to emphasize temporal dynamics and interregional comparability. Positive values indicate years above the regional long-term mean, and negative values indicate years below the regional long-term mean. The overlapped curves highlight synchronous changes in nighttime light and soil moisture, stronger interannual variability in precipitation and temperature, and differentiated vegetation responses among Northern, Southern, and Eastern Xinjiang.
Sustainability 18 05478 g003
Figure 4. Spatiotemporal Evolution of EcoIndex across Xinjiang from 2000 to 2023. The color scale represents EcoIndex values, with lower values indicating weaker integrated eco-hydrological conditions and higher values indicating stronger integrated eco-hydrological conditions. A unified color scale was applied to all annual panels to enable cross-year comparison. The value μ shown in each panel title denotes the annual spatial mean EcoIndex calculated from all valid pixels within Xinjiang. Higher μ values indicate years with relatively stronger province-wide eco-hydrological conditions, whereas lower μ values indicate weaker overall conditions.
Sustainability 18 05478 g004
Figure 5. Spatiotemporal Patterns of Eco-Hydrological Quadrant Shifts across Xinjiang from 2001 to 2023. The four colors represent the four eco-hydrological functional quadrants defined by the joint annual changes in WUE and NDVI: Quadrant I, co-enhancement; Quadrant II, stress release; Quadrant III, co-degradation; and Quadrant IV, emerging stress. Uncolored areas indicate zones with minimal or statistically insignificant changes in either vegetation productivity or water-use efficiency. The unified legend applies to all annual panels, enabling comparison of functional transition patterns across years.
Sustainability 18 05478 g005
Figure 6. Spatiotemporal Evolution of the Eco-Hydrological Synchrony Index (ESI) across Xinjiang from 2000 to 2023. The color scale represents ESI values, with higher values indicating stronger synchrony between vegetation growth and water-use efficiency and lower values indicating weaker synchrony or stronger eco-hydrological decoupling. A unified color scale was applied to all annual panels to enable cross-year comparison. The value μ shown in each panel title denotes the annual spatial mean ESI calculated from all valid pixels within Xinjiang. Higher μ values indicate years with stronger overall vegetation–water synchrony, whereas lower μ values indicate weaker regional synchrony.
Sustainability 18 05478 g006
Figure 7. Temporal Trend Characteristics of EcoIndex in Xinjiang (2000–2023). Sen’s slope and Mann–Kendall tests reveal statistically significant ecohydrological trends in Xinjiang (2000–2023), with spatially varying rates of change in ecosystem function and vegetation–water coupling strength.
Sustainability 18 05478 g007
Figure 8. Temporal Trend Characteristics of ESI in Xinjiang (2000–2023). The ESI trend analysis (2000–2023) demonstrates spatially divergent ecosystem stress dynamics in Xinjiang, with northern regions showing stabilization and southern arid zones experiencing intensified ecological pressure over time.
Sustainability 18 05478 g008
Figure 9. Comparative Importance of Climatic and Anthropogenic Drivers across Xinjiang Subregions. The grouped bars show the mean normalized random forest importance scores of individual predictors. PR, SOIL, and TEMP represent climatic or natural hydroclimatic drivers, whereas NL and CLCD represent anthropogenic proxies. Higher values indicate stronger relative explanatory importance for EcoIndex anomalies within the corresponding region, but they should not be interpreted as areal proportions of natural or anthropogenic dominance.
Sustainability 18 05478 g009
Figure 10. Proportions of Climatic, Anthropogenic, and Mixed Eco-Hydrological Dominance across Xinjiang Subregions. The stacked bar chart illustrates the areal distribution of dominant driver types across Xinjiang and its three subregions. Climatic dominance indicates that precipitation, soil moisture, or temperature had stronger explanatory importance, whereas anthropogenic dominance indicates that nighttime light intensity or land cover change had stronger explanatory importance. Anthropogenic dominance should be interpreted as an integrated signal of human-related land and water management activities, including irrigation, groundwater use, hydrological regulation, oasis expansion, construction land growth, and local vegetation restoration or degradation. Mixed influence denotes areas where climatic and anthropogenic controls were jointly involved, and no single driver group was clearly dominant.
Sustainability 18 05478 g010
Table 1. Datasets and Analytical Indicators for Vegetation–Water Interaction Assessment in Xinjiang (2000–2023). Table 1 summarizes the multi-source datasets and products used in this study, including CLCD, MODIS ET/GPP/NDVI products, the NOAA/EOG intercalibrated annual nighttime light product, and TerraClimate hydroclimatic variables. The table provides the source or product name, unit, temporal aggregation method, and target resolution of each dataset used for integrated ecohydrological diagnostics across climatic and anthropogenic drivers.
CategoryData NameSource/ProductUnitTemporal AggregationTarget Resolution
Baseline IndicatorCLCDZenodo/China Land Cover Datasetclass indexannual825 m
Process IndicatorETNASA MODIS ET productmmannual sum/annual mean825 m
Process IndicatorGPPNASA MODIS GPP product g C   m 2   d a y 1 annual mean/sum825 m
Process IndicatorNDVIMODIS NDVI productdimensionlessannual mean825 m
DriverNighttime lightNOAA/EOG intercalibrated annual nighttime light product n W   c m 2   s r 1 annual composite/annual mean825 m
DriverPRTerraClimate precipitationmmannual sum825 m
DriverSOILTerraClimate soil moistureproduct-defined unitannual mean825 m
DriverTEMPTerraClimate average temperature°Cannual mean825 m
Table 2. Ecological Interpretations of Eco-Hydrological Quadrant Classifications. The EcoIndex integrates WUE and NDVI via variance-maximizing projection to assess arid ecosystem resilience, while ESI and quadrant mapping reveal vegetation–water coupling strength and functional shifts under stress.
QuadrantConditionEcological Interpretation
I W U E > 0 , N D V I > 0 Simultaneous enhancement of water use efficiency and vegetation growth
II W U E < 0 , N D V I > 0 Vegetation gain despite declining water efficiency (potential water stress relaxation)
III W U E < 0 , N D V I < 0 Co-degradation of water efficiency and vegetation productivity
IV W U E > 0 , N D V I < 0 Water conservation accompanied by vegetation decline (emerging vegetation stress)
Table 3. Spatial Statistics of Significant Trends in EcoIndex and Eco-Hydrological Synchrony Index (ESI) Across Xinjiang (2000–2023). The table summarizes the proportions of improved, degraded, and stable areas, together with the mean Sen’s slopes for each region.
RegionIndicatorUp (%)Down (%)Stable (%)Mean Slope (Up)Mean Slope (Down)
OverallEcoIndex44.013.3552.640.0107−0.0211
OverallESI5.173.1191.710.0005−0.0004
Northern XinjiangEcoIndex18.607.0274.390.0401−0.0271
Northern XinjiangESI13.936.6879.390.0006−0.0005
Southern XinjiangEcoIndex54.912.1742.920.0079−0.0167
Southern XinjiangESI2.862.2194.940.0004−0.0004
Eastern XinjiangEcoIndex37.502.3260.170.0041−0.0075
Eastern XinjiangESI0.200.9198.890.0005−0.0004
Table 4. Regional mean and median statistics of normalized random forest predictor importance in Xinjiang. The mean values correspond to the bar heights shown in Figure 9, whereas the median values are additionally reported to describe the central tendency of pixel-level importance distributions within each region.
RegionPR MeanPR MedianSOIL MeanSOIL MedianTEMP MeanTEMP MedianNL MeanNL MedianCLCD MeanCLCD Median
Overall0.2480.2180.2330.2020.1740.140.1660.1270.1790.139
Northern Xinjiang0.2950.2610.2590.2280.1980.1570.1350.0960.1130.075
Southern Xinjiang0.2220.1940.2150.1850.1570.130.2050.1740.2090.171
Eastern Xinjiang0.210.180.1970.1680.1420.1130.1720.1440.1860.156
Table 5. Proportions of Climatic, Anthropogenic, and Mixed Dominance Across Xinjiang Subregions. In Xinjiang, climatic drivers dominate 63.27% of the region, with sharp contrasts: Northern Xinjiang maintains strong climate control (75.08%), while Southern Xinjiang shows heightened human influence (30.64%), and Eastern Xinjiang reveals fragile hybrid zones where mixed influence accounts for 20.71% of the region.
RegionClimate Dominated (%)Human Dominated (%)Mixed Influence (%)
Overall63.2722.4114.32
Northern Xinjiang75.0812.4212.5
Southern Xinjiang53.7530.6415.61
Eastern Xinjiang55.823.4920.71
Disclaimer/Publisher’s Note: The statements, opinions and data contained in all publications are solely those of the individual author(s) and contributor(s) and not of MDPI and/or the editor(s). MDPI and/or the editor(s) disclaim responsibility for any injury to people or property resulting from any ideas, methods, instructions or products referred to in the content.