Article

Advanced Biocompatible SnO2/ZnO–TiO2 Nanocomposites for Sustainable Environmental Protection and Dye Degradation


by
Evghenii Goncearenco
1,2,
Monica Scarisoreanu
1,*,
Iuliana P. Morjan
1,
Elena Dutu
1,
Valentin. S. Teodorescu
3,4,
Carmen Ioana Fort
5 and
Miruna Stan
6
1
National Institute for Lasers, Plasma and Radiation Physics, 409 Atomistilor Str., 077125 Magurele, Romania
2
Faculty of Physics, University of Bucharest, 405 Atomistilor Str., 077125 Magurele, Romania
3
National Institute of Materials Physics, 405A Atomistilor Str., 077125 Magurele, Romania
4
Academy of Romanian Scientists, 3 Ilfov, 050044 Bucharest, Romania
5
Research Center of Electrochemistry and Non-Conventional Materials, Department of Chemical Engineering, Faculty of Chemistry and Chemical Engineering, “Babes-Bolyai” University, 11 Arany Janos Str., 400028 Cluj-Napoca, Romania
6
Department of Biochemistry and Molecular Biology, University of Bucharest, 91-95 Splaiul Independenţei Str., 050095 Bucharest, Romania
*
Author to whom correspondence should be addressed.
Sustainability 2026, 18(11), 5461; https://doi.org/10.3390/su18115461 (registering DOI)
Submission received: 28 April 2026 / Revised: 26 May 2026 / Accepted: 27 May 2026 / Published: 29 May 2026

Abstract

Increasing environmental pollution has intensified the focus on sustainability, encouraging the development of eco-friendly materials. This study reports the synthesis of binary (ZnO–TiO2) and ternary (SnO2–ZnO–TiO2) compounds and their loading with Au/Ag/Pt/P noble metals (NMs) to enhance photodegradation efficiency under visible light compared to pristine TiO2. The compounds were synthesized in a single step via laser pyrolysis, and then noble metal deposition through chemical impregnation and reduction was performed. Structural and morphological analyses revealed TiO2-based nanoparticles with varied morphologies decorated with noble metal nanoparticles with sizes between 2 and 6 nm (for Pt and Pd). Photocatalytic tests demonstrated a significant improvement in Methyl Orange (MO) degradation under visible light, especially for Ag-loaded samples. The degradation rate increased from 1.03 × 10⁻³ min−1 (TZ) to 22.65 × 10⁻³ min−1 (TZS_Ag), while it was 0.09 × 10⁻³ min−1 for the commercial P25 sample. Biocompatibility assays indicated lower cytotoxicity than Degussa P25, with Au- and Pd-loaded samples showing improved compatibility with HaCaT and HEK293 cells. Overall, these findings demonstrate that the developed TiO2-based nanocomposites, designed through a novel and sustainable strategy combining binary/ternary heterostructures with noble metal loading, are promising candidates for efficient visible light-driven photocatalytic environmental decontamination with enhanced biological compatibility.

1. Introduction

MO is a dye pollutant frequently found in waters/rivers, especially in areas where the textile industry is developing rapidly [1,2]. The continuous increase in industrial activity and associated wastewater discharge has intensified the urgency for developing advanced and sustainable water purification technologies. Even exposure to small concentrations of MO can cause adverse effects on human health (such as skin irritations and respiratory problems) or disturb aquatic ecosystems [3]. Contamination of natural water sources with MO and other dye pollutants poses a growing environmental concern due to their high chemical stability, resistance to biodegradation, and potential to accumulate in aquatic ecosystems, where they can disrupt photosynthetic activity, reduce dissolved oxygen levels, and ultimately affect aquatic biodiversity and ecosystem functioning. Furthermore, conventional treatment methods often fail to achieve complete mineralization of such persistent organic compounds, highlighting the need for advanced materials capable of efficient pollutant removal under sustainable operating conditions. In addition to efforts to prevent the discharge of hazardous materials into natural waters, the scientific community is also focused on discovering efficient methods for treating wastewater and removing pollutants. In this context, photocatalytic degradation has emerged as a promising and environmentally sustainable approach due to its ability to utilize solar or visible light energy for pollutant removal without secondary contamination. Among the various methods used for MO degradation (biological, chemical, and physical), water treatment using photocatalysts is one of the most widely used techniques reported in the literature [3,4].
TiO2 is recognized as a key photocatalyst, defined as the material that accelerates a chemical reaction through the absorption of light, resulting in the generation of electron–hole pairs. Due to its unique properties such as chemical stability, non-toxicity, and low cost, it is used in photocatalytic processes for cleaning organic pollutants and microbes from water and air [5,6,7]. However, in the photodegradation processes, it shows limitations due to both poor absorption in the visible field (only 3–4%) and the high speed of recombination of electron–hole pairs. To overcome these barriers, there are three solutions: (i) doping with nonmetals or transitional metals, (ii) coupling with another semiconductor, and (iii) decorating with NM nanoparticles. Through the doping process, a reduction of the band gap (from 3.2 eV and 3.0 eV for anatase and rutile, respectively) is achieved, which means better absorption in the visible spectrum [7,8]. By coupling with another metal oxide, semiconductor–semiconductor heterojunctions are created, enhancing charge transfer and the efficient separation of formed electron–hole pairs, which leads to an increase in the lifetime of the photogenerated electrons and holes [9,10]. By loading with NM particles, the charge carrier separation in the photocatalyst is improved, resulting in more effective redox reactions at the surface as well as better absorption in the visible domain as an effect of surface plasmon resonance (SPR) [11,12].
Concerning the mixing of metal oxides, the literature has reported that, in photodegradation experiments, much better results are obtained when a mix of semiconductors is used compared to using each oxide individually. According to the Web of Science Core Collection, in the last 15 years, the number of scientific papers has increased continuously, indicating the growing interest in binary/ternary composites research. ZnO is an n-type metal oxide semiconductor with a wide direct band gap of nearly 3.2 eV. By coupling with TiO2, it becomes a good candidate due to its strong oxidation capability and good photocatalytic properties [13,14]. Yu Wei has shown that ZnTiO3 has a significant role in the formation of the heterojunction with TiO2 and ZnO, to improve the photocatalytic discoloration of MB [15]. SnO2 is an n-type semiconductor metal oxide with a wide direct band gap of approximately 3.6 eV, which, by coupling with TiO2, can enhance its photocatalytic efficiency [16,17]. The anatase phase is targeted in processes using pure TiO2, and coupling with semiconductors usually leads to phase transformations from anatase to rutile, with rutile sometimes becoming dominant.
The effect of loading with NMs on the surface of different types of TiO2-based nanomaterials has been investigated in terms of the photodegradation of various organic molecules [11,12]. Additionally, it has been reported that some oxidized forms such as PdO and Ag2O or AgCl and Ag@AgCl improve the properties of TiO2 in environmental applications due to their non-toxicity and oxidation capacity under visible light [18,19,20]. An evolving challenge is discovering methods based on environmentally friendly/biocompatible oxide composite materials (binary and ternary compounds) that, when exposed to UV light, become effective in depolluting water and the environment.
Thus, in this work, our efforts are focused on obtaining complex binary (ZnO-TiO2) and ternary (SnO2-ZnO-TiO2) composites and loading them with various NM nanoparticles (Au, Ag, Pt, Pd), as well as on revealing their photocatalytic performance in terms of the degradation of the organic pollutant MO. The results obtained from the sample characterizations are summarized to illustrate which properties of the new nanopowders lead to an improvement in the photocatalytic degradation of MO under visible light. The novelty consists of the development of multi-component TiO2-based nanocomposites via a combined strategy of binary/ternary heterostructure formation and noble metal loading. In addition, a comparative analysis with state-of-the-art studies [3,7] emphasizes the superior performance and sustainability-oriented advantages of the proposed materials, particularly in terms of improved efficiency, stability, and resource-efficient design for advanced water treatment applications.

2. Materials and Methods

2.1. Synthesis of the Nanocomposites

2.1.1. Chemicals

The following materials were used for the preparation of nanocomposites: Titanium tetrachloride (Aldrich (St. Louis, MO, USA), 99.9% purity), Diethylzinc (Aldrich, 1.0 M solution in hexanes), Tin tetrachloride (Aldrich, 98% purity), Synthetic air (Siad (Bergamo, Italy), 99.99% purity), Ethylene (Siad, 99.99% purity), Chloroplatinic acid hydrate (Aldrich, 99.995% purity), Potassium tetrachloropalladate (Aldrich, 99.99% purity), Silver nitrate (Aldrich 99.995% purity), Potassium tetrachloroaurate (Aldrich, 99.995% purity), and Sodium borohydride (Aldrich, 98% purity), used as a reducing agent in the loading process with different noble metal particles.

2.1.2. SnO2/ZnO-TiO2 Nanopowders

In the first stage, ZnO-TiO2 and SnO2-ZnO-TiO2 nanopowders (samples named TZ and TZS, respectively) were obtained using a one-step method: laser pyrolysis (see Figure 1). Titanium tetrachloride was used as a precursor for Ti atoms, Diethylzinc was used as a precursor for Zn, and Tin tetrachloride was used as a precursor for Sn atoms. As they are volatile substances at room temperature, the vapors of these precursors were entrained by a carrier gas to the reaction chamber. Synthetic air was used as the oxidizing agent for the formation of the oxide species of the precursors listed above. Ethylene played the role of the heat transfer agent. Both the pressure in the reaction chamber and the gas flow rates were very well monitored using fine-tuned measuring instruments. The laser pyrolysis method is based on the resonant absorption of CO2 laser radiation (10.6 μm) by at least one of the reactants. In the case in which none of the precursors absorbs the laser radiation, it uses a heat transfer agent. The reaction takes place in the laser pyrolysis flame, which takes place in the zone of the interaction of the laser beam with the reactants. Following the dissociation of the reactants at the atomic level, nanoparticles are formed and collected on a ceramic filter during the pyrolysis process. The details regarding the principle of the obtaining method, as well as the wide variety of nanoparticles that can be obtained in this way, have been presented in previous studies [21,22,23,24].

2.1.3. SnO2/ZnO-TiO2@NMs Nanopowders

The second stage is the decoration of the nanopowders with noble metals (Ag, Au, Pd, and Pt) using chemical impregnation and the reduction method (Figure 1). Before this stage, the obtained nanopowders were calcined in air at 450 °C for 3 h. This is done to evaporate unwanted impurities from precursors or to oxidize carbon from the heat transfer agent. The temperature was selected to be as high as possible and to maintain the crystal structure of the TiO2. After that, the synthesized nanopowders (~500 mg) were mixed in the distilled water (90 mL) and agitated in the ultrasound bath for 30 min. At the same time, the salt (KAuCl4, AgNO3, H2PtCl6 · 6 H2O, Na2PdCl4) that contained the desired noble metal atoms was also mixed in the distilled water (90 mL) and dissolved during the powder agitation. Theoretically, the salt mass was calculated and was equal to 3 wt.% of the noble metals atoms decorated on the sample surface. The aqueous solutions were mixed and agitated with the foaming device. After that, the aqueous solution of the NaBH4 was injected for the reduction. The solutions were left for several hours for deposition and drying at 60–80 °C. Following this last process, the SnO2/ZnO-TiO2@NMs nanopowders were obtained and their properties characterized and tested. We note that, based on the results obtained for the binary composites (TZ@NMs samples), only Ag was selected for loading the ternary composite nanoparticles (TZS).

2.2. Characterization of Prepared Samples

Energy-dispersive X-ray spectroscopy (EDX) analysis of the TiO2-based samples was performed by an FEI Co. model Quanta Inspect S at 15 kV in high vacuum. The composite samples’ crystallinity was analyzed by X-ray diffraction (XRD) technique using a Bruker D8 diffractometer (Bruker, Billerica, MA, USA) with Bragg–Brentano symmetry (Theta–Theta) and the copper anode. Highscore software was used to handle data and calculate the powders’ parameters. The structural investigations were carried out by transmission electron microscopy (TEM) analysis using the analytical electron microscope model JEOL JEM ARM200F (JEOL, Akishima, Japan) with an acceleration voltage of 200 kV equipped with an EDX spectroscope model JEOL JED-2300T (JEOL, Akishima, Japan). The specific surface area was measured by the Brunauer–Emmett–Teller (BET) technique using BET Flowing Gas Surface Area Analyzers, model Horiba SA-9600 (Horiba, Kyoto, Japan), with a 30% N2 + 70% He gas mixture. The elemental composition, chemical state, and electronic state of all samples were analyzed by X-ray photoelectron spectroscopy (XPS) analysis using an ESCALAB Xi+ (Thermo Scientific Surface Analysis, Thermo Fisher Scientific, Waltham, MA, USA), and Avantage software (version 5.978) was utilized. The UV-VIS diffuse reflectance spectroscopy (UV-Vis-DRS) analysis of the synthesized samples and the photodegradation investigations of MO were carried out using a JASCO-V650 UV-Vis spectrophotometer (JASCO, Tokyo, Japan) with an integration sphere (ILV-724). The spectra recordings were conducted in the range λ = 250–800 nm with a scanning speed of 100 nm/min. DRS was used to determine the influence of metals (Ag, Au, Pt, Pd) on the band gap energy values of support material. The direct band gap energy values of the materials were estimated by using the Tauc plot [25], while the first derivative spectrum (dR/dλ) was also obtained and investigated. In the presence of metal nanoparticles, the DRS was used for the detection of the plasmonic band specific for all nanoparticles [26].

2.3. Photocatalytic Tests

The photocatalytic activities study was performed in a double-walled photoreactor device with 6 × 6 W fluorescent lamps (λmax = 365 nm, irradiation time ~3 h). A flow of water surrounded the photoreactor to assure a constant temperature of 25 °C. The nanocomposite photocatalyst activity was estimated in a suspension (Cphotocatalyst = 1.0 g/L) prepared in the organic dye solution (initial concentration of MO C0, MO = 125 μM). During the measurements, the suspension was continuously stirred, and the dissolved oxygen amount was assured by an air pump. The same system was furthermore used to study the photocatalyst efficiencies under visible light irradiation. In this case, the photoreactor was irradiated by 4 × 24 W lamps (λmax = 545 nm). The sampling was performed every 15 min, and samples were filtered with Whatman® GD/X syringe filters (0.02 μm pore diameter) (Whatman, Kent, UK) to eliminate the photocatalyst particles. The concentration of MO was evaluated using a JASCO V-650 spectrophotometer at 513 nm (JASCO, Tokyo, Japan). The ln(C/C0) vs. irradiation time curve was plotted, supposing first-order kinetics, where C is MO concentration: C0—at the beginning of the experiment and C—during the experiment. From the slope of the obtained linear regression, the photocatalytic rate constants were valued. The estimated error of the photoactivity investigations took into consideration the reproducibility measurements and was estimated in the range 2–5%. At the used MO concentration, for all photocatalysts, the adsorption process was insignificant (below 5%).

2.4. Biocompatibility Tests

2.4.1. Cell Culture

Human embryonic kidney cells (HEK293 cell line) and human keratinocytes (HaCaT cell line) were cultured in Dulbecco’s Modified Eagle Medium supplemented with 10% fetal bovine serum and 1% penicillin–streptomycin and maintained at 37 °C in a humidified atmosphere containing 5% CO2. Cells were passaged at 70–80% confluence using 0.25% trypsin–EDTA and seeded at a density of 4 × 10⁴ cells/cm2 in 96-well plates for viability and toxicity assays or T25 flasks for oxidative stress analysis.

2.4.2. MTT Assay

Cell viability was assessed using the MTT assay after 24 h of incubation with nanoparticles at various concentrations. MTT solution (1 mg/mL) was added to each well and incubated for 3 h at 37 °C. Formazan crystals were dissolved in 2-propanol, and absorbance was measured at 595 nm using a microplate reader.

2.4.3. Lactate Dehydrogenase (LDH) Release Assay

LDH level in the culture medium was measured using a commercial cytotoxicity detection kit (Roche Applied Science, Penzberg, Germany) according to the manufacturer’s instructions. Briefly, after 24 h of exposure to nanoparticles, 50 µL of supernatant was transferred to a new plate, and the reaction mix was added. After 30 min of incubation in the dark, absorbance was read at 490 nm.

2.4.4. Nitric Oxide (NO) Quantification

NO levels in the culture medium were estimated by using the Griess reagent. After 24 h of incubation with nanoparticles, 50 µL of culture supernatant was mixed with an equal volume of Griess reagent (1% sulfanilamide, 0.1% NED in 2.5% phosphoric acid) and incubated at room temperature for 10 min. Absorbance was measured at 540 nm, and nitrite concentration was calculated using a sodium nitrite standard curve.

2.4.5. Reactive Oxygen Species (ROS) Generation Assay

Intracellular ROS production was evaluated using 2′,7′-dichlorodihydrofluorescein diacetate (H2DCFDA). Cells were incubated with 10 µM H2DCFDA for 30 min at 37 °C in the dark and then washed with PBS. After nanoparticle exposure, fluorescence intensity was measured using a microplate reader (excitation/emission: 485/528 nm).

2.4.6. Preparation of Cell Lysates

After 24 h of treatment with nanoparticles, cells cultured in flasks were washed twice with PBS, detached with trypsin solution, washed again with PBS, and lysed by ultrasonication on ice. Lysates were centrifuged at 12,000× g for 10 min at 4 °C, and the supernatants were collected and stored at −80 °C for further analysis.

2.4.7. Reduced Glutathione (GSH) Determination

GSH content in the cell lysates was determined using the DTNB (5,5′-dithiobis-(2-nitrobenzoic acid)) method. Briefly, 100 µL of lysate was mixed with 100 µL of 5% sulfosalicylic acid, incubated on ice for 10 min, and centrifuged. The supernatant was reacted with DTNB in phosphate buffer (pH 7.4), and absorbance was read at 412 nm. GSH concentration was calculated from a standard curve using known concentrations of GSH.

2.4.8. MDA Measurement

Malondialdehyde (MDA) levels were assessed using the thiobarbituric acid. MDA concentration was determined using a standard curve prepared with 1,1,3,3-tetramethoxypropane. The relative fluorescence intensity of MDA-TBA adducts was read at a 520/549 nm wavelength of excitation/emission.

2.4.9. Statistical Analysis

All experiments were performed in triplicate and repeated at least three times independently. Data were calculated as mean ± standard deviation (SD) and expressed relative to the control group. Statistical analysis was performed using GraphPad Prism 9.0 software. Differences between groups were analyzed using one-way ANOVA followed by Tukey’s post hoc test. A p-value < 0.05 was considered statistically significant.

3. Results and Discussion

3.1. EDX Analysis

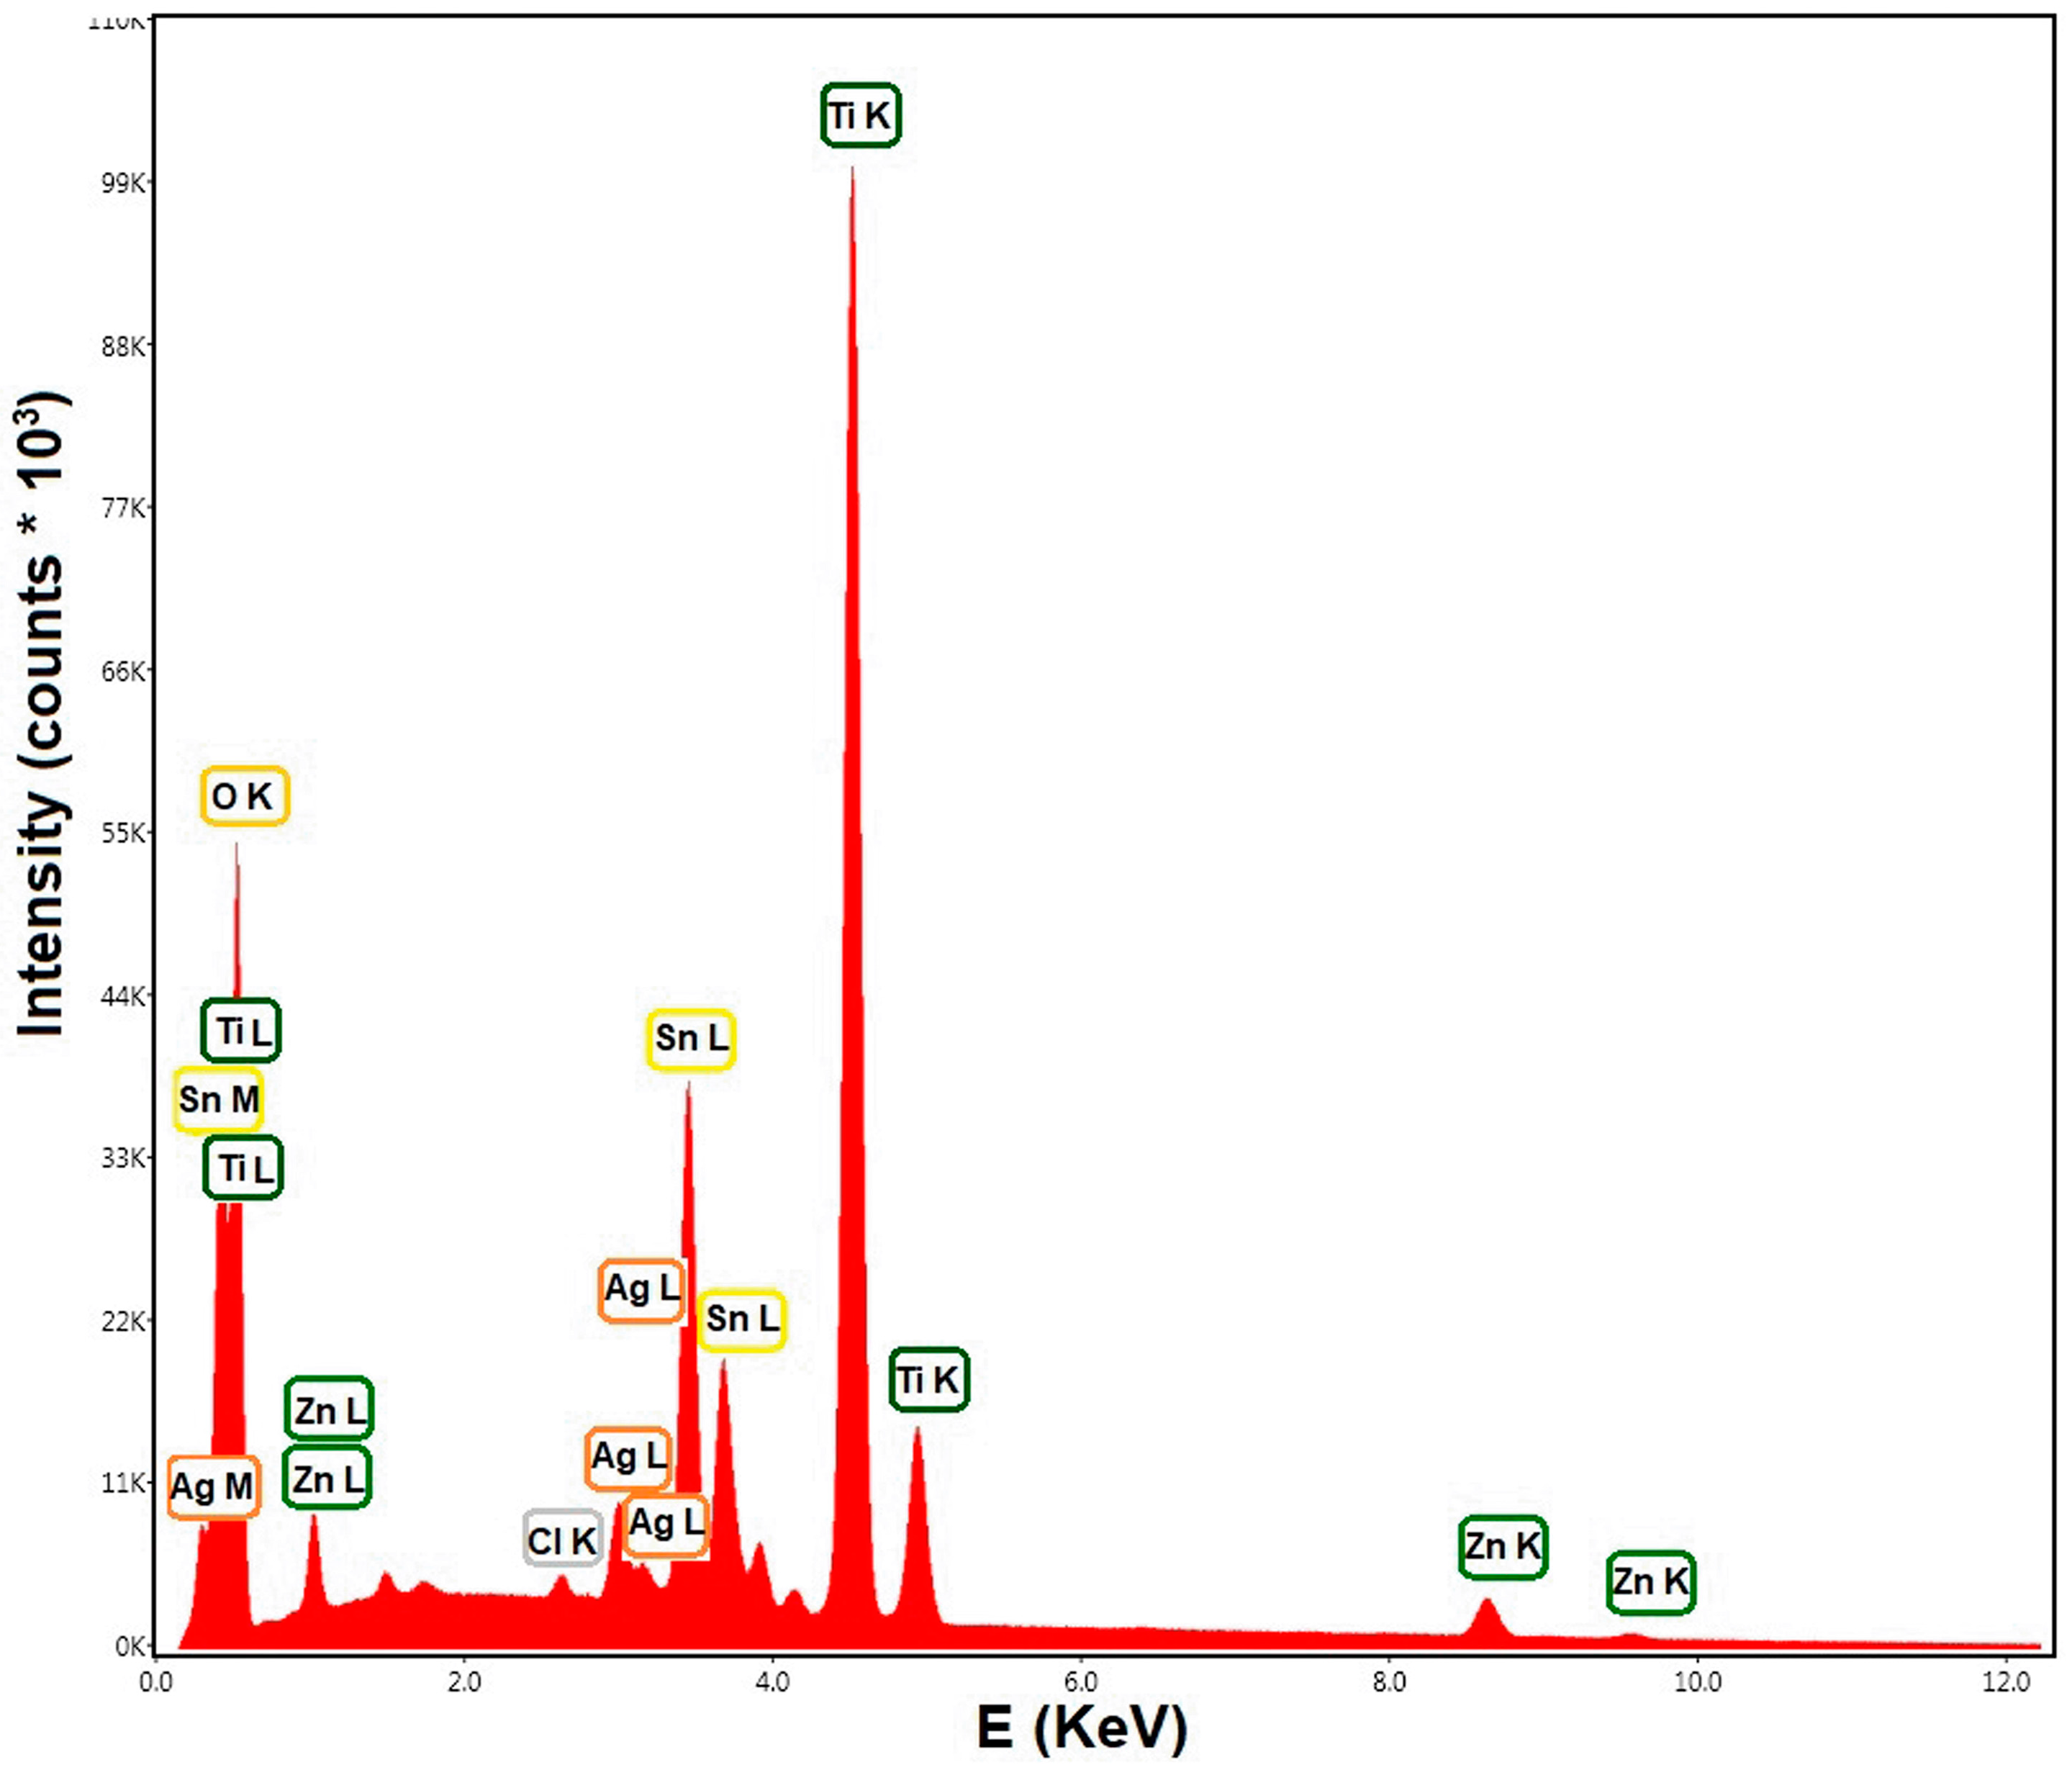
EDX spectroscopy was used to identify the elemental composition of the samples, and the results are presented in Table 1. In the case of the TZS_Ag sample, the EDX spectrum confirms the elemental composition of the nanoparticles. It can be seen that Ti is the dominant element in the sample, followed by Sn and Zn, and Ag is also present (Figure 2). The chemical compositions of the samples are in good correlation with the gas flows precursors used in the synthesis. All the samples show traces of Cl and C impurities resulting from the decomposition in the laser pyrolysis process of TiCl4 and C2H4, respectively. The EDX results confirm the presence of Ti, Zn, Sn, O, Au, Ag, Pt, and Pd elements in the synthesized nanoparticles, in good correlation with XPS analyses which also identified the chemical bonds between them (see below).

3.2. XRD Analysis

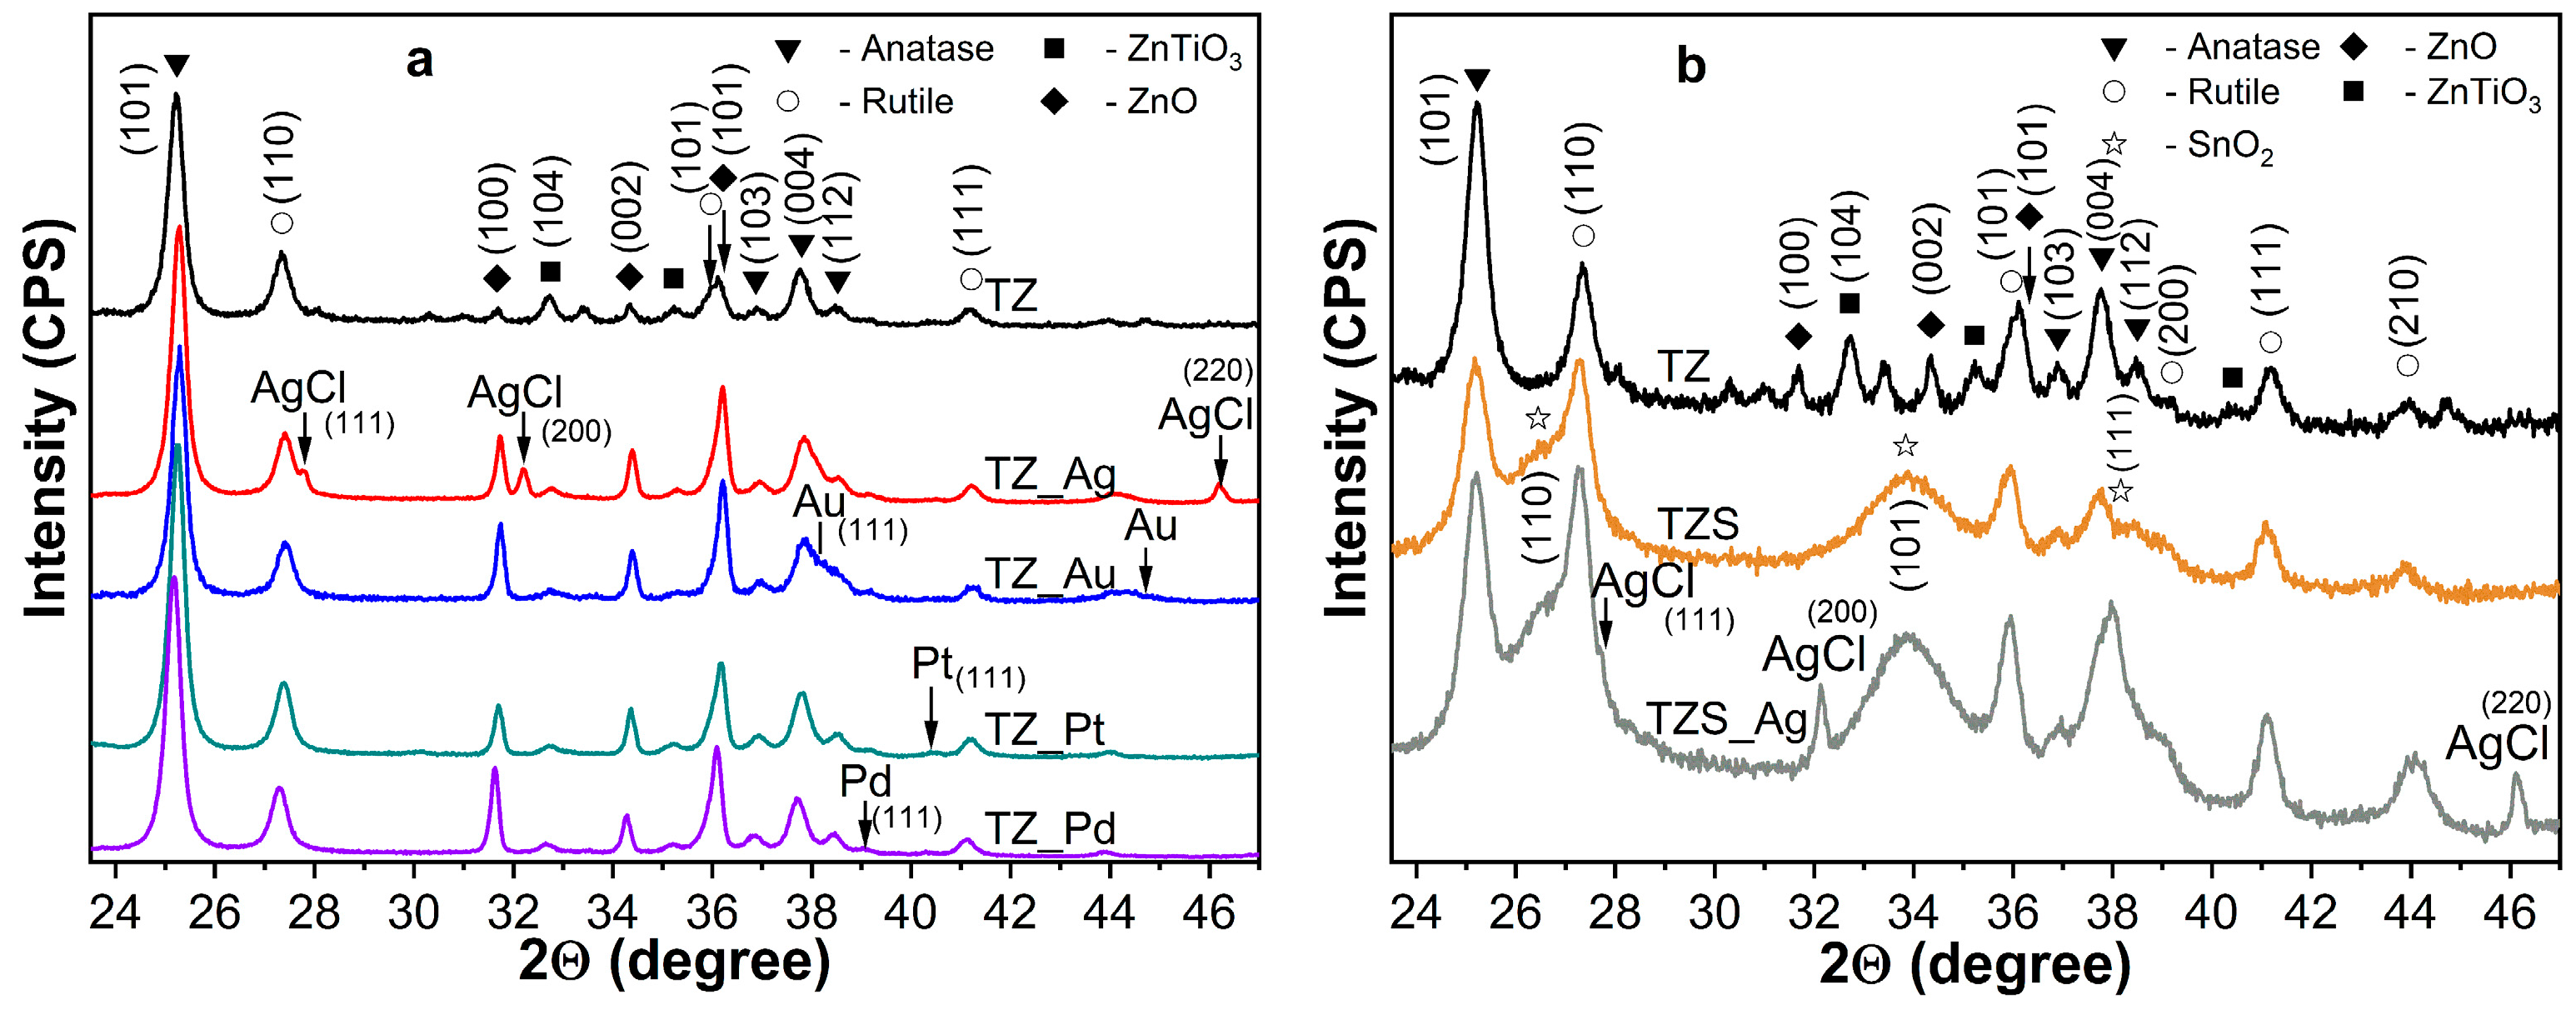
Crystal structures of the synthesized powders were investigated by X-ray diffraction at room temperature. The obtained diffractograms were analyzed using HighScore Plus 4.8 software with the ICDD 2025 database. The XRD patterns are presented in Figure 3a,b, while the identified phases and crystallite sizes are summarized in Table 1.
The diffraction patterns reveal the presence of the anatase (ICDD #01-070-7348) and rutile (ICDD #01-084-1283) phases of the TiO2. The ratio between these two phases was calculated with the Spurr and Myers equation [27], and the characteristic intense peaks at 25.32° (anatase) and 27.44° (rutile) were used. The variation in the anatase/rutile phase was minor for the TiO2/ZnO powders, whereas the introduction of the SnO2 significantly modified it. The crystallite sizes were calculated using the Scherrer equation [28] and are also presented in Table 1. Additional peaks in the range between 32° and 40° were observed. Some of these peaks correspond to the hexagonal ZnO phase (ICDD #04-015-4060). The peaks located at the angles 32.79°, 35.30°, and 40.45° were assigned to the unexpected ZnTiO3 phase (ICDD #00-026-1500) and its crystallite size was estimated to be 41.4 nm. The formation of the ZnTiO3 compound could be attributed to the heat treatment of the synthesized TiO2-ZnO powders at 450 °C that promoted the diffusion of the Zn2+ ions into the TiO2 lattice [29] and led to the formation of the ternary oxide phase.
The additional SnO2 phase (ICDD #01-071-5323) in the TZS and TZS-Ag powders was identified. At the same time, the intensity of the ZnO diffraction peaks decreased compared with the TZ samples (Figure 3b). Since the Zn concentration was almost identical (from EDX analysis) in both TZ and TZS powders, the intensity of the ZnO diffraction peaks in the TZS samples was decreased due to (i) insufficient oxygen atoms during the synthesis process of the powders; (ii) overlapping or low intensity of the ZnO diffraction peaks.
The NMs crystallize in the cubic structure, space group F m 3 ¯ m . Their most intense diffraction peaks, corresponding to the plane (111), are located between 38° and 46° (Figure 3). The intensities of the recorded diffraction peaks are close to the background level, due to their low quantities in the samples (0.2–0.6 at%, according to the EDX results). The identified phases correspond to the Pt (ICDD #01-085-5682), Pd (ICDD #01-087-0639), and Au (ICDD #03-065-2870). The crystallite sizes of the Pt and Pd nanoparticles could not be accurately calculated, because of the low intensity of the diffraction peaks and large uncertainty in the half-maximum and full-width peak intensity values. Unlike ZnO, the NM nanoparticles do not create any complex compounds with other phases. An exception is the Ag element. The intense peaks of the AgCl phase (ICDD #04-012-6380) were observed in the XRD pattern in both TZ and TZS samples. That phase was probably created during the chemical reduction process. The presence of AgCl is additionally confirmed by XPS measurements and TEM observations. Previous studies have shown that Ag/AgCl/TiO2 systems exhibit enhanced photocatalytic activity compared to pure Ag/TiO2 systems [19].
In conclusion, the results reveal the specific phases of TiO2, ZnO, and SnO2 as well as those of the NM nanoparticles, with the anatase phase being predominant in the case of binary compounds and minor in the case of ternary compounds and the size of the TiO2 nanocrystals being in the range of (19.5–31.6) nm.

3.3. TEM Analysis

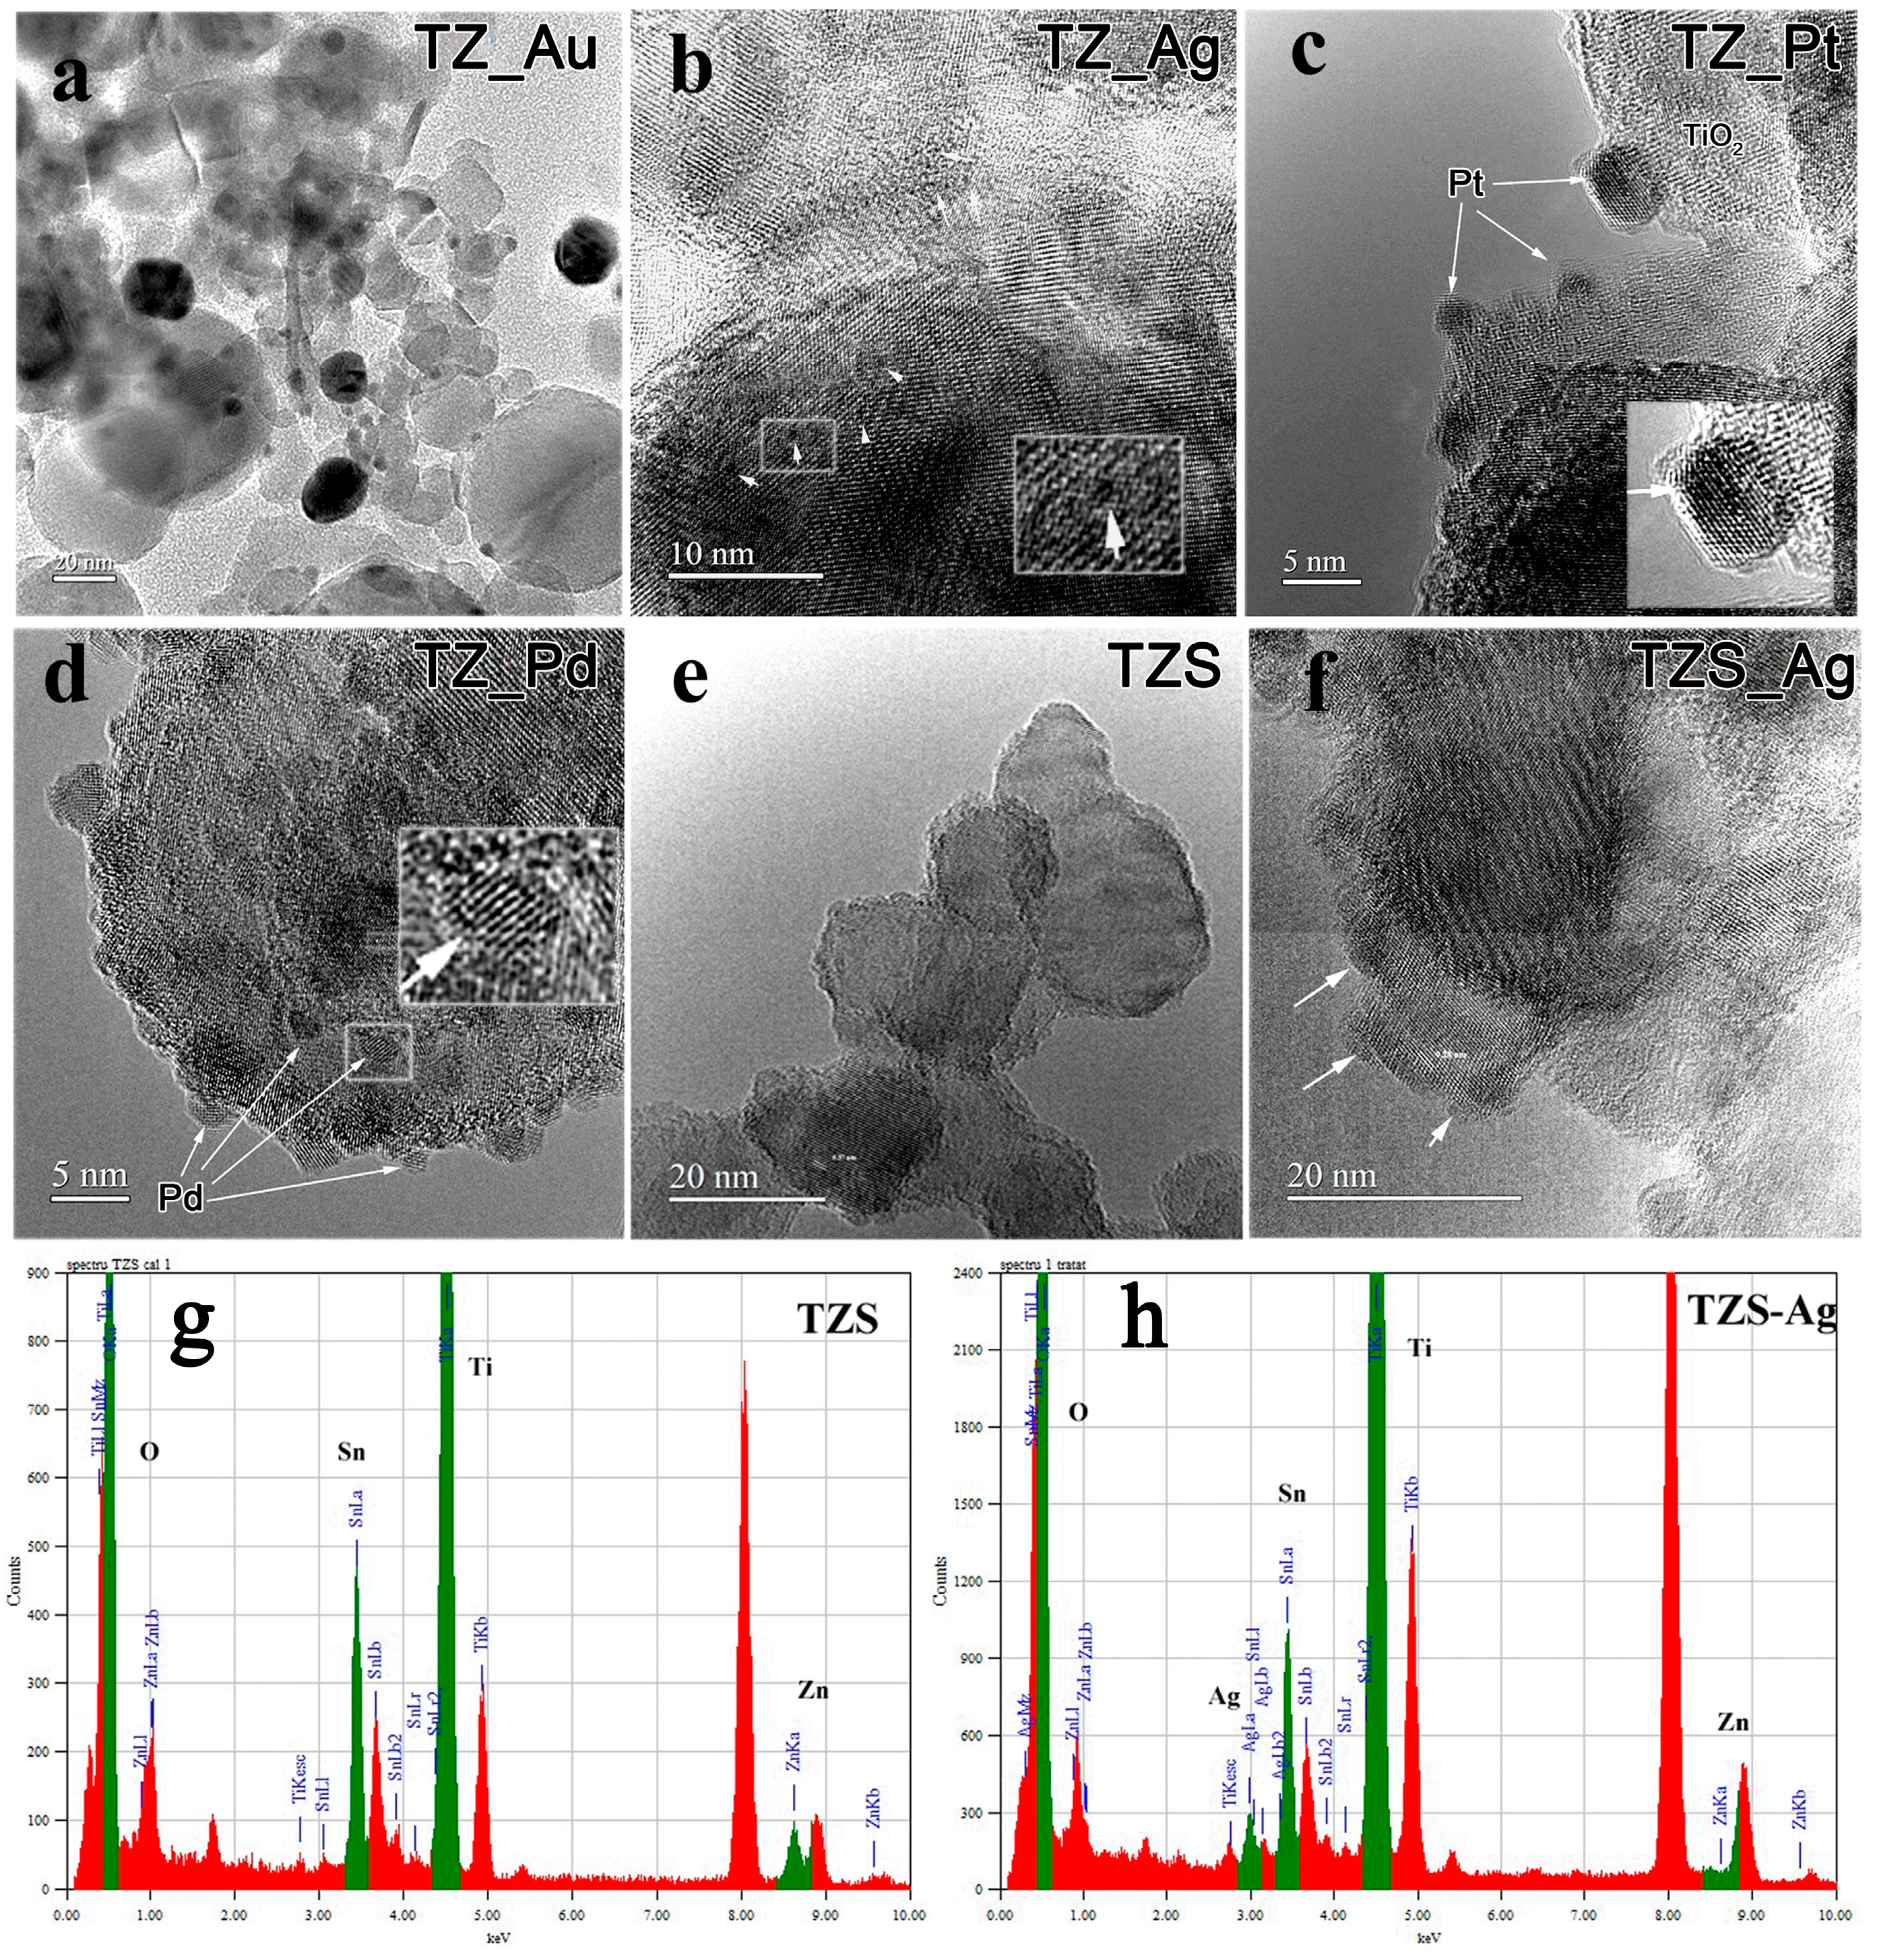
The high-resolution TEM images (HRTEM) presented in Figure 4 were used to investigate the size and morphology of binary (Figure 4a,d) and ternary nanoparticles (Figure 4e,f), and the corresponding EDS spectra are shown in Figure 4g and h, respectively. Anatase TiO2 particles with diameters in the range of 20–40 nm loaded with small noble metal nanoparticles were observed. In the HRTEM images (Figure 4a), Au nanoparticles with dimensions ranging from 5 to 30 nm or even slightly larger can be observed, with the particles being non-uniformly distributed on the TiO2 surface. In contrast, Ag appears to be dispersed atomically or in clusters of a few atoms, while the samples seem to be slightly non-uniform. The EDX results show more Ag in areas with more zinc, and its presence on the surface of anatase TiO2 crystallites, oriented in the zone axis, produces local defects in the high-resolution image (indicated by arrows in Figure 4b,f). In the case of loading TiO2 spheres with Pt and Pd nanoparticles, small crystallites were observed with dimensions ranging from 2–6 nm and 3–5 nm, respectively (see Figure 4c,d). They are heterogeneously distributed among the TiO2-based nanoparticles.
Basically, the morphology of TZ and TZS nanoparticles is relatively similar, with anatase crystallites observed to have dimensions between 20 and 40 nm and coated in an amorphous shell with a thickness of 1–3 nm (Figure 4e). In the TZS_Ag sample, no silver metallic particles were observed. Silver is dispersed atomically or in small clusters, similar to the tin-free sample (TZ_Ag), but it is visible in the EDX spectrum (Figure 4h). On the surface of the TiO2 nanoparticles, some amorphous bubbles of a few nanometers in size could be observed which contained Ag, most likely in the form of AgCl.

3.4. BET Analysis

The variation of specific surfaces was determined through nitrogen adsorption/desorption measurements using the BET technique, and the obtained values for the TZ, TZ_Au, TZ_Ag, TZ_Pt, TZ_Pd, TZS, and TZS_Ag samples are 33.11 m2g−1, 39.46 m2g−1, 40.41 m2g−1, 29.03 m2g−1, 39.13 m2g−1, 43.39 m2g−1, and 35.64 m2g−1, respectively. First, an increase in the specific surface area of nanoparticles was noted through the addition of Sn to the TZ sample, increasing from 33.11 m2g−1 to 43.39 m2g−1 (TZS sample). Secondly, it was observed that the specific surface area of samples loaded with NMs was modified compared to undecorated samples, with slight increases and decreases in their values being noted. These changes are in slight correlation with the photodegradation rate values only in UV, where they can act as electron receptors that reduce the recombination rate of electron–hole pairs. Noble metal nanoparticles, being very small and highly dispersed (Figure 4), can lead to greater coverage and a reduction in specific surface area compared to support nanoparticles (TZ and TZS samples), but they can essentially contribute during the photodegradation process in visible light by providing electrons to the conduction band and causing the generation of superoxide anion radicals [30,31].

3.5. XPS Analysis

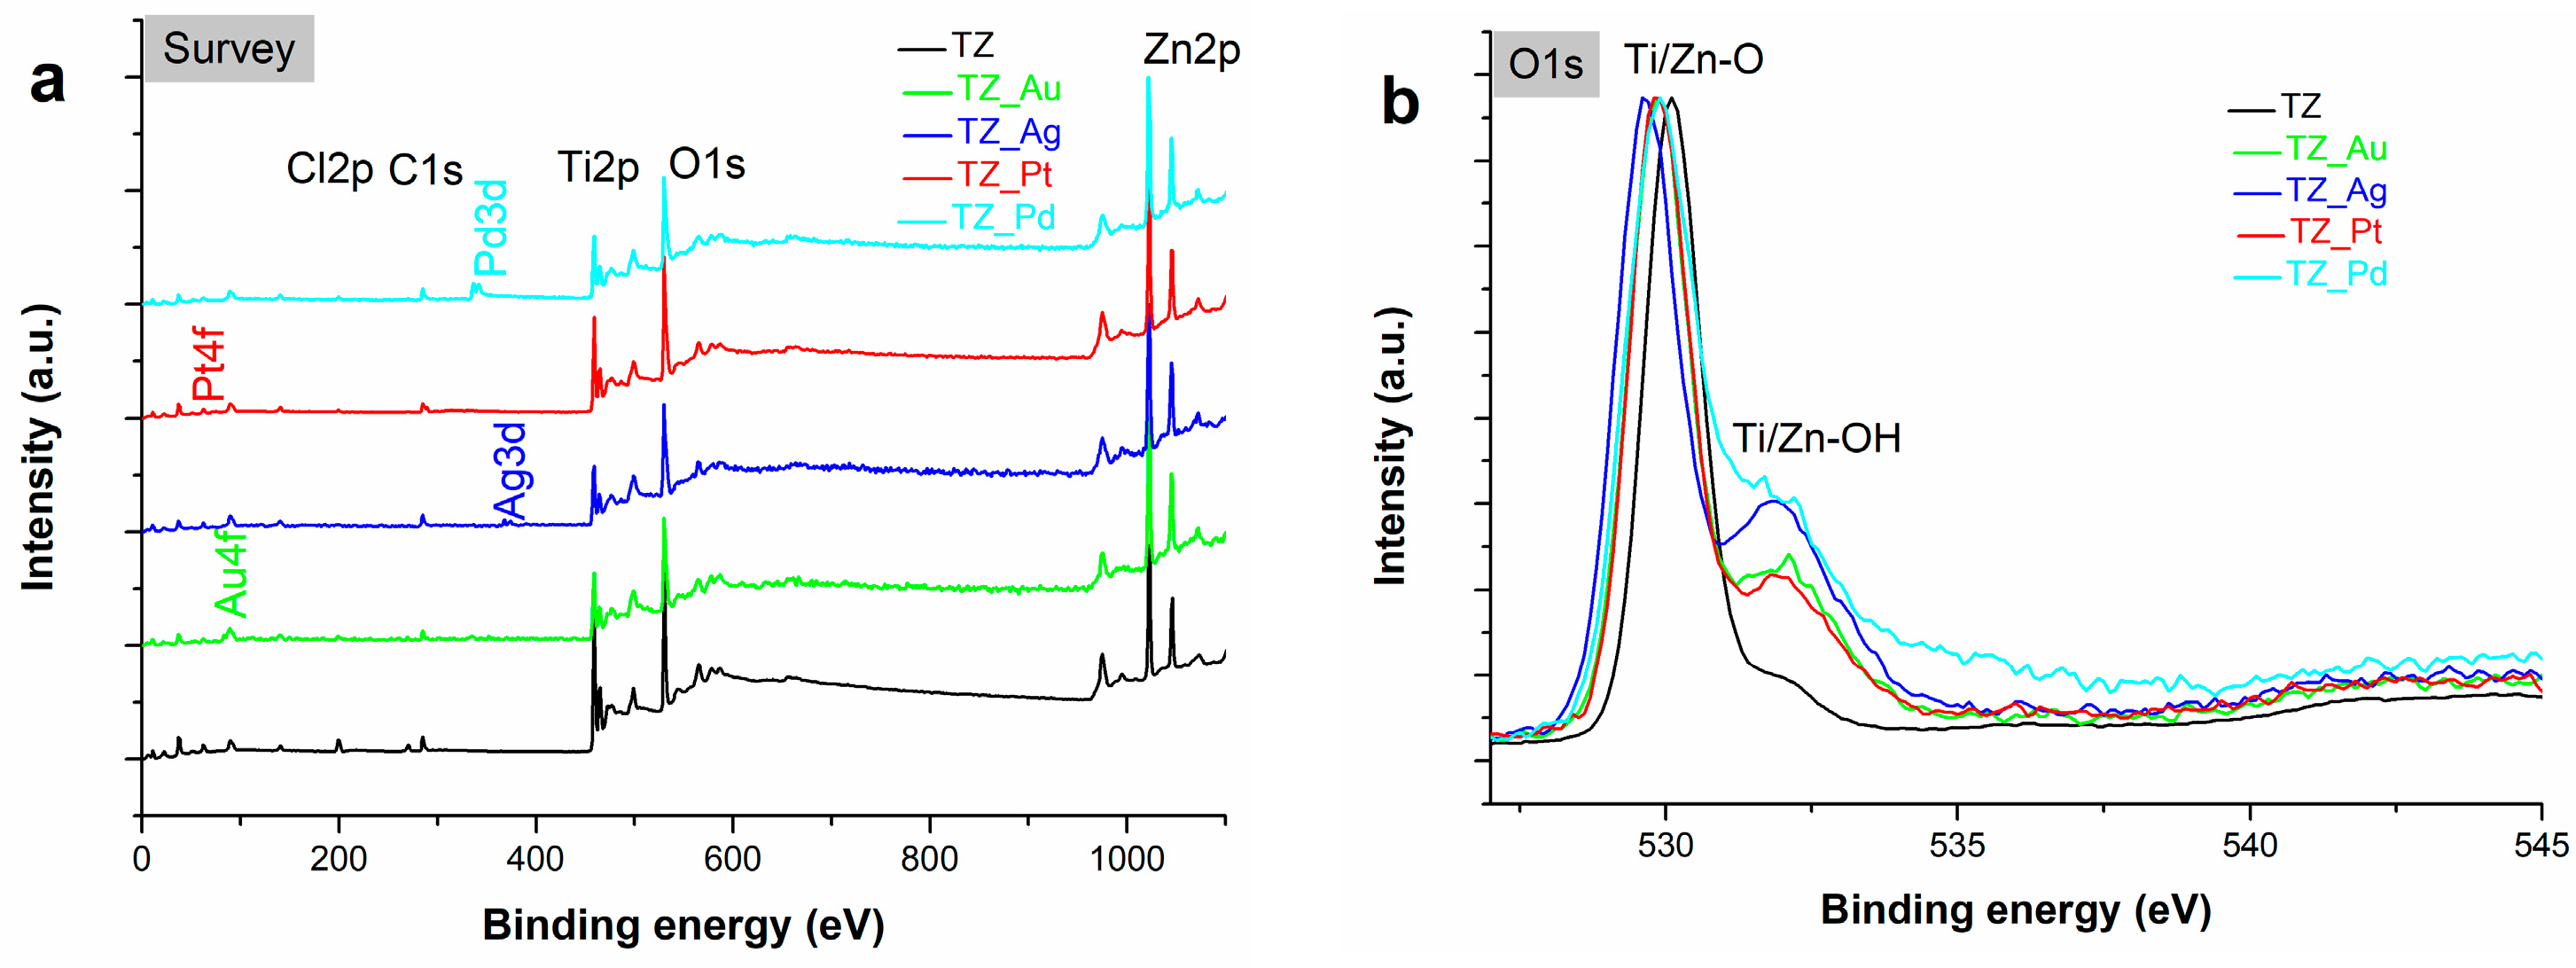
XPS is a surface-sensitive analytical technique used to study the elemental composition, chemical state, and electronic structure of materials. To further explore the impact of noble metal decoration and to acquire detailed insights into the chemical states of ions, XPS spectra were obtained, as illustrated in Figure 5. The binding energy was calibrated using the C 1s peak at 284.8 eV as a reference point.
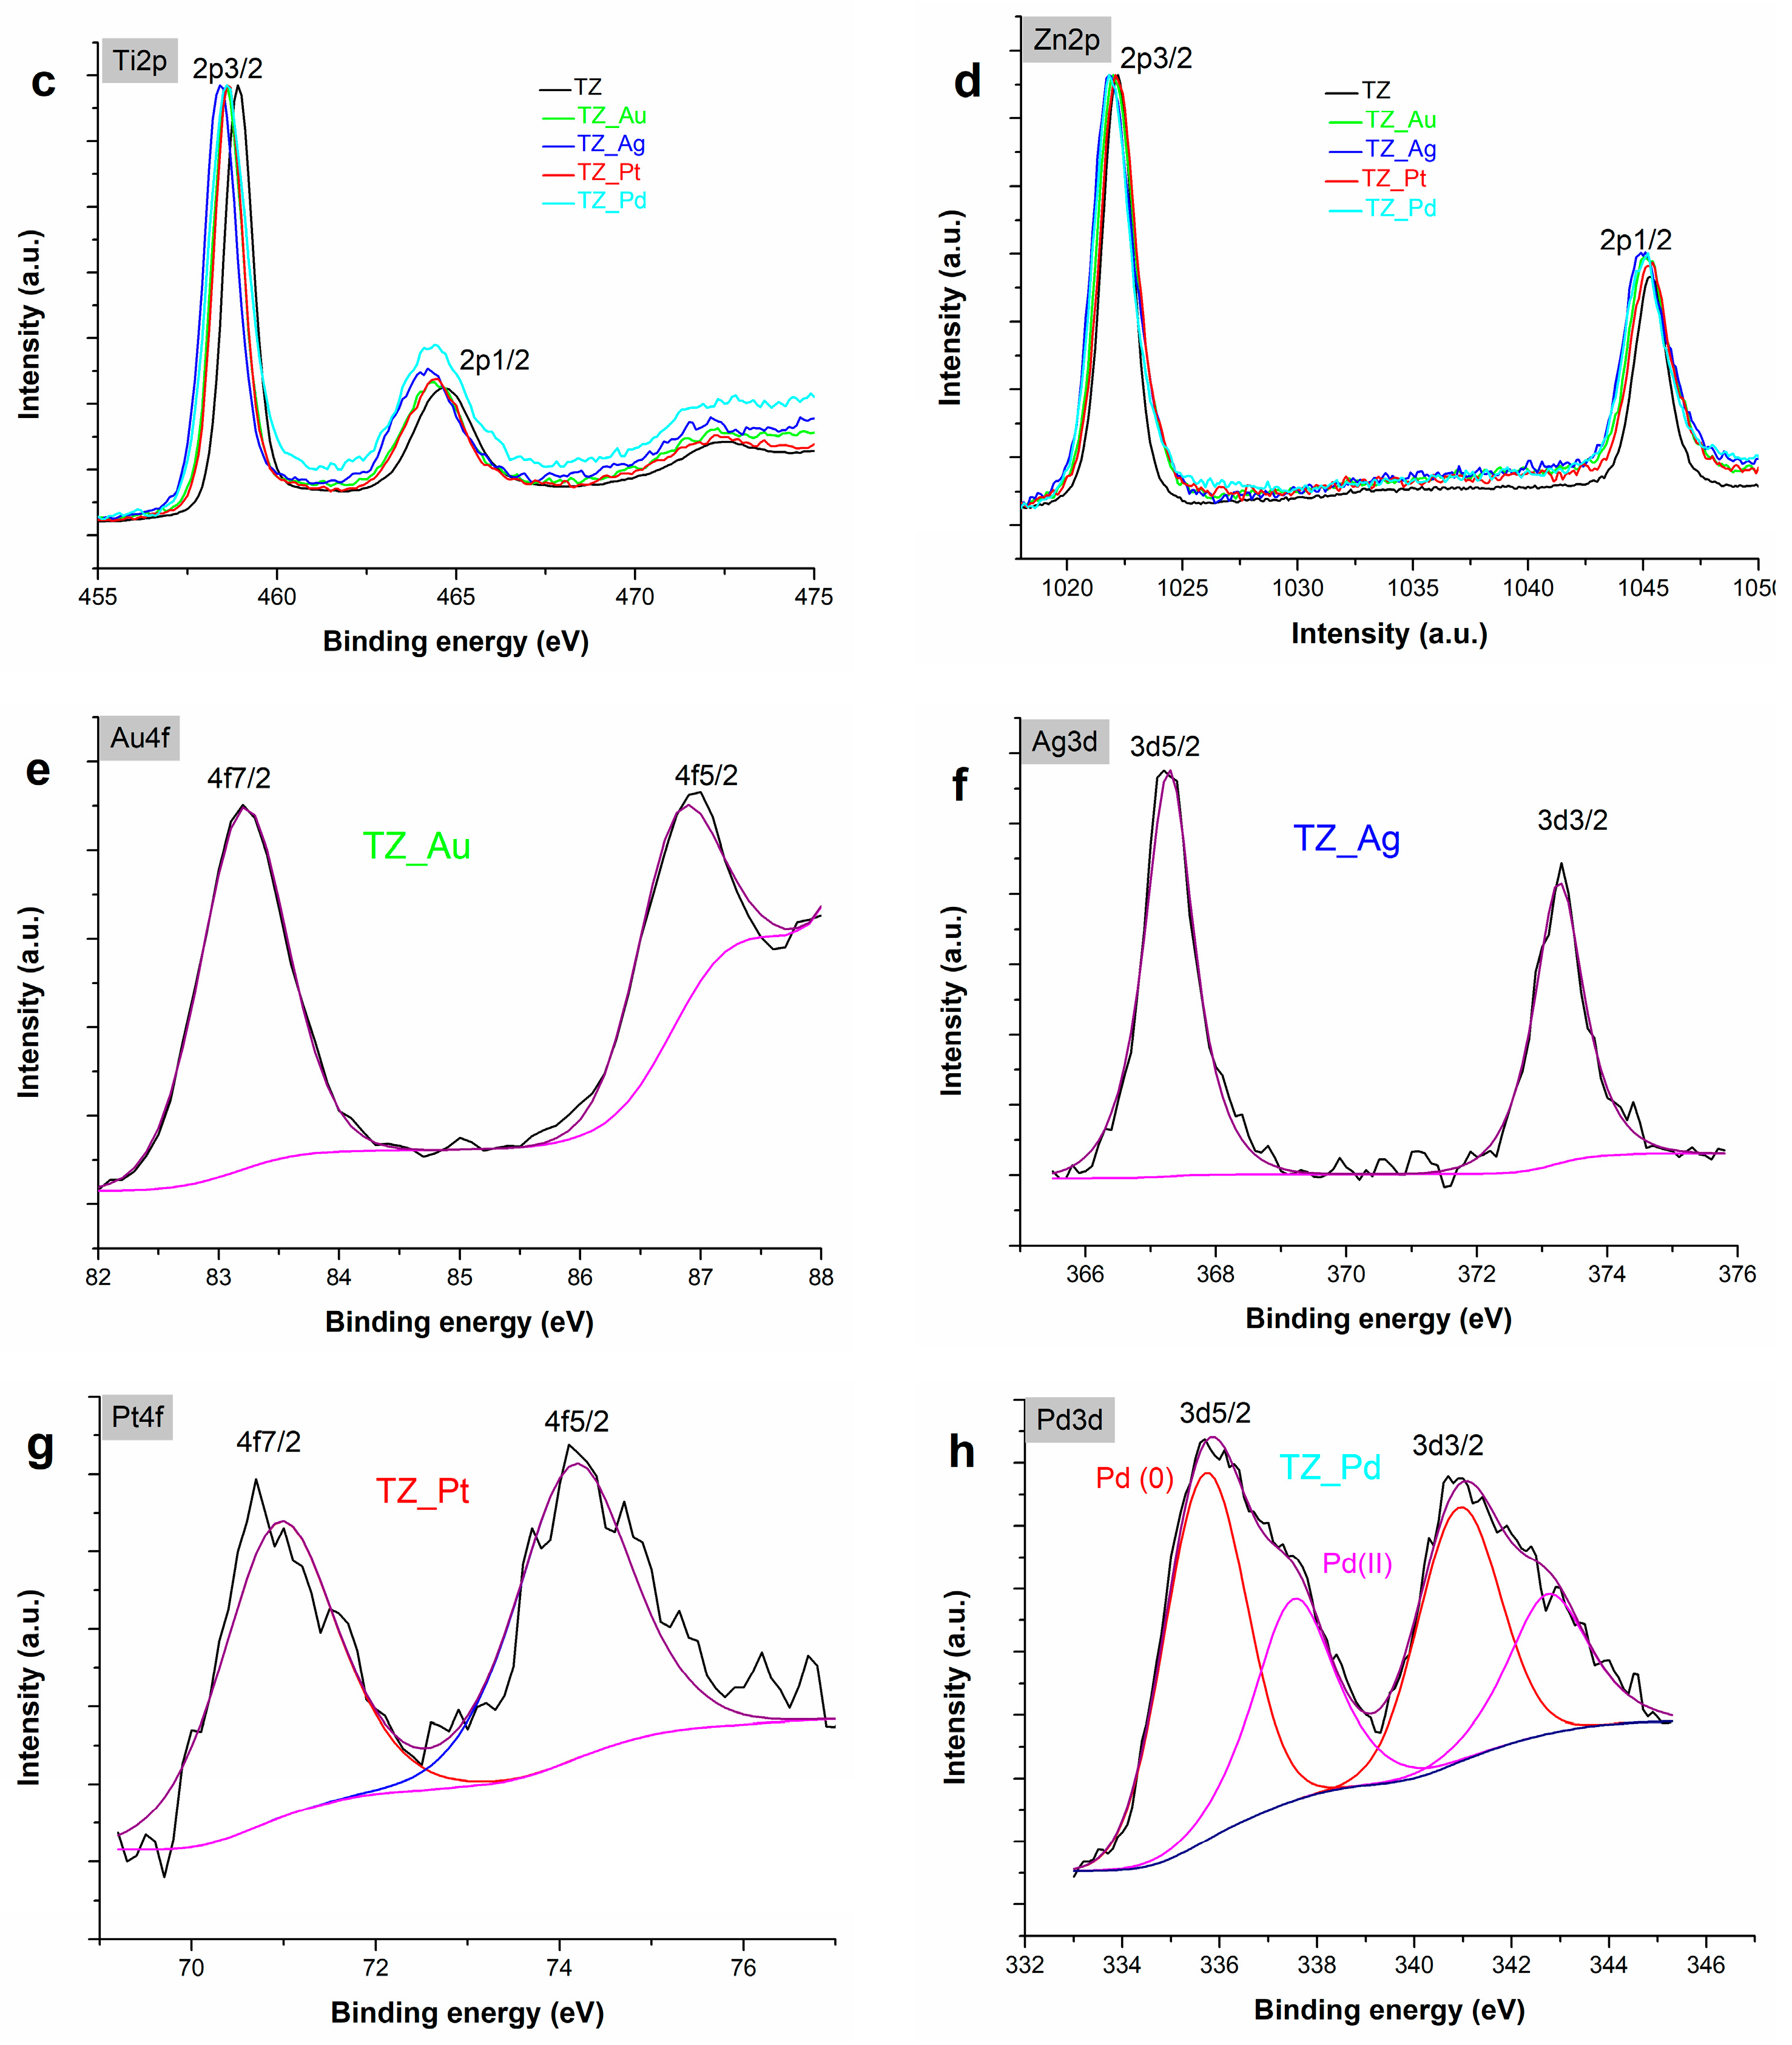
Figure 5a displays the general survey spectra of the material before and after decoration, revealing the presence of Ti, Zn, O, C, Au, Ag, Pt, and Pd on the surfaces. The photoelectron peak corresponding to C 1s suggests the existence of a minor amount of carbon, which might be attributed to potential contamination from specimen handling or the pumping oil used in the XPS instrument itself. Figure 5b–h display characteristic high-resolution scans of O1s, Ti2p, Zn2p, Au 4f, Ag3d, Pt4f, and Pd3d, each in its own right. The O 1s spectrum scan is depicted in Figure 5b. The asymmetrical peak in the TZ sample reveals two distinct regions with maxima at 530.3 eV and 531.7 eV, which can be associated with the creation of Ti/Zn-O and Ti/Zn-OH (TiO0.73) bonds, respectively [32]. The OH bond can be linked to the presence of loosely bound oxygen on the surface, which includes adsorbed oxygen and OH groups. Following the decoration of the nanoparticle with noble NMs, a noticeable shift of the peaks towards lower binding energy (BE) values was observed (Figure S1a). Furthermore, it is evident that the intensity of the shoulder peak at a higher BE increased significantly after decoration, suggesting an increase in OH groups. The formation of the Ti/Zn-O bond was attributed to the presence of O2 ions within the TiO2 and/or ZnO lattice. The Ti 2p spectrum (see Figure 5c) displays the spin–orbit doublet Ti2p3/2 and Ti2p1/2 at 458.9 eV and 464.6 eV in the TZ sample [33], revealing that titanium atoms exist as Ti4+ in the lattice of TiO2+. No significant variation was observed between the Ti 2p line shape of the TZ sample and the TZ@NMs samples, indicating that the NMs had been deposited on the TiO2-SnO surface rather than incorporated into the TiO2 or SnO lattice. However, the previously mentioned samples loaded with NMs exhibited shifts in BE and subtle changes in FWHM for Ti2p3/2 (Figure S1b,c). Consequently, when compared to the TZ sample (458.9), the samples displayed smaller BE shifts as follows: 0.3 eV (for the TZ_Au, TZ_Pt, and TZ_Pd samples) and 0.5 eV (for the TZ_Ag sample). Regarding FWHM, the values were 0.98 eV (for the TZ sample), 1 eV (for the 0.13 at% Pt-TZ_Pt sample), 1.04 eV (for the 0.57 at% Au-TZ_Au sample), 1.14 eV (for the 0.69 at% Ag-sample TZ_Ag), and 1.33 eV (for the 2.08 at% Pd sample TZ_Pd). The migration of the Ti2p3/2 peak toward lower binding energy indicates the transition of titanium from the Ti4+ state to Ti3+, likely due to the presence of the noble metal species bound to titanium and an increased concentration of oxygen vacancies (the formation and increasing concentration of oxygen vacancies on the surface of the powder due to the presence of the NMs) [34].
In the Zn region, as depicted in Figure 5d, the binding energies of the Zn2p3/2 and Zn2p1/2 peaks for the TZ sample were centered at 1022.2 eV and 1045.3 eV, indicating the presence of Zn2+ atoms (Zn-O) in the ZnO lattice [32]. The separation between these peaks is approximately 23.1 eV, which closely matches the well-known value of spin–orbit splitting for Zn2p in ZnO. Following the decoration process, shifts towards lower BEs were observed for the Zn2p3/2 peaks (Figure S1d), with changes of 0.1 eV (TZ_Pt), 0.2 eV (TZ_Au), and 0.4 eV (TZ_Ag and TZ_Pd). This shift of Zn2p3/2 BE can be attributed to a loss of oxygen in ZnO [35]. Additionally, the FWHM values were 1.65 eV for the TZ sample (Figure S1e), 1.91 eV for the TZ_Pt and TZ_Pd samples (group VIII-B elements), and 2.1 eV for the TZ_Au and TZ_Ag samples (group I-B elements). The metals Au and Pt were found in their elemental form. Distinctive peaks corresponding to gold were observed at 83.2 eV (4f7/2) and 87 eV (4f5/2) [36] (see Figure 5e), while silver exhibited characteristic peaks at 367.7 eV (3d5/2) and 373.3 eV (3d3/2), which could be assigned to AgCl [37] (see Figure 5f). Platinum exhibited distinguishable peaks at 70.7 eV (4f7/2) and 74.1 eV (4f5/2) [38], as depicted in Figure 5g. It is worth noting that, as per the literature, Pt2+ peaks are typically situated at slightly higher binding energies (approximately 72 and 75 eV [39]). The Pd 3d spectrum of the TZ_Pd sample from Figure 5h displays two Pd 3d5/2 peaks at 335.8 eV and 337.6 (∆E = 1.9 eV), characteristic of metallic Pd and PdO [40,41].

3.6. UV-Vis-DRS Analysis

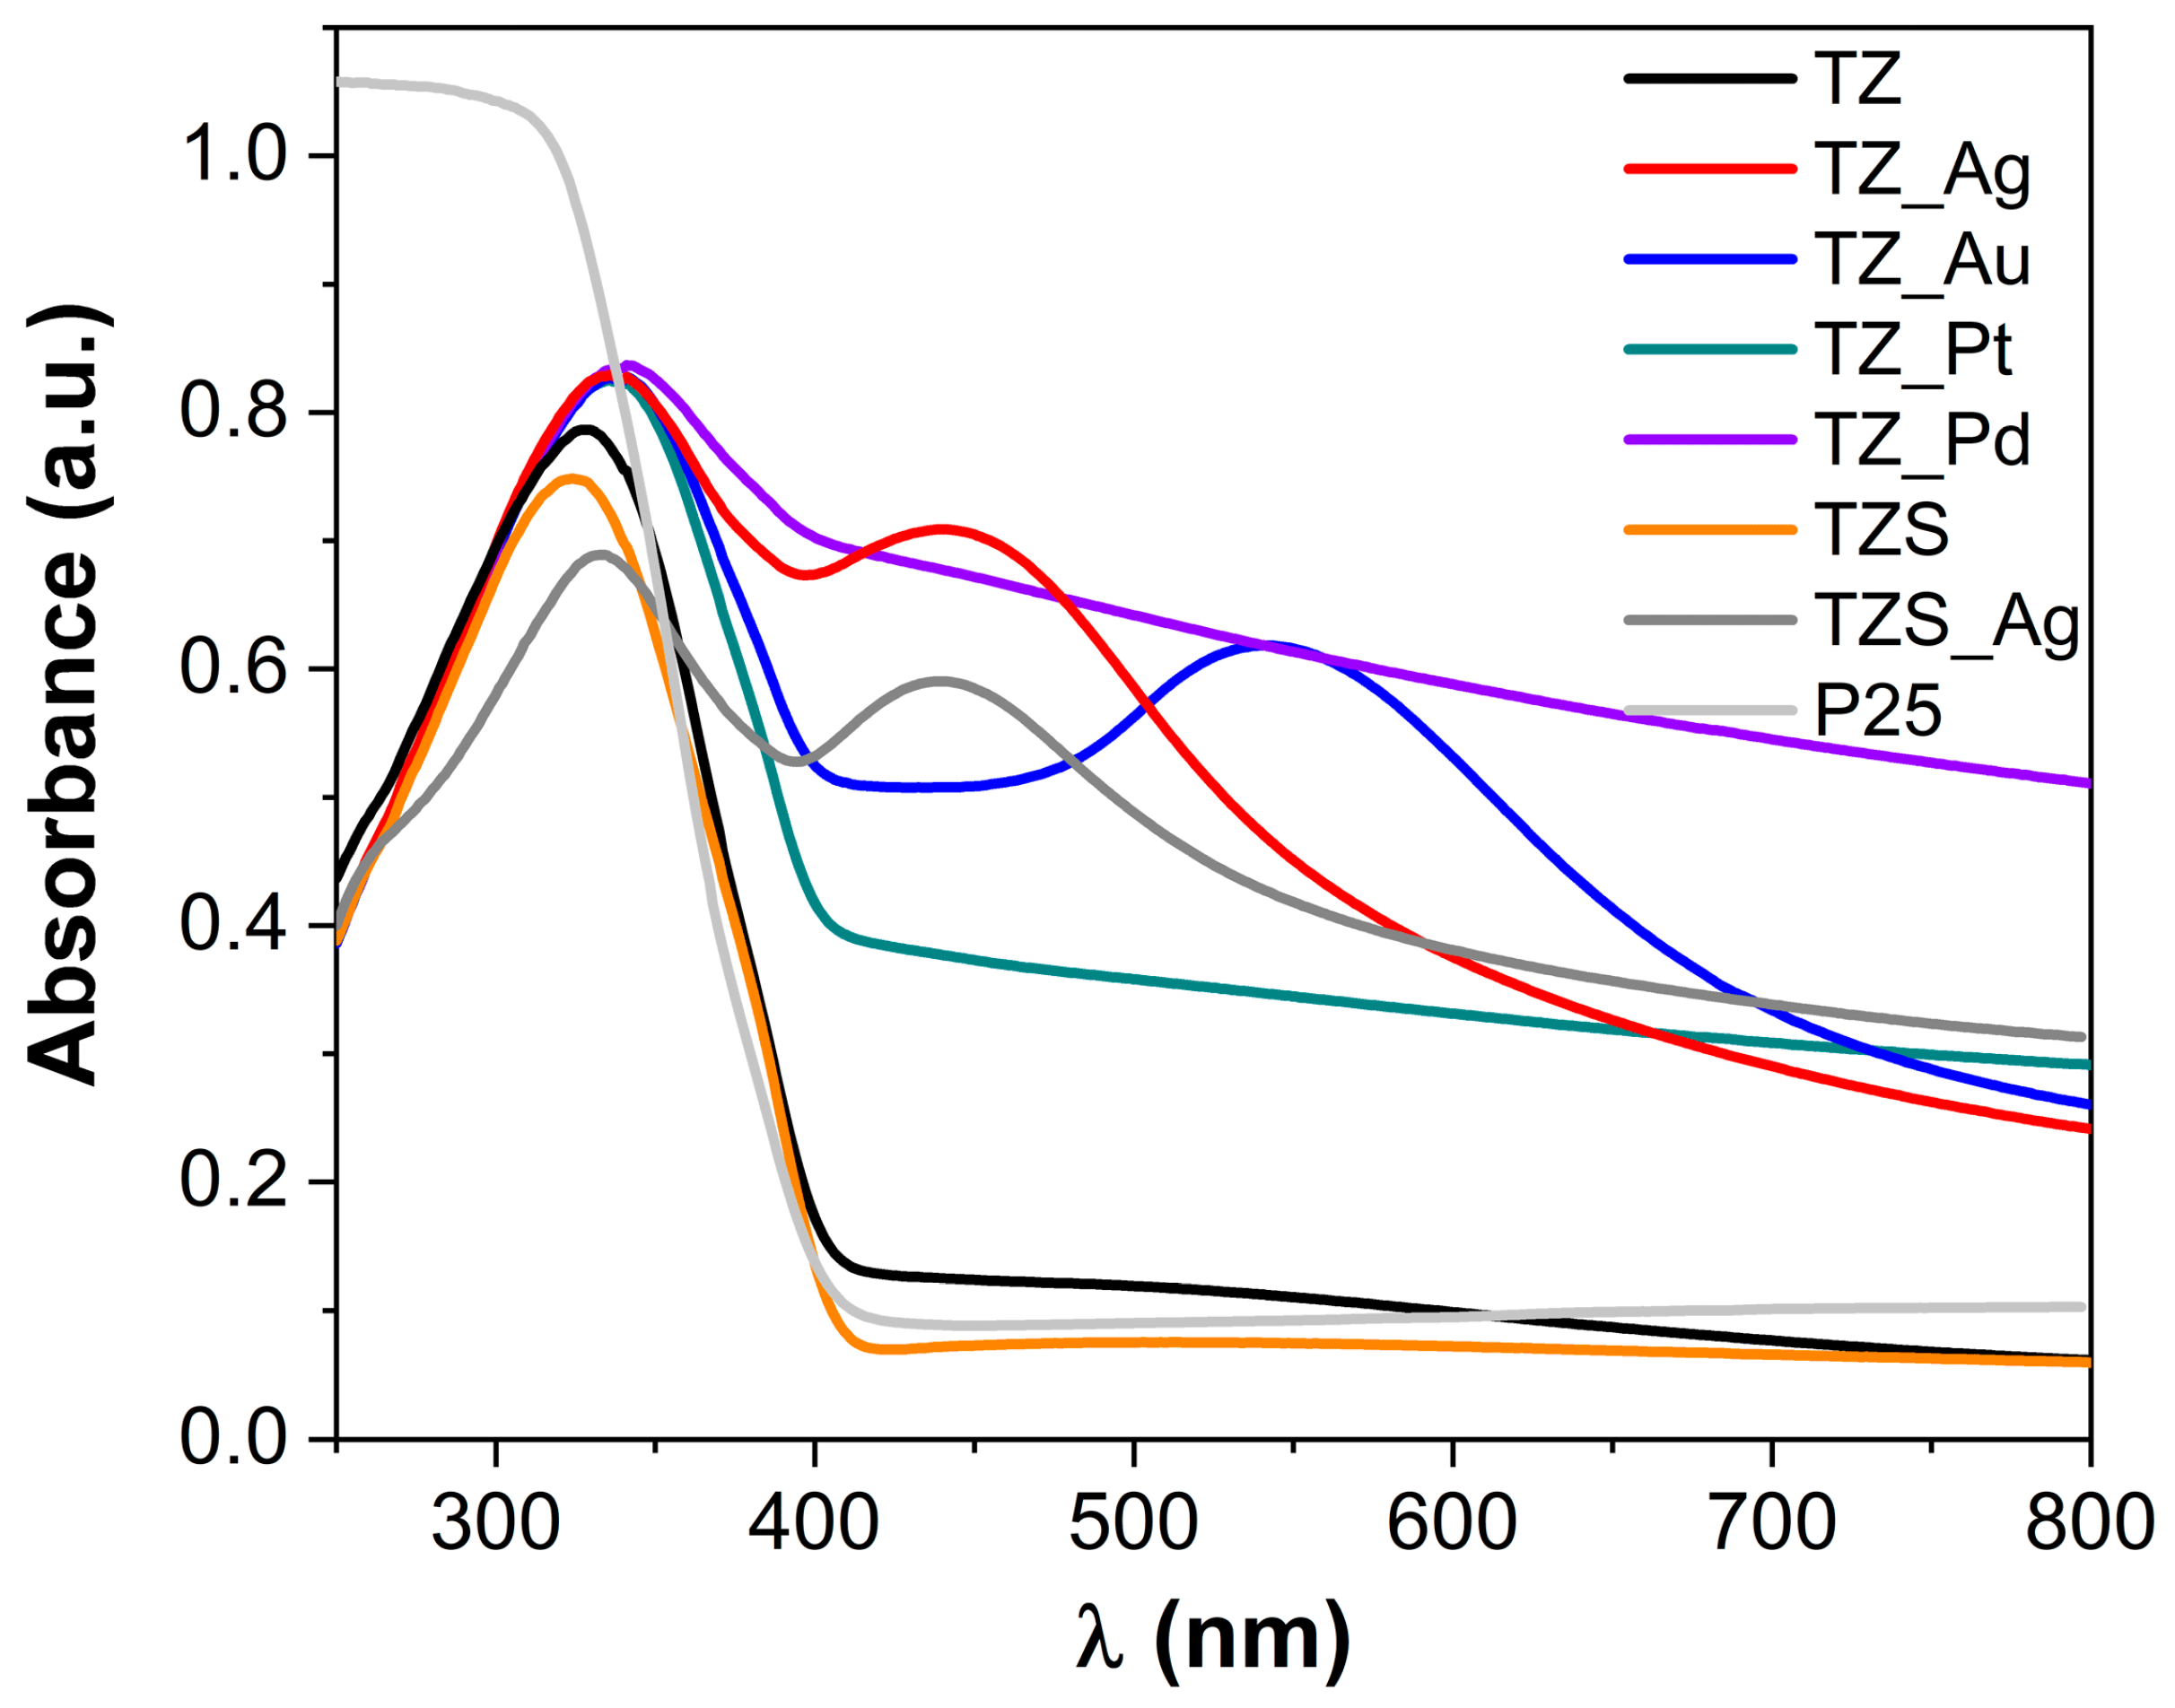
The synthesized nanocomposites’ optical properties were compared with the commercial Degussa P25 sample by using UV–Vis DRS (Figure 6). The recorded spectra of TZ_M (Au, Ag, Pt, Pd) and TZS_Ag samples show significant improved absorption in the visible range (450–600 nm) (Figure 6), which is a consequence of the surface plasmon resonance effect induced by metal nanoparticles from the composite matrix [11,42,43].
Therefore, lower energy transitions are feasible in the presence of metal nanoparticles on the support matrix. The band gap Eg values were determined from reflectance [F(R)] spectra and by applying the Kubelka–Munk (K-M) formalism and the Tauc plot (Figure S2) [25,44]. Thus, the investigation reveals that Eg varies in this order: EgP25 > EgTZ ~ EgTZS > EgTZ_Pd > EgTZS_Ag > EgTZ_Pt > EgTZ_Au > EgTZ_Ag (Table 1). In comparison with the bare semiconductors (2.84 eV, 2.85 eV, and 3.2 eV for TZS, TZ, and Degussa P25, respectively), the deposition of noble metal nanoparticles (Au, Ag, Pt, or Pd) on the surface of TZ nanoparticles led to a decrease in the band gap energy values. The nanocomposite samples’ band gap reduction could be the effect of the specific mixture of phases (anatase and rutile) combined with the presence of metal nanoparticles. Usually, the effect of a decreased band gap leads to improvement in the photocatalytic activity [7,8].

3.7. Photocatalytic Properties

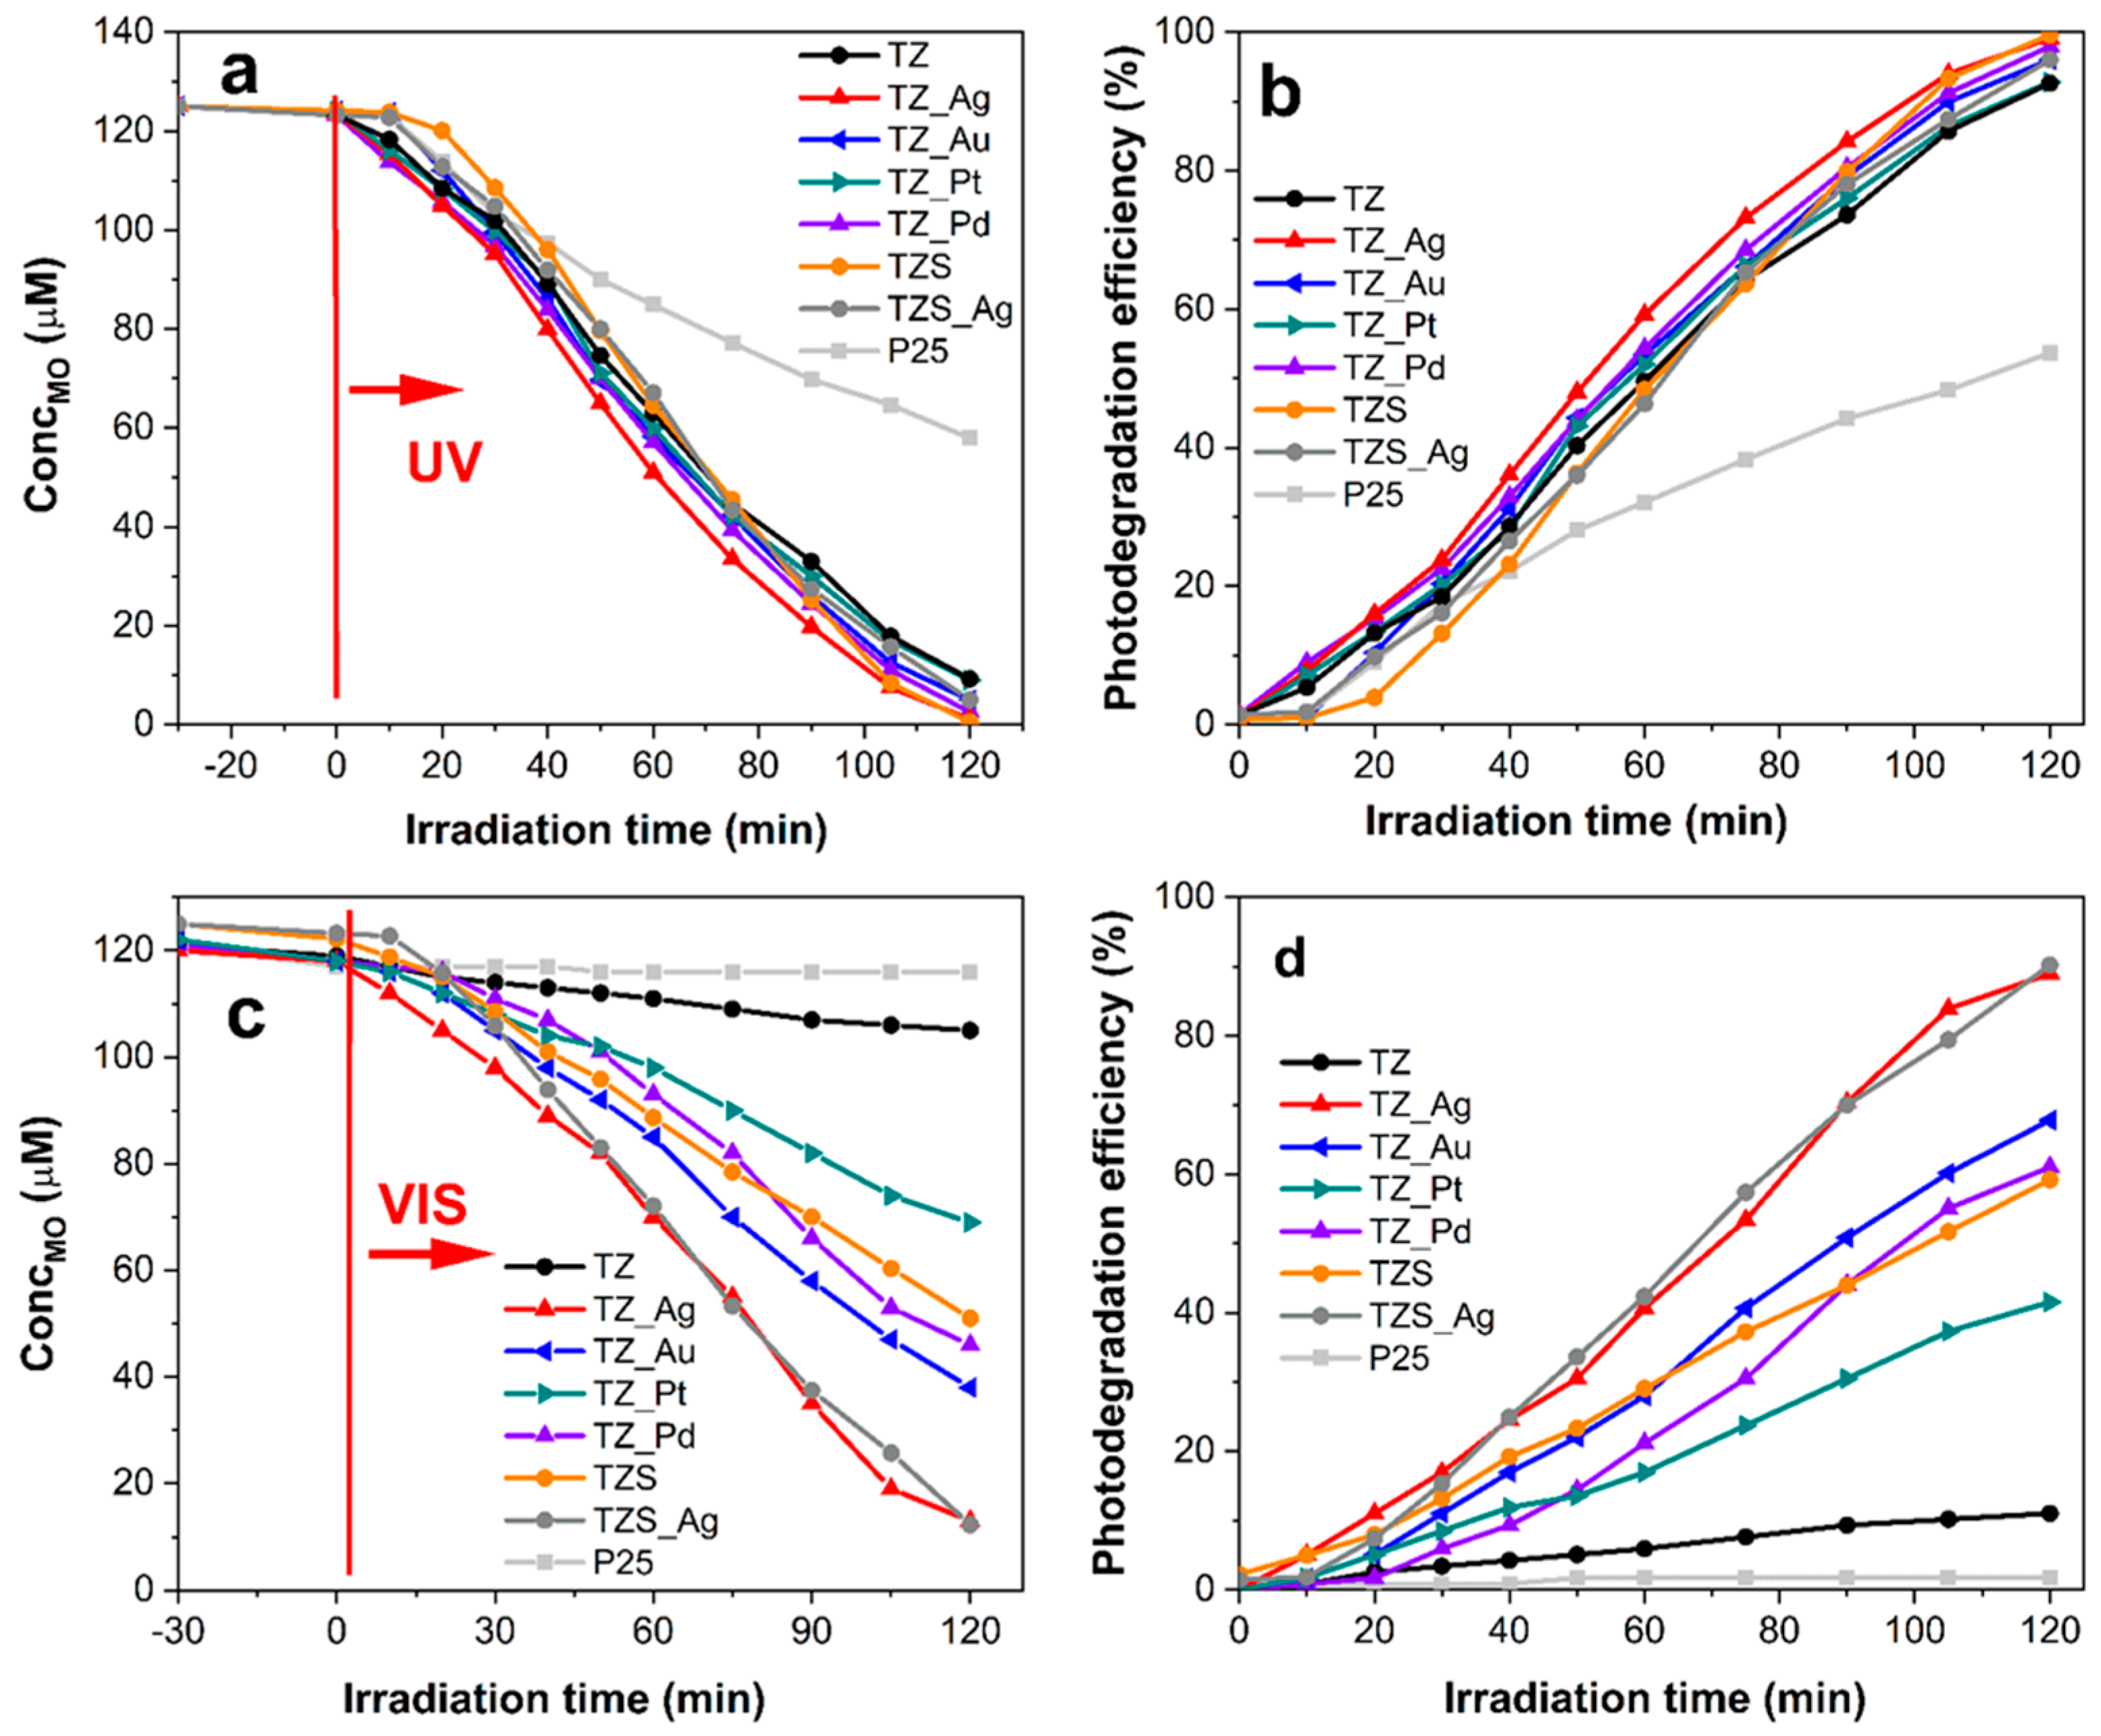
The results regarding the photocatalytic properties of all samples in the degradation of the MO pollutant are presented in Figure 7a–d. Compared with the commercial Degussa P25, which is not active in Vis light, all synthesized nanocomposite samples show enhanced ultraviolet and visible photoactivity for the photodegradation of MO, an azobenzene derivative used as a standard dye [1,2,3,4,5,24,42,43] which is soluble in water (Figure 7c). The variation of the recorded maximum of the MO absorption spectra, for both UV and Vis irradiation, in time, in the presence of P25, TZ, TZ_M (M = Au, Ag, Pt, Pd), TZS, and TZS_Ag samples, was recorded (Figure 7a,c). Thus, under UV irradiation, all samples achieved the maximum adsorption after a few minutes. It is well known that the adsorption efficiency on the photocatalyst nanocomposite matrix can be influenced by both the synthesis method and the experimental conditions (stirring, time, temperature, concentration, etc.) [24,42,43,45].
The developed nanocomposites’ photocatalyst activity (TZ, TZ_M (M = Au, Ag, Pt, Pd), TZS, and TZS_Ag) for the MO photodegradation process is evidenced (Figure 7a,c). Under UV irradiation, the photocatalysts’ activities are comparable, and the MO photodegradation achieved is above 90% for all developed photocatalysts after 120 min. Distinctly, the Degussa P25 is the exception. Also, the Au, Ag, Pt, and Pd nanoparticles reduce the recombination of charge carriers which increase the formation of free radicals, developing the photooxidation performances [11,12,43]. The obtained values of the rate constant are presented in Table 1. It is important to mention that, when comparing the rate constant of TZS, TZS_Ag, and TZ_Ag under UV irradiation, approximately the same value was obtained. This means that, for measurements under UV irradiation, the TZS photocatalyst is economically recommended.
Completely different behavior for the MO photodegradation process on TZ, TZ_M (M = Au, Ag, Pt, Pd), TZS, and TZS_Ag was recorded under Vis irradiation (Figure 7c). The recorded spectra for 120 min present points which are more scattered in comparison with those acquired under UV radiation. Accordingly, the dependence of the developed nanocomposite samples on MO photodegradation efficiency and on irradiation time succeeds the identical tendency (Figure 7b,d). The obtained values of the rate constants for the synthesized photocatalysts are considerably higher in comparison to Degussa P25 (Table 1). Therefore, the metal nanoparticle type loaded on the surface of the nanoparticle (TZ) considerably influences photocatalytic activity. Accordingly, the Ag nanoparticles’ presence significantly reduced the MO concentration, followed by Au, Pd, and Pt. Interestingly, similar behavior was obtained when metal nanoparticles were used to decorate commercial TiO2 or TiO2 obtained by laser pyrolysis [43]. All TZ nanoparticles loaded with noble metal nanoparticles presented higher performances (i.e., higher photocatalytic activity, removal rate, and efficiency) for MO photocatalytic oxidation under both UV and Vis irradiation compared with unmodified commercial P25 or TZ (Table 1). It is noteworthy that the MO degradation rate under UV irradiation on the TZ_Ag photocatalyst is ˃6 times higher than that obtained on P25, and ˃3 times higher than that obtained on TZ. Under Vis irradiation, on TZ_Ag, more significant differences in the MO degradation rate constant value were evidenced: it was ˃500 times higher than that obtained on P25, ˃18 times higher than that obtained on TZ, and <1.24 times lower than that obtained on TZS_Ag. It is important to mention that, under Vis light, TZS_Ag presents the higher rate constant.
A possible explanation for the nanocomposite materials’ photocatalytic performances under Vis light irradiation could be the surface plasmon resonance (SPR) effect of metal nanoparticles (Au, Ag, Pt, or Pd) located on the TZ or TZS surface. Thus, under Vis irradiation, from the metal NPs’ surface, the electron is transferred to the conduction band of the supporting matrix. The found series for MO photodegradation performances under visible light for the TZ or TZS-based synthesized nanocomposite photocatalysts was TZS_Ag ˃ TZ_Ag ˃ TZ_Au ˃ TZ_Pd ˃ TZ_Pt ˃ TZS ˃ TZ. This behavior could be the result of the synergistic effects between the morphostructural parameters of the TZ/TZS nanoparticles (Table 1) and the metal nanoparticles’ properties. Therefore, interactions rely on the size and shape of the metal nanoparticles, and on the nature and composition of the nanoparticles’ support [43,45], and a high exciton lifetime can appear [46]. This means that the NMs’ presence leads to the creation of extremely reactive superoxide and hydroxyl radicals, which, in turn, lead to the improvement of the photocatalyst performances. An explanation for the extended exciton lifetime in semiconductor surfaces decorated with M (Ag, Au, Pd, and Pt) could be the proximity of the Fermi level to that of the conduction band of the support material, which consequently permits the fast transmission of electrons between the metal nanoparticle (Ag, Au, Pd, and Pt) and the TZ/TZS nanoparticles. Moreover, the extended exciton lifetime in NM-decorated semiconductors decreased in the recombination of charge carriers [47].
There have been many works on ZnO-TiO2 nanocomposite materials where the researchers tried to develop new photocatalyst materials or to use these materials in other applications [48]. A comparison between the morphostructural properties and the photocatalytic performances induced by the presence of metal nanoparticles (Ag, Au, Pt, or Pd) on TZ surface nanoparticles, obtained by laser pyrolysis, was not made elsewhere.
Interestingly, the higher value of rate constant for the Ag-modified TZ or TZS matrix is in accordance with other already published work [43]. Other works involved nanocomposite-based metal nanoparticles, but an effective comparison was not possible due to the differences in the support material matrix, studied pollutant, experimental parameters (pollutant concentration, photocatalyst concentration, photoreactor arrangements, wavelength, and intensity of used radiation), and surface exposure degree of the photocatalyst (suspension or films) [49]. Even so, the improved photocatalytic properties in the metal nanoparticles’ presence was obvious. Moreover, the synthesis procedure and the morphostructural properties of the nanocomposite material (porosity, specific surface area, size nanoparticles, distribution of nanoparticles, crystalline phases, concentration of nanoparticles) together led to the final behavior.
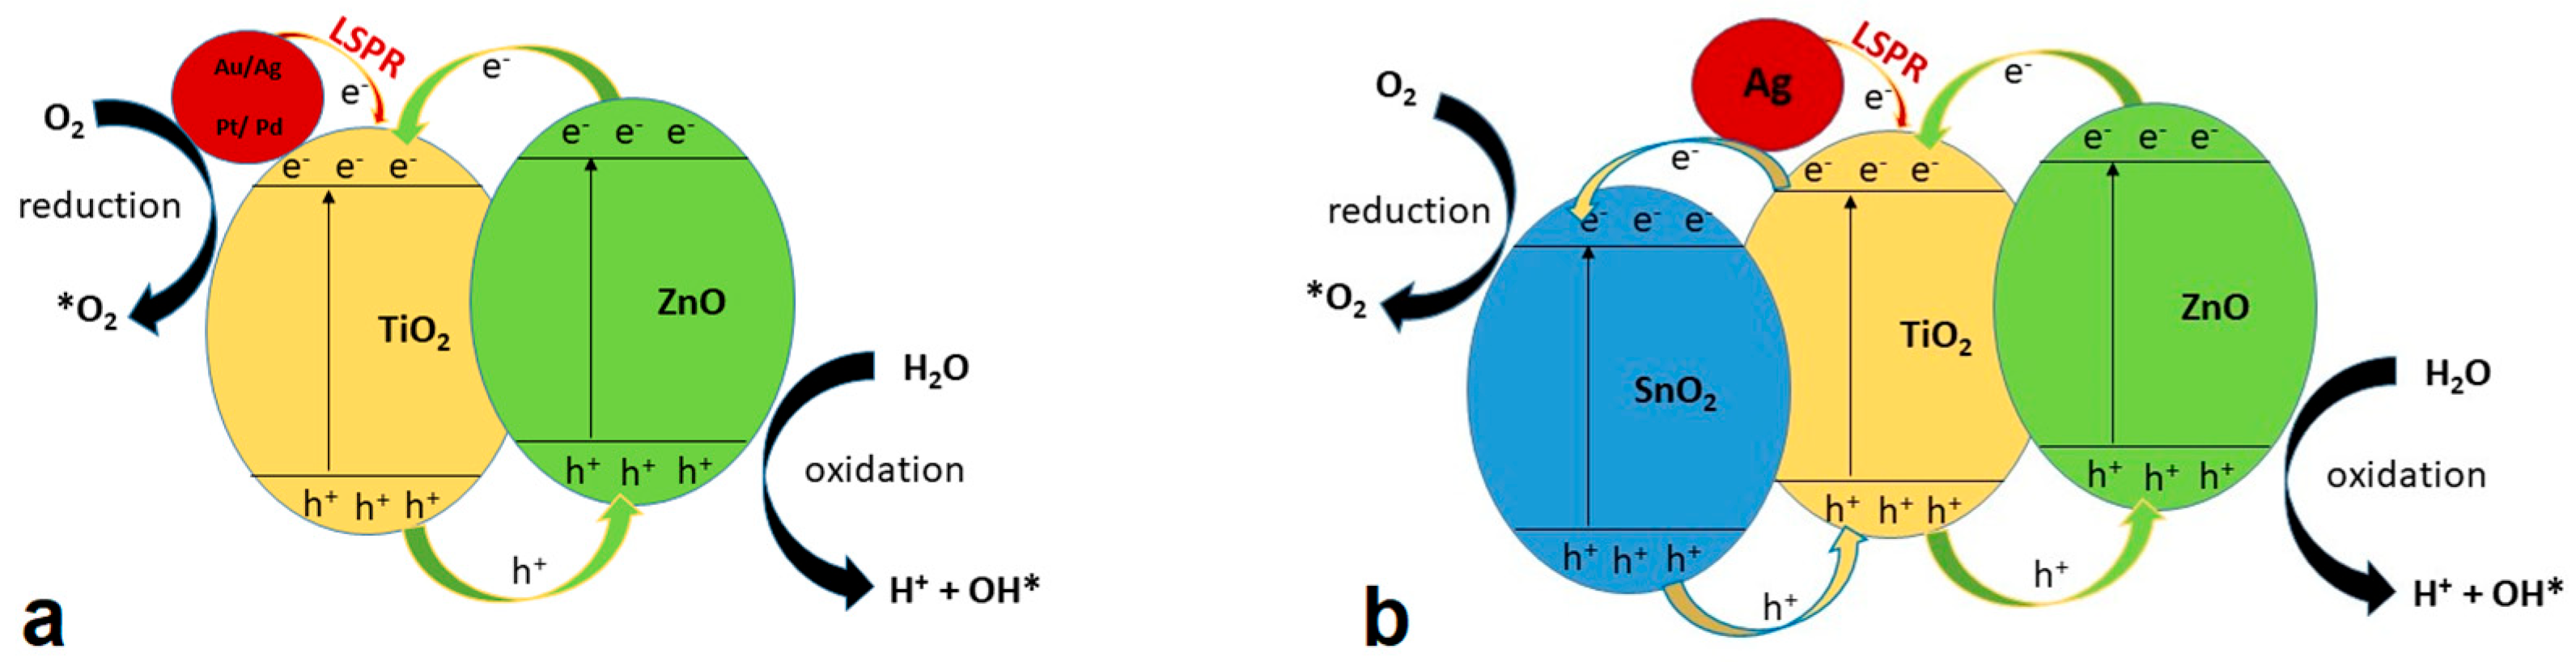
To highlight the reason for the enhanced photocatalytic activity of binary/ternary nanocomposites loaded with noble metal particles, a possible mechanism regarding the charge transfer of the photocatalyst and based on the presented results is schematically proposed in Figure 8.
Under visible light irradiation, noble metal nanoparticles will act as light collectors, leading to the production of electrons and holes on the surface of the nanoparticles due to their strong localized surface plasmon resonance effect [50,51,52]. Because the energy level of the conduction band of TiO2 is lower than that of the electrons, photogenerated electrons will rapidly migrate from Au/Ag/Pt/Pd to the surface of the TiO2-based composite. Moreover, the special structure of the bands of the ZnO-TiO2/SnO2-ZnO-TiO2 heterojunctions plays a vital role in increasing the efficiency of MO photodegradation. By coupling in both the binary (Figure 8a) and ternary (Figure 8b) configurations, these three semiconductors form a type II heterojunction in which the conduction band edge of ZnO is located above that of TiO2 and that of TiO2 is located above that of SnO2 [53]. Thus, under visible light irradiation, when electron–hole pairs are generated in noble metal nanoparticles and ZnO, electrons can be separated from holes by migrating to TiO2 and then SnO2 due to the potential gradient. After the charge transfer, electrons are finally localized in the conduction band of TiO2 (for binary composites) and SnO2 (for ternary composites), in holes in noble metal nanoparticles, and in the valence band of ZnO. Following the reaction with O2 and H2O in the pollutant solution, these lead to the formation of highly reactive radicals *O2 and *OH, respectively, for the photocatalytic degradation of MO to H2O and CO2 [54,55]. In conclusion, by inhibiting the recombination of charge carriers, ternary catalysts (TZS samples) have a better photocatalytic activity compared to binary ones (TZ samples), and, by loading them with noble metal particles, the photodegradation efficiency increases significantly in the visible range.
In addition, to further demonstrate the stability, robustness, and practical applicability of our photocatalyst, we evaluated its reusability over consecutive photodegradation cycles, showing that the material retains a high level of photocatalytic activity with minimal loss in efficiency; in particular, two successive measurements yielded degradation efficiencies differing by less than 5%, fully meeting the required reproducibility criteria and confirming the long-term reliability of the catalyst. Moreover, these measurements were realized after more than two years, thus proving the long-term stability of the photocatalyst.

3.8. Biocompatibility Properties

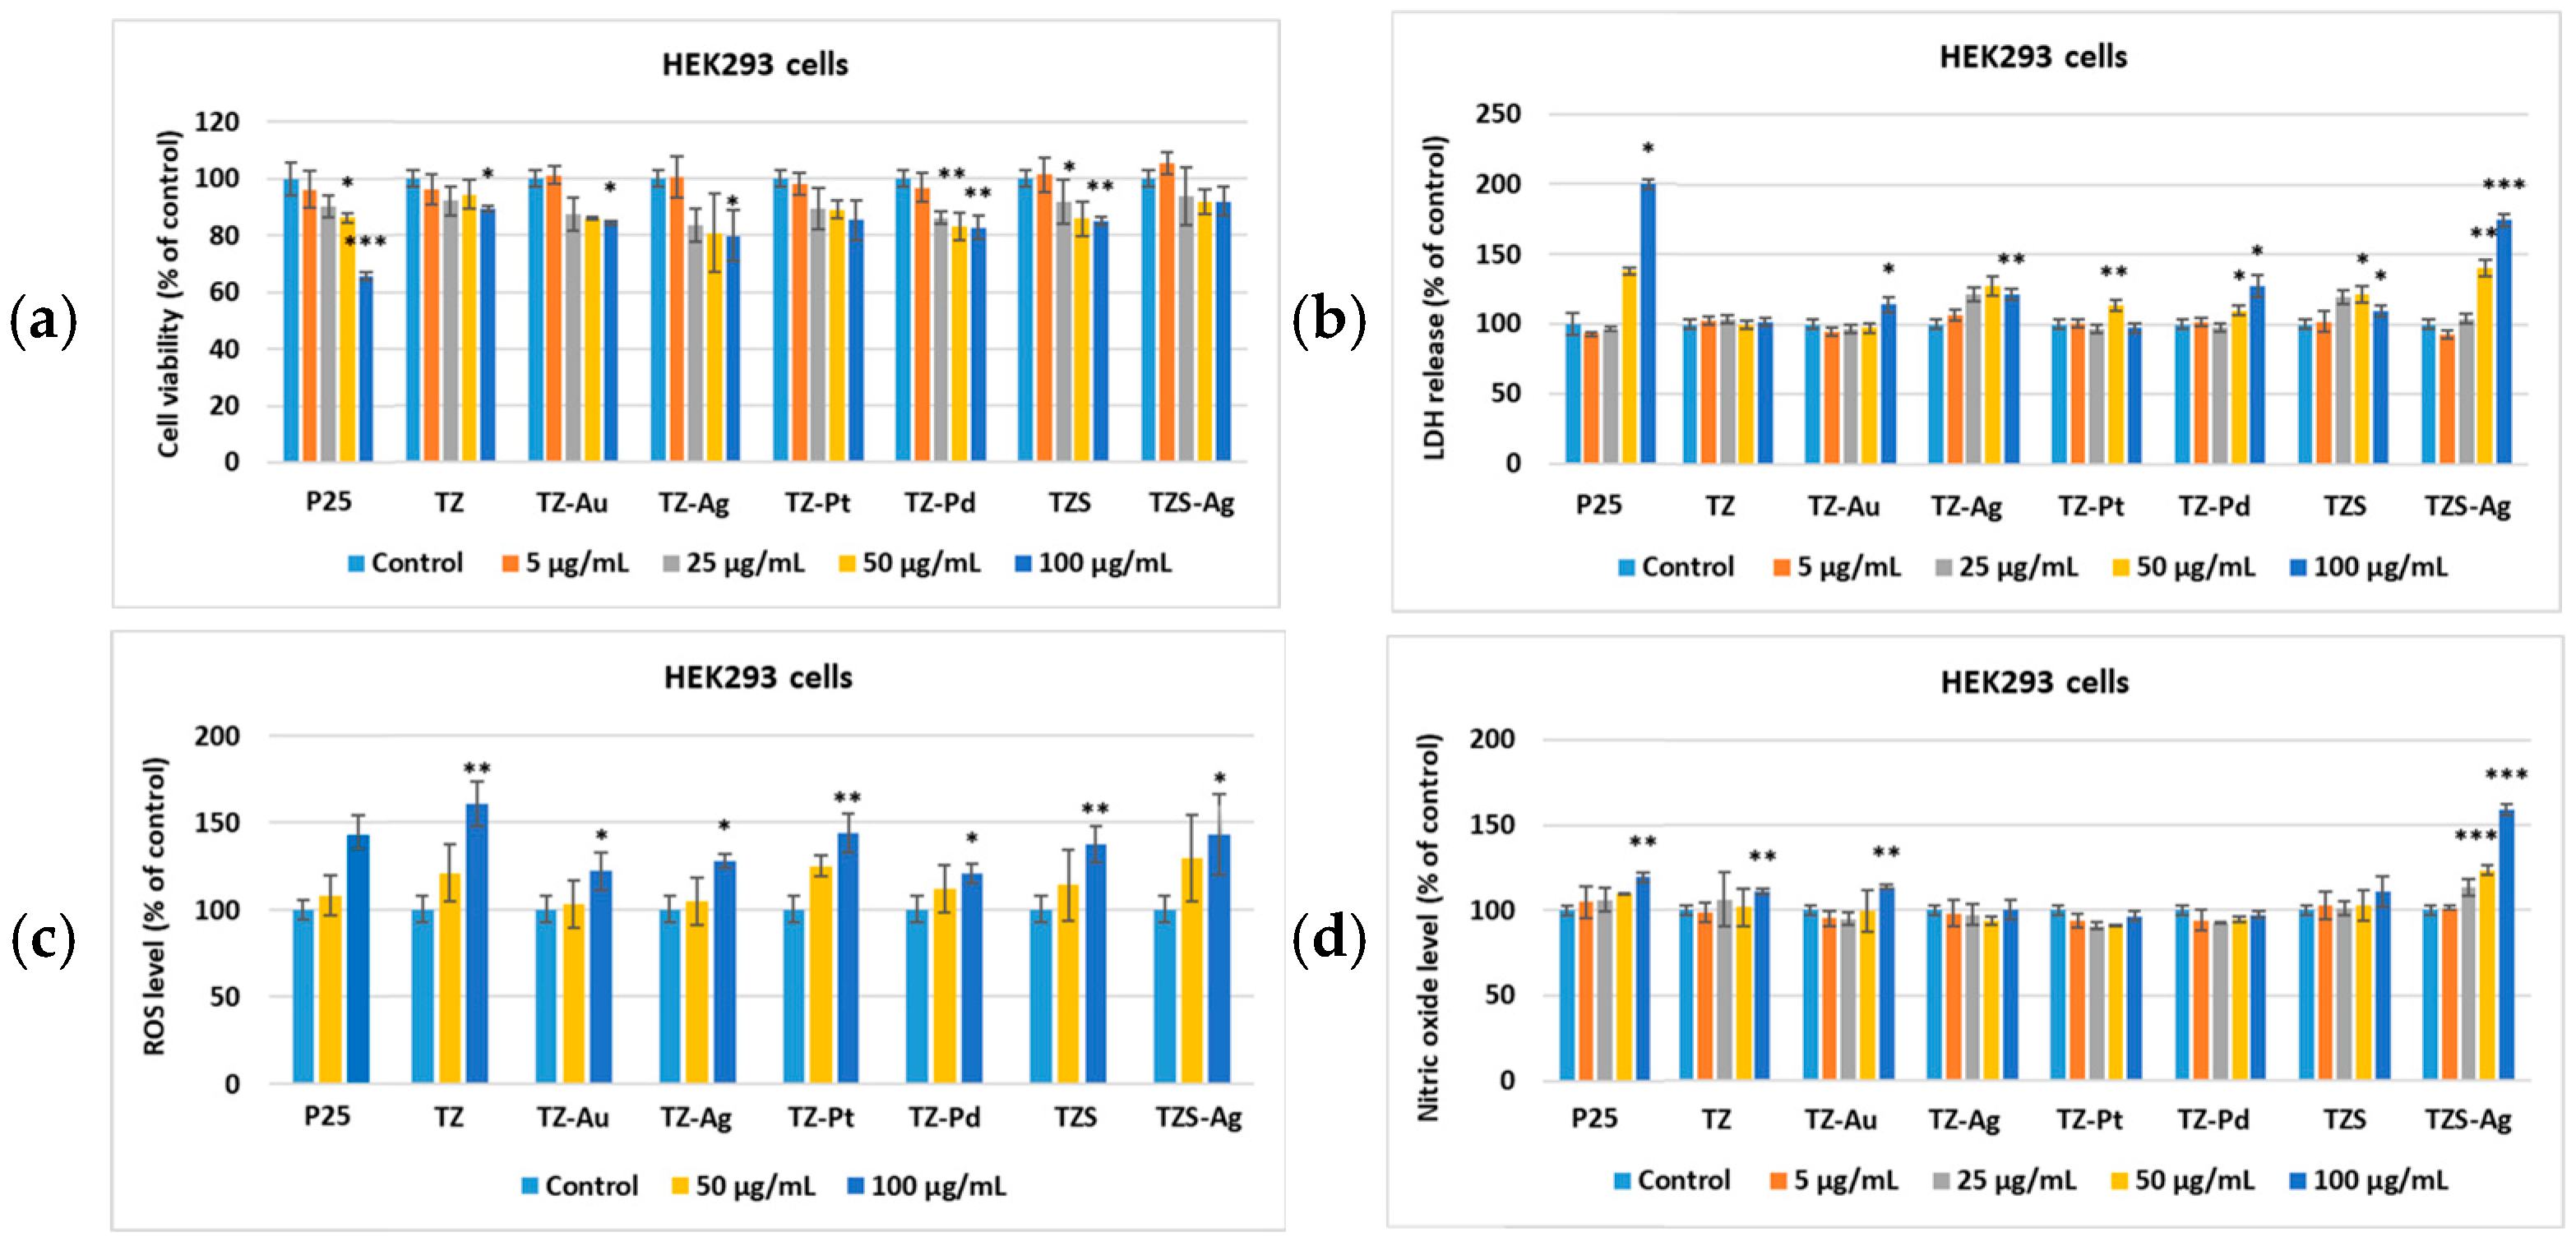
Finding the best photocatalysts for water purification is also accompanied by the need for them to be biocompatible materials, eliminating the risks of human exposure to toxic substances. For this reason, the biocompatibility properties of the obtained samples were tested on dermal and renal cells in comparison with the commercial sample. The viability analysis of HEK293 cells (Figure 9a) showed a maximum decrease of approximately 20% compared to the control after 24 h of incubation with the highest concentration (100 µg/mL) of synthesized nanoparticles. However, the most pronounced decrease was observed in the case of the P25 sample (an almost 40% reduction compared to the control). Similarly, the highest increase in LDH release into the medium (Figure 9b) was recorded in the case of cells incubated with the highest concentration of P25 particles, followed by TZS-Ag, TZ-Ag, and TZ-Pd. For the other types, the values remained close to control levels. These results suggest a slight cytotoxicity at 100 µg/mL nanoparticles, which is also supported by the increased levels of ROS detected for this dose (Figure 9c). However, NO levels remained comparable to those of the control, indicating that the particles did not induce an inflammatory response in these cells, except for TZS-Ag, which led to a more pronounced NO release at the highest concentration tested (Figure 9d).
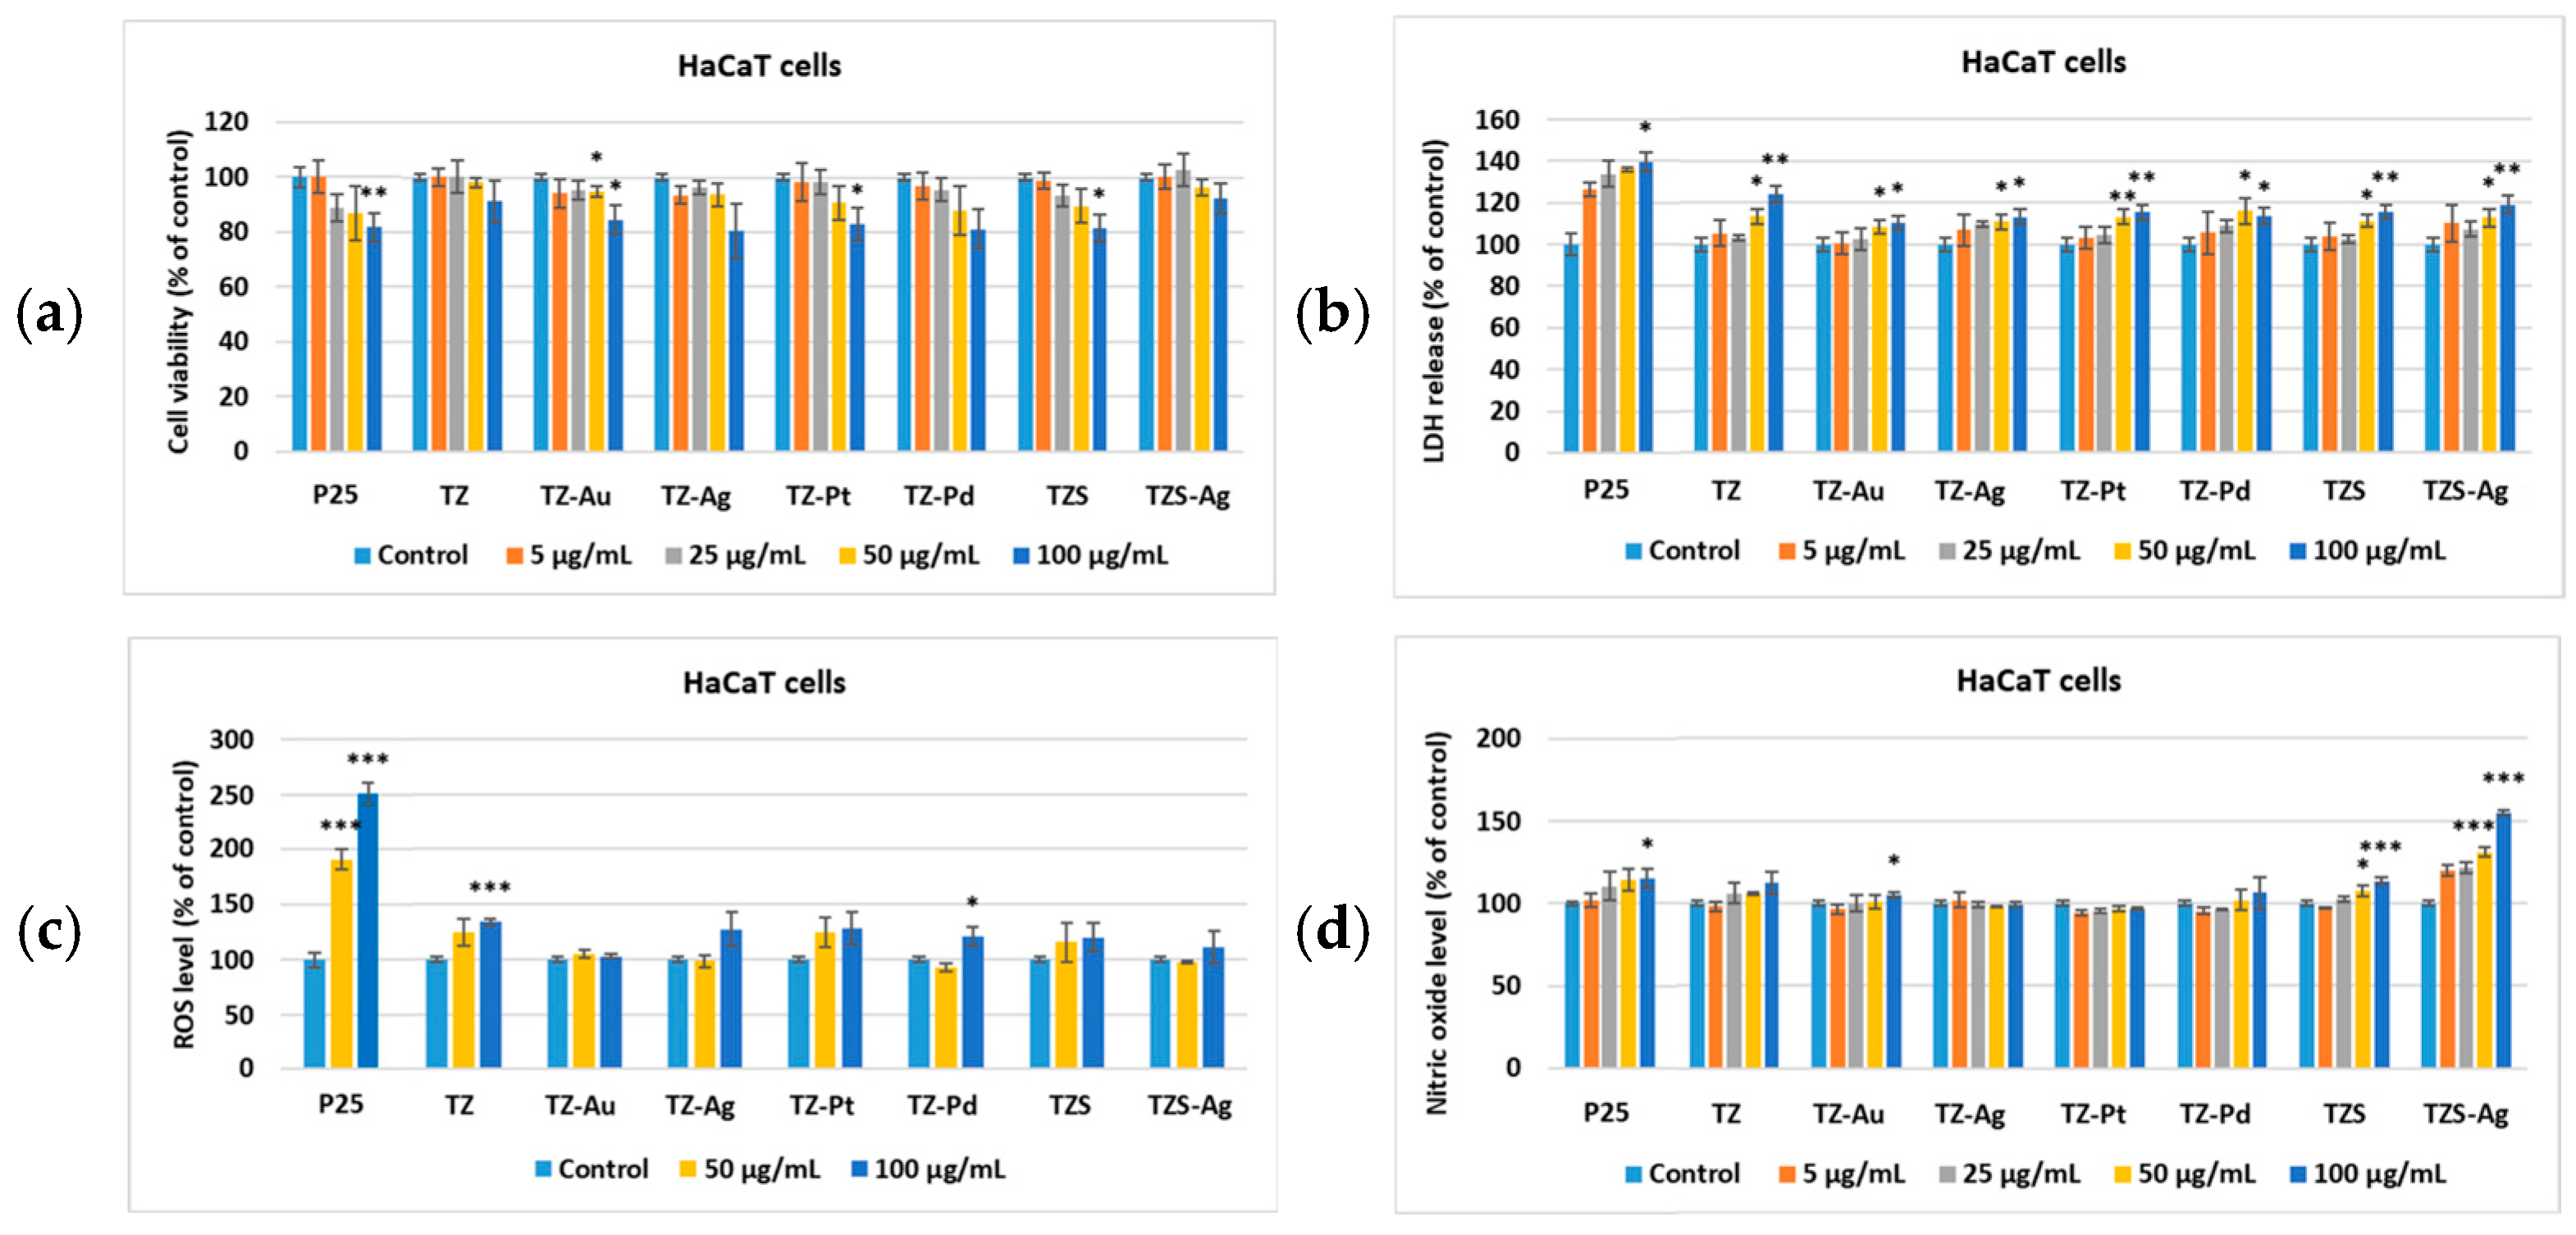
Regarding the effects on HaCaT cells, a milder cytotoxic response was observed compared to in the HEK293 cell line (Figure 10a). This was also supported by LDH values that remained close to control levels, with notable increases only in the case of P25 particles (Figure 10b). Additionally, ROS production was lower than that observed in kidney cells, with the highest levels recorded for P25 particles, followed by TZ and TZ-Pt (Figure 10c). The NO release profile was similar to that observed in HEK293 cells, highlighting pro-inflammatory potential only for high concentrations of TZS-Ag (Figure 10d).
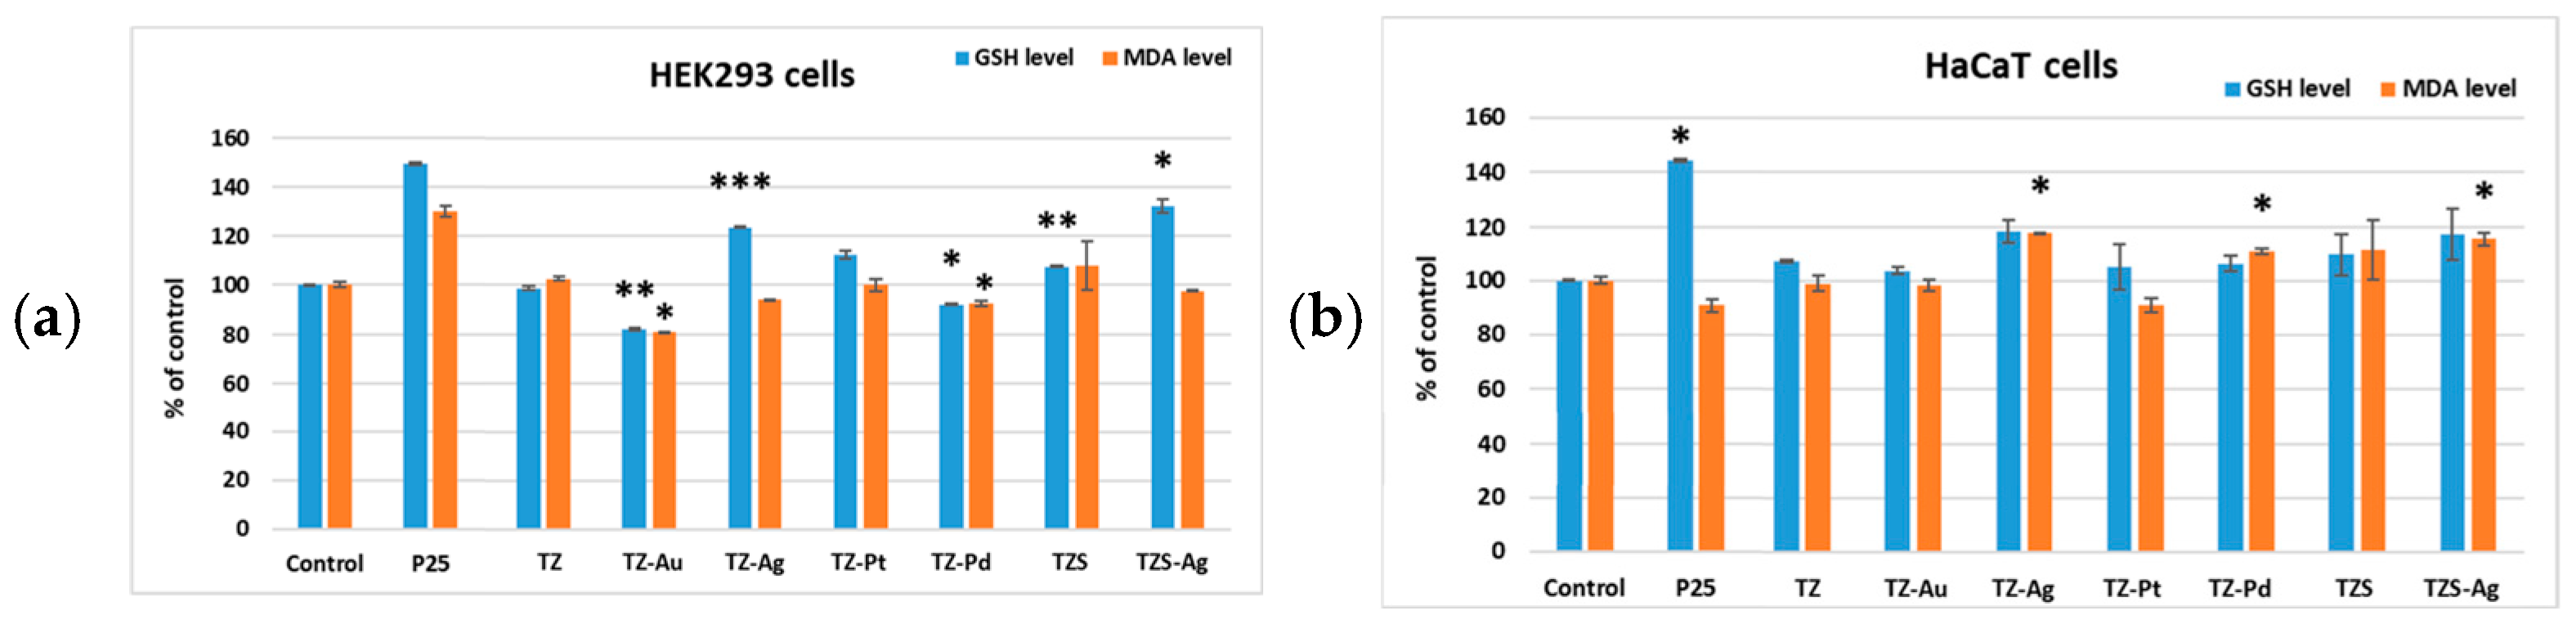
Oxidative stress analysis after 24 h of incubation with different types of nanoparticles revealed increased levels of GSH in HEK293 kidney cells exposed to P25, TZ-Ag, and TZS-Ag. However, these changes were not accompanied by a corresponding increase in malondialdehyde (MDA) concentrations, which remained near control levels for all tested samples except for P25, which induced lipid peroxidation (Figure 11a). In human keratinocytes (HaCaT), a simultaneous increase in both GSH and MDA levels was observed after 24 h of incubation with TZ-Ag and TZS-Ag (Figure 11b). However, these results indicate very mild toxicity (values not exceeding 120% of the control) for Ag-containing nanoparticles. A possible explanation is that the presence of AgCl in the case of binary/ternary Ag-loaded photocatalysts may lead to the induction of oxidative stress in skin and kidney cells [56]. Additionally, a similar significant increase (p > 0.05) in GSH levels was observed in HaCaT cells exposed to P25 as seen in kidney cells.
Our data show that new synthesized nanoparticles, especially those loaded with Au or Pd, exhibit lower cytotoxicity and oxidative stress in skin and kidney cells compared to Degussa P25, suggesting improved biocompatibility and their potential use in eco-friendly applications, such as environmental remediation, where safety for humans is essential.

4. Conclusions

In this work, binary (ZnO-TiO2) and ternary (SnO2-ZnO-TiO2) nanocomposites were obtained using the laser pyrolysis method and then loaded with noble metal nanoparticles through chemical impregnation and the reduction method. This was followed by evaluation of their photocatalytic performance. The novelty of this study lies in the combined design of binary and ternary TiO2-based heterostructures integrated with controlled noble metal nanoparticle functionalization for enhanced photocatalytic activity. To enhance the efficiency of the MO photodegradation process, the TiO2-based nanoparticles containing ZnO (2.6–3 at% in binary composites) and SnO2 (~4.7 at% in ternary composites) were loaded with Ag/AgCl measuring a few nanometers, with small nanoparticles of Pt (2–6 nm) and Pd (3–5 nm), and with large nanoparticles of Au (5–30 nm). The obtained samples were successfully tested and compared to P25 Degussa (both in UV light and under Vis irradiation), and the two main results were presented: on the one hand, ternary composite synthesis (TZS sample) is a cheap and efficient photocatalyst without using NMs, and, on the other hand, Ag-containing binary and ternary nanoparticles exhibit extraordinary photocatalytic activity for degradation of Methyl Orange (under visible light, up to efficiencies of 90%). These results confirm the strong synergistic effect between heterostructure formation and noble metal decoration in enhancing photocatalytic performance. Moreover, biocompatibility properties of these photocatalysts have been revealed using HaCaT keratinocytes and HEK293 kidney cells: the samples loaded with Au or Pd exhibited a lower cytotoxicity as compared to the commercial sample Degussa P25. These results demonstrate that the synthesized nanoparticles have excellent applicability in the photocatalytic degradation of organic pollutants, with the present study offering new perspectives on the development of sustainable materials with high MO degradation efficiency.

Supplementary Materials

The following supporting information can be downloaded at https://www.mdpi.com/article/10.3390/su18115461/s1, Figure S1. Enlarged XPS spectra showing the binding energy shifts of the Ti/Zn-O component of the O 1s peak (a), the Ti 2p3/2 peak (b), and the Zn 2p3/2 peak (d) for the TZ, TZ_Au, TZ_Ag, TZ_Pt, and TZ_Pd nanoparticles. Panels (c) and (e) show the variation of the full width at half maximum (FWHM) of the Ti 2p3/2 and Zn 2p3/2 peaks, respectively, as a function of the noble metal atomic concentration (at.%). Figure S2. Kubelka–Munk conversion of reflectance spectra regarding the bandgap value for all the samples (a–h).

Author Contributions

E.G.: conceptualization, methodology, writing—review and editing; M.S. (Monica Scarisoreanu): conceptualization, methodology, writing—review and editing; I.P.M.: conceptualization, investigation; E.D.: formal analysis, investigation; V.S.T.: formal analysis, investigation; C.I.F.: investigation, writing—review and editing; M.S. (Miruna Stan): investigation, writing—review and editing. All authors have read and agreed to the published version of the manuscript.

Funding

This work was supported by a grant from the Ministry of Education and Research (CCCDI-UEFISCDI, project number PN-IV-P6-6.1-CoEx-2024-0154) within PNCDI IV and by a project of the Romanian Ministry of Research, Innovation and Digitalization under the Romanian National Nucleu Program LAPLAS VII (contract no. 30N/2023).

Institutional Review Board Statement

Not applicable.

Informed Consent Statement

Not applicable.

Data Availability Statement

The original contributions presented in this study are included in the article/Supplementary Materials. Further inquiries can be directed to the corresponding author.

Conflicts of Interest

The authors declare no conflicts of interest.

References

  1. Wu, L.; Liu, X.; Lv, G. Study on the adsorption properties of methyl orange by natural one-dimensional nano-mineral materials with different structures. Sci. Rep. 2021, 11, 10640. [Google Scholar] [CrossRef]
  2. Pandey, A.; Pathak, V.M.; Navneet; Rajput, M. A feasible approach for azo-dye (methyl orange) degradation by textile effluent isolate Serratia marcescens ED1 strain for water sustainability: AST identification, degradation optimization and pathway hypothesis. Heliyon 2024, 10, 11. [Google Scholar] [CrossRef]
  3. Hanafi, M.F.; Sapawe, N. A review on the water problem associate with organic pollutants derived from phenol, methyl orange, and remazol brilliant blue dyes. Mater. Today Proc. 2020, 31, 141–150. [Google Scholar] [CrossRef]
  4. Arif, M. Catalytic reduction/degradation of methyl orange by metal nanoparticle containing systems: A critical review. RSC Adv. 2025, 15, 27668–27684. [Google Scholar] [CrossRef]
  5. Mohamadpour, F.; Amani, A.M. Photocatalytic systems: Reactions, mechanism, and applications. RSC Adv. 2024, 14, 20609–20645. [Google Scholar] [CrossRef]
  6. Pavel, M.; Anastasescu, C.; State, R.-N.; Vasile, A.; Papa, F.; Balint, I. Photocatalytic Degradation of Organic and Inorganic Pollutants to Harmless End Products: Assessment of Practical Application Potential for Water and Air Cleaning. Catalysts 2023, 13, 380. [Google Scholar] [CrossRef]
  7. Sari, Y.; Gareso, P.L.; Armynah, B.; Tahir, D. A review of TiO2 photocatalyst for organic degradation and sustainable hydrogen energy production. Int. J. Hydrog. Energy 2024, 55, 984–996. [Google Scholar] [CrossRef]
  8. Zhang, Y.; Xu, X. Machine Learning Band Gaps of Doped-TiO2 Photocatalysts from Structural and Morphological Parameters. ACS Omega 2020, 5, 15344–15352. [Google Scholar] [CrossRef]
  9. Shi, L.; Li, C.; Gu, H.; Fang, D. Morphology and properties of ultrafine SnO2–TiO2 coupled semiconductor particles. Mater. Chem. Phys. 2000, 62, 62–67. [Google Scholar] [CrossRef]
  10. Keller, V.; Garin, F. Photocatalytic behavior of a new composite ternary system: WO3/SiC-TiO2. Effect of the coupling of semiconductors and oxides in photocatalytic oxidation of methylethylketone in the gas phase. Catal. Commun. 2003, 4, 377–383. [Google Scholar] [CrossRef]
  11. Ratshiedana, R.; Malefane, M.E.; Fakayode, O.J.; More, G.K.; Mishra, A.K.; Kuvarega, A.T. Ag induced plasmonic TiO2 for photocatalytic degradation of pharmaceutical under visible light: Insights into mechanism, antimicrobial and cytotoxicity studies. Mater. Today Commun. 2024, 41, 110753. [Google Scholar] [CrossRef]
  12. Conte, F.; Rossetti, I.; Ramis, G.; Vaulot, C.; Hajjar-Garreau, S.; Bennici, S. Low Metal Loading (Au, Ag, Pt, Pd) Photo-Catalysts Supported on TiO2 for Renewable Processes. Materials 2022, 15, 2915. [Google Scholar] [CrossRef]
  13. Sun, Y.; Zhang, W.; Li, Q.; Liu, H.; Wang, X. Preparations and applications of zinc oxide based photocatalytic materials. Adv. Sens. Energy Mater. 2023, 2, 210006. [Google Scholar] [CrossRef]
  14. Della Costa Silveira, M.L.; Rodrigues da Silva, N.; Santos Souza Padovini, D.; Kinoshita, A.; Martinho Lima Pontes, F.; Geraldo Magdalen, A. Synthesis, characterization, and photocatalytic activity of ZnO nanostructures. Res. Soc. Dev. 2022, 11, e3811225373. [Google Scholar] [CrossRef]
  15. Wei, Y.; Lei, E.; Chen, Y.; Zhao, D.; Li, J.; Lv, Y.; Wei, H. A novel heterojunction material of TiO2/ZnO/ZnTiO3 with excellent photocatalytic activity for dye degradation. Mater. Lett. 2025, 391, 138507. [Google Scholar] [CrossRef]
  16. Sadik, W.; El-Demerdash, M.A.; Nashed, A.W. Synthesis and investigation of optical properties and enhancement photocatalytic activity of TiO2–SnO2 semiconductor for degradation of organic compounds. Sci. Rep. 2024, 14, 27846. [Google Scholar] [CrossRef]
  17. Karmaoui, M.; Jorge, A.B.; McMillan, P.F.; Aliev, A.E.; Pullar, R.C.; Labrincha, J.A.; Tobaldi, D.M. One-Step Synthesis, Structure, and Band Gap Properties of SnO2 Nanoparticles Made by a Low Temperature Nonaqueous Sol−Gel Technique. ACS Omega 2018, 3, 13227–13238. [Google Scholar] [CrossRef] [PubMed]
  18. Veziroglu, S.; Hwang, J.; Drewes, J.; Barg, I.; Shondo, J.; Strunskus, T.; Polonskyi, O.; Faupel, F.; Aktas, O.C. PdO nanoparticles decorated TiO2 film with enhanced photocatalytic and self-cleaning properties. Mater. Today Chem. 2020, 16, 100251. [Google Scholar] [CrossRef]
  19. Yang, Q.; Hu, M.; Guo, J.; Ge, Z.; Feng, J. Synthesis and enhanced photocatalytic performance of Ag/AgCl/TiO2 nanocomposites prepared by ion exchange method. J. Mater. 2018, 4, 402–411. [Google Scholar] [CrossRef]
  20. Chen, Y.; Lin, L.; Xu, W.; Liu, C.; Yu, C.; Cheng, Y.; Qi, R.; Huang, R. Origin of Cycle Performance in the Ag2O/TiO2 Heterostructure Photocatalyst. Langmuir 2023, 39, 14904–14911. [Google Scholar] [CrossRef]
  21. Dumitrache, F.; Morjan, I.; Fleaca, C.; Badoi, A.; Manda, G.; Pop, S.; Marta, D.S.; Huminic, G.; Huminic, A.; Vekas, L.; et al. Highly magnetic Fe2O3 nanoparticles synthesized by laser pyrolysis used for biological and heat transfer applications. Appl. Surf. Sci. 2015, 336, 297–303. [Google Scholar] [CrossRef]
  22. Dumitrache, F.; Morjan, I.P.; Dutu, E.; Morjan, I.; Fleaca, C.T.; Scarisoreanu, M.; Ilie, A.; Dumitru, M.; Mihailescu, C.; Smarandache, A.; et al. Zn/F-doped tin oxide nanoparticles synthesized by laser pyrolysis: Structural and optical properties. Beilstein J. Nanotechnol. 2019, 10, 9–21. [Google Scholar] [CrossRef]
  23. Fleaca, C.T.; Scarisoreanu, M.; Morjan, I.; Luculescu, C.; Niculescu, A.M.; Badoi, A.; Vasile, E.; Kovacs, G. Laser oxidative pyrolysis synthesis and annealing of TiO2 nanoparticles embedded in carbon–silica shells/matrix. Appl. Surf. Sci. 2015, 336, 226–233. [Google Scholar] [CrossRef]
  24. Scarisoreanu, M.; Fleaca, C.; Morjan, I.; Niculescu, A.M.; Luculescu, C.; Dutu, E.; Ilie, A.; Morjan, I.; Florescu, L.G.; Vasile, E.; et al. High photoactive TiO2/ SnO2 nanocomposites prepared by laser pyrolysis. Appl. Surf. Sci. 2017, 418, 491–498. [Google Scholar] [CrossRef]
  25. Tauc, J. Optical properties and electronic structure of amorphous Ge and Si. Mater. Res. Bull. 1968, 3, 37–46. [Google Scholar] [CrossRef]
  26. Amendola, V.; Bakr, O.M.; Stellacci, F. A Study of the Surface Plasmon Resonance of Silver Nanoparticles by the Discrete Dipole Approximation Method: Effect of Shape, Size, Structure, and Assembly. Plasmonics 2010, 5, 85–97. [Google Scholar] [CrossRef]
  27. Spurr, R.A.; Myers, H. Quantitative Analysis of Anatase-Rutile Mixtures with an X-Ray Diffractometer. Anal. Chem. 1957, 29, 760–762. [Google Scholar] [CrossRef]
  28. Patterson, A.L. The Scherrer Formula for X-ray Particle Size Determination. Phys. Rev. 1939, 56, 978. [Google Scholar] [CrossRef]
  29. Chang, Y.-S.; Chang, Y.-H.; Chen, I.-G.; Chen, G.-J.; Chai, Y.-L.; Fang, T.-H.; Wu, S. Synthesis, formation and characterization of ZnTiO3 ceramics. Ceram. Int. 2004, 30, 2183–2189. [Google Scholar] [CrossRef]
  30. Ibrahim, N.S.; Leaw, W.L.; Mohamad, D.; Alias, S.H.; Nur, H. A critical review of metal-doped TiO2 and its structure physical propertiese photocatalytic activity relationship in hydrogen production. Int. J. Hydrog. Energy 2020, 45, 28553–28565. [Google Scholar] [CrossRef]
  31. Lincho, J.; Mazierski, P.; Klimczuk, T.; Martins, R.C.; Gomes, J.; Zaleska-Medynska, A. TiO2 nanotubes modification by photodeposition with noble metals: Characterization, optimization, photocatalytic activity, and by-products analysis. J. Environ. Chem. Eng. 2024, 12, 112990. [Google Scholar] [CrossRef]
  32. Abdullin, K.A.; Gabdullin, M.T.; Zhumagulov, S.K.; Ismailova, G.A.; Gritsenko, L.V.; Kedruk, Y.Y.; Mirzaeian, M. Stabilization of the Surface of ZnO Films and Elimination of the Aging Effect. Materials 2021, 14, 6535. [Google Scholar] [CrossRef]
  33. Liu, Q.; Zhou, Y.; Duan, Y.; Wang, M.; Zhao, X.; Lin, Y. Enhanced conversion efficiency of dye-sensitized titanium dioxide solar cells by Ca-doping. J. Alloys Compd. 2013, 548, 161–165. [Google Scholar] [CrossRef]
  34. Göpel, W.; Anderson, J.A.; Frankel, D.; Jaehnig, M.; Phillips, K.; Schäfer, J.A.; Rocker, G. Surface defects of TiO2(110): A combined XPS, XAES AND ELS study. Surf. Sci. 1984, 139, 333–346. [Google Scholar] [CrossRef]
  35. Bhowmick, T.K.; Suresh, A.K.; Kane, S.G. Physicochemical characterization of an Indian traditional medicine, Jasada Bhasma: Detection of nanoparticles containing non-stoichiometric zinc oxide. J. Nanopart. Res. 2009, 11, 655–664. [Google Scholar] [CrossRef]
  36. Ramírez-Ortega, D.; Guerrero-Araque, D.; Acevedo-Peña, P.; Reguera, E.; Calderon, H.A.; Zanella, R. Enhancing the photocatalytic hydrogen production of the ZnO–TiO2 heterojunction by supporting nanoscale Au islands. Int. J. Hydrog. Energy 2021, 46, 34333–34343. [Google Scholar] [CrossRef]
  37. Sun, L.; Zhang, R.; Wang, Y.; Chen, W. Plasmonic AgFAgCl Nanotubes Fabricated from Copper Nanowires as High-Performance Visible Light Photocatalyst. ACS Appl. Mater. Interfaces 2014, 6, 14819–14826. [Google Scholar] [CrossRef] [PubMed]
  38. Liu, J.; Ding, T.; Zhang, H.; Li, G.; Cai, J.; Zhao, D.; Tian, Y.; Xian, H.; Bai, X.; Li, X. Engineering surface defects and metal–support interactions on Pt/TiO2(B) nanobelts to boost the catalytic oxidation of CO. Catal. Sci. Technol. 2018, 8, 4934–4944. [Google Scholar] [CrossRef]
  39. Yu, F.; Wang, C.; Ma, H.; Song, M.; Li, D.; Li, Y.; Li, S.; Zhang, X.; Liu, Y. Revisiting Pt/TiO2 photocatalysts for thermally assisted photocatalytic reduction of CO2. Nanoscale 2020, 12, 7000–7010. [Google Scholar] [CrossRef]
  40. Regull, P. XPS and IR (ATR) Analysis of Pd Oxide Films Obtained by Electrochemical Methods. Surf. Interface Anal. 1988, 11, 447–449. [Google Scholar] [CrossRef]
  41. Bonapasta, A.A.; Filippone, F.; Mattioli, G.; Alippi, P. Oxygen vacancies and OH species in rutile and anatase TiO2 polymorphs. Catal. Today 2009, 144, 177–182. [Google Scholar] [CrossRef]
  42. Goncearenco, E.; Morjan, I.P.; Fleaca, C.; Dutu, E.; Criveanu, A.; Viespe, C.; Galca, A.C.; Maraloiu, A.V.; Stan, M.S.; Fort, C.I. The Influence of SnO2 and Noble Metals on the Properties of TiO2 for Environmental Sustainability. Sustainability 2024, 16, 2904. [Google Scholar] [CrossRef]
  43. Scarisoreanu, M.; Ilie, A.G.; Goncearenco, E.; Banici, A.M.; Morjan, I.P.; Dutu, E.; Tanasa, E.; Fort, I.; Stan, M.; Mihailescu, C.N.; et al. Ag, Au and Pt decorated TiO2 biocompatible nanospheres for UV & vis photocatalytic water treatment. Appl. Surf. Sci. 2020, 509, 145217. [Google Scholar] [CrossRef]
  44. Fabregat-Santiago, F.; Mora-Sero, I.; Garcia-Belmonte, G.; Bisquert, J. Cyclic Voltammetry Studies of Nanoporous Semiconductors. Capacitive and Reactive Properties of Nanocrystalline TiO2 Electrodes in Aqueous Electrolyte. J. Phys. Chem. B 2003, 107, 758. [Google Scholar] [CrossRef]
  45. Bamba, D.; Coulibaly, M.; Fort, C.I.; CoteSt, C.L.; Pap, Z.; Vajda, K.; Zoro, E.G.; Yao, N.A.; Danciu, V.; Robert, D. Synthesis and characterization of TiO2/C nanomaterials: Applications in water treatment. Phys. Status Solidi B 2015, 252, 2503–2511. [Google Scholar] [CrossRef]
  46. Bonamali, P. Plasmonic Coinage Metal-TiO2 Hybrid Nanocatalysts for Highly Efficient Photocatalytic Oxidation under Sunlight Irradiation. New J. Chem. 2015, 39, 5966–5976. [Google Scholar] [CrossRef]
  47. Rusu, M.M.; Wahyuono, R.A.; Fort, C.I.; Dellith, A.; Dellith, J.; Ignaszak, A.; Vulpoi, A.; Danciu, V.; Dietzek, B.; Baia, L.J. Impact of drying procedure on the morphology and structure of TiO2 xerogels and the performance of dye sensitized solar cells. Sol.-Gel. Sci. Technol. 2017, 81, 693–703. [Google Scholar] [CrossRef]
  48. Ishchenko, O.M.; Rogé, V.; Lamblin, G.; Lenoble, D. TiO2- and ZnO-Based Materials for Photocatalysis: Material Properties, Device Architecture and Emerging Concepts. In Semiconductor Photocatalysis—Materials, Mechanisms and Applications; Cao, W., Ed.; IntechOpen: London, UK, 2016. [Google Scholar] [CrossRef]
  49. Rani, A.; Reddy, R.; Sharma, U.; Mukherjee, P.; Mishra, P.; Kuila, A.; Sim, L.C.; Saravanan, P. A review on the progress of nanostructure materials for energy harnessing and environmental remediation. J. Nanostruct. Chem. 2018, 8, 255–291. [Google Scholar] [CrossRef]
  50. Yang, G.; Yan, Z.; Xiao, T. Preparation and characterization of SnO2/ZnO/TiO2 composite semiconductor with enhanced photocatalytic activity. Appl. Surf. Sci. 2012, 22, 8704–8712. [Google Scholar] [CrossRef]
  51. Yaru, L.; Weihao, L.; Runcheng, L.; Jinjuan, G.; Jingwen, F.; Shicai, X.; Zhen, L.; Shouzhen, J.; Xuejian, D. 3D hybrid arrayed Ag/MOF multi-plasmon resonant cavity system for high-performance SPR sensing. Opt. Laser Technol. 2023, 167, 109825. [Google Scholar] [CrossRef]
  52. Na, Z.; Zhiquan, C.; Zao, Y.; Shubo, C.; Sohail, A.; Chaojun, T.; Fan, G.; Boxun, L. Terahertz multi-band tunable refractive index sensing graphene absorber based on surface plasmon resonance. Phys. B Condens. Matter. 2026, 734, 418608. [Google Scholar] [CrossRef]
  53. Liang, H.; Jia, Z.; Zhang, H.; Wang, X.; Wang, J. Photocatalysis oxidation activity regulation of Ag/TiO2 composites evaluated by the selective oxidation of Rhodamine B. Appl. Surf. Sci. 2017, 422, 1–10. [Google Scholar] [CrossRef]
  54. Hieu, V.Q.; Phung, T.K.; Nguyen, T.Q.; Khan, A.; Doan, V.D.; Tran, V.A.; Le, V.T. Photocatalytic degradation of methyl orange dye by Ti3C2–TiO2 heterojunction under solar light. Chemosphere 2021, 276, 130154. [Google Scholar] [CrossRef]
  55. Daneshvar, N.; Salari, D.; Khataee, A.R. Photocatalytic degradation of azo dye acid red 14 in water on ZnO as an alternative catalyst to TiO2. J. Photochem. Photobiol. A Chem. 2004, 162, 317–322. [Google Scholar] [CrossRef]
  56. Choi, Y.; Kim, H.A.; Kim, K.W.; Lee, B.T. Comparative toxicity of silver nanoparticles and silver ions to Escherichia coli. J. Environ. Sci. 2018, 66, 50–60. [Google Scholar] [CrossRef] [PubMed]
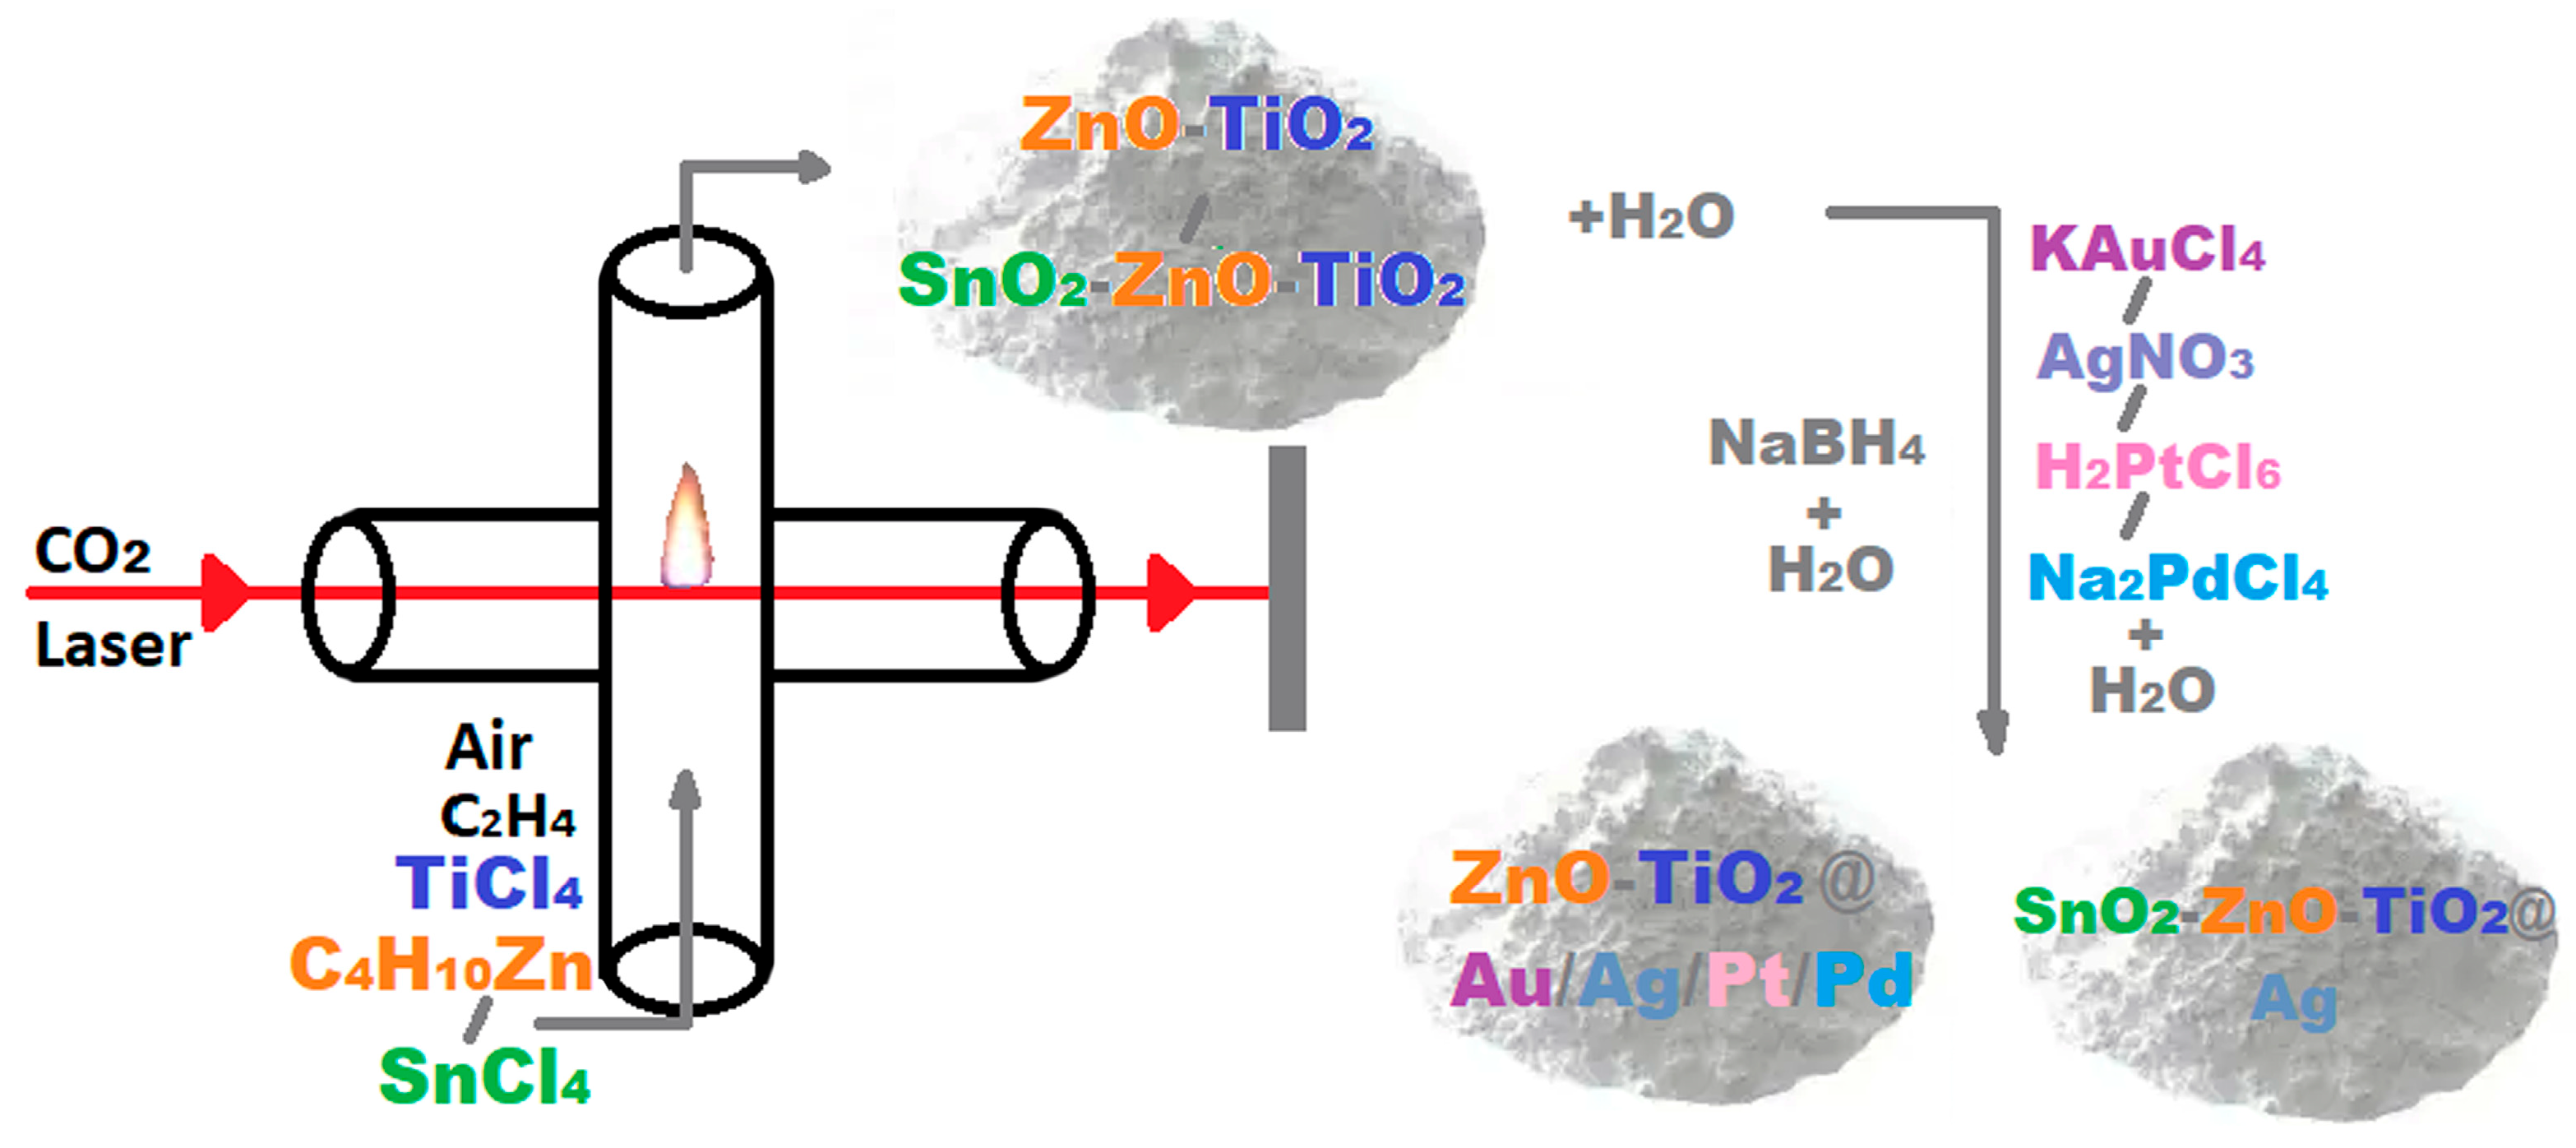
Figure 1. Experimental setup used for the synthesis of TiO2-based nanoparticles via laser pyrolysis, as well as for the chemical impregnation and reduction processes.
Sustainability 18 05461 g001
Figure 2. EDX spectrum corresponding to the TZS_Ag sample.
Sustainability 18 05461 g002
Figure 3. XRD diffractograms of the TZ (a) and TZS (b) nanopowders loaded with noble metals.
Sustainability 18 05461 g003
Figure 4. The HRTEM images of the TiO2-ZnO grain decorated with Au (a), Ag (b), Pt (c), and Pd (d) NPs and the TiO2-ZnO-SnO2 grain (e) loaded with Ag NPs (f). The EDX spectra (g,h) were collected on particle aggregate like that exposed in (e,f), respectively.
Sustainability 18 05461 g004
Figure 5. XPS survey spectrum (a) and XPS spectra of O 1s (b), Ti 2p (c), Zn 2p (d), Au 4f (e), Ag 3d (f), Pt 4f (g), and Pd 3d (h) of the TZ@Au/Ag/Pt/Pd nanoparticles.
Sustainability 18 05461 g005aSustainability 18 05461 g005b
Figure 6. UV–Vis absorption spectra for all the samples.
Sustainability 18 05461 g006
Figure 7. Methyl Orange concentration during UV (a) and Vis (c) irradiation in the photocatalysts’ presence. The corresponding MO photofading efficiency (b,d).
Sustainability 18 05461 g007
Figure 8. Schematic diagram of the possible process for binary (a) and ternary (b) composites’ photocatalytic degradation of MO under visible light irradiation.
Sustainability 18 05461 g008
Figure 9. Levels of cell viability (a), lactate dehydrogenase (LDH) released into the medium (b), reactive oxygen species (ROS) (c), and nitric oxide (NO) (d) after 24 h incubation of HEK293 cells with nanoparticles. Results are expressed as the mean of three independent experiments ± standard deviation and presented relative to the control. * p < 0.05; ** p < 0.01; *** p < 0.001 compared to the control.
Sustainability 18 05461 g009
Figure 10. Levels of cell viability (a), lactate dehydrogenase (LDH) released into the medium (b), reactive oxygen species (ROS) (c), and nitric oxide (NO) (d) after 24 h incubation of HaCaT cells with nanoparticles. Results are expressed as the mean of three independent experiments ± standard deviation and presented relative to the control. * p < 0.05; ** p < 0.01; *** p < 0.001 compared to the control.
Sustainability 18 05461 g010
Figure 11. Levels of reduced glutathione (GSH) and malondialdehyde (MDA) after 24 h incubation of HEK293 (a) and HaCaT (b) cells with 100 µg/mL nanoparticles. Results are expressed as the mean of three independent replicates ± standard deviation and presented relative to the control. * p < 0.05; ** p < 0.01; *** p < 0.001 compared to the control.
Sustainability 18 05461 g011
Table 1. EDX measurements, crystallographic parameters, band gap energy values, and photodegradation efficiency for the SnO2/ZnO-TiO2@NMs nanocomposite.
Sample TZTZ_AuTZ_AgTZ_PtTZ_PdTZSTZS_AgP 25
EDX
Results
Chemical composition [at. %]Zn/Ti0.10.10.10.10.10.10.1
Zn3.02.62.82.42.62.21.8
Ti29.621.125.222.020.728.925.3
O66.075.471.072.376.161.066.5
Sn0.00.00.00.00.07.25.5
NM0.00.20.50.20.30.00.6
Impurities1.40.70.53.10.30.70.3
XRD
Results
Phase proportion [%]TiO2(A)/TiO2(R)3.13.13.63.33.30.80.8
Mean crystallite size [nm]TiO2(A)29.528.629.529.022.919.519.8
TiO2(R)27.527.928.131.625.622.420.1
SnO2 4.84.6
ZnO29.563.163.157.695.5
Photodegradation
Results
Band gap energy [eV] 2.852.702.302.762.822.842.883.2
Rate constant
[10−3 min−1]
UV22.2727.3336.8222.7230.7236.3334.416.52
Vis1.039.6018.134.578.178.0022.650.09
Disclaimer/Publisher’s Note: The statements, opinions and data contained in all publications are solely those of the individual author(s) and contributor(s) and not of MDPI and/or the editor(s). MDPI and/or the editor(s) disclaim responsibility for any injury to people or property resulting from any ideas, methods, instructions or products referred to in the content.