Article

Python-Based AI-Assisted Modeling and Computation of Life Cycle Assessment of European Polymeric Waste: Application in Manufacturing and Recycling Industries Regarding Sustainability

1
Institute of Sustainable Building Materials and Engineering System, Riga Technical University, Paula Valdenaiela 1, LV-1007 Riga, Latvia
2
Department of Engineering Sciences and Mathematics, Luleå University of Technology, 97187 Luleå, Sweden
3
Department of Mechanical and Industrial Engineering, Tallinn University of Technology, Ehitajate Tee 5, 19086 Tallinn, Estonia
4
CiTin—Centro de Interface Tecnológico Industrial, 4970-786 Arcos de Valdevez, Portugal
5
ProMetheus, Instituto Politécnico de Viana do Castelo (IPVC), 4900-347 Viana do Castelo, Portugal
*
Author to whom correspondence should be addressed.
Sustainability 2026, 18(11), 5445; https://doi.org/10.3390/su18115445 (registering DOI)
Submission received: 31 March 2026 / Revised: 18 May 2026 / Accepted: 20 May 2026 / Published: 28 May 2026

Abstract

Development of sustainability systems for assessment of environmental impacts remains a paramount challenge for green and circular manufacturing of polymers. In this study, a comprehensive life cycle assessment (LCA) framework is developed for European polymeric waste by integrating OpenLCA, Ecoinvent v3.11, and Python-based machine learning (ML) algorithms. Cradle-to-gate, service-life, and cradle-to-grave assessments are performed for representative thermoplastic composite systems, including PP–PET–cotton, HDPE–glass fiber, and PEEK–carbon fiber composites, covering domestic, engineering, and high-performance polymer categories. The results demonstrate that raw material extraction and manufacturing stages dominate environmental impacts, contributing the highest shares to climate change, ecotoxicity, and non-renewable energy consumption. PP-based composite systems exhibit the lowest overall environmental burdens due to lower processing energy and simpler molecular structures, while HDPE-based systems show moderate impacts. PEEK-based composites present the highest impacts per unit mass, driven by energy-intensive synthesis and high processing temperature. Environmental impacts are evaluated using EF v3.1 and ReCiPe methodologies, supported by Monte Carlo simulations and ML-assisted uncertainty quantification. Monte Carlo simulations and ML-assisted LCA provide probabilistic ranges, uncertainty quantification, and predictive insights into impact indicators, enabling the development of a quantitative sustainability system based on probability–impact relationships. A Europe-wide assessment of 57 Mt of polymeric waste highlights that environmental burdens are concentrated in countries with high polymer production and consumption, emphasizing the importance of energy mix, recycling efficiency, and waste management strategies. Overall, this work demonstrates that digitalized LCA coupled with ML offers a powerful decision-support framework for sustainable polymer design, recycling optimization, and circular economy policy development, supporting the transition toward low-carbon and resource-efficient polymer systems in Europe.

1. Introduction

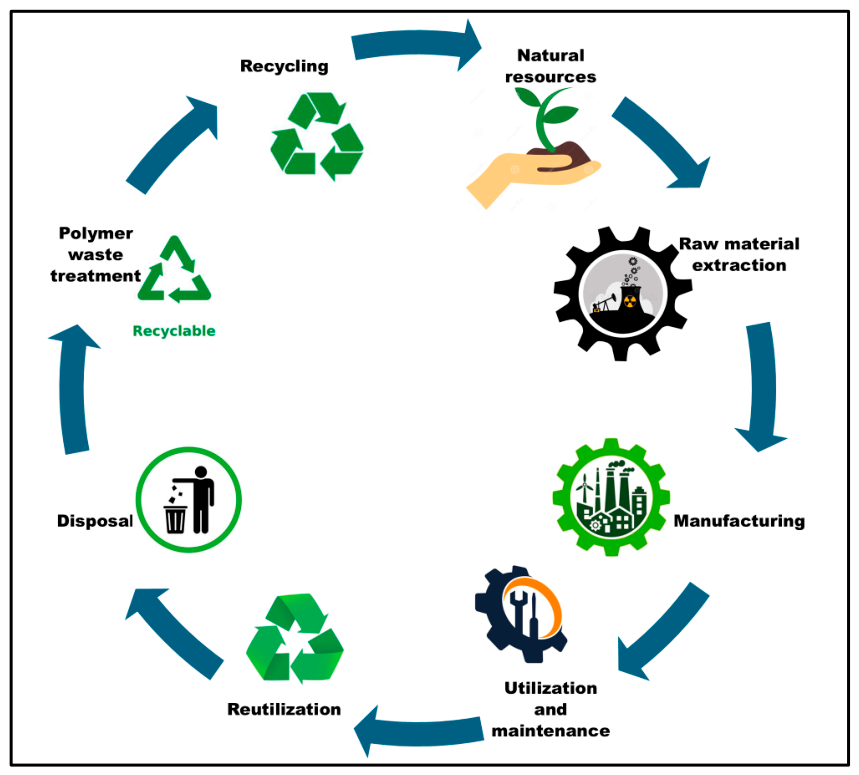
Life cycle assessment (LCA) is a tool used for assessing the environmental aspects and potential impacts connected with products, processes, and services using inventories, materials, emissions, and waste inputs. LCA implies stages of scope, inventory analysis, impact assessment, and interpretation of results. Control of emissions, governing industrial environmental policies, impacts, and solutions are suggested using LCA and life cycle impact assessment (LCIA) [1,2,3]. Conceptually, LCA provides circular, green manufacturing, industrial ecology, and design for production-ecology balance, environmental auditing, and prevention of pollution creation. Natural resources, extraction of polymeric materials, manufacturing, disposal, and recycling are important elements of LCA [4,5]. However, elements of utilization, maintenance, reuse, and waste treatment are additional parameters for LCA evaluation [6]. Functions, functional units, and reference flows describe the purpose of LCA. LCA follows process and input-output approaches regarding data validation using the European reference life cycle and international life cycle databases [7,8]. Allocation of inputs, outputs, unit processes, and sub-processes is done using International Organization of Standardization (ISO) 14040 [9]. Gaseous emissions, use of natural resources, extraction, climate change, global warming, use of water, resource depletion, human toxicity, ozone depletion, and other impact categories are assessed using LCA and LCAI. These impact categories are evaluated during, at mid, and at the end points. Other standards like ISO 14067, ISO 14044, ISO 14020, ISO 14021, ISO 14024, ISO 14025, and ISO 14026 are used for carbon footprints, greenhouse gas emissions, and environmental labels [9,10,11,12]. Product declaration is also involved in these standards. Product declaration helps in the identification of upstream, core, and downstream processing during LCA. Finally, the interpretation of LCA results is carried out using the identification of issues, completeness, sensitivity, and consistency checks. Conclusions, recommendations, and critical reviews are also considered. LCA and LCAI start by identifying key processes, elements, and components [13,14].
The initial stages of LCA are the origin of natural resources and the extraction of polymers from crude oil. Greenhouse gas emissions, resource depletion, and energy resources are impacts associated with LCA [15,16]. Polymer production is an additional stage of LCA that includes impacts of higher utilization of energy, chemical emissions, and the creation of toxic by-products. In the next step, the manufacturing of polymeric products refers to the cradle-to-gate nature of LCA [17]. Regarding impacts, energy, waste usage, emissions during processing, and waste generation are the main parameters for evaluation. Additionally, for manufacturing and applications, the polymers are categorized into standard, engineering, high-performance, and ultra-high-performance forms [18,19]. During usage, maintenance, and reuse, durability and performance are reviewed during LCA. In these steps, polymers generate comparably low impacts. However, the utilization of polymeric materials produces a variety of waste, like pre-consumer, post-consumer, end-waste, and end-of-life waste. Landfills and incinerators give rise to methane and other emissions. Advantages are comparison of polymers, ecological design, manufacturing industries, selection of polymeric materials, and evaluation of the degree of sustainability [20,21]. Academic research and commercial industrial software tools are usually needed to calculate the environmental impact parameters [22].
Commercial and open-source software tools are introduced for the analysis of environmental impacts and life cycles of polymeric materials, waste, and products. SimaPro and GaBi are commercial software tools [23,24]. SimaPro is mostly utilized for industrial and academic LCA of polyethylene terephthalate (PET), polypropylene (PP), polyvinyl chloride (PVC), polyethylene (PE), polylactic acid (PLA), bioplastics, and respective derived composites [15,25,26]. Agriculture footprints, end-of-life assessment, governance of polymer synthesis, in-depth evaluation of manufacturing, and transparency in outcomes are main features of the SimaPro software tool [27,28,29]. The GaBi software tool is introduced for the LCA of polymers, composites, life cycle costing, production allocation, supply chains, and energy consumption [30]. Similarly, Open LCA and Python-based Brightway2 provide LCA of commercial, bio-based polymers, and comparisons, respectively. Compatibility with Ecoinvent and ReCiPe is the main feature of Open LCA and Python-based Brightway2 software tools [31,32,33]. Other attributes involve web-based calculations, assistance with complex polymer assessments, alteration in inputs, and transparent solutions. Umberto LCA+ is a commercial software tool introduced for flow visualization and materials tracking. The development of Sankey diagrams and comprehensive flow modeling is the main feature of Umberto LCA+. Umberto LCA+ assists in the visualization of complex polymer manufacturing systems [34,35,36]. Among software tools, OpenLCA provides a high-quality database to address the outdated models, hotspots, and incompleteness of sources. Additionally, the integration of OpenLCA with Python, artificial intelligence, machine learning studies, and algorithms unlocks new horizons regarding environmental impact analysis [37,38,39,40].
OpenLCA can be integrated with Python programming and algorithms to achieve TensorFlow for prediction and modeling. Integration of LCA with Python enables sensitivity analysis, automation, visualization of complex manufacturing systems, and digitalization. Machine learning (ML) is an additional outcome of OpenLCA-Python integration. Additionally, OpenLCA-Python dual combination with PyCharm provides advanced insights for the prediction of LCA indicators [41,42,43]. Advanced visualizations forecast raw materials handling, produce new paths for lowering polymeric waste, and process large data sets. OpenLCA-Python integration assists in discovering new directions for consideration as well as the implementation of the concept of circularity. The addition of ML studies can commence in advance with the scenarios of waste treatments, recycling methods, new techniques for waste handling, and models for the occurrence of environmental impacts. Besides artificial intelligence (AI), the creation of Python software command scripts along with PyCharm ML algorithms can be introduced for LCA of polymeric products and manufacturing systems to bring in automation and digital modes of operations. OpenLCA normalized the numerical values of LCA indicators. However, OpenLCA-Python integration can predict the possible lowest and highest values of environmental impact indicators. The lowest and highest values of LCA indicators define the system boundaries. Furthermore, ML algorithms and Monte Carlo Simulations can help in the development of standard sustainability systems [44,45].
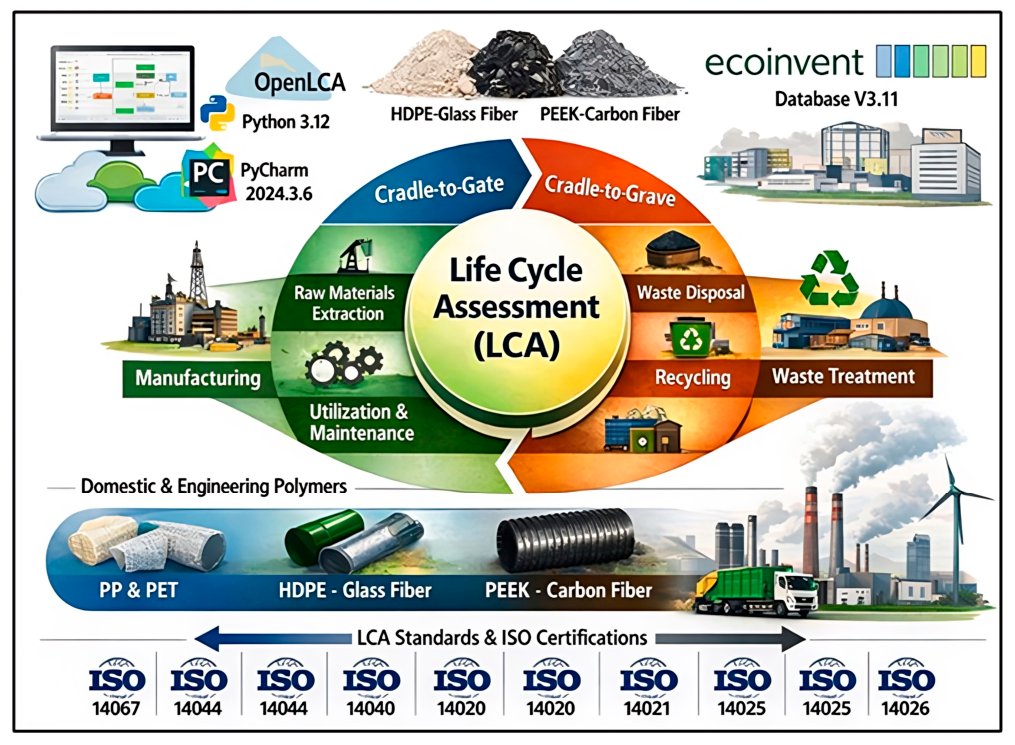
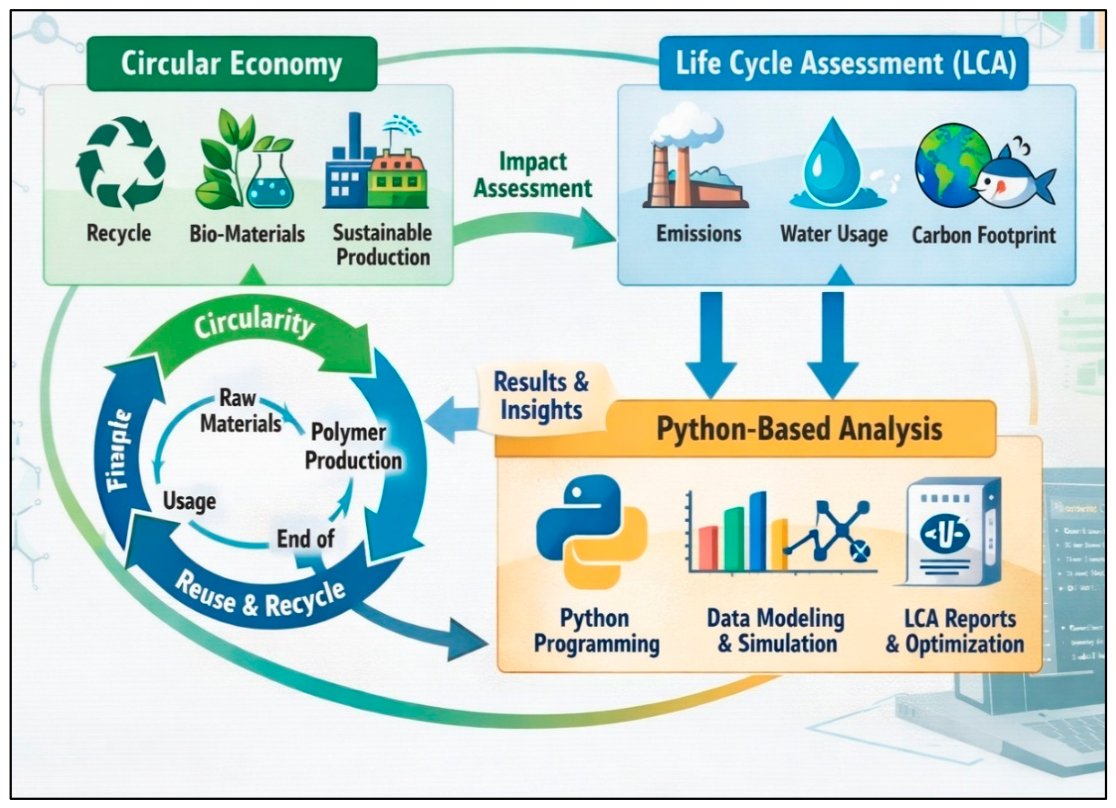
The current article novelly elaborates on the LCA of PP-PET- cotton (CT), HDPE-glass fiber (GF), and PEEK- carbon fiber (CF) composites. Open LCA, Python 3.12, and PyCharm 2024.3.6 are utilized for modeling, visualization of complex polymer manufacturing systems, and ML algorithms. The Ecoinvent V3.11 database is introduced for LCA and LCAI, see Figure 1. The research is designed to evaluate almost all types of polymeric waste present in Europe. Domestic (PP and PET), engineered high-density polyethylene (HDPE), and strategic polyether ether ketone (PEEK) forms of polymers are selected for pilot as well as industrial evaluations regarding LCA. Cradle-to-gate LCA is carried out for the presence of natural resources, raw materials’ extraction, and manufacturing. Utilization, maintenance, and reuse are considered for service life and LCA. Similarly, cradle-to-grave LCA is introduced regarding waste disposal, waste treatment, and recycling. ISO 14067, ISO 14044, ISO 14020, ISO 14021, ISO 14024, ISO 14025, and ISO 14026 standards are utilized regarding LCA, LCAI, and results demonstration. Additionally, the goal of this study is to develop a computational LCA framework for evaluating the environmental impacts of representative European polymeric waste streams and recycled composite systems using OpenLCA, Ecoinvent v3.11, Monte Carlo simulation, and Python-based data analytics. The framework is intended to support sustainable material selection, recycling optimization, and circular economy decision-making for polymer manufacturing industries.

2. Materials and Methods

2.1. Description and Selection of European Polymeric Waste for LCA

The current capacity of European (EU) post-consumer polymeric waste is 57.2 million tons (Mt). Table 1 shows the distribution of waste in different countries of the EU. The amount of each individual polymer and respective waste is derived from an EU annual report for the distribution of post-consumer material in different countries.

2.2. Python-Based AI—Assisted LCA and Modeling

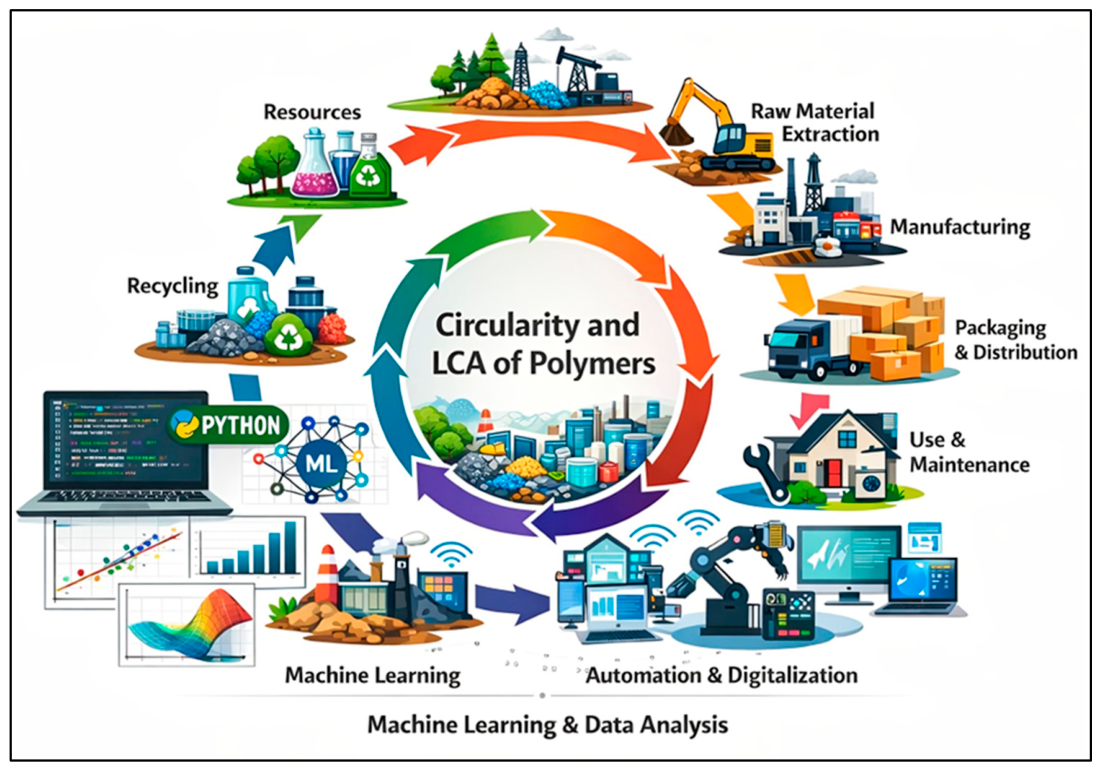
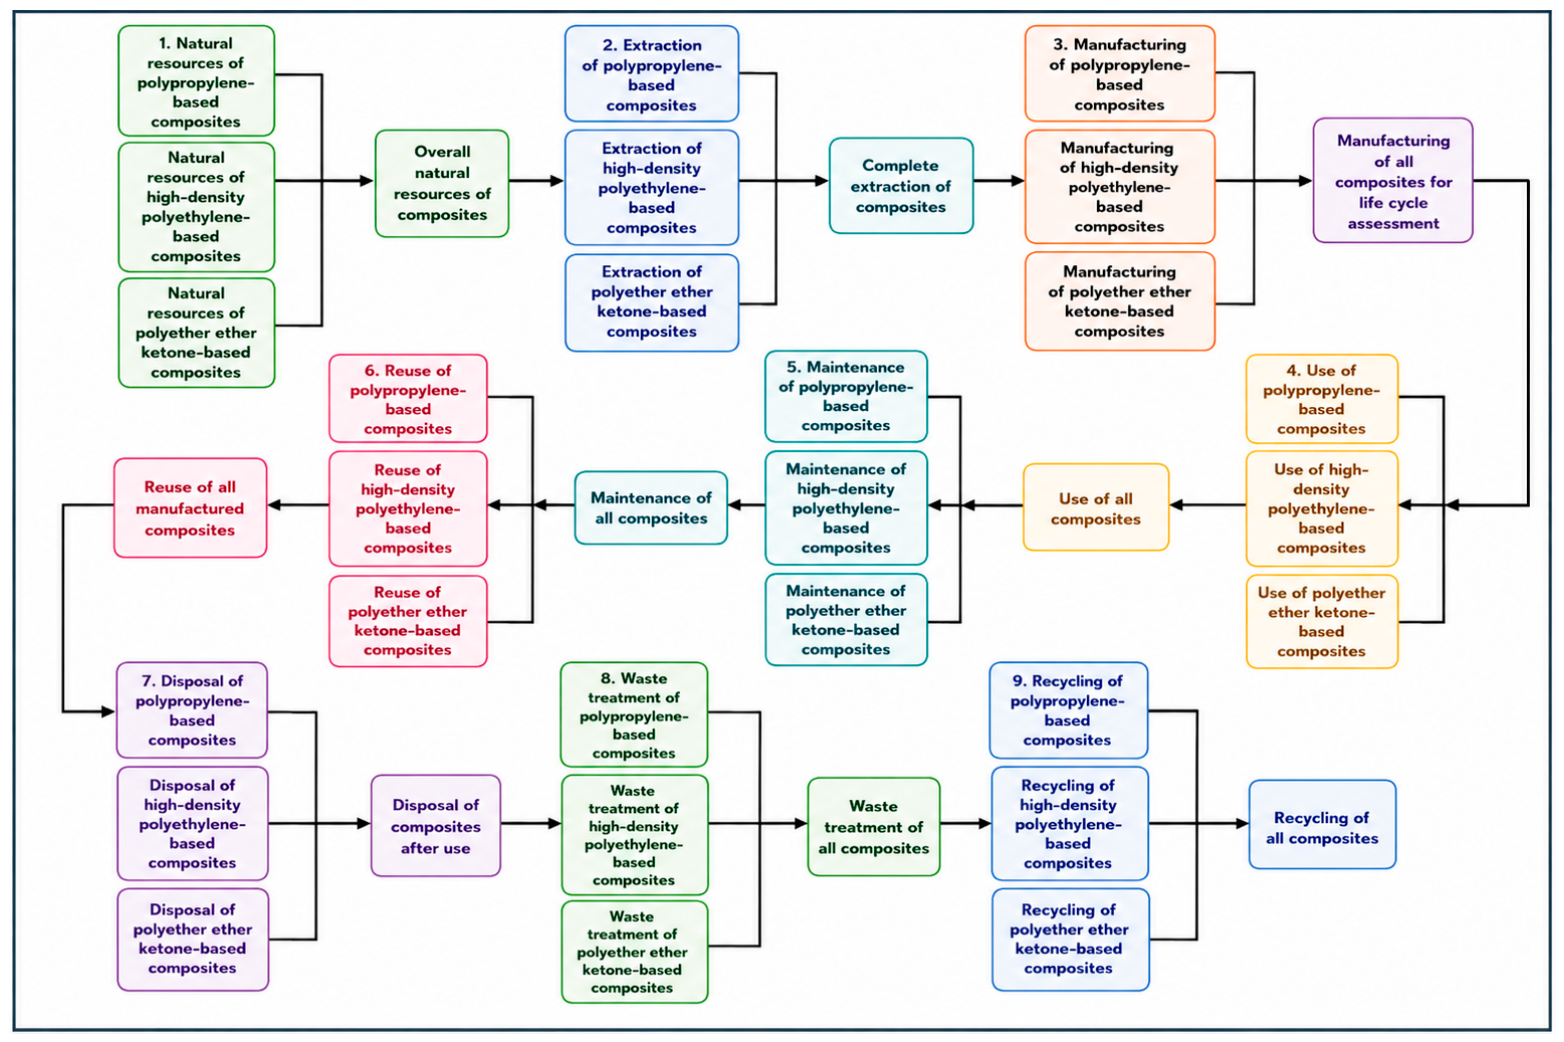
OpenLCA 2.5.1 software tool and Ecoinvent V3.11 Cutoff Unit-Process 2025-01-31. Zolca databases are introduced regarding the LCA of European polymeric waste. PP, HDPE, and PEEK PC matrix waste and CF, GF, and CF phases are selected as reinforcements, respectively. LCA elements like resources, extraction of raw materials, manufacturing, packaging, distribution, use, maintenance, reuse, disposal, waste treatment, and recycling are considered according to the Swiss Federal Office for the Environment (BAFU, 2022–2025, Source: Ecoinvent, 2025), see Figure 2. Additionally, the flow of each respective proposed polymeric material waste is considered regarding modeling, LCA, and LCIA. The following flowchart is adopted for research: Goal & Scope → Functional Unit → Inventory → OpenLCA → Monte Carlo → Python → Results. In this study, the end-of-life category “disposal” was disaggregated into sanitary landfill, municipal solid waste incineration with energy recovery, and residual waste treatment scenarios using representative European datasets from Ecoinvent v3.11. Incineration processes were modelled as waste-to-energy systems generating electricity and/or district heat according to the cutoff allocation approach [46,47,48].

2.3. Input Flows and Output Processes of Modeling

According to industrial considerations, polymers exist in domestic, engineering, and high-performance forms (strategic applications). Table 2 shows the potential for post-consumer waste in Europe. PP, HDPE, and PEEK are selected as matrix materials for the input flow for the output processes. Input flows of each individual element (mentioned in Figure 2) were created in the OpenLCA 2.5.1 software tool using Ecoinvent V3.11 Cutoff Unit-Process 2025-01-31. Zolca database for LCA. In the next step, the created flows are linked to process inputs for creating respective product systems. Cotton, glass, and carbon reinforcements have been introduced for PP, HDPE, and PEEK polymers for manufacturing thermoplastic composites. Additionally, PET was introduced as a filler regarding the fabrication of PP-cotton-based composites. Additionally, the reference flow required to fulfill the functional unit consisted of the material inputs necessary to produce 1 kg of the composite system, including polymer matrix, fillers, reinforcement phases, energy demand, transport, and waste treatment operations.
The functional unit was defined as 1 kg of polymer composite material processed throughout its life cycle (raw material extraction, manufacturing, use phase, and end-of-life). For European-scale scenario analysis, results were linearly upscaled using annual waste quantities (Mt/year) reported for European countries. Initially, 10 kg of PP, HDPE, and PEEK were introduced for LCA and laboratory-scale production of PP-PET-Cotton, HDPE-GF, and PEEK-CF composites. Regarding PP-based composites, 20% of cotton reinforcement and 40% of PET fillers are utilized for manufacturing. However, 40% of GF and CF are used for the fabrication of HDPE-GF and PEEK composites. For industrial impact and large-scale production, the amount of polymer matrices and mentioned reinforcements is considered in Mt. Glass fiber reinforcement was modeled using Ecoinvent datasets, with silica sand included as the primary upstream raw material in the life cycle inventory.

2.4. Implementation of Product Systems and Projects for Results Interpretation

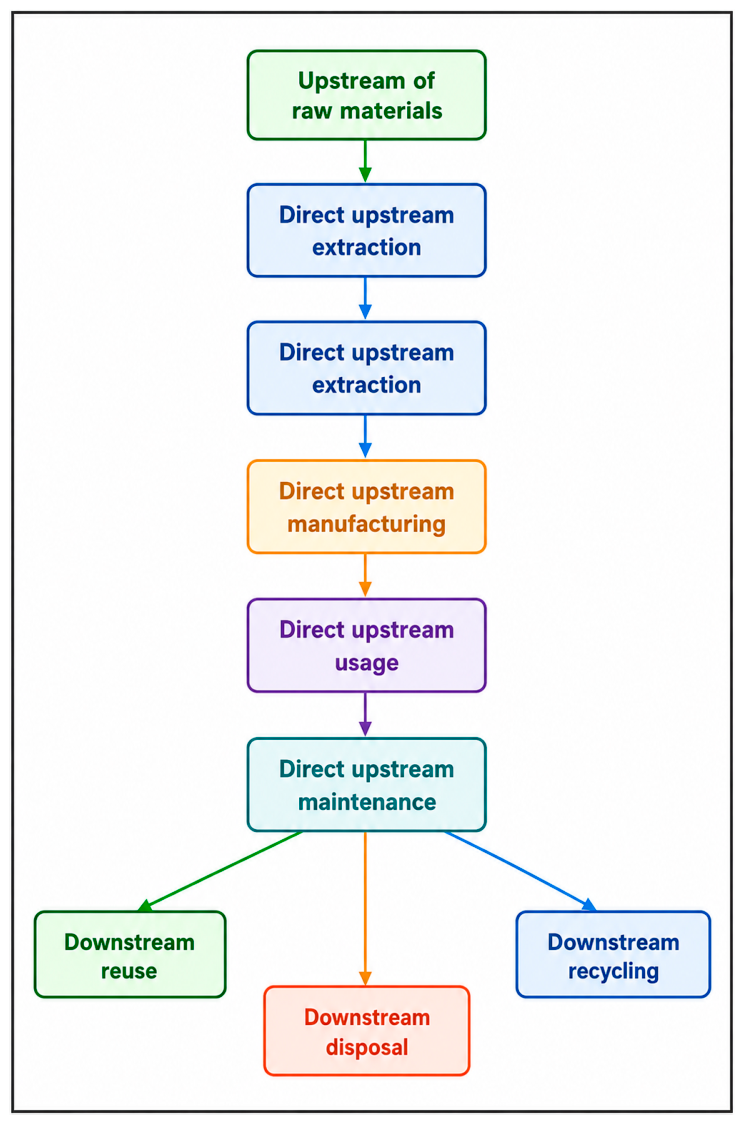
Product systems were developed on the OpenLCA 2.5.1 software tool using Ecoinvent V3.11 Cutoff Unit-Process 2025-01-31 for the interpretation of results. The distribution of amounts of PP, HDPE, PEEK matrices, cotton, GF, CF reinforcements, and PET fillers was determined for each element of LCA using model graphs. Input flows as well as output processes are linked to two hundred thousand European and global providers using the EF v3.1 impact assessment method. Normalization and weighting of results are set using EF v3.1 Global Reference 2010. Lazy-on-demand, Eager-All, and Monte Carlo Simulation types of calculations are considered regarding Cradle-To-Gate, service life, and Cradle-To-Grave assessments. About one hundred thousand iterations of each LCA indicator are considered to calculate outcomes as mean, median, and standard deviation values. The probability of occurrence of each LCIA indicator is defined between zero (0) and one (1) using Monte Carlo Simulations. A cradle-to-grave boundary system was adopted. Upstream processes include feedstock extraction and polymer synthesis; core processes include composite manufacturing; downstream processes include use, reuse, recycling, incineration, and landfill treatment. The final projects were created on the OpenLCA 2.5.1 software tool using Ecoinvent V3.11 Cutoff Unit-Process 2025-01-31 for comparison of results.
The LCA was initially performed using a normalized reference system of 10 kg of polymer composite material to ensure consistency in modeling. To extend the results to country-level scenarios, a linear mass-based scaling approach was applied. The environmental impacts were calculated using the following relationship:
Impact country = Impact reference × (Waste country/10 kg)
where impact reference represents the LCA results for the 10 kg system, and waste country corresponds to the annual polymer waste generation for each country, expressed in kilograms. For example, 1 Mt was converted to 1 × 10⁹ kg before scaling. This approach assumes proportionality between mass flow and environmental impact, which is consistent with standard LCA scaling practices. This scaling method enables comparison across countries while maintaining consistent process coefficients, system boundaries, and inventory assumptions.

2.5. LCA and Python-Based ML Studies

OpenLCA is coalesced with Python 3.12 and PyCharm 2024.3.6 software tools regarding ML studies and algorithms. The OpenLCA 2.5.1 software tool, along with the loaded Ecoinvent V3.11 Cutoff Unit-Process 2025-01-31 database, is opened in inter-process communication mode in Python using Olca_ipc and Olca_schema command packages. Multi-output recycling and waste treatment processes were modeled using the Ecoinvent cutoff approach, where recyclable secondary materials leave the first product system burden-free and subsequent recycling burdens are assigned to the next life cycle. The Olca_ipc and Olca_schema command packages enable running and creation of data sets for OpenLCA 2.5.1 in Python 3.12, respectively. The developed product systems are fetched from the OpenLCA 2.5.1 software tool and the Ecoinvent V3.11 Cutoff Unit-Process 2025-01-31 database. LCIA is carried out by loading EF 3.11 midpoint, end point, or ReCiPe 2016, respectively. Scenario sweeps are considered to achieve the possible lowest, highest, medium, standard deviation, and probability values regarding the development of sustainability systems for each individual European country. The integration process is depicted in Figure 3. Initial simulations were performed on a 10 kg scale to establish normalized process inventories and verify product system consistency. Environmental impacts were then scaled proportionally to European annual waste quantities (Mt/year) under the assumption of linear inventory scaling for mass-based thermoplastic systems. Sensitivity analysis was conducted to acknowledge that industrial economies of scale may reduce impacts per kg.

2.6. Innovative Systems of Sustainability

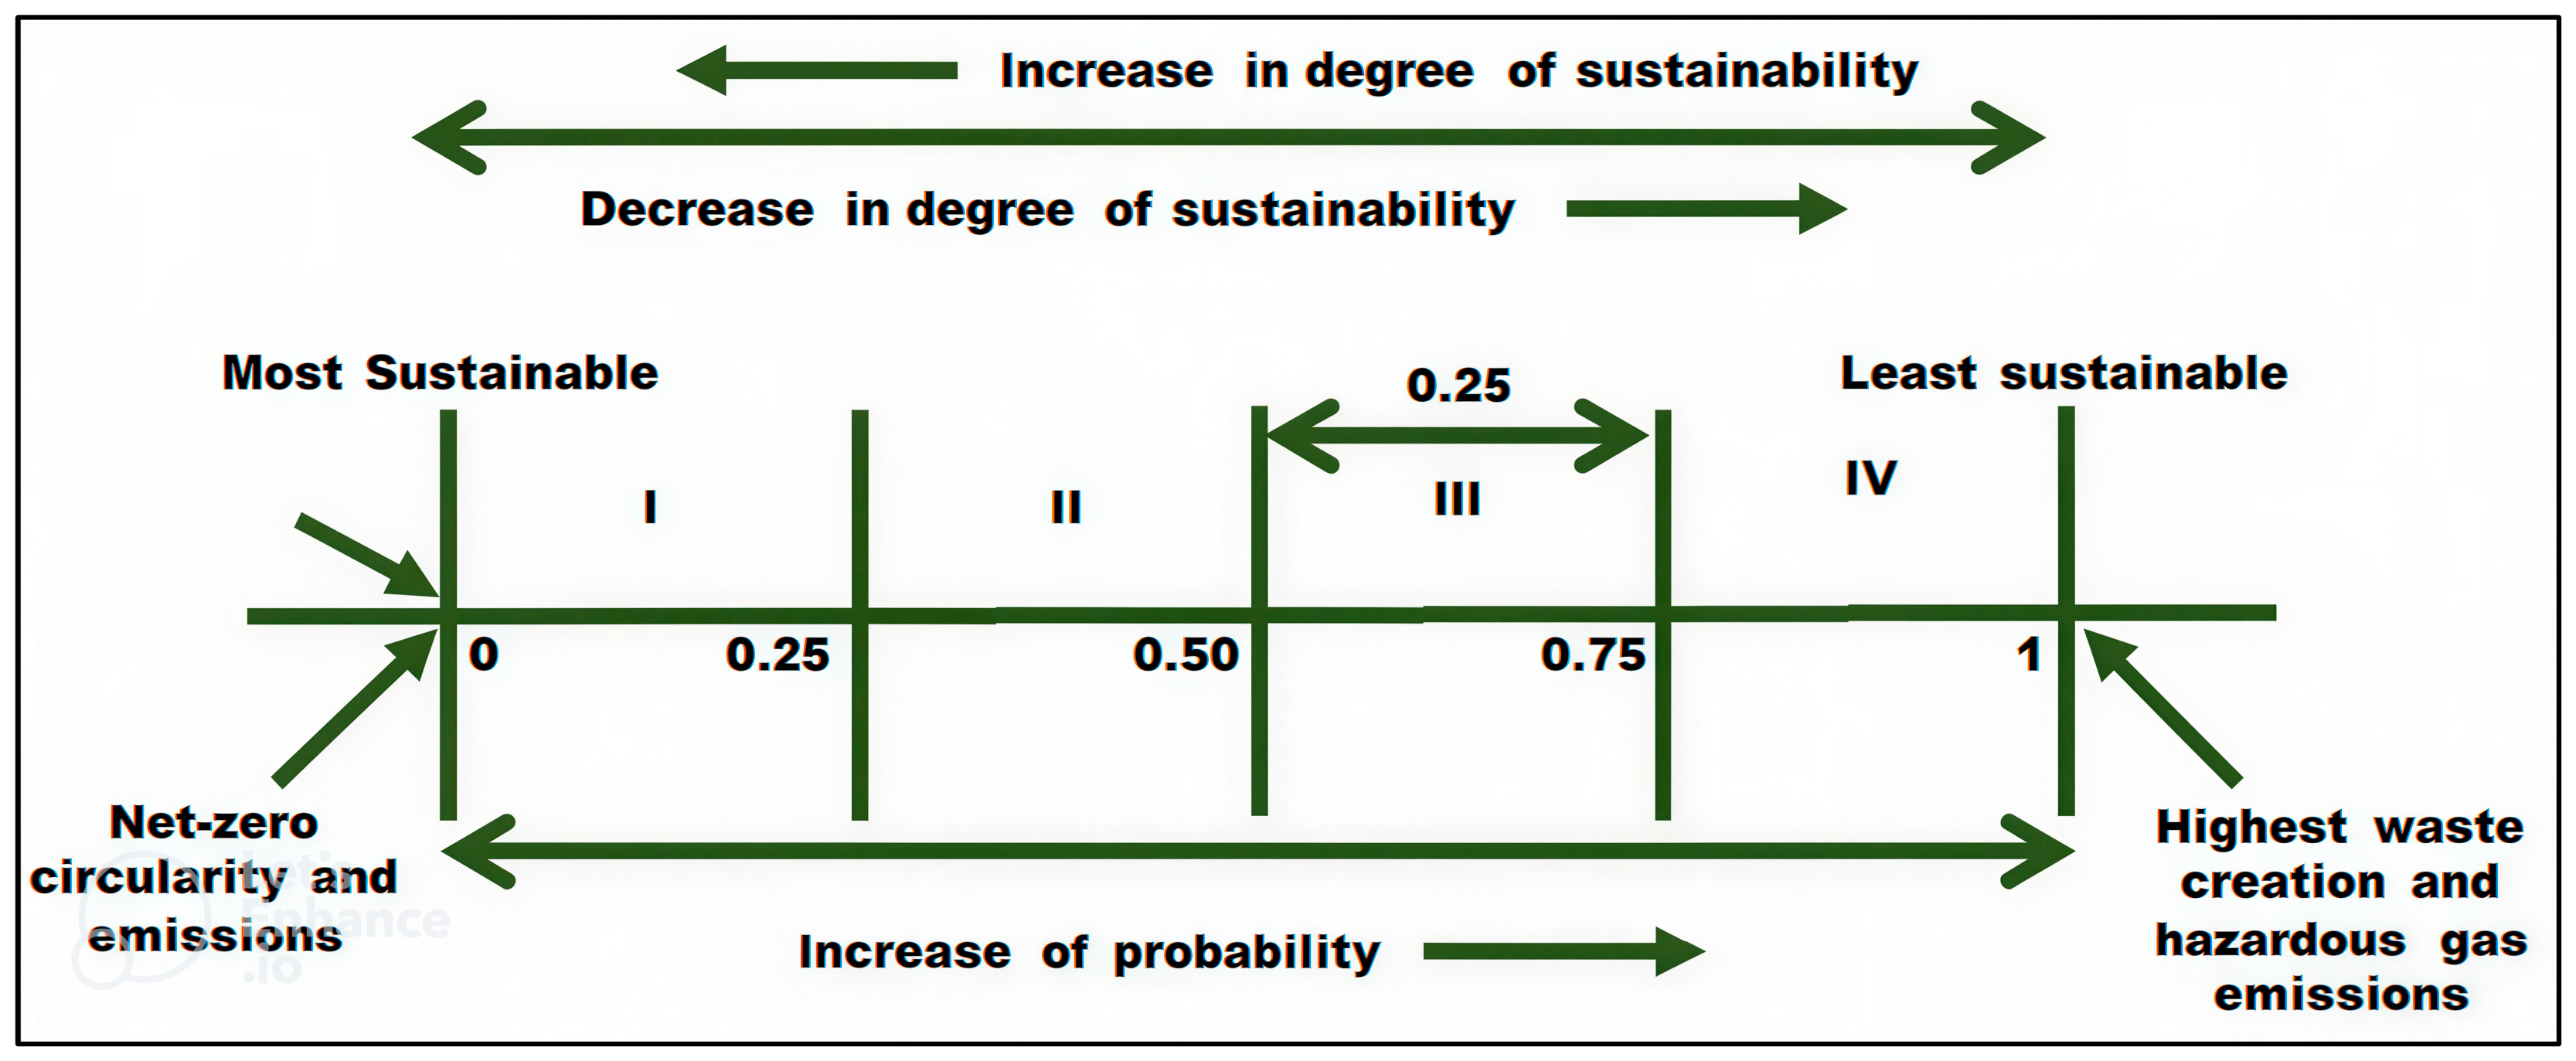
A sustainability system was created for the evaluation of the LCA of polymeric materials and waste. The system consists of vertical tick marks on a parallel line. The numerical values 0 (extreme left) and 1 (extreme right) represent the most sustainable and least sustainable environments, see Figure 4. The sustainability system is linked to the probability outcomes of indicators of LCIA. The sustainability system is divided into four linear quadrants regarding the occurrence of each LCIA indicator. In developed systems, the degree of sustainability is inversely proportional to probability. Mathematically:
Sustainability     1 P r o b a i l i t y
Stochastic variability is introduced to yield mean, standard deviation, and median regarding each individual LCA impact indicator. Uncertainty is evaluated to designate probability (inversely sustainability) for each European country for central tendencies and robustness. End-of-life scenarios were modeled using country-specific average recycling, energy recovery, and landfill shares derived from European waste statistics. Transportation distances and treatment efficiencies followed Ecoinvent default datasets. The scaling approach does not fully capture nonlinear industrial effects such as process intensification, regional logistics, or dynamic market substitution; therefore, results should be interpreted as comparative scenario estimates rather than exact national inventories [49,50,51].

2.7. Python-Based AI-Assisted ML Studies

ML models were developed in Python (Scikit-learn) to predict selected LCA indicators from material composition and process parameters. Python-based AI-assisted ML was implemented in PyCharm using pandas, NumPy, scikit-learn, and matplotlib. The dataset included polymer waste quantity and LCA elements (Figure 2) input variables, while environmental impact indicators such as CO2 emissions, fossil energy demand, human toxicity, eutrophication, and resource depletion were used as output targets. Supervised regression models, including Random Forest Regression, were trained and validated using train-test splitting and k-fold cross-validation. Model performance, like R2, MAE, and RMSE, is not calculated. Feature-importance analysis was used to identify the dominant parameters controlling environmental burden and to support AI-assisted scenario optimization. The flowchart is described as: input variables + output targets + ML algorithm + training/testing split + validation + performance metrics + feature importance.
Sustainability was assumed to be inversely related to the probability of exceeding environmental burden thresholds derived from uncertainty simulations. The calculations were based on median dataset values and the relative threshold of the highest performing polymer scenario. The index is comparative and intended for screening-level sustainability ranking rather than absolute environmental certification. A probabilistic sustainability index was developed using Monte Carlo outputs. For each impact category, the exceedance probability of a benchmark value was calculated. Lower exceedance probability indicates greater environmental robustness and therefore higher sustainability.

3. Results and Discussions

3.1. Standard Model Graphs

The successful development of product systems regarding LCA of PP, HDPE, and PEEK is shown in Figure 5. The product systems exhibit cradle-to-gate, service life, and cradle-to-grave natures. About 38 Mt, 11 Mt of naphtha crude oil is needed for the extraction of 10 Mt of PP and 6 Mt of HDPE. PEEK is not directly extracted from crude oil. However, 4 Mt of hydroquinone produced 2 Mt of PEEK. The extraction of filler (PET) and reinforcements (cotton, GF, and CF) is mentioned in Table 3. About 7.5 Mt of Naphtha, 3 Mt of organic cotton, 1500 Mt of silica sand, and 2 Mt of acrylonitrile are required to produce 5 Mt of PET, 1 Mt of cotton fiber, 2.4 Mt of GF, and 0.80 Mt of CF raw materials, respectively. Therefore, available raw materials can be utilized for manufacturing PP-PET-Cotton, HDPE-GF, and PEEK-CF composites with various matrices and fiber loading. After manufacturing composites (3rd step of LCA), the designed products are ready for specific commercial applications. These three steps are termed as cradle-to-gate regarding LCA.
Utilization, maintenance, and reuse are categorized in service life regarding LCA. Amounts of matrices, fillers, and reinforcements remain constant for utilization and maintenance of produced composites, see Table and Figure 5. However, marginal lowering in amounts of matrices (PP, HDPE, and PEEK), PET filler, and reinforcements (cotton, GF, and CF) were observed. About 10–20% of waste is generated due to product utilization. The durability, lightweight, and quality of manufactured products result in the creation of the lowest environmental impacts. Similar outcomes are observed during LCA and LCAI. Lowering the amounts of each individual matrix, filler, and reinforcement material is transformed into respective waste. Industrially, waste appears in the forms of pre-consumer, post-consumer, end-waste, and end-of-life. Pre-consumer and post-consumer waste are mostly recycled. However, end-waste and end-of-life waste are utilized for energy production and landfills.
The cradle-to-grave nature of LCA deals with disposal, recycling, and waste management. The total capacity of EU plastic production is 60 Mt. However, the recycling capacity of the EU is 51 Mt, see Table 1, Table 2 and Table 3. The distribution of each individual plastic is mentioned in Table 3. According to the model graph (Figure 5) and Table 3, the amount of waste remains constant for disposal, waste treatment, and recycling. However, due to a lowering in durability, quality of manufactured products, and downstream processing, the degree of pollution in the environment, toxicity, and gas emissions is enhanced. The clear visualization of input flows, outputs, processes, and product systems is carried out using a Sankey diagram.
Environmental results were generated through the following sequence: Inventory datasets → OpenLCA product systems → LCIA (EF v3.1/ReCiPe) → Monte Carlo uncertainty simulations → Python-based post-processing and scenario analysis.

3.2. Sankey Diagram

The Sankey diagram provides a clear understanding of the visualization of product systems. Figure 6 and Table 4 present qualitative and quantitative analyses of energy, materials, and emissions. Raw materials’ extraction, manufacturing, usage, recycling, and disposal of matrices (PP, HDPE, and PEEK), fillers, and reinforcements contribute extensively to energy utilization and emissions. In these stages, the matrices and reinforcements contribute 70–80% and 20–30% regarding emissions, energy usage, and environmental impacts, see Table 4. The extraction of crude oil, polymerization, and manufacturing of PP-PET-Cotton, HDPE-GF, and PEEK-CF produce major hotspots regarding gas emissions and impacts. Usage, maintenance, and even reuse accommodate low impacts due to higher quality and performance. However, downstream disposal and recycling of polymeric materials have environmental impacts lower and higher than service life and upstream (cradle to gate), respectively. Similarly, transportation, inventory, storage, and electricity usage of polymer materials and minerals produce minute environmental impacts (in the range of 0.042–5%) regarding each individual element of LCA. This behavior of matrices, fillers, and reinforcements makes transportation, inventory, storage, and electricity usage sustainable in nature. A comprehensive description of environmental indicators with calculations is required to predict the individual effects of resources, extraction of raw materials, manufacturing, packaging, distribution, use, maintenance, reuse, disposal, waste treatment, and recycling elements in LCA.

3.3. Natural Resources and Extraction of Polymeric Raw Materials

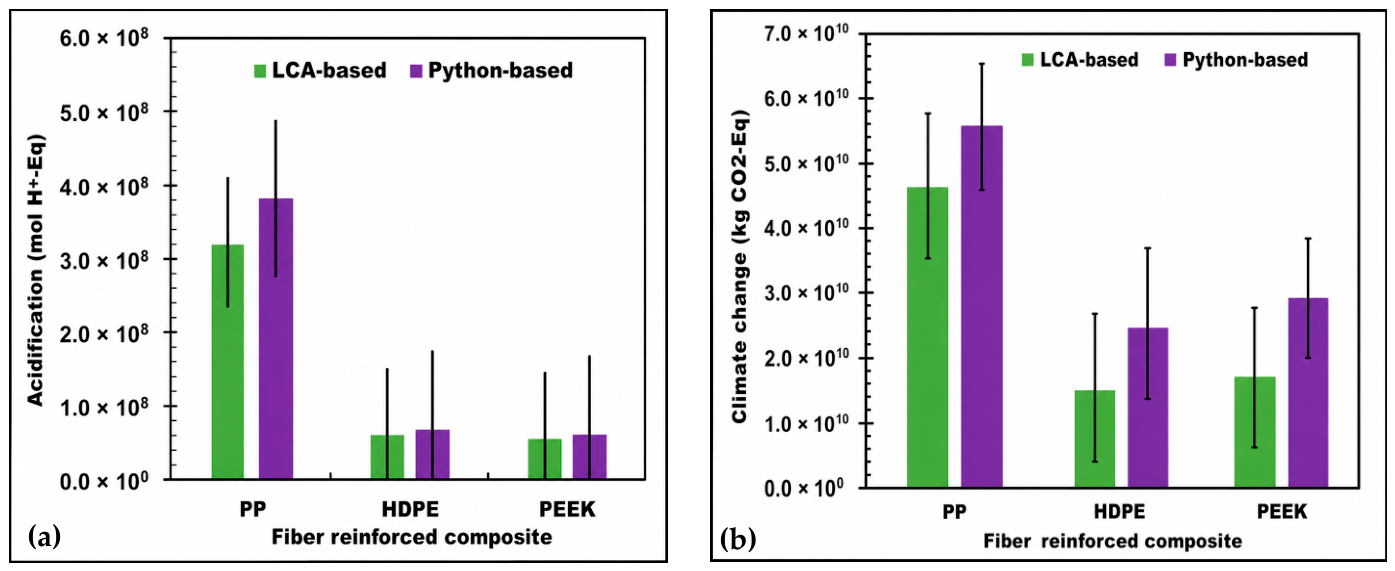
PP is derived from gas oil and naphtha in the process of steam cracking. 40 Mt of gas oil and naphtha are needed to produce 10 Mt of PP. Similarly, 8 Mt and 3 Mt of Naphtha and seed cotton are required to produce 4 Mt and 2 Mt of pure PET and cotton fabric, respectively. HDPE is obtained from naphtha. 11 Mt of naphtha crude oil is required for the extraction of 6 Mt of HDPE. Extraction of GF reinforcement from silica sand follows different paths. 1500 Mt of silica sand is required to extract 2.4 Mt of GF. PEEK and CF are derived from hydroquinone and acrylonitrile. 4 Mt of hydroquinone and 2 Mt of acrylonitrile are essential for the extraction of 2 Mt of PEEK and 0.80 Mt of GF raw materials. The highest values of acidification and climate change of PP-PET-cotton composites are in the range of 3.2 × 10⁸–4.0 × 10⁸ mol H+-Eq and 4.7 × 10¹⁰–5.5 × 10¹⁰ kg CO2-Eq, respectively, regarding LCA and Python-based analysis. The description is mentioned in Figure 7a,b.

3.4. Manufacturing of Composite Systems

According to developed model graphs (Figure 5) and Sankey Diagrams (Figure 6), the manufacturing of PP-, HDPE-, and PEEK-based composite systems has a huge impact on the environment. In view of climate change, PP-based composite systems produce the highest carbon emissions in the range of 4.20 × 10⁸–1.20 × 10⁹ kg CO2-Eq regarding climate change: biogenic and climate change: land use and land use change categories, see Table 5. However, PEEK-based composites exhibit the highest value of 5.50 × 10¹⁰ kg CO2-Eq regarding climate change: fossil category. Similarly, the HDPE- and PEEK-based composite manufacturing systems show the lowest values in the range of 6.50 × 10⁶–4.60 × 10⁷ kg CO2-Eq regarding climate change: biogenic and climate change: land use and land use change categories, respectively. Moreover, overall, climate change: biogenic, climate change: fossil, and climate change: land use, and land use change categories create the lowest, highest, and intermediate impacts on the environment regarding carbon emissions. PP-based composite systems were found to be less sustainable. However, the HDPE- and PEEK composite systems were found in mild conditions (more sustainable than PP-based composite manufacturing systems), see Table 5.

3.5. Effect of Utilization and Maintenance on Environmental Impacts

Extraction, raw materials’ utilization, manufacturing, service life, and maintenance of the PP-, HDPE-, and PEEK-based composite product design systems create significant effects on living organisms and ecosystems. The LCA- and Python-based calculations show that PP-based composite designs produce the highest effects regarding ecotoxicity: freshwater indicators. However, utilization of freshwater regarding the HDPE- and PEEK-based composite systems was found to be similar, see Table 6. Higher values of ecotoxicity: freshwater, ecotoxicity: freshwater-inorganics, and ecotoxicity: freshwater-organics exist in the range of 2.40 × 10⁹–7.20 × 10¹² CTUe. Therefore, the level of environmental risk exists at different degrees for each individual EU country. According to the Sankey diagram, LCA elements like manufacturing, utilization, reuse, maintenance, waste treatment, disposal, and recycling of PP- and HDPE-based composite systems are the main contributors to the contamination of the ecosystem. However, the extraction and recycling of PEEK-based composite systems emerged as the main hotspots regarding an increase in values of ecotoxicity indicators, see Table 6.

3.6. Human Health, Land Use, and Material Resource Impact Indicators During Reuse and Disposal

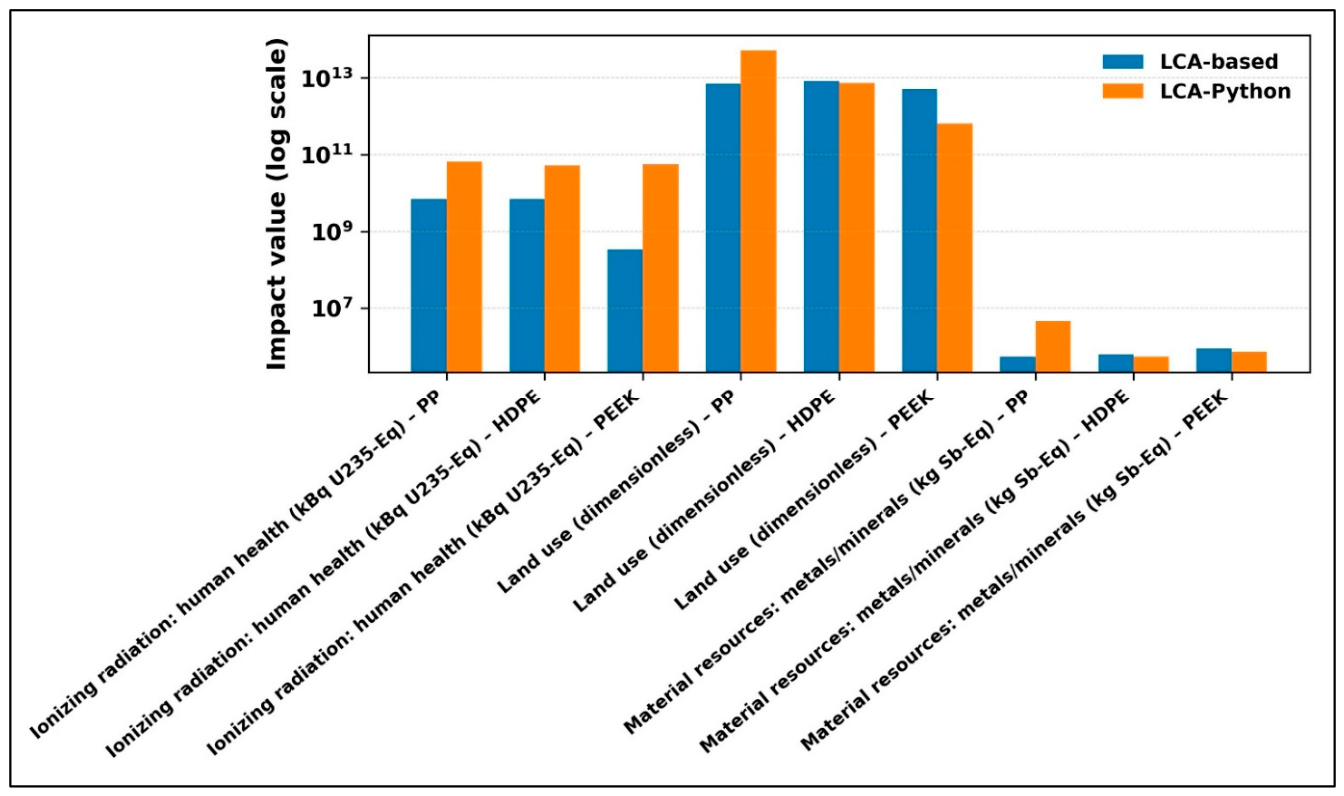
Figure 8 evaluates human health, land use, and materials resources impact categories of PP-, HDPE-, and PEEK-based composites. LCA and Python-based results are consistent and higher than LCA-based evaluations. The log-scale provides wide, mid-range, and lowest level variations regarding land-use (around 1012–1013), ionizing radiation (around 108–1011), and material resources (around 105–107), respectively. Higher values of ionizing radiation (human health) are due to capture of upstream intensities and nuclear energy production. In the case of land use, the highest values are indications of land occupation during raw material extraction, energy supply, and processing stages. The material resources (metals/minerals) impact category demonstrates lower depletion of natural resources.

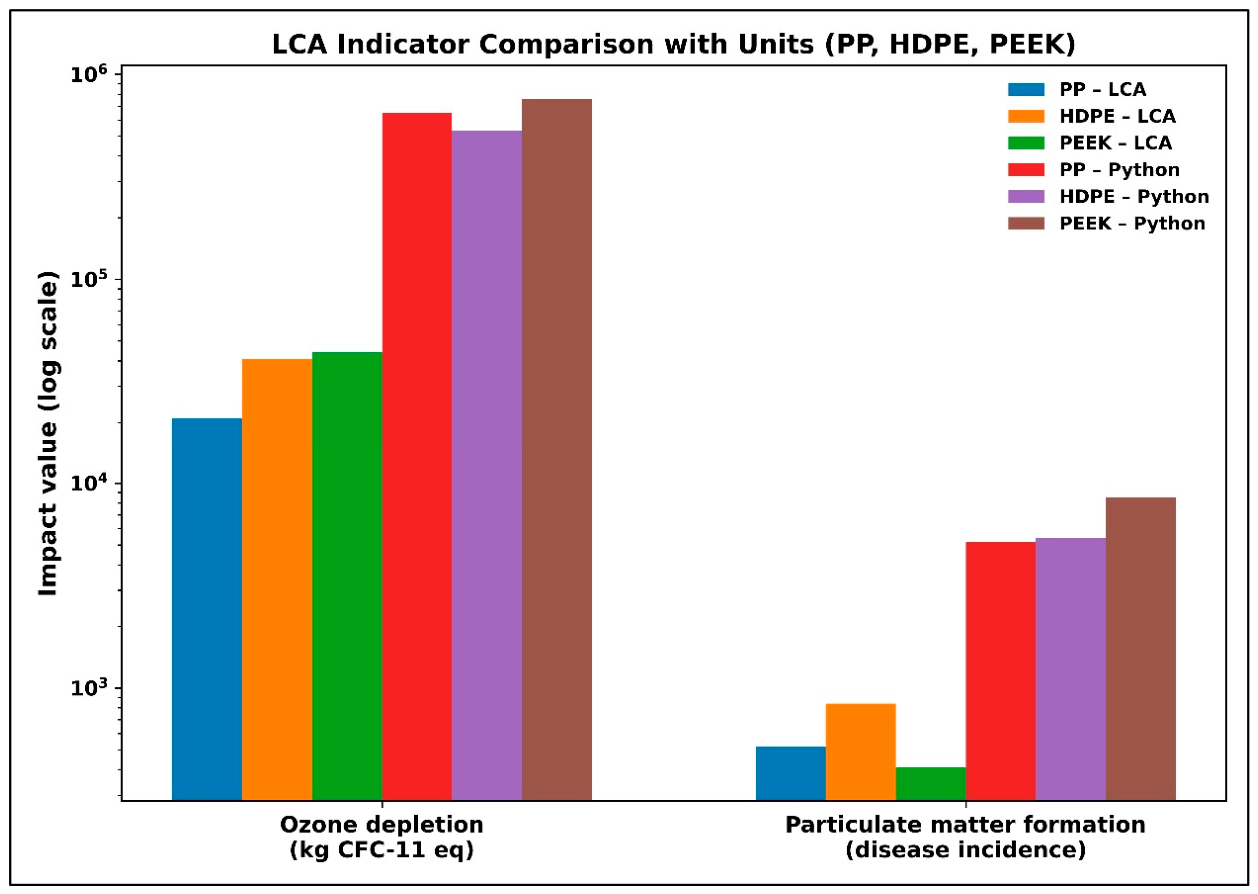
3.7. Waste Treatment Impact Indicators: Ozone Depletion and Particulate Matter Formation

Figure 9 shows the ozone depletion and particulate matter formation impact categories of the PP-, HDPE-, and PEEK-based composite systems. PEEK exhibits the highest impact for both categories. HDPE and PP follow intermediate and lowest impacts. Python-based results are consistently higher than the corresponding LCA evaluated values. Depletion of the ozone layer takes place due to PP, HDPE, and PEEK extraction, synthesis, and energy utilization. LCA and Python-based studies exhibit relatively similar methodological consistency. Therefore, Python-based studies of PP-, HDPE-, and PEEK-based composite systems can be carried out regarding screening, parametric analysis, and AI-driven sustainability optimization in comparison to standard database calibration. Additionally, Figure 9 provides a robust, comparative visualization of polymer sustainability trade-offs and methodological sensitivity regarding polymer waste treatment. The environmental performance of incineration strongly depends on plant efficiency, recovered electricity, and heat utilization, as well as national energy mixes. Therefore, the results reported here represent European-average waste-to-energy scenarios rather than country-specific outcomes.

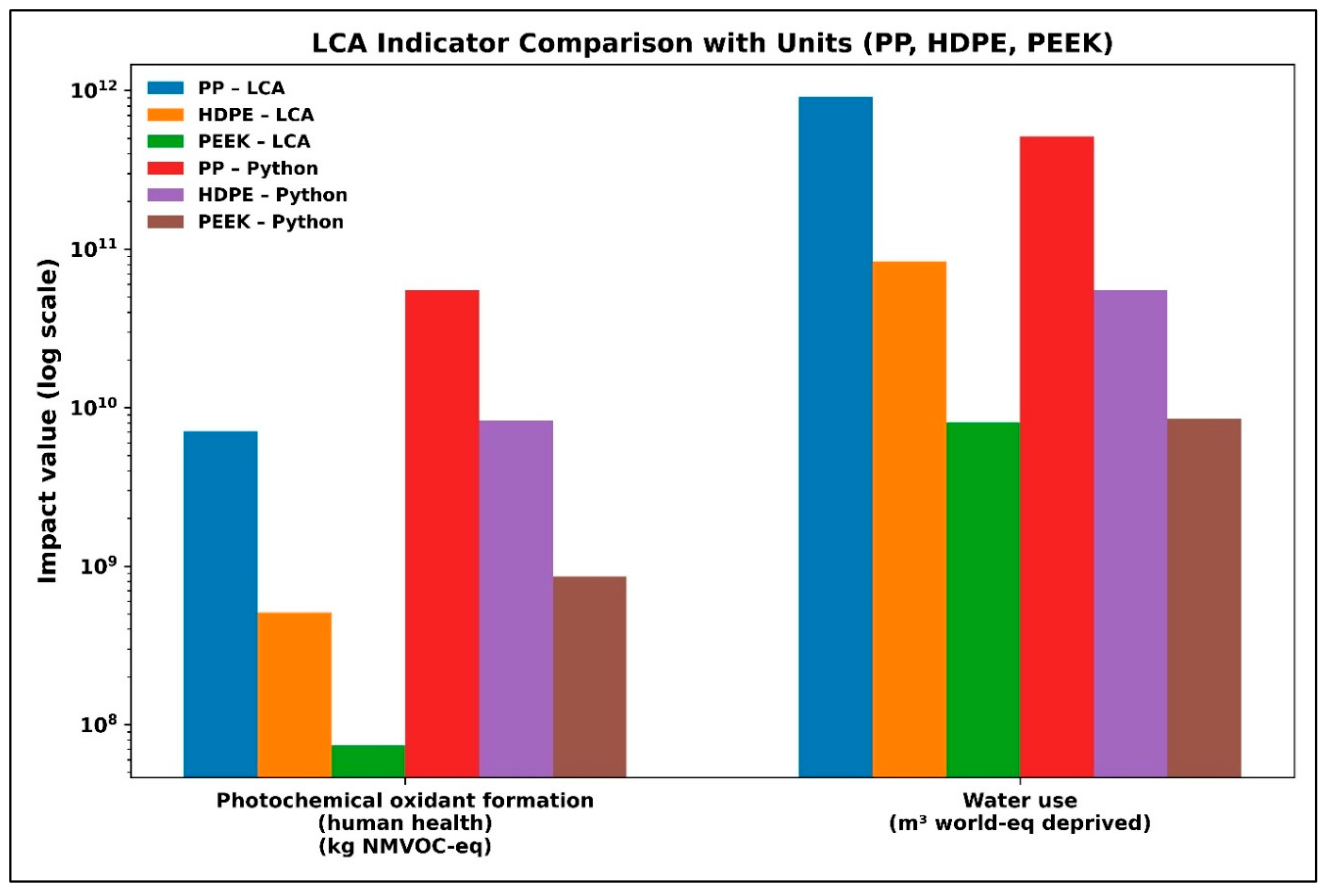
3.8. Recycling Impact Indicators: Photochemical Oxidant Formation and Water Use

Figure 10 shows the photochemical oxidant formation and water use impact categories of PP-, HDPE-, and PEEK-based composite systems. PP has the highest impact regarding photochemical oxidant formation. The HDPE and PEEK-based composite systems follow intermediate and lowest impact regarding photochemical oxidant formation. A similar trend is observed regarding water use. However, Python-based studies of PP-, HDPE-, and PEEK-based composite systems exhibit higher values for photochemical oxidant formation and water use impact categories. Overall, Figure 10 reinforces the robustness of comparative assessment. Higher values of the water use impact category are due to the electricity mix, pure water demand, and chemical synthesis routes. Recycling of waste can reduce intensive water upstream and cooling operations. Comparative studies of LCA and Python PP-, HDPE-, and PEEK-based composite systems assist in early-stage design and decisions.

3.9. LCA and Circularity-Sustainability Relationship

The circularity-sustainability relationship of the PP-, HDPE-, and PEEK-based composite systems with LCA is explained in Table 7. Table 7 expresses the minimum and maximum values of impact categories. Minimum values correspond to the lowest possible values that an indicator can gain during the application of different LCA elements. Similarly, maximum values are related to the highest possible values that LCA indicators can exhibit during computation. The results show that PP-based composites show lower environmental burdens due to a lighter molecular structure and lower processing energy demand. However, PEEK shows higher burdens due to its high-performance nature and extensive energy requirements regarding synthesis. The HDPE-based materials present moderate impacts. HDPE shows higher values in acidification and marine eutrophication, due to emissions from fossil-based feedstocks and processing energy. Climate change indicators of HDPE, particularly the fossil-based and total CO2-equivalent emissions, are significant but remain lower than those of PEEK, demonstrating HDPE’s relatively lower processing temperatures and simpler molecular structure. In ecotoxicity categories (freshwater, inorganic, and organic), HDPE’s impacts are moderate, influenced by additives and potential leaching during its life cycle. The human toxicity results, both carcinogenic and non-carcinogenic, are lower than PEEK but higher than PP, suggesting medium-level risks associated with manufacturing and end-of-life emissions. HDPE also shows notable values in energy resource consumption and water use. Overall, HDPE composites balance durability and recyclability but still exhibit substantial fossil energy dependence, highlighting the need for cleaner feedstocks and renewable energy integration to improve sustainability performance, see Table 7.
The LCA outcomes for PEEK-based composites demonstrate the highest overall environmental impact among the three polymer systems analyzed. PEEK exhibits substantially elevated values across major indicators such as climate change (fossil and total CO2-equivalent emissions), energy resource consumption, and ecotoxicity, primarily due to its highly energy-intensive synthesis, high processing temperatures, and reliance on advanced aromatic monomers derived from petrochemical feedstocks (Table 7). The acidification and eutrophication results further indicate notable emissions linked to the production of precursors like bisphenols and aromatic ketones. In terms of human toxicity (both carcinogenic and non-carcinogenic), PEEK presents the highest potential impacts, reflecting complex solvent use and high-temperature degradation products during manufacture. However, its long service life, thermal stability, and superior mechanical performance provide functional advantages that can offset its high production impacts when evaluated on a use-phase or durability basis. The results suggest that, although PEEK’s environmental footprint per kilogram is significant, its exceptional performance-to-weight ratio and potential for component miniaturization and long-term use may justify its selection in critical applications if coupled with circular recycling routes and renewable energy-driven production (Table 7).
The LCA results for PP-based composites reveal the lowest overall environmental impact among the three evaluated polymers, PP, HDPE, and PEEK. PP shows relatively minimal values in key categories such as climate change (fossil CO2-equivalent emissions), acidification, and energy resource consumption, mainly due to its lower molecular weight, moderate processing temperature, and high production efficiency (Table 7). Its eutrophication and ecotoxicity indicators are also comparatively low, reflecting reduced emissions during manufacturing and limited toxic by-products [52,53]. The human toxicity potential (both carcinogenic and non-carcinogenic) is minimal, suggesting that PP production involves fewer hazardous intermediates and lower solvent use than high-performance polymers like PEEK. Furthermore, PP demonstrates favorable performance in water use and ozone depletion, emphasizing its relatively simple polymerization route and lighter environmental footprint. Overall, PP composites offer a strong balance between mechanical performance, cost efficiency, and sustainability, making them suitable for large-scale applications where recyclability and environmental compatibility are key design priorities.
Values of LCA indicators are also determined using Monte Carlo simulations, see Table 8. Thousands of simulations are run to observe the uncertainty through stochastic variability. PEEK-based composites exhibit a higher intensity of each function parameter for impact categories like human toxicity, ozone depletion, and ionizing radiation. Higher energy consumption, processing temperature, and complex molecular structures are the main contributors to the increase in intensity of impact categories of PEEK-based composites. Table 8 reports mean, standard deviation, and median values derived from LCA and Python-based evaluations. These evaluations allow us to assess the tendency and uncertainty of PP-, HDPE-, and PEEK-based composite systems. The PP- and HDPE-based composite systems show lower mean impacts. Standard deviations assist in the implementation of robustness and the lowest variability in impact values of all categories. Broader uncertainty ranges are observed regarding climate change, energy demand, and toxicity categories. Overall, Table 8 helps in decision-making regarding the selection of sustainable polymers and circular economy strategies. Higher deviations indicate higher sensitivity of inventory assumptions and variability in datasets (for instance, electricity mix and sourcing of raw polymers). The PP-, HDPE- based composites indicate larger uncertainty. However, PEEK allows lower variability. Overall, Table 8 demonstrates that higher environmental burdens are associated with PEEK polymers and their composites. PP and HDPE polymers and composites exhibit lower impacts. The Table emphasizes that the selection of polymers should be based on absolute impacts and uncertainty ranges. Circulation of polymeric waste materials can reduce environmental impacts significantly. Additionally, Monte Carlo simulations provide a reliable foundation for policy, design, and polymer substitutions [54,55,56].
Table 9, Table 10 and Table 11 present model-based comparative sustainability results for European countries generated through integration of OpenLCA calculations with Python-based computational analysis [57,58,59,60]. These tables do not represent direct national measurements; rather, they are scenario outputs derived from harmonized inventory assumptions applied consistently across countries. The country-level values were calculated using four main inputs: (i) annual polymer waste quantities reported for each European country, (ii) country waste-management distributions including recycling, energy recovery, and landfill shares, (iii) life cycle impact coefficients obtained from the reference PP-, HDPE-, and PEEK-based composite systems modelled in OpenLCA 2.5.1 using Ecoinvent v3.11 datasets, and (iv) Python-based scaling, uncertainty propagation, probabilistic analysis, and sustainability ranking algorithms. A normalized reference system was first established at the product level, after which country waste quantities were proportionally scaled according to reported national polymer waste generation. The resulting outputs therefore indicate relative environmental burdens, comparative sustainability trends, and scenario-based rankings under consistent methodological assumptions. These tables were included to demonstrate how standard LCA results can be transformed into a broader AI-assisted sustainability decision-support framework for European countries. They should be interpreted as comparative modeling estimates rather than exact national inventories, since actual results may vary depending on local technology efficiency, electricity mix, transport distances, and waste-management infrastructure.
Table 9 presents a comprehensive LCA analysis of 57 Mt of polymeric waste across European countries. Table 9 links the generation of waste with environmental impact categories regarding designing sustainable systems across Europe. Table 9 reports the distribution of polymeric waste (in Mt) for each European country. Germany, Italy, France, Spain, Poland, and the United Kingdom exhibit the highest burden of environmental impacts due to the largest generation of polymeric waste. Germany dominates the table, showing extremely high values regarding fossil CO2-equivalents, freshwater ecotoxicity, and non-renewable energy demands due to the creation of large volumes of polymeric waste and intensive polymer chains. Belgium, the Netherlands, Austria, Sweden, and Portugal displayed moderate impacts. However, Luxembourg, Malta, Cyprus, Latvia, Estonia, Slovenia, and Croatia show extremely low absolute values of impact categories due to lower waste quantities. Fossil-based emissions in the climate change impact category contribute dominantly across all countries. However, biogenic and land-use-related emissions in impact categories remain minor. Similarly, the separation of freshwater ecotoxicity into inorganic and organic fractions refers to the outweighing of inorganic as well as organic emissions. These emissions are mostly released during polymer production and waste management. The non-renewable energy resource resembles waste generation trends, emphasizing the strong coupling between polymer consumption, fossil energy use, and environmental pressure. Overall, Table 9 provides a quantitative baseline for comparing the national performance of the polymer’s national level of sustainability. Additionally, Table 9 describes the priorities of European countries to redesign circular economic strategies and a sustainable environment. The country-level environmental impacts were calculated using the following scaling relationship:
Impact country = Impact reference × (Waste country/Waste reference)
where the impact reference corresponds to the normalized LCA results for the reference system, and the waste country represents the annual polymer waste generation for each country.
Table 9 suggests that similar waste volumes sometimes display different LCA profiles due to energy mix, industrial structure, polymer processing routes, and waste management strategies. Germany and Italy, as polymer-producing countries, exhibit extremely high acidification values. Acidic environments reflect emissions of SO2, NOx, and NH3 during polymer production, compounding, and waste treatment stages. Regions relying on fossil-based electricity or high-temperature incineration show significant emissions despite lower volumes of waste. Polymer production and waste incineration practices cause a massive increase in fossil-based emissions. Biogenic CO2 contributions are relatively minor. Land use and land use change (LULUC) emissions remain small but non-negligible in countries with agricultural or biomass-linked polymer pathways. Inorganic ecotoxicity and organic ecotoxicity dominate across all countries due to metal emissions, catalysts, fillers, pigments, inorganic additives, and organic substances. Organic ecotoxicity is lower than inorganic ecotoxicity. However, organic ecotoxicity remains relevant in countries where chemical processing, plastic leaching, and wastewater treatments are prominent.
The non-renewable energy resource impact category is low due to material reduction, redesign of recycling systems, polymer production, processing, and end-of-life management. Table 9 demonstrates that environmental impacts are highly concentrated in Germany, Italy, France, Spain, Poland, and the United Kingdom due to fossil energy dependence, lower recycling rates, and waste treatment. Circularity demands target circular economy interventions, waste prevention, redesign of manufacturing systems, energy-efficient recycling technologies, and reshaping of polymer flows across all European countries.
Table 10 presents a comparative LCA of 57 Mt of polymeric waste across European countries. Table 10 focuses on environmental and human health impacts regarding sustainable system design in Europe. The evaluations deal with eutrophication and human-toxicity-related impacts. Observations enable cross-country comparison of polymer systems and impact burdens. In the eutrophication and human toxicity impact categories, large economies like Germany, Italy, France, Spain, Poland, and the United Kingdom contribute more due to the highest waste generation. In particular, Germany displays the largest freshwater, marine, and terrestrial eutrophication impacts due to large volumes of polymeric materials, production, and processing. However, a decrease in the degree of impact of environmental and toxicity indicators takes place due to a lowering in the volume of polymer waste. Similarly, Belgium, the Netherlands, Austria, Sweden, and Switzerland create less waste than the large economies mentioned above. But it still exhibits reasonable eutrophication and toxicity impacts. Carcinogenic and non-carcinogenic toxicity indicators consistently decrease with a lowering in waste volume. Waste prevention strategies, cleaner production, and advanced recycling technologies emerged as a sustainable solution. Overall, the current Table 10 demonstrates a solid solution for prioritizing circular economy strategies, polymer recycling, substitutional eco-design, and the creation of a system of policies [61,62,63,64].
Table 10 can create a design for a degree of sustainability. It quantifies differences in polymer waste generation, industrial scale, and waste management practices into environmental eutrophication impacts and human toxicity risks. These indicators are reported as absolute national impacts. Smaller economies act as a scaling factor regarding the downstream of all waste. Higher values of eutrophication impacts cause algal blooms, oxygen depletion, biodiversity loss, and impurities in lakes and rivers due to phosphorus-equivalent emissions. Therefore, polymer-related wastewater discharges and upstream chemical production are the main contributors. Nitrogen-equivalent emissions affect coastal and marine ecosystems due to wastewater treatments and industrial effluents. Terrestrial eutrophication damages soils and terrestrial ecosystems due to NOx and NH3 emissions from energy use and waste treatment. Carcinogenic toxicity (organic and inorganic) has the highest impact in Germany, Italy, and France due to large volumes of production of polymers, use of heavy metals, metal catalysts, aromatic hydrocarbons, additives, monomers, catalyst residues, pigments, and fillers. Non-carcinogenic toxicity (total, inorganics, organics), like neurological, reproductive, and organ damage, dominates due to inorganic substances. Metal stabilizers, flame retardants, fillers, emissions during incineration, and mechanical recycling also create non-carcinogenic toxicity. Additionally, non-carcinogenic toxicity values are much larger than carcinogenic toxicity values. Improvements in material flows, reduction in reuse, and end-of-life waste can reduce the effects of carcinogenic and non-carcinogenic toxicities.
According to Table 10, it is also noted that higher recycling rates with intensive energy utilization also produce significant environmental burdens. Prevention of polymer waste, reduction in polymer use, the utilization of additives, controlled (meaning low emissions) mechanical, chemical recycling, and closed-loop manufacturing have emerged as possible solutions for lowering environmental burdens. Table 10 provides a quantitative solid foundation for circular economy policies, cleaner polymer design, and low-toxicity material innovation. It also formulates digital normalized technological LCA studies for industrial production and commercial products.
Table 11 presents the comparative LCA of polymeric materials and waste across European countries. The Table evaluates environmental sustainability at the national level. The Table relies on waste generation, multiple midpoints, and end-point impact indicators to designate a probability and sustainability score. LCA indicators are qualified and quantified using internationally recognized characterization factors to summarize overall environmental performance in terms of probability as well as sustainability scores. In Table 11, human health, ecosystem, and resource depletion impacts are covered by environmental indicators. Ionizing radiation-human health and land use reflect exposure to nuclear radiation and occupation of land regarding raw materials’ extraction, manufacturing, and waste management. Material resources—metals/minerals and ozone depletion measure depletion of material resources, processing infrastructure, and damage to the stratospheric ozone layer. Similarly, particulate matter formation and photochemical oxidant formation represent health impacts related to fine particulate emissions during production, incineration, transportation, and smog formation, respectively. Finally, water use is associated with regional water scarcity and polymer life cycles [65,66,67].
High waste in industrialized countries (like Germany, Italy, and France) indicates similar very high absolute environmental burdens (mentioned in Table 7, Table 8, Table 9, Table 10 and Table 11) due to large polymer inputs and industrial activities. Similarly, medium-sized economies (like Spain, Poland, Belgium, and the Netherlands) demonstrate moderate performance due to balanced industrial capacity and waste volumes. However, highly efficient countries (like Switzerland, Denmark, and Finland) exhibit lower environmental impacts due to the application of cleaner energy sources and advanced waste management systems. Smaller states (for instance, Malta, Cyprus, and the Baltic countries) have very low values of impact categories due to limited waste generation. Finally, a lower probability score indicates better performance. The adverse environmental impacts are related to a high probability of occurrence (higher score). Additionally, the sustainability score increases with a lowering of environmental impacts and burdens. Therefore, higher sustainability scores correspond to more sustainable polymer systems. Higher waste generation and energy-intensive countries tend to have a lower sustainability score. Furthermore, cleaner energy systems and advanced circular practices belong to higher sustainability scores and systems. Table 11 provides a complete LCA- and Python-based sustainability ranking of polymer systems in Europe. Table 7, Table 8, Table 9, Table 10 and Table 11 serve as an engineering and technological tool for determining the quality of circularity systems, policy developments, recycling strategies, national waste management, waste volumes, industrial structures, and resource efficiency.
According to Figure 11, a large population, strong industrial manufacturing systems, and plastic consumption can be redesigned for better or superior sustainability. Table 7, Table 8, Table 9, Table 10 and Table 11 and Figure 7, Figure 8, Figure 9, Figure 10 and Figure 11 suggest that a lower generation of waste does not imply better sustainability. Health risks due to nuclear radiation can be controlled using stable, low-carbon electricity units and the redesign of future cleaner energy systems. Utilization of land can be lowered by introducing advanced waste-to-energy systems and digital recycling infrastructures. The circularity of polymeric waste can play a reasonable role in controlling the depletion of material resources. Ozone depletion can be controlled using Europe’s advanced regulations for controlling chemical production. Similarly, the formation of fine particulate matter can be regulated using strict emission controls. Photochemical oxidant formation and water use can be minimized using advanced circularity of polymeric waste, public health policies, cleaner energy production, and better waste management. In Table 11, probability demonstrates the system efficiency of European countries. Similar sustainability scores for countries with different waste volumes reflect comparable impact intensities and waste-management structures rather than identical environmental burdens.

4. Conclusions

The present research demonstrates the development of sustainability systems for the assessment of environmental impacts associated with commercial polymers. Successful development of model graphs of manufactured composites delineates the distribution of amounts of polypropylene (PP), high-density polyethylene (HDPE), polyether ether ketone (PEEK), cotton, glass, and carbon fiber reinforcements during LCA of each element in cradle-to-gate, service life, and cradle-to-grave evaluations. The following conclusions are drawn:
I.
The current study presents an integrative LCA framework for European polymeric waste. The study combines OpenLCA, Ecoinvent v3.11, and Python-based ML tools to evaluate environmental impacts across cradle-to-gate, service life, and cradle-to-grave stages. The proposed methodology advances LCA, automation, stochastic uncertainty analysis, and predictive capability to enable robust sustainability assessments for polymer manufacturing and recycling systems.
II.
The comparative assessment of PP-, HDPE-, and PEEK-based composite systems demonstrates that polymer type, processing intensity, and reinforcement selection strongly govern environmental performance. PP-based composites exhibit the lowest overall environmental burdens due to lower processing temperatures, simpler molecular structure, and reduced energy demand. HDPE-based composites show moderate impacts, balancing durability and recyclability, but remain constrained by fossil-based feedstock and energy use. However, PEEK-based composites display the highest environmental impacts driven by energy-intensive synthesis routes, high processing temperatures, and complex aromatic precursors. PEEK’s long service life and superior performance suggest that its sustainability can be justified in high-value, durability-driven applications when coupled with circular reuse and low-carbon energy inputs.
III.
Across all polymer systems, raw material extraction and manufacturing emerge as dominant environmental hotspots, contributing to most of the climate change, ecotoxicity, and energy resource impacts. Service life stages (use, maintenance, and reuse) generally show comparatively low impacts, highlighting the importance of designing durable, lightweight, and high-performance polymer products. End-of-life stages reveal that recycling pathways significantly reduce overall environmental burdens, whereas disposal and energy recovery remain major contributors to emissions and toxicity.
IV.
Monte Carlo simulations and ML-assisted LCA reveal substantial uncertainty and variability in key impact categories, particularly climate change, energy demand, and toxicity indicators. The integration of Python with OpenLCA enables the prediction of minimum, maximum, and probabilistic impact ranges, supporting the development of quantitative sustainability systems where environmental performance is inversely linked to impact probability. This approach provides a powerful decision-support tool for material selection, policy design, and circular economy planning.
V.
At the European scale, the analysis of 57 Mt of polymeric waste shows that environmental burdens are highly concentrated in countries with large industrial bases and high polymer consumption, notably Germany, Italy, France, Spain, Poland, and the United Kingdom. Differences between countries with similar waste volumes underline the critical role of energy mix, recycling infrastructure, and waste management strategies in shaping national sustainability performance. Smaller economies exhibit lower absolute impacts but still benefit from targeted circular economic interventions.
Overall, this work demonstrates that digitalized LCA integrated with ML offers a transformative pathway for sustainable polymer manufacturing and recycling. The proposed framework supports early-stage eco-design, optimization of recycling strategies, reduction of polymer consumption, and evidence-based policymaking. Future research should focus on coupling this approach with real-time industrial data, renewable energy scenarios, and advanced recycling technologies to further accelerate the transition toward a circular, low-carbon polymer economy in Europe.

5. Limitations and Future Work

The present study provides a computational framework integrating OpenLCA, Monte Carlo simulations, Python-based modeling, and AI-assisted analysis for the evaluation of the environmental impacts of European polymeric waste systems. However, our research includes the following limitations:
  • First, the country-level comparisons presented in this work are based on harmonized modeling assumptions and proportional scaling approaches using reference inventory datasets. Therefore, the results should be interpreted as comparative scenario-based estimates rather than exact national environmental inventories. Real-world environmental impacts can vary significantly depending on regional electricity mixes, transportation infrastructure, industrial technologies, waste-management efficiencies, recycling capacities, and local policy conditions.
  • Second, the investigated composite systems, including PP–PET–cotton, HDPE–GF, and PEEK–CF composites, represent modeling scenarios intended for comparative LCA and sustainability analysis. In practice, many polymer composites currently undergo mechanical recycling, downcycling, energy recovery, or partial material recovery rather than complete closed-loop recycling at the same functional performance level. Accordingly, the proposed circularity framework should not be interpreted as evidence of fully industrialized closed-loop recycling technologies for all investigated composite systems.
  • Third, the sustainability scoring methodology developed in this work represents a comparative computational indicator based on probabilistic environmental burden evaluation. Different LCA indicators, including climate change, ionizing radiation, ecotoxicity, land use, resource depletion, and waste generation, possess different environmental priorities and real-world significance. Therefore, the sustainability score should be interpreted cautiously as a screening-level comparative tool rather than an absolute environmental certification or policy-ranking system.
  • Fourth, ML models were developed primarily for computational integration, uncertainty propagation, and exploratory sustainability analysis. Comprehensive optimization of model performance metrics, large industrial datasets, real-time process monitoring, and advanced hybrid AI architectures were beyond the scope of the current study.
Future work should focus on the incorporation of real industrial datasets, dynamic process modeling, and region-specific inventories to improve the accuracy and practical relevance of computational sustainability assessments. Further studies should also investigate advanced recycling technologies for polymer composites, including chemical recycling, solvent-based separation, pyrolysis, and high-value material recovery approaches to better represent realistic circular economy pathways.
In addition, future developments may include integration of digital twins, real-time environmental monitoring, Industry 4.0 frameworks, and advanced AI techniques for predictive sustainability optimization. Multi-objective optimization approaches considering environmental, economic, technical, and social sustainability indicators could further strengthen decision-support capabilities for polymer manufacturing and recycling industries.
Overall, the present work establishes a foundational computational framework for AI-assisted LCA and circularity-oriented sustainability analysis, while highlighting the need for continued advancement in realistic recycling technologies, industrial-scale validation, and integrated environmental modeling.

Author Contributions

A.H. Conceptualization, Formal analysis, Funding acquisition, Investigation, Methodology, Project administration, Resources, Software, Supervision, Validation, Visualization, Writing—original draft, and Writing—review & editing. H.S.M. Validation, Visualization, Formal analysis, and Writing—review & editing. D.G. Validation, Visualization, Formal analysis, and Writing—review & editing. R.R. Validation, Visualization, Formal analysis, and Writing—review & editing. M.S. Validation, Visualization, Formal analysis, and Writing—review & editing. D.B. Project administration, Resources, Supervision, Validation, Visualization, Formal analysis, and Writing—review & editing. All authors have read and agreed to the published version of the manuscript.

Funding

This research was funded solely by Latvian Council of Science and Riga Technical University under project and grant number 1.1.1.9/LZP/1/24/147. The APC was also funded under grant number 1.1.1.9/LZP/1/24/147.

Data Availability Statement

Data will be made available on request.

Acknowledgments

This research is done under Activity 1.1.1.9 “Post-doctoral Research” of the Specific Objective 1.1.1 “Strengthening research and innovative capacities and introduction of advanced technologies in the common R&D system” of the European Union’s Cohesion Policy Programme for 2021–2027 research application No 1.1.1.9/LZP/1/24/147 “Advanced Recycling and Computational Analysis of Ultra High-Performance Polyether ether ketone and Polyamide-Imide Carbon Reinforced Composites for Automotive and Aerospace Applications”. Authors also acknowledge the collaboration under project TFA25093 (2021-2027.1.01.25-1175) “Development of a Semi-Industrial Prototype of a Separation–Grinding System for Clothing, Textile and Footwear Waste to Increase Recycling Potential in Estonia”.

Conflicts of Interest

The authors declare that there are no conflicts of interest. The authors declare that they have no known competing financial interests or personal relationships that could have appeared to influence the work reported in this paper.

Abbreviations

LCALife cycle assessmentLCIALife cycle assessment impact
ISOInternational Organization of StandardizationPETPolyethylene terephthalate
PPPolypropylenePVCPolyvinyl chloride
PEPolyethylenePLAPolylactic acid
MLMachine learningAIArtificial intelligence
CTCotton GFGlass fiber
CFCarbon fiberHDPEHigh density polyethylene
PEEKPolyether ether ketoneEUEuropean
MtMillion tonsLDLow density
LLDLinear low densityMDMedium density
PSPolystyrene PAPolyamide
ABSAcrylonitrile butadiene styreneSANStyrene acrylonitrile
PCpolycarbonatePMMAPolymethyl methacrylate
PURPolyurethane%Percentage
kg CO2-Eqkilograms of carbon dioxide equivalentCTUeComparative Toxic Unit for ecosystems
KBq U235-Eqkilobecquerel of Uranium-235 equivalentKg Sb-Eqkilograms of antimony equivalent)
Kg CFC-11 eqkilogram of CFC-11 equivalentKg NMVOC-eqkilograms of Non-Methane Volatile Organic Compounds equivalent
mmetermol H+-Eqmoles of hydrogen ion equivalents
MJMega joulekg P-Eqkilograms of phosphorus equivalents
kg N-Eqkilograms of nitrogen equivalentsmol N-Eqmoles of nitrogen equivalents
CTUhComparative Toxic Unit for human toxicity.LULUCLand use and land use change
SO2Sulphur dioxideNH3Ammonia
NOxNitrogen oxides.

References

  1. Finnveden, G.; Hauschild, M.Z.; Ekvall, T.; Guinée, J.; Heijungs, R.; Hellweg, S.; Koehler, A.; Pennington, D.; Suh, S. Recent developments in life cycle assessment. J. Environ. Manag. 2009, 91, 1–21. [Google Scholar] [CrossRef] [PubMed]
  2. Guinée, J.B.; Heijungs, R.; Huppes, G.; Zamagni, A.; Masoni, P.; Buonamici, R.; Ekvall, T.; Rydberg, T. Life cycle assessment: Past, present, and future. Environ. Sci. Technol. 2010, 45, 90–96. [Google Scholar] [CrossRef]
  3. Hellweg, S.; Milà i Canals, L. Emerging approaches, challenges and opportunities in life cycle assessment. Science 2014, 344, 1109–1113. [Google Scholar] [CrossRef] [PubMed]
  4. Hauschild, M.; Jeswiet, J.; Alting, L. From life cycle assessment to sustainable production: Status and perspectives. CIRP Ann. 2005, 54, 1–21. [Google Scholar] [CrossRef]
  5. Al Rashid, A.; Khan, S.A.; Koç, M. Life cycle assessment on fabrication and characterization techniques for additively manufactured polymers and polymer composites. Clean. Environ. Syst. 2024, 12, 100159. [Google Scholar] [CrossRef]
  6. Miah, J.H.; Koh, S.C.; Stone, D. A hybridised framework combining integrated methods for environmental Life Cycle Assessment and Life Cycle Costing. J. Clean. Prod. 2017, 168, 846–866. [Google Scholar] [CrossRef]
  7. Pieragostini, C.; Mussati, M.C.; Aguirre, P. On process optimization considering LCA methodology. J. Environ. Manag. 2012, 96, 43–54. [Google Scholar] [CrossRef]
  8. Castellani, V.; Beylot, A.; Sala, S. Environmental impacts of household consumption in Europe: Comparing process-based LCA and environmentally extended input-output analysis. J. Clean. Prod. 2019, 240, 117966. [Google Scholar] [CrossRef]
  9. Finkbeiner, M.; Inaba, A.; Tan, R.; Christiansen, K.; Klüppel, H.J. The new international standards for life cycle assessment: ISO 14040 and ISO 14044. Int. J. Life Cycle Assess. 2006, 11, 80–85. [Google Scholar] [CrossRef]
  10. Guinée, J.B. Handbook on Life Cycle Assessment: Operational Guide to the ISO Standards; Springer Science & Business Media: Berlin/Heidelberg, Germany, 2002. [Google Scholar]
  11. Esnouf, A.; Heijungs, R.; Coste, G.; Latrille, É.; Steyer, J.P.; Hélias, A. A tool to guide the selection of impact categories for LCA studies by using the representativeness index. Sci. Total Environ. 2019, 658, 768–776. [Google Scholar] [CrossRef]
  12. McClelland, S.C.; Arndt, C.; Gordon, D.R.; Thoma, G. Type and number of environmental impact categories used in livestock life cycle assessment: A systematic review. Livest. Sci. 2018, 209, 39–45. [Google Scholar] [CrossRef]
  13. Rebitzer, G.; Ekvall, T.; Frischknecht, R.; Hunkeler, D.; Norris, G.; Rydberg, T.; Schmidt, W.P.; Suh, S.; Weidema, B.P.; Pennington, D.W. Life cycle assessment: Part 1: Framework, goal and scope definition, inventory analysis, and applications. Environ. Int. 2004, 30, 701–720. [Google Scholar] [CrossRef]
  14. Alhazmi, H.; Almansour, F.H.; Aldhafeeri, Z. Plastic waste management: A review of existing life cycle assessment studies. Sustainability 2021, 13, 5340. [Google Scholar] [CrossRef]
  15. Das, S.; Liang, C.; Dunn, J.B. Life cycle assessment of polymers and their recycling. In Circular Economy of Polymers: Topics in Recycling Technologies; American Chemical Society: Washington, DC, USA, 2021; pp. 143–170. [Google Scholar]
  16. Walker, S.; Rothman, R. Life cycle assessment of bio-based and fossil-based plastic: A review. J. Clean. Prod. 2020, 261, 121158. [Google Scholar] [CrossRef]
  17. Khorgade, P.; Rettinger, M.; Burghartz, A.; Schlaich, M. A comparative cradle-to-gate life cycle assessment of carbon fiber-reinforced polymer and steel-reinforced bridges. Struct. Concr. 2023, 24, 1737–1750. [Google Scholar] [CrossRef]
  18. Resalati, S.; Okoroafor, T.; Henshall, P.; Simões, N.; Gonçalves, M.; Alam, M. Comparative life cycle assessment of different vacuum insulation panel core materials using a cradle to gate approach. Build. Environ. 2021, 188, 107501. [Google Scholar] [CrossRef]
  19. Stoiber, N.; Hammerl, M.; Kromoser, B. Cradle-to-gate life cycle assessment of CFRP reinforcement for concrete structures: Calculation basis and exemplary application. J. Clean. Prod. 2021, 280, 124300. [Google Scholar] [CrossRef]
  20. Banerjee, R.; Ray, S.S. Sustainability and life cycle assessment of thermoplastic polymers for packaging: A review on fundamental principles and applications. Macromol. Mater. Eng. 2022, 307, 2100794. [Google Scholar] [CrossRef]
  21. Yates, M.R.; Barlow, C.Y. Life cycle assessments of biodegradable, commercial biopolymers—A critical review. Resour. Conserv. Recycl. 2013, 78, 54–66. [Google Scholar] [CrossRef]
  22. Speck, R.; Selke, S.; Auras, R.; Fitzsimmons, J. Life cycle assessment software: Selection can impact results. J. Ind. Ecol. 2016, 20, 18–28. [Google Scholar] [CrossRef]
  23. Silva, D.A.; Nunes, A.O.; Piekarski, C.M.; da Silva Moris, V.A.; de Souza, L.S.; Rodrigues, T.O. Why using different Life Cycle Assessment software tools can generate different results for the same product system? A cause–effect analysis of the problem. Sustain. Prod. Consum. 2019, 20, 304–315. [Google Scholar] [CrossRef]
  24. Herrmann, I.T.; Moltesen, A. Does it matter which Life Cycle Assessment (LCA) tool you choose?–a comparative assessment of SimaPro and GaBi. J. Clean. Prod. 2015, 86, 163–169. [Google Scholar] [CrossRef]
  25. Zalazar-Garcia, D.; Fernandez, A.; Rodriguez-Ortiz, L.; Torres, E.; Reyes-Urrutia, A.; Echegaray, M.; Rodriguez, R.; Mazza, G. Exergo-ecological analysis and life cycle assessment of agro-wastes using a combined simulation approach based on Cape-Open to Cape-Open (COCO) and SimaPro free-software. Renew. Energy 2022, 201, 60–71. [Google Scholar] [CrossRef]
  26. Venkatachalam, V.; Pohler, M.; Spierling, S.; Nickel, L.; Barner, L.; Endres, H.J. Design for recycling strategies based on the life cycle assessment and end of life options of plastics in a circular economy. Macromol. Chem. Phys. 2022, 223, 2200046. [Google Scholar] [CrossRef]
  27. Hussain, A.; Podgursky, V.; Goljandin, D.; Antonov, M.; Sergejev, F.; Krasnou, I. Circular production, designing, and mechanical testing of polypropylene-based reinforced composite materials: Statistical analysis for potential automotive and nuclear applications. Polymers 2023, 15, 3410. [Google Scholar] [CrossRef]
  28. Tan, Q.; Yang, L.; Wei, F.; Chen, Y.; Li, J. Comparative life cycle assessment of polyethylene agricultural mulching film and alternative options including different end-of-life routes. Renew. Sustain. Energy Rev. 2023, 178, 113239. [Google Scholar] [CrossRef]
  29. Korol, J.; Hejna, A.; Burchart-Korol, D.; Chmielnicki, B.; Wypiór, K. Water footprint assessment of selected polymers, polymer blends, composites, and biocomposites for industrial application. Polymers 2019, 11, 1791. [Google Scholar] [CrossRef] [PubMed]
  30. Alhashim, R.; Deepa, R.; Anandhi, A. Environmental impact assessment of agricultural production using LCA: A review. Climate 2021, 9, 164. [Google Scholar] [CrossRef]
  31. Baltrocchi, A.P.; Carnevale Miino, M.; Maggi, L.; Rada, E.C.; Torretta, V. A comprehensive critical review of Life Cycle Assessment applied to thermoplastic polymers for mechanical and electronic engineering. Environ. Technol. Rev. 2025, 14, 458–470. [Google Scholar] [CrossRef]
  32. Köck, B.; Friedl, A.; Serna Loaiza, S.; Wukovits, W.; Mihalyi-Schneider, B. Automation of life cycle assessment—A critical review of developments in the field of life cycle inventory analysis. Sustainability 2023, 15, 5531. [Google Scholar] [CrossRef]
  33. Steubing, B.; Mendoza Beltran, A.; Sacchi, R. Conditions for the broad application of prospective life cycle inventory databases. Int. J. Life Cycle Assess. 2023, 28, 1092–1103. [Google Scholar] [CrossRef]
  34. Lueddeckens, S.; Saling, P.; Guenther, E. Temporal issues in life cycle assessment—A systematic review. Int. J. Life Cycle Assess. 2020, 25, 1385–1401. [Google Scholar] [CrossRef]
  35. Mansor, M.R.; Mastura, M.T.; Sapuan, S.M.; Zainudin, A.Z. The environmental impact of natural fiber composites through life cycle assessment analysis. In Durability and Life Prediction in Biocomposites, Fibre-Reinforced Composites and Hybrid Composites; Woodhead Publishing: Cambridge, UK, 2019; pp. 257–285. [Google Scholar]
  36. Ead, A.S.; Appel, R.; Alex, N.; Ayranci, C.; Carey, J.P. Life cycle analysis for green composites: A review of literature including considerations for local and global agricultural use. J. Eng. Fibers Fabr. 2021, 16, 15589250211026940. [Google Scholar] [CrossRef]
  37. Ramesh, M.; Deepa, C.; Kumar, L.R.; Sanjay, M.R.; Siengchin, S. Life-cycle and environmental impact assessments on processing of plant fibres and its bio-composites: A critical review. J. Ind. Text. 2022, 51, 5518S–5542S. [Google Scholar] [CrossRef]
  38. Mio, A.; Bertagna, S.; Cozzarini, L.; Laurini, E.; Bucci, V.; Marinò, A.; Fermeglia, M. Multiscale modelling techniques in life cycle assessment: Application to nanostructured polymer systems in the maritime industry. Sustain. Mater. Technol. 2021, 29, e00327. [Google Scholar] [CrossRef]
  39. Amponsah, L.; Chuck, C.; Parsons, S. Life cycle assessment of a marine biorefinery producing protein, bioactives and polymeric packaging material. Int. J. Life Cycle Assess. 2024, 29, 174–191. [Google Scholar] [CrossRef]
  40. Meramo, S.; Pasutto, E.; Sukumara, S. Automating relative and absolute environmental sustainability assessments of bio-based products. Bioresour. Technol. 2024, 394, 130196. [Google Scholar] [CrossRef] [PubMed]
  41. Nair, R.R.; Chougule, K.M.; Gomez, J.C.; Brand-Daniels, U. A generalized schema to publish and share life cycle inventories (LCI): Exemplary case of an aviation fuel supply chain. J. Clean. Prod. 2025, 520, 146120. [Google Scholar] [CrossRef]
  42. Hussain, A.; Podgursky, V.; Antonov, M.; Viljus, M.; Goljandin, D. TiCN coating tribology for the circular economy of textile industries. J. Ind. Text. 2022, 51, 8947S–8959S. [Google Scholar] [CrossRef]
  43. Hussain, A.; Podgursky, V.; Goljandin, D.; Viljus, M.; Antonov, M.; Bogatov, A.; Krasnou, I. Tribological and mechanical properties investigations of post-consumer cotton textiles. Solid State Phenom. 2021, 320, 97–102. [Google Scholar] [CrossRef]
  44. Shekoohiyan, S.; Hadadian, M.; Heidari, M.; Hosseinzadeh-Bandbafha, H. Life cycle assessment of Tehran Municipal solid waste during the COVID-19 pandemic and environmental impacts prediction using machine learning. Case Stud. Chem. Environ. Eng. 2023, 7, 100331. [Google Scholar] [CrossRef]
  45. Khanna, A.; Lamba, B.Y.; Jain, S.; Sah, A.; Dangi, S.; Sharma, A.; Tiang, J.J.; Tiang, S.S.; Lim, W.H. Multi-Objective AI Optimization of Plastic Waste Pyrolysis Integrating Energy Return on Investment for Circular Polymer Recycling. Polymers 2026, 18, 1062. [Google Scholar] [CrossRef]
  46. Chin, H.H.; Varbanov, P.S.; You, F.; Sher, F.; Klemeš, J.J. Plastic circular economy framework using hybrid machine learning and pinch analysis. Resour. Conserv. Recycl. 2022, 184, 106387. [Google Scholar] [CrossRef]
  47. Rahmani, R.; Resende, P.R.; Couto, R.; Lopes, S.I.; Kumar, R.; Maurya, H.S.; Karimi, J.; Afonso, A.M.; Hussain, A.; Abrantes, J.C. Structural analysis of selective laser melted copper-tin alloy. J. Alloys Metall. Syst. 2024, 7, 100097. [Google Scholar] [CrossRef]
  48. Fang, Z.; Chen, D.; Hu, X.; Deng, Z.; Xu, J.; Wang, Y.; Qiao, Y.; Hu, S.; Xiang, J. Rapid detection and identification of plastic waste based on multi-wavelength laser Raman spectroscopy combining machine learning methods. Spectrochim. Acta Part A Mol. Biomol. Spectrosc. 2025, 340, 126316. [Google Scholar] [CrossRef]
  49. Hussain, A.; Goljandin, D.; Podgursky, V.; Yörük, C.R.; Sergejev, F.; Kübarsepp, J.; Maurya, H.S.; Rahmani, R. Industrial sustainable Fabrication, SEM Characterization, mechanical Testing, ANOVA analysis of PP-PETF recycled Composites: Artificial intelligence and deep learning studies for nuclear shielding applications. Eur. Polym. J. 2024, 213, 113082. [Google Scholar] [CrossRef]
  50. Tabone, M.D.; Cregg, J.J.; Beckman, E.J.; Landis, A.E. Sustainability metrics: Life cycle assessment and green design in polymers. Environ. Sci. Technol. 2010, 44, 8264–8269. [Google Scholar] [CrossRef] [PubMed]
  51. Hottle, T.A.; Bilec, M.M.; Landis, A.E. Sustainability assessments of bio-based polymers. Polym. Degrad. Stab. 2013, 98, 1898–1907. [Google Scholar] [CrossRef]
  52. Antelava, A.; Damilos, S.; Hafeez, S.; Manos, G.; Al-Salem, S.M.; Sharma, B.K.; Kohli, K.; Constantinou, A. Plastic solid waste (PSW) in the context of life cycle assessment (LCA) and sustainable management. Environ. Manag. 2019, 64, 230–244. [Google Scholar] [CrossRef] [PubMed]
  53. Sharifian, S.; Iranmanesh, Z.; Asasian-Kolur, N.; Vahidi, E.; Harasek, M. Toward sustainable carbon utilization: Integrated LCA–TEA assessment of carbon dioxide–derived polymers. J. Environ. Manag. 2026, 400, 128785. [Google Scholar] [CrossRef]
  54. Demirdelen, T.; Aksu, İ.Ö.; Yilmaz, K.; Koç, D.D.; Arikan, M.; Şener, A. Investigation of the carbon footprint of the textile industry: PES-and PP-based products with Monte Carlo uncertainty analysis. Sustainability 2023, 15, 14237. [Google Scholar] [CrossRef]
  55. Hussain, A.; Podgursky, V.; Goljandin, D.; Antonov, M.; Viljus, M. Tribology of alumina materials for the circular economy of manufacturing textile industries. Proc. Est. Acad. Sci. 2021, 70, 215–220. [Google Scholar] [CrossRef]
  56. Lo, S.C.; Ma, H.W.; Lo, S.L. Quantifying and reducing uncertainty in life cycle assessment using the Bayesian Monte Carlo method. Sci. Total Environ. 2005, 340, 23–33. [Google Scholar] [CrossRef]
  57. Maurya, H.S.; Kumar, R.; Kumar, S.A.; Tarraste, M.; Hussain, A.; Rahmani, R.; Juhani, K.; Sergejev, F.; Prashanth, K.G. Sliding wear and debris evolution in LPBFed ceramic-reinforced steel composites under variable loads and temperatures. Mater. Chem. Phys. 2025, 345, 131195. [Google Scholar] [CrossRef]
  58. Ramesh, P.; Vinodh, S. State of art review on Life Cycle Assessment of polymers. Int. J. Sustain. Eng. 2020, 13, 411–422. [Google Scholar] [CrossRef]
  59. Vinodh, S.; Rathod, G. Application of life cycle assessment and Monte Carlo simulation for enabling sustainable product design. J. Eng. Des. Technol. 2014, 12, 307–315. [Google Scholar] [CrossRef]
  60. Hussain, A.; Podgursky, V.; Goljandin, D.; Antonov, M. Industrial approach to circularity of polymer composites: Processing, characterization, mechanical testing, and wear regression. J. Reinf. Plast. Compos. 2024, 43, 456–472. [Google Scholar] [CrossRef]
  61. Yaghoubi, V.; Kumru, B. Retrosynthetic life cycle assessment: A short perspective on the sustainability of integrating thermoplastics and artificial intelligence into composite systems. Adv. Sustain. Syst. 2024, 8, 2300543. [Google Scholar] [CrossRef]
  62. Hashmi, R.; Singh, S.K.; Singh, A.K. AI-Driven Sustainable Polymers: A Pathway to Environmental Resilience. Macromol. Symp. 2026, 415, e70175. [Google Scholar] [CrossRef]
  63. Pande, P.B.; Dhengare, S.W.; Raut, J.M.; Bhagat, R.M.; Bahoria, B.V.; Shelke, N.; Upadhye, S.D.; Vairagade, V.S. Optimizing sustainability and resilience of composite construction materials using life cycle assessment and advanced artificial intelligence techniques. Asian J. Civ. Eng. 2025, 26, 471–489. [Google Scholar] [CrossRef]
  64. Hussain, A.; Maurya, H.S.; Goljandin, D.; Sinka, M.; Bajare, D. Development of Experimental and Computational Lightweight Industrial Circularity Manufacturing Systems for Polymer Waste Recycling: Mechanical Testing and Characterization. Int. J. Lightweight Mater. Manuf. 2025, 9, 314–336. [Google Scholar] [CrossRef]
  65. Hussain, A.; Kübarsepp, J.; Sergejev, F.; Goljandin, D.; Hussainova, I.; Podgursky, V.; Karjust, K.; Maurya, H.S.; Rahmani, R.; Sinka, M.; et al. Advanced machine learning and experimental studies of polypropylene based polyesters tribological composite systems for sustainable recycling automation and digitalization. Int. J. Lightweight Mater. Manuf. 2025, 8, 252–263. [Google Scholar] [CrossRef]
  66. Hu, X.; An, A.K.; Chopra, S.S. Life cycle assessment of the polyvinylidene fluoride polymer with applications in various emerging technologies. ACS Sustain. Chem. Eng. 2022, 10, 5708–5718. [Google Scholar] [CrossRef]
  67. Yakoubi, S. Sustainable revolution: AI-driven enhancements for composite polymer processing and optimization in intelligent food packaging. Food Bioprocess Technol. 2025, 18, 82–107. [Google Scholar] [CrossRef]
Figure 1. Proposed research regarding the LCA of European waste.
Sustainability 18 05445 g001
Figure 2. Elements of LCA.
Sustainability 18 05445 g002
Figure 3. LCA and Python integration regarding the circularity of polymers.
Sustainability 18 05445 g003
Figure 4. Proposed systems of sustainability. Conceptual sustainability-probability scale illustrating the relationship between probability increase and degree of sustainability, divided into four sustainability zones (I–IV). Zone I represents the highest sustainability level with net-zero circularity and emissions, while Zone IV represents the least sustainable condition associated with maximum waste generation and hazardous gas emissions. The sustainability threshold interval of 0.25 is used to classify the progressive transition from sustainable to unsustainable states.
Sustainability 18 05445 g004
Figure 5. Systematic interpretations of model graphs of PP-, HDPE-, and PEEK-based composite systems regarding LCA.
Sustainability 18 05445 g005
Figure 6. Sankey representation of life-cycle material flows and associated environmental hotspots for PP-, HDPE-, and PEEK-based composite systems across raw material extraction, manufacturing, use phase, recycling, waste treatment, and disposal stages.
Sustainability 18 05445 g006
Figure 7. LCA (a) Acidification and (b) climate change indicators of PP-, HDPE- and PEEK-based composite systems.
Sustainability 18 05445 g007
Figure 8. LCA ionizing radiation: human health, land use, and materials resources: metal/minerals impact indicators regarding PP-, HDPE-, and PEEK-based composite systems.
Sustainability 18 05445 g008
Figure 9. LCA of ozone depletion and particulate matter formation impact indicators regarding PP-, HDPE-, and PEEK-based composite systems.
Sustainability 18 05445 g009
Figure 10. LCA photochemical oxidant formation and water use impact indicators regarding PP-, HDPE-, and PEEK-based composite systems.
Sustainability 18 05445 g010
Figure 11. Circularity-LCA and computation relationship for sustainability.
Sustainability 18 05445 g011
Table 1. Distribution of post-consumer polymeric waste in the EU.
Country NameAmount of Waste (Mt)Recycling Capacity (%)
RecyclingEnergy RecoveryLandfill
Germany1242571
Italy8343432
France5.5254431
Spain4432136
Poland4273241
The United Kingdom4374419
Belgium2.539592
Luxemburg 2.534660
The Netherlands2.345550
Czech Republic1.9392239
Austria1.831690
Portugal1.6323533
Sweden1.739601
Hungary1.6222157
Romania1.6331156
Switzerland0.928720
Greece0.8525273
Denmark0.7040582
Finland0.7021770
Slovakia0.50302545
Bulgaria0.4523869
Lithuania0.40272845
Ireland0.4529629
Slovenia0.35353233
Norway0.4044542
Croatia0.3028567
Latvia0.2534264
Estonia0.25344620
Cyprus0.1527271
Malta0.1023275
Table 2. Potential of commercial post-consumer waste in Europe.
Polymer TypeAbundance (Mt)Applications
PP10Packaging and others
HDPE (including low density (LD), linear low density (LLD), and medium density (MD))17Domestic, engineering, and strategic
PVC6Domestic and engineering
PET5Domestic and engineering
Polystyrene (PS) (including expandable)3.5Domestic, engineering, and strategic
PA1Domestic, engineering, and strategic
ABS1Domestic, engineering, and strategic
SAN1Domestic, engineering, and strategic
PC1Domestic, engineering, and strategic
PMMA0.5Engineering and strategic
PUR5Domestic, engineering, and strategic
Other thermoplastics 3Engineering and strategic
Other thermosetting4Domestic, engineering, and strategic
Table 3. Distribution of minerals and materials observed during model graph development *, **, ***.
Nature of LCA and LCAILCA ElementAmounts of Matrices (Mt)Amounts of Reinforcements (Mt)
PPHDPEPEEKPETCottonGFCF
Cradle to gate Natural resources381147.5315002
Raw materials extraction1062512.40.80
manufacturing1062422.40.80
Service lifeUtilization1062422.40.80
Maintenance 1062422.40.8
Reuse 8.104.741.583.241.621.900.63
Cradle to graveDisposal8.104.741.583.241.621.900.63
Waste treatment8.104.741.583.241.621.900.63
Recycling8.104.741.583.241.621.900.63
* Repeated values denote conserved post-use material quantities allocated to alternative end-of-life scenarios. Environmental impacts for reuse, disposal, waste treatment, and recycling differ and were calculated separately using process-specific datasets in OpenLCA. ** Disposal includes landfill, incineration with energy recovery, and residual treatment routes. *** Silica sand represents the upstream raw material used for glass fiber production. The HDPE–GF composite utilizes processed glass fibers, while silica sand is included to account for the full life cycle inventory from raw material extraction.
Table 4. Screening-level contribution of matrix materials and reinforcements to overall environmental burdens under different calculation approaches *.
MethodMatrix Materials ContributionReinforcement Contribution
Open LCA Lazy-on-demand8020
Open Eager-All7525
Open LCA Monte Carlo Simulation7030
Python-Open LCA integration7822
* The values (e.g., 80/20, 75/25, 70/30, 78/22) represent indicative contribution shares of polymer matrix and reinforcement phases obtained from different calculation approaches. Differences arise due to variations in system boundary completeness, background process inclusion, and uncertainty propagation across datasets. These values should be interpreted as screening-level contribution estimates rather than exact material-specific fractions. The variation in contribution ratios across calculation methods reflects differences in data completeness, background process linking, and uncertainty treatment rather than fundamental changes in material composition.
Table 5. LCA of various types of climate change indicators of PP-, HDPE-, and PEEK-based composite systems.
LCA IndicatorLCA-Based CalculationLCA-Python Based CalculationsIndicator Units
PPHDPEPEEKPPHDPEPEEKStandard Unit
Climate change: biogenic4.20 × 1089.02 × 1062.60 × 1076.20 × 1081.02 × 1074.60 × 107kg CO2-Eq
Climate change: fossil4.50 × 10101.50 × 10101.50 × 10106.50 × 10104.50 × 10105.50 × 1010kg CO2-Eq
Climate change: land use and land use change1.20 × 1099.60 × 1066.50 × 1064.20 × 1091.60 × 1079.50 × 106kg CO2-Eq
Table 6. LCA of various types of ecotoxicity indicators of PP-, HDPE-, and PEEK-based composite systems.
LCA IndicatorLCA-Based CalculationLCA-Python Based CalculationsIndicator Units
PPHDPEPEEKPPHDPEPEEKStandard Unit
Ecotoxicity: freshwater6.80 × 10113.60 × 10101.40 × 10117.20 × 10123.30 × 10114.60 × 1012CTUe
Ecotoxicity: freshwater,
inorganics
1.17 × 10113.40 × 10107.10 × 10103.75 × 10126.40 × 10117.50 × 1011CTUe
Ecotoxicity: freshwater,
organics
5.65 × 10112.40 × 1096.80 × 10108.75 × 10125.35 × 10109.50 × 1011CTUe
Table 7. Description of LCA indicators of PP-, HDPE-, and PEEK-based composite materials regarding the design of systems of sustainability.
LCA IndicatorMinimum ValuesMaximum ValuesUnits
PPHDPEPEEKPPHDPEPEEKStandard Unit
Acidification2.50 × 1075.6 × 1064.30 × 1065.40 × 10107.90 × 1099.80 × 108mol H+-Eq
Climate change3.50 × 1072.50 × 1085.50 × 1086.50 × 10138.50 × 10126.50 × 1012kg CO2-Eq
Climate change: biogenic2.20 × 1065.26 × 1053.45 × 1056.20 × 10115.92 × 1094.36 × 1010kg CO2-Eq
Climate change: fossil3.65 × 1073.74 × 1073.67 × 1079.50 × 10136.25 × 10123.37 × 1012kg CO2-Eq
Climate change: land use and land use change3.24 × 1065.64 × 1047.50 × 1049.87 × 10124.25 × 1097.56 × 1010kg CO2-Eq
Ecotoxicity: freshwater3.95 × 1084.78 × 1084.54 × 1088.80 × 10146.96 × 10137.10 × 1013CTUe
Ecotoxicity: freshwater, inorganics1.50 × 1082.25 × 1072.64 × 1071.00 × 10142.30 × 10134.50 × 1013CTUe
Ecotoxicity: freshwater, organics9.50 × 1083.60 × 1059.60 × 1061.25 × 10141.60 × 10122.63 × 1013CTUe
Energy resources: non-renewable3.50 × 1091.13 × 1099.50 × 1081.12 × 10151.23 × 10134.48 × 1013MJ, net calorific
value
Eutrophication: freshwater1.50 × 1061.41 × 1051.74 × 1053.90 × 1095.50 × 1088.81 × 109kg P-Eq
Eutrophication: marine3.30 × 1064.50 × 1061.50 × 1067.50 × 10103.53 × 1096.34 × 109kg N-Eq
Eutrophication: terrestrial5.81 × 1076.91 × 1053.30 × 1068.30 × 10128.44 × 10106.33 × 1010mol N-Eq
Human toxicity: carcinogenic7.504.692.1513.817.654.15CTUh
Human toxicity: carcinogenic, inorganics3.153.25145.175.6119CTUh
Human toxicity: carcinogenic, organics4.501.10166.271.9521CTUh
Human toxicity: non-carcinogenic4.72 × 1021.72 × 1021.10 × 1026.31 × 1045.91 × 1048.92 × 105CTUh
Human toxicity: non-carcinogenic, inorganics3.81 × 1021.61 × 1054.84 × 1026.31 × 1049.10 × 1075.41 × 104CTUh
Human toxicity: non-carcinogenic, organics901011010515150CTUh
Ionizing radiation: human health7.21 × 1083.61 × 1083.54 × 1074.21 × 10117.71 × 10113.25 × 1010kBq U235-Eq
Land use5.50 × 10104.50 × 1093.50 × 1097.21 × 10127.21 × 10117.21 × 1010dimensionless
Material resources: metals/minerals2.23 × 1044.00 × 1043.50 × 1046.11 × 1073.10 × 1071.50 × 107kg Sb-Eq
Ozone depletion7.34 × 1041.14 × 1044.10 × 1041.24 × 1053.25 × 1056.24 × 105kg CFC-11-Eq
Particulate matter formation5.50 × 1025.71 × 1027.80 × 1029.70 × 1048.80 × 1047.92 × 104disease
incidence
Photochemical oxidant formation: human health4.71 × 1081.00 × 1079.00 × 1067.11 × 10103.42 × 1094.32 × 109kg NMVOC-Eq
Water use8.30 × 10101.20 × 1092.00 × 1081.51 × 10135.25 × 10109.71 × 1011m3 world Eq
deprived
Table 8. Monte Carlo Simulations of PP-, HDPE-, and PEEK-based composite systems regarding LCA.
LCA IndicatorMonte Carlo SimulationsUnits
PPHDPEPEEKStandard Unit
MeanStandard DeviationMedianMeanStandard DeviationMedianMeanStandard DeviationMedianSubunits
Acidification0.600.040.600.600.050.600.900.020.80mol H+-Eq
(3.20 × 10⁸)(1.40 × 10⁷)(3.20 × 10⁸)(6.10 × 10⁷)(5.61 × 10⁶)(6.10 × 10⁶)(5.65 × 10⁷)(6.60 × 10⁶)(5.60 × 10⁷)
Climate change0.800.170.850.700.300.650.850.030.90kg CO2-Eq
(4.70 × 10¹⁰)(1.84 × 10⁹)(4.60 × 10¹⁰)(1.50 × 10¹⁰)(7.30 × 10⁸)(1.50 × 10¹⁰)(1.50 × 10¹⁰)(1.50 × 10⁹)(1.40 × 10¹⁰)
Climate change: biogenic0.920.050.850.800.200.750.750.030.85kg CO2-Eq
(4.20 × 10⁸)(2.64 × 10⁸)(4.60 × 10⁸)(9.0 × 10⁶)(9.80 × 10⁵)(8.90 × 10⁶)(2.60 × 10⁷)(3.10 × 10⁷)(2.60 × 10⁷)
Climate change: fossil0.850.170.820.700.300.750.800.040.70kg CO2-Eq
(4.50 × 10¹⁰)(1.80 × 10⁹)(4.80 × 10¹⁰)(1.50 × 10¹⁰)(7.30 × 10⁸)(1.50 × 10¹⁰)(1.50 × 10¹⁰)(1.10 × 10⁹)(1.70 × 10¹⁰)
Climate change: land use and land use change0.650.360.640.800.250.850.900.050.87kg CO2-Eq
(1.24 × 10⁹)(4.38 × 10⁷)(1.24 × 10⁹)(9.60 × 10⁶)(7.00 × 10⁵)(9.50 × 10⁵)(6.50 × 10⁶)(8.50 × 10⁵)(6.40 × 10⁶)
Ecotoxicity: freshwater0.780.200.820.850.200.850.800.040.75CTUe
(6.80 × 10¹¹)(2.74 × 10¹⁰)(6.80 × 10¹¹)(3.40 × 10¹⁰)(6.83 × 10⁹)(3.40 × 10¹⁰)(1.40 × 10¹¹)(1.80 × 10¹⁰)(1.35 × 10¹¹)
Ecotoxicity: freshwater, inorganics0.890.150.900.840.150.870.950.010.96CTUe
(1.20 × 10¹¹)(1.60 × 10¹⁰)(1.13 × 10¹¹)(3.40 × 10¹⁰)(6.80 × 10⁹)(3.30 × 10¹⁰)(7.10 × 10¹⁰)(10 × 109)(7 × 10¹⁰)
Ecotoxicity: freshwater, organics0.900.140.870.800.250.850.800.040.65CTUe
(5.60 × 10¹¹)(2.14 × 10¹⁰)(5.66 × 10¹¹)(9.60 × 10⁶)(7.00 × 10⁵)(9.50 × 10⁵)(6.60 × 10¹⁰)(1.50 × 10¹⁰)(7.10 × 10¹⁰)
Energy resources: non-renewable0.680.350.600.840.190.900.750.080.79MJ, net calorific
value
(1.10 × 10¹²)(3.52 × 10¹⁰)(4.80 × 10¹⁰)(1.00 × 10¹²)(1.60 × 10¹⁰)(4.20 × 10¹¹)(3.50 × 10¹¹)(2.50 × 10¹⁰)(3.50 × 10¹⁰)
Eutrophication: freshwater0.840.160.880.930.040.950.750.010.95kg P-Eq
(1.90 × 10⁷)(5.82 × 10⁶)(1.70 × 10⁷)(3.12 × 10⁶)(1.60 × 10⁶)(2.80 × 10⁶)(2.60 × 10⁶)(1.20 × 10⁶)(2.30 × 10⁶)
Eutrophication: marine0.810.190.790.890.150.850.850.100.90kg N-Eq
(3.34 × 10⁸)(2.24 × 10⁷)(3.34 × 10⁸)(1.30 × 10⁷)(1.00 × 10⁶)(1.25 × 10⁷)(2.20 × 10⁷)(1.60 × 10⁶)(2.20 × 10⁷)
Eutrophication: terrestrial0.720.300.780.870.130.840.900.200.95mol N-Eq
(1.00 × 10⁹)(4.70 × 10⁷)(1.00 × 10⁹)(1.33 × 10⁸)(1.10 × 10⁷)(1.32 × 10⁸)(2.20 × 10⁸)(1.50 × 10⁷)(1.40 × 10⁸)
Human toxicity: carcinogenic0.500.500.650.870.250.880.950.660.95CTUh
(8.77)(7.10)(8.57)(5.50)(4.60)(5.40)(2.90)(2.09)2.82
Human toxicity: carcinogenic, inorganics0.750.280.700.820.210.800.850.500.90CTUh
(3.50)(2.35)(3.36)(4.00)(3.30)(3.95)(1.40 × 10²)(1.20 × 101)(1.30 × 10²)
Human toxicity: carcinogenic, organics0.680.350.700.790.260.780.950.300.95CTUh
(5.24)(4.26)(5.19)(1.50)(1.10)(1.40)(1.50 × 10²)(1.11 × 10²)(1.50 × 10²)
Human toxicity: non-carcinogenic0.550.450.600.800.300.720.850.400.75CTUh
(4.72 × 10²)(8.00 × 101)(4.60 × 10²)(3.10 × 10²)(3.80 × 101)(3.00 × 10²)(1.50 × 10²)(6.50 × 10²)(9.70 × 10²)
Human toxicity: non-carcinogenic, inorganics0.630.350.670.930.040.950.930.430.90CTUh
(3.80 × 10²)(7.80 × 101)(3.70 × 10²)(3.12 × 10⁶)(1.60 × 10⁶)(2.80 × 10⁶)(9.70 × 10²)(5.50 × 10²)(8.70 × 10²)
Human toxicity: non-carcinogenic, organics0.750.250.770.650.350.700.960.250.95CTUh
(9.50 × 101)(5.40)(9.5 × 101)(9.10)(7.10)(8.70)(1.10 × 10²)(7.60 × 10²)(1.10 × 10²)
Ionizing radiation: human health0.900.040.880.990.010.990.960.010.95kBq U235-Eq
(3.10 × 10⁹)(2.90 × 10⁹)(2.26 × 10⁹)(1.60 × 10⁹)(1.70 × 10⁹)(1.10 × 10⁹)(9.80 × 10⁸)(9.40 × 10⁸)(7.10 × 10⁸)
Land use0.950.040.940.880.150.850.950.200.95dimensionless
(6.70 × 10¹¹)(4.20 × 10¹¹)(6.41 × 10¹¹)(3.40 × 10¹⁰)(5.10 × 10⁹)(3.30 × 10¹⁰)(3.20 × 10¹⁰)(6.60 × 10⁹)(3.10 × 10¹⁰)
Material resources: metals/minerals0.850.100.880.680.310.650.950.180.93kg Sb-Eq
(2.80 × 10⁵)(9.34 × 10⁴)(2.61 × 10⁵)(6.12 × 10⁵)(4.30 × 10⁴)(6.00 × 10⁶)(1.20 × 10⁵)(6.12 × 10⁴)(1.10 × 10⁵)
Ozone depletion0.900.150.880.750.120.850.980.250.98kg CFC-11-Eq
(5.10 × 10⁴)(1.20 × 10⁴)(4.90 × 10⁴)(8.30 × 10²)(8.15 × 101)(8.20 × 10²)(5.80 × 10²)(5.20 × 10²)(5.80 × 10²)
Particulate matter formation0.850.140.880.750.300.700.990.020.99disease
incidence
(2.40 × 10³)(3.26 × 10²)(2.31 × 10³)(4.10 × 10²)(5.70 × 101)(3.90 × 10⁶)(3.80 × 10²)(3.10 × 10²)(3.82 × 10²)
Photochemical oxidant formation: human health0.600.350.650.870.150.850.970.290.96kg NMVOC-Eq
(2.10 × 10⁸)(2.10 × 10⁷)(2.10 × 10⁸)(8.10 × 10⁷)(9.11 × 10⁶)(7.83 × 10⁷)(5.70 × 10⁷)(8.50 × 10⁶)(5.60 × 10⁷)
Water use0.800.180.820.890.150.820.990.250.98m3 world Eq
deprived
(3.92 × 10¹¹)(1.60 × 10¹⁰)(3.92 × 10¹¹)(4.30 × 10⁹)(2.10 × 10⁸)(4.30 × 10⁹)(7.50 × 10⁹)(7.40 × 10⁸)(7.50 × 10⁹)
Table 9. Description of LCA indicators of overall polymeric materials and waste regarding the design of systems of sustainability in Europe *.
Country NameAmount of Waste (Mt)Acidification
(mol H+-Eq)
Climate Change
kg CO2-Eq
Climate Change: Biogenic
(kg CO2-Eq)
Climate Change: Fossil
(kg CO2-Eq)
Climate Change: Land use and Land Use Change
(kg CO2-Eq)
Ecotoxicity: Freshwater
(CTUe)
Ecotoxicity: Freshwater, Inorganics
(CTUe)
Ecotoxicity: Freshwater, Organics
(CTUe)
Energy Resources: Non-Renewable
(MJ, Net Calorific
Value)
Germany129.40 × 10157.20 × 10172.60 × 10151.60 × 10185.00 × 10157.10 × 10199.90 × 10192.50 × 10196.10 × 1021
Italy87.20 × 10105.00 × 10152.50 × 10143.90 × 10167.10 × 10143.70 × 10178.50 × 10181.10 × 10189.50 × 1020
France5.58.40 × 1084.50 × 10143.50 × 10127.50 × 10152.60 × 10134.10 × 10145.70 × 10161.95 × 10173.15 × 1019
Spain45.34 × 1066.50 × 10131.20 × 10129.41 × 10132.50 × 10136.50 × 10145.50 × 10157.91 × 10154.00 × 1017
Poland46.34 × 1075.83 × 10138.21 × 10128.50 × 10145.31 × 10139.20 × 10138.52 × 10158.21 × 10156.50 × 1017
The United Kingdom41.00 × 1089.34 × 10146.30 × 10138.32 × 10148.30 × 10136.30 × 10138.51 × 10149.20 × 10159.10 × 1017
Belgium2.51.10 × 1045.81 × 10108.50 × 1091.32 × 10103.70 × 10107.20 × 10116.23 × 10129.00 × 10135.20 × 1015
Luxemburg 2.55.20 × 1053.97 × 10103.45 × 1084.91 × 10109.10 × 10108.12 × 10117.10 × 10121.97 × 10131.50 × 1015
The Netherlands2.33.40 × 1041.35 × 10109.10 × 1079.00 × 10107.10 × 10104.93 × 10115.60 × 10115.50 × 10129.20 × 1013
Czech Republic1.91.10 × 1042.83 × 1094.20 × 1072.80 × 1097.30 × 1091.50 × 10101.30 × 10104.50 × 10111.20 × 1013
Austria1.82.60 × 1041.50 × 1093.70 × 1075.41 × 1098.51 × 1099.50 × 10106.30 × 10104.25 × 10119.20 × 1013
Portugal1.63.60 × 1053.75 × 1083.90 × 1076.40 × 1099.19 × 1097.20 × 10107.20 × 10105.50 × 10111.90 × 1013
Sweden1.75.10 × 1049.25 × 1099.70 × 1077.50 × 1095.21 × 1099.50 × 10109.12 × 1096.50 × 10103.50 × 1013
Hungary1.63.30 × 1055.63 × 1086.50 × 1071.60 × 1085.70 × 1098.10 × 10101.20 × 1095.90 × 10102.54 × 1012
Romania1.67.60 × 1043.50 × 1088.80 × 1079.92 × 1085.50 × 1095.60 × 10103.60 × 1092.90 × 1093.98 × 1011
Switzerland0.92.60 × 1035.47 × 1065.00 × 1051.70 × 1071.10 × 1076.50 × 1092.95 × 1089.50 × 1081.50 × 1010
Greece0.856.50 × 1033.81 × 1076.20 × 1044.50 × 1076.60 × 1069.60 × 1083.12 × 1078.50 × 1082.80 × 1010
Denmark0.707.10 × 1036.37 × 1053.00 × 1043.50 × 1067.50 × 1066.17 × 1082.70 × 1079.50 × 1079.20 × 109
Finland0.704.30 × 1034.54 × 1069.45 × 1037.16 × 1063.50 × 1063.60 × 1079.97 × 1087.25 × 1078.50 × 109
Slovakia0.503.14 × 1037.87 × 1054.56 × 1031.30 × 1065.31 × 1057.30 × 1062.97 × 1078.25 × 1061.50 × 107
Bulgaria0.456.91 × 1036.87 × 1063.81 × 1035.55 × 1053.41 × 1059.50 × 1068.20 × 1079.60 × 1062.50 × 107
Lithuania0.405.40 × 1031.20 × 1042.60 × 1031.50 × 1056.31 × 1059.30 × 1067.20 × 1068.10 × 1061.10 × 107
Ireland0.451.80 × 1038.27 × 1053.50 × 1036.60 × 1046.41 × 1058.70 × 1061.90 × 1073.85 × 1066.50 × 107
Slovenia0.355.21 × 1039.00 × 1043.10 × 1036.30 × 1043.52 × 1057.50 × 1068.20 × 1068.90 × 1052.55 × 106
Norway0.402.14 × 1036.45 × 1041.87 × 1035.90 × 1043.30 × 1041.50 × 1065.70 × 1065.10 × 1056.30 × 106
Croatia0.308.30 × 1031.50 × 1049.19 × 1038.90 × 1037.60 × 1047.50 × 1059.50 × 1057.50 × 1045.61 × 105
Latvia0.254.60 × 1029.00 × 1031.90 × 1026.90 × 1033.41 × 1038.40 × 1058.90 × 1059.50 × 1045.90 × 105
Estonia0.251.80 × 1029.97 × 1022.17 × 1025.50 × 1034.40 × 1038.50 × 1045.70 × 1059.50 × 1045.90 × 105
Cyprus0.159.00 × 1022.10 × 1021.90 × 1023.80 × 1038.36 × 1029.40 × 1034.26 × 1041.50 × 1034.65 × 104
Malta0.105.00 × 1021.20 × 101310 4.90 × 1029.70 × 1025.70 × 1035.10 × 1045.25 × 1032.50 × 104
* All values are scaled from a normalized reference system using country-specific polymer waste quantities. Values are model-based estimates and were recalculated to ensure consistency in units and scientific notation.
Table 10. Description of LCA indicators of overall polymeric materials and waste regarding the design of systems of sustainability in Europe *.
Country NameAmount of Waste (Mt)Eutrophication: Freshwater
(kg P-Eq)
Eutrophication: Marine
(kg N-Eq)
Eutrophication: Terrestrial
(mol N-Eq)
Human Toxicity: Carcinogenic (CTUh)Human Toxicity: Carcinogenic, Inorganics
(CTUh)
Human Toxicity: Carcinogenic, Organics (CTUh)Human Toxicity: Non-Carcinogenic (CTUh)Human Toxicity: Non-Carcinogenic Inorganic (CTUh)Human Toxicity: Non-Carcinogenic, Organics (CTUh)
Germany123.50 × 10116.55 × 10137.77 × 10149.504.956.209.90 × 1041.90 × 105140
Italy83.11 × 10103.60 × 10123.33 × 10138.704.205.259.50 × 1039.45 × 104135
France5.55.00 × 1095.66 × 10114.95 × 10127.503.954.955.72 × 1034.19 × 104130
Spain44.44 × 1085.50 × 10108.60 × 10117.213.404.503.60 × 1032.10 × 104120
Poland49.54 × 1089.20 × 10102.55 × 10117.103.504.101.50 × 1031.50 × 104115
The United Kingdom49.88 × 1086.90 × 10105.50 × 10117.153.554.051.15 × 1031.03 × 104113
Belgium2.51.66 × 1056.50 × 1089.15 × 1095.752.943.502.90 × 1029.50 × 103105
Luxemburg 2.53.33 × 1066.70 × 1088.77 × 1095.602.903.452.80 × 1028.90 × 103104
The Netherlands2.35.12 × 1058.80 × 1082.50 × 1095.452.853.302.60 × 1025.70 × 103101
Czech Republic1.97.77 × 1054.40 × 1079.60 × 1084.952.502.902.40 × 1024.50 × 10398
Austria1.85.55 × 1058.50 × 1076.70 × 1084.452.402.852.30 × 1022.90 × 10394
Portugal1.69.44 × 1045.60 × 1074.55 × 1084.502.202.702.20 × 1021.80 × 10392
Sweden1.71.90 × 1047.50 × 1069.50 × 1074.602.402.502.12 × 1022.70 × 10391
Hungary1.61.88 × 1049.50 × 1068.25 × 1074.402.352.401.50 × 1021.10 × 10388
Romania1.66.50 × 1048.50 × 1067.50 × 1074.212.342.451.20 × 1021.25 × 10389
Switzerland0.94.50 × 1034.50 × 1059.70 × 1063.901.902.2095.168.70 × 10276
Greece0.856.50 × 1031.95 × 1058.50 × 1063.701.852.1595.917.10 × 10270
Denmark0.705.70 × 1033.60 × 1056.12 × 1063.471.702.1589.176.90 × 10269
Finland0.709.00 × 1034.54 × 1055.40 × 1063.501.802.2079.156.70 × 10265
Slovakia0.507.12 × 1031.95 × 1059.90 × 1052.951.502.1075.705.80 × 10262
Bulgaria0.459.44 × 1029.50 × 1048.80 × 1052.801.402.0560.974.55 × 10261
Lithuania0.409.50 × 1028.50 × 1047.50 × 1052.781.302.0159.173.90 × 10257
Ireland0.452.50 × 1026.40 × 1046.50 × 1052.851.401.9558.194.10 × 10258
Slovenia0.359.80 × 1023.50 × 1039.50 × 1042.601.351.9055.173.10 × 10252
Norway0.406.50 × 1029.90 × 1039.20 × 1042.451.401.8555.472.90 × 10256
Croatia0.308.50 × 1025.60 × 1035.55 × 1042.301.201.8049.641.80 × 10249
Latvia0.25957.10 × 1028.50 × 1032.11.151.5044.681.60 × 10247
Estonia0.25924.60 × 1027.77 × 1032.051.101.4043.141.20 × 10245
Cyprus0.15816.10 × 1024.55 × 1031.901.021.3034.971.10 × 10239
Malta0.10701.50 × 1021.10 × 1031.800.951.2029.141.01 × 10233
* All values are scaled from a normalized reference system using country-specific polymer waste quantities. Values are model-based estimates and were recalculated to ensure consistency in units and scientific notation.
Table 11. Description of LCA indicators of overall polymeric materials and waste regarding the design of systems of sustainability in Europe *, **.
Country NameAmount of Waste (Mt)Ionizing Radiation: Human Health (kBq U235-Eq)Land Use
(Dimensionless)
Material Resources: Metals/Minerals (kg Sb-Eq)Ozone Depletion (kg CFC-11-Eq)Particulate Matter Formation
(Disease
Incidence)
Photochemical Oxidant Formation: Human Health (kg NMVOC-Eq)Water Use (m3 World Eq
Deprived)
Probability ScoreSustainability Score
Germany129.10 × 10119.50 × 10156.25 × 1069.85 × 1079.90 × 1078.50 × 10145.50 × 10170.951.05
Italy85.90 × 10108.50 × 10137.10 × 1053.25 × 1078.85 × 1068.21 × 10134.50 × 10160.861.16
France5.57.50 × 1095.10 × 10115.50 × 1051.25 × 1072.75 × 1067.90 × 10128.50 × 10160.751.33
Spain44.50 × 1084.70 × 10103.50 × 1058.55 × 1065.50 × 1066.10 × 10116.40 × 10150.671.50
Poland45.10 × 1086.10 × 1093.25 × 1057.50 × 1064.55 × 1066.56 × 10115.20 × 10150.621.60
The United Kingdom46.50 × 1087.50 × 1091.50 × 10155.50 × 1063.20 × 1065.12 × 10113.50 × 10150.681.50
Belgium2.58.80 × 1074.50 × 1088.25 × 1041.25 × 1067.60 × 1057.11 × 1098.10 × 10140.531.90
Luxemburg 2.57.10 × 1076.10 × 1087.10 × 1049.90 × 1056.70 × 1058.30 × 1097.50 × 10140.541.85
The Netherlands2.37.50 × 1078.50 × 1089.50 × 10158.30 × 1056.30 × 1055.22 × 1093.50 × 10140.511.96
Czech Republic1.95.10 × 1069.50 × 1062.10 × 1047.25 × 1055.50 × 1054.10 × 1087.50 × 10130.472.13
Austria1.85.10 × 1067.20 × 1061.50 × 1045.50 × 1054.20 × 1053.10 × 1084.50 × 10130.452.22
Portugal1.64.10 × 1064.20 × 1061.30 × 1044.50 × 1054.10 × 1052.22 × 1082.50 × 10130.462.17
Sweden1.71.90 × 1067.50 × 1061.50 × 1046.25 × 1053.85 × 1053.15 × 1081.50 × 10130.482.10
Hungary1.64.40 × 1065.50 × 1061.05 × 1044.25 × 1052.55 × 1051.10 × 1081.10 × 10130.442.27
Romania1.67.10 × 1063.50 × 1061.01 × 1043.25 × 1052.10 × 1051.01 × 1081.02 × 10130.452.22
Switzerland0.99.80 × 1057.10 × 1056.25 × 1037.50 × 1047.95 × 1048.10 × 1075.50 × 10120.382.63
Greece0.858.11 × 1056.50 × 1057.50 × 1035.50 × 1048.50 × 1044.58 × 1072.50 × 10120.362.77
Denmark0.705.10 × 1054.10 × 1055.50 × 1036.50 × 1047.40 × 1043.55 × 1071.90 × 10120.333.03
Finland0.703.50 × 1055.60 × 1054.50 × 1034.25 × 1046.50 × 1042.50 × 1071.50 × 10120.342.94
Slovakia0.502.10 × 1058.50 × 1043.70 × 1033.25 × 1044.44 × 1041.50 × 1077.50 × 10110.313.22
Bulgaria0.456.50 × 1044.50 × 1042.10 × 1038.50 × 1034.10 × 1048.25 × 1063.50 × 10110.293.35
Lithuania0.404.30 × 1047.50 × 1041.50 × 1037.50 × 1033.10 × 1045.10 × 1064.50 × 10110.274.76
Ireland0.454.50 × 1045.50 × 1043.50 × 1036.35 × 1032.50 × 1044.15 × 1063.75 × 10110.303.33
Slovenia0.356.30 × 1043.50 × 1049.90 × 1023.50 × 1032.10 × 1043.20 × 1062.50 × 10110.254.00
Norway0.403.50 × 1043.50 × 1041.05 × 1033.25 × 1031.05 × 1043.75 × 1064.50 × 10100.283.57
Croatia0.301.10 × 1041.50 × 1048.50 × 1024.40 × 1038.10 × 1039.60 × 1057.50 × 10100.244.16
Latvia0.257.40 × 1036.50 × 1037.50 × 1023.20 × 1037.33 × 1037.22 × 1051.50 × 10100.224.55
Estonia0.253.10 × 1037.55 × 1038.50 × 1022.25 × 1035.30 × 1034.10 × 1054.50 × 10100.214.76
Cyprus0.155.10 × 1035.20 × 1036.50 × 1021.50 × 1039.44 × 1021.20 × 1047.50 × 1090.195.26
Malta0.105.60 × 1028.50 × 1024.50 × 1029.50 × 1027.34 × 1027.10 × 1044.50 × 1090.156.66
* All values are scaled from a normalized reference system using country-specific polymer waste quantities. Values are model-based estimates and were recalculated to ensure consistency in units and scientific notation. ** Sustainability scores are dimensionless indices derived from normalized multi-indicator LCA results and probabilistic analysis. They do not scale linearly with waste volume.
Disclaimer/Publisher’s Note: The statements, opinions and data contained in all publications are solely those of the individual author(s) and contributor(s) and not of MDPI and/or the editor(s). MDPI and/or the editor(s) disclaim responsibility for any injury to people or property resulting from any ideas, methods, instructions or products referred to in the content.