1. Introduction
As global climate change intensifies, the environmental impact of greenhouse gas emissions has drawn increasing attention. The Product Carbon Footprint (PCF)—a key metric for assessing the total greenhouse gas emissions throughout a product’s lifecycle—plays an important role in promoting green and low-carbon development. Specifically, PCF refers to the cumulative greenhouse gas emissions generated from raw material extraction, production, transportation, use, and disposal, all expressed in carbon dioxide equivalents (CO2-eq). Quantifying a product’s carbon footprint helps us better understand its environmental impact, identify potential emission reduction opportunities, and provide a scientific basis for sustainable production and consumption.
PCF accounting is typically based on the Life Cycle Assessment (LCA) methodology [
1], which can cover either a “cradle-to-gate” or a “cradle-to-grave” system boundary [
2]. As a comprehensive and multidisciplinary approach, LCA evaluates the environmental impacts of products, processes, or services from their inception to their end of life—covering everything from raw material extraction and production to use, disposal, or recycling. Through LCA, we can gain deeper insights into product–environment interactions, thereby supporting decisions that minimize negative environmental impacts. Over the years, LCA-based PCF accounting has faced several structural bottlenecks, such as difficult data acquisition, complex processing, and a lack of standardization. Among these challenges, the most critical one is how to correctly match emission factors to activity data, especially when the LCA database contains a huge number of candidate factors. This process is known as the emission factor matching stage in Life Cycle Inventory (LCI) [
3].
Traditionally, emission factor matching has relied on manual screening by assessment experts within LCA databases. Even when supported by LCA software such as SimaPro (PRé Sustainability: Amersfoort, The Netherlands) or GaBi (Sphera: Leinfelden-Echterdingen, Germany) [
4], this approach remains not only time-consuming and labor-intensive but also expensive. Moreover, because experts have different knowledge backgrounds, the results often lack consistency and reliability [
5]. Given that an LCA process can involve tens of millions of activity data points and emission factors, manual matching simply cannot meet the timeliness and scalability demands of modern enterprises for PCF accounting. Early attempts at automated emission factor matching were mainly based on keyword searches or traditional semantic text similarity matching [
6]. However, when the activity data include many abbreviations, industry-specific terms, or vague descriptions, the accuracy of those methods drops significantly.
Embedding models rely on clear textual descriptions to generate accurate vector representations [
7]. In practice, however, companies often lack such high-fidelity data. Their information typically comes from sources like enterprise resource planning (ERP) systems, which tend to use abbreviations, domain-specific terminology, and sometimes even multiple languages. Manually creating standardized text descriptions would be too labor-intensive. At the same time, feeding this raw data directly into embedding models tends to produce inaccurate results. Another issue is that embedding models are usually trained on semantically similar, general web definitions, which may not align well with definitions related to greenhouse gas emissions. For example, when someone searches for “MacBook”, the fruit “apple” might still receive a high similarity score. To address these shortcomings, this study uses LLMs.
Retrieval-Augmented Generation (RAG) [
8,
9] offers a way to address these limitations. It does so by combining the reasoning and generation capabilities of LLMs with the ability to retrieve and integrate relevant information from external knowledge sources. A typical RAG system consists of two modules. The first is the retriever, which uses an embedding model to find relevant passages from a knowledge base. The second is the generator (i.e., the LLM), which uses the retrieved information to produce the final output. This approach has shown great promise, especially in open-ended question-answering and dialog tasks, because it improves the factual consistency and real-world grounding of generated text. Prompts also play a crucial role in RAG performance. Since LLMs are primarily trained with self-supervised learning objectives, their outputs are often highly sensitive to the prompts they receive. As the model’s initial context, prompts guide the generation process. When prompts are well designed, they can elicit the desired behavior from LLMs, leading to more accurate and relevant results across a wide range of tasks.
In this study, we propose an LLM-driven emission factor matching algorithm called EFMatch-LLM. This framework uses generative AI and the reasoning capabilities of LLMs to perform emission factor matching in PCF accounting. Moreover, EFMatch-LLM combines semantic embedding, semantic retrieval, and LLM techniques to match emission factors for process-level LCA tasks that demand high precision, a RAG module was integrated into the EFMatch-LLM framework to handle the vast search space that product matching entails. By retrieving relevant reference product metadata from the Ecoinvent database, the RAG component ensures that the matching process remains strictly grounded in standardized environmental knowledge. During the raw data reconstruction phase, RAG acts as a domain-knowledge foundation, it allows the LLM to cross-reference non-standardized industrial activity descriptions with authoritative technical specifications, so that the reconstructed data align with the physical and methodological logic required for LCA modeling. Our results show that by performing matching based on input activity data, the algorithm improves both the efficiency and accuracy of emission factor matching. Consequently, it enhances overall PCF accounting efficiency while keeping the outcomes timely and reliable.
The main contributions of this study are as follows:
We propose EFMatch-LLM, a two-stage emission factor matching algorithm that combines LLMs with semantic retrieval. This algorithm not only reduces the time needed for matching but also improves its accuracy. We tested it on eight key industrial products: tires, cement, ammonium phosphate, wood products, textiles, electronics and electrical appliances, steel, and lithium batteries. The results show that the optimal model achieved a matching precision of 95%. In addition, it demonstrated high precision: Precision@1 reached 80.3 and Precision@10 reached 84.5.
We also designed an LLM-based data restructuring method. This method converts obscure technical terms and abbreviations into easy-to-understand natural language text, thereby bridging the semantic gap. At the same time, we introduced a hallucination suppression mechanism to prevent the LLM from incorrectly matching emission factors.
We evaluated the algorithm using multiple LLMs, which confirmed the versatility of EFMatch-LLM. We also conducted ablation studies to verify how each module of the algorithm contributes to emission factor matching.
2. Related Work
LCA is a crucial method for identifying the environmental impacts of products, services, or systems throughout their entire life cycle. LCI databases, such as Ecoinvent and GaBi, provide existing information on the environmental impacts of various materials, products, and processes. This helps researchers obtain faster and more accurate LCA results for products (Pauer, Wohner, & Tacker, 2020) [
10]. Software like SimaPro and GaBi automate the LCA process, allowing users to conduct assessments with high accuracy and consistency (Herrmann & Moltesen, 2015) [
11]. Environmental Product Declarations (EPDs) offer standardized, independently verified reports on a product’s environmental impacts, making it possible to compare different product categories (Rasmussen et al., 2021) [
12]. Carbon footprint calculators let users compute emissions associated with a specific product or process, and they can serve as a simplified form of LCA (Zhong et al., 2019) [
13]. Aziminezhad et al. (2026) proposed an innovative framework that integrates LCA, circular economy (CE) strategies, and multi-criteria decision analysis (MCDA) [
14]. This framework enables robust sustainability assessments and decision support for recycled ordinary concrete and recycled geopolymer concrete at different compressive strengths. Taken together, these technologies and tools can reduce the environmental impacts of products and production processes, thereby supporting the transition toward a more sustainable future.
Large Language Models (LLMs) [
15] have become powerful tools in natural language processing (NLP) [
16], mainly because they can generate human-like text across various domains. Take GPT-4 (OpenAI: San Francisco, CA, USA) [
17] and Gemini (Google: Mountain View, CA, USA) [
18] as examples: these models are trained on massive text corpora using a self-supervised autoregressive approach. This training enables them to capture complex linguistic patterns and produce contextually coherent text. Furthermore, through prompt fine-tuning, LLMs can be further optimized to respond coherently to user prompts and deliver answers that align with human preferences. Having said that, general-purpose LLMs still struggle in specialized domains. For instance, they may generate hallucinations, show logical inconsistencies, or simply lack factual knowledge [
19].
In recent years, with the advancement of LLMs, researchers have been exploring how to apply them to LCA and PCF processes, aiming to bring automation and intelligent capabilities to core operations. Existing work mainly focuses on LCI construction, emission factor matching, data retrieval, and decision support. For instance, the “Tiangong” database project uses LLMs to help build China’s product carbon footprint background database. Through human–machine interaction tools, simply typing “carbon dioxide” (or any variant like “CO
2”) automatically retrieves relevant entries, which significantly improves data retrieval efficiency. LLM tools can also automatically convert unit process data collected by experts into the ILCD format for database entry. In terms of emission factor matching, Balaji et al. (2023) proposed the “Flamingo” algorithm, which uses pre-trained language models to automatically match product descriptions with environmental impact factors [
20]. On a test set of 664 products, it achieved a matching precision of about 75%. Castle et al. (2025) employed LLMs to automatically retrieve and link LCA database entries based on product bills of materials (BOMs), thereby reducing the need for manual data processing [
21]. Luo et al. (2023) introduced the AutoPCF framework [
22], which uses multiple general-purpose LLMs to automatically generate cradle-to-gate production process inventories for products. Semantic matching then assigns corresponding emission factors to each production step, ultimately calculating the product’s carbon footprint. Zhang et al. (2025) addressed the challenge of supply chain data transparency by proposing a distributed carbon footprint tracking model based on off-chain tracing and on-chain verification [
23]. Using blockchain technology and IPFS distributed storage, they built an interactive tracing framework that supports type filtering. This ensures that carbon emission data across long-distance supply chains remain tamper-proof and can be retrieved efficiently. Additionally, the PCF-RWKV model achieves automated lifecycle modeling and emission factor matching by employing a lightweight RWKV architecture and multi-agent technology [
24]. These approaches take advantage of LLMs’ natural language understanding and generation capabilities. They help construct lifecycle inventories and background databases more efficiently, and automatically match emission factors, thus speeding up carbon footprint estimation.
Another line of research focuses on using LLMs to interpret LCA and PCF results and to support decision-making. Preuss et al. (2024) proposed building an LLM-based LCA collaborative assistant [
25]. First, they extract metadata from LCA studies—such as target scope, system boundaries, and functional units—through systematic literature reviews, and then construct a high-quality vector database. Next, they develop an AI assistant using RAG, which enables decision-makers to quickly compare assumptions and results across different studies. For example, the study explicitly defines “selection of LCA methodology” as one target scope attribute, and the LLM extracts this information from the literature. This collaborative assistant helps users identify differences in assumptions across studies and see how those differences affect product carbon footprint results, thereby facilitating rapid low-carbon decision-making. Preuss et al. established a theoretical foundation for automating LCA tasks and mitigating the hallucination problem. Their work, however, remained largely conceptual. To address the specific limitations they identified, especially those related to data consistency and the integration of large language models (LLMs) into standardized accounting workflows, we propose the EFMatch-LLM algorithm, which extends these ideas into a practical, automated solution.
While these LLM-based approaches advance result interpretation and decision support, the underlying LCA software tools still rely heavily on manual database mapping, which can introduce inconsistencies. Traditional tools such as SimaPro and GaBi are robust but highly sensitive to manual database mapping and practitioner interpretation. This sensitivity can cause results to vary considerably from one assessment to another. EFMatch-LLM addresses this limitation by using semantic reasoning to automate the identification and matching steps, which reduces the risk of human error and helps maintain methodological consistency, even across complex industrial datasets.
Despite these advances, existing solutions such as Flamingo and AutoPCF still largely treat emission factor matching as a direct text-similarity task. As a result, they are highly susceptible to the semantic noise and non-standard terminology common in raw industrial activity data. Meanwhile, PCF-RWKV optimizes deployment efficiency, but it does not provide an explicit mechanism to narrow the immense search space of global LCA databases without sacrificing matching precision.
The main innovation of this work lies in the EFMatch-LLM algorithm, which moves beyond simple semantic alignment and instead enforces compliance with physical and methodological logic. During a dedicated data reconstruction phase, EFMatch-LLM uses a RAG-driven domain-knowledge reference point to cross-reference raw descriptions with authoritative LCA standards, thereby neutralizing industrial noise. The algorithm also follows a hierarchical two-stage strategy: first, it identifies reference product categories to prune the database search space rapidly; then, it performs high-precision embedding-based matching. This design allows EFMatch-LLM to achieve higher accuracy and robustness in complex, real-world accounting scenarios than existing single-stage or purely generative frameworks.
3. Materials and Methods
3.1. Architecture of the EFMatch-LLM Algorithm
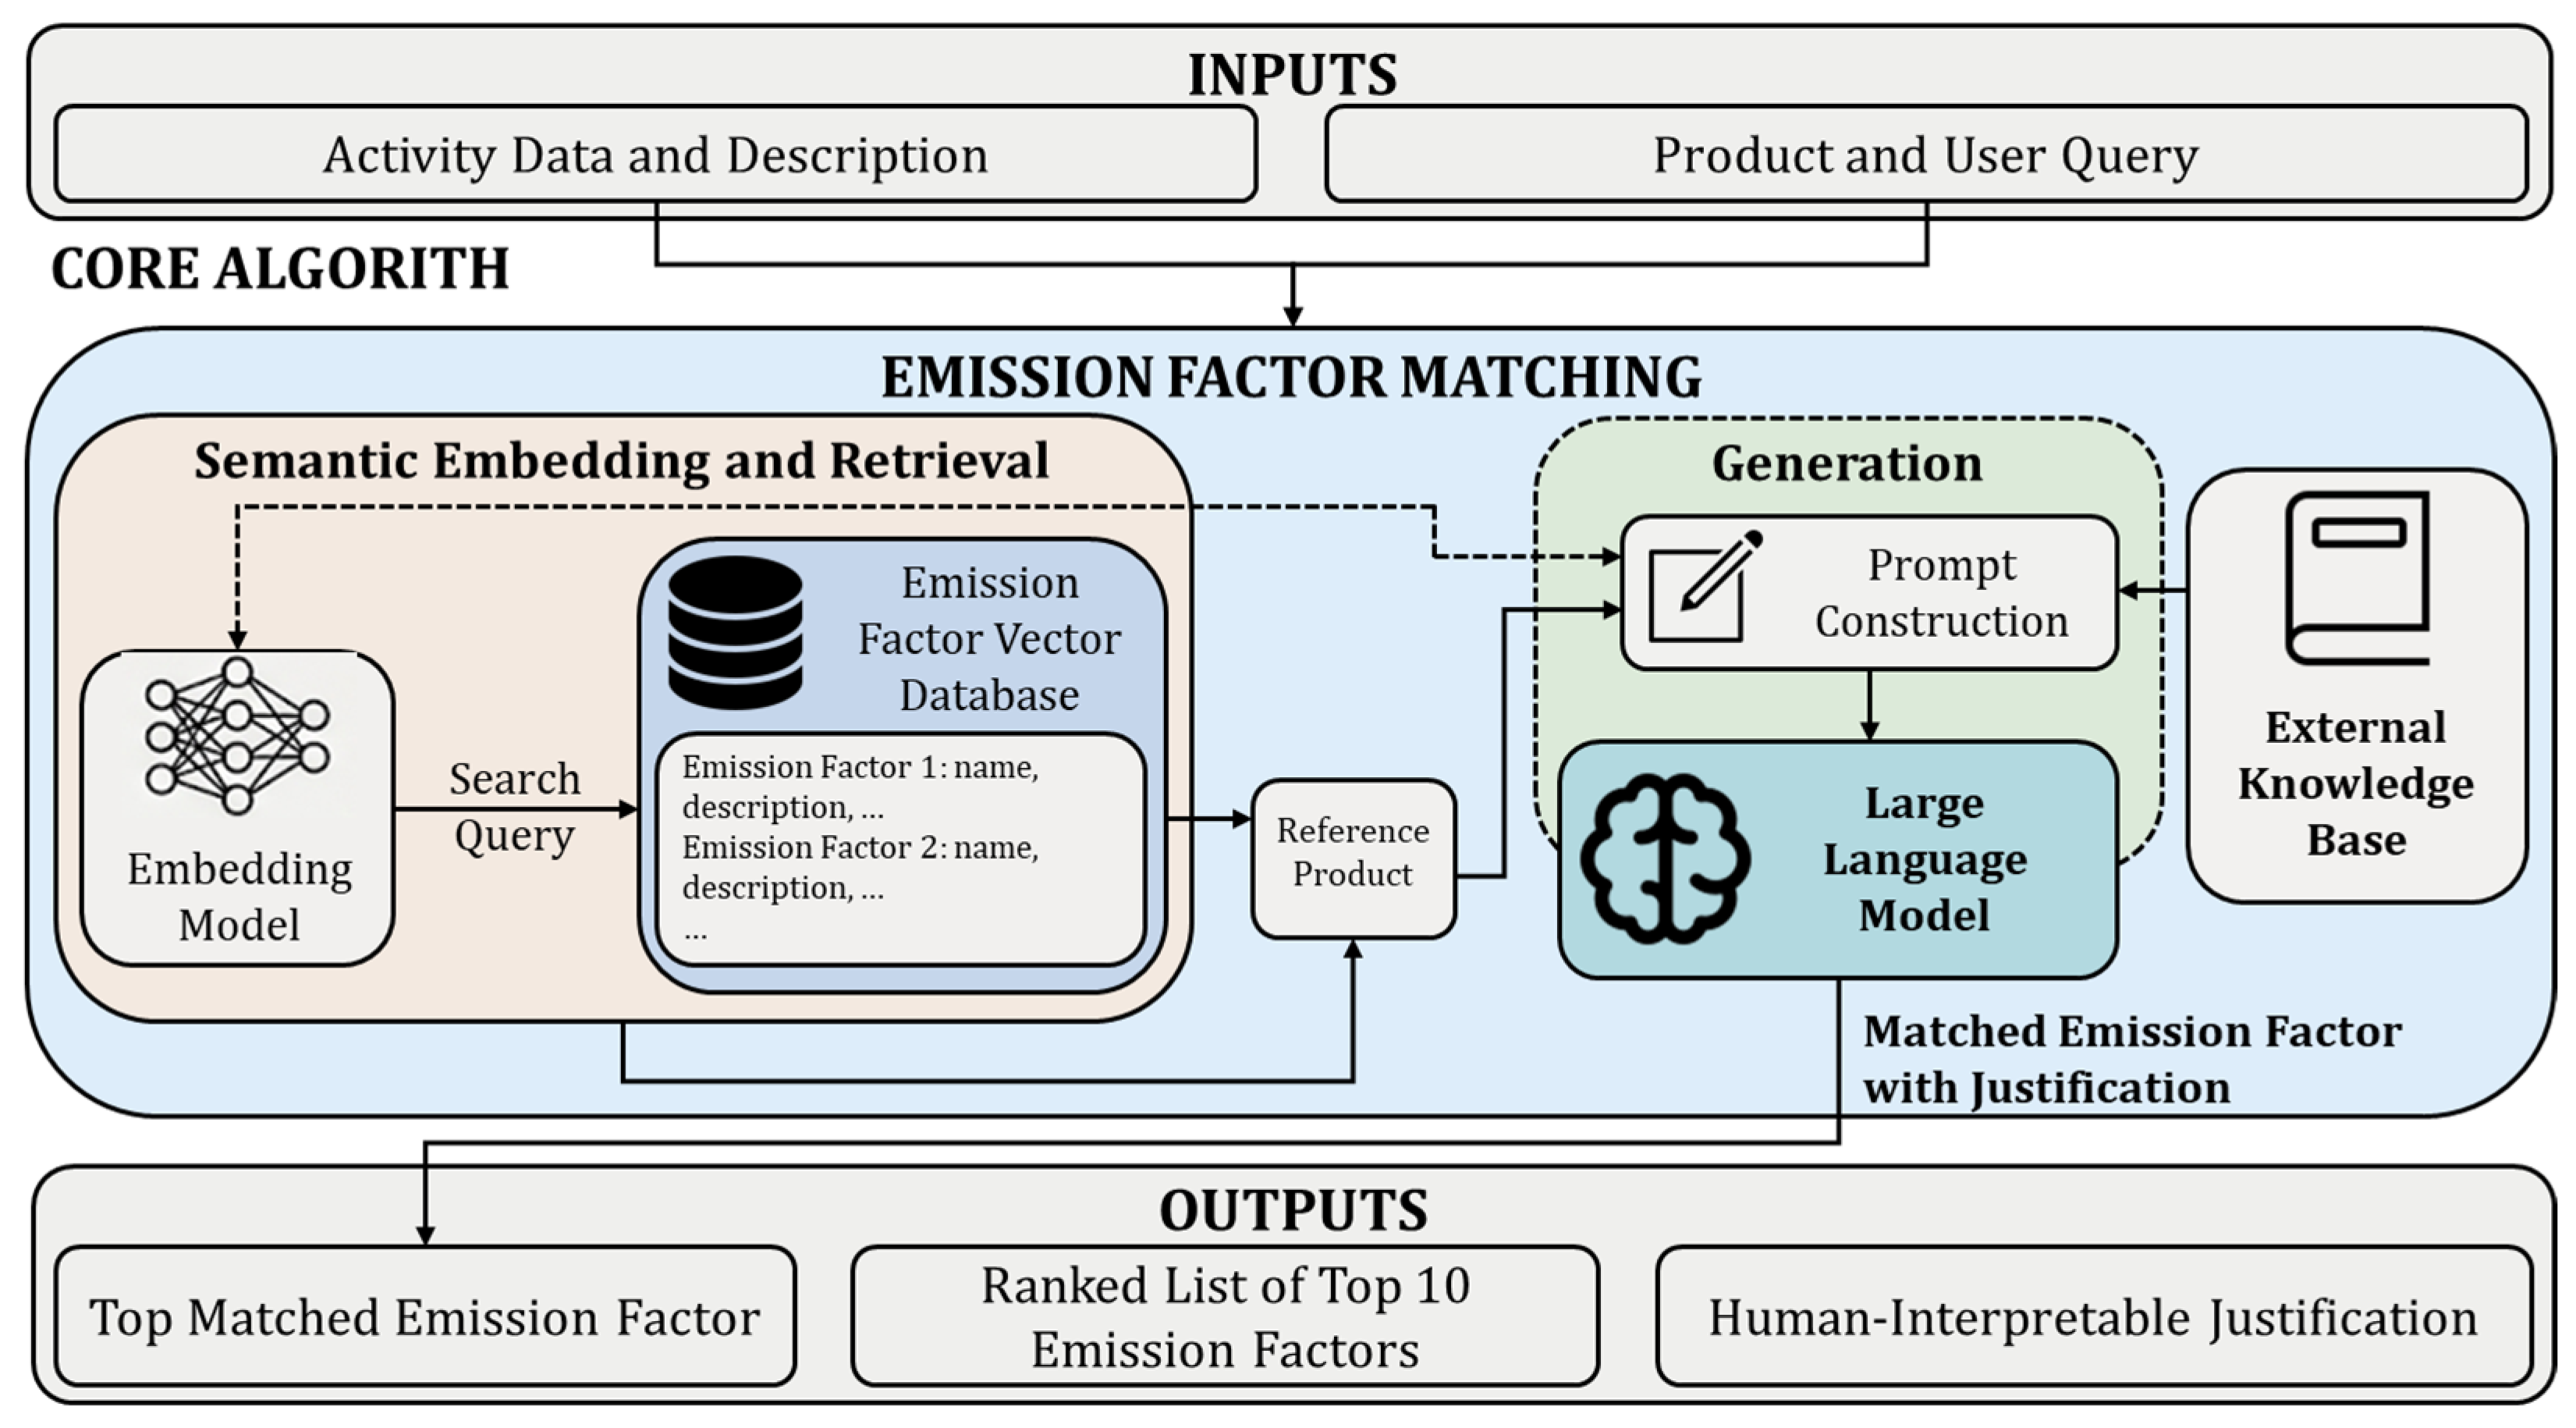
The EFMatch-LLM algorithm uses a two-stage matching method to recommend process emission factors, as shown in
Figure 1. The figure illustrates the structural integration of the components introduced in
Section 3.1. Raw activity descriptions and user queries enter through the Inputs module and are passed to the Core Algorithm. There, the Reference Product acts as a pivotal node, enabling vector-based retrieval within the RAG framework to achieve high-precision matching. The Outputs section then presents the three result formats that EFMatch-LLM provides: the singular optimal match, a ranked candidate list, and a human-interpretable justification. All three outputs are grounded in the RAG mechanism, which serves to bridge the gap between industrial data and LCA standards.
In the first stage, the LLM takes several inputs from the prompt: the target industrial product, the activity data, and the emission factors, along with a complete and detailed description of the processes they cover. Based on these, it identifies the “reference product” metadata for the target industrial product within the Ecoinvent 3.10 database. Once the reference product is found, the model captures a macro-level description of the product to which the emission factors refer. Then, it leverages the LLM’s built-in industry common sense and its knowledge of materials and process science to quickly narrow the search scope. In other words, it reduces the vast LCA database down to a set of relevant sub-sectors.
If the product metadata is missing in the database, alternative classification systems—such as international standard industry classifications or the Central Product Classification—can be used as substitutes. For a specific query, the model first identifies the closest matching reference product, and then retrieves the corresponding emission factors from it. During this first stage, the LLM processes synonyms and specialized knowledge related to materials science, which allows it to rapidly narrow the search space from all 23,000 emission factors in the database down to just a few dozen relevant candidates.
After the reference product is identified, the algorithm moves to the second stage. First, the LLM extracts all emission factors associated with this set of reference products. These factors may differ in terms of origin, production route, transportation method, or time frame of impact. The LLM then passes these emission factors, along with their detailed process descriptions, to the semantic embedding model.
Once it receives this information, the embedding model performs a refined search. It calculates the cosine similarity between the activity data and the emission factors (including their macro-level descriptions), and then selects the K emission factors that are semantically closest. After that, the embedding model sends these shortlisted emission factors back to the LLM.
The LLM then rescreens and reorders them, drawing on its own knowledge and various LCA expertise stored in the vector database. Finally, it outputs the best-matching emission factors and provides a justification for its recommendation. One important note: if a reference product is missing, or if there is a mismatch in system boundaries or a missing process step, the LLM must strictly output “No match”.
Definition of Ground-Truth Reference Products
To minimize subjective bias and anchor the evaluation of the first stage in objective methodological and physical causality rather than arbitrary expert preference, we designed a rigorous, deterministic hierarchical protocol for defining the ground-truth reference products. Specifically, the labels were constructed according to four objective criteria.
First, taxonomical alignment requires that a candidate reference product strictly belong to the matching hierarchical category under the United Nations Central Product Classification (CPC) system or the International Standard Industrial Classification (ISIC), as employed by the Ecoinvent database structure. Second, material and functional equivalence must be satisfied: the process boundaries, core material composition, and functional units described in the database entry should align precisely with the physical and technical inputs documented in the raw activity data. Third, geographical and technological consistency is maintained by selecting regional market datasets together with the appropriate production technologies, following Ecoinvent’s official system models so that they reflect the actual supply chain context of the product. Fourth, a double-blind verification protocol was implemented to prevent individual expertise from introducing subjective bias. The reference labels were independently developed by multiple certified LCA practitioners through a double-blind annotation process; any discrepancies were resolved not by arbitrary consensus, but by deterministic cross-referencing with Ecoinvent’s validation reports and data documentation.
This structured approach ensures that the reference product labels represent true methodological and technical conformity. As a result, the LLM is evaluated against objective environmental accounting rules rather than merely catering to subjective expert judgment.
3.2. Activity Data Generation
In LCA methodology, activity data refers to the total energy consumed during production, the mass of raw materials input, the energy expended in transporting goods, or the specific quantities involved in waste disposal. Logically, activity data serves as the critical variable in PCF accounting, with the accuracy of this parameter directly determining the reliability of the final assessment results. By combining activity data with specific emission factors, various environmental impact indicators—such as global warming potential, acidification potential, and resource depletion levels—can be quantified. The resulting assessments then evaluate the environmental impact of production activities.
LLMs demonstrate exceptional capabilities across a wide range of NLP tasks and can acquire text content relevant to research objectives and target products through prompt tuning and contextual learning approaches. This feature enables researchers to rapidly define system boundaries and emission inventories for target products in PCF accounting tasks based on LCA methodologies.
This study enables LLMs to automatically generate and output activity data related to target industrial products by constructing prompt words and integrating RAG, while supplementing this activity data with semantic descriptions. However, not all LLMs can generate reasonable activity data relevant to target industrial products. Therefore, this study employs the powerful GPT-4o (OpenAI: San Francisco, CA, USA) with its massive parameter count to directly generate activity data for target industrial products on October 2025.
3.3. Raw Data Reconstruction
During the initial phase of LCA, the core challenge in data processing is that raw activity descriptions are often non-standard. These data typically come directly from corporate financial systems, procurement records, or bills of materials. As a result, they contain many specialized abbreviations, internal financial codes, and non-standardized terminology. To eliminate this noise and extract the core semantics that carry physical meaning, this study introduces an LLM-driven data reconstruction method. By leveraging the extensive common sense and domain expertise embedded in pre-trained models, we map all non-standard raw data into a unified semantic space.
The process works as follows. First, a pre-trained embedding model maps the raw data into a high-dimensional vector space. Then, the LLM comes into play. Because the LLM has been pre-trained on large amounts of technical documentation, industry standards, and web data, it can recognize and expand abbreviations that appear as almost unintelligible text to the embedding model. It can also translate them as needed. At the same time, we use specific prompts to guide the LLM to act like a senior LCA expert. This ensures that the rewritten activity data retains LCA-specific knowledge. Finally, we introduce RAG into the process. This requires the LLM to reconstruct heterogeneous data based on authentic PCF reports, LCA standards, and product reports, which helps keep the newly generated data objective.
This modification and reconstruction of activity descriptions takes place in real time for each individual query, rather than as a one-time pre-processing step applied to the entire database. This dynamic, query-level approach enables the EFMatch-LLM framework to handle the inherent heterogeneity and high noise levels typical of raw industrial data. In practice, reconstructing each input string when inquiry allows the system to tailor the standardization process. For example, by stripping query-specific financial noise or enriching physical parameters. As a result, the resulting description achieves strong semantic alignment with the technical nomenclature of the LCA database before proceeding to the embedding matching stage.
3.3.1. Activity Data and Emission Factor Descriptions Rewriting Based on LLM
When data on the environmental impacts of specific products or services is lacking, the Ecoinvent database can provide first-order approximations of PCFs. In addition, estimates can also be derived from descriptions of business activities and the associated expenditure data. However, these seed files often contain abbreviations for financial terms, domain-specific terminology, and other cryptic expressions. Therefore, using an LLM to generate plain-text descriptions of queries can significantly improve the ability of embedding models to retrieve semantically relevant results.
On the other hand, while embedding models are good at retrieving emission factors that relate to given activity data, the factor ranked highest by cosine similarity is not necessarily the most appropriate one. Selecting the correct emission factor requires identifying the industry sector that truly reflects the greenhouse gas emissions associated with a specific product. To address this issue, we use an LLM to modify the description of the input activity data. Then, based on the descriptions in the Ecoinvent database, we recommend the optimal emission factor, and we incorporate the relevant instructions into the prompt.
Rewriting activity data and emission factor descriptions does more than just identify specific terms. It also resolves abbreviated units of measurement, thereby providing a high-quality textual foundation for subsequent vectorization. In this way, business data that originally belonged to different namespaces and contexts is mapped into a unified semantic space. This significantly reduces the ambiguity that embedding models may encounter when dealing with synonyms or complex contexts. As a result, it lays a solid corpus foundation for achieving automated matching across industries and domains.
3.3.2. Data Standardization and Semantic Alignment
After the initial text rewriting, the model must perform further standardization and semantic alignment. The goal is to make the parsed descriptions of activity data match the highly specialized terminology used in the emission factor database. Emission factor databases typically adopt precise scientific terms, which may vary by region. In contrast, corporate input data often uses common names for products and byproducts. This mismatch makes traditional keyword-based searches ineffective.
To address this, we construct a dynamic semantic alignment layer. This layer uses the reasoning capabilities of large language models (LLMs) to automatically identify relationships between synonyms, scientific names, and commercial terms. It also introduces mandatory alignment through unique identifiers for key industrial product sectors. When the system recognizes a unique identifier, the model prioritizes retrieving entries with the same number from the database, and then uses them as a benchmark for secondary verification. If a unique identifier is missing, the model instead relies on enriched semantic context to perform a more robust matching calculation. This ensures that even when terminological descriptions are extremely sparse, the model can still capture the core environmental characteristics of the operational data.
3.3.3. Recognition and Conversion of Industry Terminology
For complex industrial processes and the field of materials science, the algorithm includes a comprehensive mechanism for recognizing and converting industry-specific terminology. This mechanism does more than just look at lexical relevance. It also explores the logical relationships between material composition and manufacturing processes. For example, when the model encounters a specific type of polymer, it can recognize that this material falls under the category of “polyethylene terephthalate”. Then, it links the polymer to the corresponding benchmark emission factors in the database.
Furthermore, for products with composite properties, the model can automatically identify their primary components and processing levels. Take the difference between “natural rubber” and “synthetic rubber”. The model can distinguish their fundamental environmental impact differences, which allows it to provide sufficient technical details during the rewriting phase. Those details, in turn, support more precise subsequent matching.
Through this comprehensive terminology recognition and conversion mechanism, the model effectively reduces the comprehension bias caused by industry barriers. It achieves a smooth transition from unstructured text to standardized technical descriptions. As a result, the system’s robustness and accuracy are significantly improved when processing multi-source heterogeneous data.
3.4. Semantic Embedding and Retrieval
The embedding model converts the normalized text into high-dimensional dense vectors. The main goal here is to maximize recall. In other words, we want the most relevant matches to appear among the top 10 to 20 candidates. The more detailed precision calibration and exclusion logic are then handled by the LLM in later stages.
Specifically, we first use the BERT model (bert-base-uncased, version 1.0) to map text fragments of any length into 768-dimensional vectors [
26]. This allows the geometric distance between vectors to directly reflect the semantic relationships between texts. This vectorization approach goes beyond traditional term frequency-inverse document frequency (TF-IDF) methods [
27], because it captures the deeper meanings of words and their conceptual associations within specific contexts.
Mathematically, each query and each emission factor entry is encoded into an embedding vector, denoted as and respectively, and stored in an efficient vector index database that supports millisecond-level similarity retrieval. This deep representational capacity allows the model to capture complex logical relationships. For example, the model can recognize that a specific product instance belongs to a broader parent category. As a result, it can filter out a lot of superficially similar but actually unrelated entries during the initial retrieval stage.
After vectorization, the matching problem becomes a matter of computing a metric in a vector space. Our model primarily uses cosine similarity as the core measure for quantifying how semantically close two texts are. The formula for cosine similarity is:
Here,
denotes the embedding vector of the
-th LLM-reconstructed activity description, while
denotes the embedding vector of the
-th candidate emission factor entry in the LCA database. The fine-tuned embedding model maps both vectors into a shared high-dimensional semantic space and computes their cosine similarity. A higher cosine value therefore signals a stronger semantic relationship between the industrial activity and the corresponding environmental impact factor. The closer the cosine similarity value is to 1, the more semantically consistent the two text segments are. During the initial search, the algorithm performs a full scan of all emission factor entries in the database. It calculates the cosine similarity between the query vector and every vector in the candidate set, and then extracts the top K most similar results. After that, the system ranks these results in real-time, in descending order of similarity scores.
One advantage of this vector-based approach is that it uses the geometric properties of the vector space model. Semantically similar entries end up closer together in that space, which helps overcome the limitations of purely text-based matching. In addition, to keep query latency very low even with large-scale datasets, the system incorporates approximate nearest neighbor search technology. This ensures that the most similar candidates can still be accurately identified, even under high concurrency. The vectorized retrieval is not only fast but also quite robust—it can tolerate spelling errors, changes in word order, and synonym substitutions.
3.5. Matching Constraint Mechanism
Process LCA places very high demands on accuracy, the stringent requirements for data quality and result accuracy are clearly defined by the international standard ISO 14044:2006 [
28]. This standard breaks down data quality requirements into several dimensions—temporal coverage, geographical coverage, technological coverage, precision, completeness, representativeness, consistency, reproducibility, data sources, and uncertainty—and it mandates that all comparative LCA studies address each of these aspects [
29]. Precision here refers to how closely the data reflect the true value, while uncertainty captures the variability and reliability of the data. In addition, the ISO 14040 and ISO 14044 standards require that sensitivity and uncertainty analyses be performed during the life cycle interpretation phase, so that the objectivity and robustness of the conclusions can be ensured [
28,
30,
31].
The query data must include detailed information about a specific product, mainly covering its bill of materials, manufacturing processes, and transportation methods. Emission factor databases contain numerous highly specialized terms across a wide range of industries. Although each emission factor is specific to a particular product, there may still be missing entries in the database.
When responding to queries about target industrial products, the EFMatch-LLM algorithm may occasionally output incorrect emission factors. This can happen when the LCA database lacks any emission factor relevant to the target product. In such cases, the LLM might ignore the actual situation and incorrectly match an emission factor to the activity data, which significantly increases the risk of misleading PCF accounting results. The root cause of this problem lies in how LLMs operate: they rely on the probability of word occurrence rather than genuine understanding to make predictions and generate outputs. To reduce such erroneous matches, this study introduces a matching constraint mechanism. Specifically, when the LLM cannot find a reference product for the target industrial product in the LCA database, or when none of the candidate emission factors from the reference product meet the system boundary requirements—meaning the cosine similarity does not reach the specified threshold—the algorithm must output a “No match” result and provide an explanation. Because incorrect data in LCA can be highly misleading, this mechanism helps prevent wrong attributions in LCA.
According to the definition of “matching”, the key to emission factor matching is knowing when a given query does not correspond to any valid emission factor in the database. Relying solely on a distance threshold based on semantic text similarity is not enough to determine a “non-match”. Therefore, we use an LLM to assess whether a suitable match exists among the ranked list of semantically similar emission factors. By providing additional context through prompts and incorporating expert knowledge, the LLM can be guided to make appropriate recommendations.
Determining whether a recommendation is a “match” or a “non-match” is critical for evaluating the accuracy of the LLM’s suggestions. In this study, a recommendation is considered a match only when the system boundary of the emission factor fully aligns with the query input. For example, we judged that the emission factor for “natural rubber” does not match that for “styrene-butadiene rubber”, because there is insufficient data to compare their production processes. Similarly, “logs/roundwood” is not a good match for “wood chips/sawdust”, since the latter excludes other ingredients and the processing steps at sawmills. This strict definition provides an objective standard. In practice, however, LCA experts may make different choices depending on available data and research objectives. Importantly, even if the algorithm outputs “No match”, it will still list the emission factor that is closest to the query. Therefore, the algorithm remains useful when human experts intervene.
4. Results
This study evaluates the model using emission factors from the “cradle-to-gate” production stage. All emission factors come from the Ecoinvent 3.10 database, which covers a variety of functional units. For example, it includes the carbon dioxide equivalent (kg CO2-eq/kg material) emitted per kilogram of material produced, the CO2 equivalent emitted per kilowatt-hour of electricity consumed, and the CO2 equivalent emitted from fuel per ton-kilometer of freight transported.
Unlike LCA practitioners in real-world applications, EFMatch-LLM does not combine emission factors from raw material production with those from manufacturing processes. For process-level LCA, the emission factors used must cover the entire “cradle-to-gate” system boundary for a given query. If the available data only covers part of the process, then the actual value is marked as “No match”. The performance of EFMatch-LLM is evaluated using the following four metrics:
Precision@K: This metric measures the proportion of correct matches among the top-K results in the query’s output list. The choice of K depends on how the algorithm is used to evaluate model performance. Top-1 corresponds to a fully automated solution. If this metric is 90%, it means there is a 10% chance that the selected emission factor is wrong. Top-10 represents a scenario where human reviewers are given ten recommended emission factors for a specific activity data, and they then pick the right one for PCF evaluation. In this case, if Precision@10 reaches 90%, it means that in 90% of cases, human experts can find the correct emission factor within the top ten recommendations. The model presents up to ten options to the user, and the LLM ranks these options from highest to lowest relevance. This ranking helps reduce the time users spend sifting through candidates.
Mean Absolute Percentage Error (
): Unlike direct emission factor matching,
evaluates prediction accuracy from the perspective of the PCF accounting. It does so by comparing the predicted emission factors
with the correct ones
. For each user query, the system computes the difference between the CO
2 impact value of the predicted emission factor and that of the actual emission factor. The formula for
is as follows:
: In process LCA scenarios, there may be activity data for which no exact emission factor can be matched. In such cases, both human experts and the model will mark the matching result for that activity data as “No match”.
is calculated only for those activity data that do have valid emission factors. Unlike Precision@K, this metric is computed within the subset of matchable queries, denoted as
, where the ground truth
, and
is the predicted emission factor. Specifically, its denominator
remains constant, while the numerator increases only when the model correctly identifies the exact non-empty emission factor. Consequently, any conservative bias, such as a tendency to over-predict “No Match”, incurs a severe penalty because it raises the number of false negatives, which directly causes
to drop rapidly. In this way, the mathematical formulation guarantees that the metric cannot be artificially inflated by a model’s inclination to output “No Match”. The formula for
is as follows:
Latency: This metric reflects how long the algorithm takes to return a matching emission factor after receiving input. Latency is important because it helps evaluate both the cost and the response speed of the algorithm. Smaller LLMs tend to offer lower latency and cost, but their performance is correspondingly weaker.
All experiments were conducted on a server equipped with four 4090 GPUs and 96 GB of VRAM. In this study, we used BM25 (via Rank-BM25 library version 0.2.2) and SBERT (all-MiniLM-L6-v2, version 2.2.0) as baselines and three different LLMs, Qwen2.5-1.5B, Qwen2.5-7B, and Llama3.1-8B, to investigate and evaluate emission factor matching. The experimental results are shown in
Table 1.
The results show that all three performed well, both in fully automatic mode (Precision@1) and as an auxiliary tool for LCA experts (Precision@10). In fully automatic operation, Llama3.1-8B achieved a correct matching rate of 82.6%, the highest among the three. When performing LCA emission factor matching tasks, Qwen2.5-7B achieved a of 95.0%. This means the model can match precisely when correct emission factors exist, and otherwise output a “No match” result. Llama3.1-8B had a of 12.0, indicating that its matched emission factors had relatively small numerical errors. Qwen2.5-1.5B and Qwen2.5-7B also had relatively low error values, though both were slightly higher than Llama3.1-8B’s. The traditional BM25 method, which captures only lexical matching, performs poorly in terms of Precision@K and , confirming that simple retrieval-based approaches struggle to handle industrial term ambiguity and abbreviations. The SBERT pre-trained model achieves some improvement in semantic retrieval but still neglects domain-specific background knowledge. These metrics confirm that our algorithms achieve very high correct matching rates and .
In terms of latency, Qwen2.5-1.5B took the least time to complete the task: only 8.3 s. The other two LLMs were slightly slower, but all three significantly reduced the time required compared to manual matching by LCA experts. This proves that our algorithm can greatly improve the efficiency of PCF accounting.
In the ablation study, we investigated the contribution of each module in EFMatch-LLM by selectively removing steps and measuring the impact on performance.
Table 2 shows experiments on LCA emission factor matching using activity data generated by GPT-4o. We found that data reconstruction led to a decrease in accuracy. This may be because the model focuses on the main components of the input data while ignoring or losing information about other distinct components. As a result, after data reconstruction, the emission factors lack certain details. For example, a model with the data reconstruction step classified “precipitated silica” as “carbon black.” In this case, the correct output should have been “No match”, because the “precipitated silica” entry involves the reaction of sodium silicate with sulfuric acid and an energy-intensive drying step, details the LLM did not account for. Specifically,
decreased by 16.8%, indicating that inappropriate data rewriting can interfere with correct matching.
In process LCA, EFMatch-LLM first performs a preliminary screening of the reference products to which the input industrial products belong, and then proceeds to final emission factor matching. When we omitted this reference product selection step, dropped by 5.6%. This confirms that the step helps narrow down the range of emission factor types that need to be considered in the final matching task. In the study mentioned before, the model performs emission factor matching during the reference product step and averages the emission factors that belong to a single reference product. Due to the specificity of emission factors, the performance of previous state-of-the-art algorithms that relied on semantic matching declined significantly. Our ablation experiments show that with reference product selection, all performance metrics (Precision@1, Precision@10, and ) improved.
When the algorithm uses semantic matching alone, it becomes clear that it cannot complete the task. The message “Precision@1 is 0.0%” indicates that the algorithm failed to find any correct emission factor. In this situation, the PCF accounting produced by the algorithm would inevitably be wrong. This confirms that the algorithm relies heavily on the reasoning logic of the LLM. Conversely, when the LLM works alone (without semantic matching), the model can sometimes identify the correct emission factors for the activity data. However, the numerical errors in those emission factors are too large, and the matching process takes too long. This suggests that an LLM alone finds it difficult to match emission factors accurately from the entire database. Therefore, we need both RAG and embedding models to improve the algorithm’s accuracy and matching efficiency.
When we use activity data generated directly by LLMs together with the Ecoinvent 3.10 database, LLMs with larger parameter counts perform better than those with smaller ones. Meanwhile, smaller LLMs offer higher computational speed and lower latency. Specifically, Qwen2.5-7B and Llama3.1-8B outperformed Qwen2.5-1.5B on all four metrics: Precision@1, Precision@10, , and . However, because Qwen2.5-1.5B has fewer parameters, it runs faster and therefore has lower latency. Overall, the better performance of the larger models indicates that LLMs with more parameters tend to work better for emission factor matching. In summary, when LLMs perform this task, they need more precise instructions, larger parameter sizes, and up-to-date domain knowledge.
Overall, the collaboration between the LLM and the embedding model is essential in our algorithm. When semantic matching is removed, the algorithm cannot perform emission factor matching correctly.
We also ran experiments using different semantic embedding models and varying vector space dimensions. The results are shown in
Table 3. After changing the embedding model, the fully automatic algorithm achieved a maximum accuracy of 98.1%, and the human-assisted algorithm reached up to 100%. In general, the choice of embedding model did not have a significant impact on the overall performance of the emission factor matching model. Experiments on activity data generated by the LLM show that Precision@10 is around 100 for nearly all embedding models. However, there are noticeable differences in Precision@1 across the dataset. This suggests that the order in which emission factors are presented to the LLM influences the final matching results. Additionally, vector dimension size affects Precision@1 to some extent, but it has virtually no impact on Precision@10.