Article

Sustainable Use of Rapeseed (Brassica napus L.) Meal as a Functional Ingredient in Bread: Impact on Dough Rheology, Nutritional Profile, and Bread Quality


1
Faculty of Food Engineering, University of Life Sciences “King Mihai I” from Timisoara, Aradului Street No. 119, 300645 Timisoara, Romania
2
“Food Science” Research Center, University of Life Sciences “King Mihai I” from Timisoara, Aradului Street No. 119, 300645 Timisoara, Romania
3
Doctoral School, University of Life Sciences “King Mihai I” from Timisoara, Aradului Street No. 119, 300645 Timisoara, Romania
4
Faculty of Agriculture, University of Life Sciences “King Mihai I” from Timisoara, Aradului Street No. 119, 300645 Timisoara, Romania
5
S.C. PROSPERO S.R.L., Timisoara, Strada Gheorghe Lazăr 26, 300081 Timisoara, Romania
*
Authors to whom correspondence should be addressed.
These authors contributed equally to this work.
Sustainability 2026, 18(11), 5441; https://doi.org/10.3390/su18115441 (registering DOI)
Submission received: 27 April 2026 / Revised: 19 May 2026 / Accepted: 25 May 2026 / Published: 28 May 2026
(This article belongs to the Special Issue Sustainable Food Processing and Chemical Analysis)

Abstract

In this study, we investigated the possibility of partially substituting wheat flour in bread-making technology with a by-product (rapeseed meal) obtained after pressing of rapeseed seeds used to obtain edible oil. The research was conducted within the context of sustainable food systems and circular bioeconomy strategies. Experiments were conducted using substitution rates of 10%, 20%, and 30% (RMW1, RMW2, and RMW3), as well as their corresponding breads (RMWB1, RMWB2, and RMWB3). The results reveal a notable improvement in the nutritional profile, correlated with the increase in RM. Indeed, significant increases were observed in protein content (up to 16.64% in flours and 14.19% in breads), fat content (up to 8.72% and 7.89%, respectively), and ash content (up to 2.30% and 2.85%, respectively), while carbohydrates decreased (down to 63.72 g/100 g in flours and 45.76 g/100 g in breads). Furthermore, the phytochemical profile was significantly enhanced, as reflected by the increased antioxidant capacity and elevated total polyphenol concentration, highlighting the functional potential of RM-enriched products. Water absorption increased from 55% to 61%, accompanied by a decrease in dough stability, suggesting modifications in the gluten network. Mixolab analyses indicated reduced viscosity and starch retrogradation, while physical bread properties, including porosity, elasticity, and H/D ratio, decreased with increasing substitution levels. Sensory evaluation revealed that a 10% RM substitution ensured optimal acceptability, whereas higher levels (30%) resulted in significant quality deterioration. From a sustainability perspective, the incorporation of RM contributes to the valorization of agro-industrial by-products, reducing waste streams and promoting resource efficiency. Partial substitution of wheat flour also has the potential to decrease reliance on primary agricultural inputs, thereby lowering the environmental footprint associated with cereal production. Additionally, the improved antioxidant profile may enhance product stability and shelf life, contributing to food loss reduction. In conclusion, an incorporation level of up to 20% provided the most suitable compromise between improved nutritional value, functional and technological properties, consumer acceptability, and sustainability considerations, thereby supporting the formulation of novel bakery products consistent with circular bioeconomy concepts and sustainable dietary approaches.

1. Introduction

Rapid global population expansion and the need to provide safe, nutritious, and adequate food resources for the entire population have emerged as major challenges for modern society. To meet these challenges, it is imperative to address food and nutrition security issues while preventing deficiencies and diseases. Healthy diets should be promoted, food quality improved, and nutrition integrated into development policies [1,2]. Within this framework, increasing attention has been directed toward the utilization and recovery of nutrient-dense agro-industrial co-products as sustainable alternative ingredients for food formulations [1,3,4].
Rapeseed meal, derived from the annual herbaceous plant of the Brassicaceae family (Brassica napus), is an abundant and widely available plant resource in Europe and worldwide. Global rapeseed production has increased significantly over the past few decades. Indeed, statistics show that production rose from 37.33 million tons in 2000, reached 59.38 million tons in 2009, and then reached approximately 80.32 million tons during the 2022/2023 season. Concurrently, rapeseed oil production attained 30.741 million tons, whereas rapeseed meal production amounted to 43.532 million tons [5,6,7,8]. Rapeseed meal is currently used primarily in animal nutrition. Nevertheless, its nutritional composition makes it a promising ingredient for human food applications due to its high levels of protein (30–40%). Moreover, it is a valuable source of fiber and various bioactive principles, as reported in several studies [6,9,10,11,12]. On a global scale, rapeseed meal represents the second most widely produced oilseed meal, with soybean meal being the primary producer [6].
From a nutritional point of view, rapeseed proteins have a balanced nutrient composition, comparable to soy, and a significant proportion of sulphur amino acids. This makes them a promising candidate for protein enrichment in cereal foods [6,12,13]. In addition, rapeseed meal contains phenolic compounds and minerals that could help optimize the nutritional value of formulated products. Nonetheless, its utilisation in the domain of human nutrition is still restricted due to the existence of various anti-nutritional compounds, such as glucosinolates, phytates, and certain phenolic substances, which have the capacity to adversely impact digestibility, mineral bioavailability, and sensory attributes [14,15,16].
The addition of plant protein sources into bakery formulations represents a widely investigated approach for enhancing their nutritional value. This approach responds to the growing demand for alternative proteins [17,18,19]. However, incorporating protein- and fiber-rich fractions into the dough composition can significantly alter its rheological properties. These alterations are attributable to the influence on gluten network development, water absorption, and dough stability [20,21]. Thus, integrating rapeseed meal into baking matrices requires a thorough evaluation of its technological and qualitative effects.
In addition to its nutritional interest, the valorization of rapeseed meal as a food ingredient may contribute to sustainable food systems in the context of the circular economy [22]. Furthermore, according to Regulation (EC) No 258/97 of the European Parliament [23], Brassica napus protein may be used as an alternative functional ingredient in the manufacture of bakery products. Nevertheless, only a limited number of studies have comprehensively investigated its effects on the bread-making process, antioxidant activity, and the overall sensory characteristics of bread simultaneously.
In this study, particular attention is given to its effects on dough rheological behavior, the technological characteristics, and the enhancement of its nutritional quality. The originality of this research lies not only in assessing the nutritional contribution of rapeseed meal incorporation into wheat flour, but also in providing a comprehensive evaluation of the rheological performance of composite flours and the technological approach of the resulting breads. Moreover, the study seeks to support the development of sustainable food systems, thereby encouraging circular bioeconomy practices, improving resource utilization, and reducing the environmental impact associated with conventional cereals.

2. Materials and Methods

2.1. The Procurement of Mixture Samples

Type 650 wheat flour (WF) was procured from a local retail store, while rapeseed meal (RM) was provided by Soloverde SRL, Moravita, Romania. Three composite wheat–rapeseed meal flour formulations were developed for the present study (Table 1), following the procedure previously reported in [17]. The resulting blends were coded as RMW1, RMW2, and RMW3.

2.2. Rheological Property Analysis

Rheological analyses were performed for all flour samples (WF, RMW1, RMW2, and RMW3). The measurements were carried out using a Chopin Mixolab apparatus (Chopin Technologies, Paris, France).
The amount used ranged from 43 to 48 g, depending on the humidity of each flour variant, previously determined using a thermobalance (Kern & Sohn GmbH, Balingen, Germany), as well as its water absorption capacity.
The Mixolab profile enabled the determination of several rheological parameters, including water absorption, dough development time, dough stability (reflecting resistance to mixing), maximum torque during mixing (C1), protein weakening under mechanical and thermal stress (C2), starch gelatinization (C3), minimum torque during heating (C4), and torque after cooling to 50 °C (C5). In addition, the device provided secondary parameters such as cooking stability (C4/C3), protein weakening rate under heat treatment (α slope), starch gelatinization rate (β slope), enzymatic degradation rate (γ slope), and starch retrogradation during cooling (C5–C4), which is associated with the shelf-life potential of the final bakery products [24].

2.3. Production of Bread Samples with RM Addition

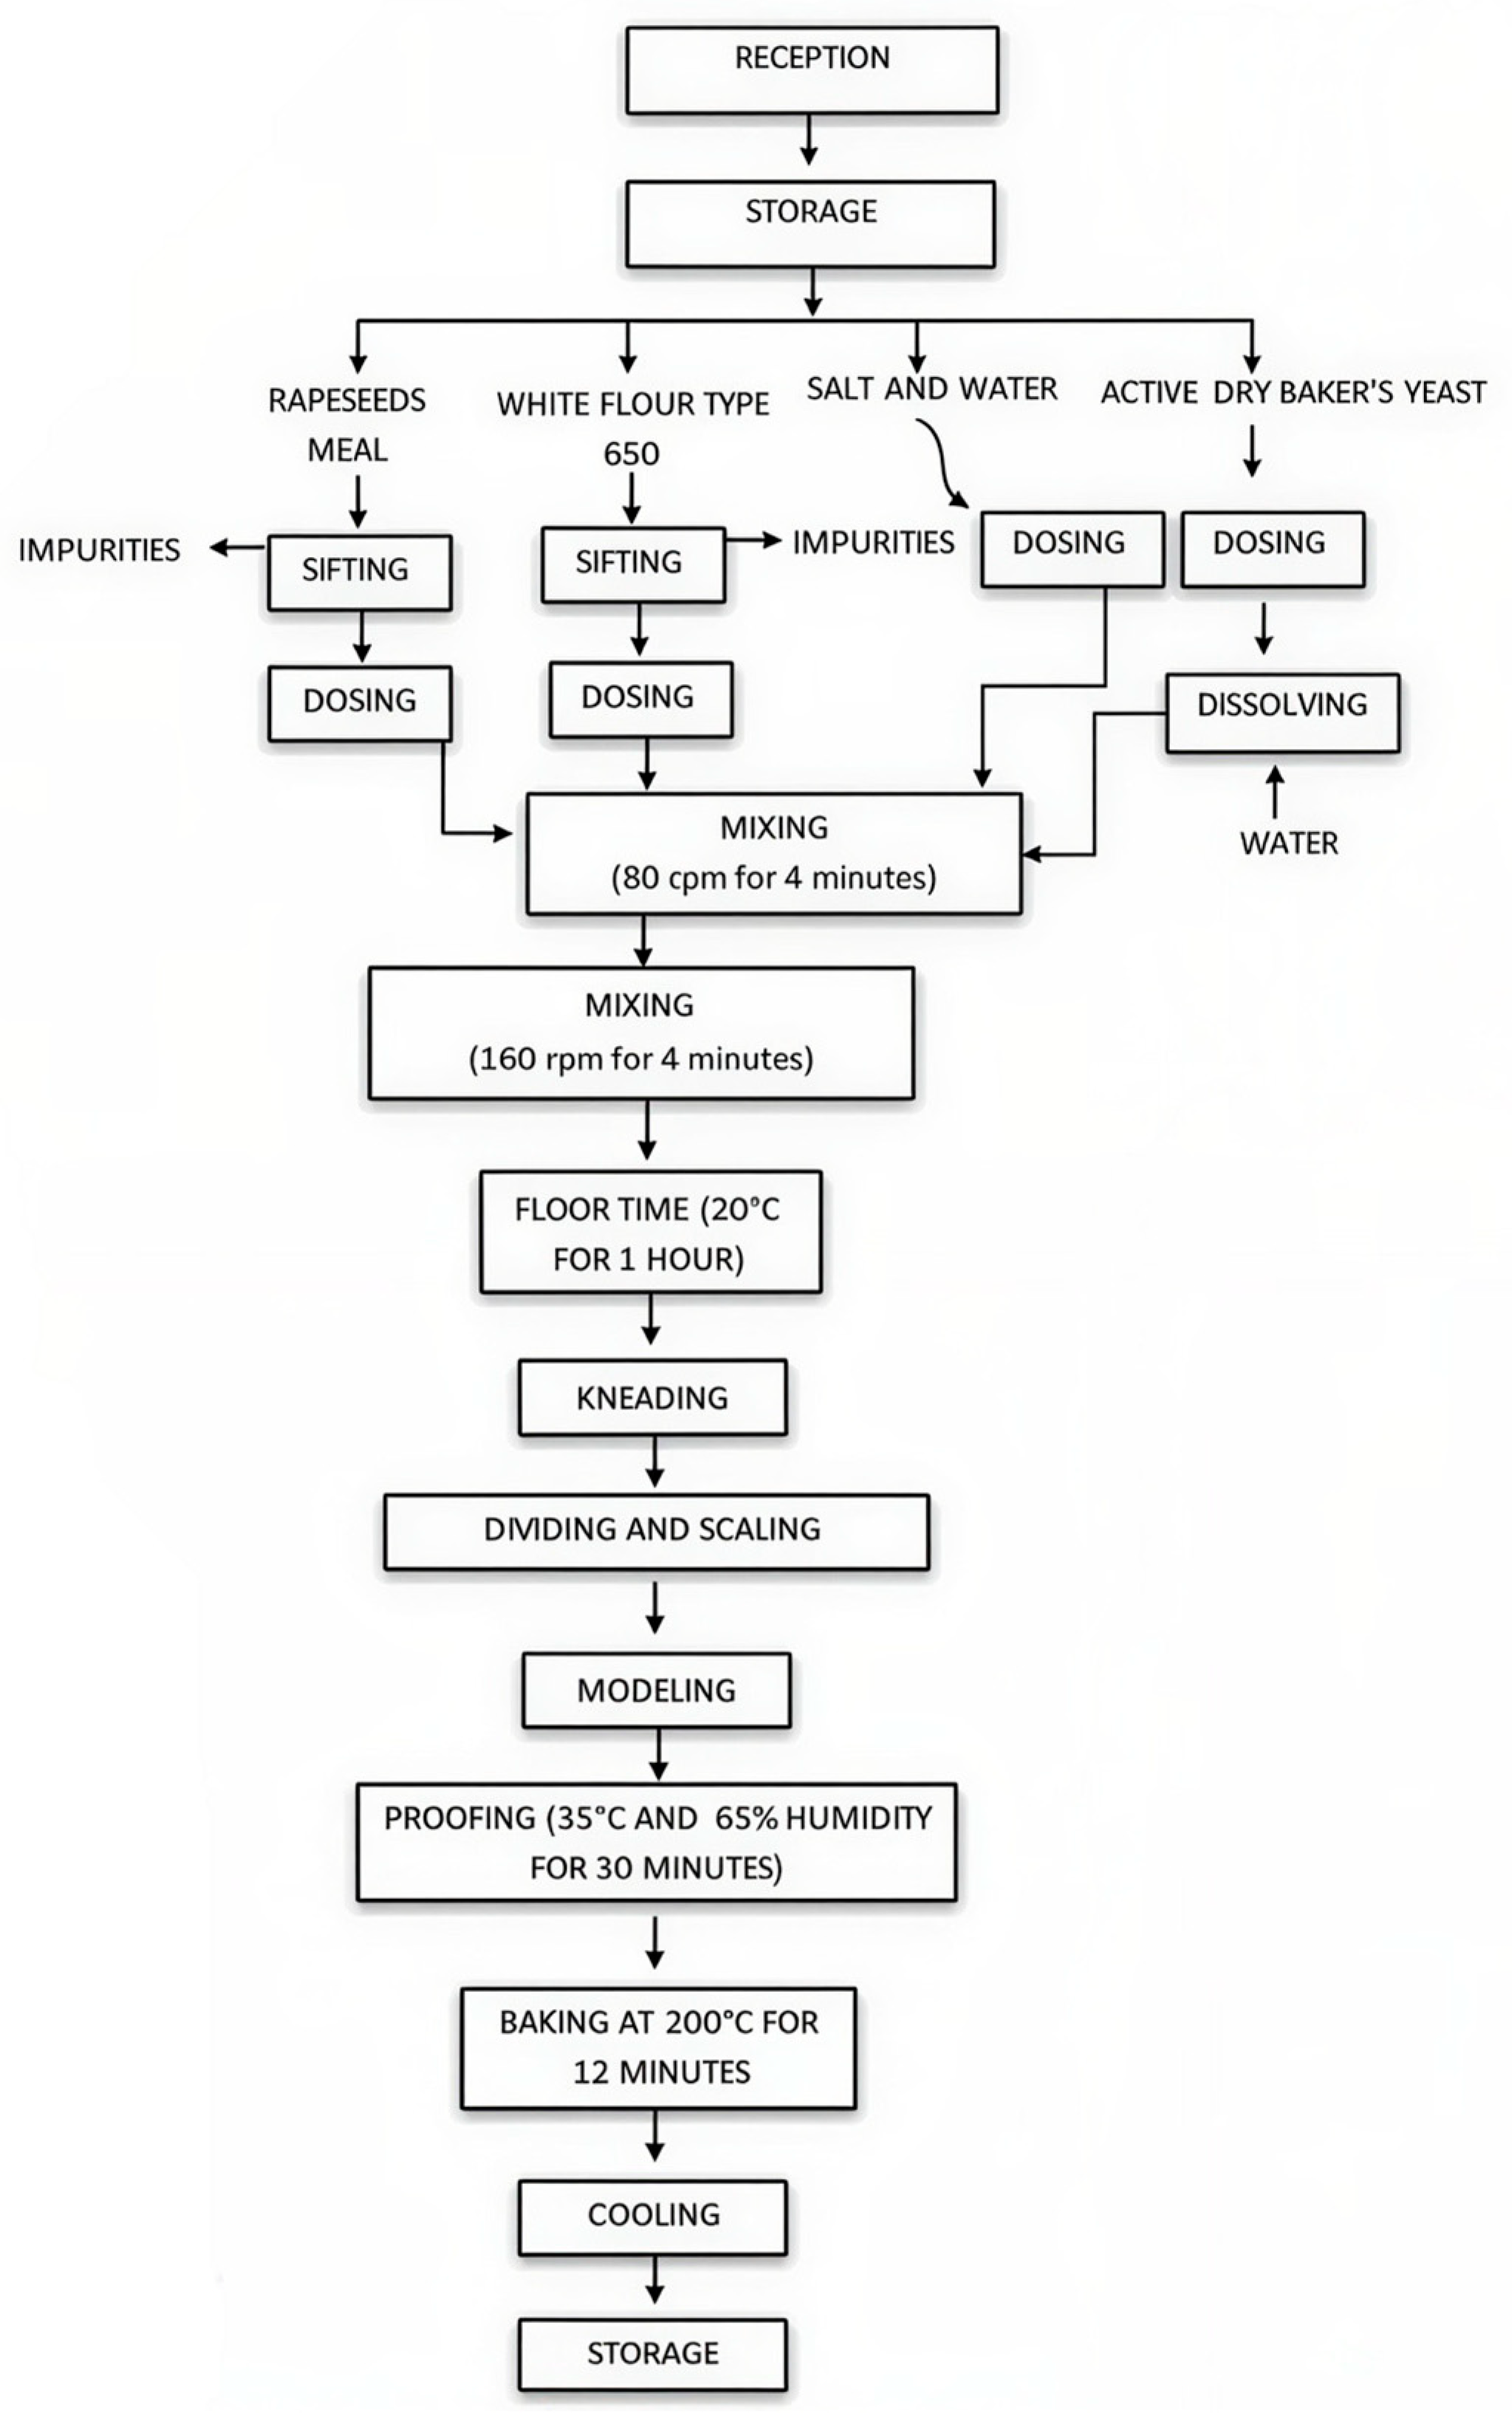
The different bread formulations were produced following the methods described, with slight modifications. Four bread variants (CB, RMWB1, RMWB2, and RMWB3) were prepared using WF, RMW1, RMW2, and RMW3 flours, respectively, according to the method described by Dossa et al. (2026) [17] and Plustea et al. (2022) [25]. The technological process applied for bread production is illustrated in Figure 1 and the recipes for the products are presented in Table 2.

2.4. Nutritional Composition of Flour and Bread Samples

Table 3 presents the methods used to determine the proximate composition of the analysed samples.

2.5. Determination of Elemental Profile of Samples

The elemental profile of various flour samples (WF, RM, RMW1, RMW2, and RMW3) and bread samples (CB, RMWB1, RMWB2, and RMWB3) was determined as described by Plustea et al. (2022) [25]. Mineral concentrations were expressed as mg/kg on a fresh weight basis. Therefore, variations in moisture content among samples may influence the apparent mineral concentration due to a dilution effect. The analyses were performed in triplicate.

2.6. Determination of Total Phenolic Content (TPC) and Antioxidant Activity (AA) of Different Flour and Bread Samples

2.6.1. Preparation of Ethanol Extracts

The determination of phytochemical compounds present in flour and bread samples was achieved through alcoholic extraction. The extraction process entailed the dissolution and subsequent mixing of 1 g of each sample with 10 mL of 70% ethanol for a period of 30 min in a hermetically sealed container. The solution obtained through the aforementioned process was then subjected to a 30 min shaking process, followed by filtration [28].

2.6.2. Evaluation of TPC

The TPC of various samples was determined in accordance with the Folin–Ciocâlteu method, as described in Danciu et al. (2018) [29] and Obistioiu et al. (2021) [30]. The procedure was implemented using alcoholic extracts prepared in advance, and the results were expressed in GAE/100 g. It is imperative to emphasise that all determinations were carried out in triplicate.

2.6.3. Evaluation of Antioxidant Activity

The antioxidant activity (AA) of the various samples was determined using spectrophotometry at 518 nm, according to the method described by Ciulca et al. (2021) [31].

2.7. Physical Analyses of Bread Samples

According to the requirements of SR 91:2007 [32], porosity, crumb elasticity, and the height-to-diameter (H/D) ratio were determined. The definition of each parameter, as well as the formulas used for their calculation, is provided in Table 4. All measurements were conducted in triplicate.

2.8. Sensory Evaluation of Bread Samples

A sensory analysis of the samples was carried out by a trained panel of 37 assessors, comprising 17 males and 20 females, who met the criteria set out in ISO 6658:2017 [33]. The sensory panel consisted of non-smokers aged 19 to 48 years, with no reported food allergies, who evaluated the acceptability and preference of the products. In this study, each bread type was assessed in terms of appearance, taste, aroma, texture, and overall acceptability. A 5-point hedonic scale was employed for sensory evaluation, where 1 corresponded to “extremely disliked”, 2 to “slightly disliked”, 3 to “neither liked nor disliked”, 4 to “slightly liked”, and 5 to “extremely liked”. The bread formulations were sliced and individually presented to each panelist on paper plates identified using randomly assigned three-digit codes. To minimize potential carryover effects between samples, the assessors were instructed to rinse their mouths with water after each evaluation. Given the non-invasive nature of the study and the absence of animal subjects, approval from a Bioethics Committee was not required. Participation was entirely voluntary, and all 37 panelists provided informed consent prior to the sensory evaluation.

2.9. Statistical Analysis

All experimental data were first analyzed using Duncan’s multiple range test following ANOVA in order to compare mean values and identify statistically significant differences (p < 0.05). Subsequently, a multivariate statistical approach was applied in three successive steps: linear correlation analysis, principal component analysis (PCA), and cluster analysis. Prior to cluster analysis, all variables were standardized using z-score normalization to eliminate the influence of differences in measurement units and variable scales. This procedure ensured that each parameter contributed equally to the distance calculations used for sample clustering. The statistical analyses were conducted within the R statistical computing environment (version 4.3.3; R Core Team, 2023, Vienna, Austria).

3. Results and Discussion

3.1. Chemical Composition of the Flour and Bread Samples

Table 5 presents the moisture, ash, protein, lipid and carbohydrate contents of the various flour and bread samples.
The results of the nutritional composition reveal significant differences between wheat flour (WF) and rapeseed meal (RM). RM has significantly higher protein, lipid, and mineral concentrations than wheat flour. Chemical analyses reveal that RM contains approximately twice as much protein as WF, approximately eight times as much fat, and approximately seven times as many minerals as wheat flour. This nutritional richness of RM is typical of oilseed co-products after oil extraction, which explains the growing interest in their use in human nutrition [17,34,35,36,37]. Several studies have shown that rapeseed meal generally contains 35–40% protein, as well as a significant proportion of residual lipids and fiber. These elements make rapeseed meal an interesting source of functional nutrients [6,9,12,38,39]. In contrast, wheat flour is distinguished by its elevated carbohydrate content and notable moisture content. These characteristics could explain the variations observed in the nutritional profiles of composite mixtures.
The gradual addition of rapeseed meal to composite flours consistently leads to an increase in the proportion of protein (from 13.15 ± 0.07% for RMW1 to 16.64 ± 0.04% for RMW3), lipids (increasing from 4.75 ± 0.05% for RMW1 to 8.72 ± 0.03% for RMW3), and ash (increasing from 1.02 ± 0.03% for RMW1 to 2.30 ± 0.05%). At the same time, the carbohydrate content decreased by 8.25% between RMW1 and RMW3. This observation could be attributed to the dilution of the starch fraction of WF by RM, which is rich in protein and mineral compounds. The increase in the ash content of rapeseed meal is also an indicator of its mineral richness [6,12]. Similar observations have been made when incorporating ingredients rich in vegetable protein into cereal products. Indeed, improving the nutritional value of these products is often accompanied by a relative reduction in the carbohydrate fraction [17,25,34,37].
These compositional changes are also observed in bread samples. The gradual enrichment with rapeseed meal results in increased protein, mineral, and lipid content in enriched breads compared to the control bread. This improvement in nutritional density is important in the current context of the search for foods richer in vegetable proteins. Recent research has revealed that adding oilseed-derived ingredients to bread can significantly improve its nutritional value, particularly by increasing protein, dietary fiber, and micronutrient content [40,41,42]. In addition, the increase in ash content in enriched breads suggests a greater contribution of minerals from rapeseed meal. This improvement in the mineral profile could represent a potential nutritional advantage, given the frequent micronutrient deficiencies in refined cereal products. However, the decrease in carbohydrate content, concomitant with the increase in substitution rate, highlights the partial replacement of wheat starch by the protein and fiber fractions of RM. In addition, the decrease in moisture in enriched breads could be attributed to the distinct water-absorption capacities of the proteins and fibers in rapeseed meal. These elements modify the structure of the bread matrix and, consequently, its interactions with water. Similar observations have been reported when fiber-rich ingredients are incorporated into bakery products, where the dough’s water-retention properties and the crumb structure change [21].
Based on the results, adding rapeseed meal during bread production is an effective way to optimize the nutritional quality of bakery products. This method also enables the addition of value to a large quantity of agro-industrial co-products. This approach aligns with the principles of sustainability and the circular bioeconomy, which aim to optimize the use of resources derived from oilseed crops.

3.2. Mineral Content of Samples

The data presented in Table 6 show that the addition of RM to wheat flour (WF) markedly modifies the mineral profile of both flours and derived breads.
Overall, increasing substitution levels lead to a progressive rise in the concentrations of key elements, including Mn, Ca, Mg, K, Na, Zn and Fe. These findings highlight the ability of rapeseed meal to act as a natural source of essential micronutrients, thereby enhancing the nutritional value of cereal-based products.
The rapeseed meal (RM) has a significantly higher mineral content than wheat flour (WF) (Table 6). The highest concentrations in RM are mainly macro-elements, namely calcium (4760.46 ± 43.22 mg/kg), magnesium (3714.30 ± 13.13 mg/kg), and potassium (8963.28 ± 37.99 mg/kg), as well as several essential trace elements, including iron, zinc, and manganese. Rapeseed meal is recognized as a significant source of essential minerals, the content of which increases after oil extraction. This increase is attributable to the higher concentration of non-lipid compounds in the solid residue [43,44]. The minerals in question include Ca, Mg, K, Fe, and Zn. For example, previous research has reported calcium concentrations of 5750–7330 mg/kg and magnesium concentrations of 3500–4690 mg/kg in rapeseed meal. These values are consistent with those found in the present study [43].
On the other hand, refined wheat flour generally has a lower mineral content because the bran and germ are partially removed during milling. These elements contain a large proportion of the micronutrients in grains [44]. This difference explains the significant disparity observed between RM and WF in the experimental results.
The gradual incorporation of rapeseed meal into wheat flour, at concentrations of 10%, 20% and 30%, led to a significant increase (p < 0.05) in calcium concentrations (from 369 mg/kg in WF to 2775 mg/kg in RMW3), magnesium (from 364 mg/kg to 2471 mg/kg), iron (from 8.51 mg/kg to 33.19 mg/kg) and zinc (from 3.43 mg/kg to 13.64 mg/kg). This increase could be attributed to rapeseed meal’s high mineral content. Oilseed co-products have significant mineral concentrations, as minerals are closely linked to the cellular structures, proteins, and fiber fractions of the grain [44]. Consequently, incorporating them into cereal formulations is a relevant strategy for increasing the nutritional density of food products. Consistent observations have been reported in several studies on the enrichment of cereal flours with nutrient-rich plant ingredients. Indeed, increasing the substitution rate generally leads to a proportional increase in essential minerals such as iron (Fe), zinc (Zn), and magnesium (Mg) [17,37].
These observations are consistent with those reported in composite breads (RMWB1, RMWB2, and RMWB3). Increasing rapeseed meal incorporation results in a gradual increase in mineral concentrations compared with the control bread (CB). Indeed, the analysis reveals a significant increase in calcium concentrations, from 354 mg/kg in CB to 2403 mg/kg in RMWB3. This trend is accompanied by a notable increase in magnesium, from 353 mg/kg to 1740 mg/kg. In addition, iron shows remarkable growth, rising from 8.6 mg/kg to 23.43 mg/kg, while zinc shows a more modest increase, rising from 3.24 mg/kg to 11.39 mg/kg. However, it was found that the mineral concentrations in the breads remain slightly lower than those in the corresponding flours. The relative decrease observed can be attributed to several factors. These include the dilution effect, which results from the addition of water and other ingredients during bread-making. This variation could also be attributed to the thermal conditions during bread baking. Another hypothesis has been put forward, namely, interactions with antinutritional compounds, particularly phytates present in cereals and oilseeds. These compounds can form complexes with certain minerals, thereby influencing their bioavailability [45]. Despite these effects, enriched breads show a significant improvement in mineral profile compared to the control bread, confirming the nutritional benefits of using rapeseed meal in bakery products.
Rapeseed meal, a residual product of rapeseed oil extraction, constitutes a significant source of essential nutrients for human nutrition. Adding this product to cereal products can help increase the micronutrient content of the diet. Minerals such as iron, zinc, and magnesium are essential nutrients for human health. They are involved in many physiological processes, including hemoglobin formation, enzyme activity, the immune system, and energy metabolism [46,47,48].

3.3. Phytochemical Characteristics of Flour and Bread Samples

The effect of rapeseed meal (RM) incorporation into wheat flour (WF) and bread formulations on two key phytochemical indicators—antioxidant activity (%) and total polyphenol content (mg GAE/100 g)—is presented in Table 7. The results indicated that higher levels of rapeseed meal (RM) incorporation resulted in increased antioxidant content in both dough and bread samples.
Rapeseed meal (RM) has the highest values for antioxidant activity (82.15%) and total polyphenol content (1820.61 mg GAE/100 g), compared to wheat flour (WF), which has significantly lower values (76.07% and 345.55 mg GAE/100 g, respectively). This difference is consistent with the biochemical composition of rapeseed. Co-products from oil extraction, such as rapeseed meal, have a high content of phenolic compounds, of which sinapine constitutes the majority fraction. These chemical compounds constitute a substantial proportion of the meal’s bioactive compounds and are responsible for its significant antioxidant potential [44,49]. In addition, several studies have shown that phenolic extracts from rapeseed meal exhibit particularly high free-radical-scavenging activity and can effectively inhibit lipid oxidation. The findings of this study demonstrate the promise of rapeseed meal as a natural source of antioxidants within food systems [50,51]. However, it has been observed that refined wheat flour generally contains fewer polyphenols, as these compounds are mainly found in the bran and germ, which are partially removed during refining.
The gradual incorporation of rapeseed meal into wheat flour (RMW1, RMW2, and RMW3) resulted in a significant increase (p < 0.05) in antioxidant activity and total polyphenol content. The polyphenol content, which increased gradually from 426.98 mg GAE/100 g in RMW1 to 598.05 mg GAE/100 g in RMW3, was concomitant with antioxidant activity, which increased from 77.32% to 79.87%. This increase can be attributed to the direct contribution of the phenolic compounds in rapeseed meal to the flour mixtures. The polyphenols contained in rapeseed are mainly classified in the hydroxycinnamic acid category and have a high capacity to neutralize reactive oxygen species. This property explains the increase in antioxidant activity observed in correlation with the increase in the incorporation rate [44]. In addition, it has been shown that incorporating polyphenol-rich plant co-products into cereal food matrices significantly improves the functional properties and antioxidant capacity of the final products [49].
A concomitant increase in antioxidant activity and overall polyphenol content was also observed in composite breads, with an increase in the substitution rate with rapeseed meal. In fact, polyphenols increased from 369.07 mg GAE/100 g in the control bread (CB) to 603.45 mg GAE/100 g in RMWB3, and antioxidant activity increased from 75.36% to 79.07%. Although baking can cause partial degradation of certain heat-sensitive phenolic compounds [52,53], the overall increase observed in enriched breads suggests that the initial amount of polyphenols provided by rapeseed meal largely compensates for potential losses due to heat treatment. Furthermore, the baking process can also lead to the formation of new antioxidant compounds. It has been demonstrated that Maillard reactions, which occur between amino acids and reducing sugars, can contribute to the overall antioxidant activity of bakery products [54,55,56,57]. The concomitant increase in antioxidant activity and polyphenol content in enriched breads suggests a positive correlation between these two parameters [17,51].
The results show that incorporating rapeseed meal into flour and bread formulations significantly improves the products’ phytochemical profiles. It is important to note that this improvement is particularly significant from a nutritional standpoint, as polyphenols are known for their antioxidant, anti-inflammatory, and protective effects against oxidative stress [58,59].

3.4. Rheological Profile of Flour Samples

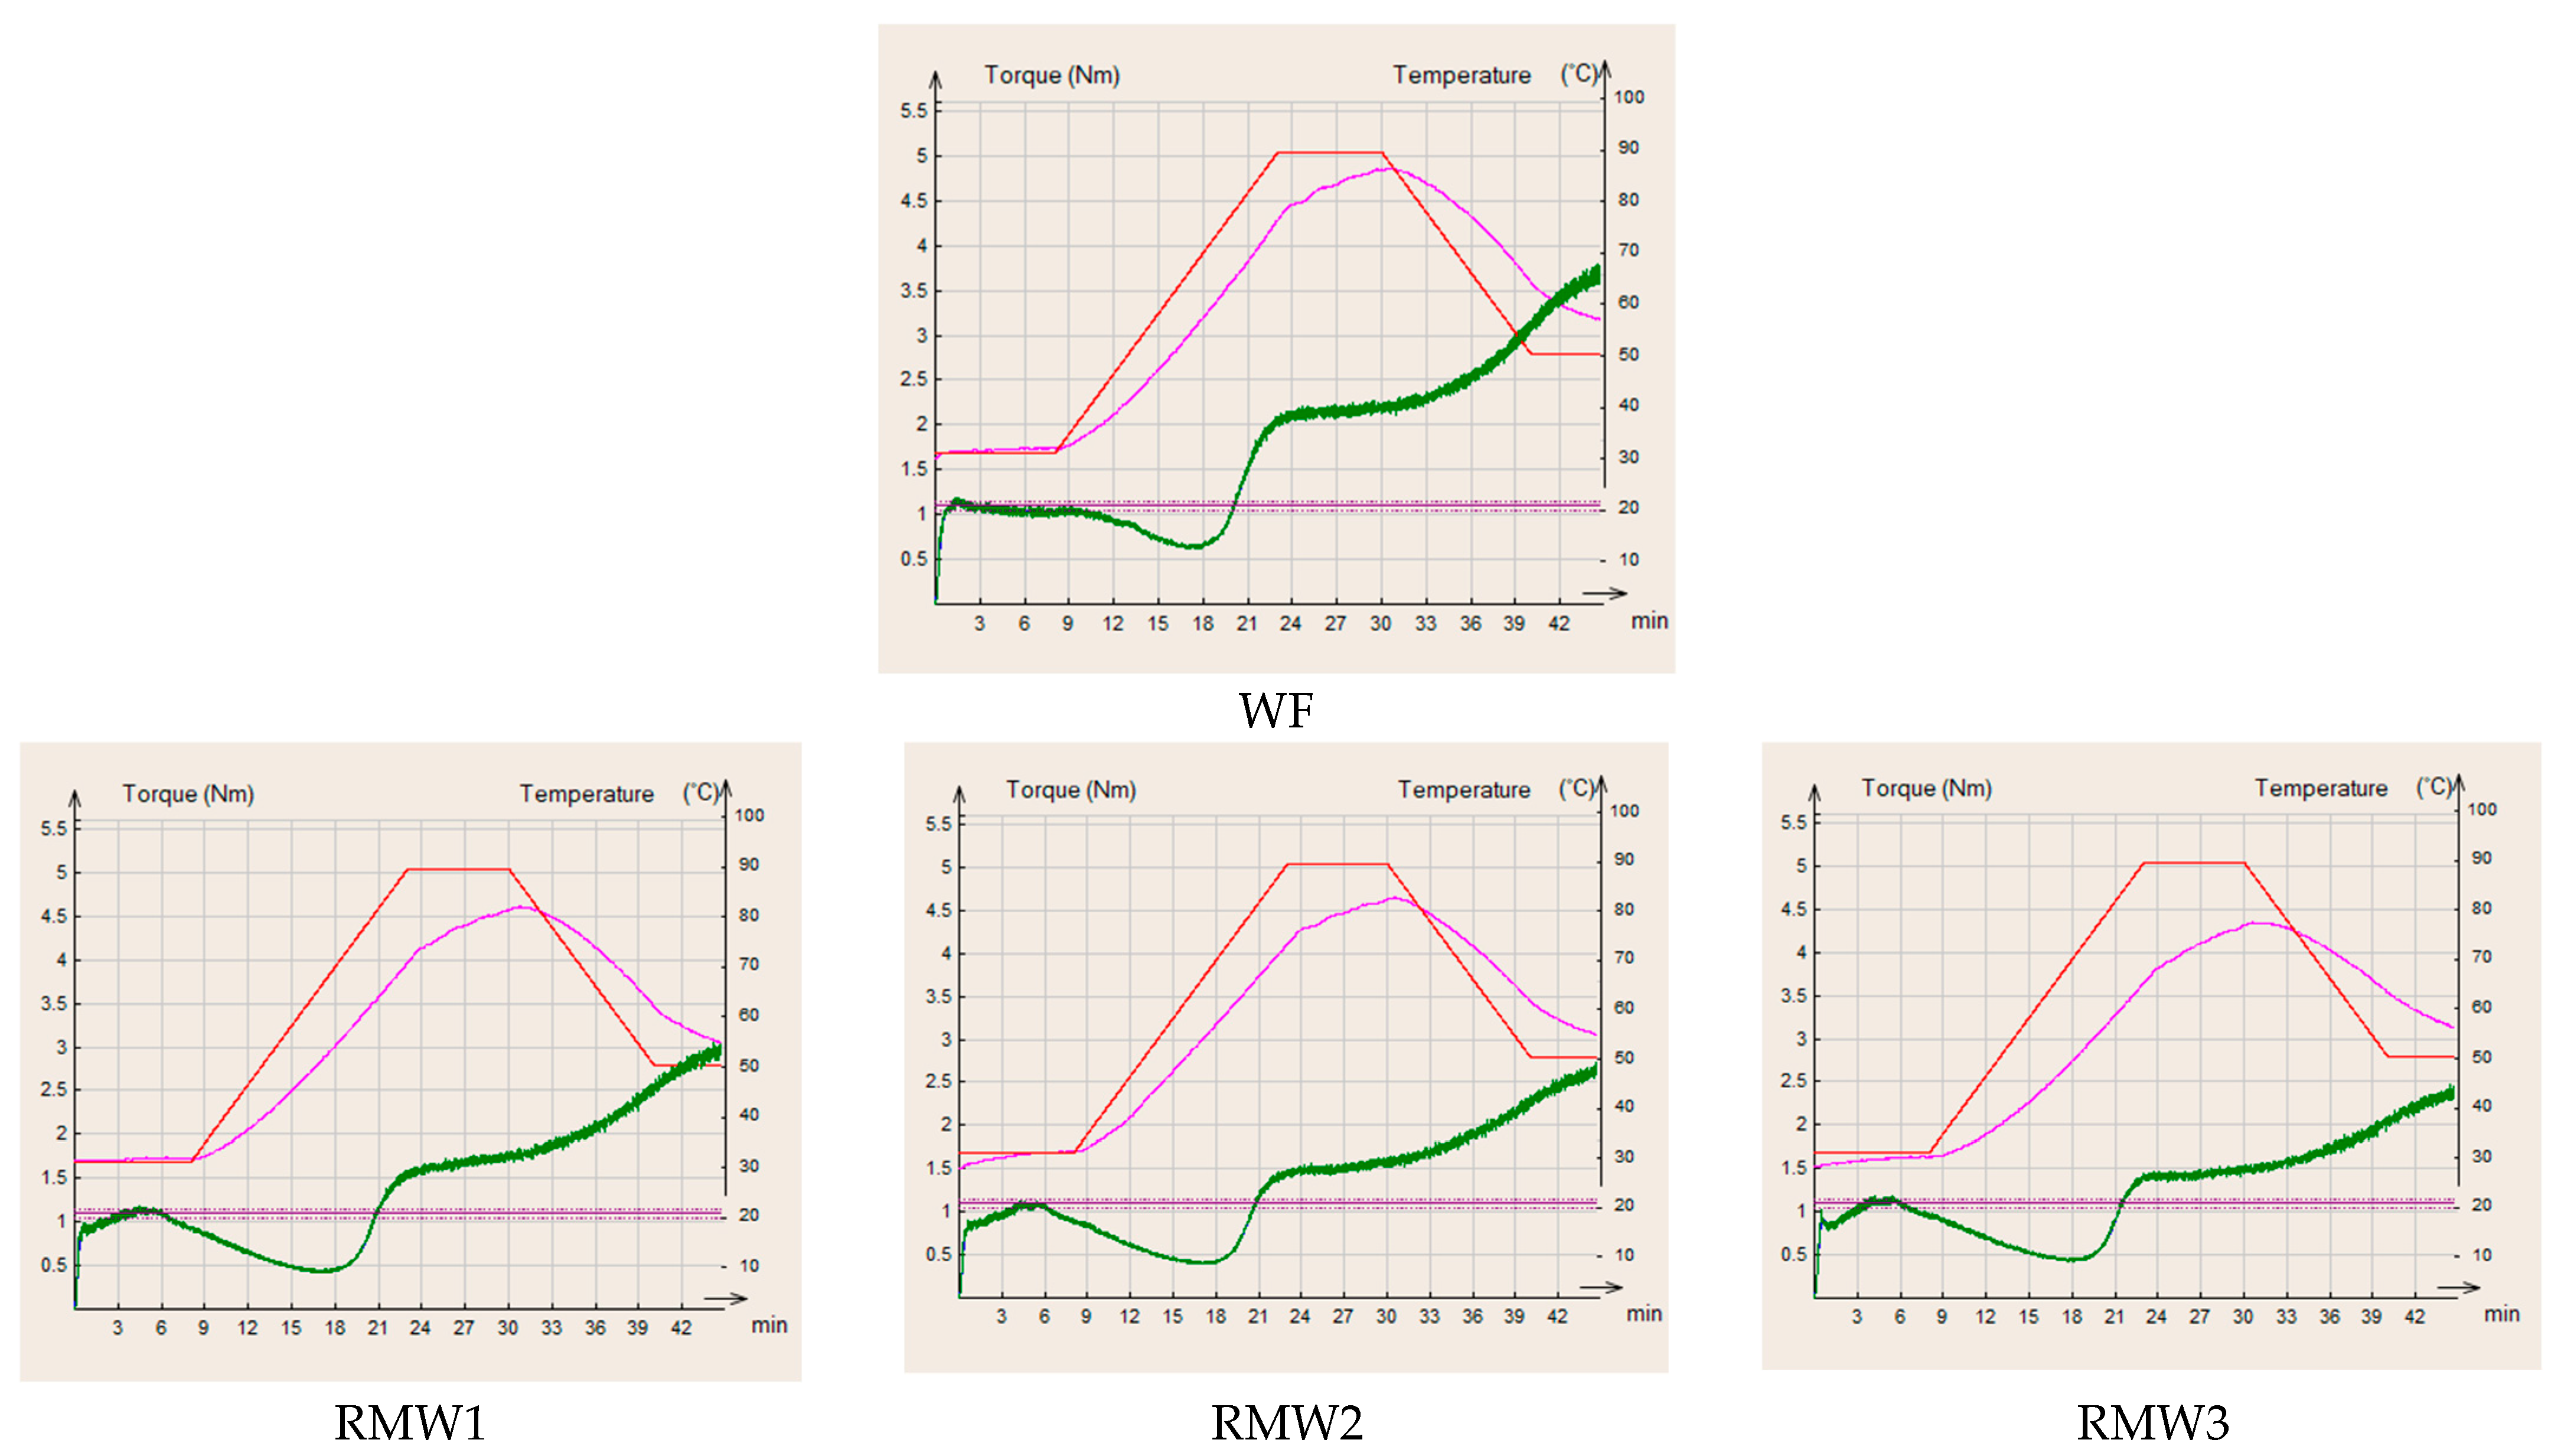
The Mixolab curves obtained for WF, RMW1, RMW2, and RMW3 are presented in Figure 2.

3.4.1. Mixolab Torque Indices

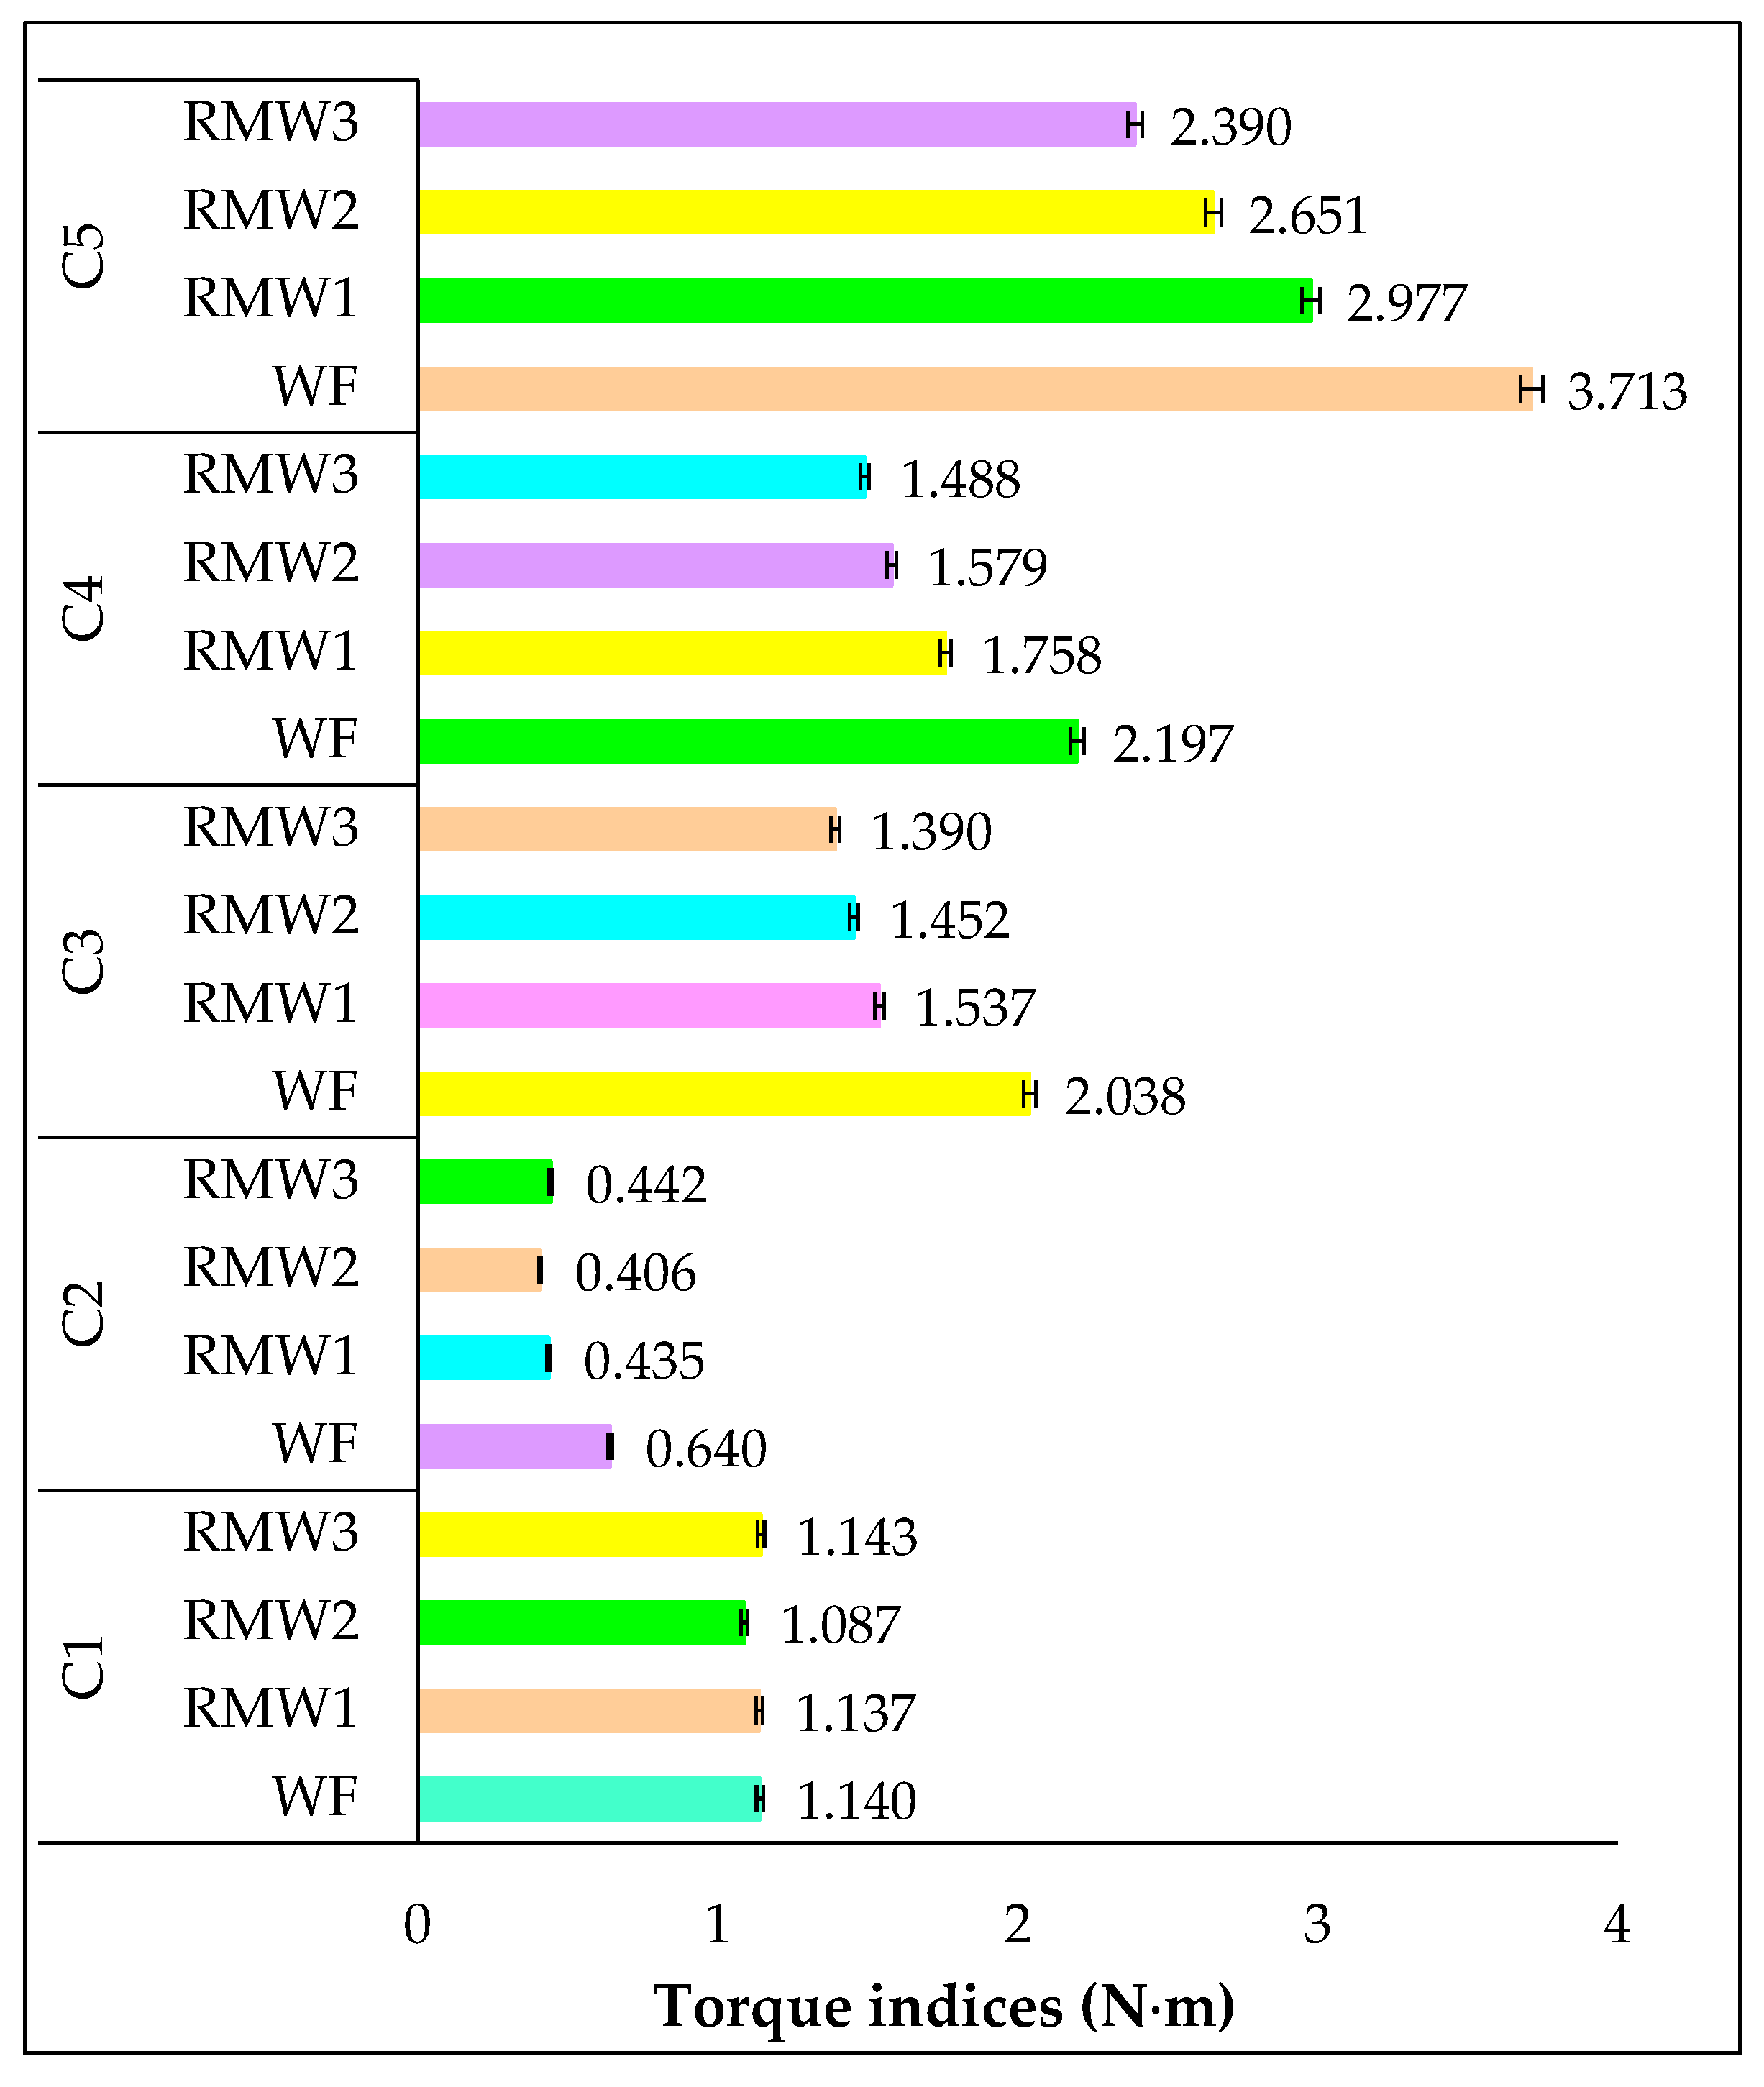
Figure 3 illustrates the impact of partial substitution of wheat flour (WF) with rapeseed meal (RM) on Mixolab parameters (C1 to C5). The rheological behavior of the composite flours was assessed using the Mixolab device, which evaluates dough properties during mixing, heating, and cooling phases. Parameters C1 to C5 correspond, respectively, to dough development, protein weakening, starch gelatinization, hot gel stability, and starch retrogradation during cooling [24,60,61].
The C1 values showed notable similarities between the different formulations, with a range of approximately 1.087 to 1.140 N·m. The similarity of the observed values suggests that incorporating 10–30% rapeseed meal did not significantly alter the dough’s initial consistency. However, the slight variations observed could be attributed to the presence of non-gluten fibers and proteins in rapeseed meal [6,9,12,38,39], which can influence hydration and gluten network formation.
Relatively stable C1 values (1.087–1.140 N·m) indicate that initial dough consistency was not markedly influenced by the incorporation of rapeseed meal. In contrast, the gradual decline in C2 values reflects a weakening of the protein network, which can be explained by the gluten dilution effect resulting from the addition of gluten-free rapeseed meal. Moreover, the high water absorption capacity of rapeseed meal likely intensified competition for available water, thereby limiting gluten hydration and reducing dough stability and viscoelastic properties. The partial replacement of wheat flour with rapeseed meal decreased the proportion of gluten-forming proteins, leading to a less cohesive gluten structure and modified dough rheology. At the same time, the fiber-rich nature of rapeseed meal may have further enhanced water-binding capacity, influencing protein interactions during both mixing and heating stages.
The C2 parameter represents the weakening of the protein network due to the combined effects of heating and mechanical work [24]. In this study, wheat flour (WF) had the highest C2 value (0.640 N·m), while composite flours had lower values (0.406–0.442 N·m). This observation suggests a reduction in protein network strength as the proportion of rapeseed meal increases. This observation is mainly seen in composite flours, where the incorporation of non-cereal ingredients dilutes gluten and disrupts the protein network. Extensive research on the incorporation of legumes or other non-gluten-rich protein flours has revealed comparable reductions in C2, attributable to interactions between the added proteins and gluten [17,25].
The C3 value corresponds to the maximum viscosity reached during starch gelatinization while the dough is being heated [62]. The results of the study reveal that wheat flour has the highest C3 value (2.038 N·m), while composite flours show progressively lower values with increasing rapeseed meal content (1.537 N·m for RMW1, 1.452 N·m for RMW2, and 1.390 N·m for RMW3). Several factors can explain this decrease. First, the dilution of starch in composite flours can be considered. Second, the interactions between fibers, proteins, and starch granules can be considered a factor limiting their swelling. Finally, competition for water between rapeseed meal fibers and other components may also be a factor. It has been observed that rapeseed meal fibers absorb some of the available water. Similar observations have been recorded in composite flours enriched with oilseeds or vegetable proteins, where starch gelatinization decreases with increasing incorporation of fiber- and protein-rich ingredients [17,63].
The C4 parameter represents the stability of the starch gel formed during the heating phase [60]. It should be noted that the observed values decrease gradually as the substitution rate of WF with RM increases. The values for WF, RMW1, RMW2, and RMW3 are 2.197 N·m, 1.758 N·m, 1.579 N·m, and 1.488 N·m, respectively. This observation suggests a possible reduction in the stability of the starch gel in composite flours. This alteration can be attributed to the presence of fibers and proteins in rapeseed meal [6,9,12,38,39], which disrupt the integrity of the starch–gluten matrix and promote enzymatic or mechanical degradation of the starch during heating. Previous research has shown that incorporating plant proteins or fibers can alter amylolytic activity and reduce starch gel stability in composite flour doughs [64].
The C5 parameter corresponds to the dough’s final viscosity after cooling. It reflects the phenomenon of starch retrogradation [60]. The results of the study reveal a gradual decrease in C5 values as the proportion of rapeseed meal increases. The recorded measurements are as follows: WF: 3.713 N·m; RMW1: 2.977 N·m; RMW2: 2.651 N·m; and RMW3: 2.390 N·m. Starch retrogradation is a key factor in bread staling. A reduction in C5 values may be indicative of a diminished rate of starch retrogradation, which could result in an enhancement of the shelf life of the final product [24]. The observed reduction could be attributed to the presence of dietary fiber and proteins in rapeseed meal, which may interact with amylose and amylopectin chains, thereby limiting their reassociation during cooling. Further research on composite flours enriched with vegetable proteins or fiber has also revealed a reduction in starch retrogradation, thereby improving the texture and shelf life of baked goods [17,25,62].
The Mixolab results indicate that incorporating rapeseed meal into wheat flour significantly alters the dough’s rheological properties. Increasing the substitution rate induces several notable effects. First, it reduces protein network stability (C2) by diluting gluten. Second, it leads to reduced starch gelatinization and viscosity (C3), correlating with the decrease in starch content. Thirdly, it leads to decreased starch gel stability (C4) and reduced starch retrogradation (C5), which could improve bread preservation. These results suggest that rapeseed meal can be used as a functional ingredient in composite flour formulations. However, technological adjustments may be necessary to maintain optimal rheological properties in baked goods.

3.4.2. Mixolab Profiler Index for Flour Samples

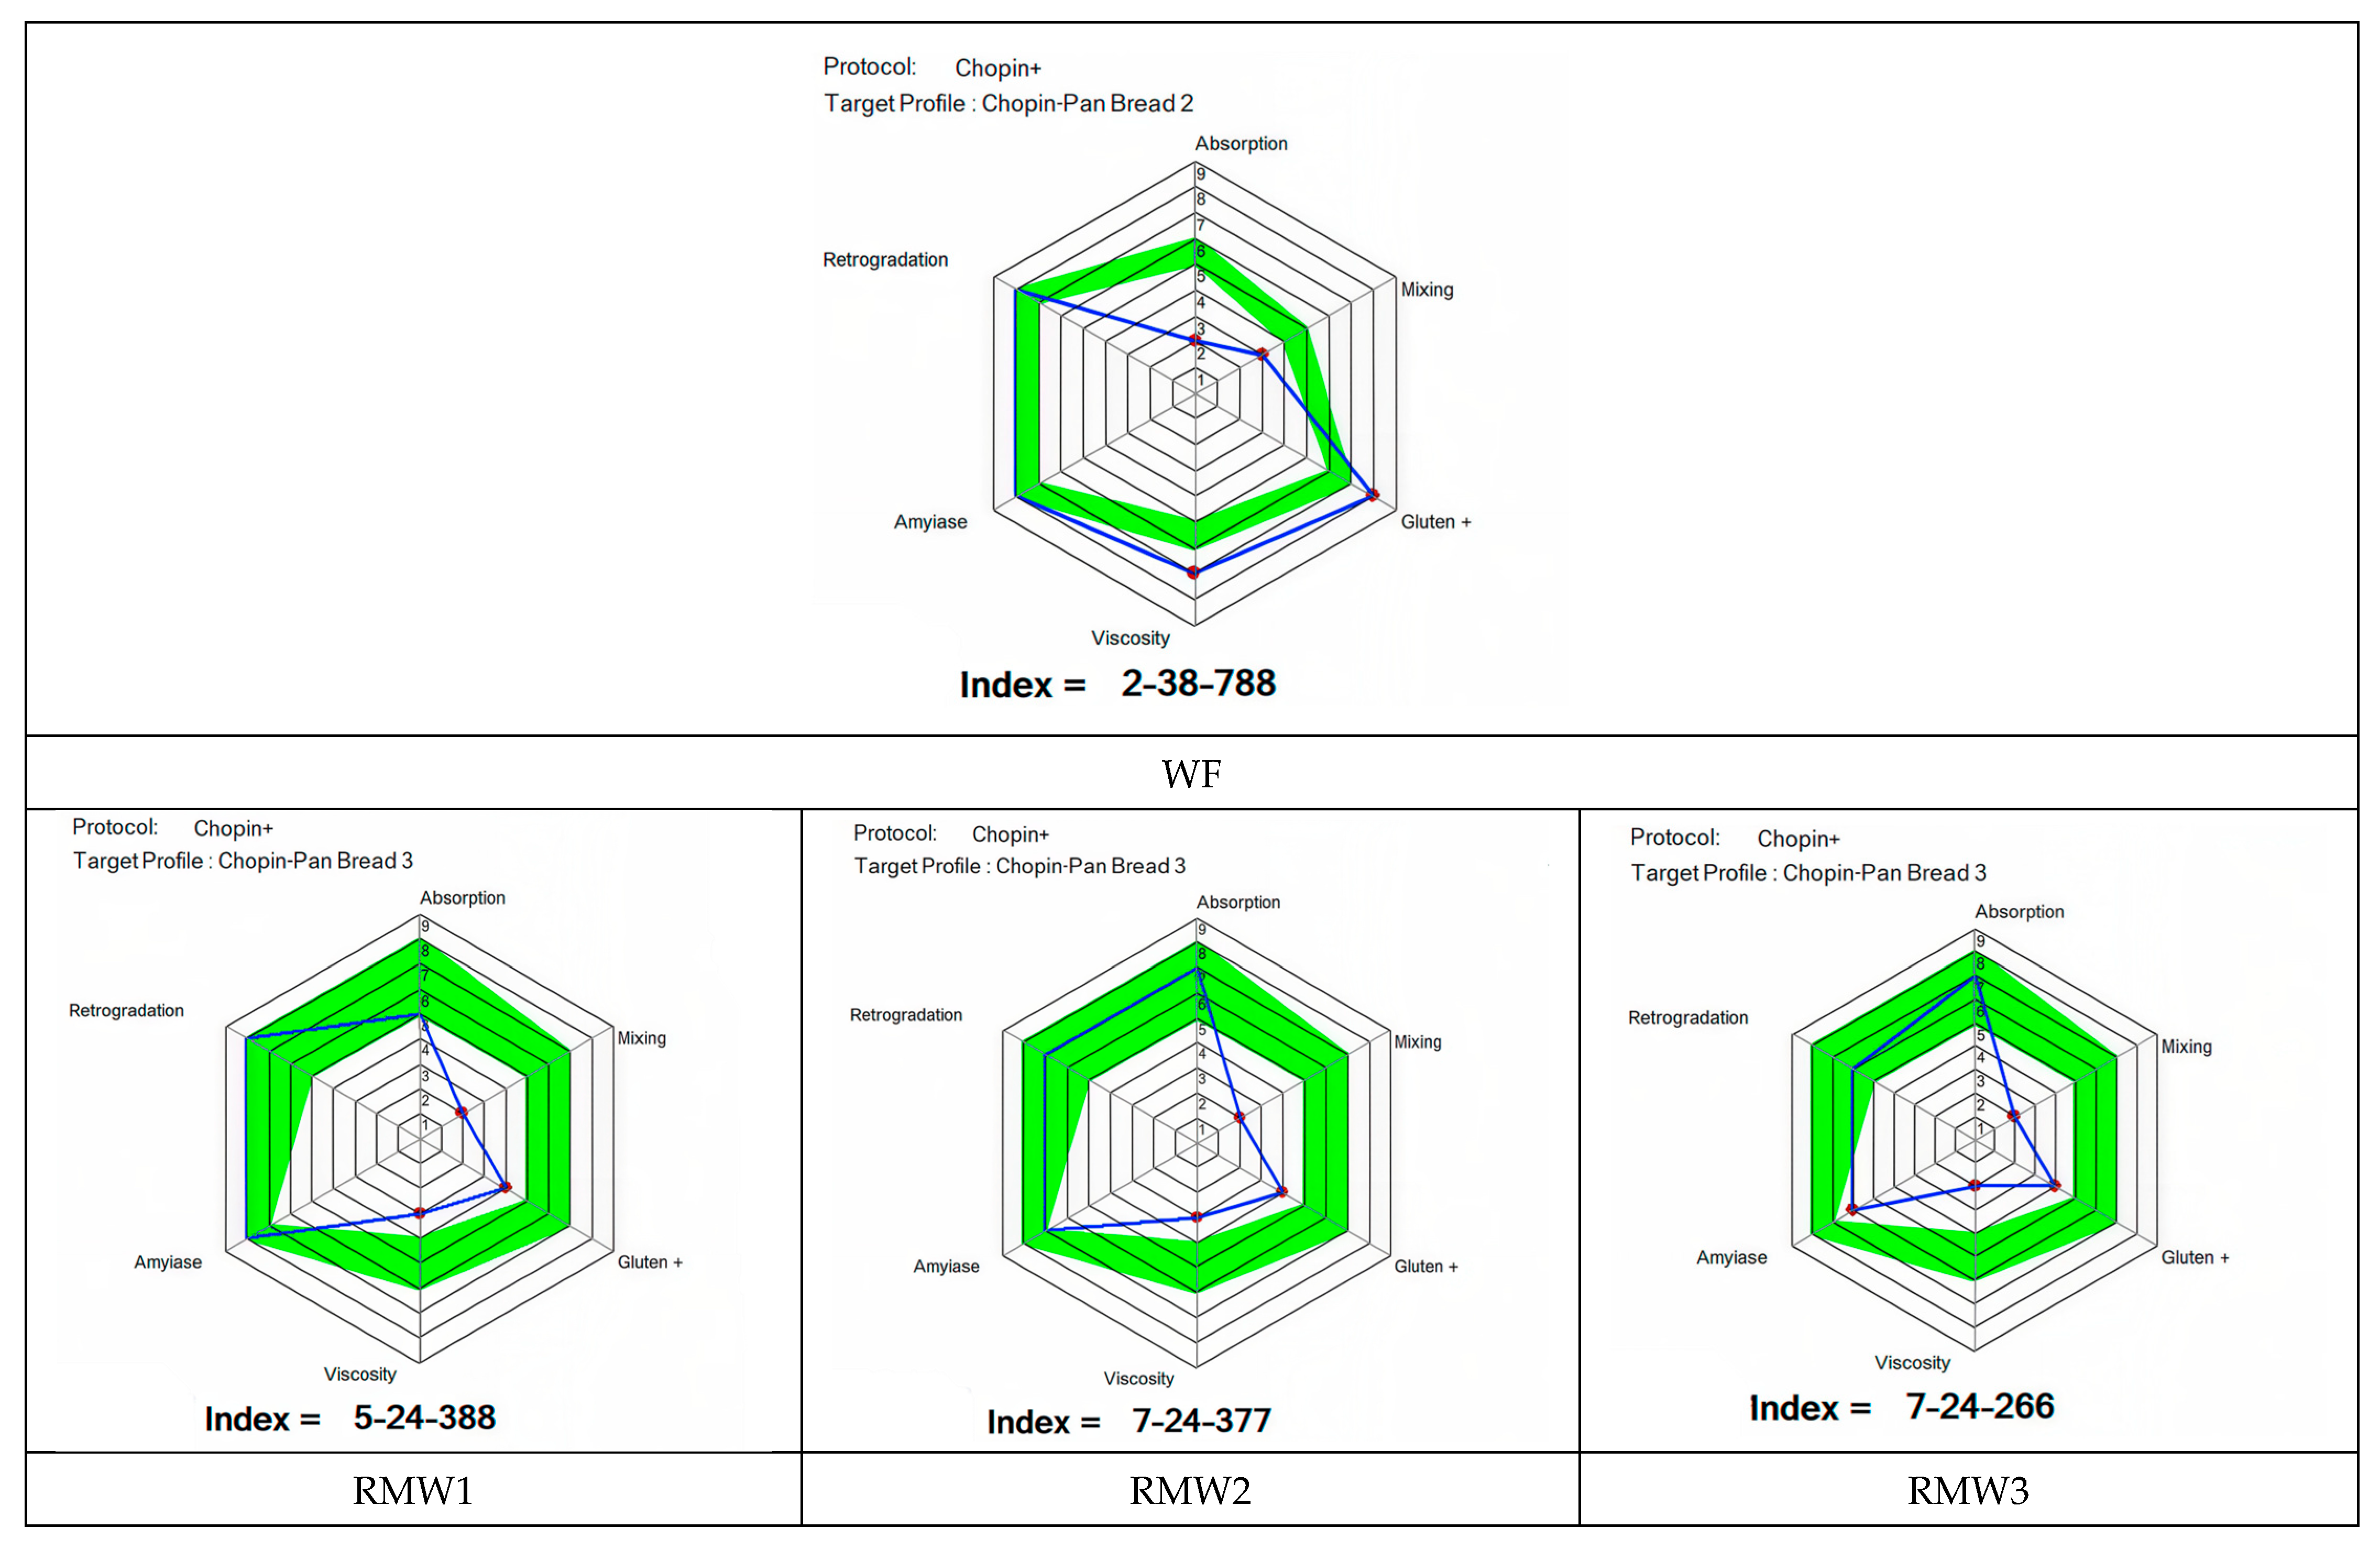
As illustrated in Figure 4, the replacement of WF with RM has been shown to have a significant impact on various Mixolab indices, including absorption, mixing, gluten+, viscosity, amylase, and retrogradation.
The Mixolab Profiler is designed to analyze the six indices (ranging from 0 to 9) that correspond to the main functional properties of flour. These properties include water absorption, mixing behavior, gluten strength, maximum starch viscosity, amylase activity, and starch retrogradation. These indices provide an overall assessment of the technological quality of flours intended for bread making [24,65]. According to the technological profiles recommended for producing bread of optimal quality, ideal values generally fall within a range of 5 to 8 for absorption, 5 to 7 for mixing and gluten strength, 4 to 6 for viscosity, 7 to 8 for the amylase index, and 5 to 8 for retrogradation [24].
The absorption index is significantly influenced by flour composition, particularly its protein, fiber, and damaged starch content. A high value indicates that the flour has a greater capacity to absorb water [24,66]. The present study evaluated the water absorption index in relation to the content of rapeseed meal. The incorporation of rapeseed meal (RM) was found to result in an increase in the index, with values rising from 2 for wheat flour (WF) to 5 for RMW1 and 7 for RMW2 and RMW3. This increase can be attributed to the high dietary fibre and protein content of rapeseed meal, which possesses a high water-retention capacity. From a technological standpoint, a moderate increase in water absorption can be beneficial for the process of bread making, as it results in a more hydrated dough and can improve bread yield.
Regarding the mixing index, the study results reveal a significant decrease from 3 for WF to 2 across all composite flours (RMW1, RMW2, and RMW3). This index is an important criterion for assessing dough quality during kneading, as it reflects the stability of the flour’s protein network. A high value for this parameter indicates better dough resistance to the mechanical stresses of mixing [24]. The observed decrease suggests that incorporating rapeseed meal into the dough reduces its kneading stability. This observation can be attributed to gluten dilution, a phenomenon resulting from partial substitution of wheat flour with rapeseed meal. Indeed, rapeseed meal contains non-gluten proteins that cannot form a viscoelastic network like gluten.
In addition, the Gluten+ index was observed to decrease with substitution, falling from 8 for WF to 4 for all composite flours. This index is an important criterion for evaluating gluten resistance to heating during the thermal phase of the Mixolab analysis. A high value correlates with increased stability of the gluten network at high temperatures [24]. The decrease observed in this study confirms the diluting effect of gluten. It also highlights the interference of rapeseed meal fibers and proteins with the formation of the gluten network. These interactions can therefore impact the formation of bonds between gluten proteins and, consequently, the dough’s ability to maintain its structure during heating [24].
The viscosity, amylase, and retrogradation indices, on the other hand, show a gradual decrease. The viscosity index, which corresponds to the maximum viscosity reached during starch gelatinization when the dough is heated and is closely linked to starch quality and amylase activity [24,65], shows a significant decrease, ranging from 7 for WF to 3 for RMW1 and RMW2, and then to 2 for RMW3. The observed decrease can be explained by the reduced starch content in the composite flours and by the interaction of the fibers with the starch granules, which limit their swelling and gelatinization. This phenomenon is frequently observed in flours enriched with fibers or plant by-products [17,25]. Regarding the amylase index, an indicator of starch resistance to enzymatic hydrolysis by α-amylase, a gradual decrease was observed, from 8 for WF and RMW1 to 7 for RMW2 and to 6 for RMW3. It is important to note that high values of this index correlate with low amylase activity, while low values are associated with increased starch hydrolysis [67]. The observation of a slight decrease in this index with increasing rapeseed meal content suggests a modification of the starch–protein matrix in the composite flour. This change could enhance the enzymatic accessibility of the starch, which requires further investigation to fully understand the process. As for the retrogradation index, a decrease is observed from 8 for WF and RMW1 to 7 for RMW2 and to 6 for RMW3. In the context of the physicochemical analysis of food substances, the starch recrystallization index, measured during product cooling, is a relevant indicator of staling in bread. A high value indicates greater retrogradation and, consequently, a shorter shelf life for the product [24,67]. The decrease observed as rapeseed meal content increases suggests a potential reduction in starch retrogradation, which could help slow staling in bread. This behavior can be attributed to the interaction of the fibers and proteins in rapeseed meal with amylose and amylopectin molecules, which limits their recrystallization.
These findings indicate that wheat–rapeseed meal formulations containing 10–20% rapeseed meal may provide a suitable compromise between enhanced nutritional value and the maintenance of technological properties required for bread production.

3.4.3. Mixing Stability Time of Dough

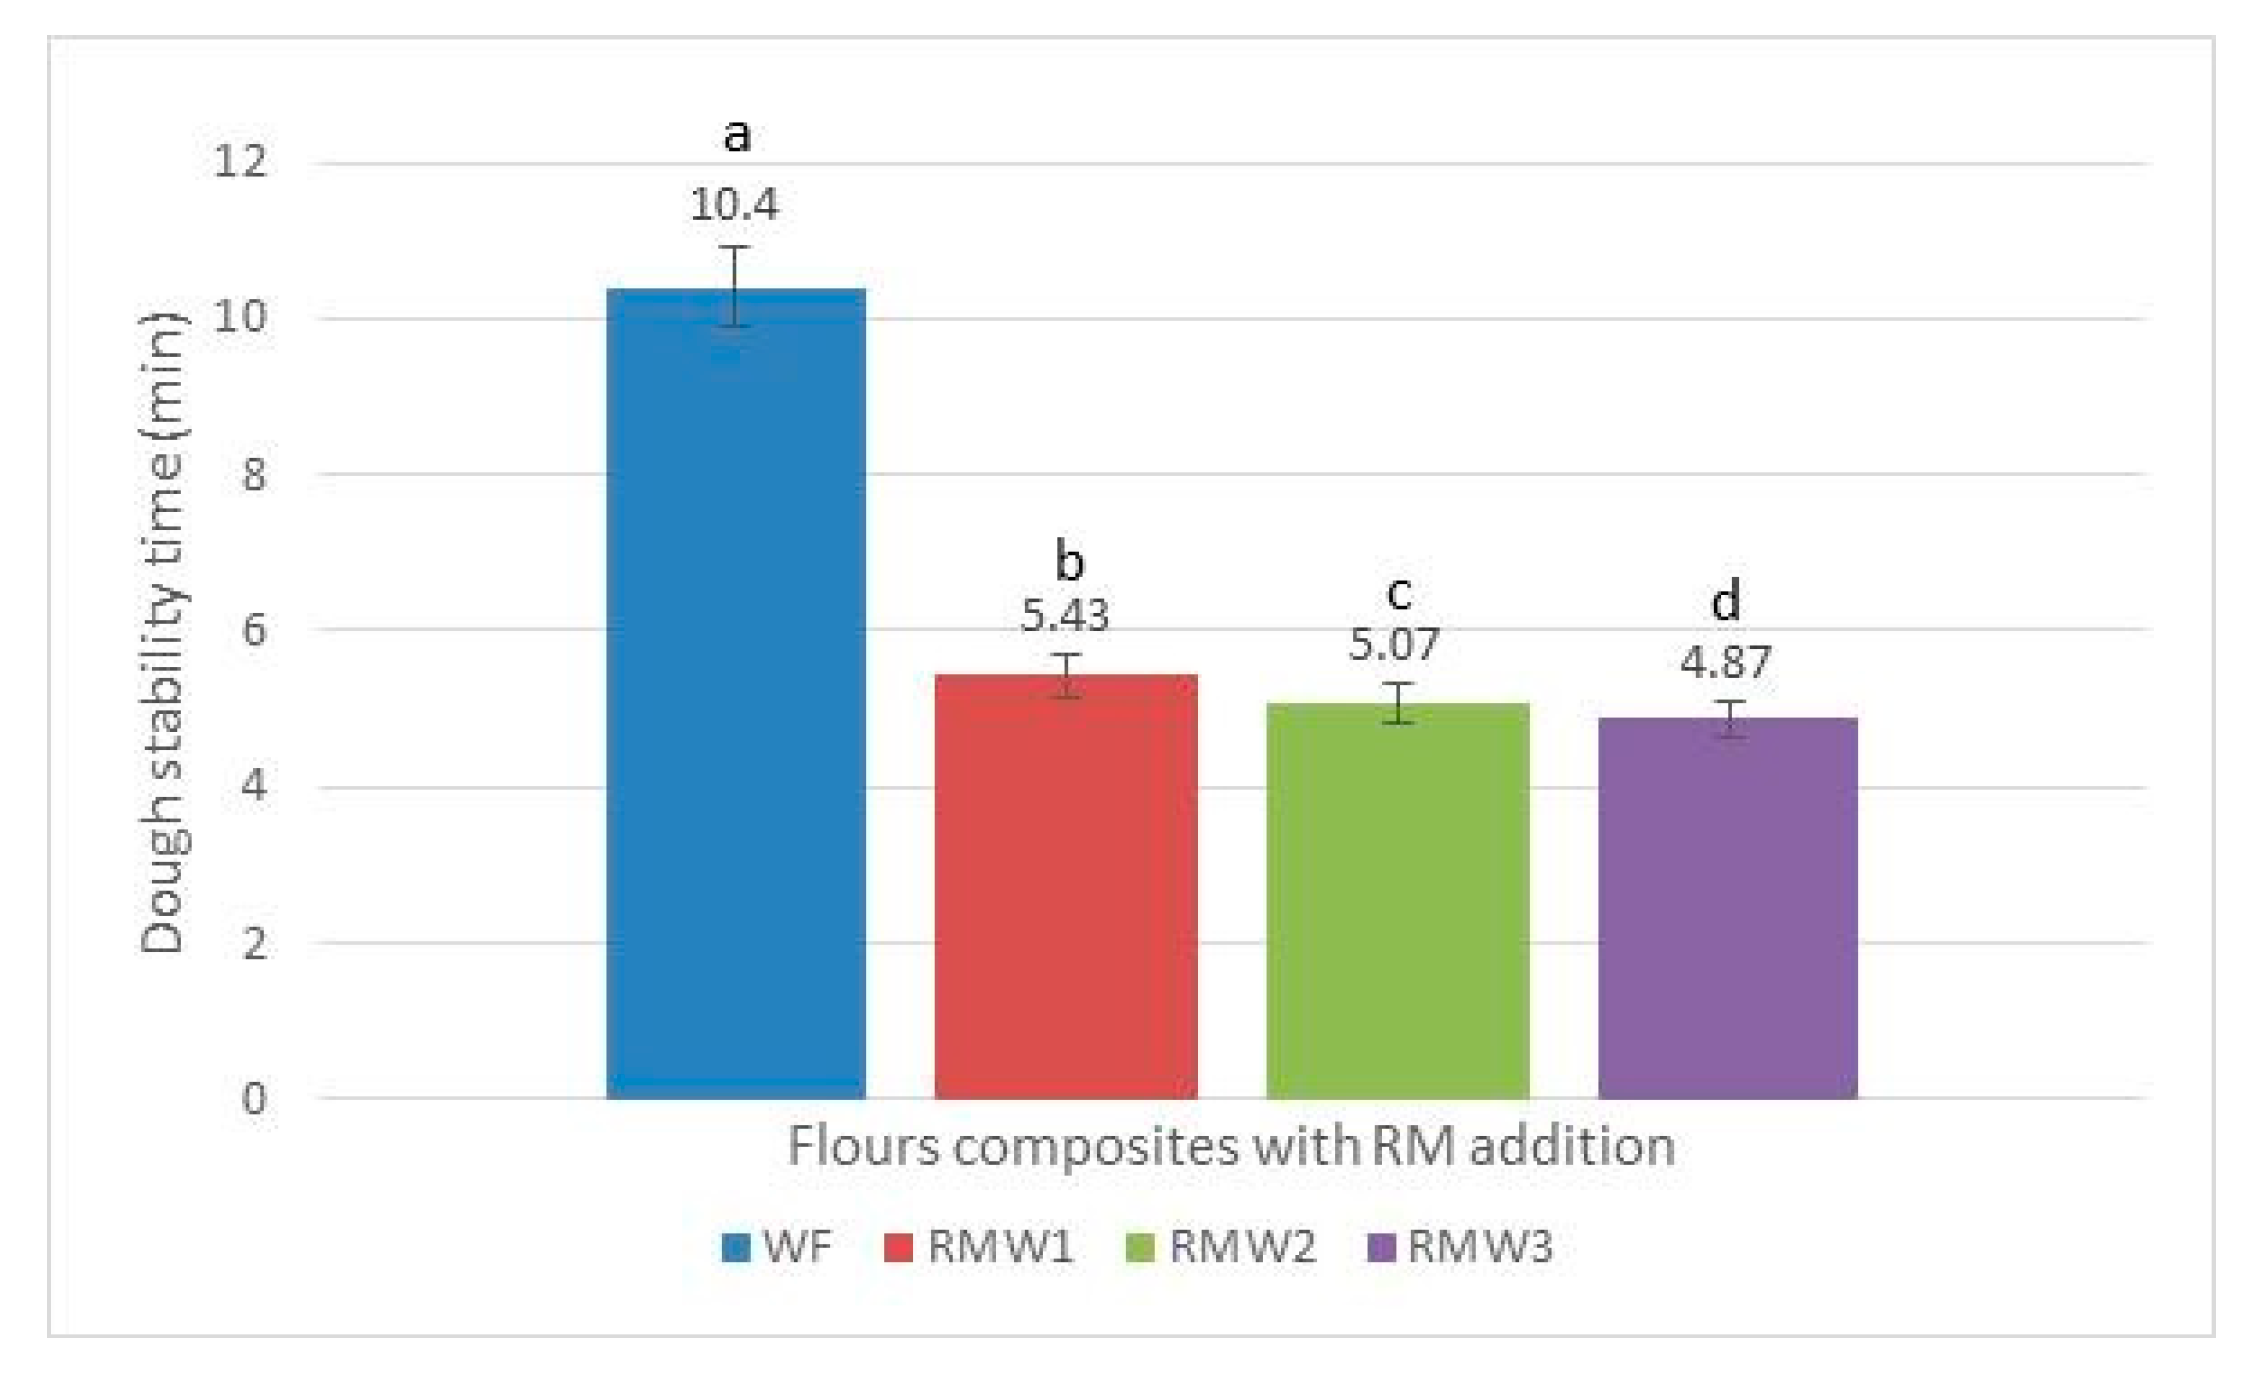
The dough stability time, a key indicator of dough resistance during industrial processing, reflects the ability of the gluten network to withstand mechanical stress during kneading (Figure 5) [24].
The results presented in Figure 5 show that wheat flour (WF) exhibits the highest dough stability (10.4 min), while the incorporation of rapeseed meal leads to a gradual decrease in this parameter in the composite flours. Stability, meanwhile, was measured at 5.43 min for RMW1 (10% RM), 5.07 min for RMW2 (20% RM), and 4.87 min for RMW3 (30% RM). This observation suggests that increasing the proportion of rapeseed meal in the dough composition decreases its structural capacity during mixing. This decrease can primarily be attributed to the dilution of gluten resulting from the incorporation of rapeseed meal. Wheat flour contains gluten proteins (gliadin and glutenin), which play an essential role in forming a cohesive, viscoelastic network. This network helps retain the gas produced during fermentation. When non-cereal ingredients are incorporated into wheat flour, they can disrupt the protein network and, consequently, weaken the dough structure [17,25,68].
In addition, rapeseed meal is characterized by its high dietary fiber and non-gluten protein content. These proteins may interact with gluten proteins and compete for the water available in the dough. These interactions limit the optimal hydration of gluten proteins and reduce the cohesion of the gluten network, thereby decreasing dough stability during mixing. Similar observations have been reported in several studies on composite flours enriched with ingredients high in fiber or plant proteins, such as flaxseeds, sunflower meal, or other plant byproducts [17,69,70]. Moreover, the presence of fibre has been demonstrated to modify the rheological characteristics of dough. This alteration is attributed to the increased water absorption capacity of the fibre, which in turn restricts the mobility of macromolecules within the dough matrix. This can lead to slower and less stable gluten network formation, resulting in reduced dough tolerance to prolonged mixing [70].
Despite this reduction, the stability values observed for composite flours remain within a range compatible with bread-making processes, indicating that rapeseed meal can be used as a functional ingredient in composite flour formulations. However, optimization of processing conditions—namely, dough hydration, mixing time, or the addition of bread-making improvers—may be necessary to counteract the weakening of the gluten network.

3.4.4. Water Absorption of Flour Samples

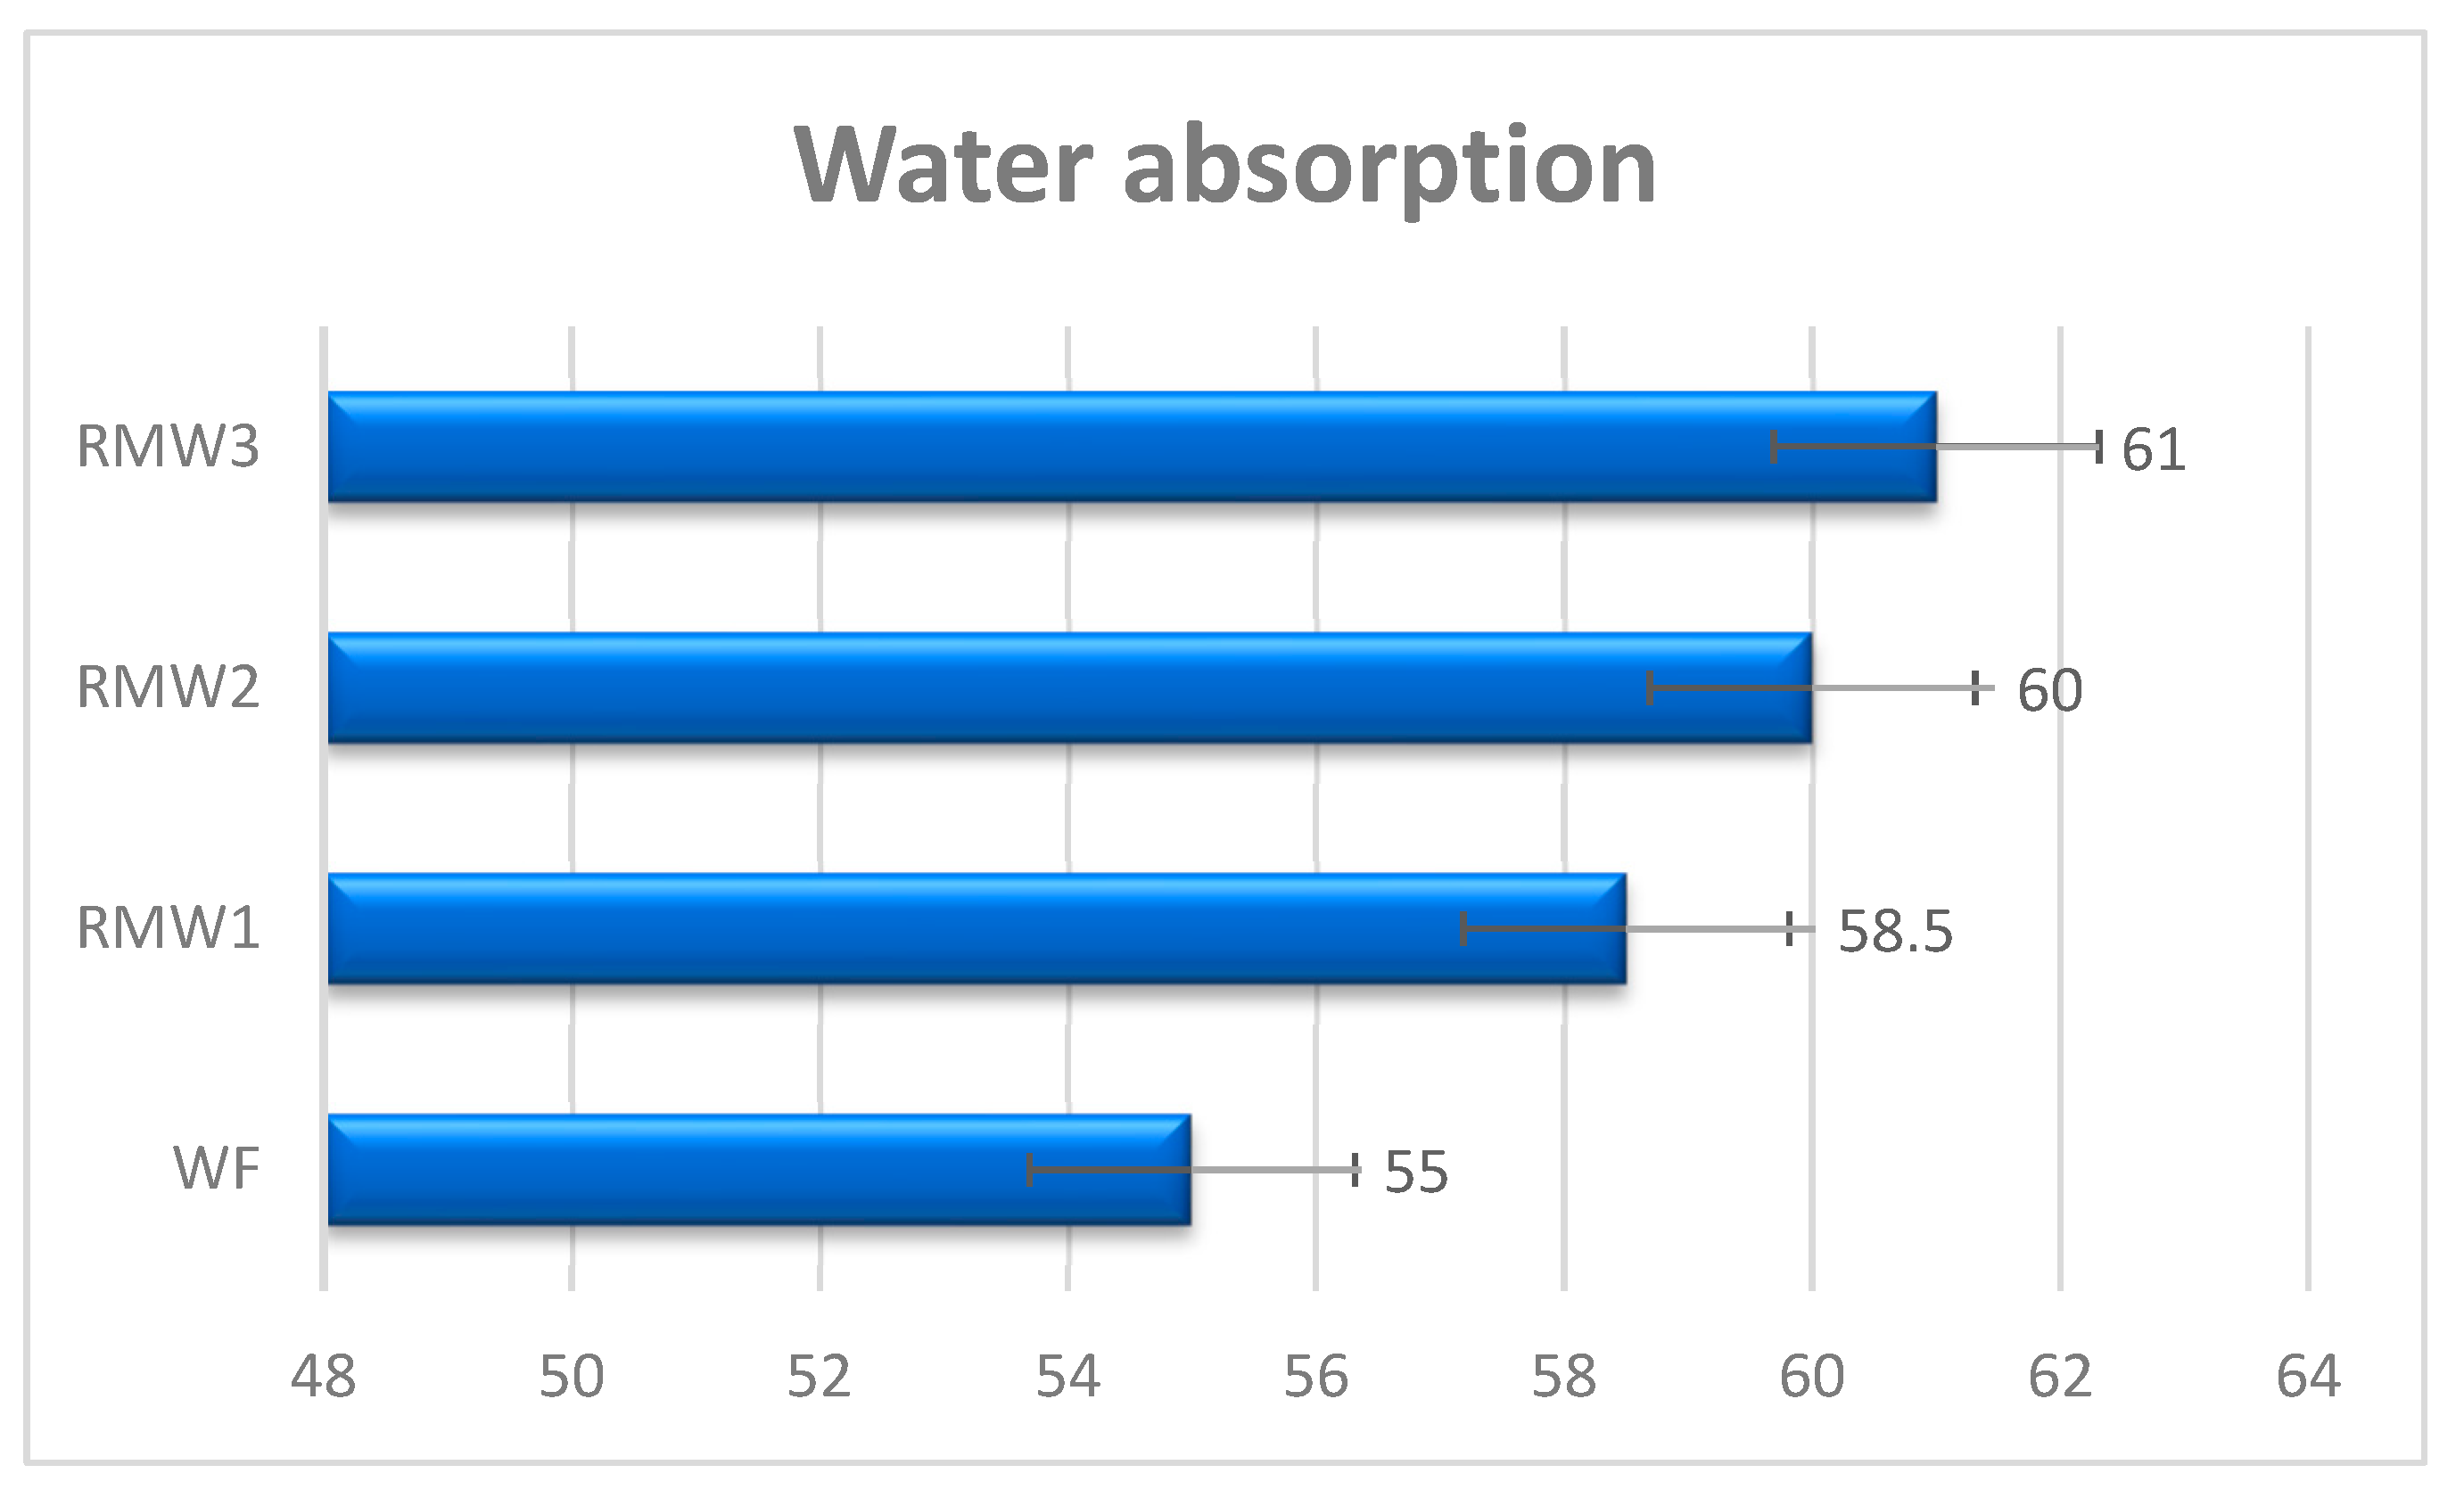
Figure 6 reports the impact of substituting WF with RM on water absorption behavior.
Water absorption is a critical technological property determined by Mixolab, defined as the amount of water necessary to achieve standard dough consistency. It indicates the extent to which flour constituents, including proteins, starch, fiber, and polysaccharides, are able to interact with and bind water. It directly influences mixing properties, dough texture, and the final quality of the bread [24,71]. The results presented in Figure 6 show that wheat flour (WF) has the lowest water absorption (55%), whilst composite flours enriched with rapeseed meal show a gradual increase in this parameter as the substitution rate increases: 58.5% for RMW1 (10% RM), 60% for RMW2 (20% RM), and 61% for RMW3 (30% RM). Incorporating rapeseed meal into the dough significantly increases hydration capacity, thereby confirming the results from Section 3.4.2 on the water absorption index. This increase can be mainly attributed to the high levels of dietary fiber and protein in rapeseed meal. Dietary fiber contains a high number of hydroxyl functional groups capable of interacting with water molecules through hydrogen bonding. This characteristic contributes to an increased water retention capacity within the dough matrix [72]. Similar observations have been reported in various studies on composite flours. Thus, the addition of flours rich in fiber or plant proteins, such as soya, oats, or other plant by-products, significantly increases the dough’s water absorption. This increase is attributable to the high water-binding capacity of these flours, as demonstrated by several studies [73,74].
Furthermore, the relative reduction in starch content in composite flours may also contribute to increased water absorption. Indeed, when ingredients rich in fibre and protein replace part of the wheat flour, the proportion of hydrophilic components in the formulation increases. This increase requires a greater quantity of water to achieve the optimal dough consistency [75].
From a technological perspective, a moderate increase in water absorption can improve the quality of bakery products by resulting in a more hydrated dough. This dough is likely to produce bread with a softer crumb and a higher yield. However, high levels of substitution can also alter the dough’s rheology and require adjustments to baking parameters, such as mixing time or water content. The results indicate that incorporating rapeseed meal improves the hydration capacity of composite flours. Formulations containing 10–20% rapeseed meal appear to offer an attractive compromise between nutritional improvement and technological properties suitable for bread-making.

3.5. Physical Profiles of Bread Samples

The physico-structural attributes of the bread samples are presented in Table 8. The data demonstrate pronounced differences resulting from the incremental substitution of wheat flour (WF) with rapeseed meal flour (RM). Product quality was assessed based on three principal parameters—porosity, elasticity, and the height-to-diameter (H/D) ratio. These metrics serve as reliable indicators of key technological properties, including crumb morphology, gas retention ability, and the overall volumetric development of the baked loaves.
The study findings indicate that bread porosity decreases progressively with increasing levels of substitution of wheat flour (WF) by rapeseed meal (RM). Data evaluation shows that the control sample (CB) exhibited the highest porosity value, reaching 62.25%. In contrast, the enriched breads show slightly lower values, with 62.12% for RMWB1, 61.42% for RMWB2, and 60.90% for RMWB3. This decrease in porosity can be attributed mainly to the dilution of gluten and the presence of dietary fiber in the rapeseed meal. These components disrupt the formation and stability of the gluten network, which is responsible for retaining the carbon dioxide produced during fermentation. When this network is weakened, the dough’s ability to retain gases decreases. This reduction leads to a more compact crumb structure and lower bread volume and porosity. Similar observations have been reported in several studies on breads enriched with fiber- or vegetable-protein ingredients. The incorporation of plant-based ingredients into wheat flour, for example, reduces the bread’s porosity and volume. This reduction is attributable to the interference of plant fibers with the gluten network, thereby altering the dough structure [76]. Furthermore, bread porosity is closely linked to the type of flour used and the composition of the dough. White breads made exclusively from refined flour typically have higher porosity than breads containing high-fiber fractions, which produce a denser, less airy crumb [77].
The elasticity of the crumb also decreases as the rapeseed meal content increases: 61.18% for CB, 58.05% for RMWB1, 57.28% for RMWB2, and 55.48% for RMWB3. This observation can be interpreted as structural changes in the crumb induced by the incorporation of rapeseed meal. Bread elasticity is a physicochemical property that depends on the cellular structure of the crumb and the integrity of the gluten network. When non-gluten proteins and fibers are introduced into the formulation, they can interact with gluten proteins, thereby reducing their ability to form a continuous viscoelastic network [28]. Extensive research on breads enriched with rapeseed proteins has shown that their incorporation can reduce crumb elasticity. This decrease is attributable to alterations in pore structure and an increase in crumb density [42]. Furthermore, the crumb structure significantly influences the bread’s mechanical properties. A positive correlation has been observed between porosity and crumb elasticity, meaning that breads with an airier structure generally have higher elasticity [42].
The height-to-diameter ratio (H/D), which indicates the bread’s ability to rise vertically during baking, also decreases as the substitution rate increases. The values range from 0.59 for CB to 0.50 for RMWB1, 0.48 for RMWB2, and 0.46 for RMWB3. The decrease in the H/D ratio suggests a reduction in specific volume and in the bread’s expansion during baking. This observation is frequently reported in the context of breads enriched with fiber- or plant-protein-rich ingredients [17,25,28,76]. Indeed, the presence of these components has been demonstrated to disrupt the gluten network, thereby reducing the dough’s capacity to retain gases during both the fermentation and baking processes. Studies conducted on breads fortified with plant-based ingredients have yielded analogous outcomes. In the course of these studies, an increase in the level of substitution was found to result in a gradual decrease in the H/D ratio and in the volume of the bread. This phenomenon can be attributed to the weakening of the gluten network and the reduced stability of the gas cells [17,25,28,76].
Overall, the results reveal that incorporating rapeseed meal into the dough affects the physical structure of the bread by altering the formation of the gluten network and the distribution of gas cells within the crumb. Increasing the substitution rate leads to several notable effects. Firstly, it reduces crumb porosity, indicating a more compact structure. Secondly, it leads to a decrease in elasticity due to interactions between fibers, non-gluten proteins, and gluten. Finally, it results in a lower H/D ratio, reflecting more limited bread expansion during baking. Despite these changes, the differences observed remain relatively moderate, suggesting that incorporating 10–20% rapeseed meal could represent an acceptable compromise between nutritional improvement and the preservation of the bread’s physical properties.

3.6. Correlation Analysis of Nutritional Composition and Bioactive Components in Different Flours

3.6.1. Correlation Analysis of Nutritional Parameters, Macro- and Micro-Elements, Total Polyphenol Content, and Antioxidant Activity in Different Flours

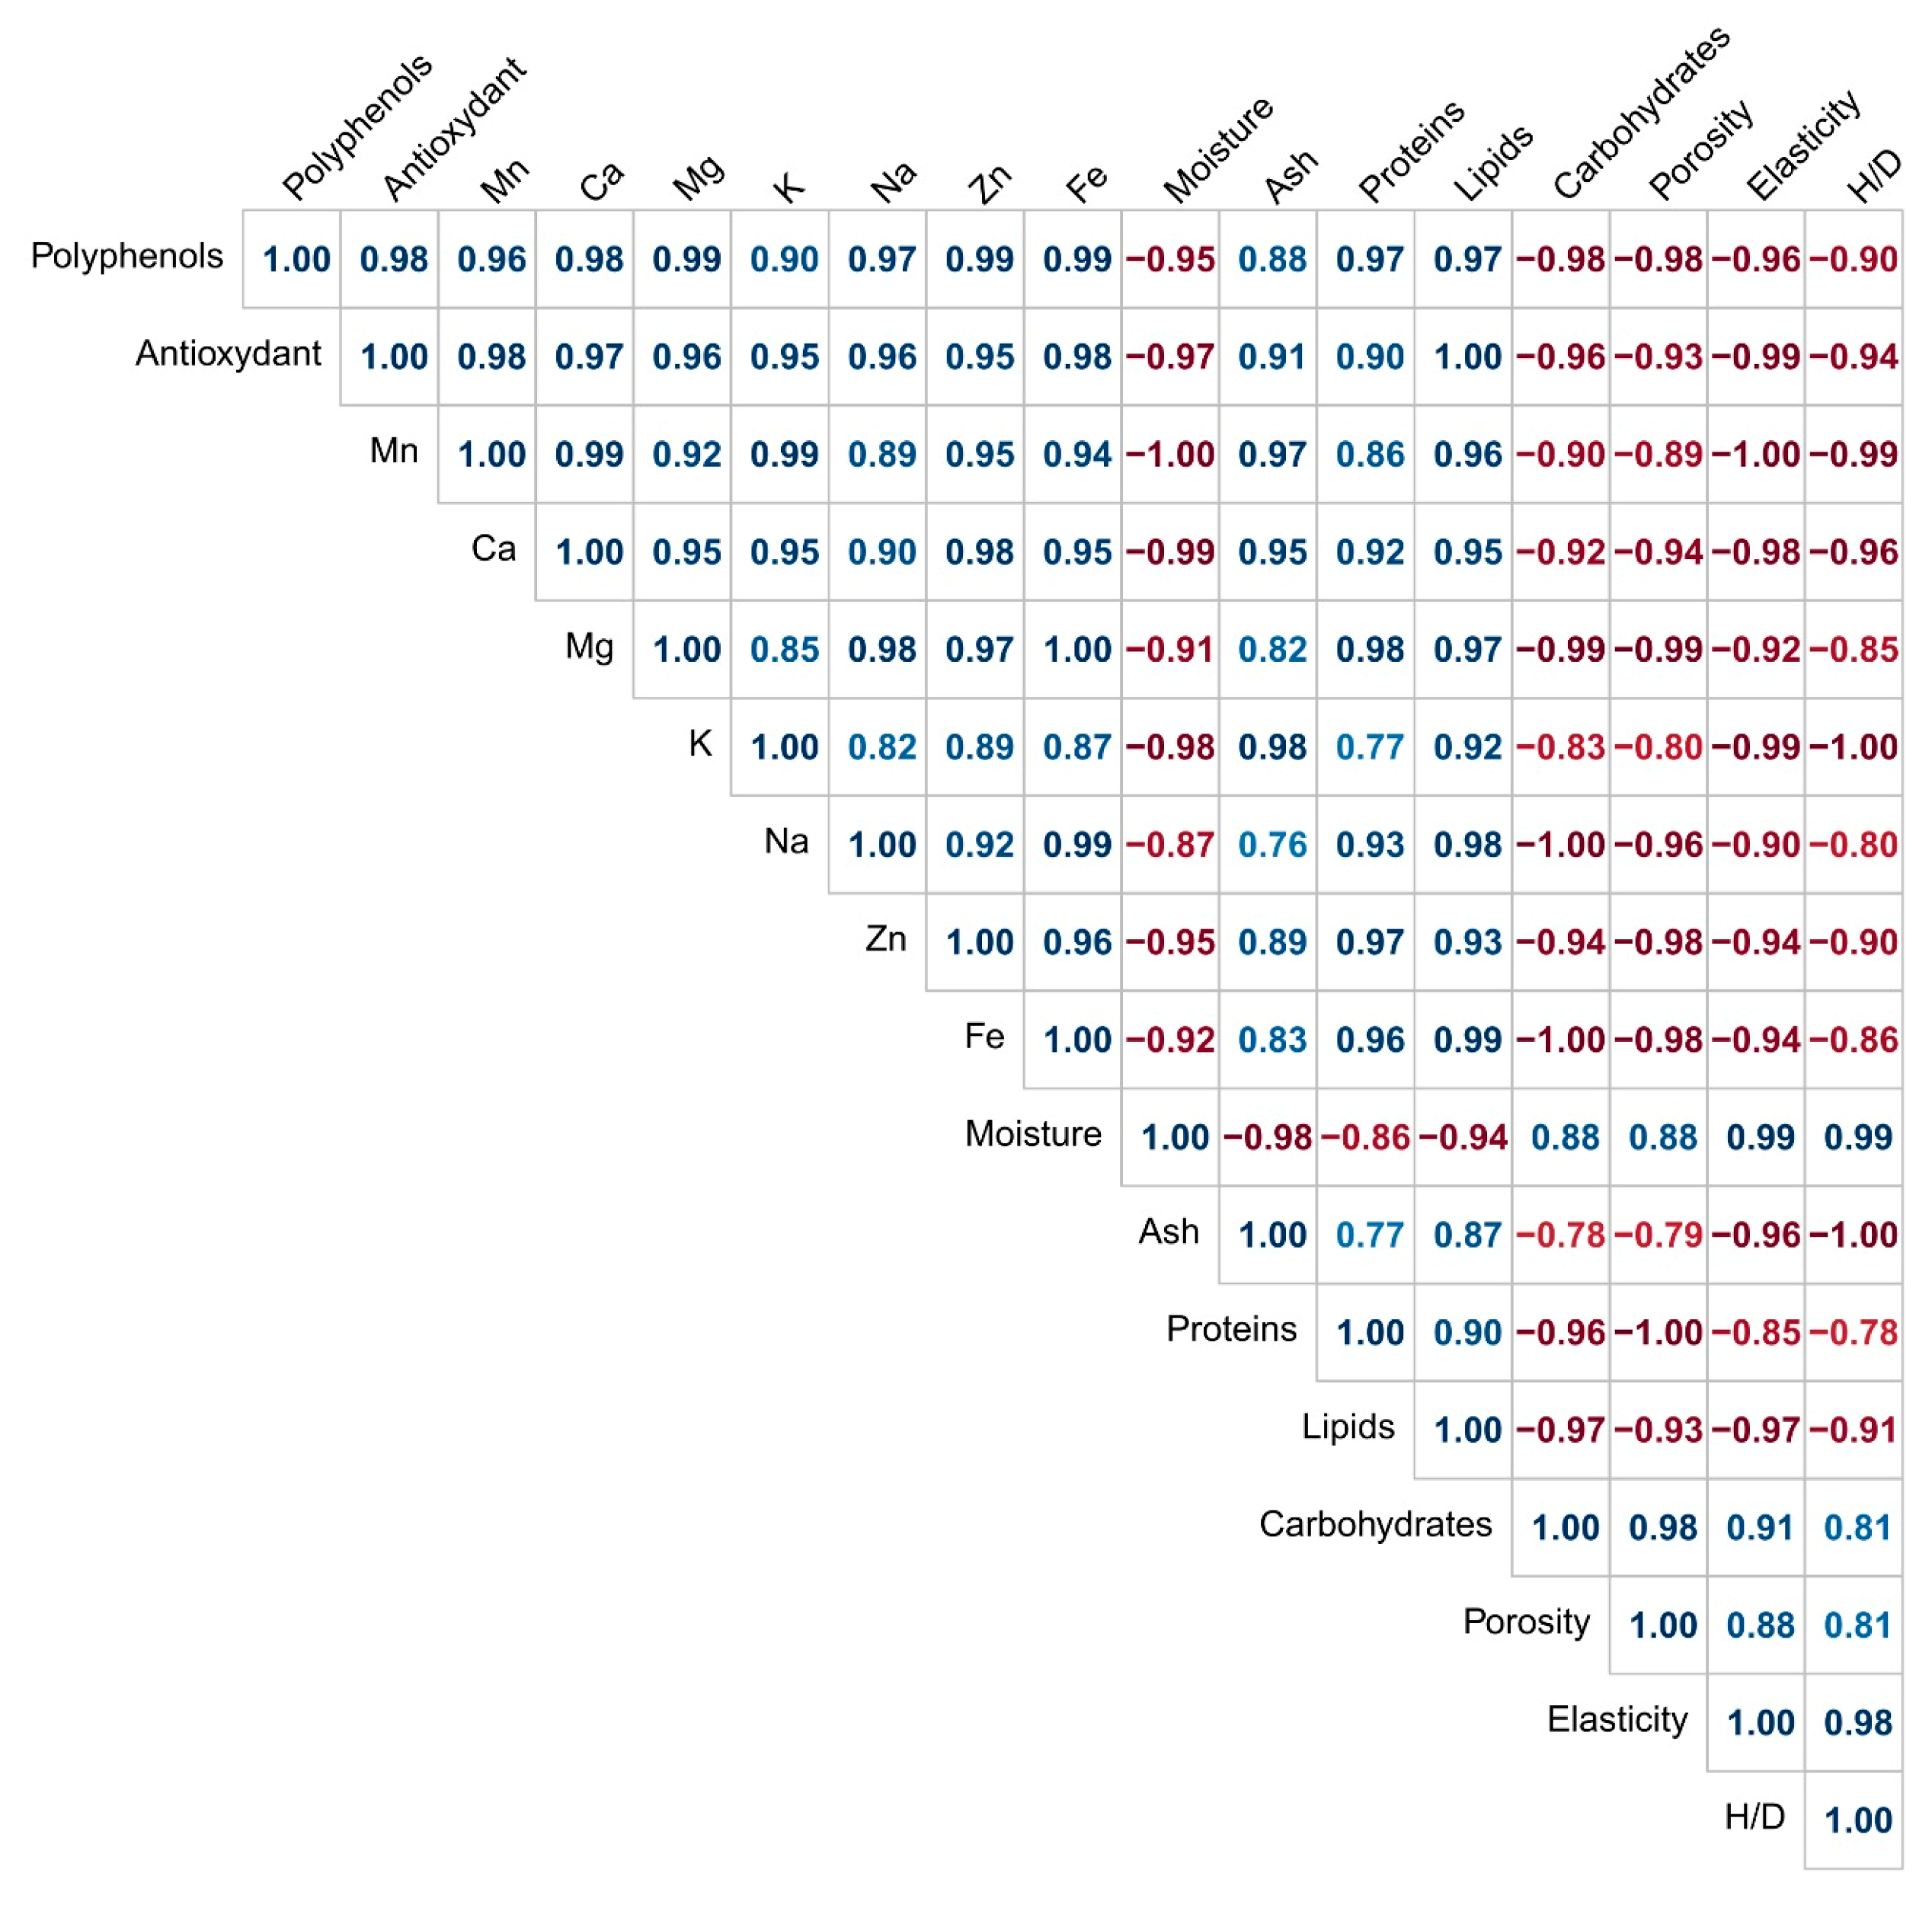
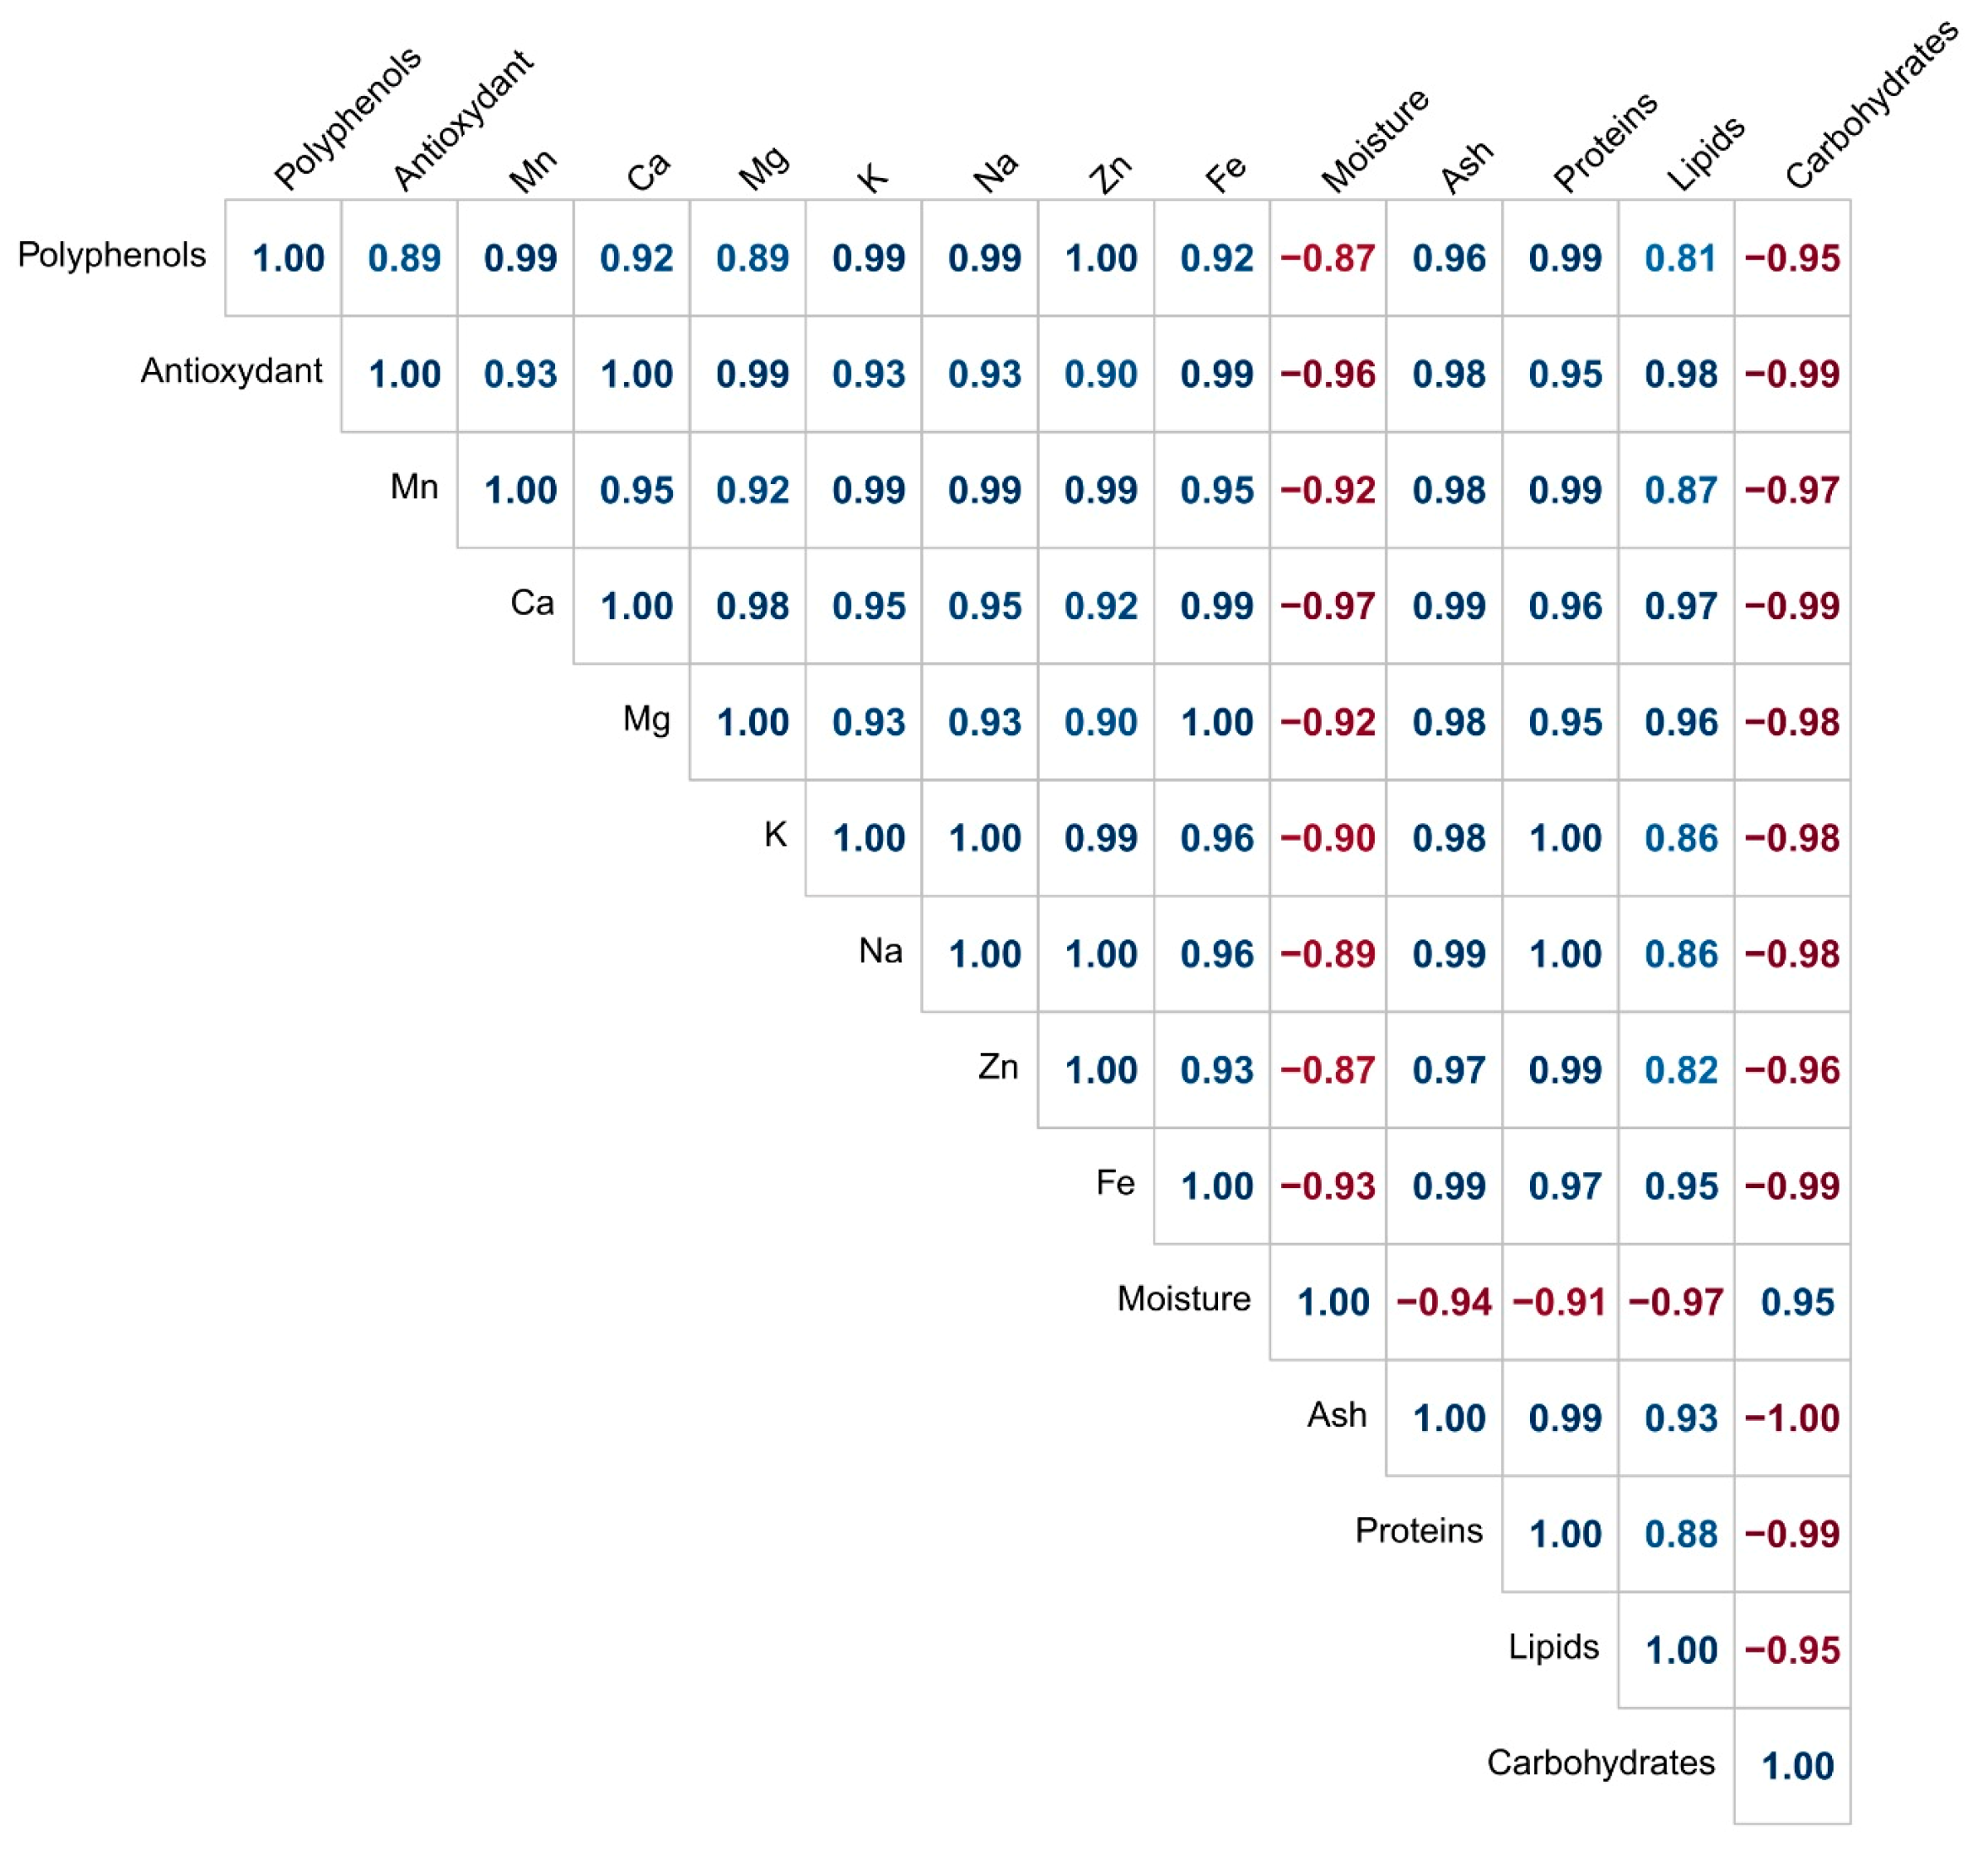
The relationships among nutritional parameters, macro- and micro-elements, total polyphenol content, and antioxidant capacity in various flour samples were systematically evaluated. The correlation assessment presented in Figure 7 illustrates the interdependencies between compositional traits, mineral content, and bioactive constituents in composite flours enriched with rapeseed meal. Statistical analyses revealed high correlation coefficients, suggesting that incorporating rapeseed meal results in simultaneous changes in several nutritional and functional components of the flour.
A strong positive correlation (r = 0.89) was identified between total polyphenol content and antioxidant activity. Rapeseed meal is particularly distinguished by its elevated concentration of phenolic compounds, predominantly sinapic acid and sinapine, which represent the major fraction of phenolic acids within this plant-derived matrix. These compounds exhibit strong free-radical-scavenging activity. They thus contribute significantly to overall antioxidant activity, as demonstrated by several studies [44]. Research has established a direct correlation between polyphenol content and antioxidant activity in rapeseed meal extracts, thereby confirming the central role of these bioactive compounds in the functional properties of rapeseed-enriched products [78]. Thus, the gradual increase in antioxidant activity observed in composite flours containing 10%, 20%, and 30% rapeseed meal can be attributed to the corresponding increase in the polyphenol content introduced by this ingredient.
A pronounced positive correlation was further identified between total polyphenol levels and multiple mineral constituents, including manganese (Mn), calcium (Ca), magnesium (Mg), potassium (K), zinc (Zn), and iron (Fe), with correlation coefficients spanning from 0.90 to 0.99. This association may be attributed to the intrinsic composition of rapeseed meal, which serves as a substantial source of both phenolic compounds and essential mineral elements naturally embedded within the plant matrix [6,12]. Furthermore, polyphenols are likely to form complexes with metal ions, thereby enhancing their antioxidant properties through mechanisms involving metal chelation during oxidation reactions. These interactions appear to reinforce the role of polyphenols in protecting against oxidative stress, which could explain the positive correlations observed between these variables.
A significant positive correlation was observed between protein, ash, and mineral content. The relationship is consistent with the composition of rapeseed meal, which is characterised by high concentrations of protein and minerals derived from the seed’s cellular tissues [6,12]. It was found that the concomitant increase in protein and ash content, in correlation with the rise in the substitution rate, demonstrates the predominant role of rapeseed meal as a substantial source of nutrients in compound flours.
Furthermore, the figure shows a significant negative correlation between carbohydrates and most other nutritional parameters, including polyphenols, minerals, proteins, and lipids. The phenomenon of nutritional dilution can explain this relationship. Refined wheat flour is characterized by its high starch content and generally lower concentrations of fiber, minerals, and bioactive compounds. It has been demonstrated that increasing the proportion of rapeseed meal in the formulation leads to a concomitant decrease in the carbohydrate fraction, whilst the protein, mineral, and phenolic fractions show an increase (Section 3.1).
A comprehensive analysis of the correlation matrix reveals concurrent improvements in the nutritional profile and antioxidant properties of the composite flours upon incorporation of rapeseed meal. The findings highlight positive correlations between polyphenol content, antioxidant activity, and mineral content. These results suggest a possible synergy between these compounds, which indicates that they could significantly improve the functional value of enriched cereal products. These findings support the growing interest in using oilseed by-products, such as rapeseed meal, as functional ingredients in the formulation of enriched food products, particularly in the bakery sector.

3.6.2. Correlation Analysis of Nutritional Composition, Mineral Content, Bioactive Compounds, Antioxidant Capacity, and Physical Properties of Various Bread Types

The correlation matrix presented in Figure 8 provides insight into the relationships among the nutritional composition, mineral profile, antioxidant capacity, and physical attributes of bread samples fortified with rapeseed meal. The strong correlations identified suggest that the progressive addition of rapeseed meal induces concurrent modifications in both the nutritional quality and structural characteristics of the bread.
The findings illustrated in Figure 8 indicate a very strong positive correlation (r = 0.98) between total polyphenol content and antioxidant activity, suggesting that phenolic compounds represent the primary contributors to the antioxidant potential of the enriched bread samples. This result is consistent with previous observations made on composite flours (see Section 3.6.1). The phenolic compounds, namely sinapic acid and sinapine, which make up the RM, exhibit a strong ability to neutralize free radicals. This property explains the parallel increase in antioxidant activity as the proportion of rapeseed meal in the formulation increases [79,80]. Extensive research on cereal products enriched with oilseed by-products has also revealed that increasing the concentration of polyphenols in composite flours leads to a significant increase in antioxidant activity in the resulting breads [17].
The results in Figure 8 also show a very high positive correlation between minerals (Mn, Ca, Mg, K, Na, Zn, Fe), ash, and protein. This relationship highlights the nutritional value of rapeseed meal, which is naturally rich in protein and essential minerals. It has been observed that oilseed byproducts generally contain significant concentrations of nutrients, which are closely associated with the seed’s protein and fiber fractions. Thus, increasing the proportion of rapeseed meal in bread formulations leads to a concomitant increase in mineral and protein content. This phenomenon explains the observed positive correlations.
Furthermore, the results reveal a significant negative correlation between carbohydrate content and most other nutritional parameters, such as protein, minerals, polyphenols, and antioxidant activity. This observation can be explained by the partial replacement of wheat flour, which is rich in starch, with rapeseed meal, which has a different composition due to its higher protein, fiber, and bioactive compound content. Consequently, increasing the proportion of rapeseed meal leads to a relative reduction in the carbohydrate fraction of the bread’s composition.
The inverse relationship identified between moisture content and mineral concentration may be partly attributed to the expression of mineral levels on a fresh weight basis, whereby higher moisture levels induce a dilution effect. Significant correlations were also identified between the nutritional composition and the physical characteristics of the bread samples, specifically porosity, elasticity, and the height-to-diameter ratio (H/D). Positive relationships were observed among porosity, elasticity, and the H/D ratio, whereas negative associations were detected between these physical parameters and key nutritional components, including protein, dietary fiber, and mineral content. These effects can be attributed to the gluten dilution phenomenon caused by rapeseed meal incorporation. The introduction of non-gluten proteins and dietary fiber may disrupt the gluten matrix responsible for gas retention during proofing and baking. Consistent with previous findings, increasing levels of rapeseed protein substitution have been shown to reduce crumb porosity and elasticity, primarily due to modifications in cell structure and reduced gas-holding capacity of the gluten network [42].
Analysis of the correlation matrix indicates two predominant trends. An increase in rapeseed meal content enhances the nutritional profile of bread, as evidenced by elevated levels of polyphenols, minerals, proteins, and antioxidant activity. Concurrently, its incorporation induces modifications in bread structure, leading to a modest decline in gluten-dependent technological properties such as porosity, elasticity, and loaf expansion. These results validate the hypothesis that oilseed by-products represent promising functional ingredients for improving the nutritional quality of baked goods while maintaining satisfactory technological performance at moderate substitution levels (10–20%) [17].

3.7. Principal Component Analysis (PCA) Applied to Wheat–Rapeseed Flour Mixtures and Their Derived Bread Products

3.7.1. Principal Component Analysis Applied to Wheat Flour (WF), Rapeseed Meal (RM), and Composite Flour Blends (RMW1, RMW2, and RMW3)

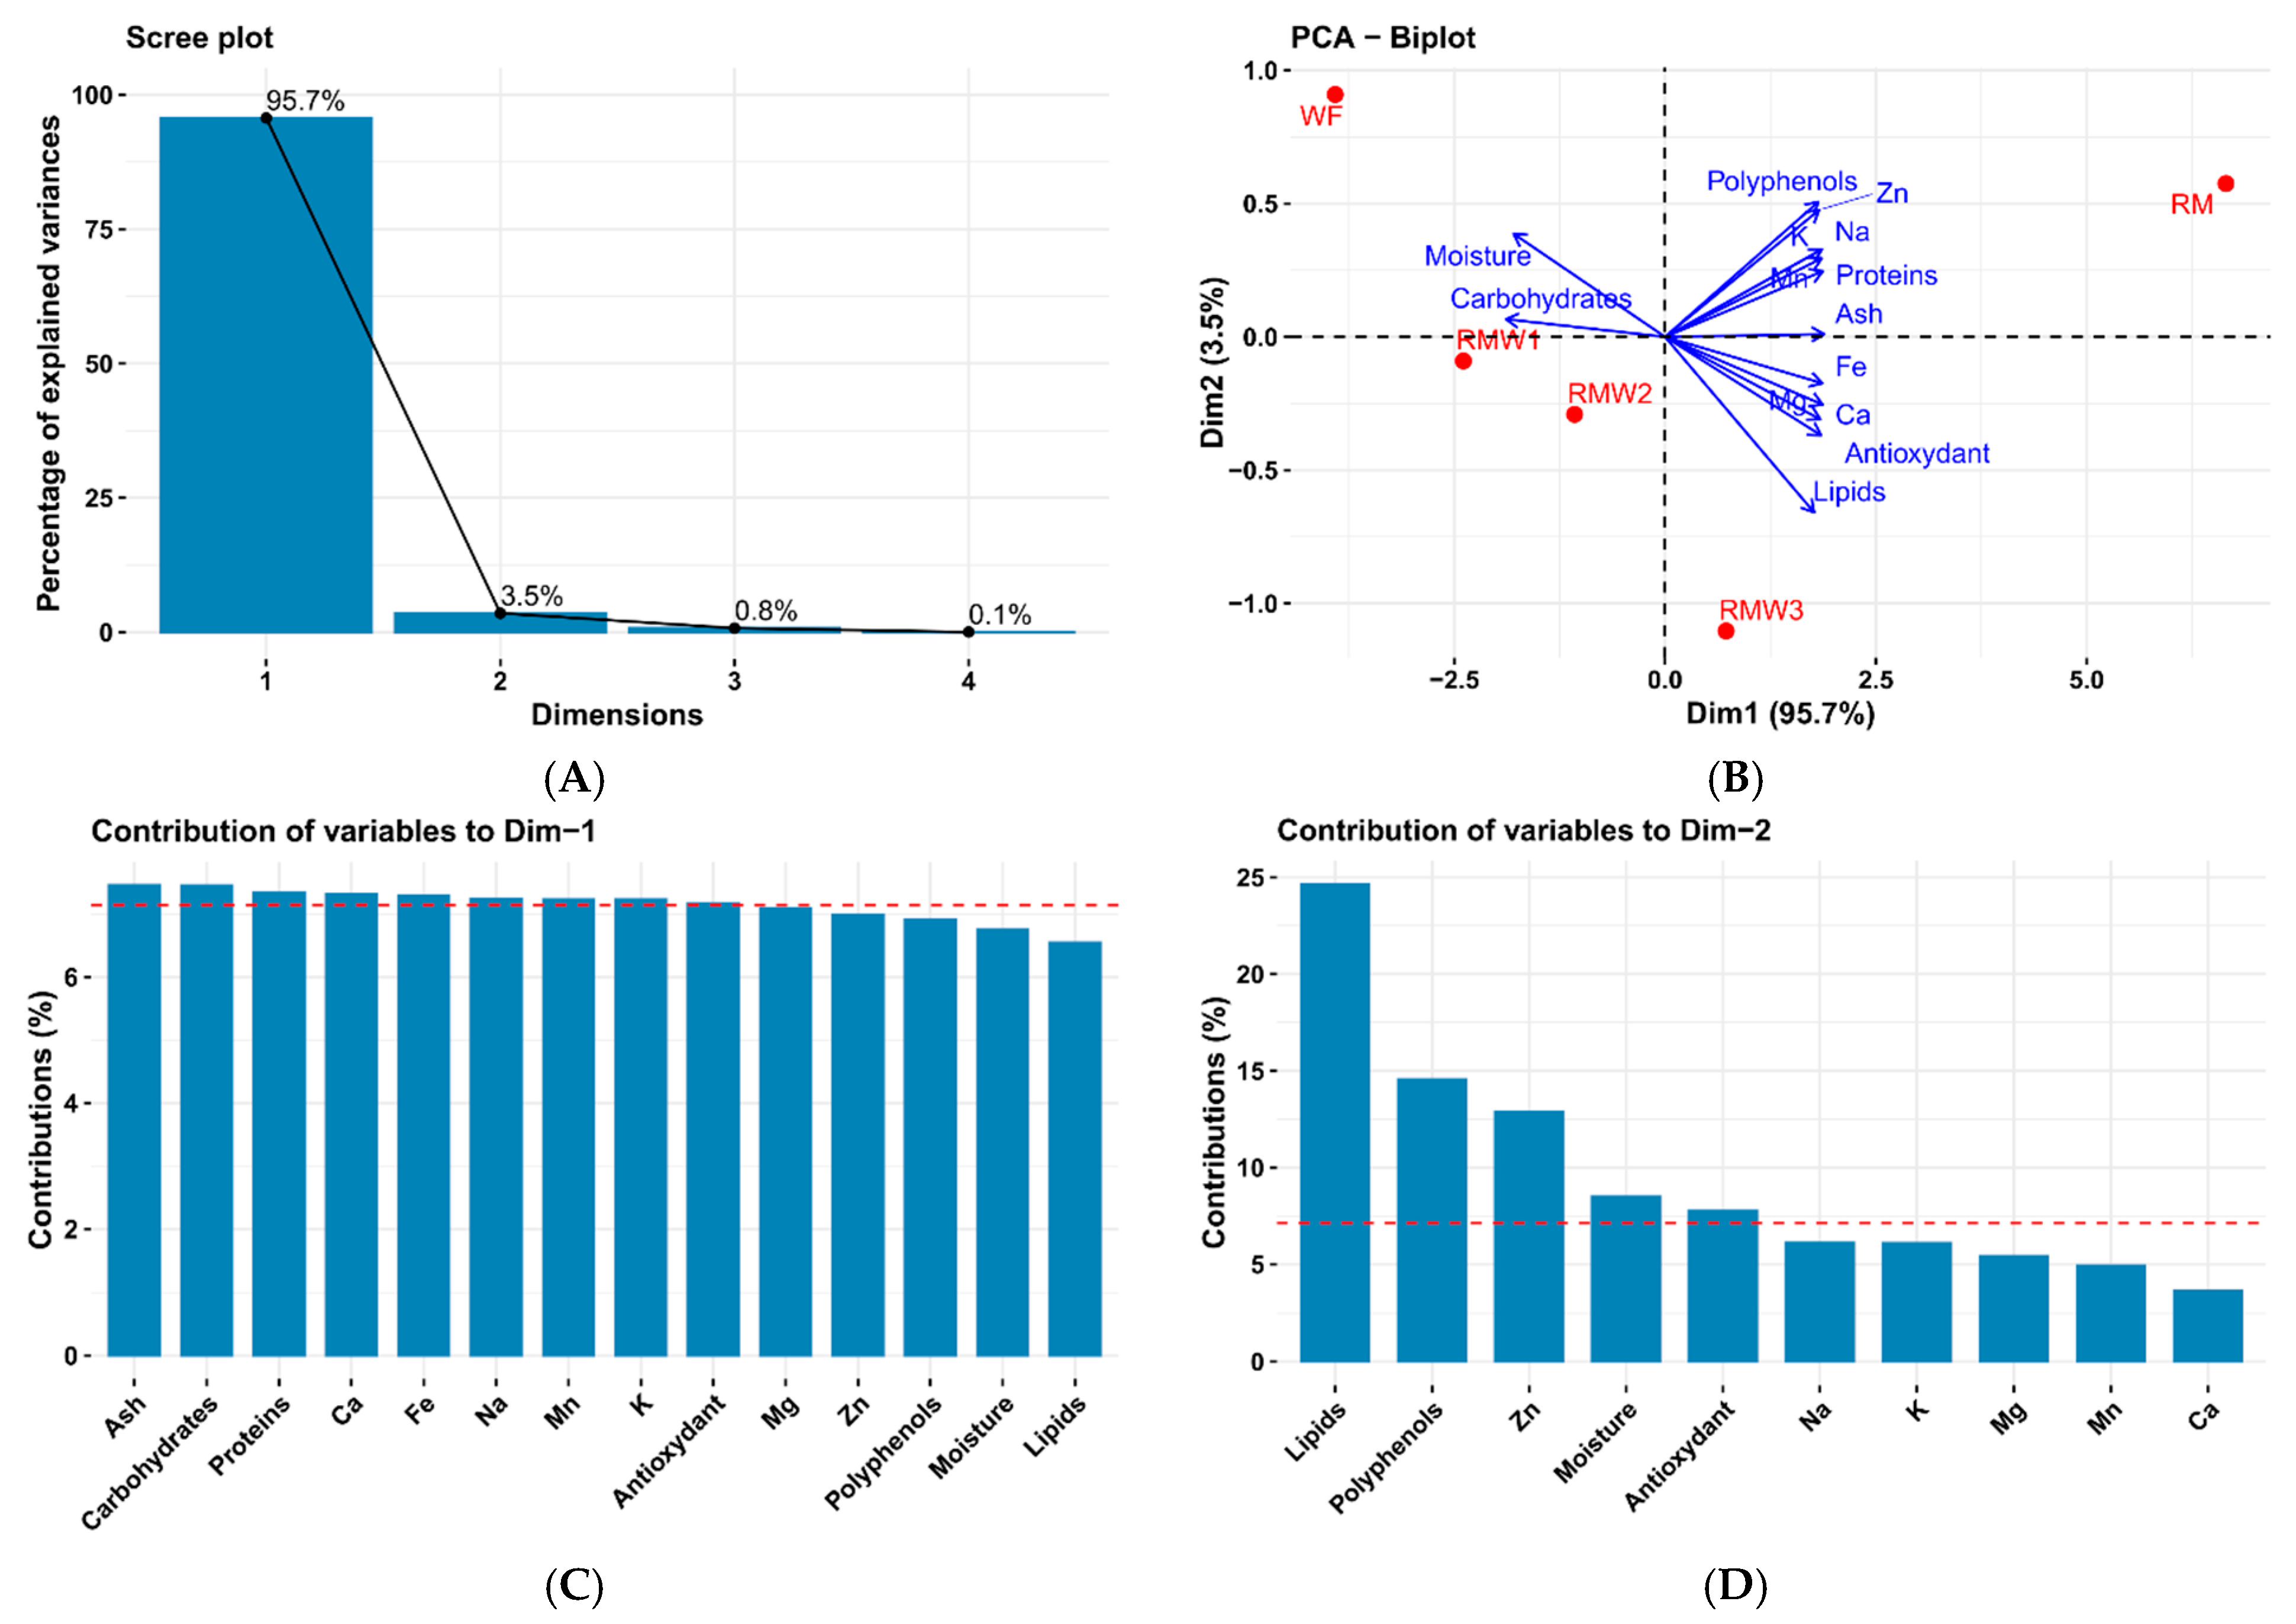
As illustrated in Figure 9, the outcomes of the principal component analysis (PCA) for the investigated flour samples (WF, RM, RMW1, RMW2, and RMW3) are presented. PCA was performed to explore the interrelationships among the nutritional composition, mineral content, and antioxidant properties of the analyzed flours, as well as to determine the variables that most significantly contribute to sample differentiation.
Analysis of the scree plot (Figure 9A) shows that the first principal component (Dim1) explains 95.7% of the total variance, while the second component (Dim2) explains 3.5%, resulting in a cumulative variance of over 99%. This observation suggests that most of the data variability is captured by the first two components, thereby validating the effectiveness of two-dimensional representation for interpreting the relationships between variables and samples. In the context of nutritional characterization studies of food matrices, a high proportion of variance explained by Dim1 generally indicates a strong correlation among the measured variables. This correlation is particularly pronounced when samples exhibit significant differences, particularly in overall chemical composition. Principal component analysis (PCA) is a widely used statistical technique in food research. It enables identification of the dominant factors influencing the nutritional and functional properties of cereal products enriched with plant byproducts [81,82].
Analysis of the data using a PCA biplot (see Figure 9B) reveals a significant distinction between the samples. Specifically, the RM sample is located in the positive region of Dim1 and shows notable correlations with polyphenols, proteins, minerals (Zn, Na, Fe, Ca), and antioxidant activity. WF is located in the negative region of Dim1 and is mainly associated with carbohydrates and moisture. The composite flours (RMW1, RMW2, and RMW3) lie between these two extremes, thus reflecting their intermediate composition. This distribution highlights the impact of the sequential incorporation of rapeseed meal on the significant modification of the nutritional composition of the composite flours. Rapeseed meal is known for its high protein, mineral, and phenolic compound content, which explains its association with these variables in the PCA space [44,49].
Analysis of the data reveals that the majority of nutritional and mineral parameters, such as protein, ash, polyphenols, antioxidant activity, and various essential minerals, including Ca, Fe, Mn, Na, and Zn, make a significant contribution to this component. This observation suggests that PC1 primarily represents a nutritional gradient, contrasting starch-rich flours (WF) with flours rich in protein, minerals, and bioactive compounds (RM and composite flours). This finding is relevant to the growing use of rapeseed meal as a substitute for wheat flour in the food industry. This substitution increases protein and mineral content while decreasing carbohydrate content.
The second principal component (Dim2) explains a much smaller proportion of the variance (3.5%) but allows for the identification of certain specific parameters. As shown in Figure 9D, the variables that contribute significantly to Dim2 are lipids, polyphenols, zinc, moisture, and antioxidant activity. This component may reflect secondary variations related to the biochemical characteristics of rapeseed meal, particularly its residual lipid and phenolic compound content. Rapeseed by-products, resulting from oil extraction, contain a residual portion of lipids as well as phenolic compounds that may affect the functional and nutritional properties of composite flours [44].
Principal component analysis (PCA) indicates that incorporating rapeseed meal results in significant changes in the nutritional profiles of the flours. These changes are characterized by increases in protein, essential minerals, polyphenols, and antioxidant activity, along with a relative decrease in carbohydrates. These results suggest that rapeseed meal has promising potential as a functional ingredient in the formulation of composite flours for breadmaking.

3.7.2. Principal Component Analysis Applied to the Control Bread (CB) and Bread Samples Enriched with Rapeseed Meal (RMWB1, RMWB2, and RMWB3)

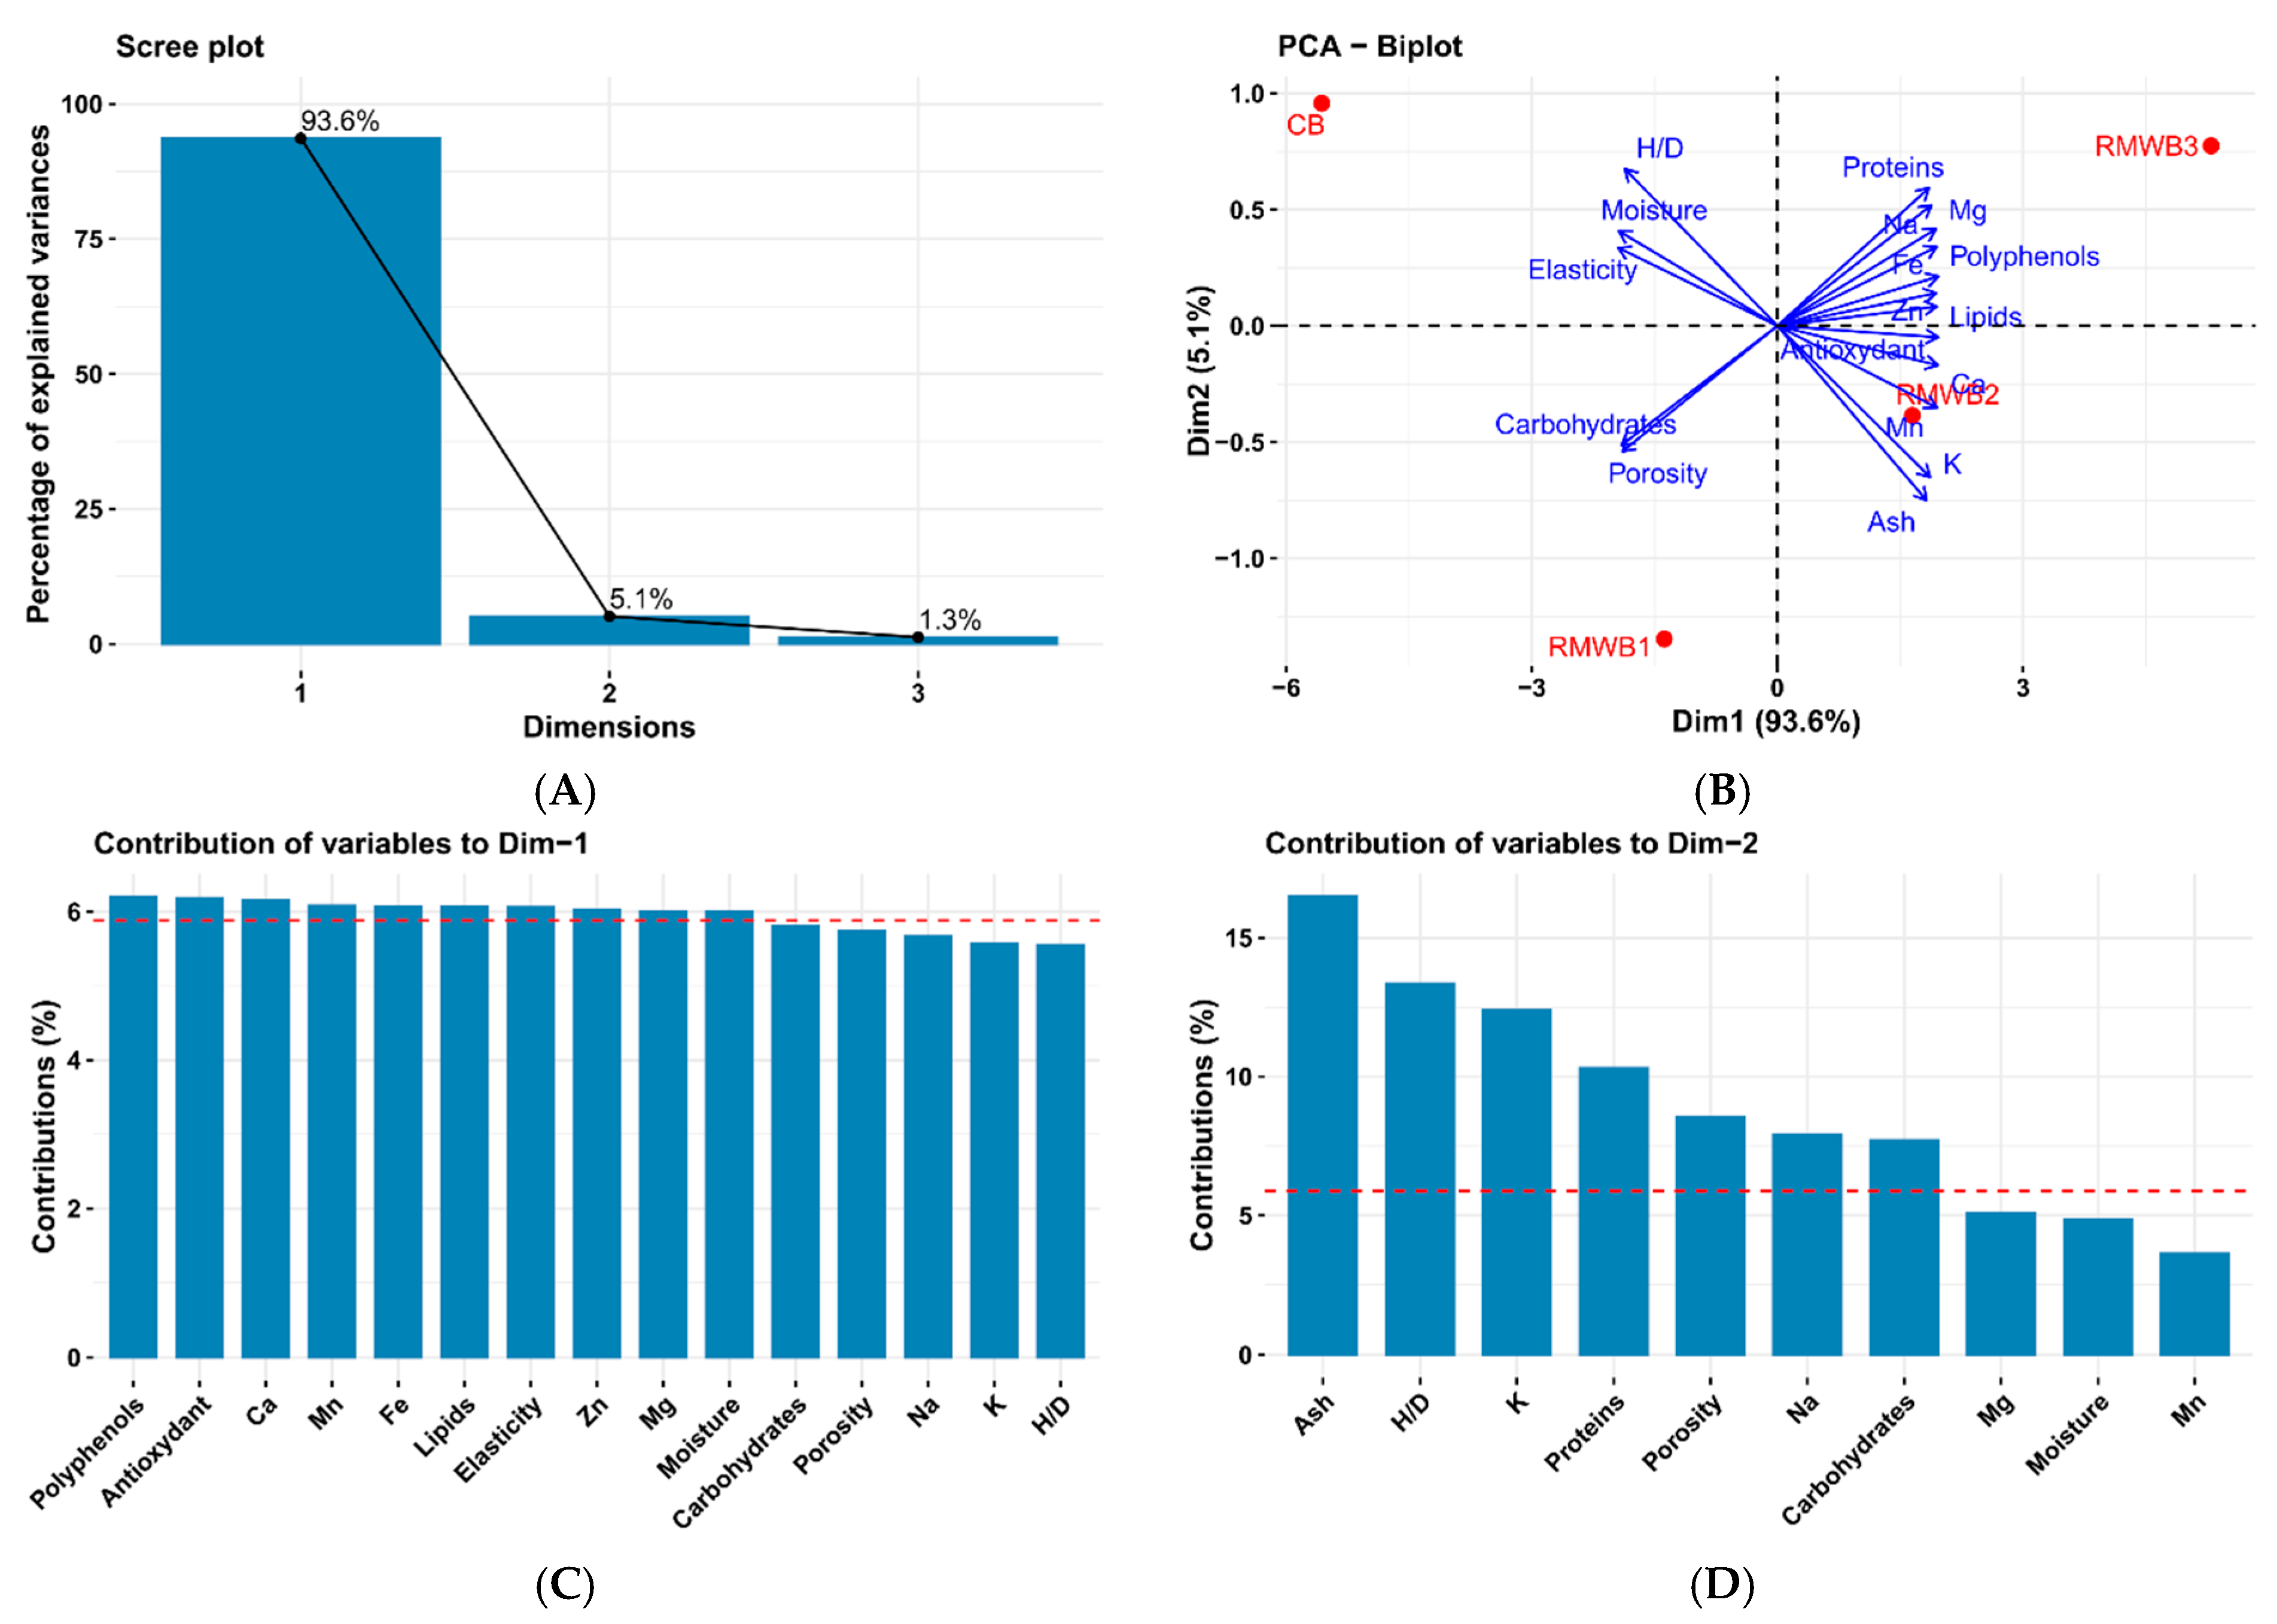
Principal component analysis (PCA) was conducted to examine the relationships among nutritional composition, mineral profile, antioxidant capacity, and physical characteristics of bread samples (CB, RMWB1, RMWB2, and RMWB3) obtained with varying levels of rapeseed meal substitution in wheat flour. The corresponding results are illustrated in Figure 10.
The scree plot examination (Figure 10A) indicates that the first principal component (Dim1) captures 93.6% of the total variance, whereas the second component (Dim2) accounts for 5.1%. Collectively, these two components explain approximately 99% of the overall variability, suggesting that the dataset can be effectively interpreted within a two-dimensional framework.
The PCA biplot (Figure 10B) clearly illustrates the distribution of the different types of bread: CB is located in the negative region of Dim1 and is associated with carbohydrates, porosity, and elasticity—distinctive characteristics of breads made exclusively from refined wheat flour. In contrast, RMWB1 is located near the center, although its composition shows a slight tendency to align with the enriched bread group. This observation suggests a moderate modification of the initial composition. Finally, the RMWB2 and RMWB3 breads, located in the positive quadrant of Dim1, are correlated with protein, minerals (Mg, Fe, Zn, Ca, K), lipids, polyphenols, and antioxidant activity. This distribution supports the hypothesis that an increase in rapeseed meal content leads to a gradual alteration of the bread’s nutritional profile.
Analysis of the data reveals that the majority of nutritional and mineral variables contribute significantly to this component, particularly polyphenols, antioxidant activity, proteins, lipids, and minerals such as calcium (Ca), manganese (Mn), iron (Fe), and zinc (Zn). Thus, Dim1 essentially represents a nutritional gradient, contrasting CB (starch-rich breads) with breads enriched with nutrients and bioactive compounds (RMWB2 and RMWB3). This observation highlights the partial substitution of wheat flour, characterized by a high starch content, with rapeseed meal, which is distinguished by a composition richer in protein, fiber, and bioactive compounds. Numerous studies have shown that adding nutrient-rich plant-based ingredients to bread dough leads to a concomitant increase in minerals and phenolic compounds in the finished products [17,25,28,76,83].
The second principal component (Dim2) explains a smaller proportion of the variance (5.1%), but it allows us to distinguish certain parameters related to bread’s physical properties. As shown in Figure 10D, the variables that contribute significantly to Dim2 are ash, the height-to-diameter ratio (H/D), potassium, protein, porosity, and carbohydrates. These variables are indicators of structural differences between breads, particularly those related to gluten network formation and crumb structure. The incorporation of ingredients rich in protein and fiber, such as rapeseed meal, can alter gluten network formation and modify the physical properties of bread, particularly crumb porosity and elasticity. These changes are frequently observed in breads enriched with oilseed byproducts or fiber-rich ingredients [40].

3.8. Hierarchical Cluster Analysis of Wheat–Rapeseed Flour Blends (WF, RM, RMW1, RMW2, RMW3) and the Corresponding Bread Samples (CB, RMWB1, RMWB2, RMWB3)

3.8.1. Hierarchical Cluster Analysis Applied to Wheat Flour (WF), Rapeseed Meal (RM), and Composite Flour Blends (RMW1, RMW2, and RMW3)

Hierarchical cluster analysis (HCA) was carried out to evaluate the overall similarities among the studied flour samples based on their nutritional, mineral, and functional properties, considered simultaneously. This multivariate technique enables the grouping of samples with comparable chemical characteristics and provides insight into the effects of wheat flour substitution with rapeseed meal on both composite flours and the corresponding breads.
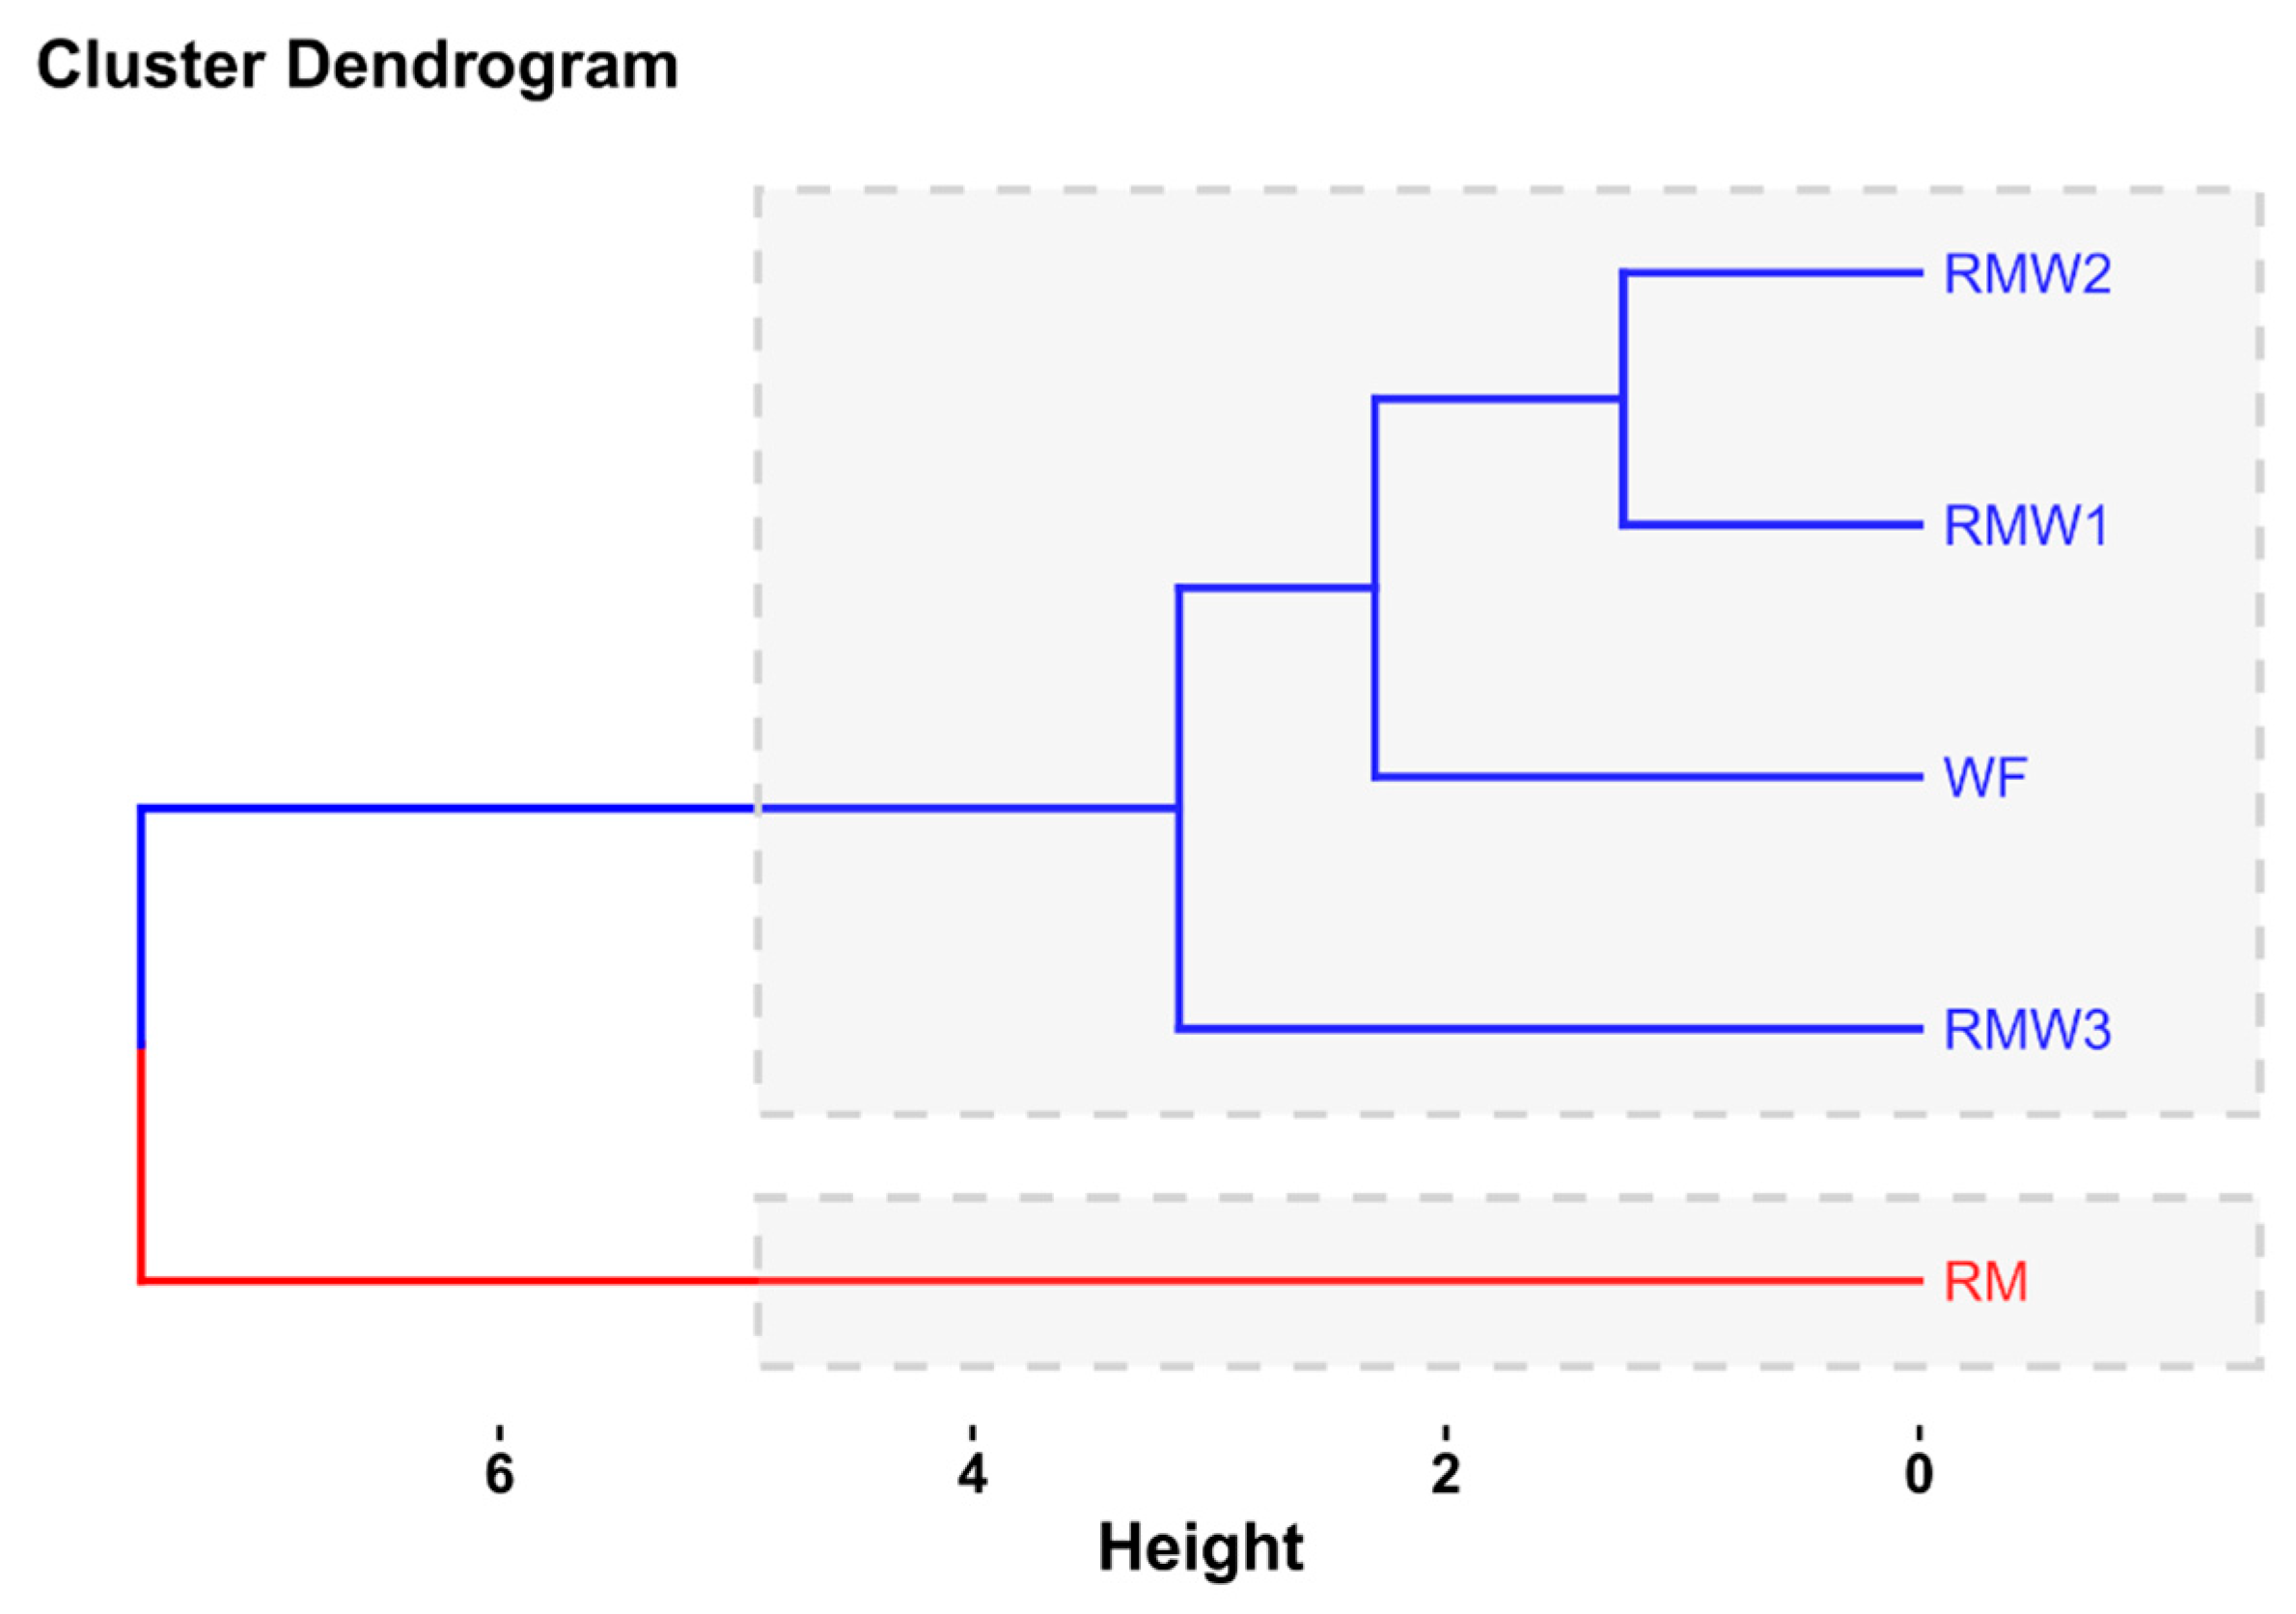
The clustering results for the flour samples are shown in Figure 11.
The dendrogram (see Figure 11) highlights the formation of two main groups: the first, labeled “Cluster 1,” includes RM (rapeseed meal); the second, “Cluster 2,” comprises wheat flours and composite flours (WF, RMW1, RMW2, and RMW3). The clear separation of rapeseed meal from the other samples confirms the previously obtained results regarding its chemical composition, which differs from that of wheat flour and composite mixtures. In fact, rapeseed meal is known for its high content of bioactive compounds. These compounds account for a large part of its antioxidant activity and help differentiate this raw material from cereal flours [44,84]. Furthermore, rapeseed meal is distinguished by its high content of plant proteins and essential minerals, making it a first-rate substitute for wheat flour, which is primarily starch [85].
In the second cluster, the flours WF, RMW1, RMW2, and RMW3 are grouped, indicating that they share a similar compositional basis linked to the predominant presence of wheat flour in their formulations. However, analysis of the cluster’s internal structure reveals a gradual organization. Indeed, RMW1 and RMW2 are very similar, suggesting similar compositions when substitution remains moderate (10–20%). WF also falls into this category, although it remains distinct from the composite flours due to the absence of rapeseed meal in its composition. RMW3 (30% RM), on the other hand, differs from the other composite flours due to a more significant alteration in its chemical profile. This distribution is indicative of the gradual effect of substitution, whereby an increase in the proportion of rapeseed meal results in a shift in the composition of the composite flour relative to that of wheat flour.

3.8.2. Hierarchical Cluster Analysis of the Control Bread (CB) and Rapeseed Meal-Enriched Bread Samples (RMWB1, RMWB2, and RMWB3)

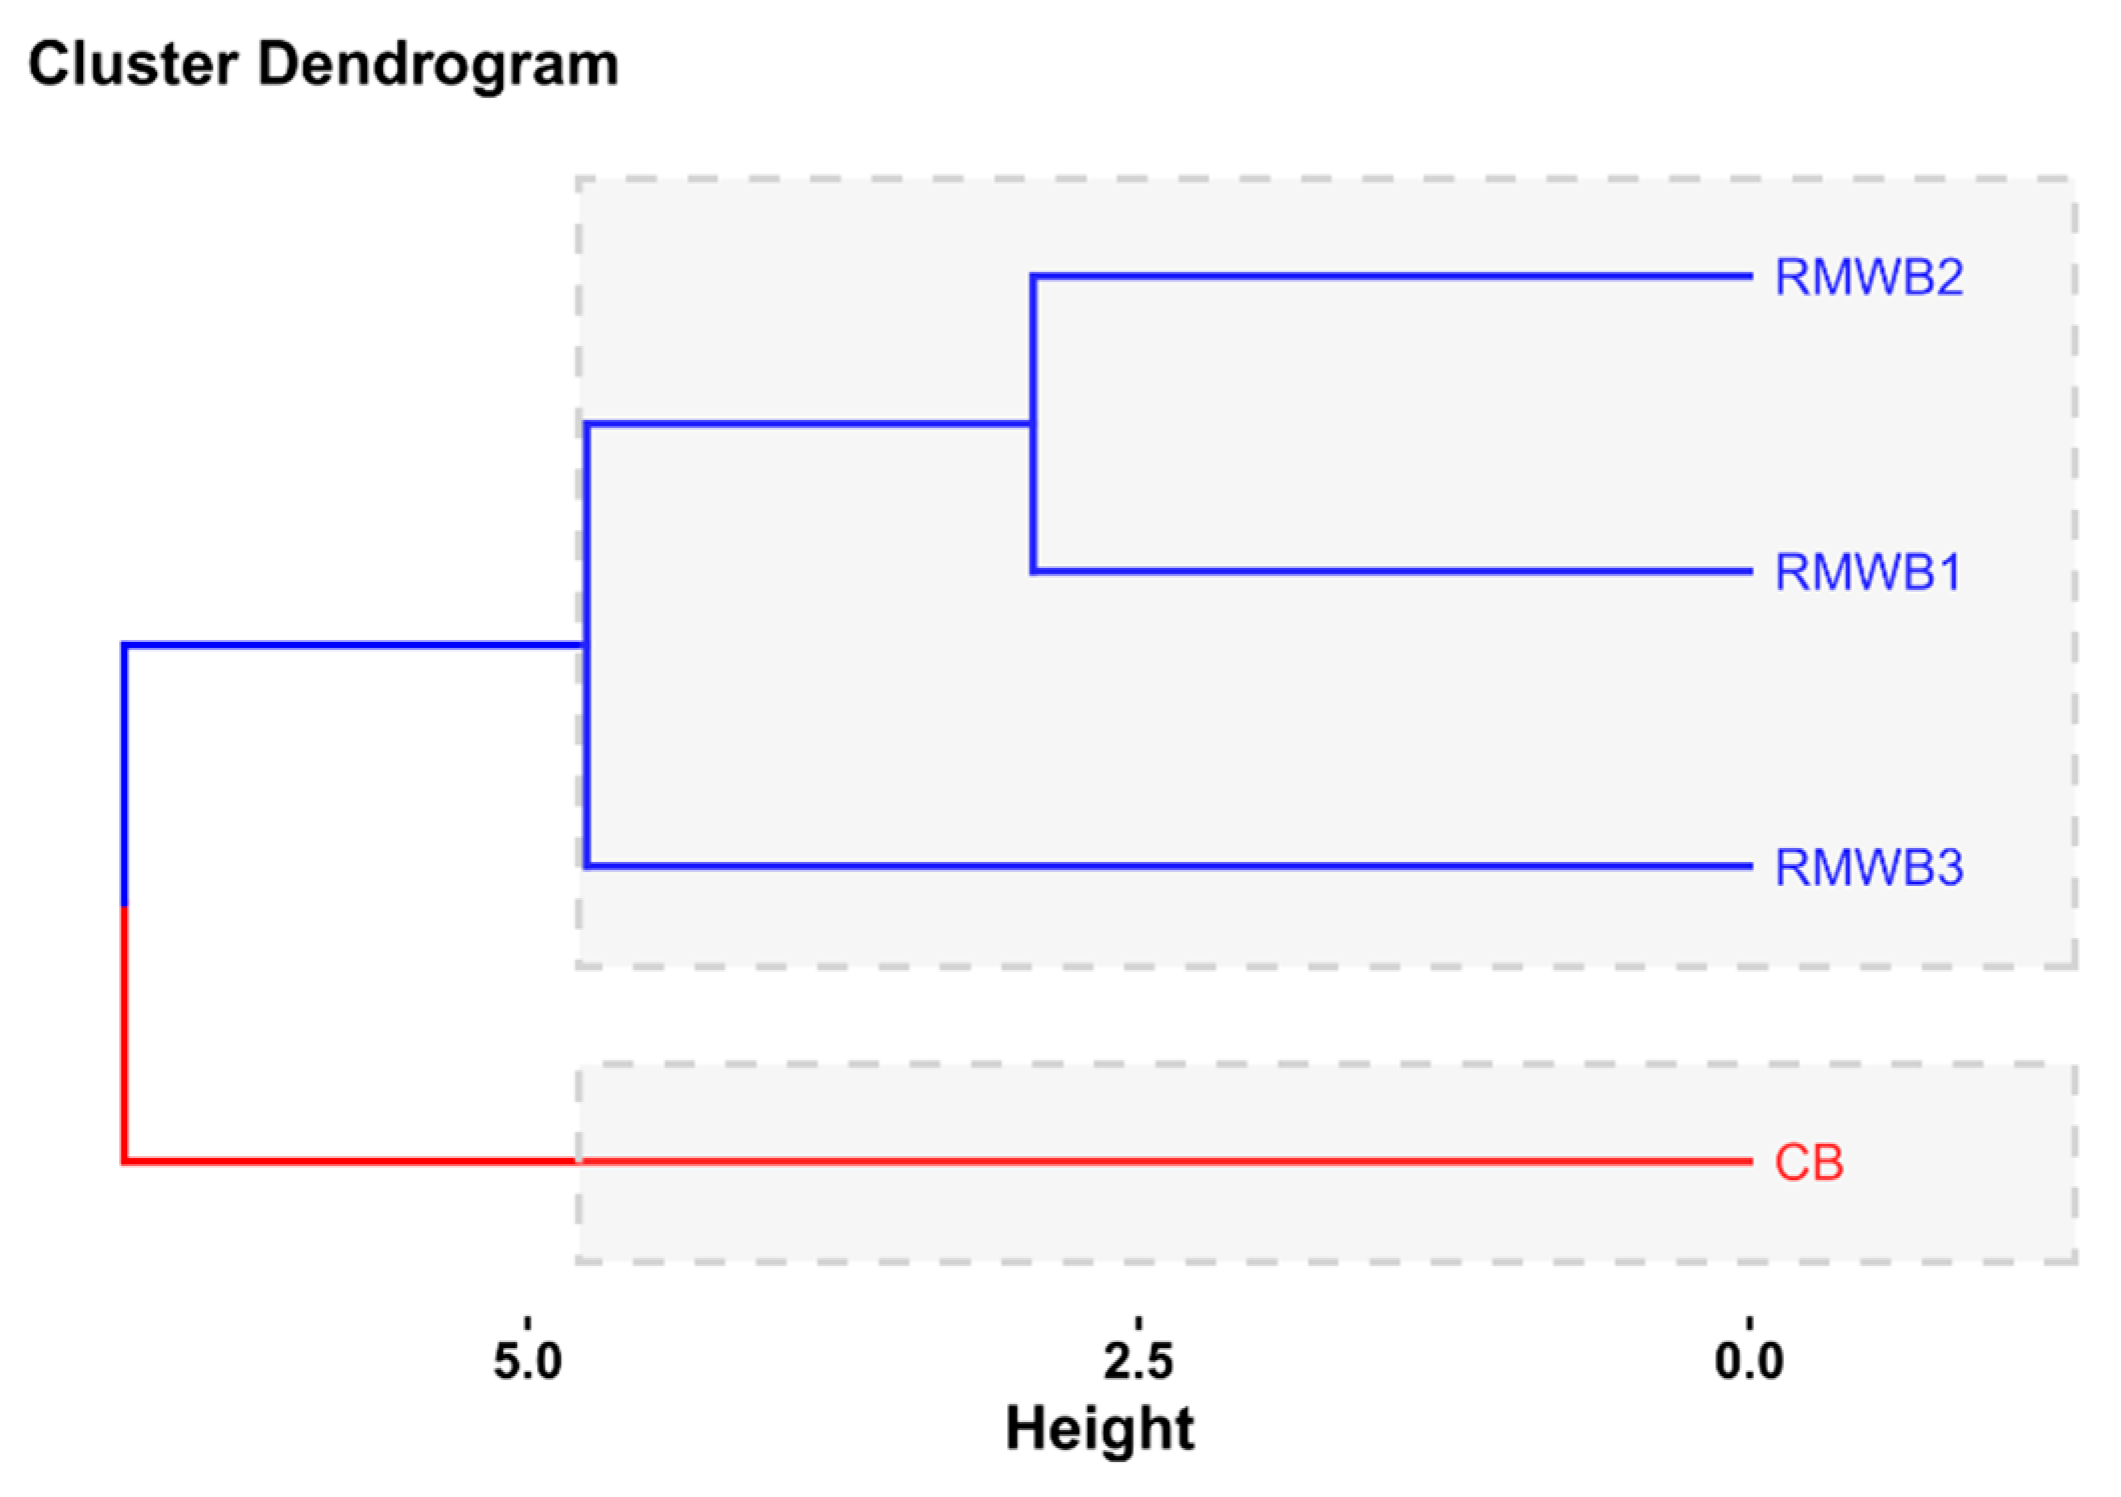
The results of the cluster analysis for the bread samples are presented in Figure 12.
The dendrogram (see Figure 12) highlights the formation of two distinct main clusters: the first, labeled “Cluster 1,” corresponds to the control bread (CB), made exclusively from wheat flour; the second, labeled “Cluster 2,” corresponds to breads enriched with rapeseed meal (RMWB1, RMWB2, and RMWB3). This clear separation suggests that incorporating rapeseed meal results in a significant change in the overall bread profile, consistent with the PCA and correlation matrix results.
Within the cluster of enriched breads, a gradual differentiation is observed: the RMWB1 bread (10% RM) is the farthest from the other enriched breads and the closest to the control bread, indicating a limited change in the overall profile. The RMWB2 (20% RM) and RMWB3 (30% RM) formulations are closely correlated, suggesting greater similarity between them. This pattern highlights a dose-dependent effect of rapeseed meal on bread characteristics. As the incorporation rate increases, the bread’s composition diverges from that of the control bread and approaches a nutrient-enriched profile. Similar observations have been reported in research on bread fortification with plant by-products. It has been found that high substitution levels induce significant changes in nutritional and technological properties [17]. Although enriched breads are classified by salt content, they also exhibit internal differences in physical properties. High substitution levels (20–30%) are associated with reduced porosity and elasticity, as well as changes in bread expansion, as measured by the H/D ratio.

3.9. Sensory Analysis of Different Types of Bread

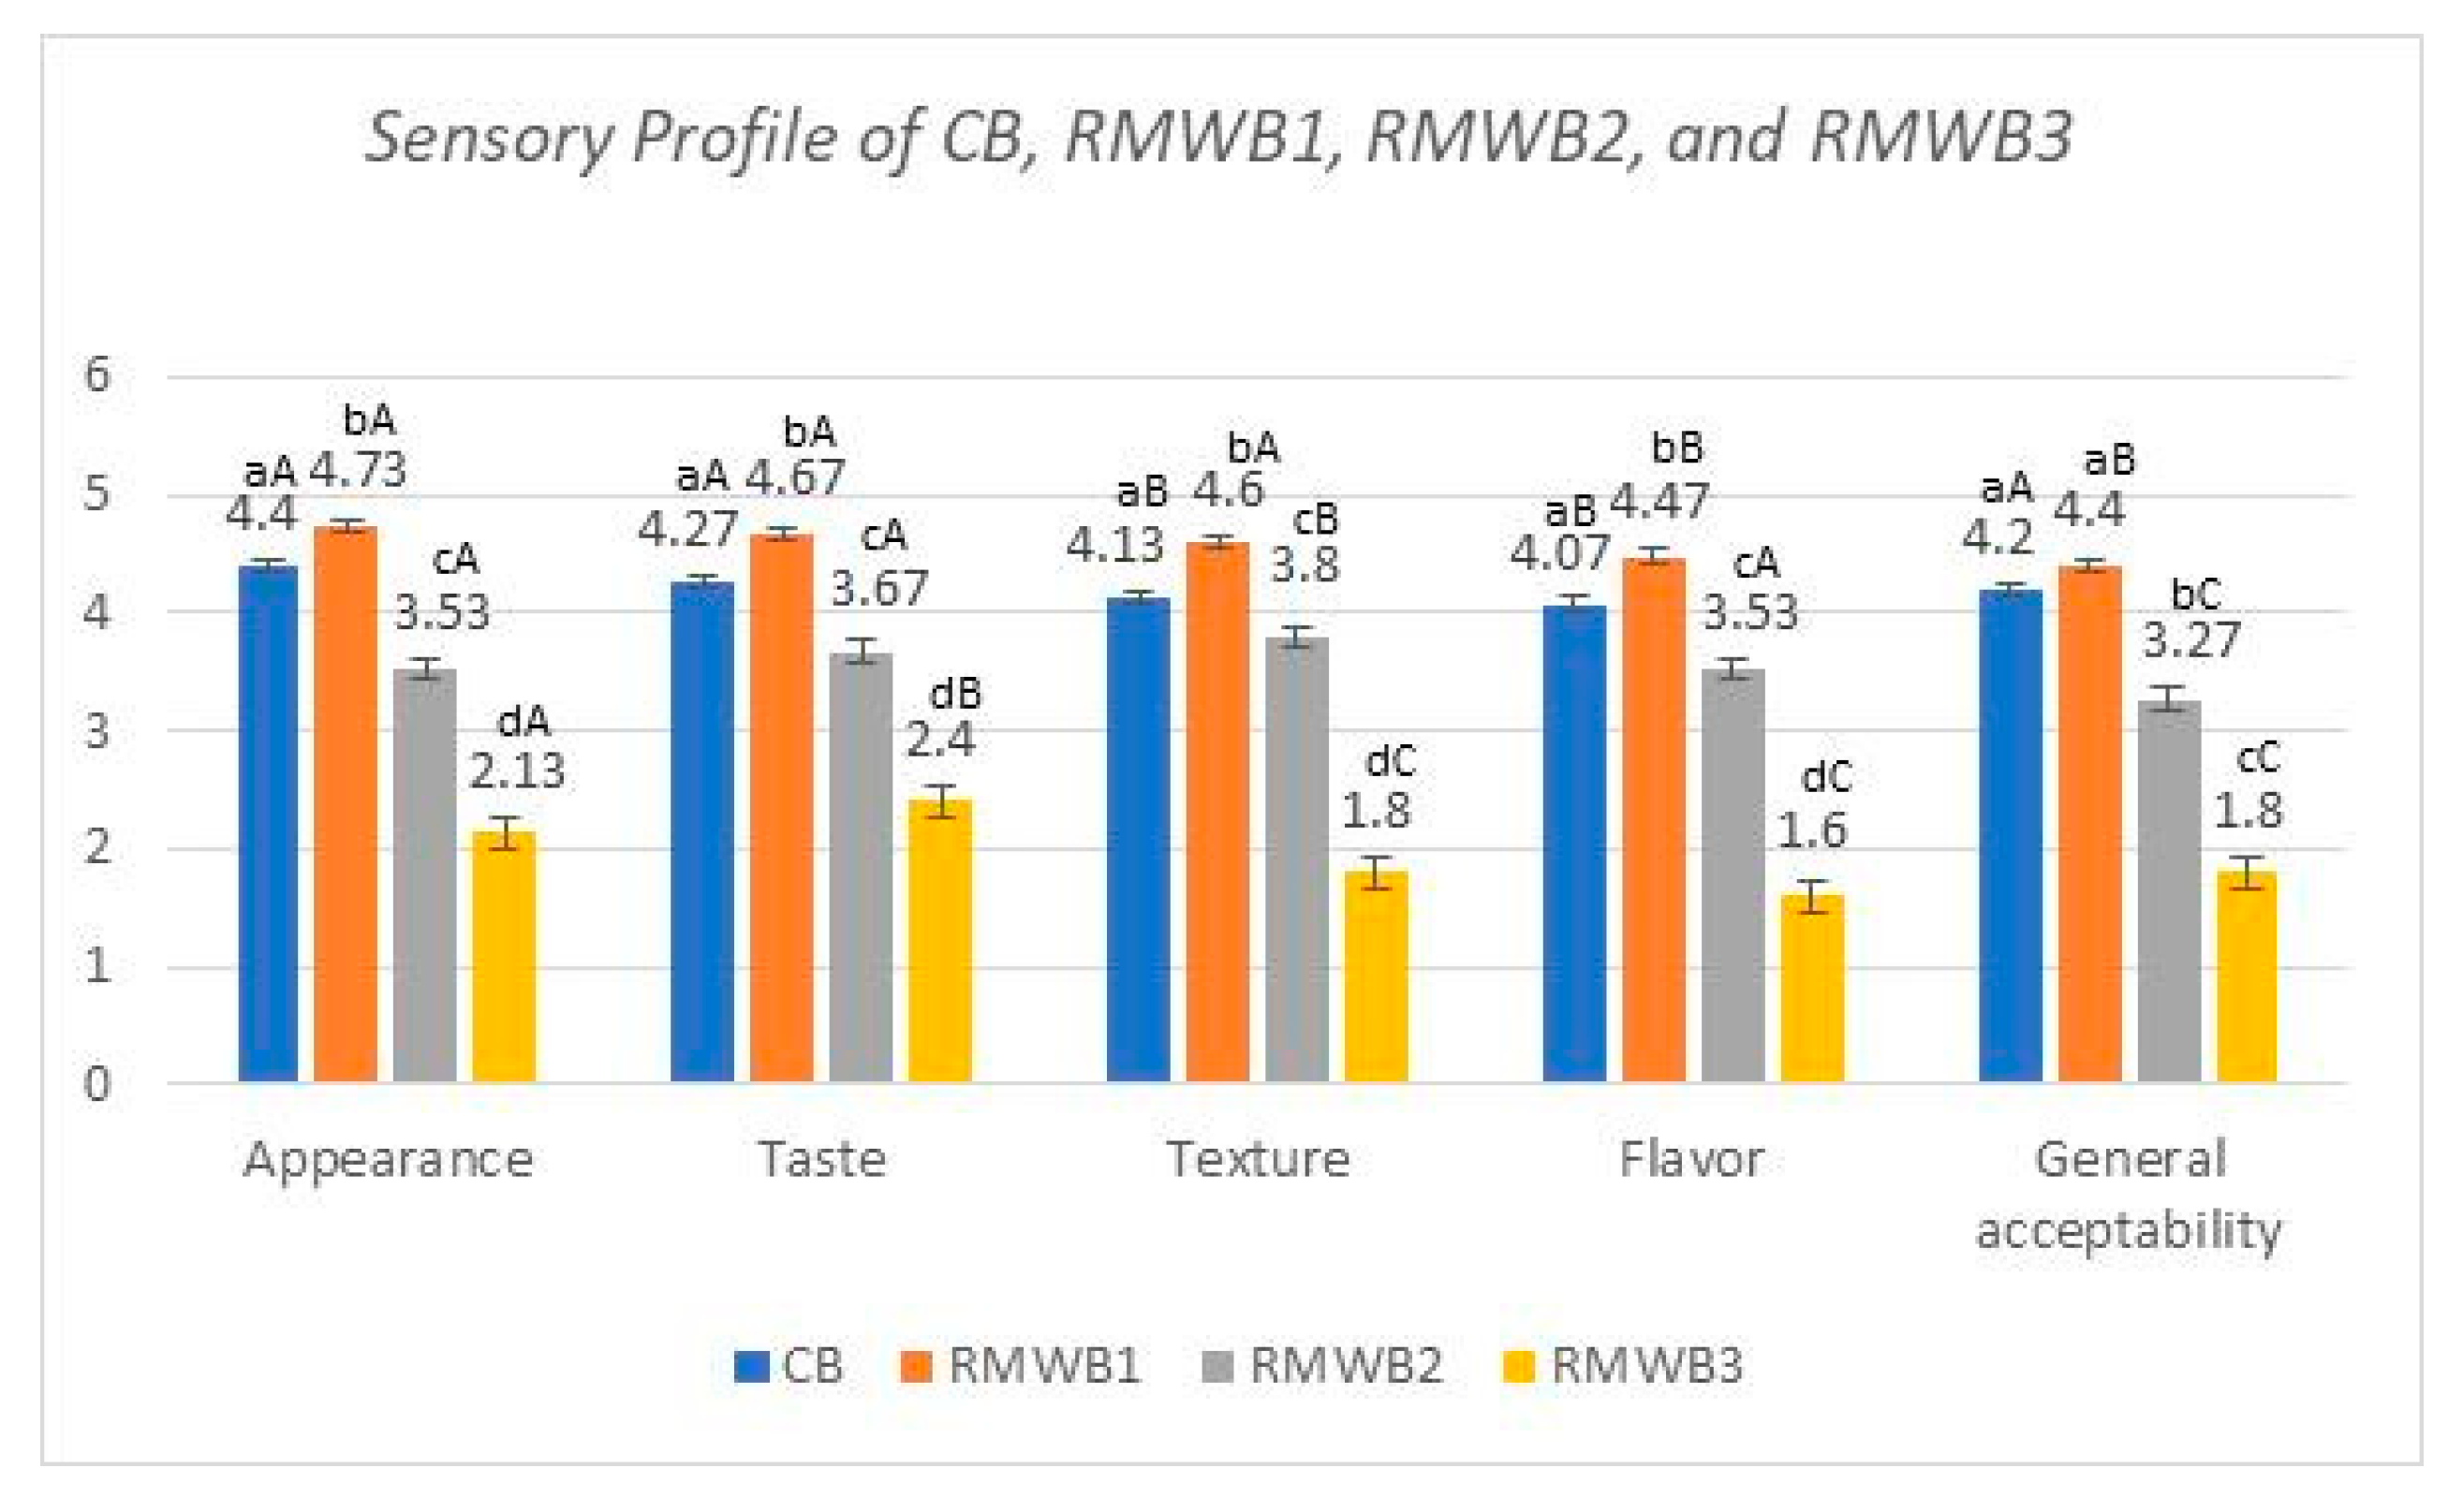
Sensory profiling serves as an important indicator of the acceptability of enriched breads, as it captures the combined impact of physicochemical, rheological, and structural modifications induced by rapeseed meal (RM) incorporation. As illustrated in Figure 13, the level of substitution significantly affects all evaluated sensory parameters, including appearance, taste, texture, aroma, and overall acceptability.
The findings of the sensory analysis demonstrate that the rate of rapeseed meal (RM) substitution exerts a significant influence on all attributes evaluated, including appearance, taste, texture, flavour, and overall acceptability. Regarding the visual aspect of the samples, a marginal enhancement was discerned in RMWB1 (4.73) in comparison with the control CB (4.40), accompanied by a subsequent decline in RMWB2 (3.53) and, more pronouncedly, in RMWB3 (2.13). This phenomenon can be attributed to a number of factors, including the darkening of the crumb, which is associated with the presence of phenolic compounds in rapeseed. It is also associated with changes in the crumb structure, specifically a reduction in porosity and the formation of pigments resulting from more intense Maillard reactions. Research findings have indicated that an analogous outcome is observed in the context of breads that have been enriched with polyphenol-rich by-products. It has been demonstrated that an escalation in the incorporation rate results in a decline in both crumb lightness and uniformity [86,87]. The results of the sensory analysis also reveal that the taste and aroma profiles follow a similar trend. A marginal enhancement was evident for RMWB1 (4.6–4.47) in comparison to CB (4.27–4.07). Furthermore, a gradual decrease was observed for RMWB2 and RMWB3. The decrease in intensity observed at high concentrations (20–30%) is primarily due to the presence of bitter phenolic compounds, particularly sinapic acid derivatives, as well as to interactions with proteins and lipids that alter aromatic perception. The present observations are consistent with the findings of several studies that indicate that residues from rapeseed processing contain compounds responsible for bitterness and astringency. These compounds limit the use of rapeseed residues at high doses in cereal products [12,88].
The texture scores for the CB, RMWB1, RMWB2, and RMWB3 breads were 4.13, 4.60, 3.80, and 1.80, respectively. The improvement observed at 10% (RMWB1) can be attributed to two main factors: increased water retention and a moderate structuring effect of rapeseed proteins. However, at higher levels (20% and 30%), the texture deteriorates significantly due to several factors: gluten dilution, fiber interference with the gluten network, and reduced gas retention capacity. These results are consistent with studies conducted on breads enriched with plant proteins or fiber, which demonstrated a deterioration in texture beyond 15–20% substitution [17,28,89]. Regarding general acceptability, the results obtained for RMWB1 (4.40) indicate an acceptability similar to that of the control (4.20). In contrast, a notable decrease is observed for RMWB2 (3.27), while RMWB3 (1.80) shows marked sensory rejection. These results suggest that, from a technological and sensory standpoint, a 10% substitution is considered acceptable. However, levels above 20% appear to significantly compromise this acceptability.
This analysis shows that incorporating rapeseed meal significantly affects bread sensory properties in a dose-dependent manner. Moderate substitution, i.e., less than 10%, is effective in maintaining or improving bread’s sensory characteristics. In contrast, high levels (i.e., greater than 20%) have been associated with significant deterioration, particularly in bitterness, texture, and bread structure.

4. Conclusions

The present study assessed the impact of replacing wheat flour with rapeseed meal (RM) at levels ranging from 0 to 30% on the nutritional, rheological, technological, physical, and sensory characteristics of composite flours and the resulting breads. The study results consistently show that increasing the incorporation rate of RM significantly improves the nutritional value of the products, particularly by increasing levels of protein, fat, polyphenols, antioxidant activity, and essential minerals. From a technological standpoint, the incorporation of RM led to increased water absorption and decreased dough stability, reflecting an alteration in the gluten network. Mixolab analyses revealed decreases in parameters associated with gluten and viscosity, as well as alterations in the starch retrogradation process. These changes affected the bread’s physical properties, notably by decreasing porosity, elasticity, and the height-to-diameter ratio. Multivariate analyses (including correlations, principal component analysis, and hierarchical clustering) confirmed the existence of a dose-dependent effect of RM, with a clear distinction between control and enriched samples. Furthermore, the research revealed positive correlations between bioactive compounds such as polyphenols, antioxidant activity, and minerals, and negative correlations with the technological and structural parameters of the bread. Sensory evaluation revealed that bread acceptability decreases as the substitution rate increases, mainly due to bitterness associated with phenolic compounds and textural degradation. Nevertheless, a 10% incorporation (RMWB1) preserves optimal sensory acceptability while providing substantial nutritional benefits.
Rapeseed meal has proven to be a suitable raw material for the development of enriched functional breads. However, its use must be optimized to maintain a balance between nutritional quality, processing properties, and sensory acceptability. Given the conditions of this study, a 10% substitution rate appears to represent the optimal compromise.
Although the present study provided comprehensive information regarding the nutritional composition, rheological behavior, and technological characteristics of the formulated breads, additional analyses such as texture profile analysis (hardness, springiness) and specific volume determination would further contribute to a more complete assessment of bread quality. Future research should explore technological treatments (enzymatic, fermentation, and additives) to increase the incorporation of rapeseed meal while preserving bread quality. Particular attention should also be paid to reducing antinutritional factors (glucosinolates, phytic acid, phenolic compounds) to improve nutrient bioavailability and sensory acceptability.

Author Contributions

All authors contributed to the study conception and design. Conceptualization and original draft preparation: S.D., C.A., A.R., and E.A.; methodology: S.D., C.A., A.R., C.N., D.S., D.L., I.R., L.S., and A.B.; formal analysis: S.D., C.A., A.R., C.N., D.L., D.S., I.R., L.S., A.B., C.J., and E.A.; review, editing, and validation: S.D., C.A., A.B., C.J., and E.A.; supervision: A.B., E.A., and C.J. All authors have read and agreed to the published version of the manuscript.

Funding

Financial support for the publication of this paper was provided by the University of Life Sciences “King Mihai I” from Timișoara, Romania.

Institutional Review Board Statement

Ethical review and approval were waived for this study due to the absence of any experimental use of live animals, as confirmed by the Bioethics Commission of the University of Life Sciences “King Mihai I” from Timisoara (No. 692/13 April 2026). The study involved only sensory evaluation by human panelists who provided written informed consent and confirmed that the tested products complied with all relevant national and European regulations.

Informed Consent Statement

Informed consent was obtained from all subjects involved in the study.

Data Availability Statement

The original data and contributions generated during this study are presented within the article. Additional information may be obtained from the corresponding authors upon reasonable request.

Acknowledgments

This article was developed within the framework of the Regele Mihai I University of Life Sciences in Timișoara, in collaboration with S.C. PROSPERO S.R.L., through the project “Research and Development Services for Healthy Bakery and Pastry Products—EIT Food RIS PSRAL—Testing Service” (No. 9812/15 November 2024). The authors employed ChatGPT-5, an artificial intelligence language model created by OpenAI (San Francisco, CA, USA), solely for linguistic editing and to enhance the clarity and readability of the manuscript. The scientific data, analyses, interpretations, and conclusions presented in this work are entirely the responsibility and original contribution of the authors.

Conflicts of Interest

Authors Lelia Serpe and Adina Brinzeu were employed by the company S.C. PROSPERO S.R.L. The remaining authors declare that the research was conducted in the absence of any commercial or financial relationships that could be construed as a potential conflict of interest.

References

  1. Berry, E.M. Sustainable Food Systems and the Mediterranean Diet. Nutrients 2019, 11, 2229. [Google Scholar] [CrossRef]
  2. Marsden, T.; Morley, A. Sustainable food systems. In Building a New Paradigm; Earthscan from Routledge: Abingdon, UK, 2014. [Google Scholar]
  3. Khedkar, R.; Singh, K. New approaches for food industry waste utilization. In Biologix; Mewar Institute of Management: Ghaziabad, India, 2015. [Google Scholar]
  4. Lai, W.T.; Khong, N.M.; Lim, S.S.; Hee, Y.Y.; Sim, B.I.; Lau, K.Y.; Lai, O.M. A review: Modified agricultural by-products for the development and fortification of food products and nutraceuticals. Trends Food Sci. Technol. 2017, 59, 148–160. [Google Scholar] [CrossRef]
  5. Exports CCE. Oilseeds: World Markets and Trade; United States Department of Agriculture: Washington, DC, USA, 2024.
  6. Negawoldes, T. Review on nutritional limitations and opportunities of using rapeseed meal and other rape seed by-products in animal feeding. J. Nutr. Health Food Eng. 2018, 8, 43–48. [Google Scholar]
  7. Patrick, C.; André, P. Rapeseed market, worldwide and in Europe. Oilseeds Fats Crops Lipids 2014, 21, D102. [Google Scholar]
  8. Wongsirichot, P.; Gonzalez-Miquel, M.; Winterburn, J. Recent advances in rapeseed meal as alternative feedstock for industrial biotechnology. Biochem. Eng. J. 2022, 180, 108373. [Google Scholar] [CrossRef]
  9. Ciurescu, G. Efficiency of soybean meal replacement by rapeseed meal and/or canola seeds in commercial layer diets. Arch. Zootech. 2009, 12, 27–33. [Google Scholar]
  10. Swati, S.; Sneha Sehwag, S.S.; Madhusweta Das, M.D. A brief overview: Present status on utilization of mustard oil and cake. Indian J. Tradit. Knowl. 2015, 14, 244–250. [Google Scholar]
  11. Taraz, Z.; Jalali, S.; Rafeie, F. Effects of replacement of soybean meal with rapeseed meal on organs weight, some blood biochemical parameters and performance of broiler chicks. Int. J. Poult. Sci. 2006, 5, 1110–1115. [Google Scholar] [CrossRef]
  12. Wanasundara, J.P. Proteins of Brassicaceae oilseeds and their potential as a plant protein source. Crit. Rev. Food Sci. Nutr. 2011, 51, 635–677. [Google Scholar] [CrossRef]
  13. Thanaseelaan, V. Proximate Analysis, Mineral and amino acid profiles of De–oiled rapeseed meal. Int. J. Food Agric. Vet. Sci. 2013, 3, 66–69. [Google Scholar]
  14. Hao, Y.; Wang, Z.; Zou, Y.; He, R.; Ju, X.; Yuan, J. Effect of static-state fermentation on volatile composition in rapeseed meal. J. Sci. Food Agric. 2020, 100, 2145–2152. [Google Scholar] [CrossRef]
  15. Manyeula, F.; Mlambo, V.; Marume, U.; Sebola, N.A. Nutrient digestibility, haemo-biochemical parameters and growth performance of an indigenous chicken strain fed canola meal–containing diets. Trop. Anim. Health Prod. 2019, 51, 2343–2350. [Google Scholar] [CrossRef] [PubMed]
  16. Zhu, L.; Wang, J.; Ding, X.; Bai, S.; Zeng, Q.; Su, Z.; Xuan, Y.; Zhang, K. Effects of dietary rapeseed meal on laying performance, egg quality, apparent metabolic energy, and nutrient digestibility in laying hens. Livest. Sci. 2018, 214, 265–271. [Google Scholar] [CrossRef]
  17. Dossa, S.; Rinovetz, A.; Neagu, C.; Stoin, D.; Lalescu, D.; Jianu, C.; Radulov, I.; Serpe, L.; Brinzeu, A.; Alexa, E. Impact of Sunflower (Helianthus annuus) Seed Meal Use on the Nutritional, Phytochemical, Rheological, Physicochemical, and Sensory Quality of Wheat Bread. Appl. Sci. 2026, 16, 461. [Google Scholar] [CrossRef]
  18. Dung, N.C.; Thuy, N.M.; Giau, T.N.; Van Hao, H.; Van Thanh, N.; Minh, V.Q.; Van Tai, N. Evaluation of quality characteristics, antioxidant activity, functional groups of sweet potato by-products and their usage in sandwich bread processing. Food Chem. X 2026, 35, 103731. [Google Scholar] [CrossRef] [PubMed]
  19. Öğünç, Y.T.; Aytekin, Ö.; Rakıcıoğlu, N. Enhancing the nutritional profile of refined wheat bread with cereal and pulse flours: Assessment of phytate content and mineral bioaccessibility. Eur. Food Res. Technol. 2026, 252, 44. [Google Scholar] [CrossRef]
  20. Gomez, M.; Oliete, B.; Caballero, P.; Ronda, F.; Blanco, C. Effect of nut paste enrichment on wheat dough rheology and bread volume. Food Sci. Technol. Int. 2008, 14, 57–65. [Google Scholar] [CrossRef]
  21. Rosell, C.M.; Rojas, J.A.; De Barber, C.B. Influence of hydrocolloids on dough rheology and bread quality. Food Hydrocoll. 2001, 15, 75–81. [Google Scholar] [CrossRef]
  22. European Commission. Farm to Fork Strategy: For a Fair, Healthy and Environmentally-Friendly Food System; Communication from the Commission to the European Parliament, the Council, the European Economic and Social Committee and the Committee of the Regions; European Commission: Brussels, Belgium, 2020; Volume 381, pp. 1–9. [Google Scholar]
  23. European Union. 2014/424/EU: Commission implementing decision of 1 July 2014 authorizing the placing on the market of rapeseed protein as a novel food ingredient under regulation (EC) No 258/97 of the European Parliament and of the Council. Off. J. Eur. Union 2014, 196, 27–29. [Google Scholar]
  24. Handbook Mixolab Application. Rheological and Enzymatic Analysis; Chopin Applications Laboratory: Paris, France, 2009.
  25. Plustea, L.; Negrea, M.; Cocan, I.; Radulov, I.; Tulcan, C.; Berbecea, A.; Popescu, I.; Obistioiu, D.; Hotea, I.; Suster, G. Lupin (Lupinus spp.)-fortified bread: A sustainable, nutritionally, functionally, and technologically valuable solution for bakery. Foods 2022, 11, 2067. [Google Scholar] [CrossRef]
  26. ISO 2171/2007; Cereals, Pulses and By-Products—Determination of Ash Yield by Incineration. International Organization for Standardization: Geneva, Switzerland, 2007.
  27. Horwitz, W.; Latimer, G.W. Official Methods of Analysis of AOAC International; AOAC international: Gaithersburg, MD, USA, 2000. [Google Scholar]
  28. Dossa, S.; Negrea, M.; Cocan, I.; Berbecea, A.; Obistioiu, D.; Dragomir, C.; Alexa, E.; Rivis, A. Nutritional, Physico-Chemical, Phytochemical, and Rheological Characteristics of Composite Flour Substituted by Baobab Pulp Flour (Adansonia digitata L.) for Bread Making. Foods 2023, 12, 2697. [Google Scholar] [CrossRef] [PubMed]
  29. Danciu, C.; Muntean, D.; Alexa, E.; Farcas, C.; Oprean, C.; Zupko, I.; Bor, A.; Minda, D.; Proks, M.; Buda, V. Phytochemical characterization and evaluation of the antimicrobial, antiproliferative and pro-apoptotic potential of Ephedra alata Decne. Hydroalcoholic extract against the MCF-7 breast cancer cell line. Molecules 2018, 24, 13. [Google Scholar] [CrossRef] [PubMed]
  30. Obistioiu, D.; Cocan, I.; Tîrziu, E.; Herman, V.; Negrea, M.; Cucerzan, A.; Neacsu, A.-G.; Cozma, A.L.; Nichita, I.; Hulea, A. Phytochemical profile and microbiological activity of some plants belonging to the Fabaceae family. Antibiotics 2021, 10, 662. [Google Scholar] [CrossRef] [PubMed]
  31. Ciulca, S.; Roma, G.; Alexa, E.; Radulov, I.; Cocan, I.; Madosa, E.; Ciulca, A. Variation of polyphenol content and antioxidant activity in some bilberry (Vaccinium myrtillus L.) populations from Romania. Agronomy 2021, 11, 2557. [Google Scholar] [CrossRef]
  32. SR 91:2007; Romanian Standard for Bread, Confectionery and Bakery Specialties—Methods of Analysis. ASRO—Romanian Standards Association: Bucharest, Romania, 2007.
  33. ISO 6658:2017; Sensory Analysis—Methodology—Overall Guidelines. ISO: Geneva, Switzerland, 2017.
  34. Grasso, S.; Liu, S.; Methven, L. Quality of muffins enriched with upcycled defatted sunflower seed flour. LWT 2020, 119, 108893. [Google Scholar] [CrossRef]
  35. Grasso, S.; Omoarukhe, E.; Wen, X.; Papoutsis, K.; Methven, L. The use of upcycled defatted sunflower seed flour as a functional ingredient in biscuits. Foods 2019, 8, 305. [Google Scholar] [CrossRef]
  36. Grasso, S.; Pintado, T.; Pérez-Jiménez, J.; Ruiz-Capillas, C.; Herrero, A.M. Potential of a sunflower seed by-product as animal fat replacer in healthier frankfurters. Foods 2020, 9, 445. [Google Scholar] [CrossRef]
  37. Grasso, S.; Pintado, T.; Pérez-Jiménez, J.; Ruiz-Capillas, C.; Herrero, A.M. Characterisation of muffins with upcycled sunflower flour. Foods 2021, 10, 426. [Google Scholar] [CrossRef]
  38. Fetzer, A.; Müller, K.; Schmid, M.; Eisner, P. Rapeseed proteins for technical applications: Processing, isolation, modification and functional properties—A review. Ind. Crops Prod. 2020, 158, 112986. [Google Scholar] [CrossRef]
  39. Wang, Y.; Rosa-Sibakov, N.; Edelmann, M.; Sozer, N.; Katina, K.; Coda, R. Enhancing the utilization of rapeseed protein ingredients in bread making by tailored lactic acid fermentation. Food Biosci. 2022, 50, 102028. [Google Scholar] [CrossRef]
  40. De Lamo, B.; Gómez, M. Bread enrichment with oilseeds. A review. Foods 2018, 7, 191. [Google Scholar] [CrossRef]
  41. Di Nunzio, M.; Picone, G.; Pasini, F.; Chiarello, E.; Caboni, M.F.; Capozzi, F.; Gianotti, A.; Bordoni, A. Olive oil by-product as functional ingredient in bakery products. Influence of processing and evaluation of biological effects. Food Res. Int. 2020, 131, 108940. [Google Scholar] [CrossRef] [PubMed]
  42. Korus, J.; Chmielewska, A.; Witczak, M.; Ziobro, R.; Juszczak, L. Rapeseed protein as a novel ingredient of gluten-free bread. Eur. Food Res. Technol. 2021, 247, 2015–2025. [Google Scholar] [CrossRef]
  43. Petraru, A.; Amariei, S. Rapeseed-An Important Oleaginous Plant in the Oil Industry and the Resulting Meal a Valuable Source of Bioactive Compounds. Plants 2024, 13, 3085. [Google Scholar] [CrossRef] [PubMed] [PubMed Central]
  44. Di Lena, G.; Sanchez del Pulgar, J.; Lucarini, M.; Durazzo, A.; Ondrejíčková, P.; Oancea, F.; Frincu, R.-M.; Aguzzi, A.; Ferrari Nicoli, S.; Casini, I.; et al. Valorization Potentials of Rapeseed Meal in a Biorefinery Perspective: Focus on Nutritional and Bioactive Components. Molecules 2021, 26, 6787. [Google Scholar] [CrossRef]
  45. Czech, A.; Woś, K.; Pachciński, K.; Muszyński, S.; Świetlicki, M.; Tomaszewska, E. Fermented Rapeseed Meal as a Dietary Intervention to Improve Mineral Utilization and Bone Health in Weaned Piglets. Animals 2024, 14, 2727. [Google Scholar] [CrossRef] [PubMed]
  46. Qureshi, G.; Memon, S.A.; Memon, A.B.; Ghouri, R.A.; Memon, J.M.; Parvez, S.H. The emerging role of iron, zinc, copper, magnesium and selenium and oxidative stress in health and diseases. Biog. Amines 2005, 19, 147–169. [Google Scholar] [CrossRef]
  47. Guzmán, D.C.; Brizuela, N.O.; Herrera, M.O.; Peraza, A.V.; Garcia, E.H.; Mejía, G.B.; Olguin, H.J. Assessment of the roles of magnesium and zinc in clinical disorders. Curr. Neurovasc. Res. 2023, 20, 505–513. [Google Scholar] [CrossRef]
  48. Zoroddu, M.A.; Aaseth, J.; Crisponi, G.; Medici, S.; Peana, M.; Nurchi, V.M. The essential metals for humans: A brief overview. J. Inorg. Biochem. 2019, 195, 120–129. [Google Scholar] [CrossRef]
  49. Multescu, M.; Marinas, I.C.; Susman, I.E.; Belc, N. Byproducts (Flour, Meals, and Groats) from the Vegetable Oil Industry as a Potential Source of Antioxidants. Foods 2022, 11, 253. [Google Scholar] [CrossRef]
  50. Vuorela, S.; Meyer, A.S.; Heinonen, M. Impact of isolation method on the antioxidant activity of rapeseed meal phenolics. J. Agric. Food Chem. 2004, 52, 8202–8207. [Google Scholar] [CrossRef] [PubMed]
  51. Oskoueian, E.; Abdullah, N.; Hendra, R.; Karimi, E. Bioactive compounds, antioxidant, xanthine oxidase inhibitory, tyrosinase inhibitory and anti-inflammatory activities of selected agro-industrial by-products. Int. J. Mol. Sci. 2011, 12, 8610–8625. [Google Scholar] [CrossRef] [PubMed] [PubMed Central]
  52. Alfeo, V.; Bravi, E.; Ceccaroni, D.; Sileoni, V.; Perretti, G.; Marconi, O. Effect of baking time and temperature on nutrients and phenolic compounds content of fresh sprouts breadlike product. Foods 2020, 9, 1447. [Google Scholar] [CrossRef]
  53. Abdel-Aal, E.-S.M.; Rabalski, I. Effect of baking on free and bound phenolic acids in wholegrain bakery products. J. Cereal Sci. 2013, 57, 312–318. [Google Scholar] [CrossRef]
  54. Bolchini, S.; Larcher, R.; Morozova, K.; Scampicchio, M.; Nardin, T. Screening of Antioxidant Maillard Reaction Products Using HPLC-HRMS and Study of Reaction Conditions for Their Production as Food Preservatives. Molecules 2024, 29, 4820. [Google Scholar] [CrossRef] [PubMed] [PubMed Central]
  55. Nooshkam, M.; Varidi, M.; Bashash, M. The Maillard reaction products as food-born antioxidant and antibrowning agents in model and real food systems. Food Chem. 2019, 275, 644–660. [Google Scholar] [CrossRef]
  56. Liu, L.; Yin, J.; Richards, M.P. Role of Maillard reaction products as antioxidants in washed cod and washed turkey muscle oxidized by added hemoglobin. Eur. J. Lipid Sci. Technol. 2022, 124, 2100204. [Google Scholar] [CrossRef]
  57. El Hosry, L.; Elias, V.; Chamoun, V.; Halawi, M.; Cayot, P.; Nehme, A.; Bou-Maroun, E. Maillard Reaction: Mechanism, Influencing Parameters, Advantages, Disadvantages, and Food Industrial Applications: A Review. Foods 2025, 14, 1881. [Google Scholar] [CrossRef] [PubMed] [PubMed Central]
  58. Mustafa, S.; Al-Aoh, H.; Omer, N.; Jame, R.; Althaqafy, A.D.; Al-Duais, M.A.; Ajmal, M.R.; Ismaili, H. Dietary Polyphenols in Human Health: A Novel Critical Review of Benefits and Possible Risks. J. Pure Appl. Microbiol. 2026, 20, 33–52. [Google Scholar] [CrossRef]
  59. Cory, H.; Passarelli, S.; Szeto, J.; Tamez, M.; Mattei, J. The role of polyphenols in human health and food systems: A mini-review. Front. Nutr. 2018, 5, 370438. [Google Scholar] [CrossRef] [PubMed]
  60. Kim, H.R.; Kim, M.R.; Ryu, A.R.; Bae, J.E.; Choi, Y.S.; Lee, G.B.; Choi, H.D.; Hong, J.S. Comparison of rheological properties between Mixolab-driven dough and bread-making dough under various salt levels. Food Sci. Biotechnol. 2023, 32, 193–202. [Google Scholar] [CrossRef] [PubMed] [PubMed Central]
  61. Stamatie, G.D.; Duță, D.E.; Culețu, A.; Susman, I.E.; Schimbator, M.; Israel-Roming, F. The Influence of Plant Proteins (From Pleurotus, Pea, Corn, Soy, Oat, Hemp and Sea Buckthorn) Addition on Wheat Dough Rheology; Academic Press Publishing House: Amsterdam, The Netherlands, 2021. [Google Scholar]
  62. Singh, N.; Gujral, H.S.; Katyal, M.; Sharma, B. Relationship of Mixolab characteristics with protein, pasting, dynamic and empirical rheological characteristics of flours from Indian wheat varieties with diverse grain hardness. J. Food Sci. Technol. 2019, 56, 2679–2686. [Google Scholar] [CrossRef] [PubMed] [PubMed Central]
  63. Mironeasa, S.; Codină, G.G. Dough Rheological Behavior and Microstructure Characterization of Composite Dough with Wheat and Tomato Seed Flours. Foods 2019, 8, 626. [Google Scholar] [CrossRef] [PubMed]
  64. Büyük, F.; Sayaslan, A.; Gökmen, S.; Şahin, N.; Yetim, H. Effects of different flour blends with varying protein content and quality on dough and crust properties of “etliekmek”, a pizza-like traditional food of Turkey. J. Food Sci. Technol. 2020, 57, 1032–1040. [Google Scholar] [CrossRef] [PubMed] [PubMed Central]
  65. Banu, I.; Aprodu, I. Association of physicochemical with technological properties of wheat. Int. J. Food Sci. Technol. 2015, 50, 1644–1650. [Google Scholar] [CrossRef]
  66. Dapčević Hadnađev, T.; Pojić, M.; Hadnađev, M.; Torbica, A. The Role of Empirical Rheology in Flour Quality Control. In Wide Spectra of Quality Control; Akyar, I., Ed.; IntechOpen: London, UK, 2011. [Google Scholar]
  67. Dubat, A. Mixolab: A New Approach to Rheology; Academic Press: Amsterdam, The Netherlands, 2016. [Google Scholar]
  68. Korus, A.; Witczak, M.; Korus, J.; Juszczak, L. Dough Rheological Properties and Characteristics of Wheat Bread with the Addition of Lyophilized Kale (Brassica oleracea L. var. sabellica) Powder. Appl. Sci. 2023, 13, 29. [Google Scholar] [CrossRef]
  69. Manthey, F. Effect of flaxseed flour on rheological properties of wheat flour dough and on bread characteristics. J. Food Res. 2014, 3, 83–91. [Google Scholar] [CrossRef]
  70. Adamczyk, G.; Posadzka, Z.; Witczak, T.; Witczak, M. Comparison of the Rheological Behavior of Fortified Rye–Wheat Dough with Buckwheat, Beetroot and Flax Fiber Powders and Their Effect on the Final Product. Foods 2023, 12, 559. [Google Scholar] [CrossRef]
  71. Sapirstein, H.; Wu, Y.; Koksel, F.; Graf, R. A study of factors influencing the water absorption capacity of Canadian hard red winter wheat flour. J. Cereal Sci. 2018, 81, 52–59. [Google Scholar] [CrossRef]
  72. Ahmed, J.; Almusallam, A.S.; Al-Salman, F.; AbdulRahman, M.H.; Al-Salem, E. Rheological properties of water insoluble date fiber incorporated wheat flour dough. LWT Food Sci. Technol. 2013, 51, 409–416. [Google Scholar] [CrossRef]
  73. Mashayekh, M.; Mahmoodi, M.R.; Entezari, M.H. Effect of fortification of defatted soy flour on sensory and rheological properties of wheat bread. Int. J. Food Sci. Technol. 2008, 43, 1693–1698. [Google Scholar] [CrossRef]
  74. Zaki, H.; Hussien, A. Chemical, rheological and sensory properties of wheat-oat flour composite cakes and biscuits. J. Product. Dev. 2018, 23, 287–306. [Google Scholar]
  75. Menon, L.; Majumdar, S.D.; Ravi, U. Development and analysis of composite flour bread. J. Food Sci. Technol. 2015, 52, 4156–4165. [Google Scholar] [CrossRef] [PubMed] [PubMed Central]
  76. Pop, I.-A.; Dossa, S.; Stoin, D.; Neagu, C.; Moigradean, D.; Alexa, E.; Poiana, M.-A. Nutritional, Rheological, and Functional Assessment in the Development of Bread Using Chestnut and Rosehip-Fortified Wheat Flour. Foods 2025, 14, 3343. [Google Scholar] [CrossRef]
  77. Bodor, K.; Szilágyi, J.; Incze, J.; Ungvári, B.; Bodor, Z. Examination of the physico-chemical parameters of some romanian breads. Appl. Food Res. 2025, 5, 100744. [Google Scholar] [CrossRef]
  78. Szydłowska-Czerniak, A.; Amarowicz, R.; Szłyk, E. Antioxidant capacity of rapeseed meal and rapeseed oils enriched with meal extract. Eur. J. Lipid Sci. Technol. 2010, 112, 750–760. [Google Scholar] [CrossRef]
  79. Sakač, M.; Marić, A.; Đermanović, B.; Tomić, D.; Dragojlović, D.; Šarić, B.; Jovanov, P. Characterisation of fibre-rich ingredients obtained from defatted cold-pressed rapeseed cake after protein extraction. LWT 2025, 222, 117671. [Google Scholar] [CrossRef]
  80. Li, Y.; Duan, M.; Liu, G.; Liang, L.; Liu, X.; Zhang, J.; Wen, C.; Xu, X. Effect of Sinapine on Microstructure and Anti-Digestion Properties of Dual-Protein-Based Hydrogels. Foods 2024, 13, 3237. [Google Scholar] [CrossRef] [PubMed] [PubMed Central]
  81. Grané, A.; Jach, A. Applications of principal component analysis (PCA) in food science and technology. Math. Stat. Methods Food Sci. Technol. 2014, 13, 57–86. [Google Scholar]
  82. Granato, D.; Santos, J.S.; Escher, G.B.; Ferreira, B.L.; Maggio, R.M. Use of principal component analysis (PCA) and hierarchical cluster analysis (HCA) for multivariate association between bioactive compounds and functional properties in foods: A critical perspective. Trends Food Sci. Technol. 2018, 72, 83–90. [Google Scholar] [CrossRef]
  83. Purkiewicz, A.; Gul, F.H.; Pietrzak-Fiećko, R. The Utilization of Vegetable Powders for Bread Enrichment—The Effect on the Content of Selected Minerals, Total Phenolic and Flavonoid Content, and the Coverage of Daily Requirements in the Human Diet. Appl. Sci. 2024, 14, 10022. [Google Scholar] [CrossRef]
  84. Wongsirichot, P.; Gonzalez-Miquel, M.; Winterburn, J. Rapeseed meal biorefining: Fractionation, valorization and integration approaches. Biocatal. Agric. Biotechnol. 2024, 62, 103460. [Google Scholar] [CrossRef]
  85. Kreps, F.; Vrbiková, L.; Schmidt, Š. Industrial rapeseed and sunflower meal as source of antioxidants. Int. J. Eng. Res. Appl. 2014, 4, 45–54. [Google Scholar]
  86. Boukid, F.; Carini, E.; Curti, E.; Bardini, G.; Pizzigalli, E.; Vittadini, E. Effectiveness of vital gluten and transglutaminase in the improvement of physico-chemical properties of fresh bread. LWT 2018, 92, 465–470. [Google Scholar] [CrossRef]
  87. Cozma, B.; Dossa, S.; Cozma, A.; Stoin, D.; Lalescu, D.; Radulov, I.; Imbrea, I.; Pop, G.; Crista, L.; Suba, M.; et al. Integrated Nutritional, Spectroscopic and Technological Evaluation of Black Oat (Avena strigosa) and White Oat (Avena sativa L.) Cultivars. Molecules 2026, 31, 639. [Google Scholar] [CrossRef] [PubMed]
  88. Khattab, R.; Arntfield, S. Functional properties of raw and processed canola meal. LWT Food Sci. Technol. 2009, 42, 1119–1124. [Google Scholar] [CrossRef]
  89. Rosell, C.; Garzón, R.; Altamirano-Fortoul, R. Microstructure analysis tools to support bread research. In Proceedings of the 7th International Congress Flour-Bread ′13 and 9th Croatian Congress of Cereal Technologists, Opatija, Croatia, 16–18 October 2013; Josip Juraj Strossmayer University: Osijek, Croatia, 2014. [Google Scholar]
Figure 1. Flowchart for bread technology (CB, RMWB1, RMWB2, and RMWB3).
Sustainability 18 05441 g001
Figure 2. MIXOLAB rheological profiles of WF type 650, RMW1, RMW2, and RMW3. Red line—MIXOLAB temperature (°C), pink line—dough temperature (°C), green line—MIXOLAB curve.
Sustainability 18 05441 g002
Figure 3. Torque indices (N·m) for flour samples.
Sustainability 18 05441 g003
Figure 4. MIXOLAB Profiler index of WF, RMW1, RMW2, and RMW3. The profile of partially substituted wheat flours (blue line), the profile of optimal MIXOLAB parameters for bread-making technology (green line).
Sustainability 18 05441 g004
Figure 5. Dough stability time of WF, RMW1, RMW2, and RMW3. The mean of all measurements is expressed, as well as the standard deviation, which represents the extent of variation. The data sharing different letters in the same row are significantly different (p < 0.05) according to Duncan’s test.
Sustainability 18 05441 g005
Figure 6. Water absorption behavior of type 650 wheat flour with partial substitution by rapeseed meal. WF, RMW1, RMW2, and RMW3 denote 0%, 10%, 20%, and 30% replacement levels, respectively.
Sustainability 18 05441 g006
Figure 7. Correlation analysis of compositional and bioactive parameters in various flour samples. (red color indicates negative correlations, and blue color indicates positive correlations).
Sustainability 18 05441 g007
Figure 8. Correlation analysis of nutritional attributes, mineral composition, antioxidant capacity, and physical characteristics of formulated breads. (red color indicates negative correlations, and blue color indicates positive correlations).
Sustainability 18 05441 g008
Figure 9. Principal component analysis of the flour formulations, comprising the scree plot (A), PCA biplot (B), and the contribution of variables to the first (C) and second (D) principal components.
Sustainability 18 05441 g009
Figure 10. Principal component analysis of bread formulations, encompassing the scree plot (A), PCA biplot (B), and the contribution of variables to the first (C) and second (D) principal components.
Sustainability 18 05441 g010
Figure 11. Cluster analysis of wheat- and rapeseed-based flour samples.
Sustainability 18 05441 g011
Figure 12. Hierarchical cluster analysis of bread samples.
Sustainability 18 05441 g012
Figure 13. Sensory evaluation of CB, RMWB1, RMWB2, and RMWB3. Duncan’s multiple range test was applied, where distinct lowercase letters denote statistically significant differences among samples for a specific parameter, while uppercase letters indicate significant differences among parameters within the same sample.
Sustainability 18 05441 g013
Table 1. Composition and codes of composite flours.
Composite Flour CodesWheat Flour (WF)Rapeseed Meal (RM)
RMW190%10%
RMW280%20%
RMW370%30%
Table 2. The bread samples (CB, RMWB1, RMWB2 and RMWB3).
Sustainability 18 05441 i001Sustainability 18 05441 i002Sustainability 18 05441 i003Sustainability 18 05441 i004
Ingredient
CB (Control Bread)RMWB1RMWB2RMWB3
WF (kg)10.9000.8000.700
RM (kg)-0.1000.2000.300
Active dry baker’s yeast (kg)0.030
Salt (kg)0.020
Water (mL)500
Table 3. Nutritional composition analysis procedures for the different samples.
ParametersStandardReference
Ash contentISO n° 2171/2007[26]
Lipid contentOfficial AOAC 922.06 method[27]
Protein contentOfficial AOAC 920.87 method[27]
Moisture contentOfficial AOAC 925.10 method[27]
Carbohydrate contentCalculated by difference[25]
Table 4. Descriptions of physical analyses carried out on bread.
ParametersDescriptionFormulaUnit
PorosityPorosity is expressed as the volume of pores contained within 100 g of crumb. The method consists of determining the specific mass of the crumb after removing all pores (SR 91:2007) [32]. P o r o s i t y % = V m d V × 100
V—volume of the crumb cylinder (cm3)
m—mass (g)
d—density of the compact crumb (1.26 g/cm3)
%
Height-to-diameter ratio (H/D)The H/D ratio was calculated based on the maximum loaf height (H, cm) and the arithmetic mean of two perpendicular loaf diameters (D, cm). Height/Diameter ratio = H/D-
ElasticityThe elasticity of the crumb was determined by subjecting a cylindrical specimen measuring 6 cm in height to a compressive stress test for a duration of one minute. Elasticity (%) = B/A × 100
A—the height of the core cylinder prior to the application of pressure (cm)
B—the height of the cylinder measured after recovery to its initial shape following the application of pressure (cm)
%
Table 5. Nutritional composition of flour and bread samples.
SamplesNutritional Characteristics
MoistureAshProteinsLipidsCarbohydrates
(%)(%) (%)(%)(g/100 g)
Composite flours
RM7.31 ± 0.04 e4.47 ± 0.04 a26.14 ± 0.12 a11.09 ± 0.04 a51 ± 0.15 e
WF10.40 ± 0.08 a0.60 ± 0.02 e12.26 ± 0.04 e1.42 ± 0.04 e75.32 ± 0.15 a
RMW19.11 ± 0.03 b1.02 ± 0.03 d13.15 ± 0.07 d4.75 ± 0.05 d71.97 ± 0.09 b
RMW28.96 ± 0.05 c1.58 ± 0.01 c14.99 ± 0.08 c5.81 ± 0.02 c68.65 ± 0.13 c
RMW38.62 ± 0.02 d2.30 ± 0.05 b16.64 ± 0.04 b8.72 ± 0.03 b63.72 ± 0.07 d
Breads
CB34.71 ± 0.34 a0.99 ± 0.02 d11.30 ± 0.02 c1.06 ± 0.06 d51.95 ± 0.33 a
RMWB131.68 ± 0.07 b2.34 ± 0.05 c11.38 ± 0.20 c3.72 ± 0.05 c50.88 ± 0.17 d
RMWB230.36 ± 0.11 c2.75 ± 0.02 b13.24 ± 0.04 b4.53 ± 0.29 b49.11 ± 0.31 c
RMWB329.3 ± 0.04 d2.85 ± 0.04 a14.19 ± 0.17 a7.89 ± 0.08 a45.76 ± 0.16 d
The mean of all measurements is expressed, as well as the standard deviation, which represents the extent of variation. The data sharing different letters in the same row are significantly different (p < 0.05) according to Duncan’s test.
Table 6. Mineral content of different samples.
SamplesMicro- and Macro-Element Contents
MnCaMgKNaZnFe
Composite flours
RM40.45 ± 1 a4760.46 ± 43.22 a3714.30 ± 13.13 a8963.28 ± 37.99 a56.1 ± 0.19 a56.98 ± 0.67 a52.94 ± 1.56 a
WF4.45 ± 0.51 e369.09 ± 21.03 e363.67 ± 10.72 e1248.85 ± 20.82 e20.39 ± 0.61 e3.43 ± 0.05 e8.51 ± 0.04 e
RMW19.62 ± 0.19 d1295.97 ± 51.83 d651.98 ± 2.91 d1482.93 ± 24.74 d21.78 ± 0.49 d5.59 ± 0.20 d12.62 ± 0.07 d
RMW212.49 ± 0.10 c2056.46 ± 52.65 c1354.32 ± 30.29 c2725.96 ± 23.36 c25.74 ± 0.51 c9.39 ± 0.22 c19.46 ± 0.19 c
RMW314.45 ± 0.22 b2775.7 ± 49.74 b2470.90 ± 57.01 b3308.8 ± 36.50 b30.26 ± 0.94 b13.64 ± 0.22 b33.19 ± 0.52 b
Composite Breads
CB7.45 ± 0.32 d354.86 ± 6.08 d353.21 ± 1.97 d1201.96 ± 6.53 d19.50 ± 0.17 d3.24 ± 0.03 d8.6 ± 0.04 d
RMWB19.36 ± 0.43 c1249.80 ± 7.99 c615.94 ± 4.93 c2115.86 ± 14.42 c21.20 ± 0.14 c5.47 ± 0.09 c12.27 ± 0.25 c
RMWB211.16 ± 0.54 b1990.47 ± 10.83 b1151.45 ± 34.01 b2219.20 ± 15.92 b23.11 ± 0.95 b9.64 ± 0.03 b16.41 ± 0.12 b
RMWB313.68 ± 0.38 a2402.97 ± 20.64 a1740.21 ± 33.36 a2548.34 ± 10.19 a28.54 ± 0.45 a11.39 ± 0.26 a23.43 ± 0.39 a
The mean of all measurements is expressed, as well as the standard deviation, which represents the extent of variation. The data sharing different letters in the same row are significantly different (p < 0.05) according to Duncan’s test.
Table 7. Phytochemical characteristics of different samples.
SamplesPhytochemical Profile
AATPC
(%)(mg GAE/100 g)
Composite flours
RM82.15 ± 0.02 a1820.61 ± 0.75 a
WF76.07 ± 0.09 e345.55 ± 1.45 e
RMW177.32 ± 0.06 d426.98 ± 0.12 d
RMW278.28 ± 0.02 c511.07 ± 0.18 c
RMW379.87 ± 0.03 b598.05 ± 0.65 b
Breads
CB75.36 ± 0.15 d369.07 ± 0.95 d
RMWB176.97 ± 0.04 c434.88 ± 0.33 c
RMWB277.52 ± 0.05 b518.62 ± 0.33 b
RMWB379.07 ± 0.05 a603.45 ± 1.15 a
The mean of all measurements is expressed, as well as the standard deviation, which represents the extent of variation. Data sharing different letters in the same row are significantly different (p < 0.05) according to Duncan’s test.
Table 8. Physical profiles of CB, RMWB1, RMWB2, and RMWB3.
SamplesPorosity (%)Elasticity (%)Height/Diameter Ratio (H/D)
CB62.25 ± 0.01 a61.18 ± 0.08 a0.59 ± 0.002 a
RMWB162.12 ± 0.16 a58.05 ± 0.05 b0.50 ± 0.001 b
RMWB261.42 ± 0.22 b57.28 ± 0.20 c0.48 ± 0.002 c
RMWB360.90 ± 0.10 c55.48 ± 0.18 d0.46 ± 0.001 d
The mean of all measurements is expressed, as well as the standard deviation, which represents the extent of variation. The data sharing different letters in the same row are significantly different (p < 0.05) according to Duncan’s test.
Disclaimer/Publisher’s Note: The statements, opinions and data contained in all publications are solely those of the individual author(s) and contributor(s) and not of MDPI and/or the editor(s). MDPI and/or the editor(s) disclaim responsibility for any injury to people or property resulting from any ideas, methods, instructions or products referred to in the content.