Article

Connectivity Optimization of Mountain Heritage Corridors Based on an Adaptive MCR Gravity Model: A Case Study of the Mount Song World Heritage Landscape in China


College of Landscape Architecture, Henan Agricultural University, Zhengzhou 450002, China
*
Author to whom correspondence should be addressed.
Sustainability 2026, 18(11), 5429; https://doi.org/10.3390/su18115429 (registering DOI)
Submission received: 17 April 2026 / Revised: 14 May 2026 / Accepted: 25 May 2026 / Published: 28 May 2026

Abstract

Mountainous cultural landscapes, characterized by fragmented heritage sites, present significant challenges for integrated conservation and regional planning. Taking the Mount Song Culture Circle in Dengfeng City, China—a World Heritage site embodying the core of Chinese ritual civilization—as a case study, this study proposes an adaptive minimum cumulative resistance (MCR) gravity model to optimize heritage corridor resilience against spatial fragmentation and development imbalances. Based on a spatial database of 294 cultural relic units, the adaptive model introduces a dynamic cultural value weight (CVIndex = 0.82) and a time decay function (λ = 0.05) to capture the interplay between cultural significance and ecological constraints—features absent in traditional static approaches. The model identifies three optimized heritage corridor networks—”Seeking Wisdom in the Mountains”, “Searching for Culture in the Landscape”, and “Exploring the City Along the River.” Compared with a traditional static MCR model (αindex = 0.42; core area node density = 0.74 nodes/km2), the adaptive approach improves network connectivity by 37% (α-index = 0.58, p < 0.01) and increases core area heritage node density to 1.12/km2. Space syntax analysis further confirms that optimized network integration values strongly correlate with cultural dissemination efficiency (R2 = 0.78, p < 0.01, n = 48). This research offers a methodological innovation for resilient conservation of complex cultural landscapes in World Heritage contexts.

1. Introduction

Cultural landscapes became a World Heritage category in 1992. Complex and dynamic, they show regional similarities due to environment, social development, and ideologies, yet also internal differences [1]. With accelerating urbanization, cultural landscapes increasingly face “islandization” and “commercialization” [2,3,4], while urban expansion fragments linear cultural heritage into “heritage islands” [5].
Attention to cultural heritage corridors in China has grown significantly [6]. In 2021, central authorities issued guidelines emphasizing the protection and revitalization of historical and cultural heritage, calling for hierarchical and categorical connections to form display routes, corridors, and networks integrated into daily life [7]. This reflects a deepening of systematic protection in national policy, yet effective implementation requires scientific support and methodological innovation.
Existing MCR-based models for heritage corridor construction suffer from three interrelated deficiencies: static valuation, uniform resistance coefficients ignore spatial heterogeneity of cultural value across heritage grades and preservation statuses [8,9]; temporal insensitivity, the historical stratification effect (exponential decay/accumulation of cultural significance over time) remains unaccounted for, distorting connectivity potential between multi-era nodes; and structural fragmentation, ecological efficiency (minimizing topographic resistance) is prioritized over cultural connectivity, bypassing high-value nodes and perpetuating “heritage islandization” [2,3]. These deficiencies are amplified in mountainous cultural landscapes, where topographic barriers and core–periphery imbalances already constrain network integration.
Recently, scholars in human geography, planning, and landscape architecture have begun focusing on regional cultural landscape typologies, holistically understanding distribution characteristics [10] and influencing factors. Research objects have shifted from single-type landscapes (traditional villages, settlements [11], segments [12]) to multi-type regionalization [13,14]. Studies address settlement regionalization [15], methods [16], spatiotemporal drivers [17], spatial distribution [18], feature identification [19], formation mechanisms [20], digital technology, and cultural identity. Scales range from mesoscopic (watersheds [21,22], provinces/cities) to macroscopic (national [23,24]) and microscopic (county/district [25]). Common methods include multi-factor overlay [26], dominant factor analysis [27], and hierarchical clustering [28].
Overall, the field has moved from qualitative or quantitative analyses to a mixed approach. To address “isolation” and “commercialization”, scholars like Liu Hailong proposed a “cultural heritage network” that integrates regional resources hierarchically to create themed display routes. The network has been refined using international experience [29] and concepts from ecology [30] and botany, with practical research at national [31], regional [32,33], and provincial/municipal [34,35] levels. Studies focus on cultural relic units [36], traditional villages [37], and related heritage [38]. Construction methods include a literature review, the Delphi method [39], PAST [40], space syntax [41,42,43], a minimum resistance model [8], and AHP-MCR [9]. Thus, building a cultural heritage network at the municipal level is feasible.
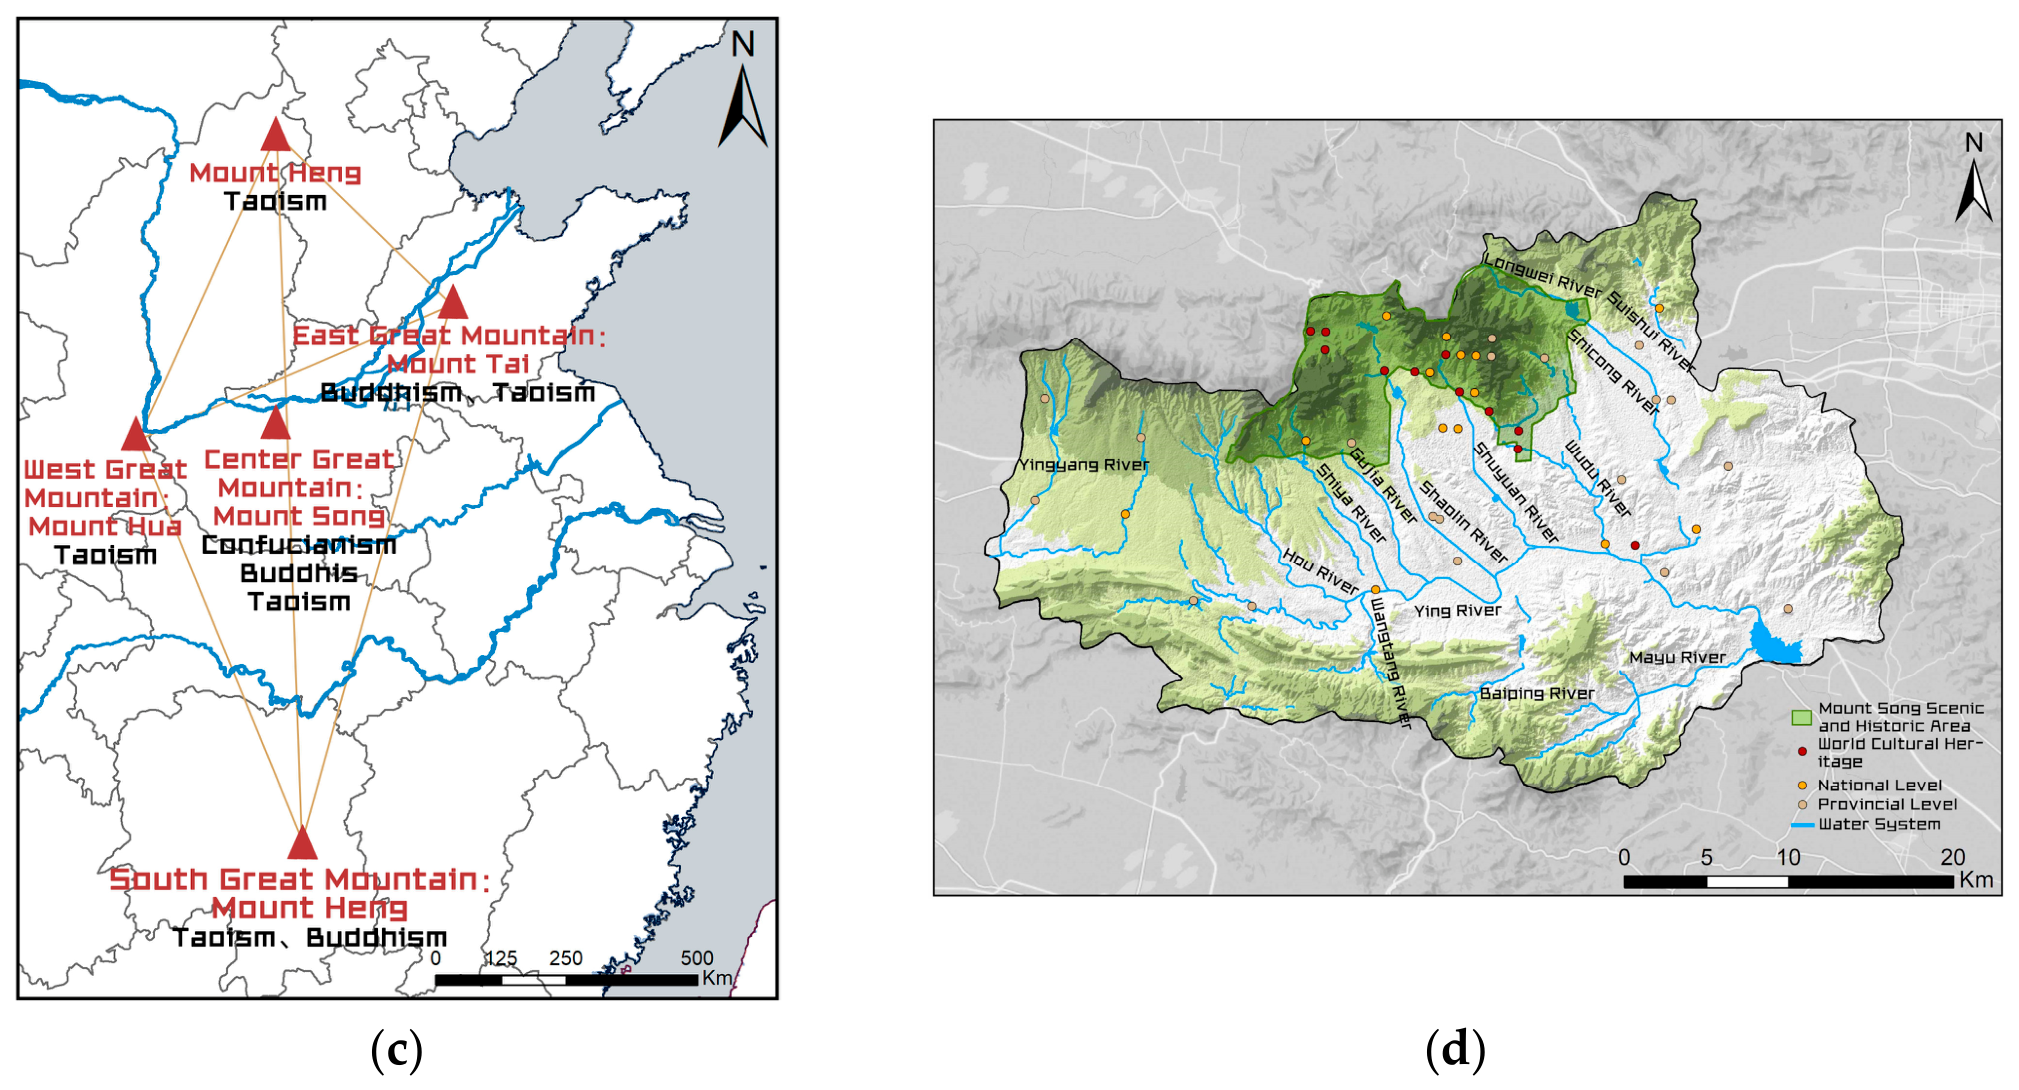
The “Mount Song Culture Circle” was proposed by Kunshu Zhou [44]. As the core hub of Central Plains civilization, it features the “Center of Heaven and Earth” cosmological schema, where the east–west-oriented Mount Song Range serves as a natural barrier and the Ying, Shaoshi, Taishi, and Fuxi river systems create accessible corridors for settlement and ritual movement [44,45,46,47]. This mountain–water–cosmology triad directly shaped the spatial distribution of heritage sites; 83% of identified cultural relics concentrate on gentle slopes (5–15°) at 200–800 m elevation along these river corridors (see Section 3.1), forming a “high north, low south” core–periphery structure that the present study seeks to reconfigure through network optimization. The region’s ritual heritage—including the Zhongyue Temple and Songyue Temple Pagoda—and cosmological observation platforms (e.g., ancient astronomical observatories) co-evolved with this topographic framework, establishing a spatial gene of “sacred mountain worship” that remains relevant for corridor thematization.
As a typical city lacking the overall protection of cultural landscapes during urbanization, Dengfeng has seen a growing concern for the cultural heritage of the Songshan Scenic Area over the years. However, insufficient attention is paid to other areas within the city, leading to a “single-core polarization” model. This study examines an adaptive MCR gravity model that dynamically balances cultural values and incorporates time decay effects, and this “core-periphery” structure is transformed into a resilient multi-center network. This is mainly verified through three interrelated objectives: constructing a dynamic cultural value weight (CVIndex) and time decay function (λ) for heritage nodes; generating optimized corridor networks that increase peripheral node density and topological connectivity (α-index); and validating that enhanced physical connectivity improves cultural dissemination efficiency (R2 > 0.70 via space syntax).
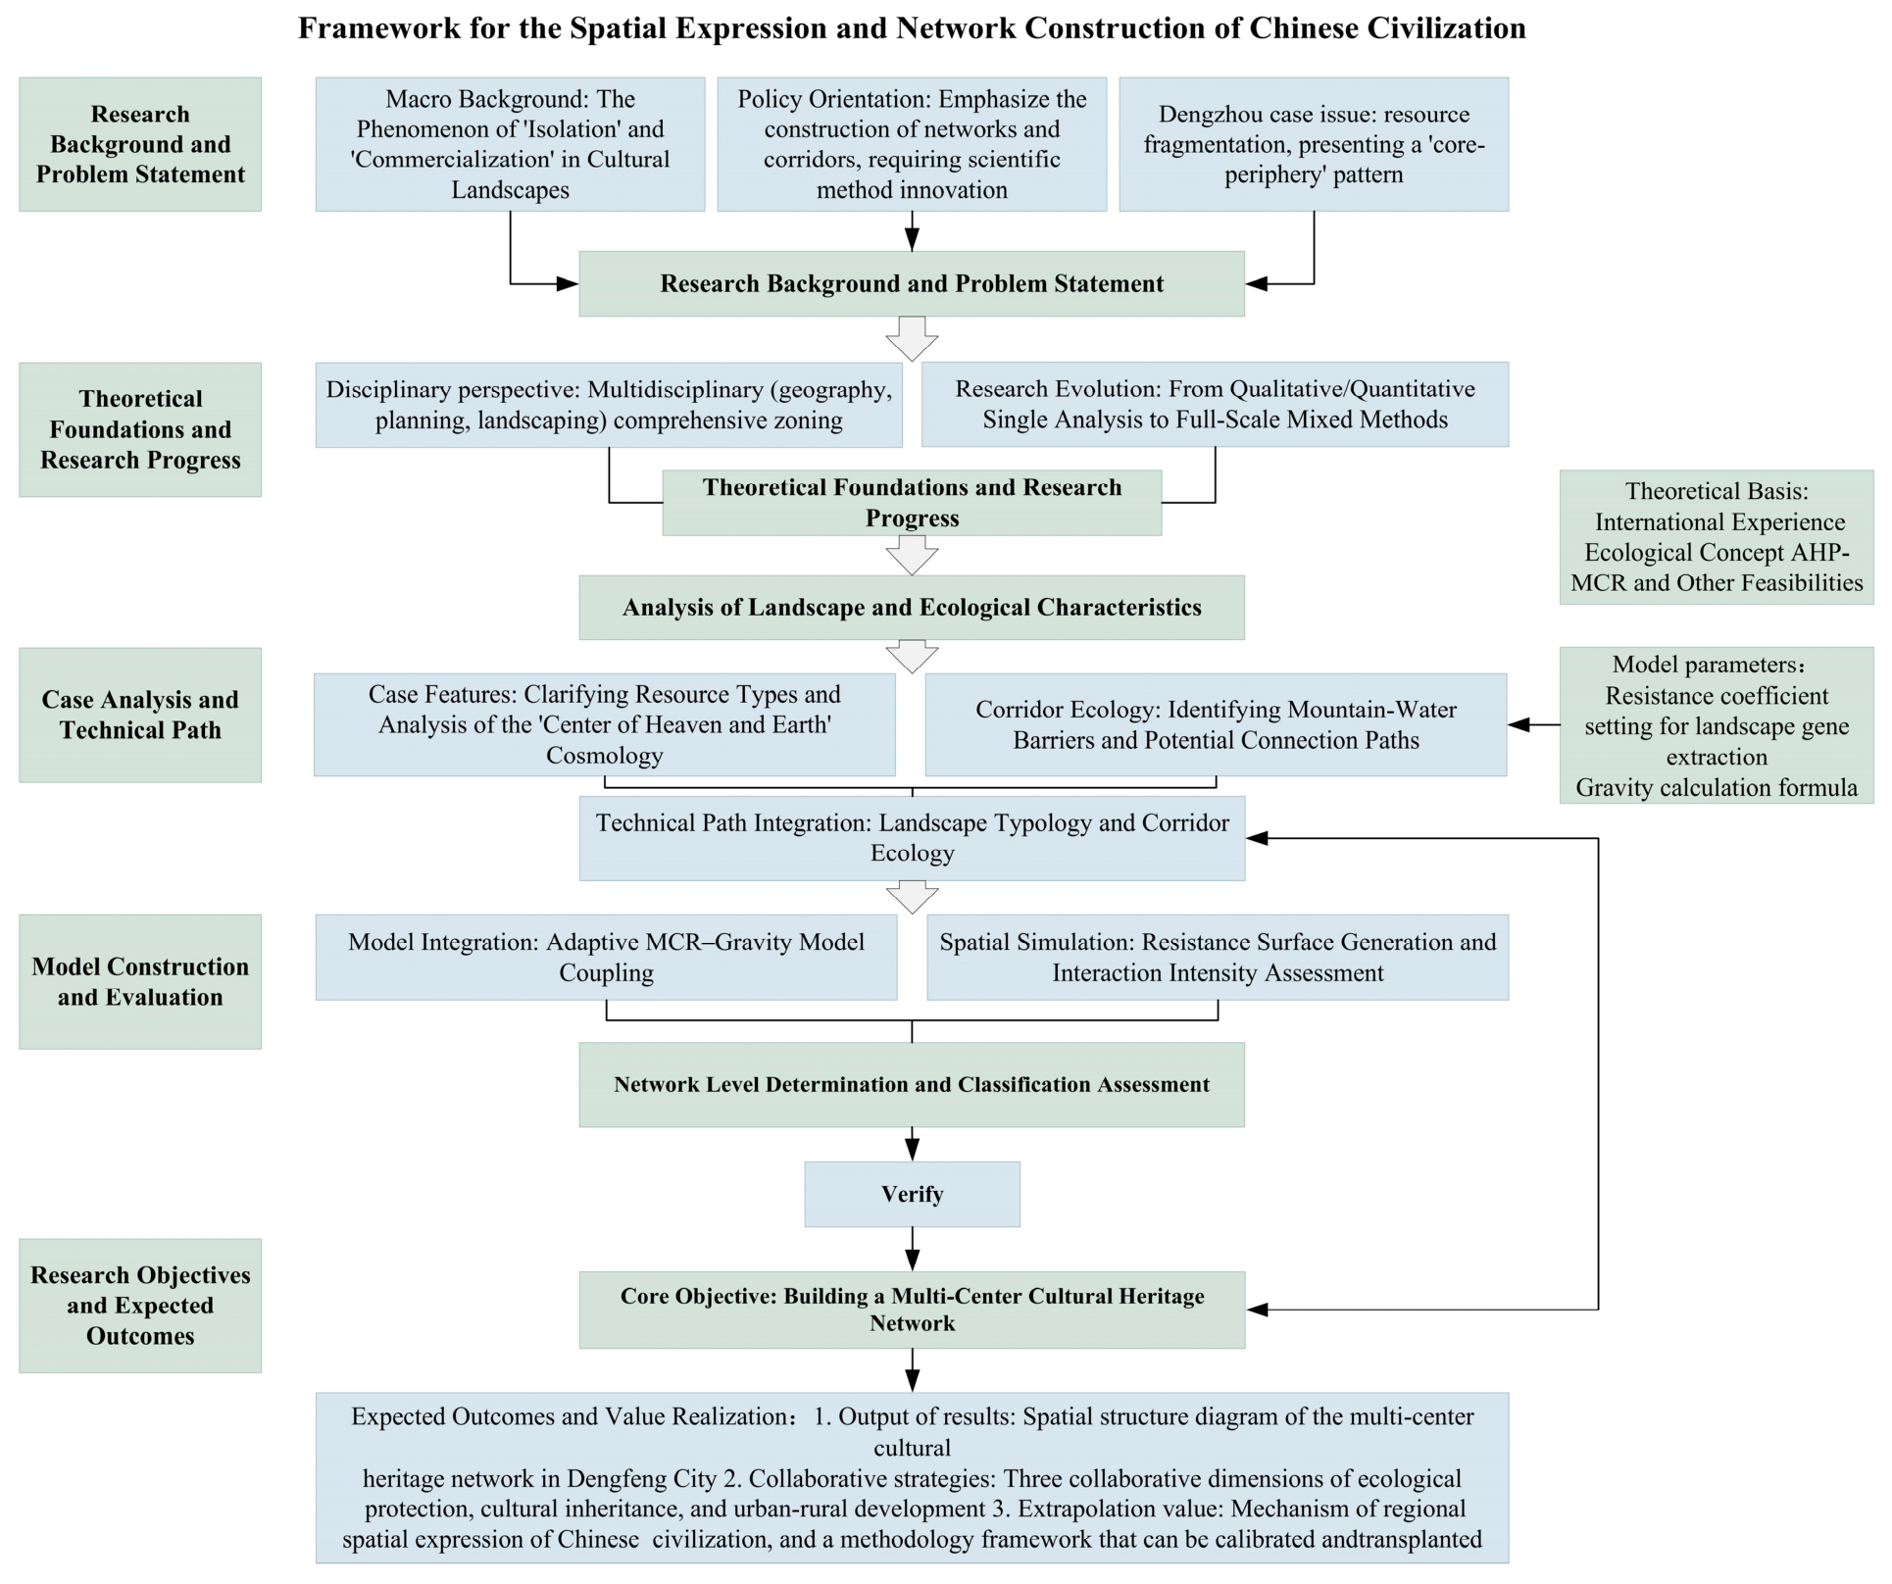
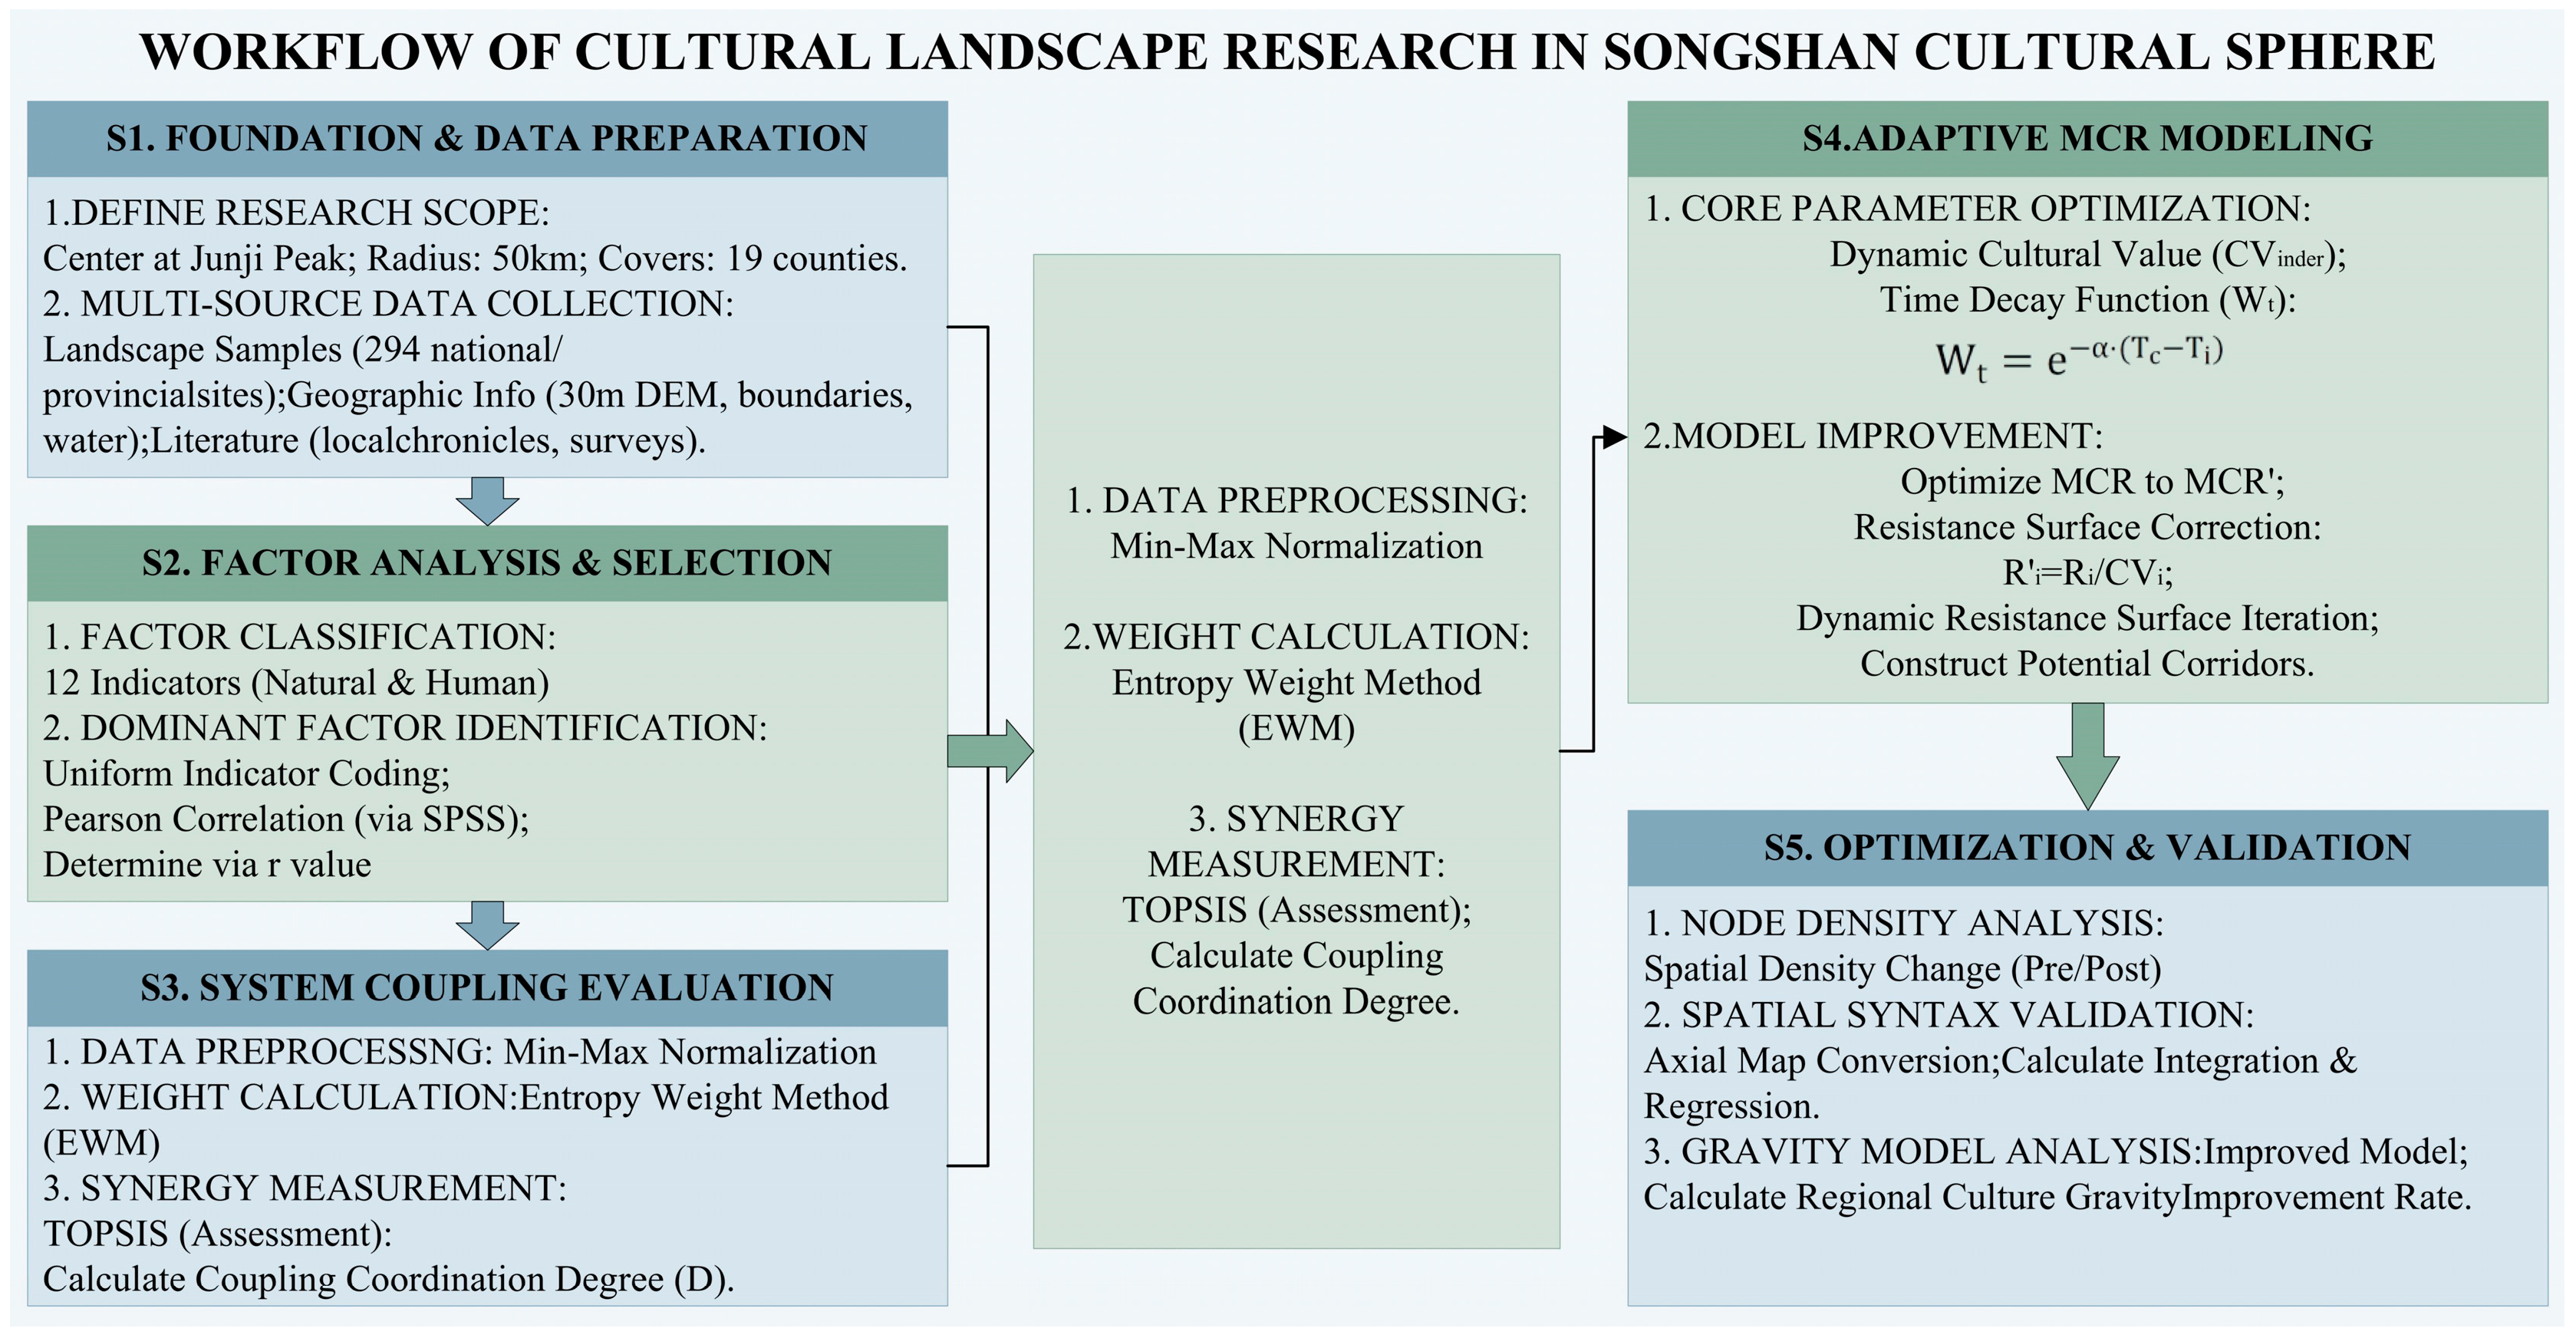
Dengfeng, a historic county-level city in Henan, is home to the “Center of Heaven and Earth” World Heritage site, yet rapid urbanization has fragmented its cultural resources, leaving the southern Ying River basin underdeveloped despite the well-protected northern Songyang Scenic Area. Existing studies focus on single analytical dimensions without clarifying their coupling mechanisms, so this paper adopts an adaptive MCR gravity model integrating landscape typology and corridor ecology to reveal the synergistic logic of cultural landscape–heritage networks for integrated regional protection, outlining the step-by-step methodology from problem identification to network optimization (Figure 1). Using Dengfeng as a case study, the model illuminates the continuity of Chinese civilization and is transferable to other fragmented mountainous cultural landscapes as a methodological framework, provided its core components are recalibrated to local conditions.

2. Materials and Methods

2.1. Study Area and Data Sources

2.1.1. Study Area

Cultural regions can be classified into core regions, sub-regions, and sub-sub-regions according to the degree of individual differences. Kunshu Zhou put forward the concept of the “Mount Song Culture Circle” based on the same and similar lineages distributed around Mount Song. This cultural circle includes the central area (R ≈ 50 km), the marginal area (R ≈ 200 km), and the influence area (R ≈ 700 km). The cultural landscape within it has a long history and diverse varieties. There is also the historical building complex of the World Cultural Heritage “Center of Heaven and Earth” that relies on Mount Song. This complex contains multiple value attributes of nature and humanity and is a direct manifestation of Mount Song culture.
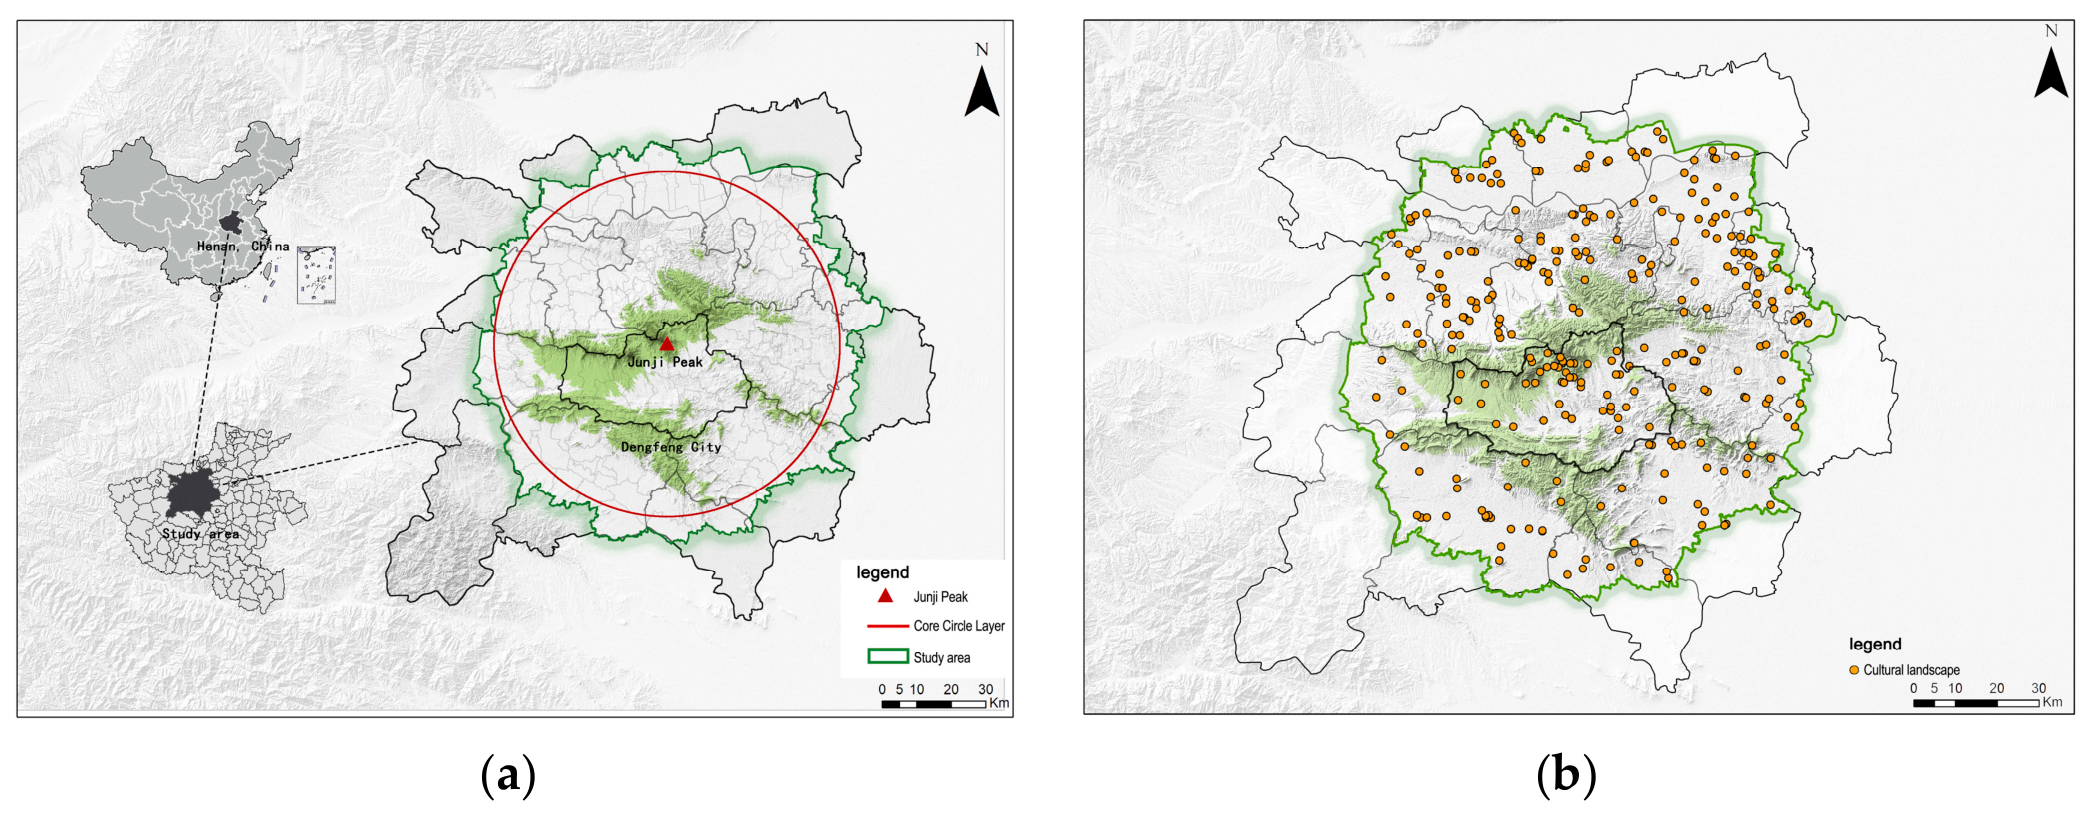
After comprehensively considering the current situation and the influence of Mount Song culture, the central area of the “Mount Song Culture Circle” is chosen as the research scope (Figure 2). Specifically, centered on Junji Peak, the highest peak of Mount Song, with a radius of 50 km, this area covers 19 counties (cities, districts) under the jurisdiction of 5 cities, namely, Zhengzhou, Luoyang, Pingdingshan, Xuchang, and Jiaozuo, with a total of 165 township administrative units. The overall terrain slopes from west to east. In the center, the Mount Song Range runs nearly east–west. There is a diverse range of landforms distributed in a ring around the Songshan Mountain. The region enjoys a mild climate with four distinct seasons.
Dengfeng City, located in the core area of the Mount Song Culture Circle, was formerly known as Yangcheng, Songyang, and Dengfeng County. As a county-level city under the jurisdiction of Zhengzhou City, Henan Province, it lies in the heart of the Central Plains, at the southern foot of Mount Song. It borders the ancient capital Luoyang to the west and is close to the provincial capital Zhengzhou to the east.

2.1.2. Data Sources

The research data is specifically divided into three aspects:
  • Research objects. Based on the eight batches of national and provincial cultural relic protection units, 294 samples were obtained from an initial pool of 412 sites after three-stage filtering: exclusion of modern historical sites and representative buildings post-1949 (n = 47); removal of duplicates and spatially overlapping entries (n = 59); and exclusion of sites lacking demonstrable connection to the Mount Song cultural landscape system (n = 12). Inclusion criteria required an authentic spatial relationship with Mount Song geography; cultural attributes traceable to the “Center of Heaven and Earth” framework; and locational precision ≤ 30 m for GIS analysis. The final dataset comprises 93 national-level and 201 provincial-level units (Figure 2b). Among the 48 Dengfeng cultural heritages selected through statistics, nearly 25 are located in the Songshan Scenic Area, covering most of the world’s cultural heritages and national-level cultural relic protection units.
  • Literature and materials. They are sourced from on-site investigations, local county annals, garden records, maps, and the interpretation of various historical information.
  • Geographic information. The DEM (Digital Elevation Model) data is sourced from the Geospatial Data Cloud SRTM (Shuttle Radar Topography Mission) DEM 30M (http://www.gscloud.cn)(v12.2, 2026), while the data on county-level administrative division boundaries, topography, and water systems are obtained from the Data Center for Resources and Environmental Sciences, Chinese Academy of Sciences (https://www.resdc.cn), etc.

2.2. Pearson Bivariate Correlation Analysis

2.2.1. Factor Selection

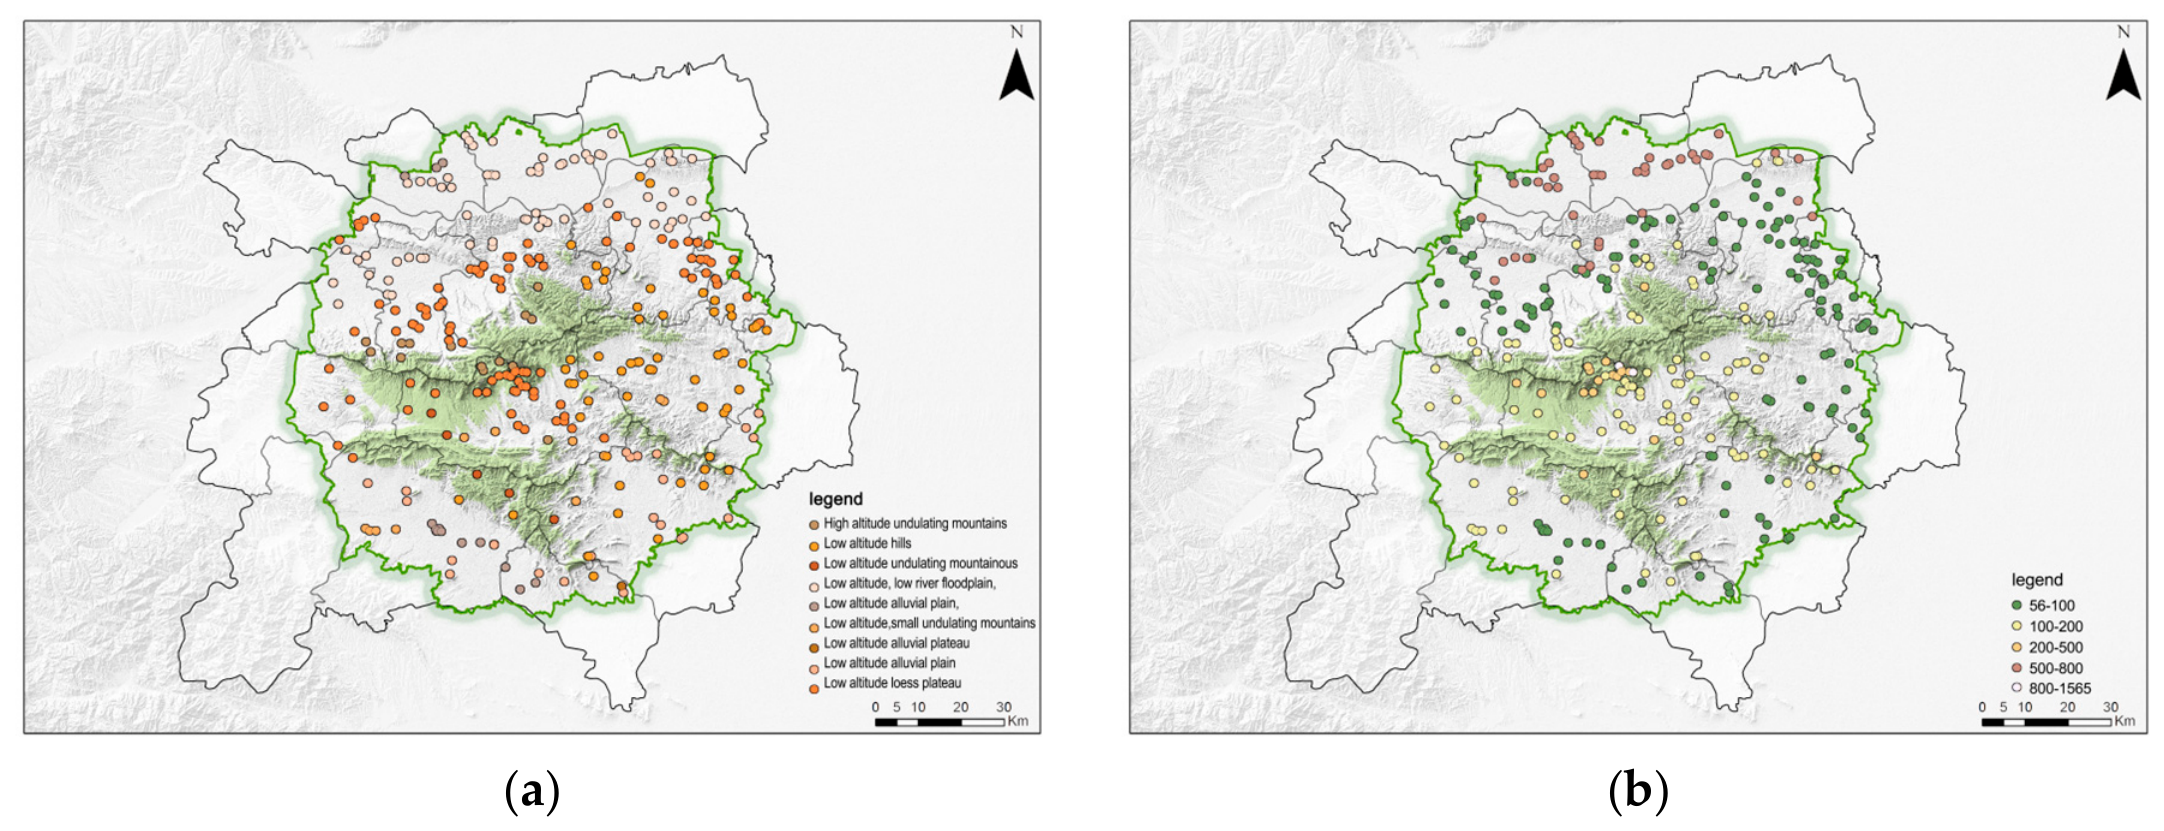
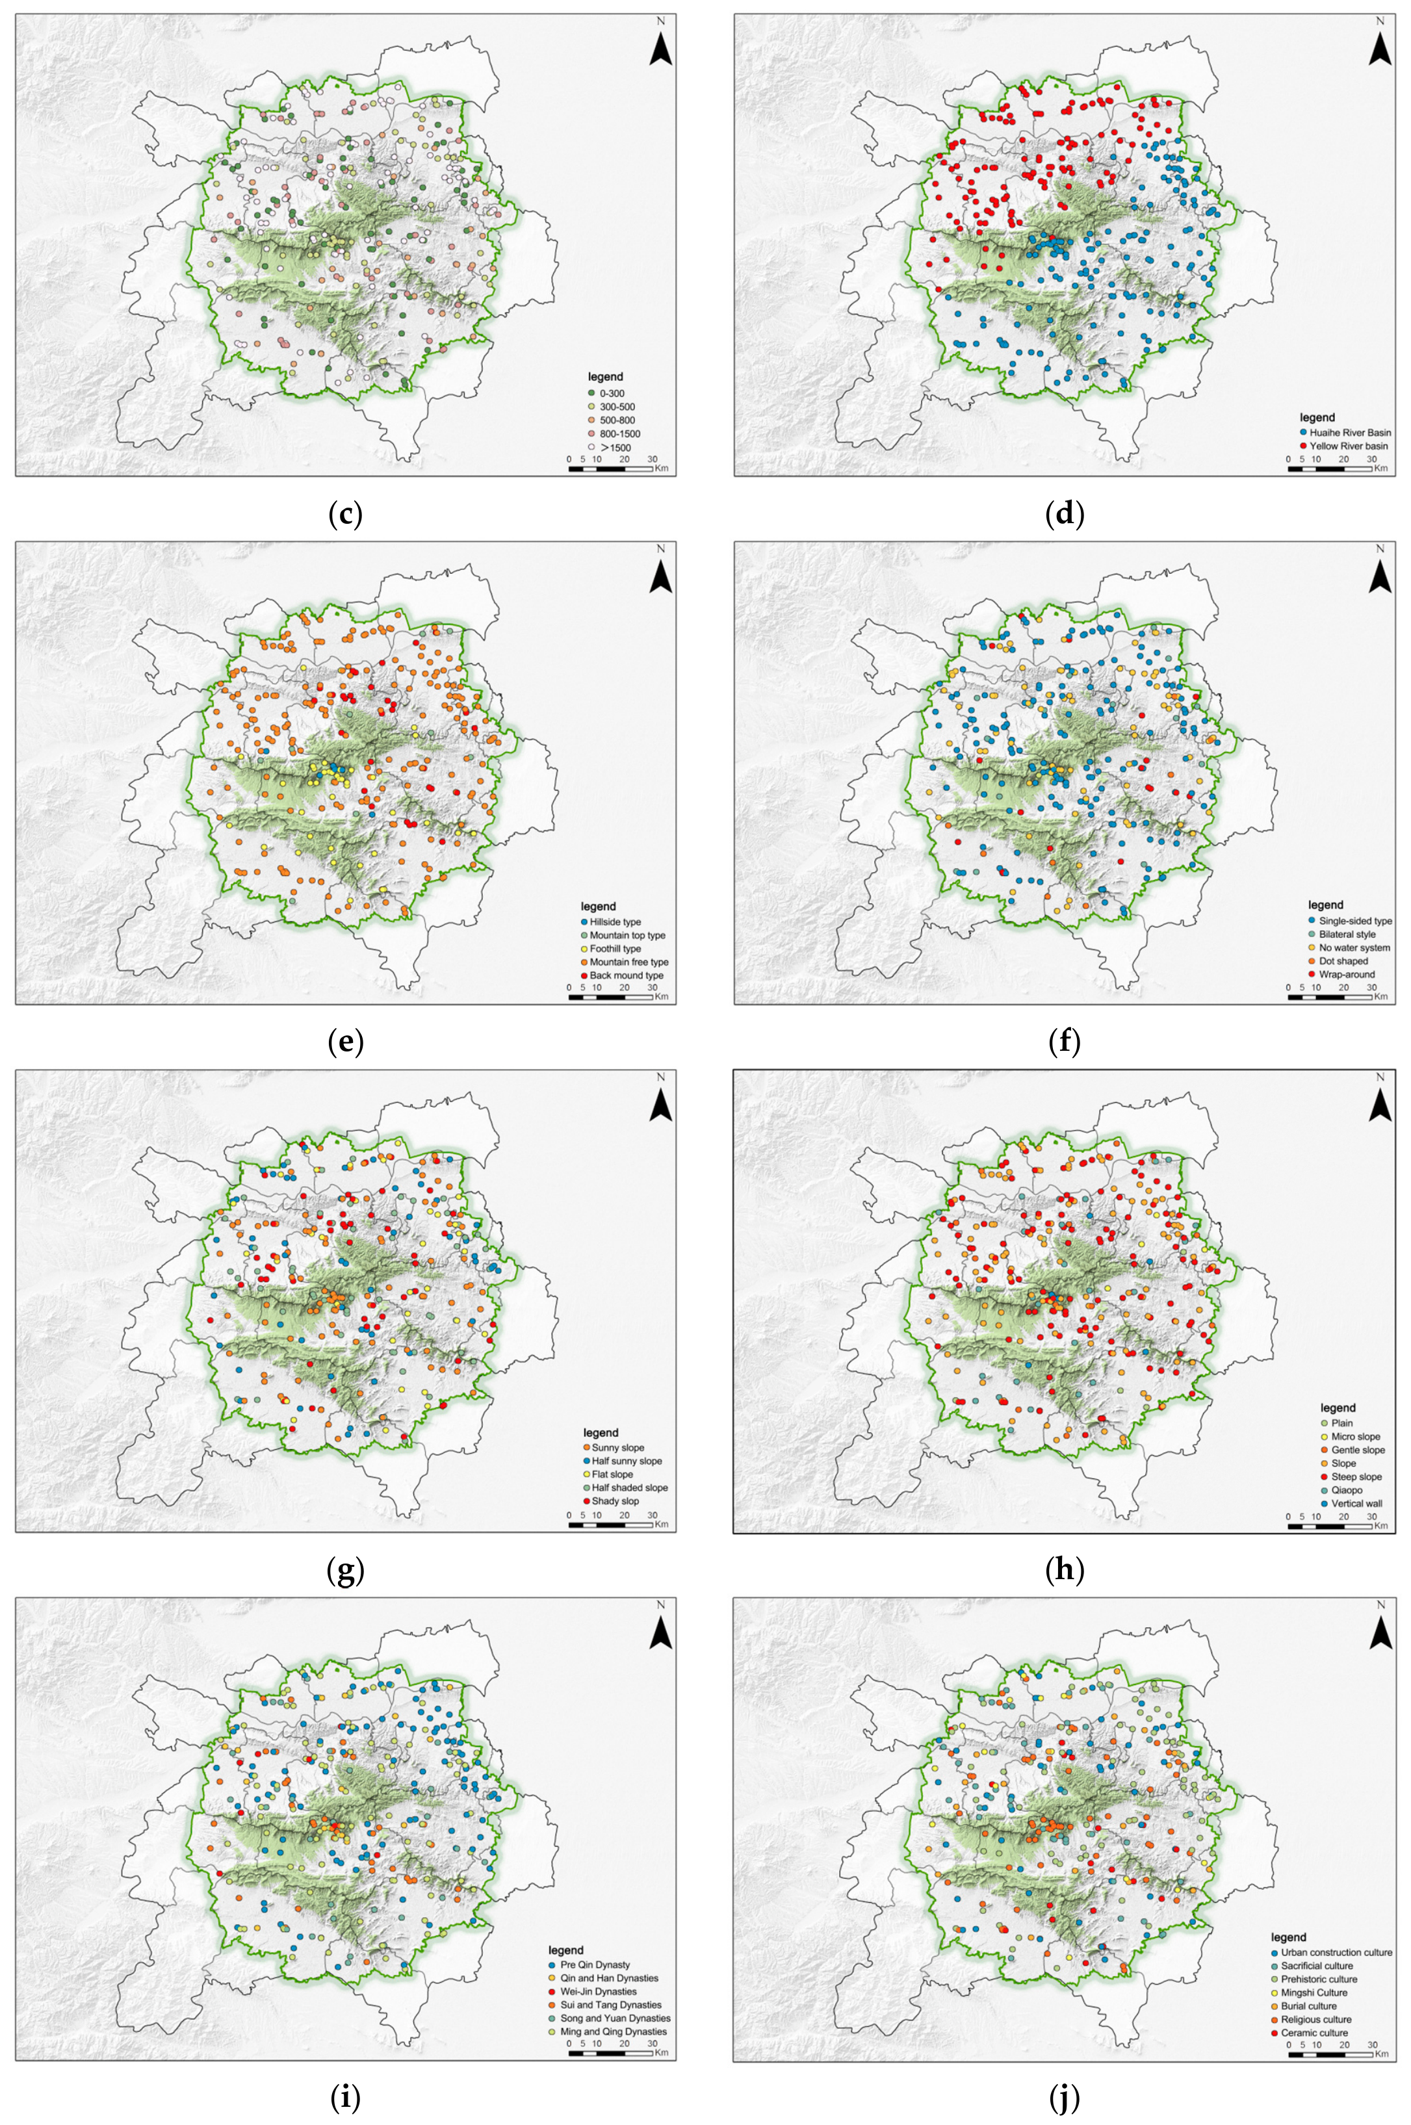
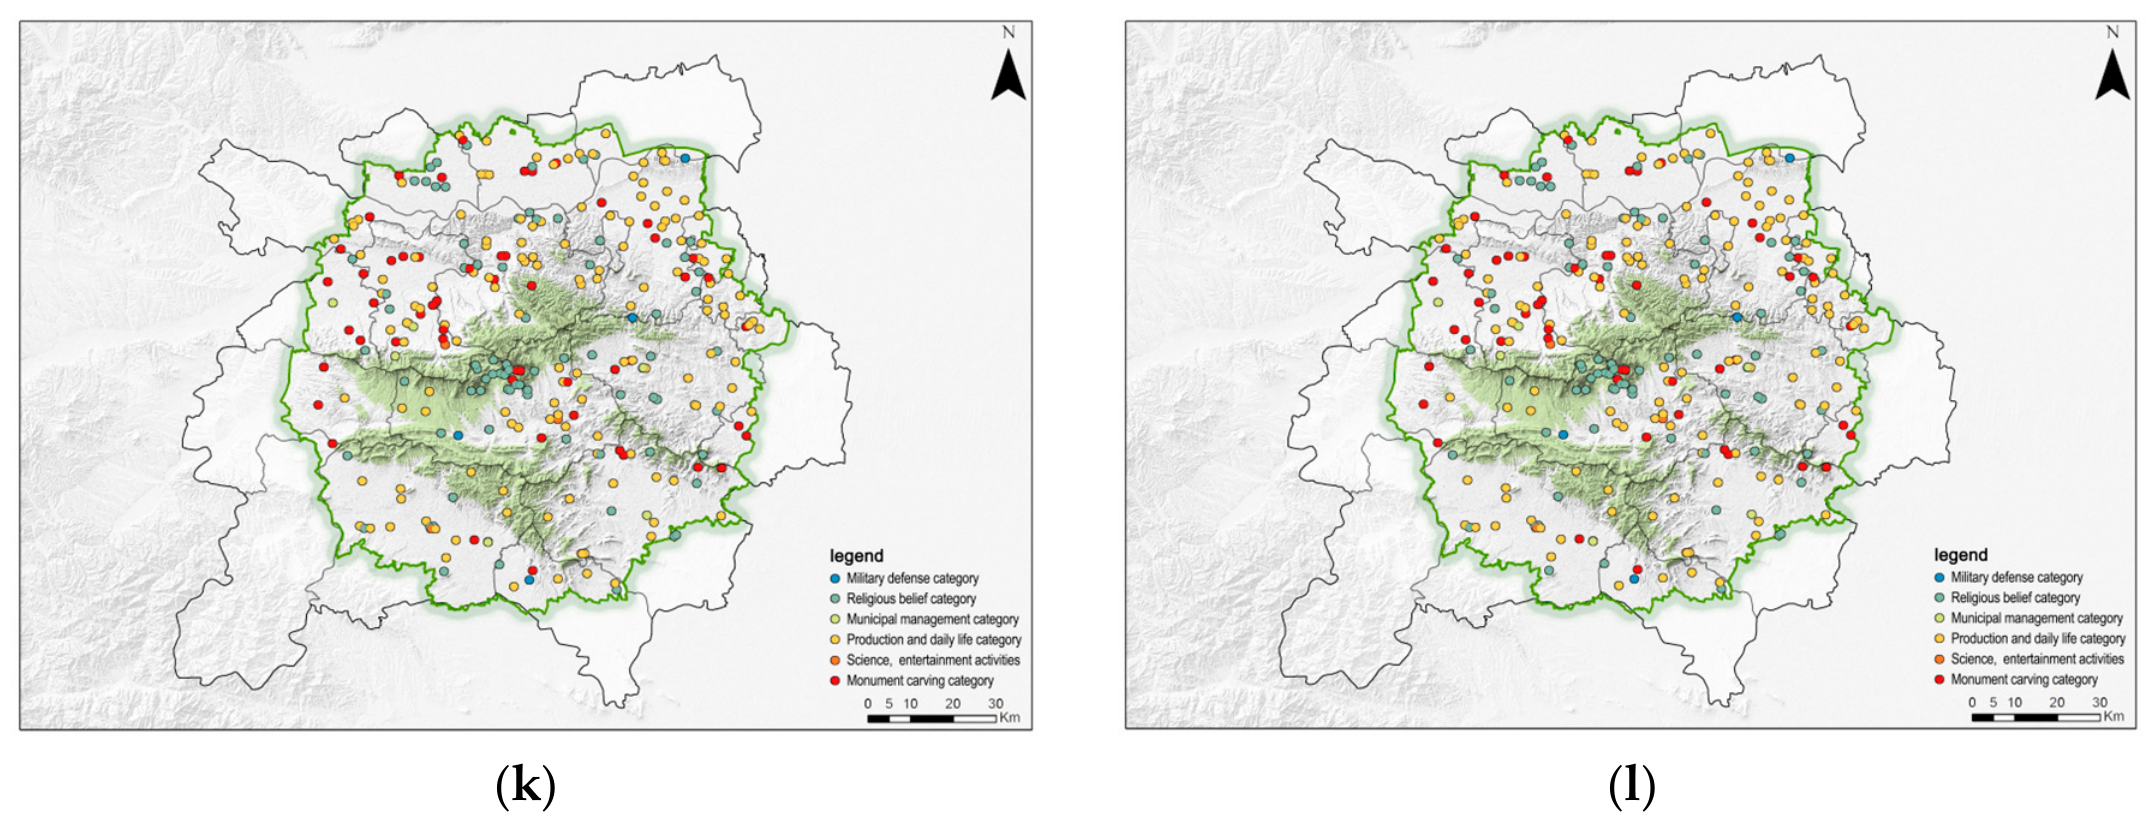
Based on multiple literature sources, cultural landscape factors are classified into two major categories and twelve sub-categories (Table 1): natural environment and human elements. Considering the profound cultural heritage and diverse cultural types in the Songshan area, seven general categories are further summarized in terms of cultural connotations [48,49,50], each divided into numerous sub-categories, such as urban construction culture (military defense, residential buildings, city planning), sacrifice and memorial culture, prehistoric culture (Yangshao, Longshan, Peiligang), tomb culture, celebrity culture, ceramic culture, and religious culture (Buddhism, Taoism, Confucianism, Islam, Christianity). For data-type indicators, GIS (Geographic Information System) 10.8 (v25, 3, 2026) software processes DEM data to derive slope, aspect, distance to water, etc. Descriptive indicators refer to historical information from field surveys and local county annals, specifically including construction age, usage function, and interpreted human value. After data collection and processing, a cultural landscape information database for the central area of the Mount Song Culture Circle is established (Figure 3).

2.2.2. Bivariate Correlation Analysis

To standardize the 11 data-type indicators, unified coding was performed according to each cultural factor’s classification. Given that the dataset contains ordinal variables (e.g., slope gradient, construction era) and nominal variables (e.g., watershed hierarchy, mountain relationship), Spearman’s rank order correlation was adopted as the primary method, as it is robust to non-normal distributions and appropriate for mixed-scale data. Shapiro–Wilk tests confirmed significant deviation from normality for all continuous variables (p < 0.001). SPSS (Statistical Product and Service Solutions) 19.0 (v11, 4, 2026) software was used to conduct bivariate Spearman correlation analysis to determine dominant factors.
r x y = Σ x i x ¯ y i y ¯ Σ x i x ¯ 2 Σ y i y ¯ 2
Among them, when examining the Pearson correlation coefficient between variables x and y, the values of the i-th sample on variables x, y, x ¯ , and y ¯ are the sample means of variables x and y. The closer |r| is to 1, the stronger the correlation; the closer |r| is to 0, the weaker the correlation.

2.3. Entropy Weight TOPSIS Coupling Model

During the development of the “Mount Song Culture Circle cultural landscape”, elements are interconnected, mutually reinforcing, and develop in a coordinated manner (Table 2).
In order to solve the problems of large data value span and inconsistent units caused by the differences in calculation methods and sources of various indicators, the range normalization method was used to perform dimensionless processing on the original data. The calculation formula is:
Positive   indicators :   X i j = X I J min ( X i ) max ( X i ) min ( X i )
Negative   indicators :   X i j = max ( X i ) X I J max ( X i ) min ( X i )
In the equation, Xij denotes the standardized index value after processing, XIJ represents its original index value, max(Xi) stands for the maximum value of the index, and min(Xi) is the minimum value of the index.
For the standardized data, the proportion of each indicator in each sample is calculated. Then, the entropy value of each indicator is computed. This value is positively correlated with the stability of the system. The formula for calculating the entropy value is:
P i j = X i j m n X i j
e j = κ i = 1 n P i j ln ( P i j )
Define the weights of each index by the entropy weight method [51]. The weight of each index reflects its relative importance in the comprehensive evaluation. The formula is:
W i j = ( 1 e j ) j = 1 n ( 1 e j )
In the formula, Wij is the index weight and ej is the information entropy of the jth index. Substitute the data of each index into the formula to calculate the weight results of the evaluation indexes of the subsystem.
This study uses the coupling coordination degree to describe the mutual influence and synergistic interaction between natural and cultural landscapes. The calculation is based on the comprehensive evaluation values of the two subsystems obtained in the previous chapter. Specifically, the entropy method is applied to determine index weights, and the TOPSIS model provides the evaluation values for the natural and cultural systems individually [11]. Using these values, the coupling degree C and the coupling coordination degree D of the Songshan cultural landscape system are calculated as follows:
C = 2 T 1 × T 2 T 1 + T 2
Q = α T 1 + β T 2
D = C × Q
Among them:
T : the comprehensive development index;
α   a n d   β : subsystem importance (both set to 0.5).
In the formula, C denotes the coupling degree; T1 and T2 represent the comprehensive evaluation indices of the natural and cultural systems, respectively; Q represents the overall synergistic effects between the two systems; D indicates the coupling coordination degree; and α and β denote the importance of the two systems, both of which are considered equally important based on existing research, with both values set to 0.5.

2.4. Adaptive MCR Model

The construction of the cultural heritage network in Dengfeng City adheres to the “point-line-surface” principle, which involves a path of recognizing cultural heritage features, identifying cultural heritage values, constructing potential cultural heritage corridors, and optimizing the cultural heritage network in Dengfeng City. All data were projected to CGCS2000/3-degree Gauss–Kruger zone 38 (EPSG: 4524) with 30 m × 30 m raster resolution. DEM sinks were filled using the Wang & Liu algorithm; slope and watershed rasters were derived using standard ArcGIS 10.8 tools (Spatial Analyst extension). Heritage nodes were georeferenced via GPS field survey (n = 87), satellite imagery interpretation (n = 156), and historical map digitization (n = 51), validated against road intersections within 50 m tolerance. The composite resistance surface was generated via weighted overlay of seven factor rasters, normalized to [1, 100]. MCR corridor extraction employed the Dijkstra least-cost path algorithm with 8-connectivity and a 15 km Euclidean distance threshold between node pairs, selecting paths below the 25th percentile resistance cost (Figure 4). Many scholars have verified the effectiveness of the minimum cumulative resistance model (MCR) in generating potential cultural heritage corridors. Therefore, this study employs the MCR model to construct such corridors and assesses the results.
Calculation formulas and steps:
1.
Dynamic weight of cultural value (CVIndex)
Formula:
C V i = k = 1 n w k · S i k
C V I n d e x = 1 m i = 1 m C V i
Among them:
C V i : the cultural value score of heritage site i;
w k : the entropy weight of index k (Table 1);
S i k : the standardized value of heritage site i in index k (0–1);
m : the total number of heritage sites.
Steps:
  • Data normalization (range method):
S i k = x i k min ( x k ) max ( x k ) min ( x k )
Calculating weights by the entropy weight method:
Proportion   of   the   index :   p i k = S i k i = 1 m S i k
Information   entropy :   e k = 1 ln m i = 1 m p i k ln p i k
Weight :   w k = 1 e k k = 1 n ( 1 e k )
2.
Weighted summation: calculate each point CVi.
3.
Regional index: take the average of all C V i to get C V I n d e x .
2.
Time decay function (historical stratification effect).
Formula:
W t = e α · ( T c T i )
Among them:
α = 0.05 is the attenuation coefficient (determined through sensitivity analysis; α was varied across [0.01, 0.10] and evaluated against network connectivity, node density, and spatial syntax validity; α = 0.05 yielded optimal performance with R2 = 0.78 and α-index = 0.58).
T c : Current time (2025).
T i : Construction year of the heritage site.
Steps:
1. Calculate the time difference: Δ T = T c T i (Unit: Century);
2. Substitute the exponential function: W t = e 0.05 × Δ T ;
3. Correct the gravity value: M i = M i × W t .
The traditional minimum cumulative resistance (MCR) model has two major limitations for cultural heritage networks: it ignores spatial heterogeneity of cultural value by assigning uniform resistance and it assumes static resistance values, failing to capture the dynamic nature of cultural significance (which may decay or accumulate over time). As a result, generated corridors are ecologically efficient but culturally suboptimal, often bypassing high-value cultural nodes or fragmenting meaningful pathways. To address these issues, this study proposes an adaptive MCR gravity model incorporating a dynamic cultural value weight and a time decay function, allowing high-value heritage nodes to reduce local resistance and reflecting temporal changes in cultural significance, thereby generating corridors that balance ecological constraints with cultural connectivity.
3.
Improvement of the adaptive MCR model
Traditional MCR:
M C R = min j = 1 n i = 1 m ( D i j × R i )
MCRImproved MCR:
MCR = min j = 1 n i = 1 m D i j × R i × 1 C V i
Steps:
  • Calculate the cultural value resistance correction: R i = R i / C V i ;
  • Generate dynamic drag surface;
  • Iterative calculation of the minimum accumulated path;
  • Connectivity enhancement verification.
    Traditional network α-index: α 0 = L V + 1 2 V 5 .
    Optimized network α-index: α 1 .
    Improvement rate: α 1 α 0 α 0 × 100 % .
4.
Calculation of heritage node density
Formula:
P = N A
Steps:
  • Delimit the scope of the core area: A (Songshan Scenic Area);
  • Number of nodes before statistical optimization: N 0 ρ 0 ;
  • Newly added nodes after optimization: N 1 ρ 1
  • Spatial syntax analysis.
Formula:
I n t e g r a t i o n = ( n 1 ) 2 2 j = 1 n d i j
Steps:
  • Convert the corridor network into an axis diagram;
  • Calculate the average depth value of each node ( M D );
  • Calculate integration ( I n t e g r a t i o n );
  • Regression analysis.
Establish an equation: y = β 0 + β 1 x .
Among them, y is the cultural dissemination efficiency index (derived from spatial syntax integration values and heritage node accessibility metrics).
x : Corridor integration value.
5.
Cultural gravity model
Basic formula:
F i j = G M i M j d i j b   ( G = 1 0 3 ,   b = 1.8 )
Improved formula:
F i j = G ( C V i · W t i ) ( C V j · W t j ) d i j b
Regional gravity calculation:
F t o t a l = i c o r e j e d g e F i j
Steps:
  • Gravity before computational optimization: F 0 ;
  • Optimized gravity: F 1 ;
  • Calculate the improvement rate: F 1 F 0 F 0 × 100 % .
Motivation: The gravity model quantifies the attractive force between heritage nodes. The improved version replaces static mass MM with the product of cultural value CVCV and a time decay weight Wt, thereby capturing dynamic cultural significance. A higher Ftotal after optimization indicates stronger potential interactions among heritage nodes across the core–edge gradient, supporting integrated regional protection.

3. Results

3.1. Cultural Landscape Zoning and Coupling Analysis

3.1.1. Determine the Dominant Factor

Through correlation analysis, the degree of closeness and the direction of the relationship between relevant cultural factors can be deduced. In the analytical framework of cultural landscape adopted in this study, natural geographical elements, such as topography and elevation, are not treated merely as objective environmental variables. Rather, because they have historically shaped human settlement patterns, spatial practices, and cultural cognition in the Songshan area, they are considered cultural factors in a broad sense—constitutive components of the cultural landscape that mediate human–environment interactions. Accordingly, this study uses SPSS 19.0 to perform a bivariate correlation analysis on 11 data-type indicators to further explore the relationships among these cultural factors. The research findings indicate that topography is closely associated with cultural landscape distribution and has a significant correlation with elevation. This correlation is stronger than that between topography and other cultural factors, which provides a basis for the subsequent analysis of the relationship between cultural factors and settlement patterns (Table 3).

3.1.2. Cluster Analysis and Cultural Zoning

Traditional cultural zoning methods primarily focus on the qualitative description and analysis of the dominant geographical–cultural factors, followed by statistical classification based on these findings. This approach results in a lack of objectivity and accuracy. Meanwhile, a simple mathematical clustering method may fail to distinguish between primary and secondary factors, overemphasizing the comprehensive effect of multiple indicators.
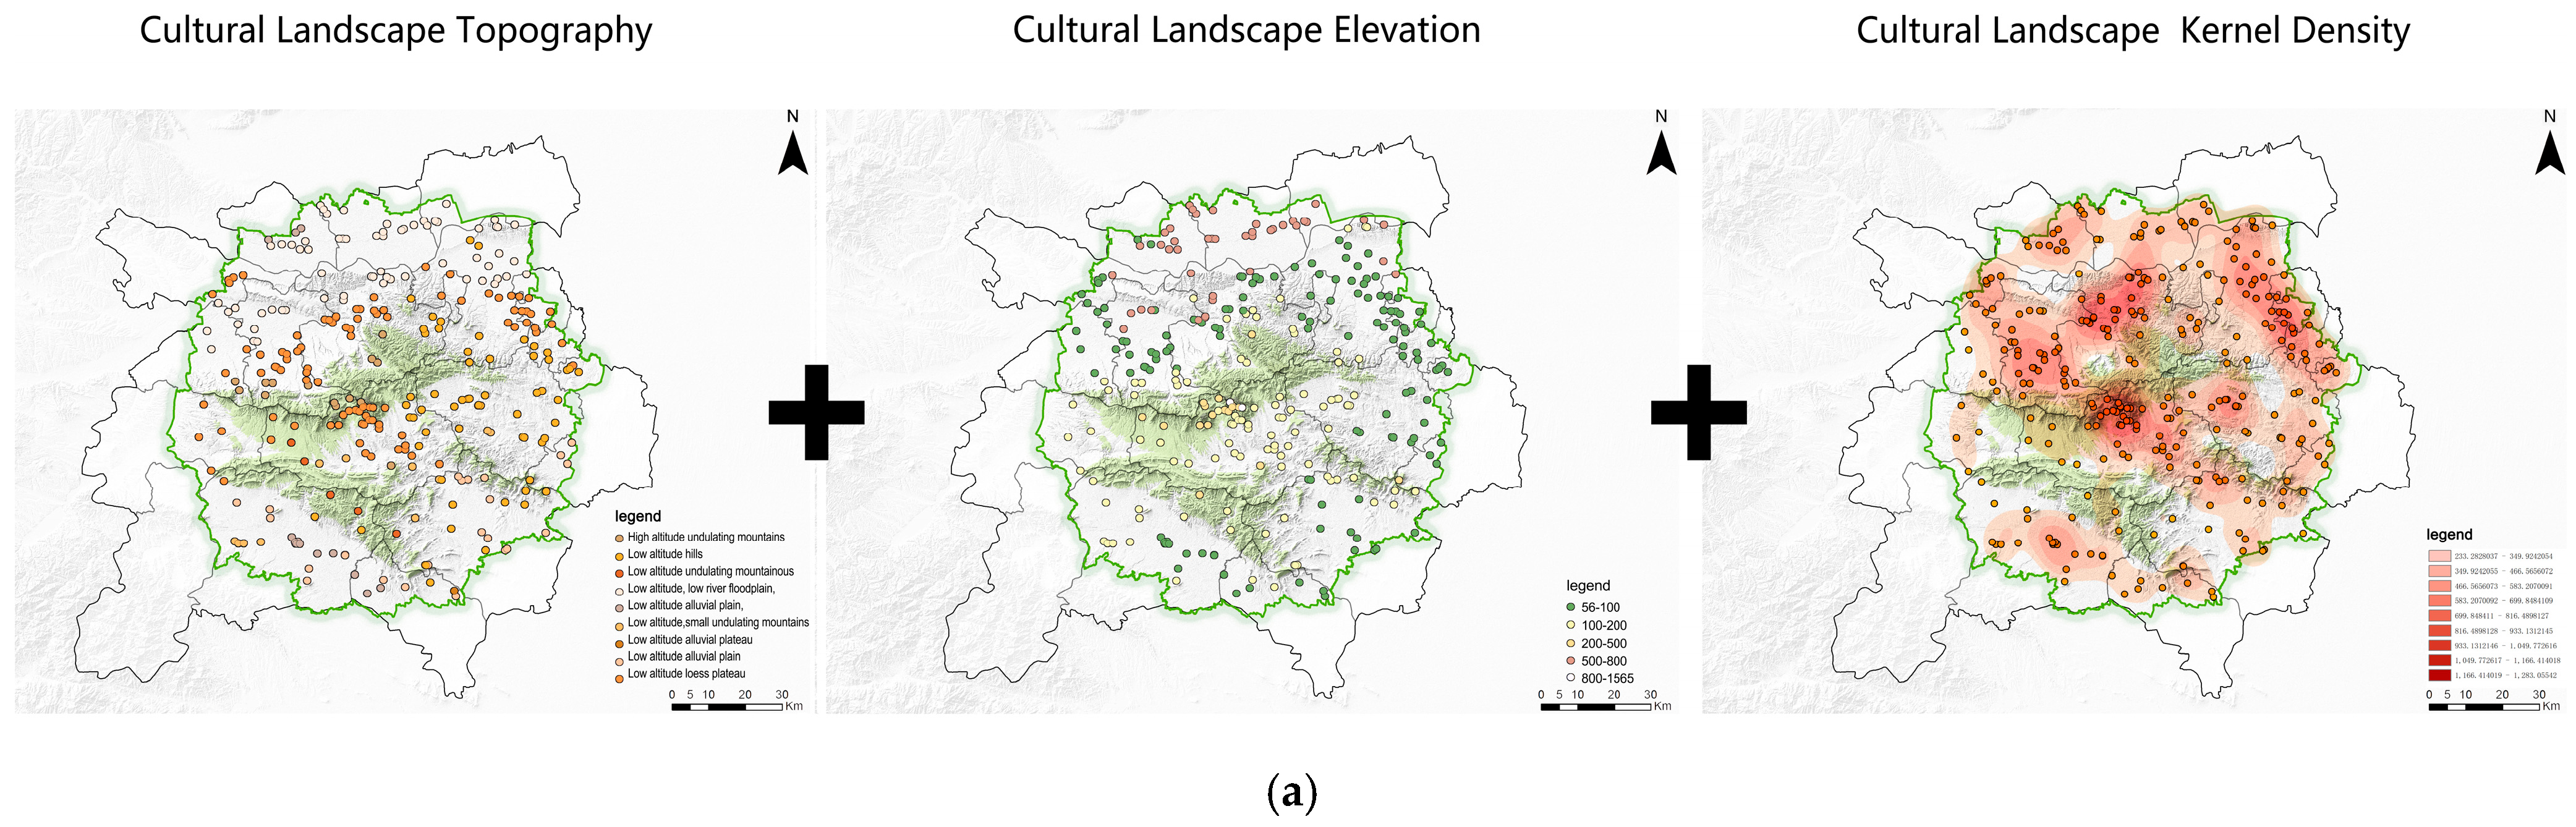
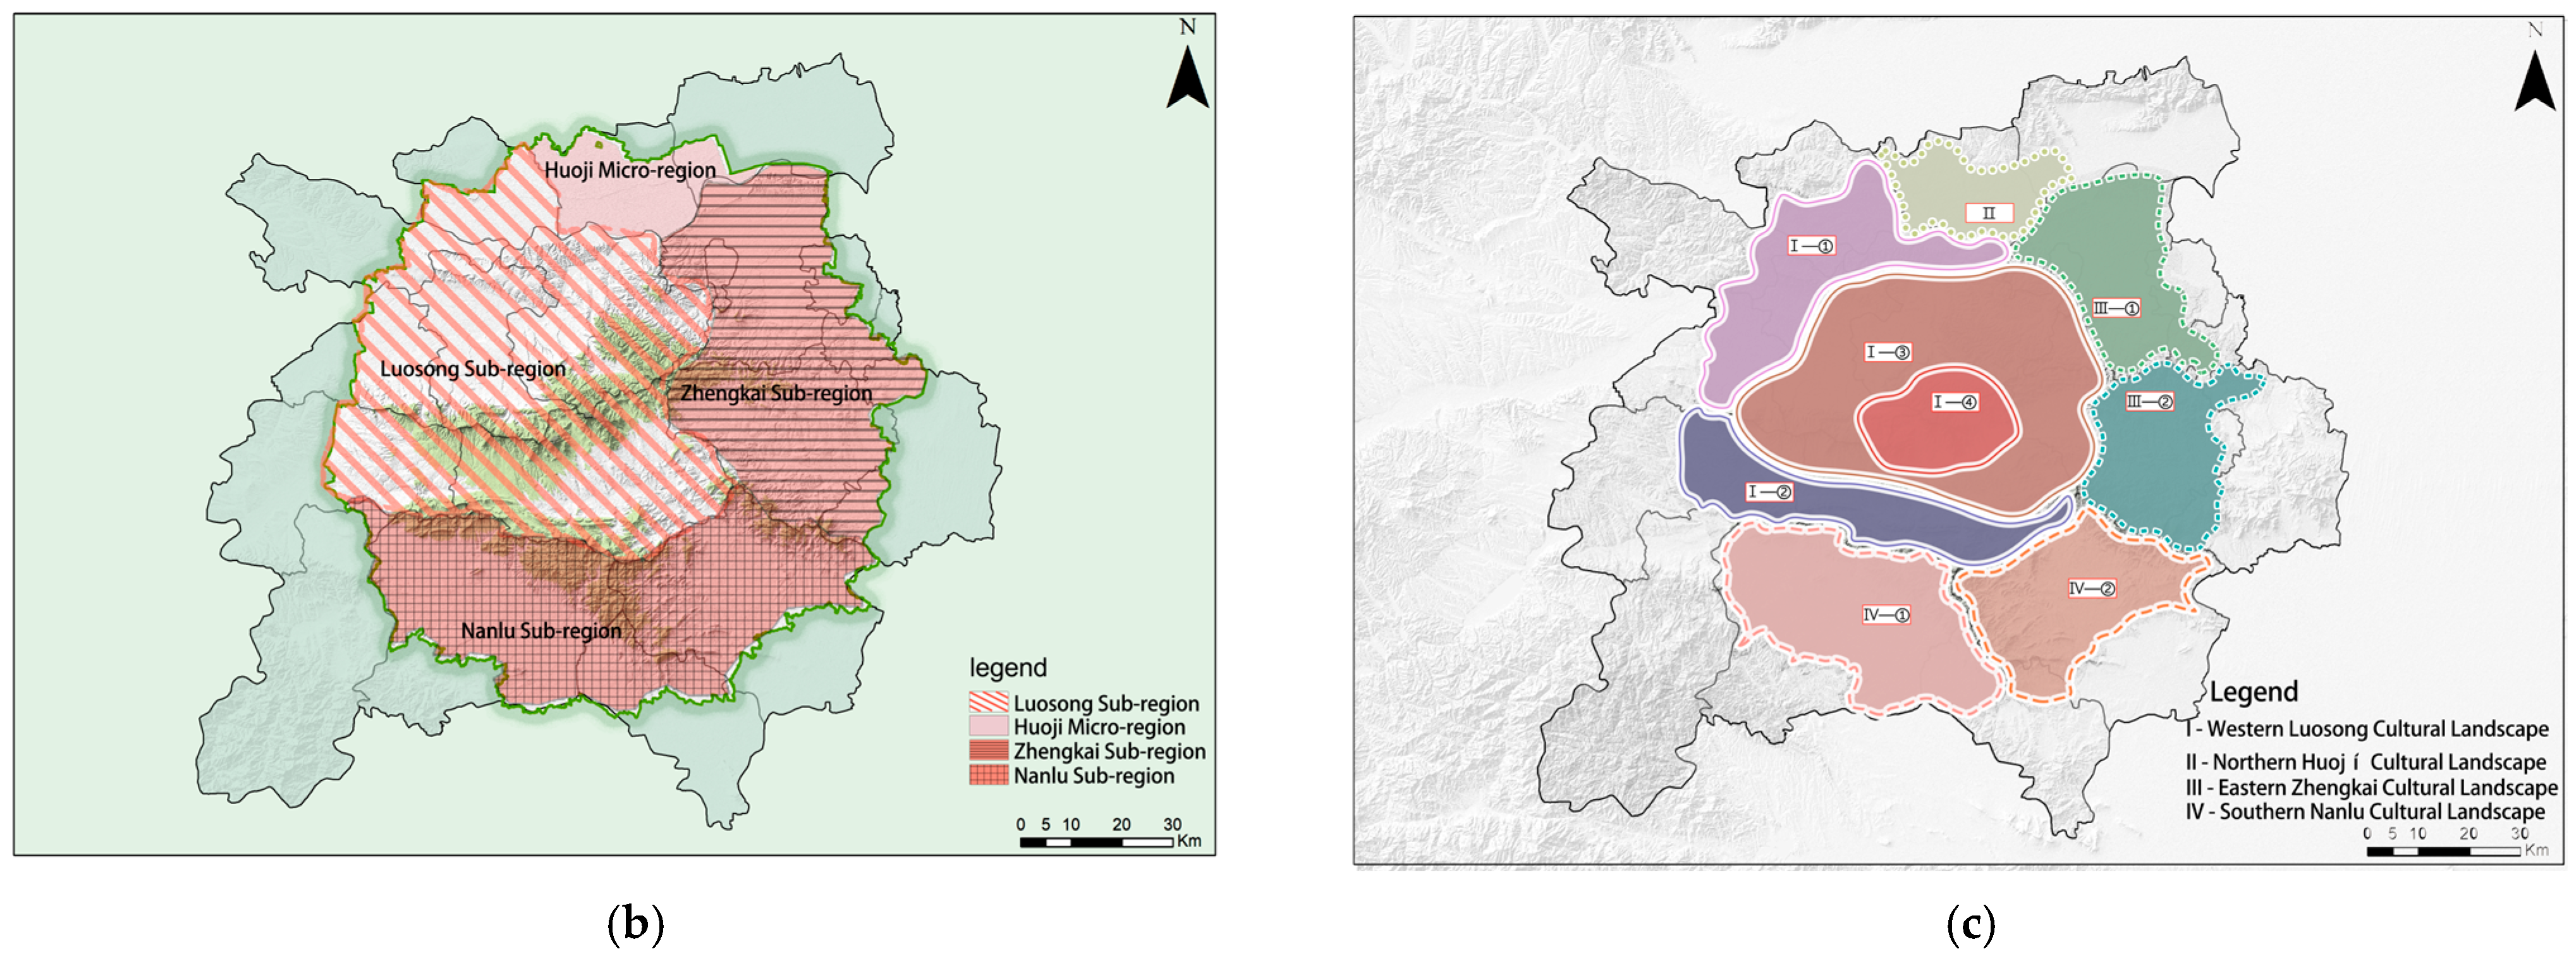
This study integrates quantitative and qualitative methods to refine landscape zoning for the Mount Song Culture Circle. It first analyzes data-type indicators to identify dominant factors and performs hierarchical clustering (Ward’s method, squared Euclidean distance), with the optimal cluster number (k = 4) determined by the elbow method and silhouette analysis. It then incorporates descriptive indicators (topography, elevation, cultural landscape types, ethnic groups/languages/dialects, intangible heritage) through a combined data analysis and map representation approach (Figure 5). The optimal number of clusters (k = 4) was determined through the elbow method and silhouette coefficient analysis, with the final solution achieving an average silhouette width of 0.62, indicating reasonably separated clusters. Using GIS, the clustering results are associated with spatial data, and regional differences in descriptive indicators are overlaid to fine-tune boundaries. The Mount Song Culture Circle is ultimately divided into four cultural regions (I–Luosong, II–Huoji, III–Zhengkai, IV–Nanlu) and nine sub-regions, each exhibiting distinct cultural landscape characteristics.

3.1.3. Evaluation Results of Cultural Landscape Zoning

On the basis of referring to the research findings of relevant scholars [52], the coordination scores are classified, and the overall coordination degree is divided into five types. When c(n) ≤ 0.2, it denotes severe imbalance; when 0.2 < c(n) ≤ 0.4, it indicates moderate imbalance; when 0.4 < c(n) ≤ 0.6, it indicates basic coordination; when 0.6 < c(n) ≤ 0.8, it indicates moderate coordination; and when 0.8 < c(n) ≤ 1, it indicates high coordination (Table 4).
The Songshan Scenic Area has a high coupling coordination degree as a model of nature–culture integration. However, Dengfeng’s cultural landscape shows a “high north, low south” core–periphery structure: the north forms a strongly coordinated core due to Songshan’s topographical barrier, heritage agglomeration, and well-developed infrastructure; the south suffers from topographical barriers, scattered cultural resources, poor accessibility, and lagging development, resulting in spatial fragmentation of ecological, cultural, and urban–rural functions. Corridor network construction can promote a shift from core polarization to network synergy, providing key support for coupled and coordinated natural–cultural–urban–rural space and sustainable development in Dengfeng.

3.2. Construction of the Cultural Heritage Spatial Network

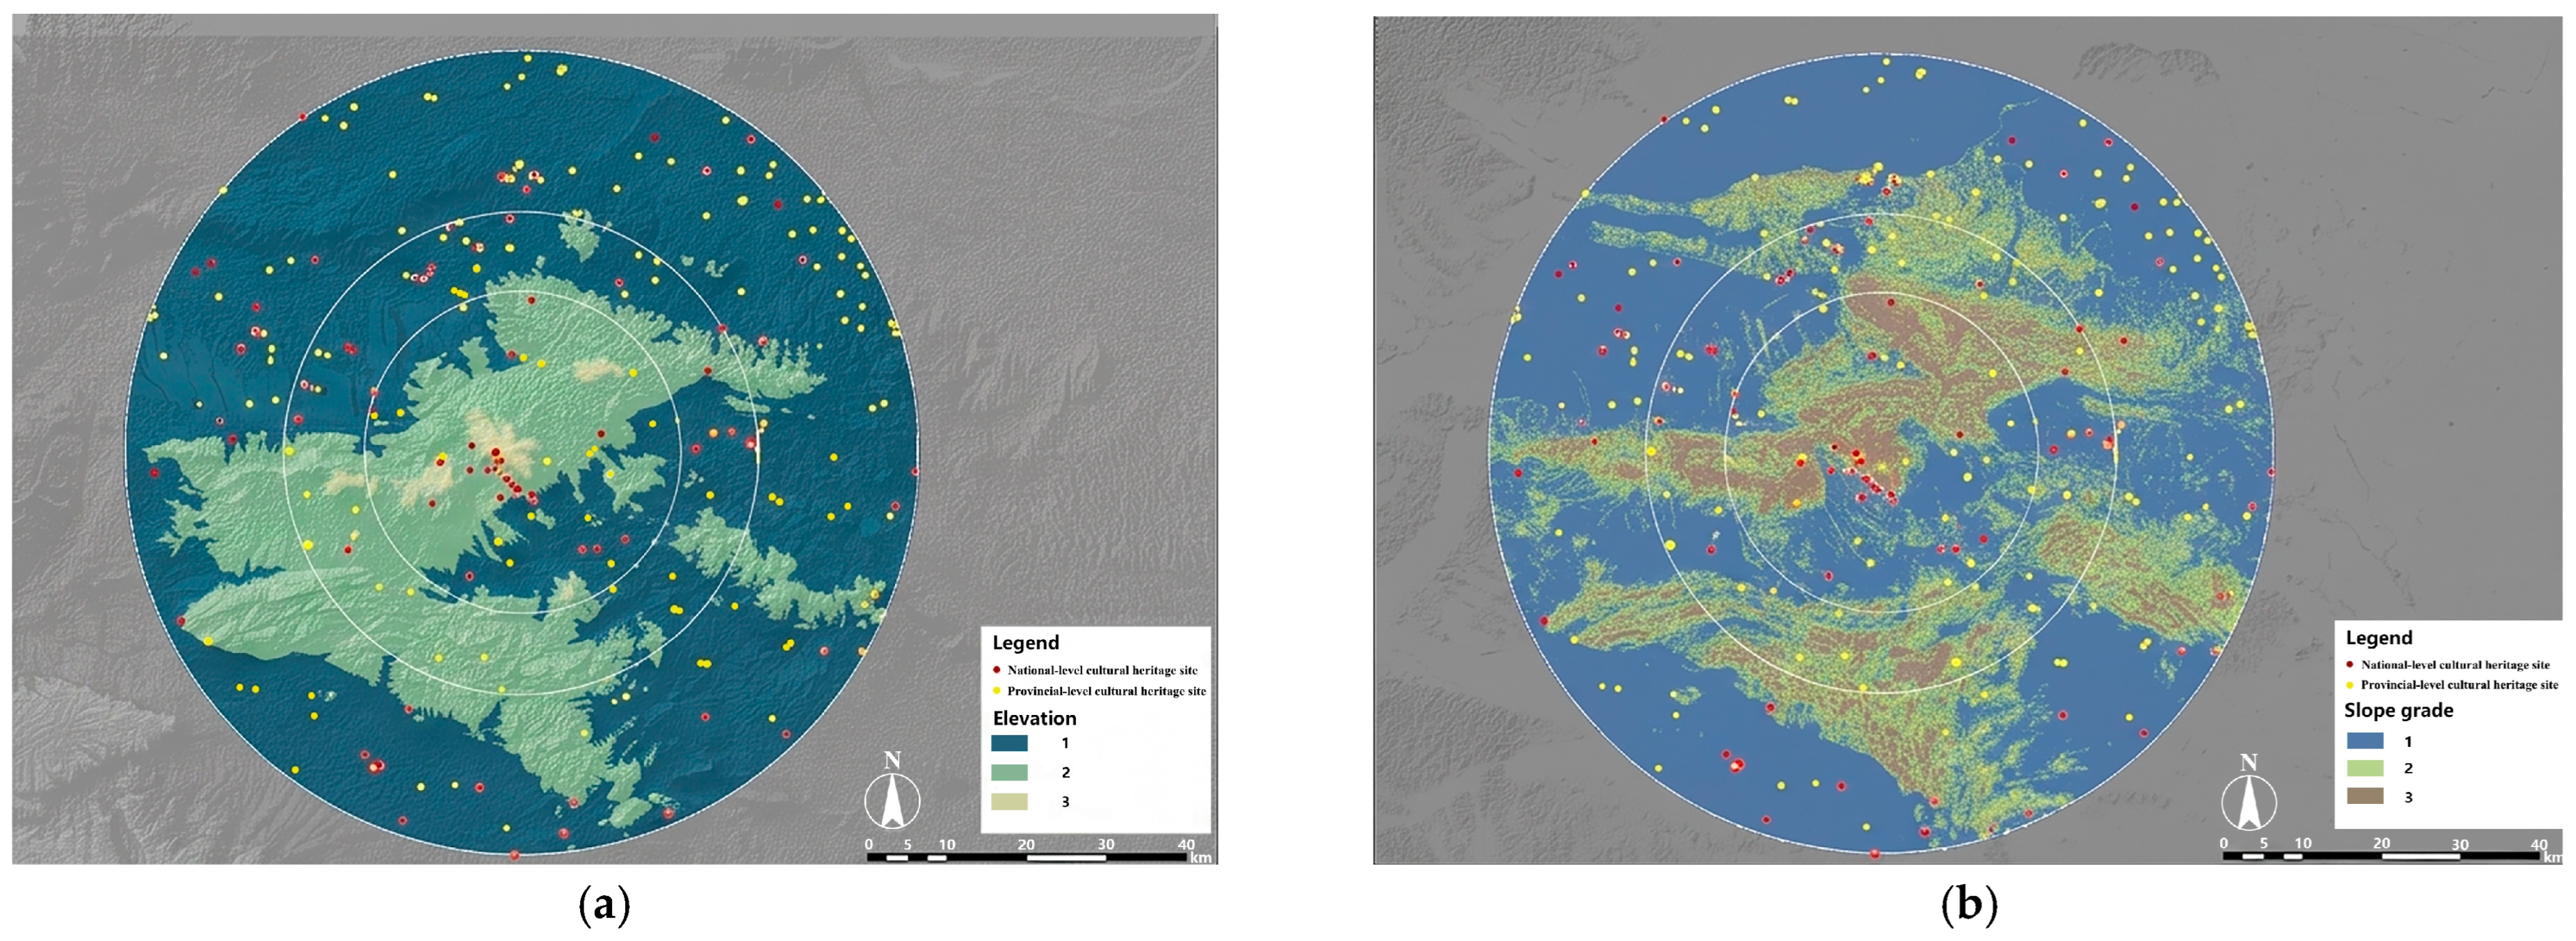
This study determined factor weights for the comprehensive resistance surface through a systematic literature review and entropy-weighted analysis informed by relevant studies [53,54,55,56]. The significant influence of elevation and slope on heritage connectivity in mountainous terrain was verified [57], confirming the factor selection. Heritage resource level emerged as the primary factor affecting cultural heritage protection and development, followed by roads, elevation, and slope as secondary factors, with land use types and rivers being the least important (Table 5). Using the raster calculator in GIS, a weighted calculation was performed on the seven cost rasters, and the results were classified via the natural break method into five suitability levels (high, moderately high, moderate, low, unsuitable), from which potential cultural heritage corridors were generated (Figure 6).
The simulated path of potential cultural heritage corridors is constructed using the minimum cumulative resistance (MCR) model, which calculates the “minimum cost path” between heritage resource points. As there are overlapping paths between some of these points, the potential Dengfeng City cultural heritage corridor network needs to be manually and reasonably selected and optimized. After selecting and comparing the potential cultural heritage corridors based on minimum cumulative resistance thresholds, corridor width suitability (≥500 m), and expert review (n = 5), the Dengfeng City cultural heritage corridor was finally obtained (Figure 7a). The optimized Dengfeng City cultural heritage corridor has the following characteristics:
The areas with relatively dense cultural heritage corridors are near the Songshan area.
The distances between corridors at the first-and second-level cultural heritage sites are relatively short.
The left and right sides of the optimized Dengfeng City cultural heritage corridor are relatively sparse, with its main support points in the middle. Meanwhile, it maintains the necessary connectivity in areas with fewer resources.
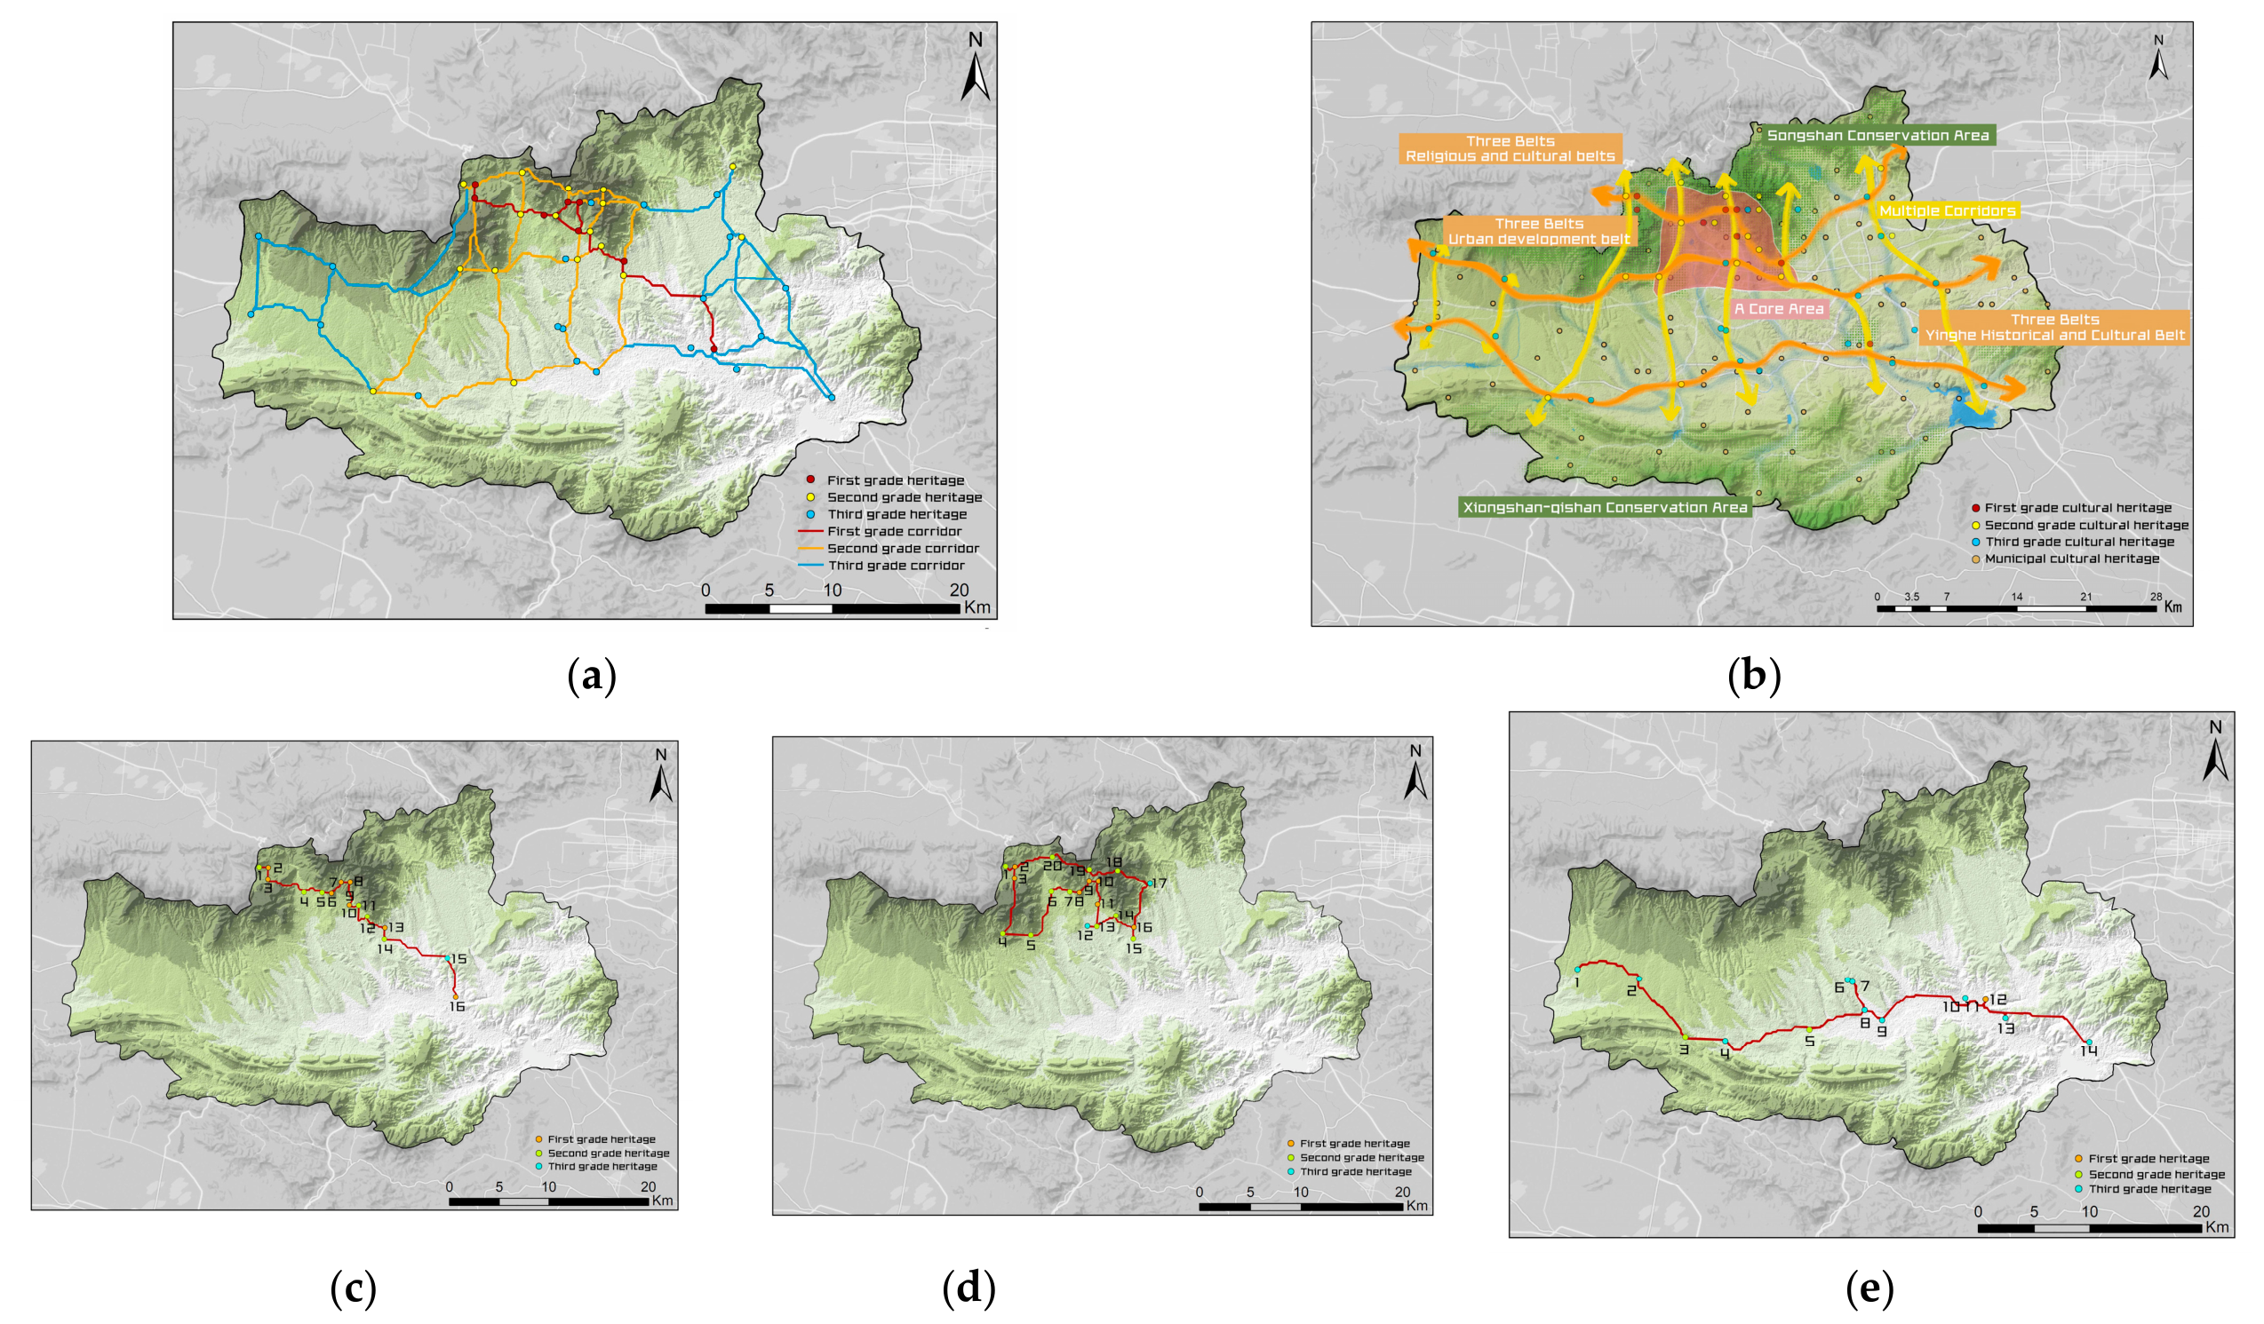
The heritage corridor network of Dengfeng City has ultimately formed a spatial protection pattern for the city’s cultural heritage. It links the eastern and western parts of Dengfeng City, spanning widely from left to right and covering a relatively large area. However, due to the spatial distribution of cultural heritage resource points, the southern area has not been fully covered (Figure 7b).
As a crucial carrier for urban development and cultural presentation, Dengfeng City’s cultural heritage network must include thematic routes, which are indispensable [58]. These routes integrate heritage resources with similar geographical environments, historical backgrounds, and cultural connotations, making heritage protection more systematic and efficient, revealing internal connections, forming a complete cultural context, and enhancing public understanding and recognition through shared cultural backgrounds (Table 6). The selection of the three major thematic paths—culturally themed segments within the broader heritage corridor network—“Seeking Wisdom in the Mountains”, “Searching for Culture in the Scenery”, and “Exploring the City Along the River”—adheres to a dual framework that combines quantitative constraints on resilience thresholds with qualitative verification of cultural narratives.
Cultural theme clustering, based on entropy-weighted cultural value (CVIndex ≥ 0.82) and historical literature, groups nodes with religious functions (Shaolin Temple, Zhongyue Temple) into the “Seeking Wisdom in the Mountains” route, where slope suitability (5–15°) and sacrificial axis integrity (“Que–Temple–Peak”) reach 83%, revealing the spatial gene of sacred mountain worship. Spatial synergy optimization uses the MCR resistance surface and space syntax integration (R2 > 0.78); the “Searching for Culture in the Scenery” path preferentially connects Songyang Academy and the Star Observation Platform, relying on the 300–500 m landscape corridor along the Ying River to enhance academy culture dissemination. Enhancing network resilience, the gravity model simulates marginal zone enhancement (ΔF ≥ 47%); the “Exploring Cities Along the River” approach activates scattered southern resources (Wangchenggang Prehistoric Site) using the Ying River system, reducing basin ecological–cultural resistance by 60% and breaking the “high north, low south” imbalance.
Figure 7. (a) Potential cultural heritage corridor in Dengfeng City; (b) cultural heritage space protection pattern of Dengfeng City; (c) the theme path of asking “Tao” according to “Mountain”; (d) the theme path of looking at the “Scenery” and finding the “Culture”; (e) the theme path of exploring the “City” along the “River”.
Sustainability 18 05429 g007

3.3. Cultural Heritage Spatial Network System Evaluation

A systematic evaluation is conducted on the constructed “Adaptive MCR–Gravity Model” and the optimized heritage corridor network to verify their effectiveness and innovation (Table 7):
Model performance improvement: Compared with the traditional static MCR model, the adaptive model significantly improves the network connection efficiency by introducing a dynamic weight coefficient of cultural value (CVIndex = 0.82, evaluated based on the heritage grade, age, and entropy weight of cultural connotations) and a time decay function (α = 0.05, reflecting the historical stratification effect). Network topology analysis shows that the α index (connectivity) of the optimized corridor network increased from 0.42 to 0.58 (+37%), indicating improved network structure. As these are descriptive network metrics without replicate sampling, formal inferential statistics (confidence intervals, p-values) are not reported; the magnitude of change serves as the effect size.
Spatial optimization effect: The multi-scale resilience optimization framework, integrating “historical stratification effects, ecological substrate constraints, and cultural gravity associations”, effectively addresses the connectivity challenges of heritage nodes in complex mountainous terrains. The optimized corridor network increases heritage node density in the core area (Songshan Scenic Area and adjacent zones) from 0.74 nodes/km2 to 1.12 nodes/km2, enhancing the spatial agglomeration of resources and laying the physical foundation for outward radiation to underdeveloped peripheries.
Corridor function verification: Axial analysis based on space syntax was employed to verify the accessibility and integration of the optimized corridors. The results indicated a significant positive correlation (p < 0.01) between the integration (integration R2= 0.78) of the three major theme corridors (“Seeking Wisdom in the Mountains”, “Searching for Culture in the Scenery”, and “Exploring the City Along the River”) within the network and the cultural dissemination potential. This confirms that the optimized corridors not only enhance physical connectivity but also effectively boost the structural accessibility and dissemination efficiency of cultural heritage values.
Regional balance improvement: The gravity model simulation reveals that the optimized thematic corridor network boosts the cultural gravitational pull of the core area (scenic spots) on the southern region by approximately 47%. Through hierarchical nodes (such as the Fengsi Altar Site and the prehistoric settlement group along the Ying River), it activates the scattered resources in the south, initially breaking the previous “north–high, south–low” pattern and laying the groundwork for the “network synergy” development across the entire region.
The model evaluation comprehensively employs topological analysis, density calculation, space syntax, and gravity simulation to multi-dimensionally verify the remarkable effectiveness and scientific value of the “Adaptive MCR–Gravity Model” in addressing the spatial fragmentation of cultural landscapes, optimizing the structure of heritage networks, and enhancing regional cultural connectivity.

4. Discussion

4.1. The Multi-Factor Synergy Mechanism of the Adaptive MCR Gravity Model

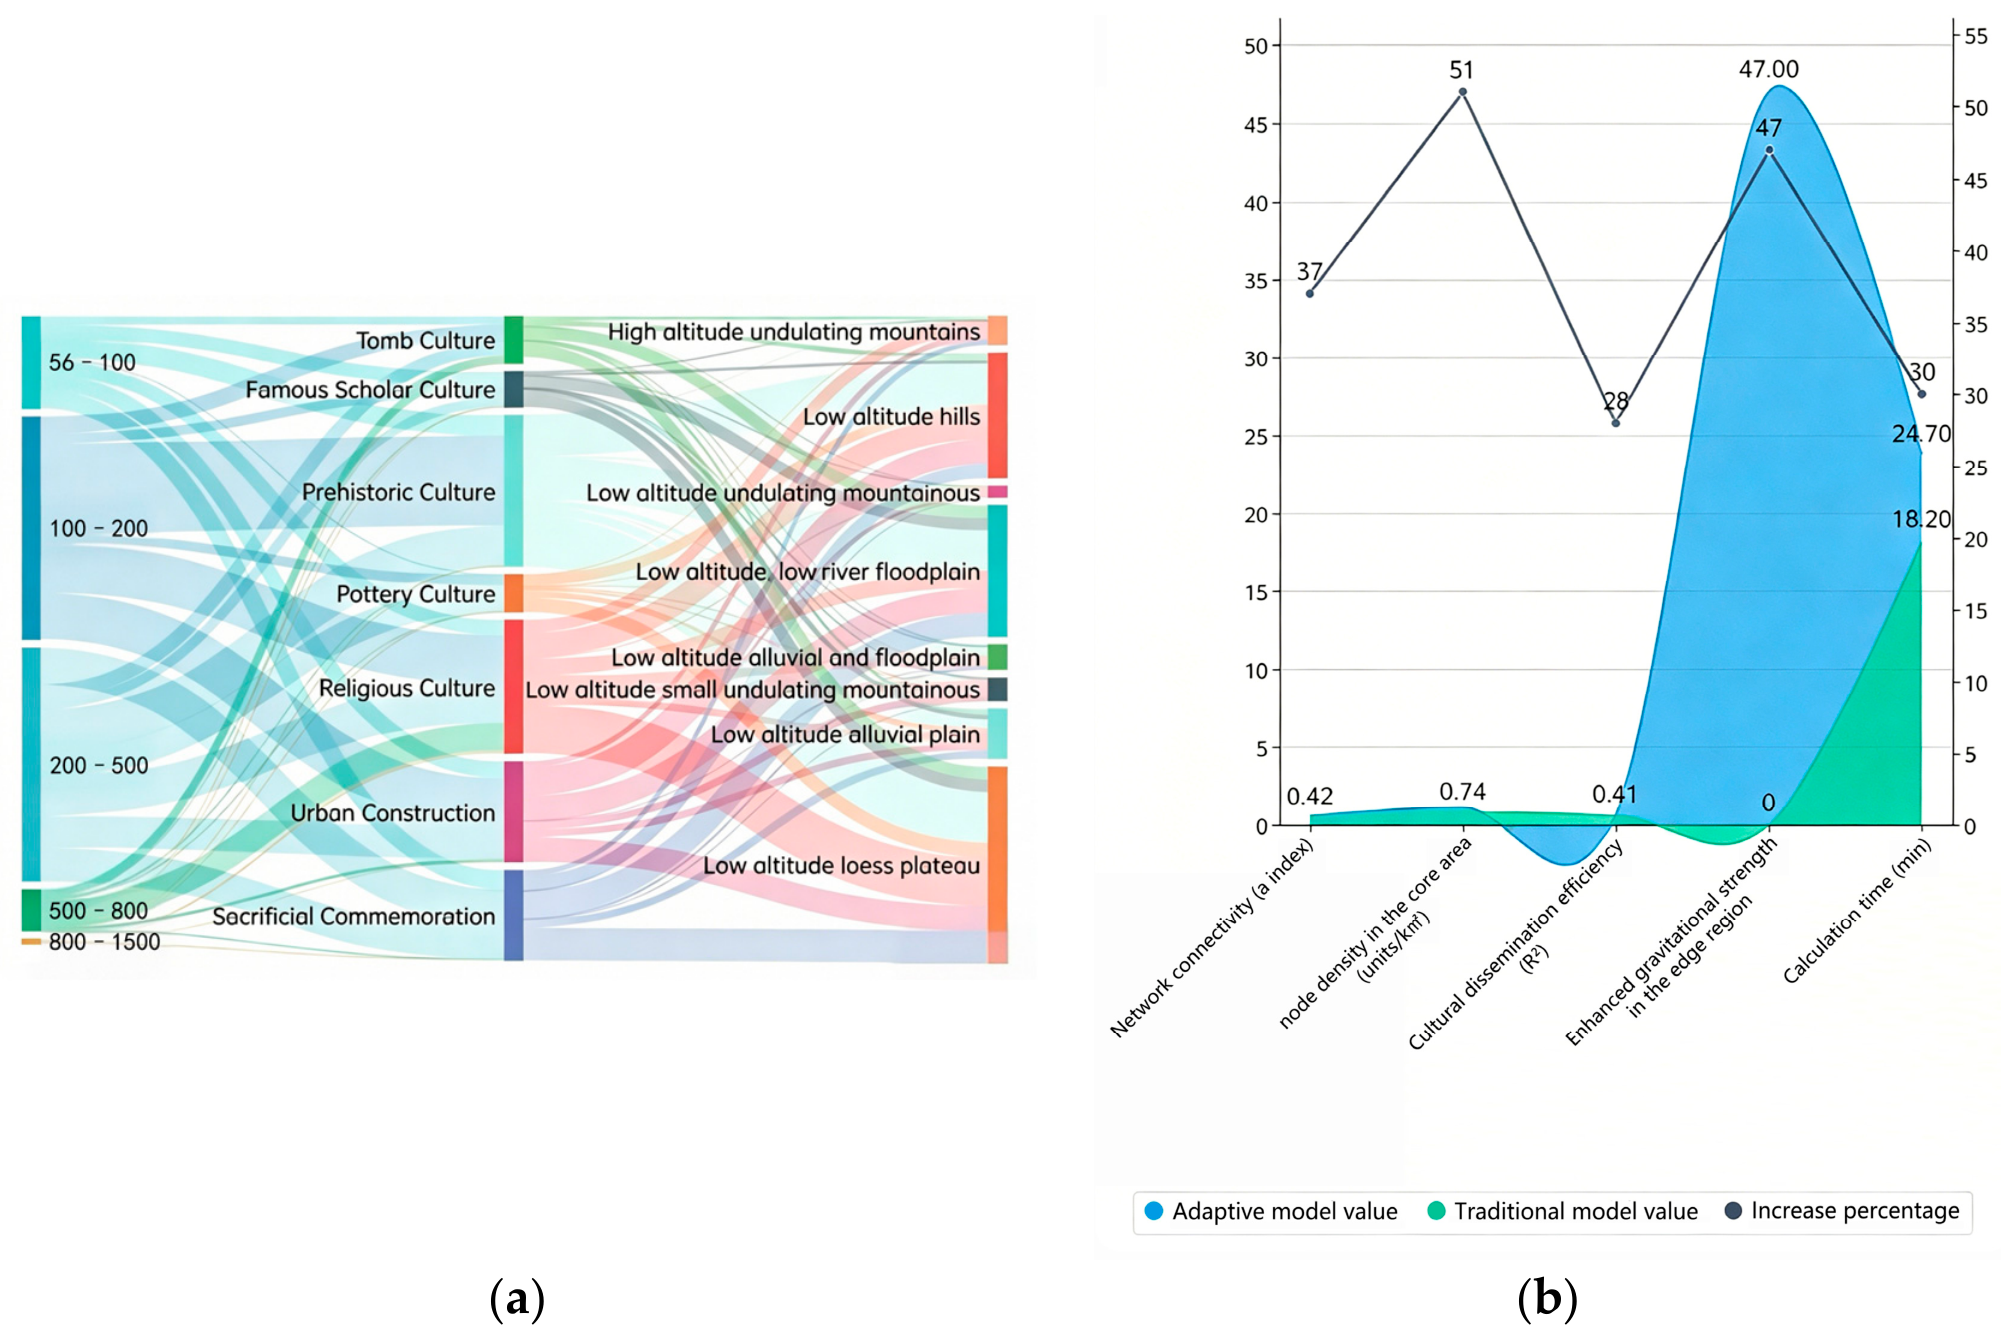
This study’s adaptive MCR gravity model introduces two innovations absent in conventional applications: dynamic cultural value weight (CV_Index = 0.82) and time decay coefficient (α = 0.05). Traditional MCR models treat resistance as spatially homogeneous and temporally static [8,9], whereas our approach quantifies the non-linear temporal attenuation of cultural significance (Wt = 0.0810 for Neolithic Yingyang Site to 0.9162 for Qing Wanglou Watchtower). The 37% improvement in α-index connectivity exceeds the 15–20% gains reported by Chen et al. [55] using conventional MCR in Chaozong Street, suggesting that cultural value-weighted resistance correction is particularly effective in mountainous contexts where topographic constraints (r = 0.548 with elevation) compound fragmentation (Figure 8). Unlike Zhang et al. [54], who treated cultural value as a passive suitability filter in the Yellow River region, our model integrates entropy-weighted CV_Index as an active resistance modifier, shifting the optimization objective from “least ecological cost” to “maximum cultural gravitational efficiency.” (Table 8). This operationalizes Taylor and Albrecht’s [2] conceptualization of resilience as “dynamic equilibrium” through measurable network parameters.

4.2. The Interactive Relationship Between Imbalanced Regional Development and Heritage Networks

The core–periphery disequilibrium in Dengfeng (0.74 nodes/km2 in the north versus fragmented southern distribution) mirrors the “polarized protection” pattern documented by Yue et al. [57] along the Shu Road, where linear heritage corridors similarly failed to penetrate peripheral basins. Yet, our intervention diverges methodologically; whereas Yue et al. [57] employed remote sensing-based ecological resistance surfaces without cultural value differentiation, our adaptive model achieves a 47% gravitational enhancement in the southern Yinghe River Basin by coupling water system proximity (≤500 m buffer) with time decay-adjusted node mass. This result contrasts with Feng et al.’s [34] network construction in Dunhuang, where gravity models improved peripheral connectivity by only 22% despite higher baseline node density, suggesting that Dengfeng’s steeper topographic gradient (62% slopes > 25°) actually amplifies the relative advantage of adaptive resistance correction. The resistance reduction achieved through refined slope/river weighting (0.145–0.15) is comparable to Huang et al.’s [40] mountainous multi-ethnic corridor study in Southwest China, but our integration of space syntax validation (R2 = 0.78) provides an empirical bridge between structural connectivity and perceived accessibility that Huang et al. did not establish. Notably, the “structural transformation” from single-core to multi-centered networking (with ≥40% newly activated southern nodes) challenges Liu and Yang’s [5] earlier assumption that hierarchical “point-line-surface” networks inevitably reproduce core dominance; instead, our thematic routes demonstrate that culturally weighted gravity can redistribute network centrality without requiring equivalent infrastructure investment in peripheries.
This process confirms that the optimization of the heritage network’s resilience relies on the spatial adaptability of “nature–culture”. The water system and gentle slope zones (5–15°) not only serve as the foundation for historical settlements (such as the Yangcheng Ruins) but also act as the spatial link to address the imbalance in regional development.

4.3. The Resilience Mechanism of Network Coupling in Topic Paths

The three thematic paths (“Seeking Wisdom in the Mountains”, “Searching for Culture in the Scenery”, and “Exploring the City along the River”) instantiate “differentiated resilience” that contrasts with existing typologies. Jansen-Verbeke et al. [29] proposed “pattern-process-policy” integration for cultural routes, yet their PAST tool remains qualitative; our CV_Index ≥ 0.82 threshold provides a replicable quantitative entry. The religious path’s “hierarchical radiation” around Jiji Peak (83% slope suitability at 5–15°, Wt > 0.7) operationalizes Zhou’s [44] “que-temple-peak” spatial gene metrically, unlike Garau et al.’s [39] purely narrative assessment in Cagliari.
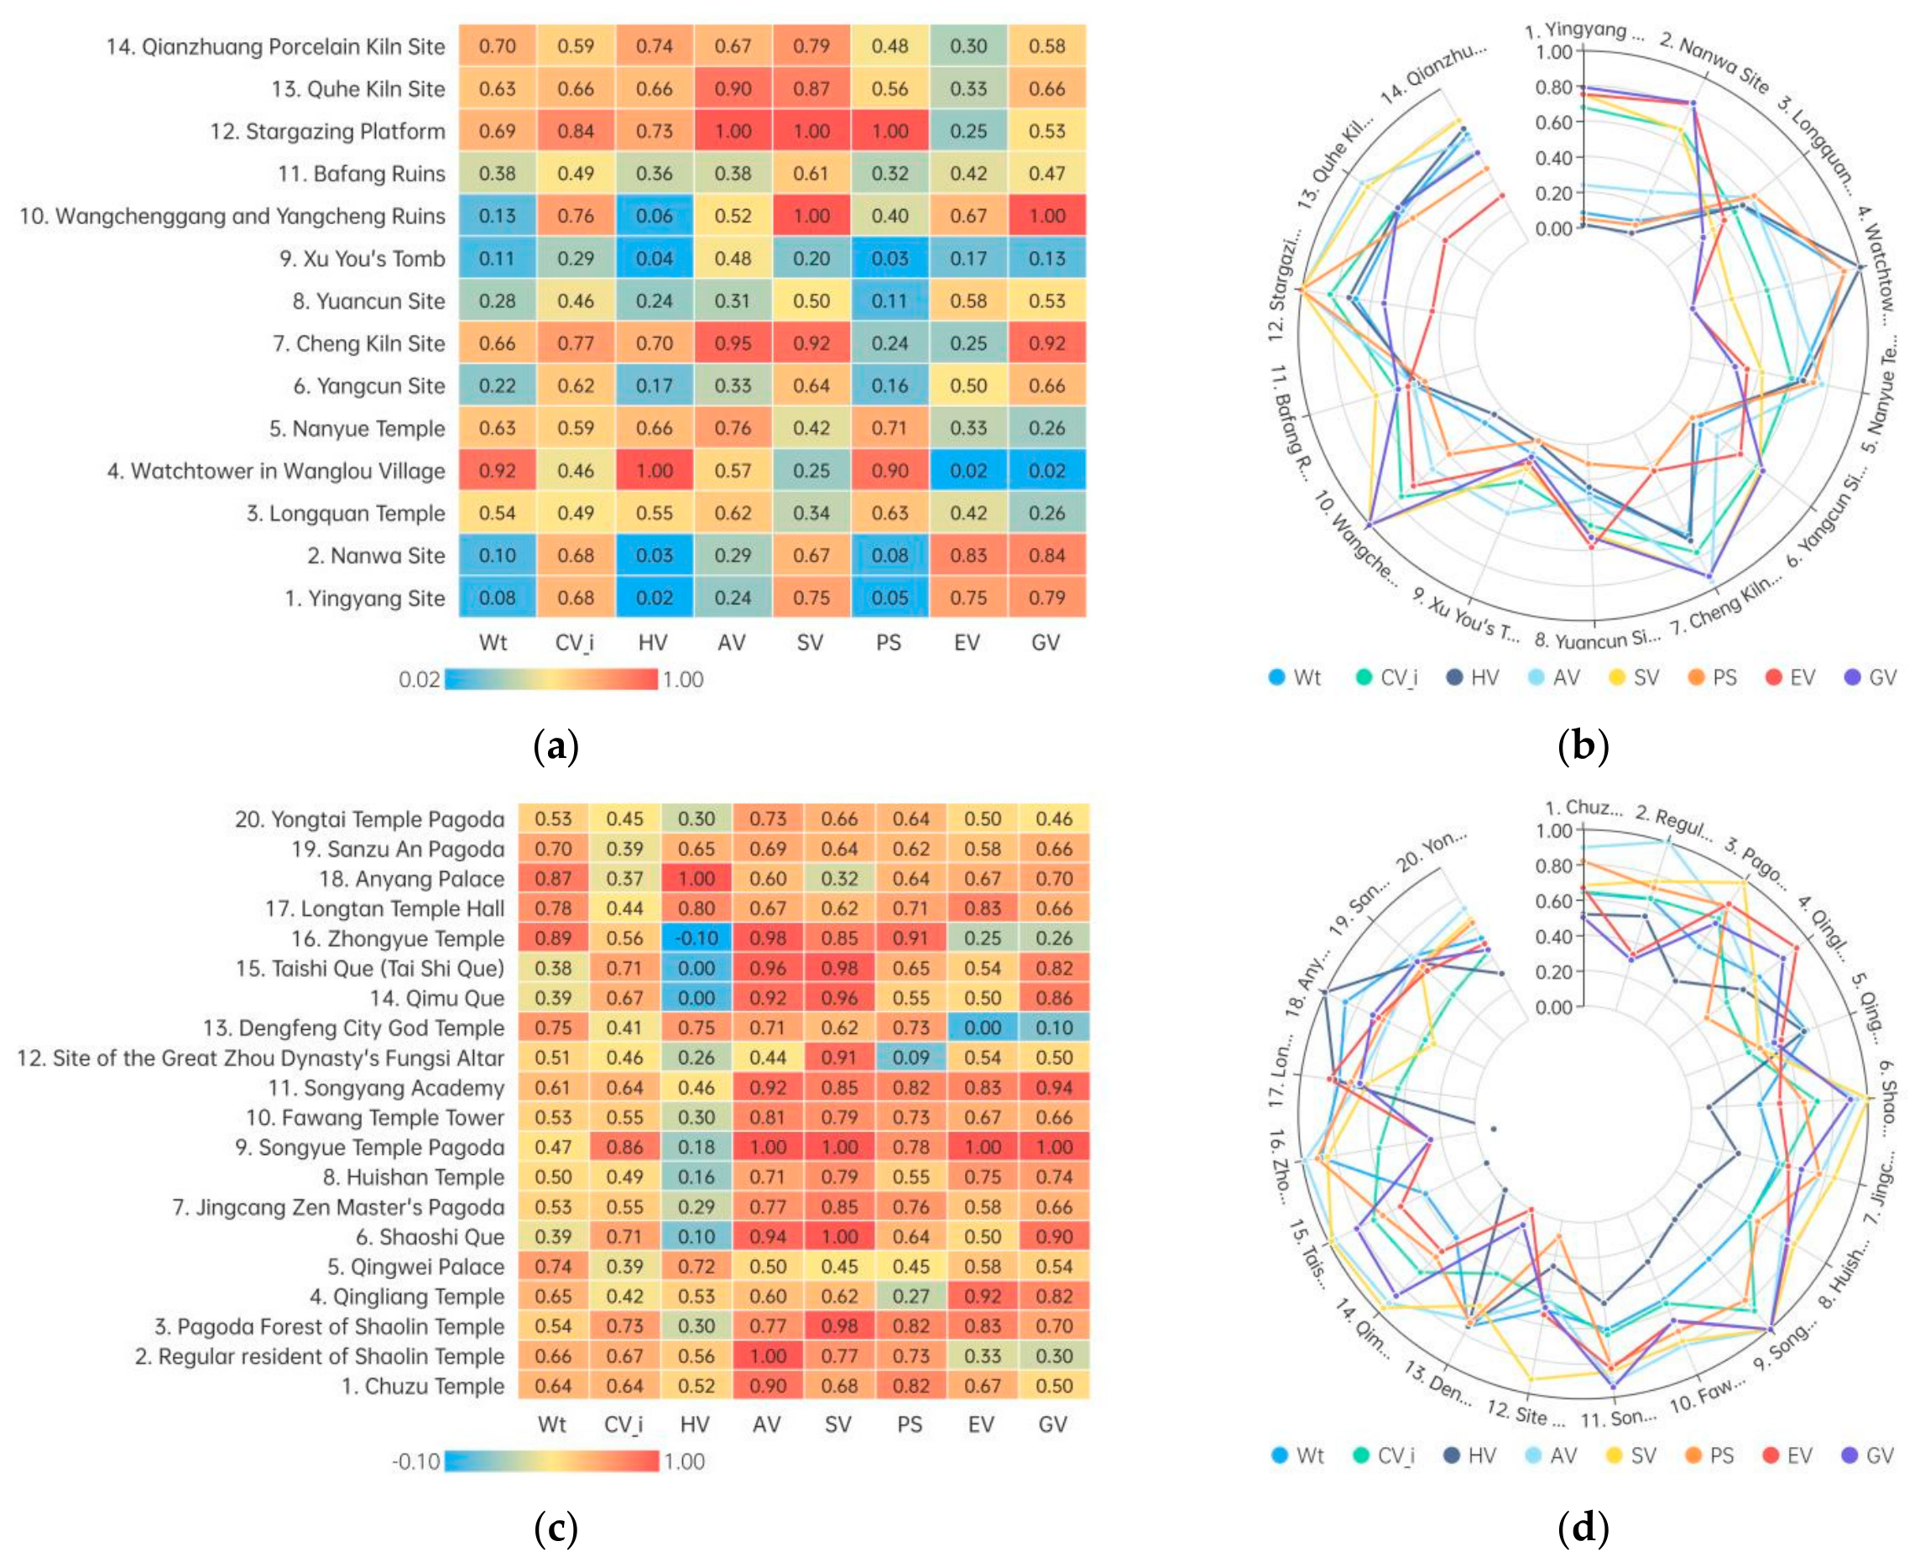
The extreme temporal asymmetry within this path—Wanglou Watchtower (Wt = 0.9162) versus Yingyang Site (Wt = 0.0810)—exposes a tension absent in prior MCR studies; Zhang et al. [54] and Chen et al. [55] treated heritage age as static prestige, whereas our exponential decay penalizes older sites for connectivity potential despite higher nominal value. This is resolved through coupling coordination (D > 0.6); prehistoric sites achieve inclusion via aggregation with high-PS neighbors, as seen in the stone que group (CVi = 0.70–0.83), where shared geological value (>8.5) compensates for temporal attenuation. This aligns with Biro et al.’s [10] finding that landscape legacies persist through “knowledge clusters” rather than isolated nodes.
The academy path’s Ying River visual corridor (300–500 m) and R2 > 0.78 integration validate Jiang et al.’s [41] space syntax approach but extend it by establishing a predictive relationship (p < 0.01) between topological centrality and structural accessibility (Figure 9). This bridges the divergence between physical and topological proximity in mountain landscapes [42]. The settlement path’s activation of ≥40% of southern nodes through water system corridors (D > 0.6) contradicts Ma et al.’s [35] assumption that functional integration requires prior urban–rural coordination; instead, our “Exploring the City Along the River” route leverages existing geomorphology as both a resistance modifier and a narrative carrier.

4.4. Methodological Enlightenment and Application Boundaries

The “cultural landscape zoning-corridor optimization” coupling framework proposed in this study offers three paradigm innovations for the protection of mountainous cultural landscapes:
  • Dynamic weight mechanism: The “CVIndex” of the entropy weight method empowers the quantification of the heterogeneity of heritage values, thus avoiding the deviation caused by the traditional MCR model’s “homogenization” treatment of the cultural dimension.
  • Multi-scale decoupling: By hierarchically coupling the historical stratification effect (time decay function) with the ecological substrate (terrain/water system resistance surface), the problem of scale disconnection between macro-cultural zoning and micro-path optimization is solved.
  • Resilience verification tool: Combining the gravity model (ΔF ≥ 47%) with spatial syntax (R2 = 0.78) enables the collaborative evaluation of network structure and functional efficiency.
However, the application of the model in highly urbanized areas (such as the urban area of Zhengzhou) is limited by the large-scale annihilation of spatial carriers of cultural heritage. In the future, the spatial mapping mechanism of intangible cultural heritages (such as Zen martial arts culture and sacrificial rituals) should be integrated to enhance network adaptability in complex environments.

5. Conclusions

The co-evolution of the Mount Song Culture Circle cultural landscape and heritage corridor reveals the systematic mechanism of the deep mutual feedback between the natural geographical foundation and the human historical process, which can be summarized into the following three aspects:
(1)
Physically, 83% of the heritage is on gentle slopes (200–800 m) of the Taishi and Shaoshi Mountains, forming a “high north, low south” core–periphery structure. Water corridors like the Ying River enabled mountain–water settlement models and served as key network axes.
(2)
Historically, the “Center of Heaven and Earth” cosmology and ritual civilization have defined the cultural landscape. The MCR gravity model validates the “que-temple-peak” sacrificial axis, while Confucianism–Buddhism–Taoism coexistence forms a “mountain-scenery-city” spiritual network reinforcing “heaven-human unity”.
(3)
Three thematic paths (“Seeking Wisdom,” “Searching for Culture,” “Exploring the City”) address heritage islandization, boosting core–periphery cultural connection by 47% and shifting from single-pole polarization to network synergy, offering a paradigm for nature–culture–urban–rural collaborative protection.
In summary, as a core part of Chinese civilization, the landscape evolution of the Mount Song Culture Circle results from the combined effects of natural barriers, sacrificial rituals, and dynastic governance, making it a geographical and historical product. The methodological innovation of the adaptive MCR gravity model provides a spatial optimization framework for enhancing connectivity in fragmented mountainous cultural landscapes. It advances MCR modeling by incorporating entropy-weighted cultural value into resistance surfaces and parameterizing the temporal decay of heritage significance. While it improves measurable connectivity metrics (α-index, node density, integration R2), it does not claim to explain the mechanisms of civilizational continuity—a process beyond spatial analysis. Rather, it offers a replicable approach for comparable contexts, provided parameters are recalibrated locally. In the future, we need to further integrate the spatial mapping of intangible cultural heritage with multi-governance mechanisms to ensure that the civilization gene pool of this “Center of Heaven and Earth” remains vibrant in the new era.

Author Contributions

Conceptualization, H.W. and X.Y.; methodology, H.W., X.Y., and F.K.; software and validation, F.K.; formal analysis and investigation, Z.L. and G.Z.; resources, B.L.; writing—original draft preparation, X.Y.; data curation, G.Z. and H.J.; writing—review and editing, X.Y. and F.K.; visualization, H.J. and B.L.; supervision, Z.L.; project administration, B.L.; funding acquisition, H.W. All authors have read and agreed to the published version of the manuscript.

Funding

This research was funded by the Ministry of Education Youth Fund for Humanities and Social Sciences Project: Research on the Spatiotemporal Evolution Mechanism of Ancient Luoyang Imperial Gardens Based on Cultural Genes (No. 25YJCZH337); the Henan Provincial Key Research and Development Special Project: Research and Application of Simulation System for Dynamic Succession of Cultural Landscape Along the Yellow River Basin of Henan Based on Spatial and Temporal Big Data (No. 241111211500); the 2024 Henan Province Xing Culture Project Cultural Research Special Project: Research on the Protection and Utilization of Rural Red Cultural Heritage in Henan (2024XWH111); and the Henan Xing Culture Project Cultural Research Special ‘Research on Ming Dynasty Prince Mansion Gardens in Henan Based on the Politics of Feudal Princes’ (No. 2024XWH110).

Institutional Review Board Statement

Not applicable.

Informed Consent Statement

Not applicable.

Data Availability Statement

The original contributions presented in this study are included in the article. Further inquiries can be directed to the corresponding author.

Conflicts of Interest

The authors declare no conflicts of interest.

References

  1. UNESCO. World Heritage and Resilience: Bridging Cultural and Natural Heritage Approaches; UNESCO Publishing: Paris, France, 2022. [Google Scholar]
  2. Taylor, K.; Albrecht, J. Cultural Landscapes: Heritage Preservation and Community Resilience; Routledge: Abingdon, UK, 2020. [Google Scholar]
  3. Wang, Y. Conservation model of traditional regional cultural landscape based on landscape fragmentation analysis: A case study of Zhibu Town, Zhuji City, Zhejiang Province. Geogr. Res. 2011, 30, 10–22. (In Chinese) [Google Scholar]
  4. Lane, P.J.; M’mbogori, F.N.; Godana, H.W.; Kuria, M.W.; Kanyingi, J.; Abduba, K.; Mohamed, A.A. Climates of Change in Northern Kenya and Southern Ethiopia: From Scientific Data to Applied Knowledge. Heritage 2025, 8, 352. [Google Scholar] [CrossRef]
  5. Liu, H.; Yang, R. Thinking of establishing the integrated conservation network for natural and cultural heritage sites of China. Chin. Landsc. Archit. 2009, 25, 24–28. [Google Scholar]
  6. Casarotto, A.; Fiorentino, S.; Vandini, M. An Approach to Risk Assessment and Planned Preventative Maintenance of Cultural Heritage: The Case of the Hypogeum Archaeological Siteof Sigismund Street (Rimini, Italy). Heritage 2025, 8, 344. [Google Scholar] [CrossRef]
  7. Xinhua News Agency. The General Office of the CPC Central Committee and the General Office of the State Council have Issued the “Opinions on Strengthening the Protection and Inheritance of Historical and Cultural Heritage in Urban and Rural Construction” [EB/OL]. 30 September 2021. Available online: https://www.gov.cn/gongbao/content/2021/content_5637945.htm (accessed on 12 December 2024). (In Chinese)
  8. Wang, R. Study on the Establishing of the Spatial Network of The Industrial Cultural Landscapes of the Chinese Eastern Railway in Harbin. Master’s Thesis, Harbin Institute of Technology, Harbin, China, 2016. [Google Scholar]
  9. Wang, Z. The Research on The Characteristics of Dengfeng Historical Architecture Features. Master’s Thesis, Lanzhou Jiaotong University, Lanzhou, China, 2017. (In Chinese) [Google Scholar]
  10. Biró, M.; Molnár, K.; Öllerer, K.; Szilágyi, R.; Babai, D.; Molnár, C.; Molnár, Z. Oral history methods can reveal drivers of landscape transformation: Understanding land-use legacies with local and traditional knowledge in Central Europe. People Nat. 2024, 6, 2463–2479. [Google Scholar] [CrossRef]
  11. Yu, C.; Zhou, Z.; Gao, J.; Zhang, X.; Zheng, Q.; Liu, Z.; Ma, Z.; He, W.; Wen, S. Multi-scale comparison of the formation mechanisms in landscape genes of traditional villages. Sci. Rep. 2025, 15, 87145. [Google Scholar] [CrossRef]
  12. Hearn, K.P. Mapping the past: Using ethnography and local spatial knowledge to characterize the Duero River borderlands landscape. J. Rural Stud. 2021, 82, 37–53. [Google Scholar] [CrossRef]
  13. Luo, T.; Huang, T.; Zhang, L.; Xue, L.; Huang, L.K. The Approach of Vernacular Landscape Zoning Based on Spatial Correlation of Ecological and Cultural Spaces. Chin. Landsc. Archit. 2019, 35, 77–82. (In Chinese) [Google Scholar]
  14. Yang, G.; Cen, C.; Ma, X.; Wang, Y.; Guo, Z.; Jiang, T. Integrating Memetics and Gamified Virtual Reality for the Digital Preservation of Cultural Heritage: The Case of Mo Jia Quan. Heritage 2025, 8, 351. [Google Scholar] [CrossRef]
  15. Zeng, Y. Research on Traditional Villages and Vernacular Houses inFuiian Based on Cultural Geography. Ph.D. Thesis, South China University of Technology, Guangzhou, China, 2021. (In Chinese) [Google Scholar]
  16. Song, Z.; Zhao, Y.; Long, B. A Quantitative Methodfor Cultural Landscape Zoning in Traditional Chinese Villages andIts Applications: A case Study based on Chongging. South Archit. 2022, 1–10. (In Chinese) [Google Scholar]
  17. Zhang, J.; Zhao, X.; Guo, J.; Zhao, Y.; Huang, X.; Long, M. Spatio-Temporal Evolution and Driving Factors of Landscape Pattern in a Typical Hilly Area in Southern China: A Case Study of Yujiang District, Jiangxi Province. Forests 2023, 14, 609. [Google Scholar] [CrossRef]
  18. Zhang, R.; Lu, Q. Quantitative Analysis of Distribution Characteristics of Traditional Villages in Guilin and Relevant Influencing Factors. South Archit. 2021, 15–20. (In Chinese) [Google Scholar]
  19. He, D.; Lu, L.; Wang, J.; Zhang, J. Landscape Character Identification in Large-Scale Linear Heritage Areas: A Case Study of Beijing Great Wall Cultural Belt. Landsc. Archit. 2022, 29, 99–106. [Google Scholar]
  20. Liu, Y. Research on Cultural Regionalization and Influencing Factors of Traditional Folk Houses in Quanzhou. Master’s Thesis, Huaqiao University, Quanzhou, China, 2020. [Google Scholar]
  21. Lin, R.; Yang, F.; Zhang, D.; Zou, C.; Zeng, Z.; Li, X. Landscape Feature Extraction and Floristic Division of Traditional Villages in the Minjiang River Basin. South Archit. 2022, 1, 54–60. [Google Scholar]
  22. Gamble, L.H.; Wilken-Robertson, M. Kumeyaay Cultural Landscapes of Baja California’s Tijuana River Watershed. J. Calif. Great Basin Anthropol. 2008, 28, 127–152. [Google Scholar]
  23. Li, W. Preliminary study on landscaperegionalization in China. Geogr. Sci. 1982, 2, 358–367+397–398. [Google Scholar]
  24. Rodoman, B. Russian cultural landscape: Theoretical and practical implications of the concept. Russ. Peasant Stud. 2021, 6, 13–25. [Google Scholar] [CrossRef]
  25. Wang, L. The Research on the Rural Development Typedivision and It’s Landscape Characterisation in Pengshui of Chongqing. Master’s Thesis, Huazhong Agricultural University, Wuhan, China, 2018. (In Chinese) [Google Scholar]
  26. Li, Y. Researching of Traditional Villages and Dwellings in Shaoguan Area Basing on the Cultural Geography. Master’s Thesis, South China University of Technology, Guangzhou, China, 2021. [Google Scholar]
  27. Huang, S. A Study on the Spatial Differentiation of Traditional Villages and Residential Spaces in Zhangzhou from the Perspective of Cultural Landscape. China Urban Planning Society, Chengdu Municipal Government. Spatial Governance for High-Quality Development. In Proceedings of the 2021 China Urban Planning Annual Conference (16 Rural Planning); China Architecture & Building Press: Beijing, China, 2021; p. 9. (In Chinese) [Google Scholar]
  28. Li, J.; Yang, D.; Xiao, D. A Quantitative Study on the Cultural Landscape Division of the Traditional Settlements and Vernacular Dwellings in Hainan Island. Dev. Small Cities Towns 2020, 38, 39–48. [Google Scholar]
  29. Jansen-Verbeke, M.; Priestley, G.K.; Russo, A.P. Cultural Resources for Tourism: Patterns, Processes and Policies; Nova Science Publishers: New York, NY, USA, 2008; pp. 120–124. [Google Scholar]
  30. Ding, S. A Study in the Construction of a City’s Historical and Cultural Landscape Network, Based on the Patch-Corridor Theory-Take Traditional-Landscape-Clustered Area in Hangzhou’s Old Town as an Example. Master’s Thesis, Zhejiang University, Hangzhou, China, 2012. [Google Scholar]
  31. Yu, K.; Xi, X.; Li, D. On the construction of the national linear culture heritage network in China. Hum. Geogr. 2009, 24, 11–16+116. [Google Scholar]
  32. Chen, Z.; Chen, L.; Tan, L. Research on the Construction of Spatial Network of Well Salt Cultural Heritage under Regional Coordinated Development: A Case Study of Zigong. Chin. Landsc. Archit. 2023, 39, 124–130. [Google Scholar]
  33. Lin, F.; Zhang, X.; Ma, Z.; Zhang, Y. Spatial structure and corridor construction of intangible cultural heritage: A case study of the Ming Great Wall. Land 2022, 11, 1478. [Google Scholar] [CrossRef]
  34. Feng, B.; Ma, Y. Network construction for overall protection and utilization of cultural heritage space in Dunhuang City, China. Sustainability 2023, 15, 4579. [Google Scholar] [CrossRef]
  35. Ma, Y.; Chen, L.; Guan, Z. Construction of the Synergistic Protection System for Ecological Protection and Cultural Heritage Protection in the Context of Territorial Spatial Planning—A Case Study of Foshan City. Chin. Landsc. Archit. 2024, 40, 106–112. (In Chinese) [Google Scholar]
  36. Guan, Z.; Chen, S. Study on the Safety Pattern of Local Cultural Landscape and the Construction of Heritage Corridor—Taking in Yongtai, Fujian as an Example. Chin. Landsc. Archit. 2020, 36, 96–100. (In Chinese) [Google Scholar]
  37. Wang, Z. Research on the Construction of Spatial Network of Traditional Village Clusters in Yuanshui River Basin of Wuling Mountain Area under the Guidance of Integrated Protection. Master’s Thesis, Huazhong Agricultural University, Wuhan, China, 2020. [Google Scholar]
  38. Wang, L.; Tao, L.; Zhang, L.; Li, J. Study on cultural corridor extent calculation andthe construction of its tourism spatial structure—A Case Study of the Southwestern Silk Road. Hum. Geogr. 2012, 27, 36–42. [Google Scholar]
  39. Garau, C.; Annunziata, A.; Yamu, C. The multi-method tool ‘PAST’for evaluating cultural routes in historical cities: Evidence from Cagliari, Italy. Sustainability 2020, 12, 5513. [Google Scholar]
  40. Huang, Y.; Shen, S.; Hu, W.; Li, Y.; Li, G. Construction of cultural heritage tourism corridor for the dissemination of historical culture: A case study of typical mountainous multi-ethnic area in China. Land 2022, 12, 138. [Google Scholar] [CrossRef]
  41. Liu, H.; Paerhati, R.; Tuluxun, N.; Halike, S.; Wang, C.; Yan, H. Integrating Social Network and Space Syntax: A Multi-Scale Diagnostic–Optimization Framework for Public Space Optimization in Nomadic Heritage Villages of Xinjiang. Buildings 2025, 15, 2670. [Google Scholar]
  42. Karimi, A.; Brown, G. Measuring spatial connectivity for cultural heritage networks using space syntax. Environ. Plan. B Urban Anal. City Sci. 2021, 48, 2625–2642. [Google Scholar]
  43. Wu, Y.; Zhu, H.; Li, J.; Wu, X. Identification and grading evaluation of the spatial pattern of intangible cultural heritage tourism corridors in the Yangtze River National Cultural Park. Geogr. Res. 2025, 44, 2429–2449. (In Chinese) [Google Scholar]
  44. Zhou, K.; Zhang, S.; Zhang, Z.; Yang, R.X.; Cai, Q.F. On Mountain Song Culture Circle. Cult. Relics Cent. China 2005, 1, 12–20. [Google Scholar]
  45. Kaifeng Area Cultural Management Committee; Xinzheng County Cultural Management Committee. The Peiligang Neolithic Site in Xinzheng, Henan. Archaeology 1978, 73–79, 145–146. [Google Scholar]
  46. (Han Dynasty) Sima Qian. Records of the Grand Historian: Basic Annals; Sanqin Publishing House: Xi’an, China, 2008. [Google Scholar]
  47. Zhou, K.; Qi, A. Stratum: Environment, Mountain Song Cultural Circle. In Studies on Chinese Civilization and Songshan Civilization; Science Press: Beijing, China, 2009; Volume 1, p. 25. (In Chinese) [Google Scholar]
  48. Sun, W.; Rong, T. Study on the Composition and Characteristics of Cultural Heritage in Songshan Area. Res. Herit. Preserv. 2018, 3, 10–17. [Google Scholar]
  49. Tang, X.; Zhou, K.; Wang, Y. Research on the Value and Protection Management of Mountain and River Sacrifice Cultural Relics in the Five Great Mountains Scenic Protection Areas. China Anc. City 2020, 47–54. (In Chinese) [Google Scholar]
  50. Zhang, C. Classification and Advantage Analysis of Henan Cultural Tourism Resources. Acad. J. Zhongzhou 2018, 80–83. [Google Scholar]
  51. Zhang, L.; Qi, W.; Du, T.; Zhang, Y. Evaluation of land multifunctional use based on entropy weight method: A case study of Zibo City. Jiangsu Agric. Sci. 2020, 48, 31–36. (In Chinese) [Google Scholar]
  52. Zhang, P. Study on Rural Space Optimization in Hilly Areas Based on "Production-living−ecological" Spatial Coordination—A Case Study of Egong Town, Dingnan County. Master’s Thesis, East China University of Technology, Nanchang, China, 2020. (In Chinese) [Google Scholar]
  53. Yao, L.; Gao, C.; Zhuang, Y.; Yang, H.; Wang, X. Exploring the Spatiotemporal Dynamics and Simulating Heritage Corridors for Sustainable Development of Industrial Heritage in Foshan City, China. Sustainability 2024, 16, 5605. [Google Scholar] [CrossRef]
  54. Zhang, H.; Wang, Y.; Qi, Y.; Chen, S.; Zhang, Z. Assessment of Yellow River region cultural heritage value and corridor construction across urban scales: A case study in Shaanxi, China. Sustainability 2024, 16, 1004. [Google Scholar] [CrossRef]
  55. Chen, Z.; Liu, S.; Liao, W.; Zhang, J. Construction of security pattern for historical districts in cultural landscape based on MCR model: A case study of Chaozong Street, Changsha City. Sustainability 2023, 15, 10619. [Google Scholar] [CrossRef]
  56. Li, H.; Zhang, T.; Cao, X.; Yao, L. Active Utilization of Linear Cultural Heritage Based on Regional Ecological Security Pattern along the Straight Road (Zhidao) of the Qin Dynasty in Shaanxi Province, China. Land 2023, 12, 1361. [Google Scholar] [CrossRef]
  57. Yue, F.; Li, X.; Huang, Q.; Li, D. A framework for the construction of a heritage corridor system: A case study of the Shu Road in China. Remote Sens. 2023, 15, 4650. [Google Scholar] [CrossRef]
  58. Zhang, T.; Yang, Y.; Fan, X.; Ou, S. Corridors construction and development strategies for intangible cultural heritage: A study about the Yangtze River economic belt. Sustainability 2023, 15, 13449. [Google Scholar] [CrossRef]
Figure 1. Research thinking framework.
Sustainability 18 05429 g001
Figure 2. (a) Range of study; (b) distribution of cultural heritage; (c) the map of the five mountains and four rivers; (d) the relationship between mountains and rivers.
Sustainability 18 05429 g002aSustainability 18 05429 g002b
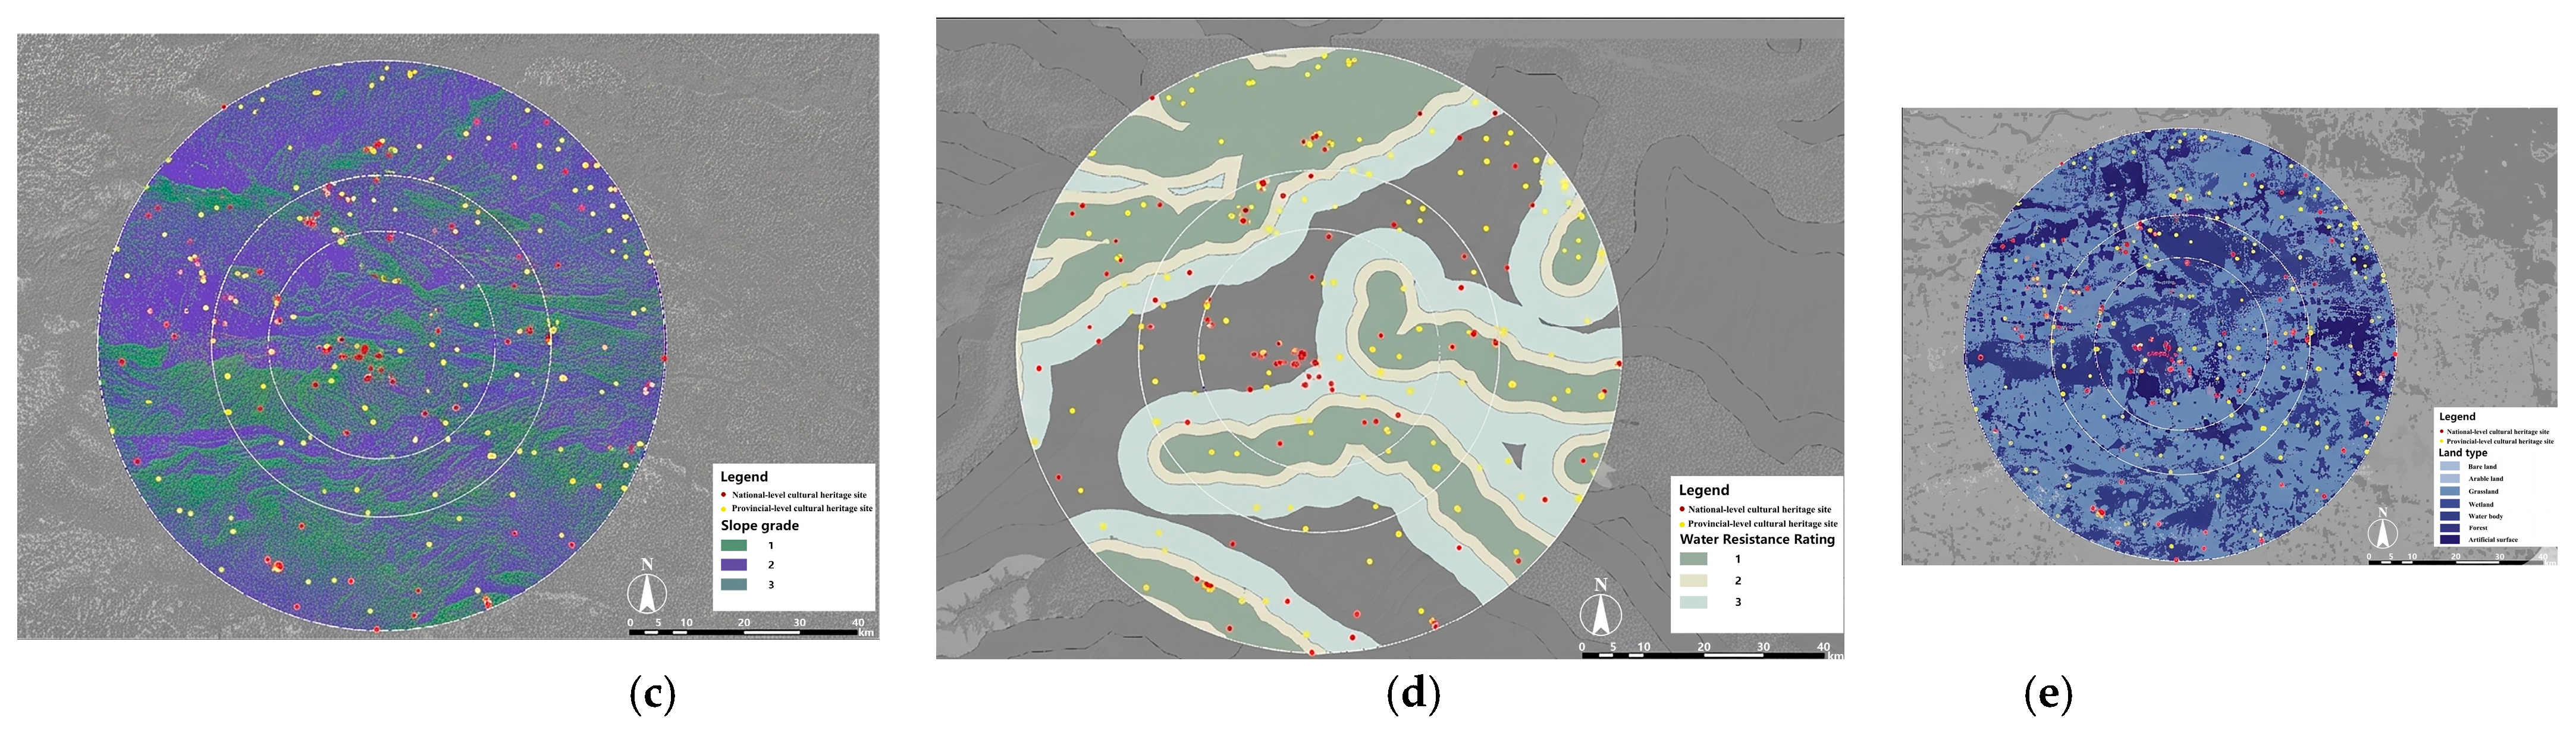
Figure 3. (a) Topography and landforms; (b) elevation; (c) distance from water; (d) watershed hierarchy; (e) mountain relationship; (f) water body relationship; (g) slope aspect; (h) slope gradient; (i) initial construction era; (j) humanistic value; (k) typology; (l) hierarchy.
Sustainability 18 05429 g003aSustainability 18 05429 g003bSustainability 18 05429 g003c
Figure 4. Research method flowchart.
Sustainability 18 05429 g004
Figure 5. Using GIS analysis tools to correlate the clustering data-based results. (a) Cultural landscape topography, cultural landscape elevation, and cultural landscape kernel density; (b) dialect zoning of cultural landscape; (c) sub-zoning of cultural landscape.
Sustainability 18 05429 g005aSustainability 18 05429 g005b
Figure 6. Potential cultural heritage corridor extraction in Dengfeng City: (a) elevation analysis; (b) slope analysis; (c) aspect analysis; (d) water leaving analysis; (e) land use analysis.
Sustainability 18 05429 g006aSustainability 18 05429 g006b
Figure 8. (a) Map of the coupling relationship between landform, elevation, and culture; (b) performance comparison chart of traditional MCR vs. adaptive MCR gravity model.
Sustainability 18 05429 g008
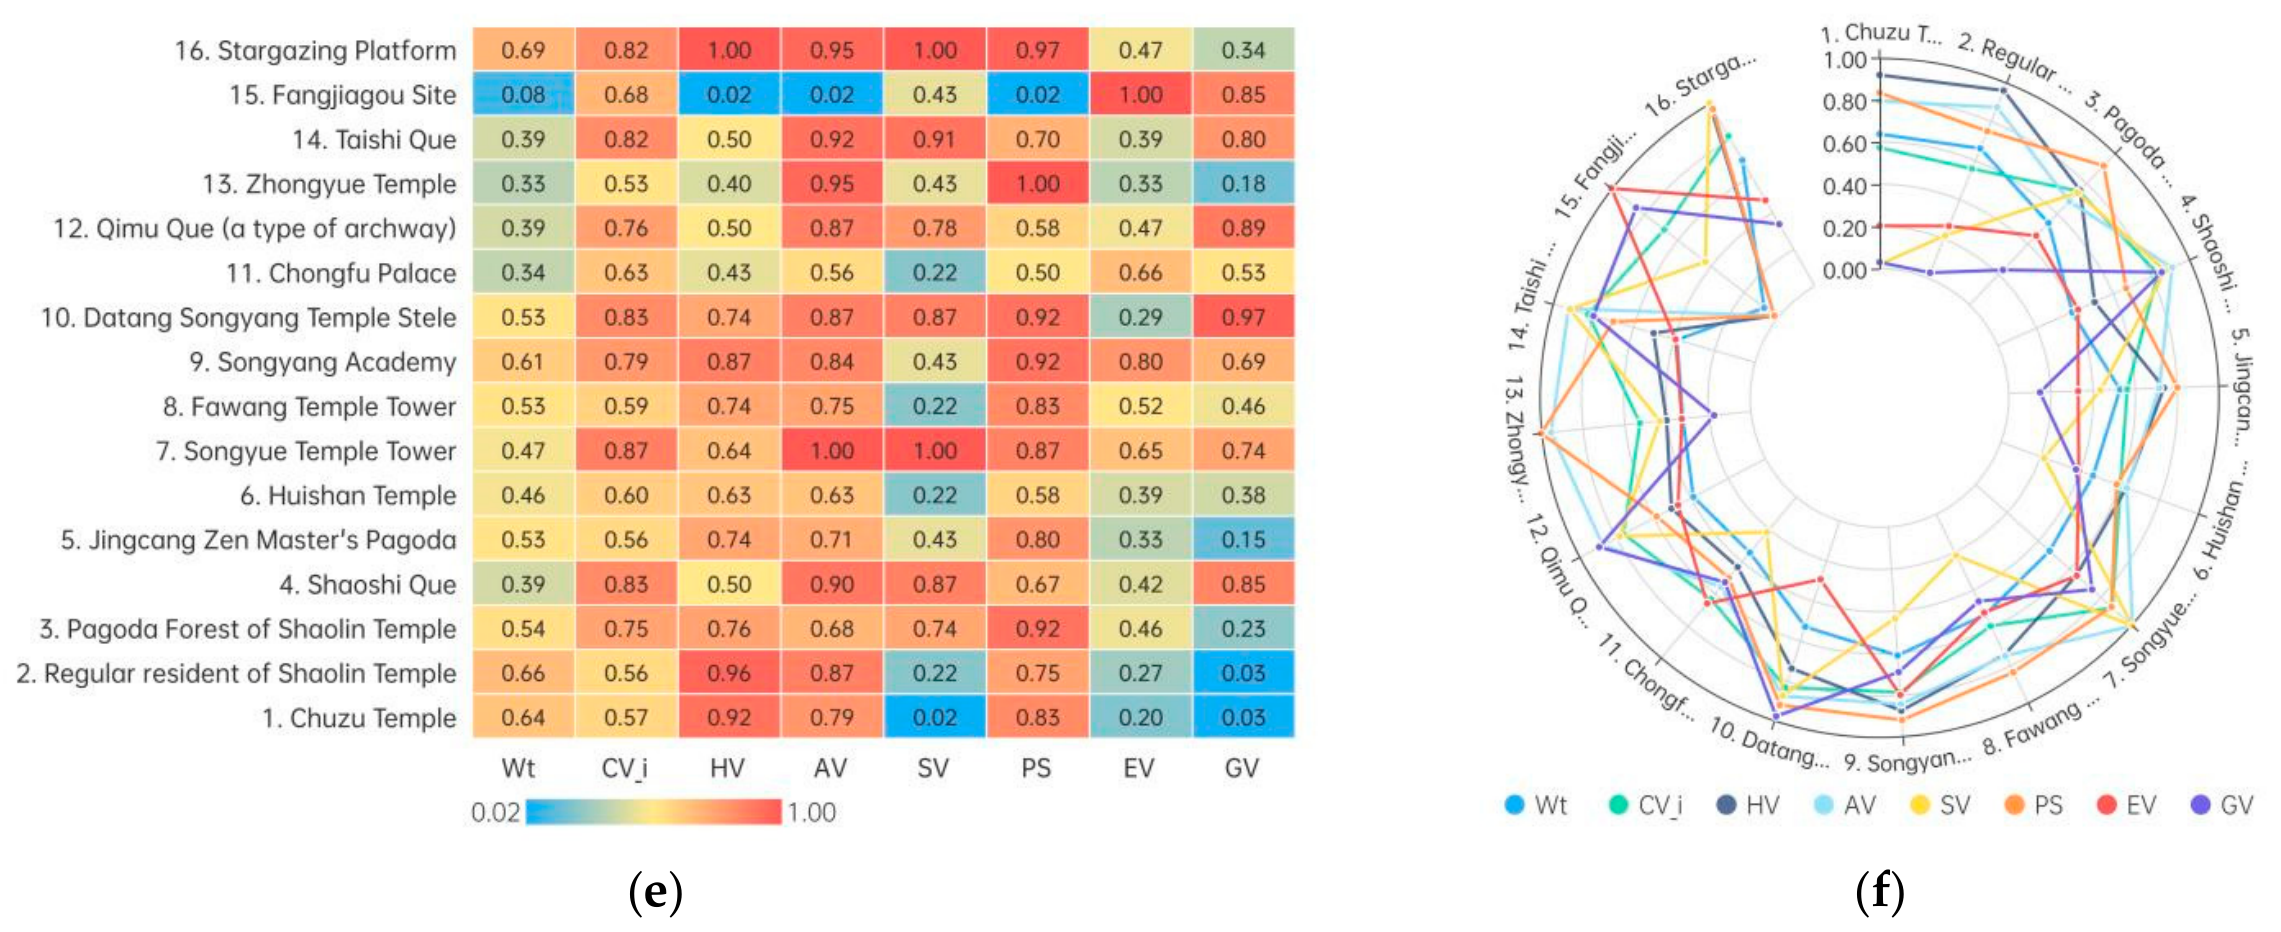
Figure 9. (a) Ask “Tao” according to the “Mountain” corridor Cartesian heatmap; (b) polar coordinate line chart of the ‘Ask “Tao” according to the “Mountain” Corridor’; (c) ‘Look at the “Scenery” and find the “Culture”’ corridor Cartesian heatmap; (d) polar coordinate line chart of the ‘Look at the “Scenery” and find the “Culture”’; (e) ‘Explore the “City” along the “River”’ corridor Cartesian heatmap; (f) polar coordinate line chart of the ‘Explore the “City” along the “River”’. 1 Indicators and weights (based on the prior entropy weight method normalized weights): Wt (time decay effect), (cultural value score), HV (historical value), AV (artistic value), SV (scientific value), PS (preservation status), EV (ecological value), GV (geological value).
Sustainability 18 05429 g009aSustainability 18 05429 g009b
Table 1. Selection of cultural landscape factors.
CategoryCultural Landscape Factor TypeCultural Landscape Subfactor Types
Physical GeographyTopography and LandformsLow-altitude alluvial–proluvial plains, low-altitude floodplains, low-altitude proluvial plains, low-altitude proluvial terraces, low-altitude loess plateaus, low-altitude hills, low-altitude small undulating mountains, low-altitude medium undulating mountains, mid-altitude large undulating mountains
ElevationH < 100 m, 100 ≤ H < 200 m, 200 m ≤ H < 500 m, 500 m ≤ H < 800 m, 800 m ≤ H
Distance from WaterD < 300 m, 300 m ≤ D < 500 m, 500 m ≤ D < 800 m, 800 m ≤ D < 1500 m, 1500 m ≤ D
Secondary WatershedYellow River Basin, Huai River Basin
Mountain RelationshipNon-mountain type, back-hill type, piedmont type, mid-slope type, summit type
Water Body RelationshipNo water system, point-type, single-side type, double-side type, surrounding type
Slope AspectSemi-sunny slope, semi-shady slope, flat slope, sunny slope, shady slope
Slope Gradient0–0.5° (flat land), 0.5–2° (gentle slope), 2–5° (moderate slope), 5–15° (slope), 15–35° (steep slope), 35–55° (cliff slope), >55° (vertical cliff)
Human FactorsConstruction EraPre-Qin, Wei–Jin, Sui–Tang, Song–Yuan, Qin–Han, Ming–Qing
Functional CategoryEducation/science/culture, production/livelihood, religious belief, monument/inscription, municipal administration, military defense
HierarchyNational-level, provincial-level
Humanistic ValueHistorical value (HV), artistic value (AV), scientific value (SV), preservation status (PS), ecological value (EV), geological value (GV)
Table 2. Evaluation indicator system for the cultural landscape of the Songshan Cultural Circle.
Target LevelFactor LevelCriterion LevelIndicator LevelUnitIndicator DescriptionDirection
Cultural Landscape of Songshan Cultural Circle (A) Physical subsystem (B1)Mountain Landscape (B1)Topography and Landforms (C1)_Describes surface morphological characteristicsPositive
Elevation (C2)mIndicates terrain elevationPositive
Mountain Relationship (C3)_Describes spatial relationships between mountainsPositive
Slope Aspect (C4)_Orientation of slope inclinationPositive
Slope Gradient (C5)°Degree of slope inclinationPositive
Water System Landscape (B2)Distance from Water (C6)kmDistance to water body boundariesPositive
Watershed Hierarchy (C7)_Hierarchical classification by watershed scalePositive
Water Body Relationship (C8)_Interaction with surrounding water systemsPositive
Human subsystem (B2)Historical Culture (B3)Initial Construction Era (C9)YearInitial construction periodPositive
Humanistic Value (C10)_Comprehensive cultural valuePositive
Site Assessment (B4)Typology (C11)_Classification of cultural landscape typesPositive
Hierarchy (C12)_Hierarchical position in the classification systemPositive
Table 3. Correlation analysis of cultural landscape factors in the core area of the Songshan Cultural Circle.
Cultural FactorTimeSub-CategoryTopographyElevationDistance from WaterSecondary WatershedSlope GradientWater RelationshipMountain RelationshipAspectLevel
TimePearson Correlation10.578 **0.125 *0.159 *0.126 *0.0250.087−0.0100.164 *0.013−0.055
Sig. (2-tailed) <0.0010.0440.0100.0420.6930.1600.8690.0080.8340.374
Sub-categoryPearson Correlation0.578 **10.0730.164 **0.211 **0.0980.0680.0230.1150.0440.117
Sig. (2-tailed)<0.001 0.2390.008<0.0010.1120.2760.7120.0630.4770.058
TopographyPearson Correlation0.125 **0.07310.548 **0.0370.242 **0.0990.0990.260 **0.0440.050
Sig. (2-tailed)0.0440.239 <0.0010.554<0.0010.1120.111<0.0010.4840.425
ElevationPearson Correlation0.159 **0.164 **0.548 **10.209 **0.393 **0.187 **0.0940.502 **0.168 **0.195 **
Sig. (2-tailed)0.0100.008<0.001 <0.001<0.0010.0020.131<0.0010.0070.002
Distance from WaterPearson Correlation0.126 *0.211 **−0.0370.209 **10.0320.135 **−0.192 **0.195 **0.0630.051
Sig. (2-tailed)0.042<0.0010.554<0.001 0.6050.0290.0020.002−0.3110.408
Secondary WatershedPearson Correlation0.0250.0980.242 **0.393 **0.0321−0.0610.0670.131 *−0.0960.103
Sig. (2-tailed)0.6930.112<0.001<0.0010.605 0.3240.2820.0340.1230.098
Slope GradientPearson Correlation0.0870.0680.0990.187 **0.135 *−0.0611−0.1680.321 **0.235 **−0.006
Sig. (2-tailed)0.1600.2760.1120.0020.0290.324 0.007<0.001<0.0010.924
Water RelationshipPearson Correlation−0.0100.0230.099−0.094−0.192 **0.067−0.168 **1−0.110−0.1000.040
Sig. (2-tailed)0.8690.7120.1110.1310.0020.2820.007 0.0760.1080.518
Mountain RelationshipPearson Correlation0.164 **0.1150.260 **0.502 **0.195 **0.131 **0.321 **−0.11010.145 **0.236 **
Sig. (2-tailed)0.0080.063<0.001<0.0010.0020.034<0.0010.076 0.019<0.001
AspectPearson Correlation0.0130.0440.0440.168 **0.0630.0960.235 **0.1000.145 **10.011
Sig. (2-tailed)0.8340.4770.4840.0070.3110.123<0.0010.1080.019 0.858
LevelPearson Correlation0.0550.1170.0500.195 **0.0510.1030.0060.0400.236 **0.0111
Sig. (2-tailed)0.3740.0580.4250.0020.4080.0980.9240.518<0.0010.858
* Significant at the 0.05 level (2-tailed). ** Significant at the 0.01 level (1-tailed). Data source: Results processed by SPSS software.
Table 4. Coupling coordination evaluation of cultural sub-regions.
Cultural Sub-RegionCoupling DegreeCoordination IndexCoupling Coordination DegreeCoordination LevelCoordination Status
I-①0.4420.50.475Near Imbalance
I-②0.5590.2680.3874Mild Imbalance
I-③0.6990.470.5736Barely Coordinated
I-④0.7310.7020.7168Moderate Coordination
II0.2780.2750.2773Moderate Coordination
III-①0.8140.3480.5326Barely Coordinated
III-②0.5330.4110.4685Near Imbalance
IV-①0.4420.50.475Near Imbalance
IV-②0.4490.2250.3184Mild Imbalance
Table 5. Resistance coefficient of suitability for constructing the inheritance network.
IndexFactorWeight
RoadUrban slip roads, slide roadsMain and secondary roads of the cityProvincial roads, national roadsRailways, highwaysNo roads0.155
50100300400500
/m Rivers/m≤200 m200~500 m500~1000 m1000~1500 m≥1500 m0.095
10305070100
/m Altitude/m≤200 m200~400 m400~600 m600~800 m≥800 m0.15
10305070100
/°Slope/°<5°5~15°15~25°25~35°≥35°0.145
51030100500
Distance from the Road/m≤200 m200~500 m500~1000 m1000~1500 m≥1500 m0.15
51050200400
Level of Heritage Source1000 m First-Level Source Area and Surrounding 1000 m Area1000 m Second-Level Source Area and Surrounding 1000 m Area1000 m Third-Level Source Area and Surrounding 1000 m AreaOther Areas0.21
52050400
Type of Land UseForestlandRiver SystemLawnFarmlandUnused LandConstruction Land0.095
204060150160200
Table 6. Table of factors for constructing thematic paths of the heritage network.
Theme PathCulture ConnotationKey Screening IndicatorsTypical Node Cases
“Seeking Wisdom in the Mountains”Religion/Sacrificial Culture (Buddhism, Taoism, and Confucianism Space)The density of religious heritage
≥0.8 place/km2
Slope 5–15° (suitability of the path coefficient Ti > 0.7 0.7 (historical layers)
Shaolin Temple, Zhongyue Temple, Songyang Academy, Junji Peak sacrificial axis
“Searching for Culture in the Scenery”Scholars’/Academy Culture (Spread of Neo-Confucianism and Landscape Aesthetics)Integration degree R2 > 0.75 (high accessibility)
300–500 m from the water system (landscape view)
CVi education weighting > 0.15
Songyang Academy, Star Observation Platform, Qimu Que (stone carving art), Tang Dynasty Stele
“Exploring the City Along the River” Prehistoric Settlements/City Civilization (Cradle of the Ying River Basin Civilization)Distance from water ≤ 500 m (settlement dependent)
Cultural coupling coordination degree D > 0.6 (natural–human collaboration)
The proportion of newly activated nodes ≥ 40%
Wangchenggang site, Yangcheng site, Quhe kiln site, Yingyang ancient city
Table 7. Key parameters of heritage network system evaluation.
IndexSymbolValueImplication
Cultural value indexCVIndex0.82Regional heritage value average level
Time decay coefficientα0.05Decay rate per century
Distance attenuation coefficientb1.8Calibration based on friction surface
Gravitational constantG103Dimensional transformation coefficient
Connectivity increaseΔα+37%Network connectivity gain
Density increaseΔρ+51%Core area resource integration
Table 8. Performance of traditional MCR vs. adaptive MCR gravity model.
Evaluating Indicator Traditional MCR ModelAdaptive Model Improvement RateVerification Method
Network Connectivity
(α index)
0.420.58+37%Topology Analysis
Node Density of the Core Area (per/km2)0.741.12+51%Kernel Density Estimation
Cultural Dissemination Efficiency(R2)0.610.78+27.9%Spatial Syntax
Gravitational Intensity of the Peripheral Region (∆Fij)Reference Value+47%47%Gravity Model Simulation
Computation Time (min)18.223.7+30%Python 3.6 Timing
Disclaimer/Publisher’s Note: The statements, opinions and data contained in all publications are solely those of the individual author(s) and contributor(s) and not of MDPI and/or the editor(s). MDPI and/or the editor(s) disclaim responsibility for any injury to people or property resulting from any ideas, methods, instructions or products referred to in the content.