Article

The Impact of Transportation Accessibility on Tourism Economic Resilience Based on GWRF: A Case Study of the Yellow River Basin, China

1
School of Resources and Environmental Engineering, Ludong University, Yantai 264025, China
2
School of Business, Ludong University, Yantai 264025, China
*
Author to whom correspondence should be addressed.
Sustainability 2026, 18(11), 5427; https://doi.org/10.3390/su18115427
Submission received: 17 April 2026 / Revised: 20 May 2026 / Accepted: 25 May 2026 / Published: 28 May 2026
(This article belongs to the Section Tourism, Culture, and Heritage)

Abstract

Transportation plays a fundamental role in tourism development, serving as the critical link between tourism demand and supply. China’s domestic demand-oriented strategy has positioned tourism as an important driver of economic recovery during the post-COVID-19 transition period, highlighting the urgent need to strengthen tourism system resilience. Tourism economic resilience is measured via the entropy-weighted Technique for Order Preference by Similarity to an Ideal Solution (TOPSIS) method, transportation accessibility is quantified using a composite index, and a Geographically Weighted Random Forest (GWRF) model is applied across 73 prefecture-level cities in the Yellow River Basin to map spatial patterns and examine the association between transportation accessibility and tourism economic resilience. The results reveal: (1) pronounced spatial disparities in both tourism resilience and accessibility, displaying a clear “core–periphery” pattern; (2) strong spatial coupling between high resilience and high accessibility in the east, and low–low clusters in the west (e.g., Qinghai, Gansu, Sichuan); and (3) a relatively strong association between transportation accessibility and tourism resilience, particularly in supporting recovery, adaptability, and renewal capacity. Other influential factors include tourist density, openness to external markets, and industrial structure. This study provides a quantitative foundation for understanding the spatially heterogeneous associations of transport infrastructure with tourism system resilience and offers both theoretical insights and practical guidance for formulating regionally differentiated, transport-led policy strategies to foster sustainable tourism development in river-basin economies.

1. Introduction

Tourism is inherently multifaceted, integrating economic and cultural dimensions. It not only stimulates economic growth, generates fiscal revenue, and contributes to industrial transformation and upgrading but also facilitates cultural exchange, promotes resource sharing, and enhances cultural soft power and international influence. Consequently, tourism has evolved into both a strategic priority and a key driver of regional and national development. However, given its strong dependence on environmental and external conditions, it is vulnerable to major external shocks. Tourism resilience provides a new analytical perspective for the tourism industry to enhance its anti-fragility and achieve sustainable development. As an important force boosting domestic demand and promoting coordinated regional development, maintaining a highly resilient and high-quality tourism economy represents a crucial approach to upgrading quality and enhancing resilience [1]. To continuously improve the tourism industry’s ability to respond to shocks, strengthen its adaptability and recovery from adversities, the UN General Assembly established Global Tourism Resilience Day in 2023, observed annually on 17 February, emphasizing the adaptability, resilience and coordination that tourism systems should possess in the face of crises. Centered on tourism resilience, it highlights its role in achieving sustainable development goals across multiple dimensions, including economy, transportation, and social progress.
The term “resilience” originates from the Latin word resilire, referring to the ability of a system or entity to maintain functionality and recover from shocks or disruptions [2]. Since Holling introduced resilience into ecology in 1973, research on resilience has gradually evolved from an emphasis on equilibrium restoration toward dynamic adaptation and sustainable development [3]. Conceptually, resilience can be broadly understood from two perspectives: the equilibrium-based perspective, which focuses on the system’s ability to recover after disturbances and forms the theoretical foundation of engineering and ecological resilience, and the evolutionary perspective, also referred to as evolutionary resilience, which considers resilience as the capacity of complex social–ecological systems to maintain stability, recover previous states, and transition to new equilibrium states following external shocks [4,5]. In recent years, research on ecological resilience has deepened, encompassing multiple scales, including communities, cities, and industries, with a focus on cross-sectional measurement, spatiotemporal differentiation, and analysis of influencing factors [6].
The tourism industry, owing to its strong dependence on natural and cultural resource endowments, is particularly sensitive to environmental and external disturbances, making resilience an essential prerequisite for the long-term sustainable development of tourism destinations. Existing studies typically view tourism ecosystems as complex systems integrating tourism, ecological, and social subsystems and define tourism system resilience as the system’s capacity to resist shocks, recover and adapt, and reorganize innovatively through transformation and upgrading [7]. Accordingly, the resilience indicators constructed in this study primarily reflect the system’s structural stability, resistance, and adaptive potential in response to external disturbances, rather than its long-term dynamic evolutionary processes.
Transportation provides the institutional and infrastructural foundation for tourism development, serving as a critical intermediary between tourism demand and supply. At the same time, tourism-related economic activities have significantly reshaped transport networks and development trajectories [8]. The interrelationship between tourism and transportation has thus become tourism–transportation research, with scholars examining the role of transportation within tourism systems from multiple perspectives. Using a transportation cost model, Prideaux identified transportation as indispensable to tourism development [9]. Connell and Page analyzed the interactions among tourism resources, tourist travel behavior, and tourism flows, arguing that understanding tourist dynamics should provide the spatial information basis for tourism transport planning [10]. Through a natural experiment on Spain’s high-speed rail (HSR) network, Albalate and Fageda examined the stimulating effects of HSR on the tourism economy while also highlighting its potential “siphoning effect” on peripheral destinations [11]. Khan, adopting a diversified transportation system perspective, developed a Travel and Tourism Competitiveness Index to demonstrate transportation’s positive contribution to global tourism growth [12]. In research on traditional villages in Guizhou, Dong revealed that transport accessibility strongly shapes the spatial clustering of tourism attractions, reflecting a distinct “core–periphery” pattern [13]. From a macro-level perspective, Yang confirmed transportation accessibility as a key variable in the mechanisms of tourism recovery following disruptions [14].
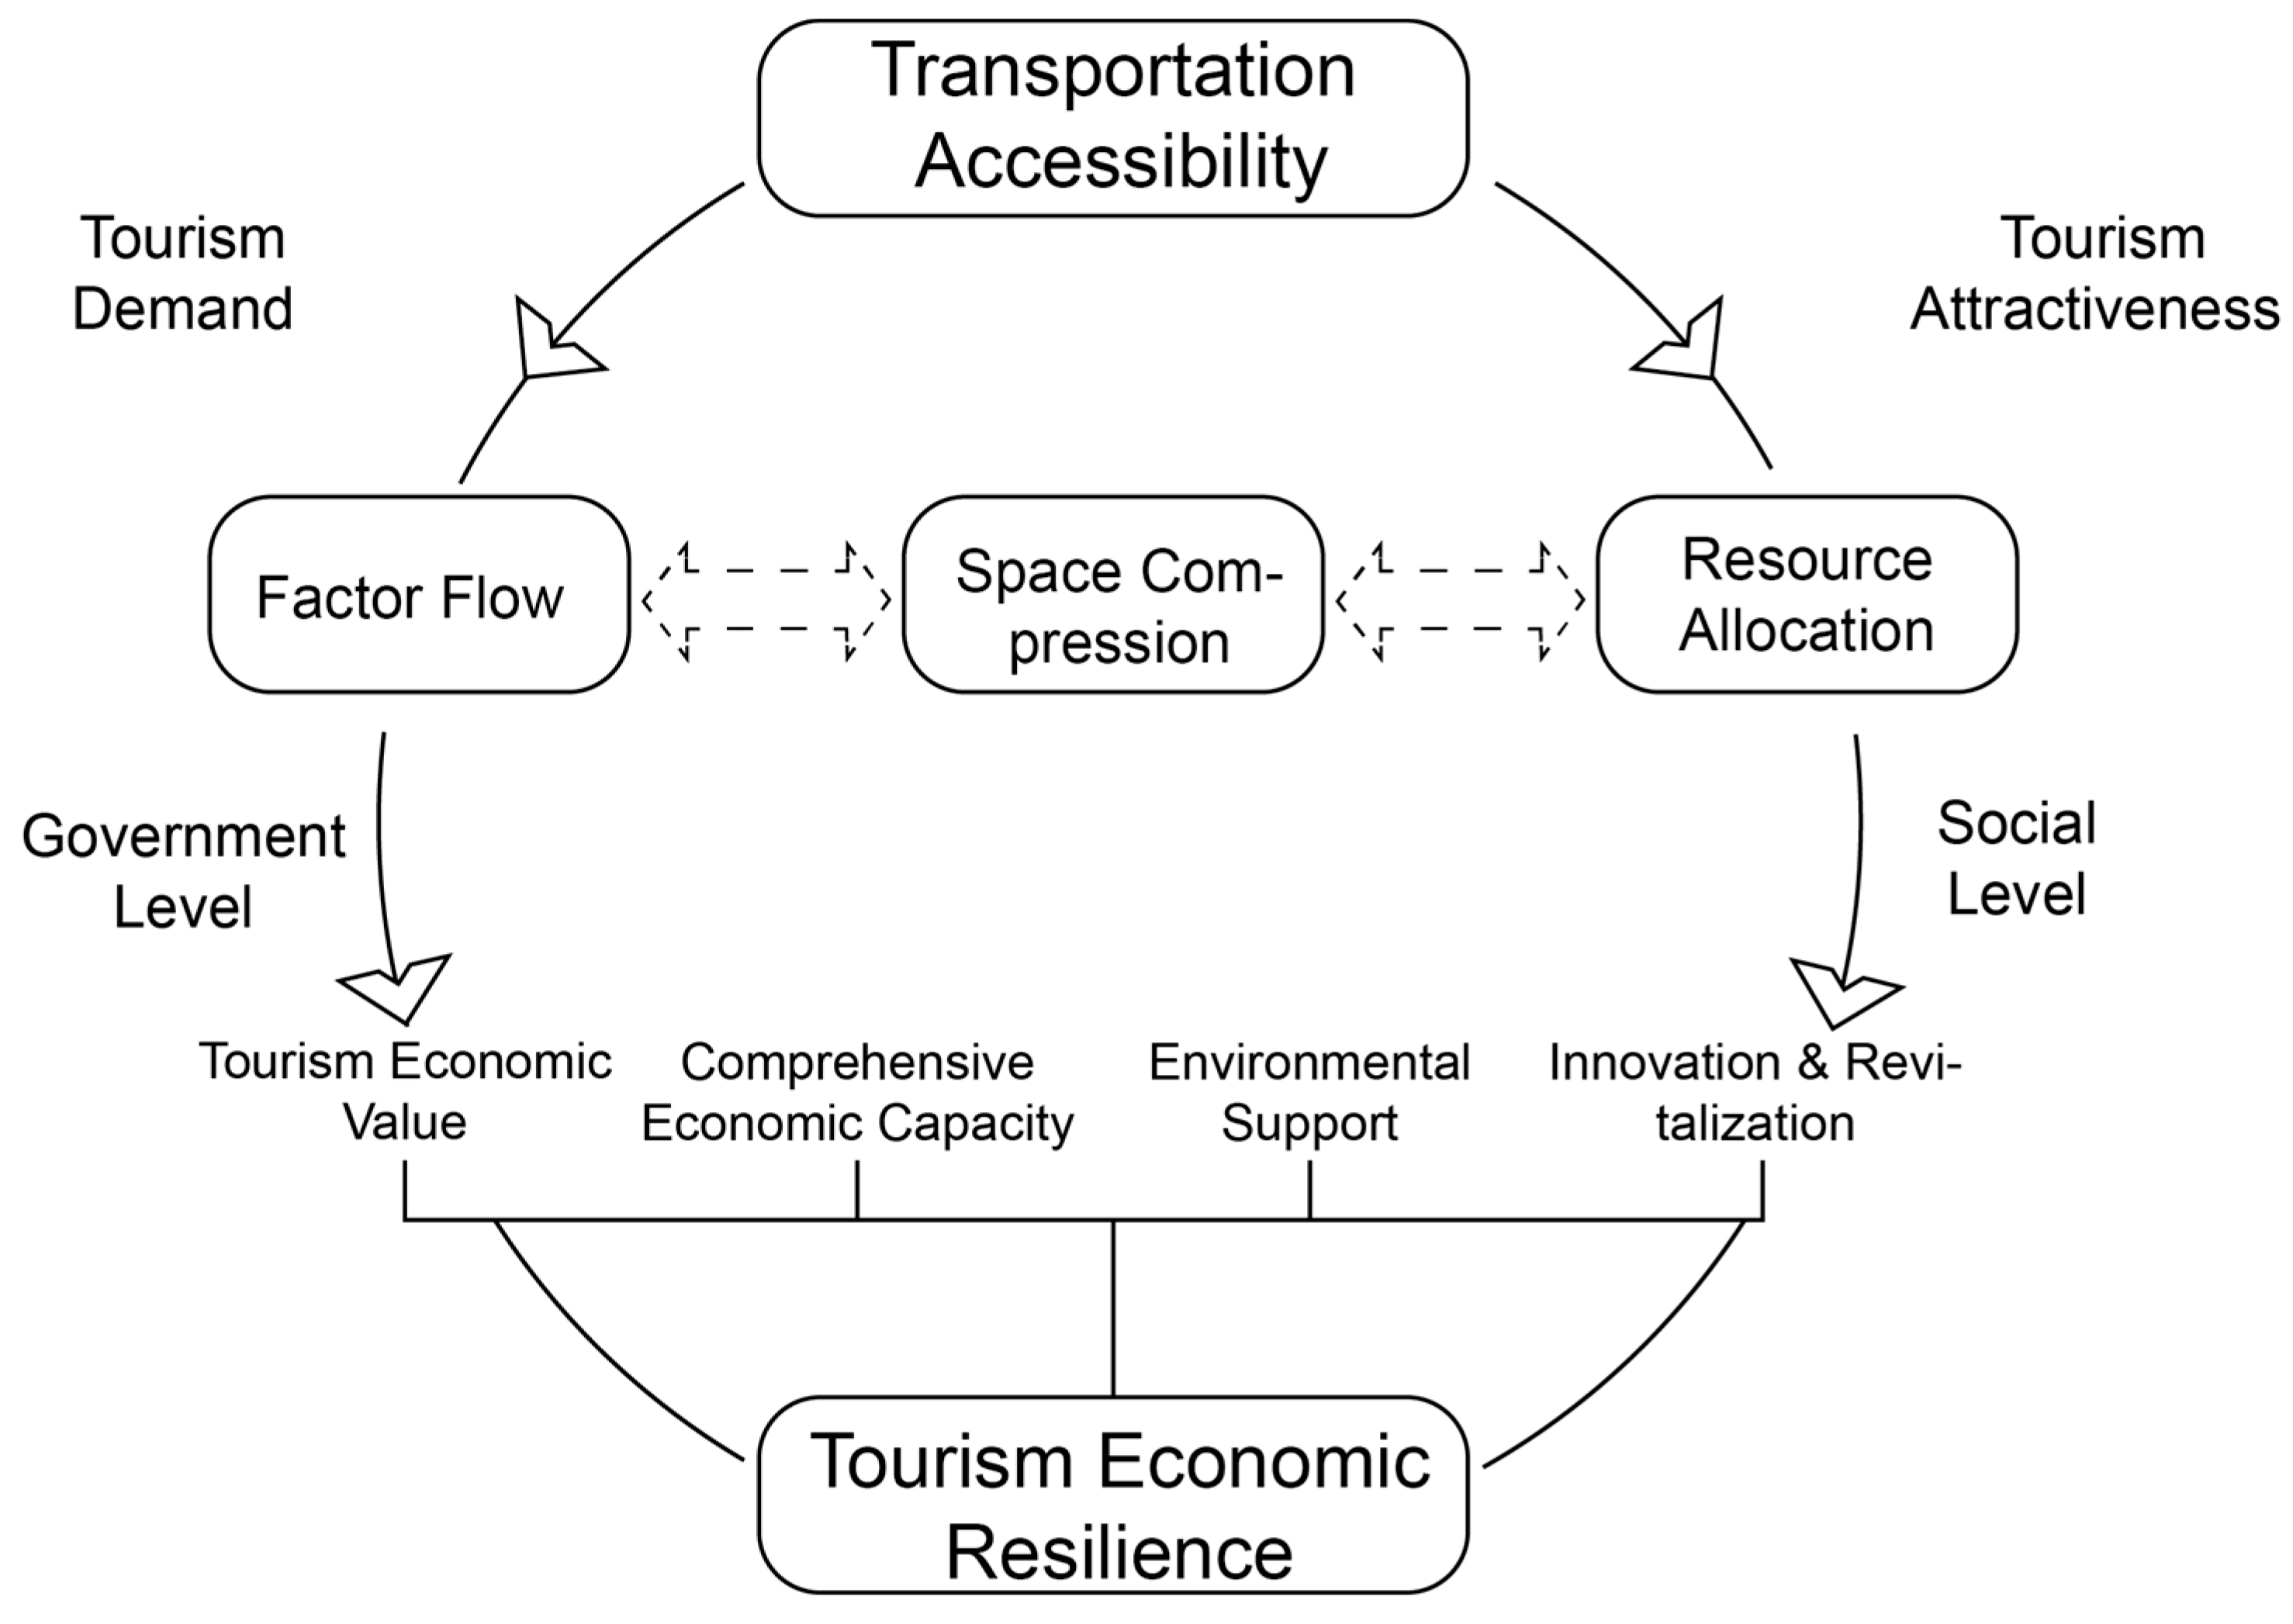
Transportation accessibility reflects the degree of spatial connectivity among cities and constitutes an important external condition shaping tourism system resilience. Higher levels of accessibility can strengthen intercity linkages and regional coordination by facilitating factor mobility, improving resource allocation efficiency, and overcoming spatial barriers through time–space compression effects. Specifically, improved transportation accessibility promotes the circulation of key tourism-related factors, including tourists, capital, information, and tourism services, thereby enhancing the adaptive capacity of tourism systems under uncertain disturbances. At the same time, greater accessibility expands the market reach of tourism destinations, strengthens destination attractiveness, and improves the matching relationship between tourism supply and demand, further enhancing the efficiency of tourism resource allocation. In addition, well-developed transportation accessibility reduces travel time, mobility costs, and spatial frictions, generating time–space compression effects that intensify regional interactions and improve the flexibility and emergency responsiveness of tourism systems (Figure 1).
Through these mechanisms, transportation accessibility supports tourism systems in maintaining operational stability, achieving adaptive adjustment, and coordinating resource allocation when facing internal and external disturbances. In turn, this strengthens the sustainability of tourism development and further consolidates the foundation of tourism economic resilience. Building on this body of work, examining how transportation influences the resilience of tourism economic systems has become a critical research frontier and an important interdisciplinary endeavor. Such studies can move the field beyond its exploratory phase. Focusing on the Yellow River Basin represents a strategic choice, guided by the need to promote sustainable and balanced development of both the tourism economy and its broader socioecological system. Accordingly, exploring the influence and mechanisms of transportation on the resilience of tourism economic systems has become a key component of tourism and transportation research, as well as an important interdisciplinary research agenda. Such investigations can help advance the field of tourism economic resilience from an exploratory stage toward more mature, mechanism-based analytical frameworks. Selecting the Yellow River Basin as the research area represents a strategic choice guided by the necessity of ensuring the sustainable and sound development of both the tourism economy and its associated ecological systems.
As a critical region for ecological conservation and coordinated economic development in China, the resilience of its tourism economic system not only concerns regional economic security but also functions as an important benchmark for national ecological governance [15]. The Yellow River Basin is endowed with abundant natural and profound cultural resources, containing 13.72% of China’s A-level tourist attractions and ranking among the regions with the richest tourism resource endowments nationwide. However, constrained by ecological conditions, topographical heterogeneity, and unbalanced regional development, the basin’s superior tourism resources have not been fully translated into economic advantages, resulting in generally inadequate development efficiency and overall performance. Furthermore, existing domestic research predominantly focuses on economically developed regions such as the Beijing–Tianjin–Hebei region, the Pearl River Delta, and the Yangtze River Delta, while the Yellow River Basin remains relatively underexplored in terms of tourism economic system resilience. Against this backdrop, this study addresses this gap by adopting an integrated basin-wide perspective to examine how transportation accessibility influences tourism economic resilience. This study thus selects the Yellow River Basin as the research object and investigates the relationship between transportation accessibility and tourism economic system resilience, drawing on established methodological frameworks to provide empirical evidence and policy implications for regional tourism planning and sustainable development. Methodologically, a Geographically Weighted Random Forest (GWRF) model is employed to capture spatial heterogeneity and local variations in influencing mechanisms, offering a more flexible and interpretable approach for regional resilience assessment [16]. By integrating transportation accessibility modeling with spatial analytical techniques, this study provides a refined understanding of how transportation conditions shape tourism economic resilience across heterogeneous regional contexts.

2. Materials and Methods

2.1. Study Area

The Yellow River Basin, serving as both a vital ecological barrier and a key economic zone in China, encompasses major ecological and economic regions. As the cradle of Chinese civilization, the basin represents a pivotal unit in the development of regional tourism economies in China. Supported by an established industrial base and an increasingly comprehensive transportation network, the tourism industry in the Yellow River Basin exhibits strong connectivity and substantial potential for coordinated development. Nevertheless, complex terrain and pronounced regional disparities continue to constrain growth and limit the efficient agglomeration of tourism resources. In recent years, guided by China’s Outline of the Plan for Ecological Protection and High-Quality Development of the Yellow River Basin, emerging trends including cultural–tourism integration, ecological tourism, and regional cooperation have begun to reshape development trajectories. Together, these dynamics provide both a policy framework and a practical context for advancing research on tourism economic resilience in the Yellow River Basin.
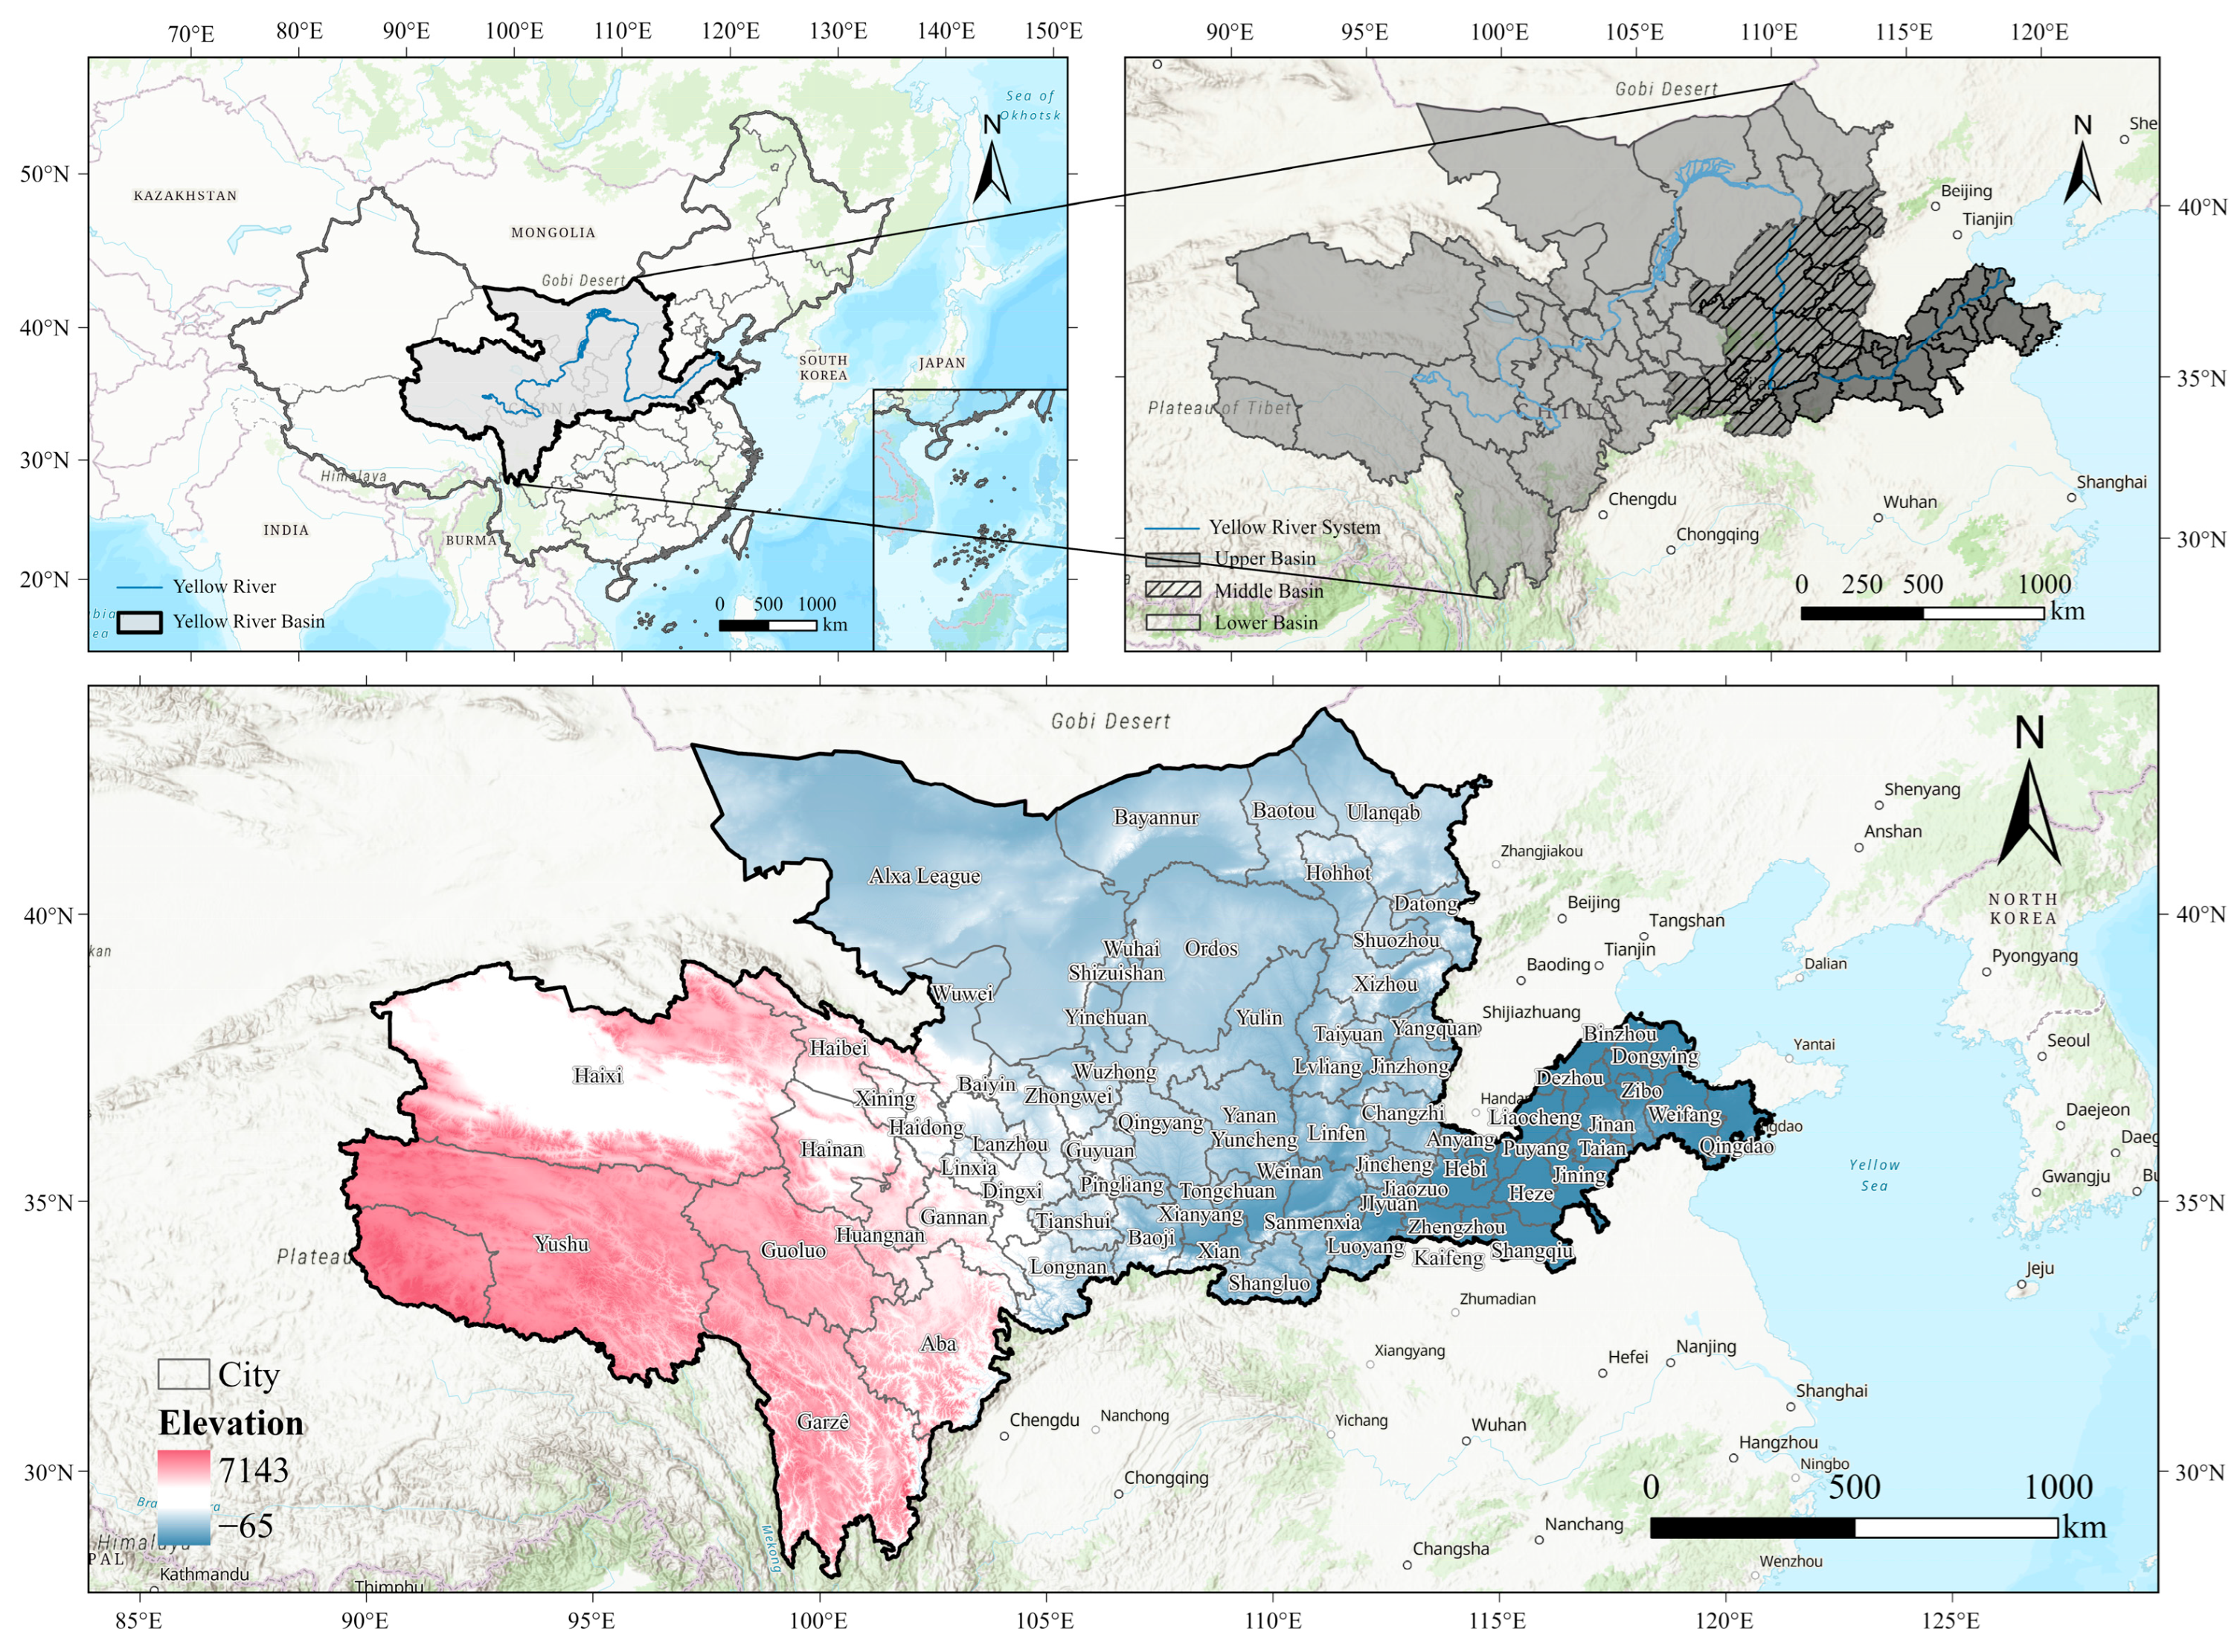
For spatial analysis, the study area is delineated based on the official Yellow River Basin boundaries defined by the Yellow River Conservancy Commission under China’s Ministry of Water Resources. Prefecture-level cities (including prefectures and leagues) are adopted as the basic spatial units, ensuring consistency between natural basin boundaries and socioeconomic statistical units. The final study area covers nine provinces and autonomous regions, including Qinghai, Sichuan, Gansu, Ningxia, Inner Mongolia, Shaanxi, Shanxi, Henan, and Shandong within the Yellow River Basin [17]. Following existing studies [18,19] and the Yellow River Yearbook, Hekou Town (Inner Mongolia) and Taohuayu (Henan Province) are used as boundary points to divide the basin into upper, middle, and lower reaches, forming a structured spatial framework for subsequent analysis (Figure 2).

2.2. Data Sources

2.2.1. Construction of the Indicator System and Selection of the Influencing Factors

At present, there is no universally agreed-upon evaluation model for the resilience of tourism economic systems. Martin proposed an economic resilience analysis framework encompassing four dimensions—resistance, recovery, reconfiguration, and creativity [2]—which has gained broad recognition in resilience research. Drawing on resilience theory, this study operationalizes tourism economic system resilience in terms of structural potential and adaptive capacity to resist, recover, reconfigure, and renew under uncertainty, reflecting its structural stability and adaptive capacity. Given that only 2022 cross-sectional data are used, this measure reflects the system’s static potential to withstand shocks rather than its dynamic evolution over time.
Drawing on existing research on urban resilience frameworks [17,20,21,22] and guided by principles of systematic analysis, comprehensiveness, and data accessibility, this study develops an evaluation index system encompassing four dimensions: tourism economic value, overall economic capacity, environmental support capacity, and innovation vitality. ① Tourism economic value represents the concentration of resources and output value in the tourism system, reflecting the richness of local tourism resources and their potential value [21]. ② Comprehensive economic capacity denotes the overall regional economic development level and resource carrying capacity, indicating the broader economic hinterland supporting the tourism system [23]. ③ Environmental support capacity refers to the guarantees provided by the ecological environment and infrastructure, serving as the material foundation for the stable and long-term operation of tourism systems [24]. ④ Innovation and revitalization level reflects the system’s ability to adapt and reorganize resources in response to external shocks, focusing on improving efficiency and overall system quality [25]. Across these four dimensions, a total of 26 indicators were selected to construct a comprehensive tourism resilience index for cities in the Yellow River Basin (Table 1).
To account for differences in measurement scales and reduce the impact of outliers in the tourism economic resilience dataset, all indicators were normalized using the min–max standardization method. Using weights derived from the entropy-weighted TOPSIS approach, the overall resilience level of the tourism economic system in the Yellow River Basin was then calculated through linear aggregation [26].

2.2.2. Data Sources and Processing

Considering data availability and the gradual recovery of China’s tourism market following the COVID-19 shock, 2022 was selected as the observation year to capture tourism economic resilience during the recovery transition stage. The economic and statistical data used in this study were primarily obtained from the 2023 statistical yearbooks of cities within the Yellow River Basin, statistical bulletins on national and local economic and social development, and the official websites of cultural and tourism administrative authorities.
Vector data for cities, county seats, and administrative boundaries were sourced from the National Fundamental Geographic Information dataset. Road network data for 2022 were obtained from the open-source platform OpenStreetMap (OSM). The road network data were used to calculate the weighted average travel time (WATT) component of transportation accessibility. Using the GraphHopper routing engine, route distances and travel times between cities were calculated to derive minimum driving times based on the road network. For each road hierarchy level, default speed parameters were adjusted to better approximate real driving conditions. These reference speeds were used to estimate intercity travel time for the WATT indicator (Table 2).

2.3. Research Methods

2.3.1. Comprehensive Evaluation Model of Transportation Accessibility

The comprehensive transport accessibility (TA) model serves as an integrated measure for evaluating the performance of regional transport systems. It captures both the overall ease of travel and the functional convenience provided by infrastructure. Drawing on indicator systems proposed by Jin Fengjun, Sun Hongri, and others [27,28,29], transport accessibility in this study is operationalized across three dimensions: weighted average travel time (WATT), transport corridor influence (TCI), and transport network density. Each dimension is standardized using Z scores, and the final TA index is calculated through an equally weighted summation. The model can be formally expressed as follows:
T A i = ( W A T T i × ω 1 + T C I i × ω 2 + T N D i × ω 3 )
where T A i represents the transport accessibility of city i ; W A T T i represents the weighted average travel time of city i ; T C I i represents the influence of the transport corridor of city i ; and T N D i represents the transport network density of city i . ω 1 , ω 2 , ω 3 represent the weights assigned to the three indicators. In this study, referring to previous research, equal weighting was applied such that ω 1 = ω 2 = ω 3 .
(1)
Weighted average travel time
The WATT captures the ease of transport connectivity between a given city and other cities within a defined period, reflecting both travel time costs and overall accessibility. A lower WATT score indicates lower travel time costs and stronger connectivity with other cities and is therefore treated as a reverse indicator. The formula is as follows:
W A T T i = j = 1 n T i j × M j j = 1 n M j , M j = G D P i P O U P i
where W A T T i represents the weighted average travel time of city i , where a smaller value reflects higher accessibility of the urban node. n represents the number of nodes excluding i . T i j denotes the shortest travel time from city i to city j . M j represents the central mass of city j , capturing its relative attractiveness. In this study, M j is defined as the geometric mean of the city’s gross domestic product (GDP) and population size (POP), that is, M j = G D P i P O U P i . The GDP represents the gross domestic product, and the POP denotes the total population of the city.
(2)
Transportation Corridor Influence
The transportation corridor influence (TCI) quantifies the extent to which trunk-line infrastructure supports regional development, serving as a key indicator of external connectivity. Higher TCI scores indicate stronger regional support from backbone transportation systems. More specifically, TCI reflects the role of trunk-line transport in promoting socioeconomic development by enhancing external accessibility and interregional linkages (Table 3).
(3)
Traffic Network Density
Traffic network density reflects the capacity of intraregional transport infrastructure and serves as an indicator of both external connectivity and internal functionality. Higher network density generally indicates a more compact infrastructure layout, greater accessibility, and stronger support for socioeconomic activities and interregional linkages.
In this study, TND is calculated as follows:
T N D i = L i S i
where T N D i represents the traffic network density of city i ; L i represents the total operational length of transportation infrastructure within city i ; and S i represents the land area of city i .

2.3.2. Spatial Correlation Test

To examine whether the resilience of the tourism economic system exhibits spatial dependence, Moran’s I statistic for tourism economic system resilience in the Yellow River Basin in 2022 was calculated using GeoDa 1.16. This statistic was then employed to assess the overall spatial clustering patterns of tourism economic system resilience across the region [30].
I = n I = 1 n j = 1 n ω i j × I = 1 n j = 1 n ω i j ( x i x ¯ ) ( x j x ¯ ) i = 1 n ( x i x ¯ ) 2
where I represents the global Moran’s I statistic; n denotes the total number of study units; x i is the observed value of unit i ; x ¯ denotes the mean of all observations; and ω i j represents the element of the spatial weight matrix, which characterizes the spatial proximity between unit i and unit j , with ω i j typically defined as 0 when i = j .
The bivariate Moran’s I statistic, originally proposed by Anselin, measures the spatial dependence between the distributions of two variables [31]. To further investigate the spatial interaction between transportation accessibility and tourism economic system resilience, this study applies the bivariate Moran’s I statistic to test whether significant spatial clustering exists between transportation accessibility in region j and tourism economic system resilience in region i [32].
I x y = n I = 1 n j = 1 n ω i j × I = 1 n j = 1 n ω i j ( x i x ¯ ) ( y j y ¯ ) i = 1 n ( x i x ¯ ) 2 × i = 1 n ( y j y ¯ ) 2
where I x y denotes the bivariate Moran’s I statistic between variables x and y ; n is the total number of study units; x i and y j are the values of variables x and y for units i and j , respectively; and x ¯ and y ¯ denote their respective global means. ω i j is an element of the spatial weight matrix that characterizes the spatial proximity between units i and j , with ω i i typically defined as 0 .

2.3.3. Research Variables and Testing

The resilience of the tourism economic system is influenced not only by natural conditions such as topography but also by multiple socioeconomic factors, including the level of economic development, industrial structure, technological innovation capacity, population structure, and resource endowment. Given its multidimensional nature and significant regional variability, and to further explore the mechanisms through which transportation accessibility affects resilience, this study builds on prior research [21,33,34,35,36]. Transportation accessibility (TA) is specified as the key explanatory variable, while economic development level (PGDP), industrial structure (IND), technological innovation capacity (TIC), natural environmental conditions (TRI), and openness (OPE) are included as control variables. Descriptive statistics for these variables across the Yellow River Basin are presented in Table 4.

2.3.4. Geographically Weighted Random Forest (GWRF)

To overcome the limitations of GWR and RF, this study employs the GWRF model. The GWRF model combines the spatial localization capabilities of GWR with the nonlinear modeling strengths of RF. By constructing random forest sub-models within geographic neighborhoods, it enables both localized and nonlinear predictions, while also facilitating the interpretation of relationships between dependent and explanatory variables [37,38].
The GWRF model extends the traditional RF into a locally adaptive framework composed of multiple sub-models. By constructing random forest sub-models at each geographic location, it accounts for nonlinear effects, variable interactions, spatial heterogeneity, and spatial autocorrelation. Compared with GWR and RF, GWRF is better suited to capturing the spatially uneven evolutionary dynamics and nonlinear association patterns of tourism economic system resilience. It effectively disentangles the combined effects of multiple factors, such as transportation accessibility, on resilience levels under conditions of spatial heterogeneity. At each location, the GWRF model employs a spatial weighting mechanism to build random forest sub-models based on local sample characteristics, enabling localized fitting and nonlinear prediction of tourism economic system resilience. The simplified form of the GWRF model is expressed as follows:
Y i = a u i , v i x i + e
where a u i , v i x i represents the predicted value from the locally calibrated RF model at spatial location ( u i , v i ) and where e represents the model error.
In the GWRF model, the spatial extent within which each local random forest (RF) sub-model operates is referred to as the neighborhood, and the maximum distance from a data point to the neighborhood boundary is defined as the bandwidth. The bandwidth is determined by the kernel function: adaptive kernels adjust to local sample density, making them suitable for unevenly distributed samples, while fixed kernels apply a uniform spatial radius, which is appropriate for more evenly distributed samples. Considering the large spatial extent and uneven sample density of the Yellow River Basin, this study employs an adaptive kernel function for model construction. Bandwidth selection substantially affects both model accuracy and computational efficiency [38]. Accordingly, the model’s performance was evaluated by comparing R2 values of GWRF out-of-bag predictions under different bandwidths, and the optimal bandwidth was then selected. The GWRF model was implemented using the SpatialIML package in R 4.3.1 software [39].
To further enhance prediction performance, the GWRF model allows integration of spatial heterogeneity signals from local sub-models with predictions from the global RF model. This fusion strategy produces a weighted combination of local and global models through a weighting coefficient (A), where a larger A assigns greater weight to the GWRF in the fused prediction. Following iterative adjustments, this study adopts the weighted fusion strategy to balance spatial sensitivity and prediction stability.

2.3.5. Model Evaluation and Testing

To evaluate model performance, this study employs multiple performance metrics, including the coefficient of determination (R2), root mean square error (RMSE), relative root mean square error (rRMSE), and mean absolute error (MAE) [37,38,39]. Comparative validation among OLS, GWR, RF, and GWRF models was conducted to identify an appropriate modeling framework. As the performance of the GWRF model is sensitive to bandwidth (BW) and the weighting between local and global components, an adaptive bandwidth search procedure and a series of local weighting coefficients ranging from 0.1 to 1.0 were iteratively tested to optimize model performance.

2.4. Research Framework

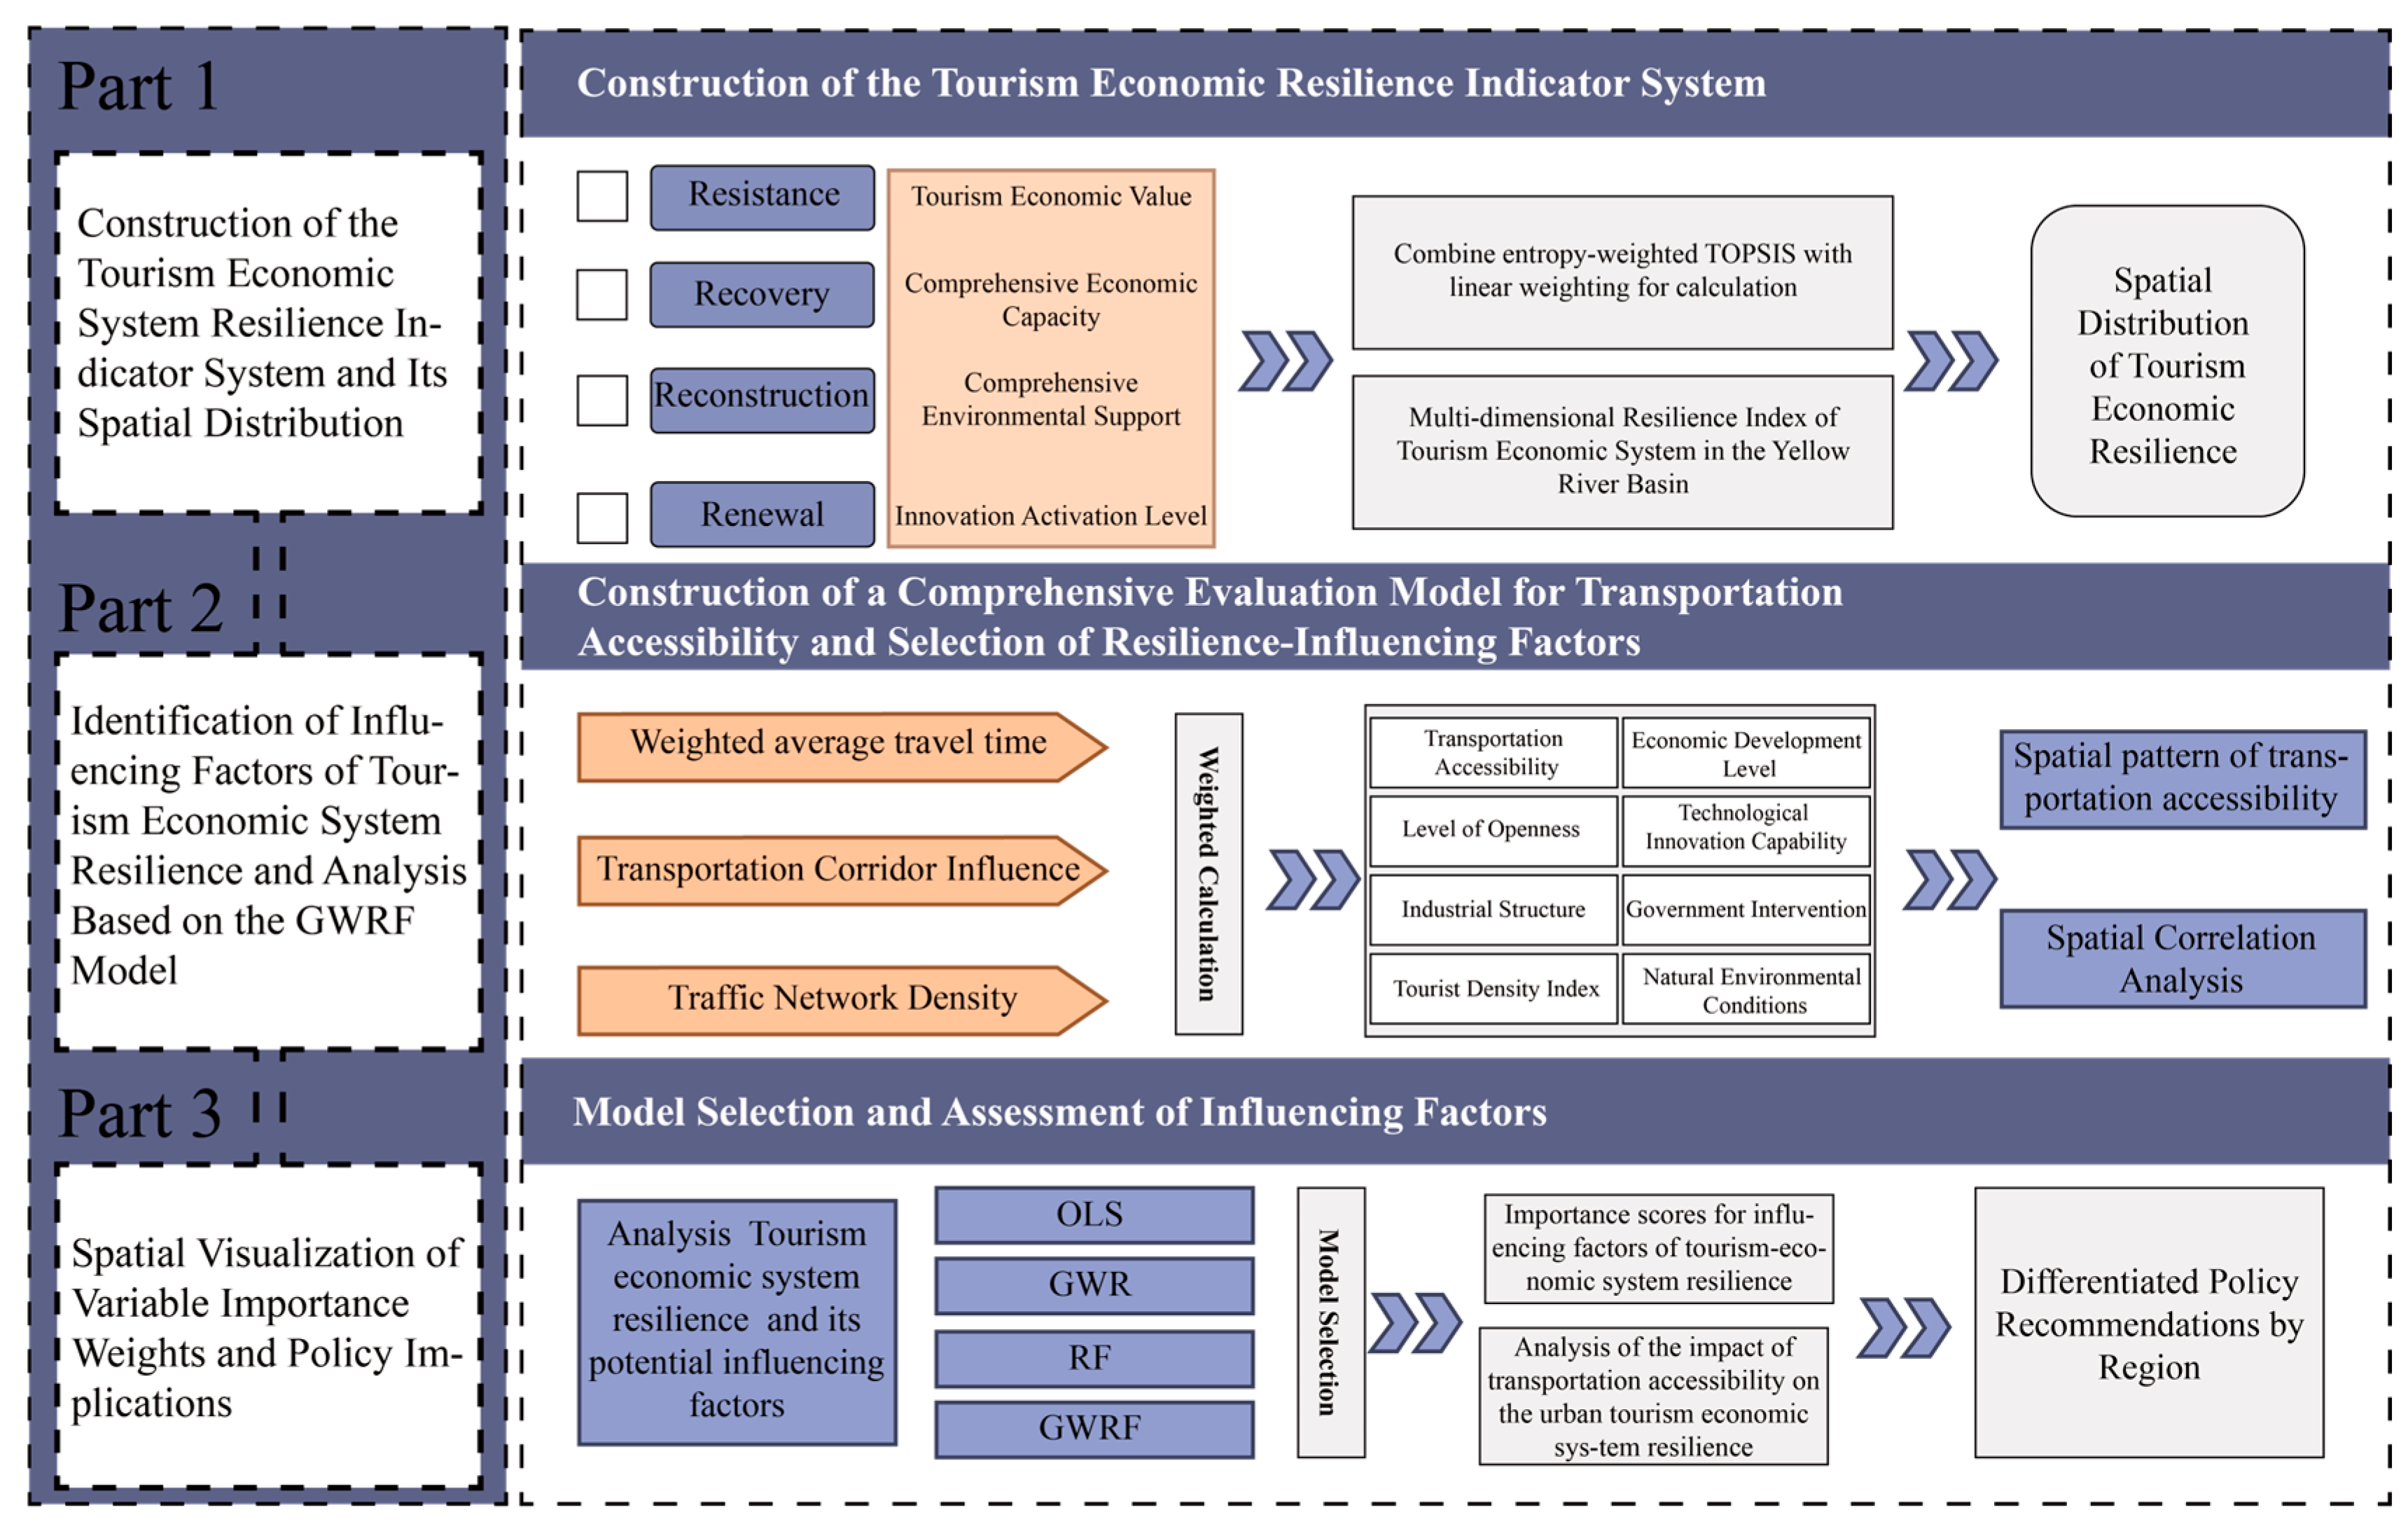
The overall research framework is illustrated in Figure 3. First, a multidimensional resilience index for the tourism economic system in the Yellow River Basin is developed across four dimensions: resistance, recovery, reconstruction, and renewal. Resilience scores are calculated using the entropy-weighted TOPSIS method combined with linear aggregation. Spatial autocorrelation and hotspot–coldspot analyses are then conducted to examine spatial distribution patterns. Next, transportation accessibility is measured through a composite model encompassing multiple weighted dimensions, and the determinants of tourism economic system resilience are identified. To capture spatial heterogeneity and nonlinear relationships, four models, including the GWRF, are applied for comparative accuracy assessment. The spatially varying effects of transportation accessibility and other factors on tourism resilience are further analyzed to identify regions with differential explanatory power. Finally, based on these results, differentiated strategies are proposed to enhance the connectivity and resilience of the tourism economic system in the Yellow River Basin, informed by causal mechanism analysis.

3. Results

3.1. Spatial Distribution Characteristics of Tourism Economic System Resilience in the Yellow River Basin

3.1.1. Overall Characteristics of Tourism Resilience

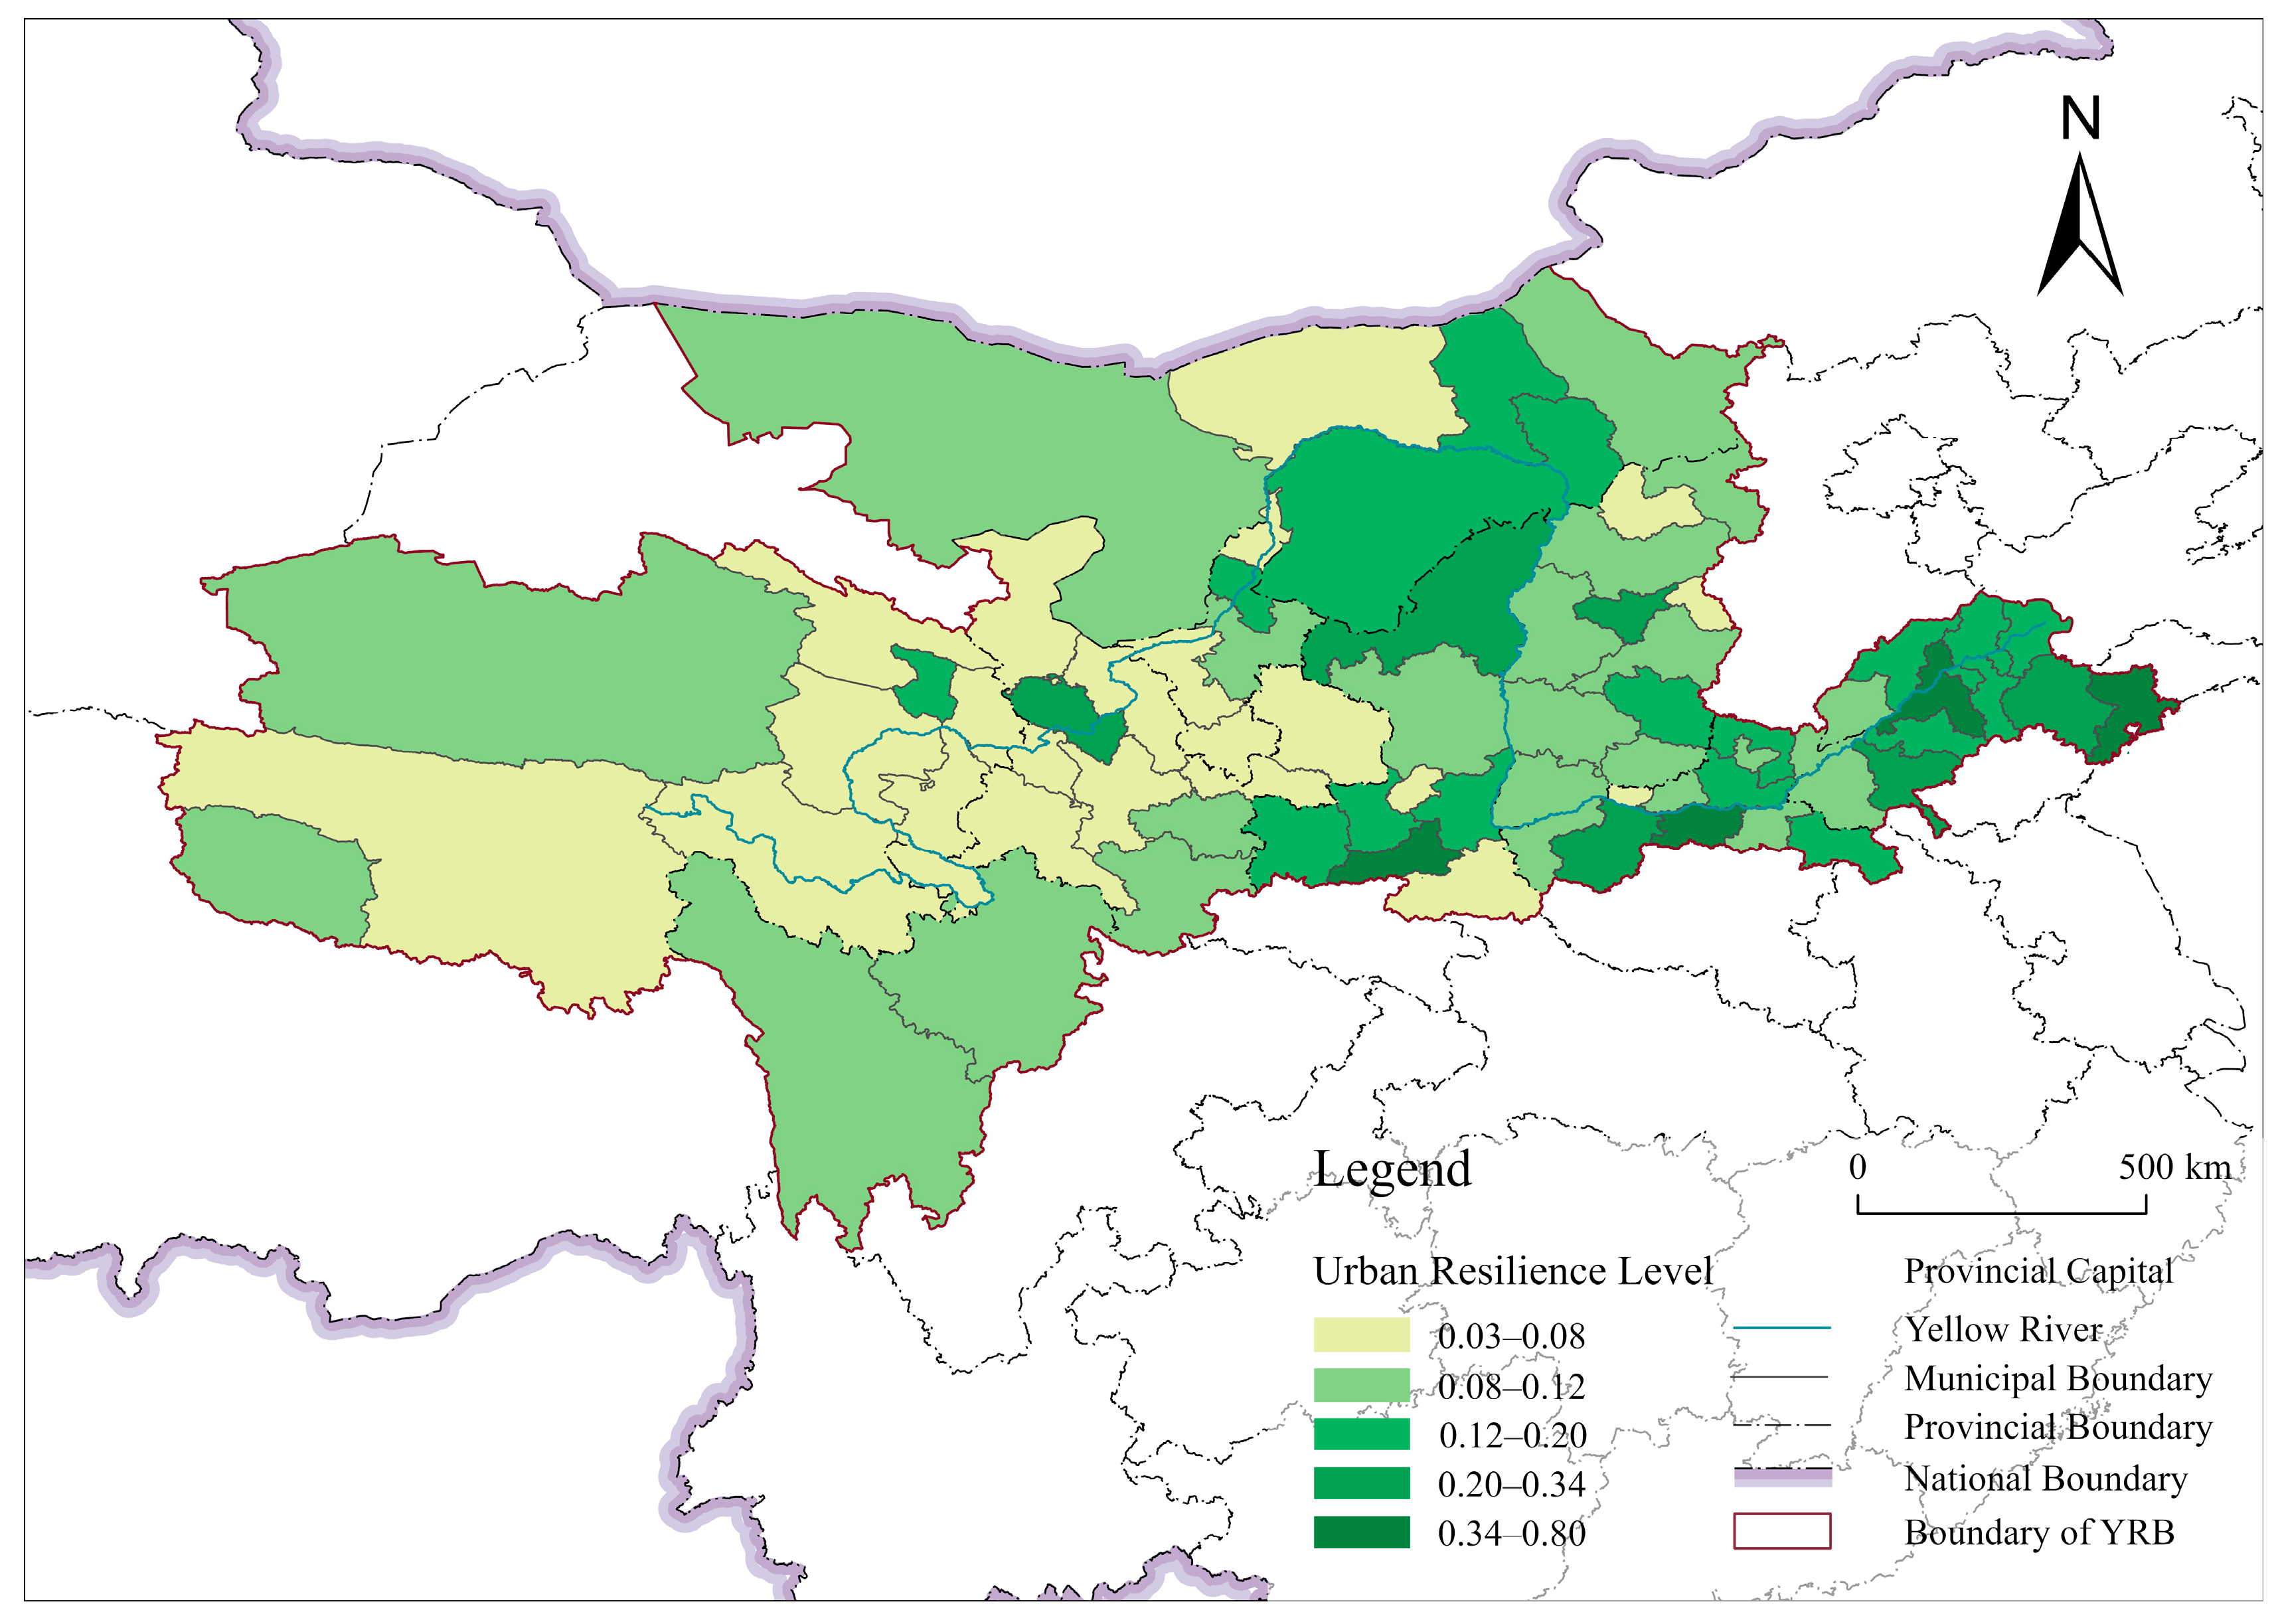
To examine the spatial distribution of tourism economic system resilience across cities in the Yellow River Basin, 2022 was selected as the reference year. Resilience scores were calculated using the entropy-weighted TOPSIS method and subsequently aggregated into a composite index (Figure 4). High-resilience areas are concentrated in provincial capitals such as Xi’an, Zhengzhou, and Jinan, as well as in key development cities along the middle and lower reaches of the Yellow River, including Qingdao, Weifang, Luoyang, and Jining. These cities exhibit strong resilience and relatively high resource–environment carrying capacity. Functioning as core growth poles within the Yellow River Basin, they not only radiate tourism-driven development to surrounding areas but also have the potential to promote synergistic enhancements of ecological, economic, and tourism benefits through cross-regional resource coordination.
From a spatial perspective, resilience levels across the upper, middle, and lower reaches of the Yellow River display marked heterogeneity, following an overall gradient from low to medium to high. Cities in the middle and lower reaches exhibit significantly higher resilience than those in the upper reaches, indicating stronger capacities in resource integration, infrastructure provision, and governance. In contrast, the upper reaches are generally constrained by underdevelopment, fragile ecosystems, and limited urban carrying capacity. These conditions result in relatively weak resilience, underscoring the need for enhanced regional coordination through targeted policy support and ecological stability measures.

3.1.2. Global Spatial Distribution Characteristics

To examine the spatial clustering characteristics of tourism economic system resilience in the Yellow River Basin, this study conducts a spatial autocorrelation analysis of the resilience index across 73 cities in 2022, calculating both global and local Moran’s I statistics.
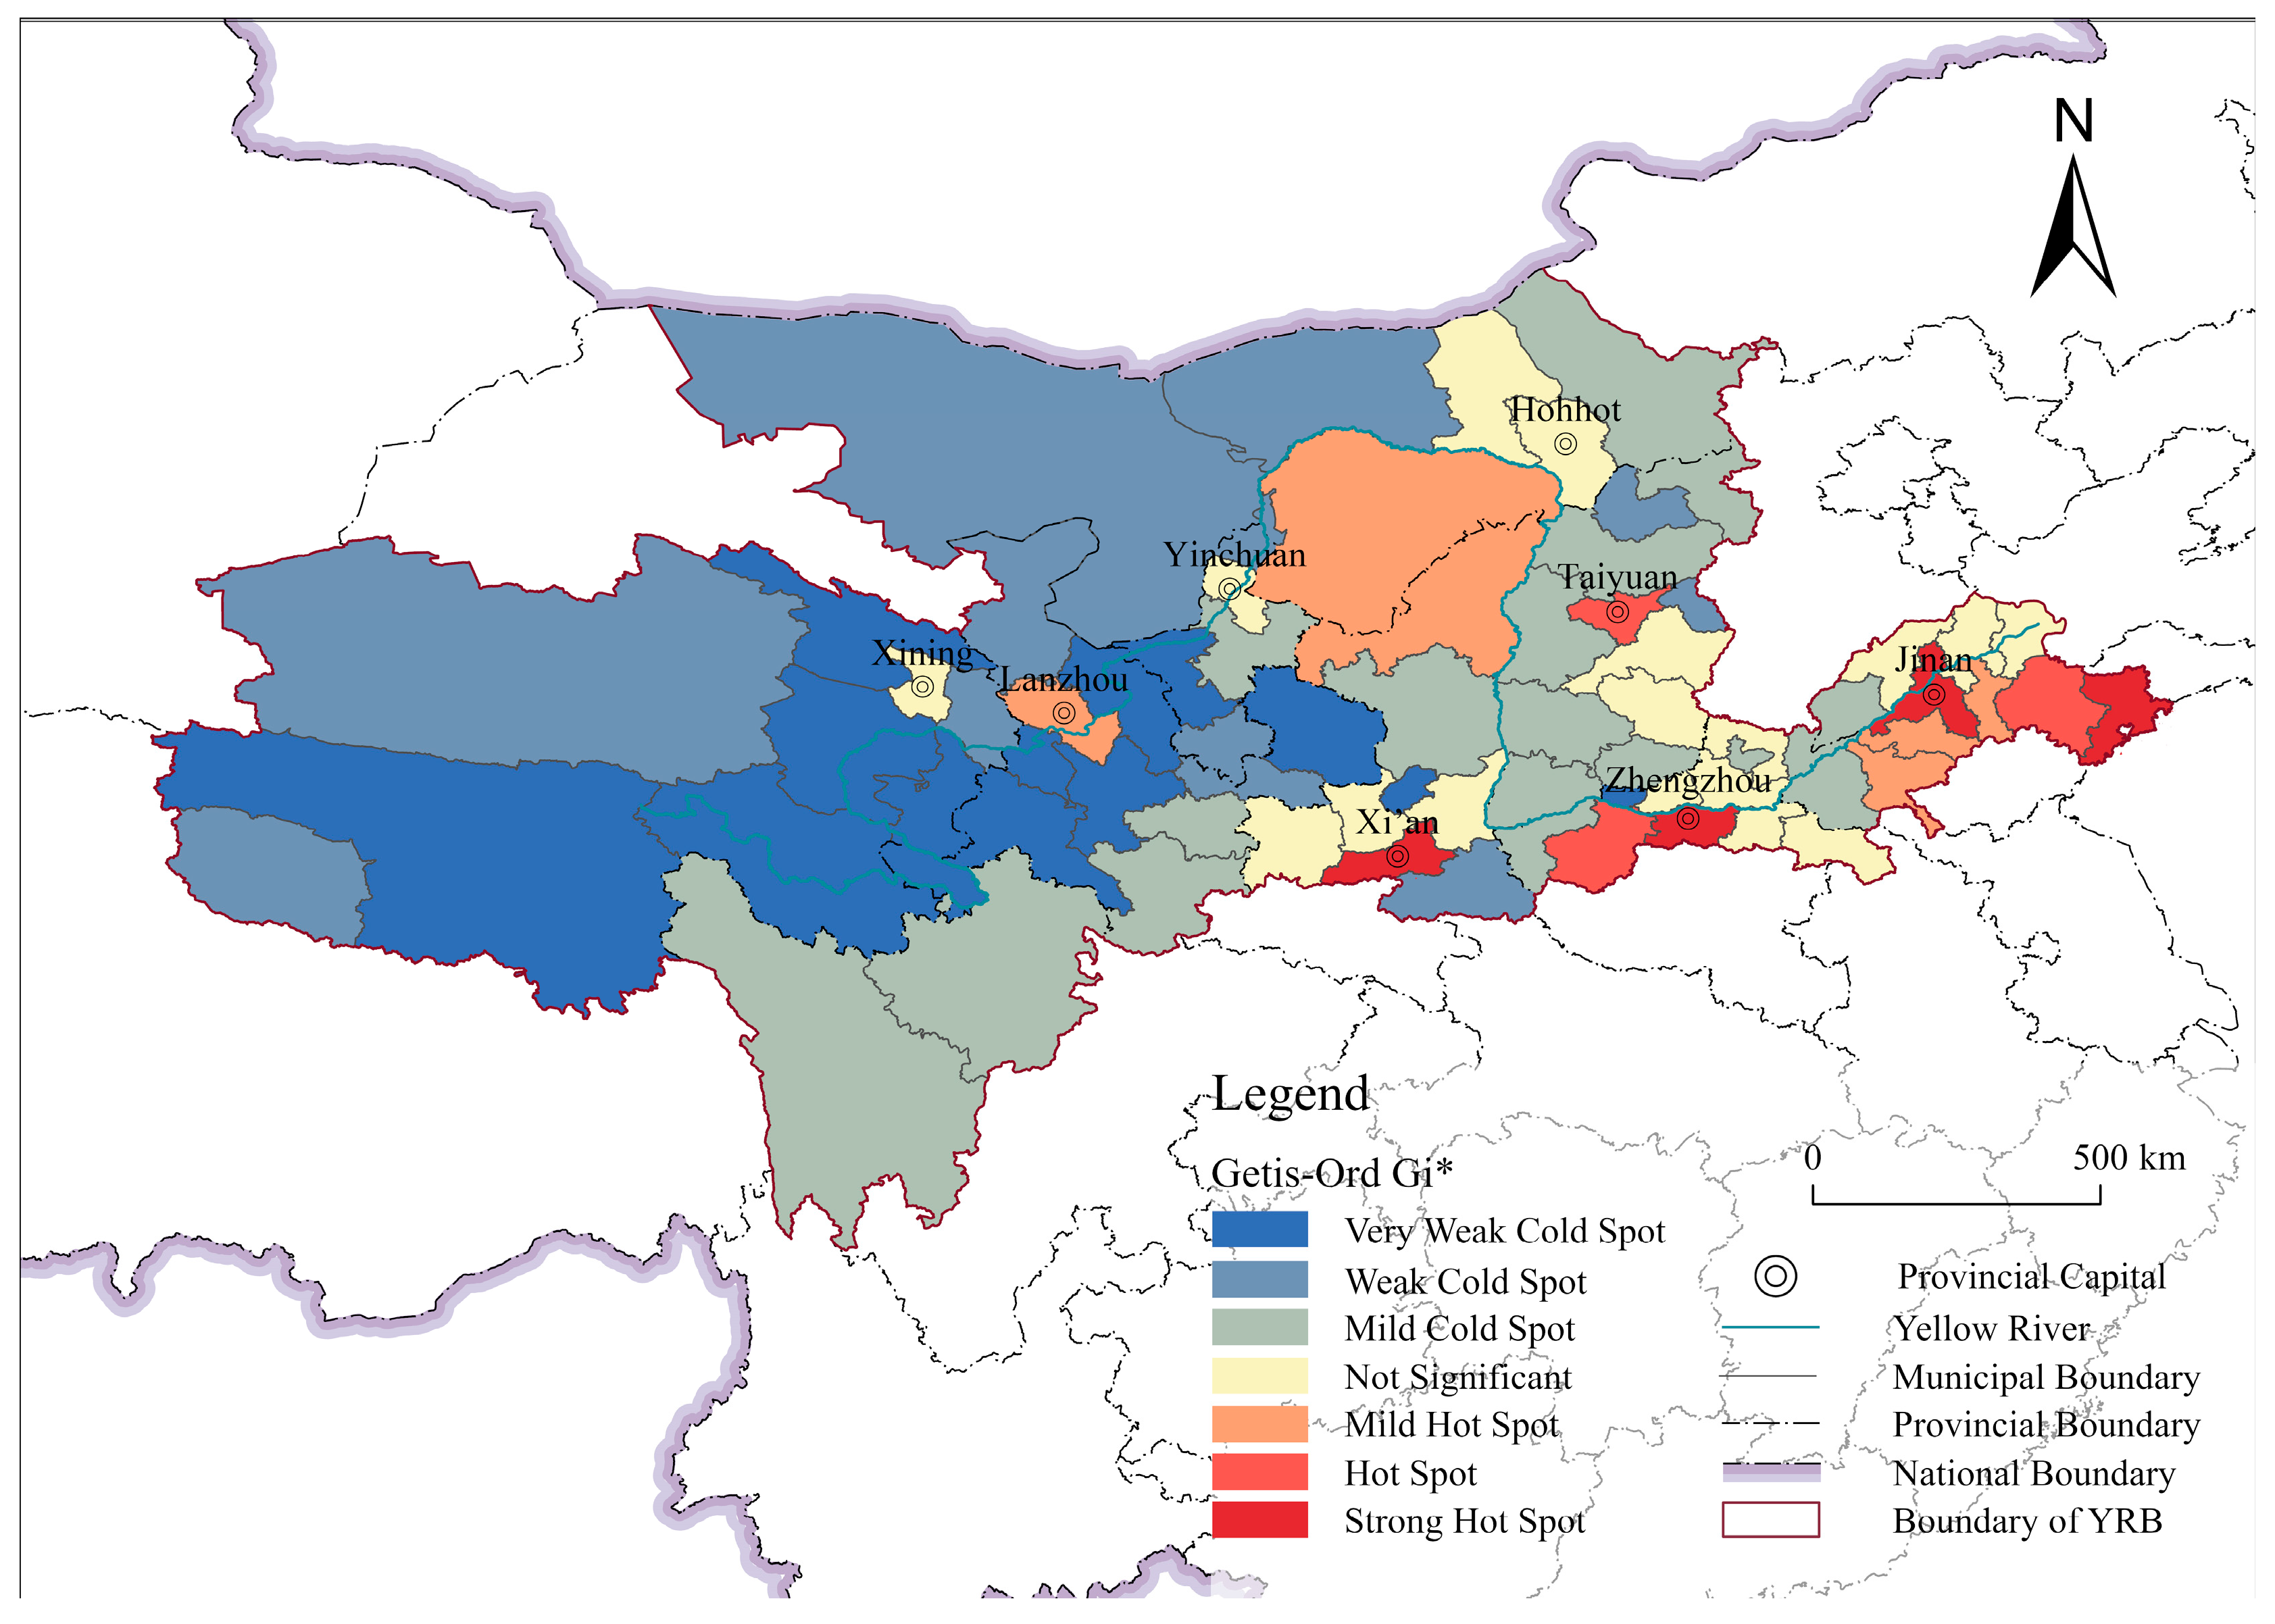
The results indicate a Moran’s I value of 0.148, which is statistically significant at the 5% level (p = 0.029, Z = 2.3644), suggesting a positive but relatively weak spatial autocorrelation. This finding implies that resilience levels in the tourism economic system exhibit a spatial structure, with high-resilience areas tending to cluster together, while low-resilience areas display similar localized patterns.
A hotspot analysis based on the Getis-Ord Gi* statistic was subsequently performed in the ArcGIS 10.8, applying inverse distance weights and Z-score classification to identify cold- and hotspot distributions of tourism economic system resilience in the Yellow River Basin (Figure 5). The results reveal a distinct spatial gradient, characterized by upstream coldspot clusters, midstream diffusion cores, and downstream hotspot concentrations. Upstream regions, such as Qinghai and Gannan, are dominated by coldspots, reflecting weak tourism foundations and limited system resilience. The midstream area, centered on cities such as Xi’an and Zhengzhou, forms a strong diffusion belt radiating outward. In the downstream area, multiple significant hotspots are concentrated, demonstrating high resilience and functioning as growth poles for tourism development.

3.2. Spatial Correlation Analysis of Tourism Economic System Resilience and Transportation Accessibility

3.2.1. Analysis of Transportation Accessibility Measurement Results

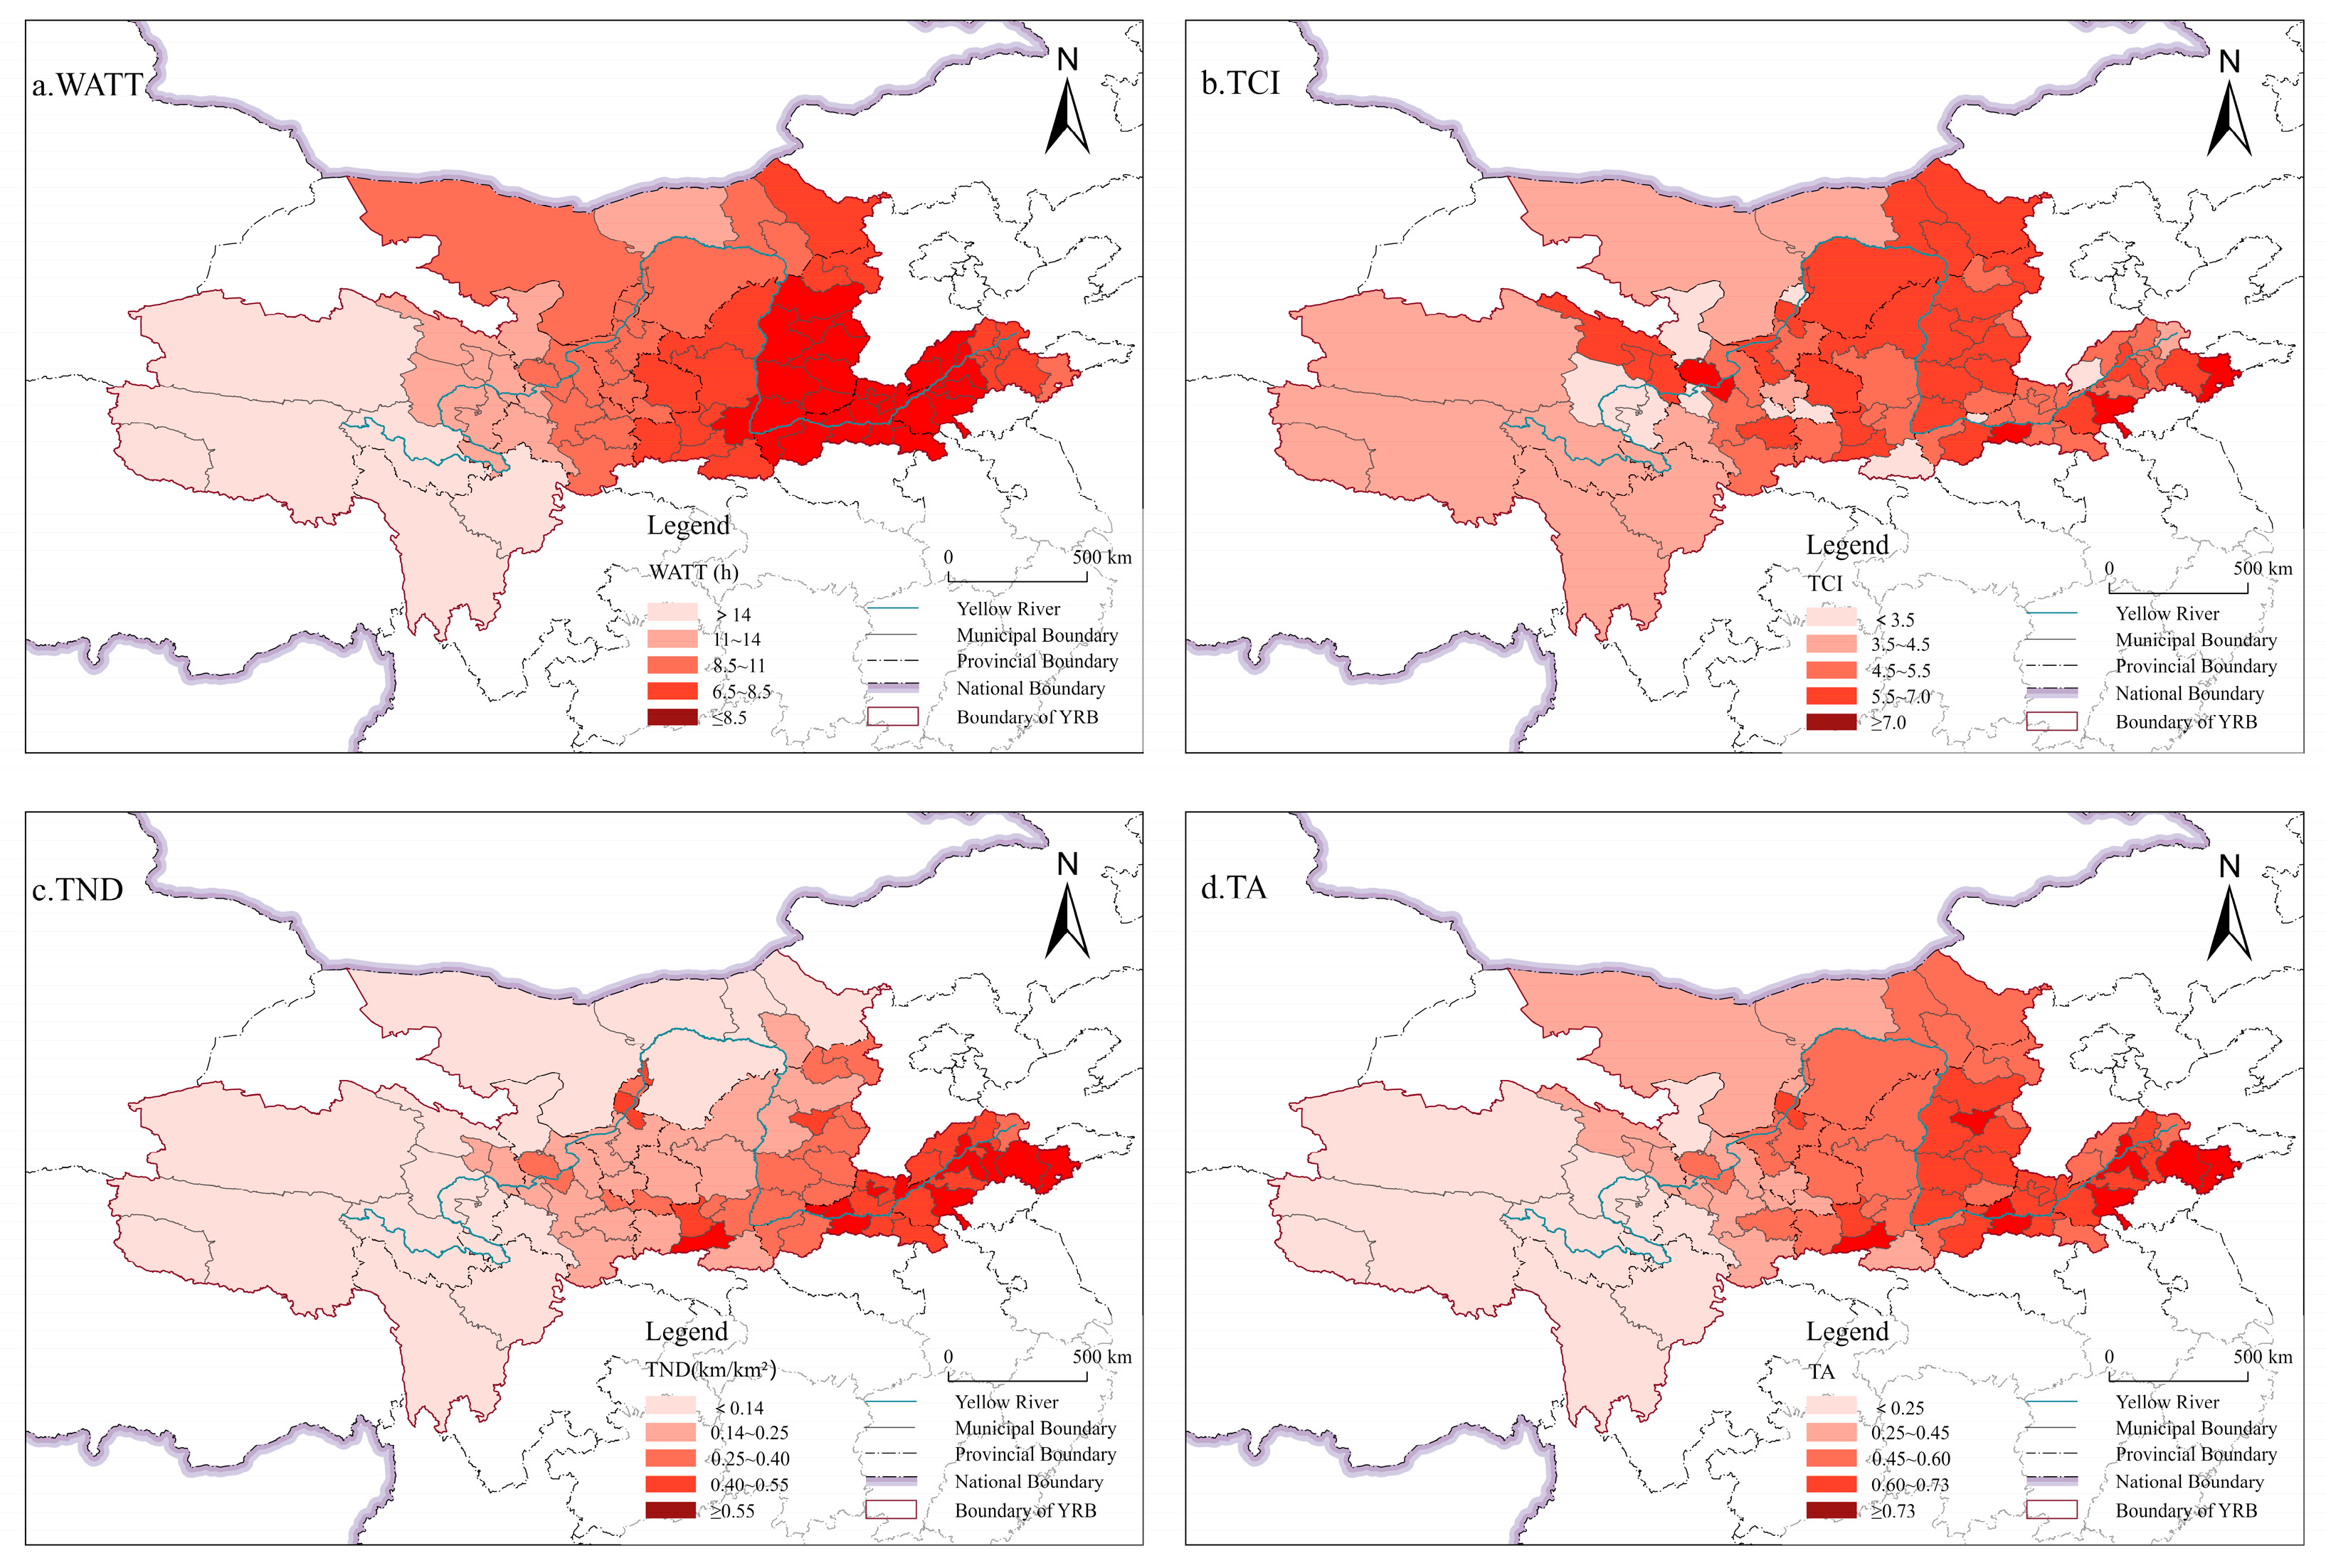
Building on the previously defined indicator calculation methods, each transportation indicator—transportation network density, trunk-line influence, and WATT—was classified into five levels and mapped for spatial visualization (Figure 6a–c). The three standardized indicators were then aggregated using a weighted overlay method to derive overall transportation accessibility (TA) for each city (Figure 6d).
High-accessibility areas are concentrated along major trunk transport corridors, particularly in regions characterized by dense networks of high-speed railways, highways, and airports (Figure 6d). At the regional scale, the eastern and midstream areas demonstrate clear transportation advantages, forming distinct high-value clusters. In contrast, the western and upstream regions face significant transportation disadvantages, with spatial connectivity remaining notably weak. Regions such as the Central Plains Urban Agglomeration and the Shandong Peninsula, supported by dense trunk railway systems and multi-node aviation hubs, exhibit high TND, strong TCI, and low WATT. These conditions collectively create regional “advantage islands,” where TA levels are significantly higher than in surrounding areas. Conversely, the northwestern and peripheral areas of the Qinghai–Tibet Plateau, constrained by complex topography and underdeveloped transport infrastructure, display markedly low TA levels, forming a “low–low” spatial clustering pattern.

3.2.2. Bivariate Local Spatial Autocorrelation Analysis of Tourism Economic System Resilience and Transportation Accessibility

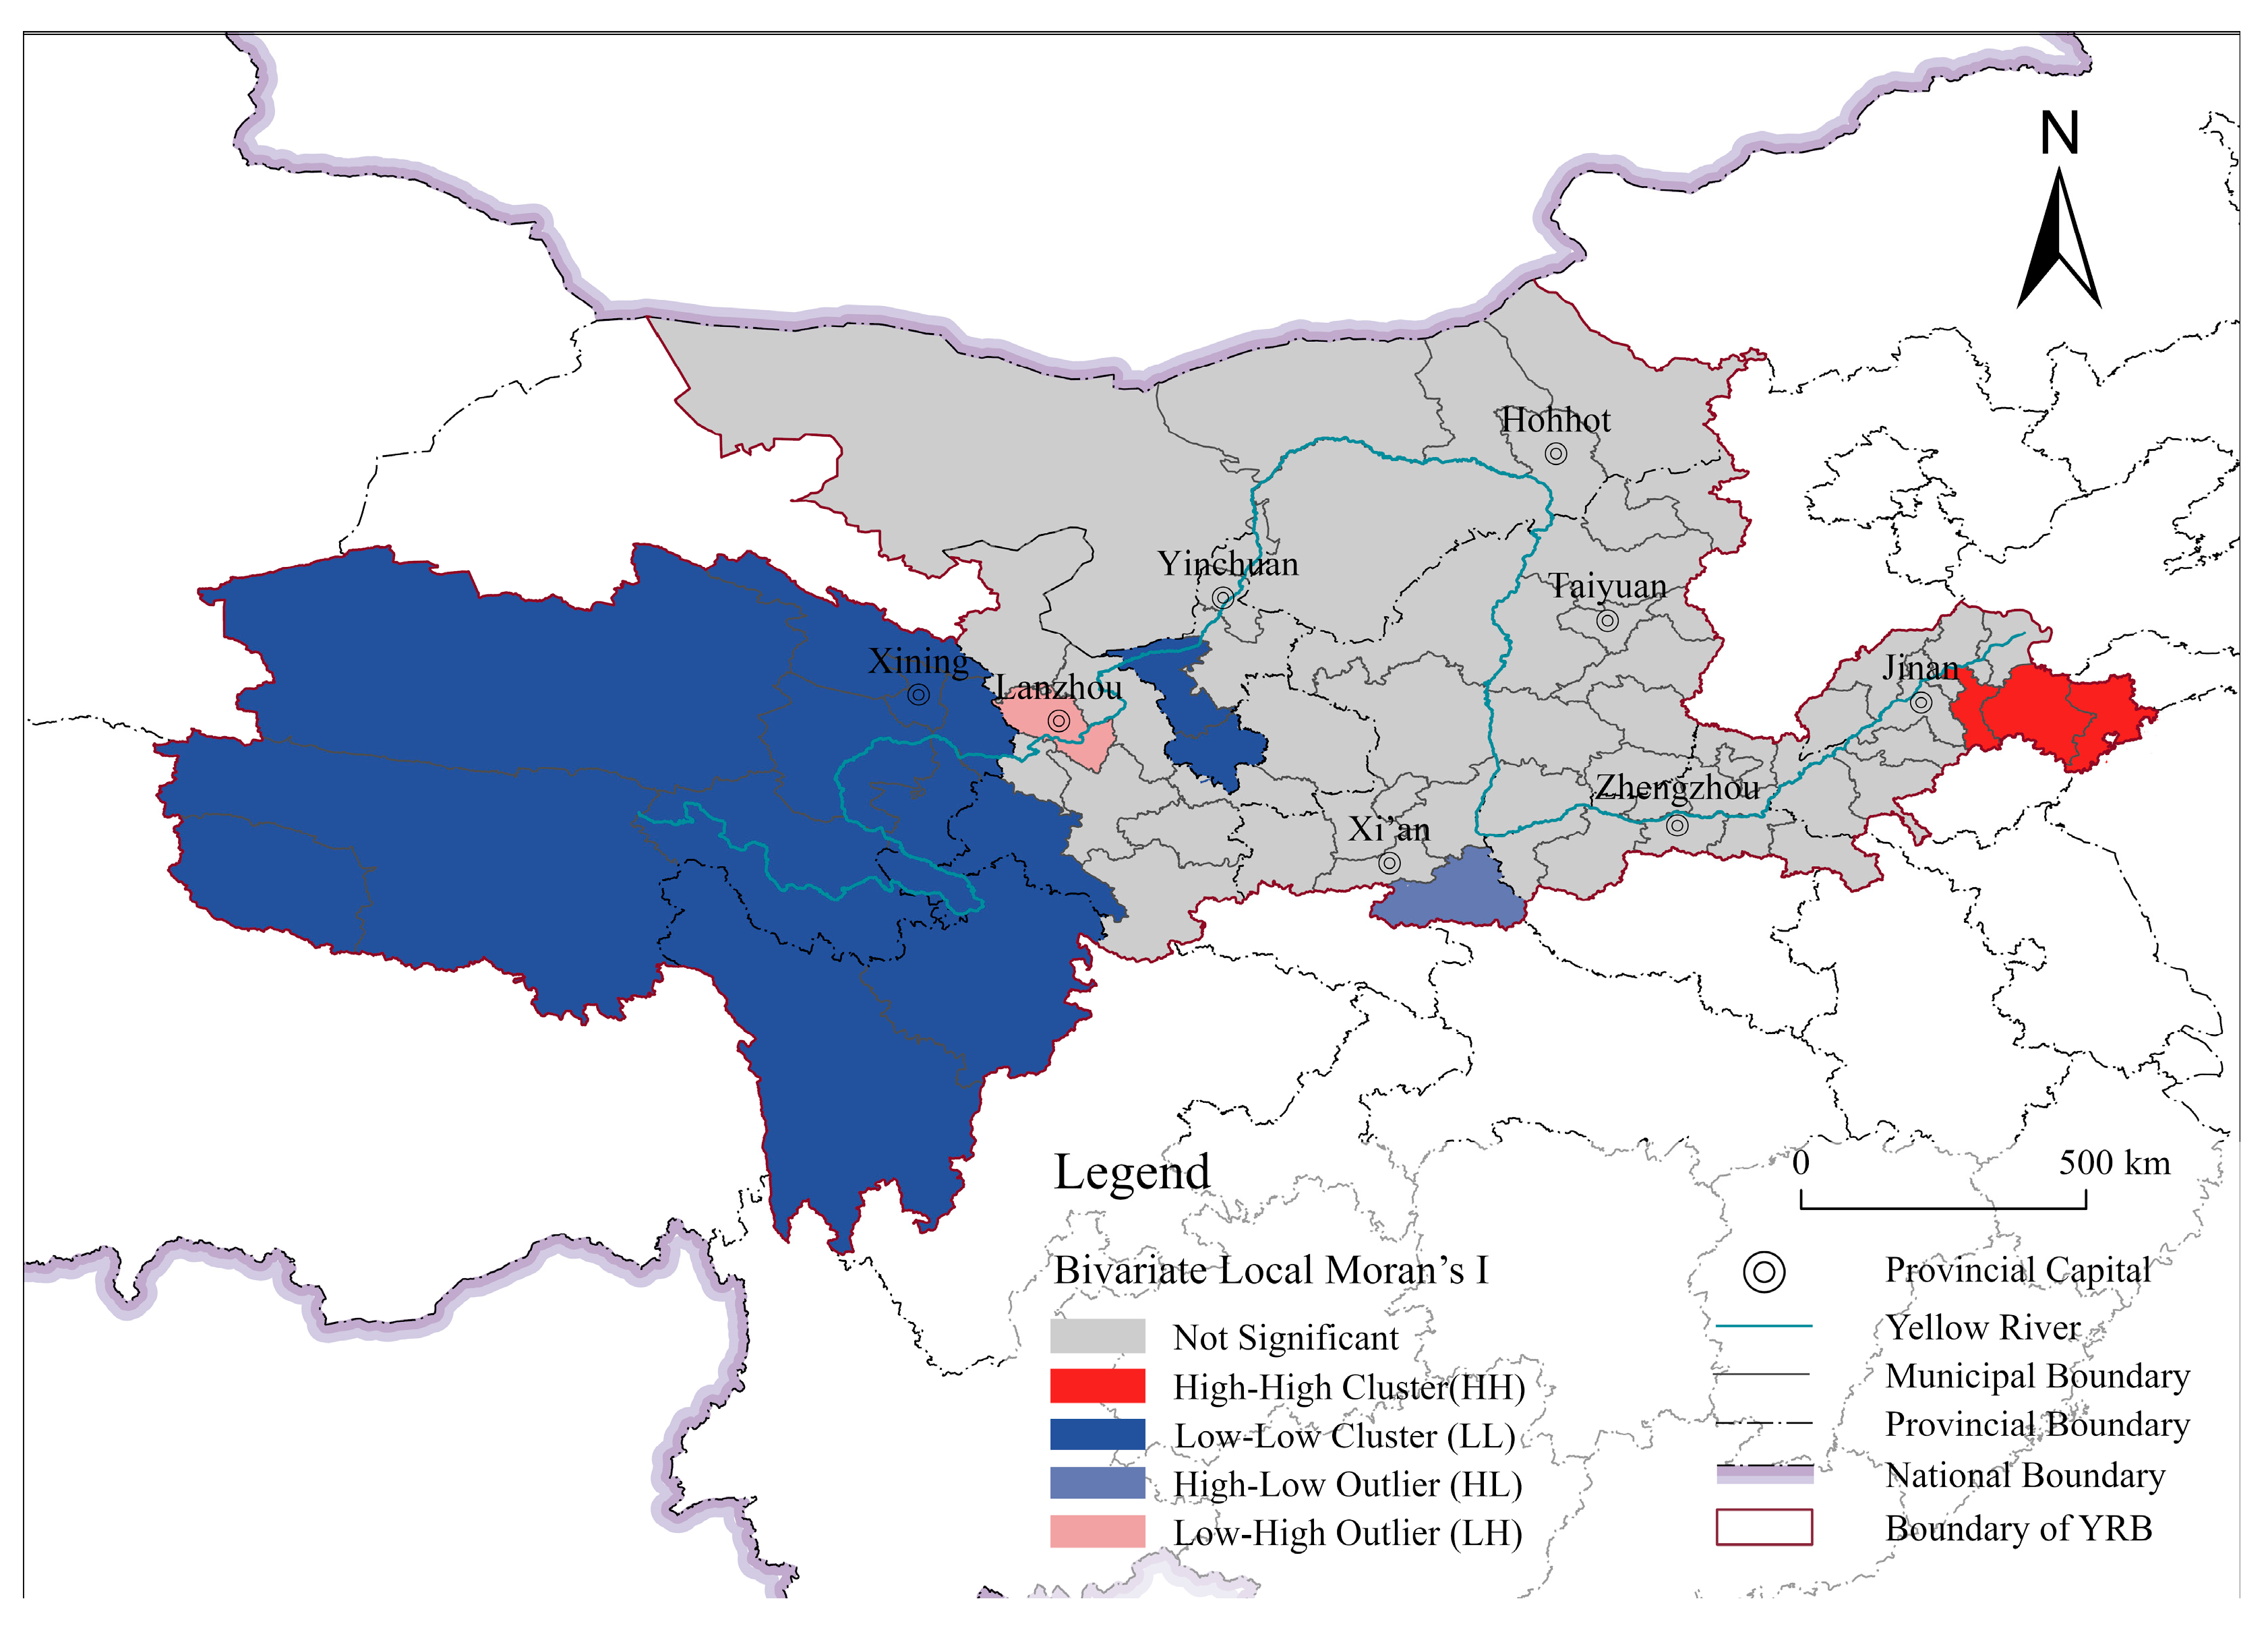
The bivariate local spatial autocorrelation between tourism economic system resilience and transportation accessibility was analyzed to produce a LISA clustering map, revealing the spatial association patterns between the two variables (Figure 7). High–high (HH) clusters are concentrated in economically developed areas of the Shandong Peninsula in the middle and lower reaches of the Yellow River. In these regions, transportation accessibility advantages are pronounced, and neighboring areas also exhibit high levels of tourism economic system resilience, indicating a strong positive spatial association between transportation accessibility and tourism resilience. In contrast, low–low (LL) clusters are widely distributed in the upper reaches of the Yellow River Basin and western regions, particularly in Qinghai, Gansu, and northern Sichuan. These areas are characterized by weak tourism system resilience and generally low transportation connectivity, forming a spatial pattern characterized by the co-occurrence of lower accessibility and lower resilience.
Low–high (LH) clusters are primarily observed in areas with relatively high accessibility but insufficient surrounding tourism resilience, with Lanzhou serving as a representative case. As an important provincial capital in Northwest China, Lanzhou benefits from strong trunk-line connections and high transport network density, functioning as a regional core hub. However, the surrounding areas exhibit comparatively lower levels of tourism resilience, suggesting spatial disparities between transport accessibility and tourism development. High–low (HL) clusters are concentrated mainly in Shangluo, located in the central Qinling Mountains. Although Shangluo has recently achieved “high-speed access to all counties,” with high-speed rail still under construction, its external accessibility remains relatively weaker than that of many prefecture-level cities. In contrast, neighboring cities possess abundant tourist attractions, favorable ecological and health conditions, and rich natural endowments, resulting in higher tourism resilience in surrounding areas.

3.3. Analysis and Study of the Influencing Factors of Tourism Economic System Resilience

3.3.1. Correlation Analysis of Influencing Factors

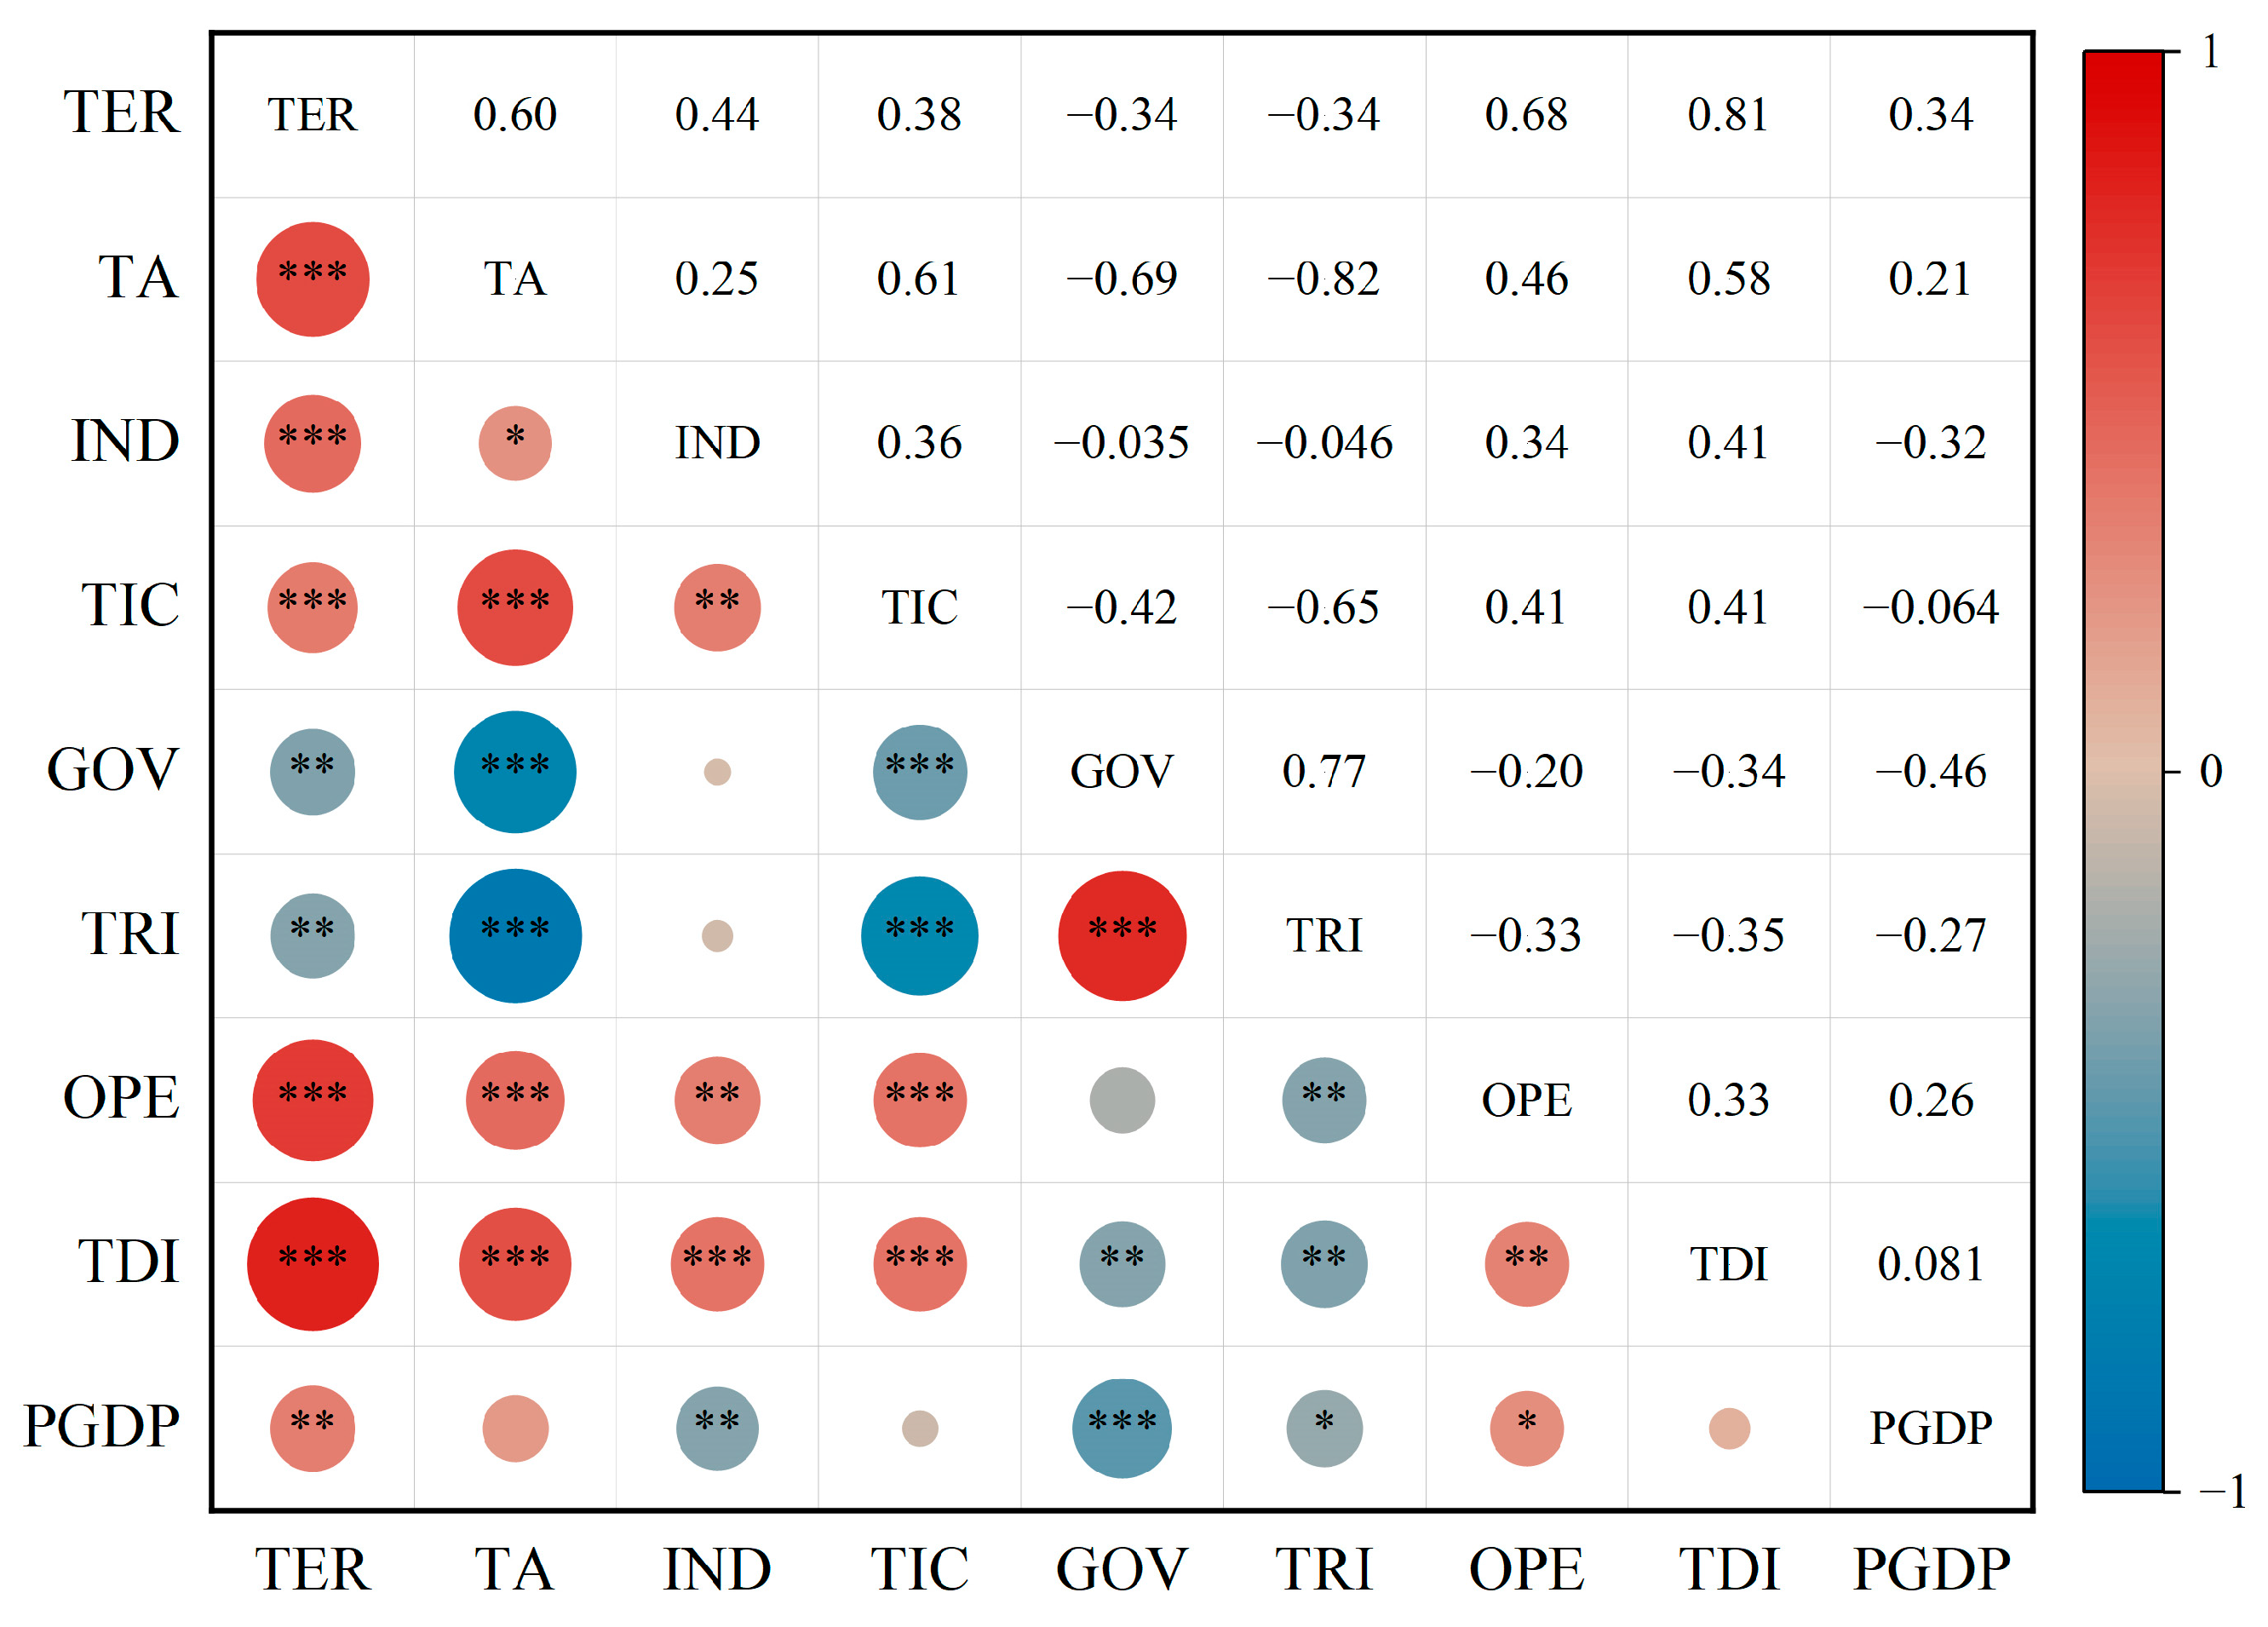
Pearson correlation analysis was conducted to examine the associations between tourism economic system resilience (TER) and its potential influencing factors. Figure 8 presents the correlation matrix, where color gradients and coefficient values (ranging from −1 to 1) indicate the strength and direction of correlations. The results indicate that TER is significantly negatively correlated with government intervention (GOV) and topographic relief (TRI) (p < 0.01). In contrast, TER is positively correlated with the tourist density index (TDI) (p < 0.001) and significantly positively correlated with transportation accessibility (TA) and openness (OPE) (p < 0.01). Correlations with industrial structure (IND) and per capita GDP (PGDP) are not statistically significant (p ≥ 0.05). Moreover, varying degrees of correlation are observed among the influencing factors themselves, indicating the potential interrelationships among these variables.

3.3.2. Validation of the GWRF Model and Parameter Optimization

To ensure reliable model fitting, model validation and parameter selection were conducted prior to analyzing the spatial heterogeneity of influencing factors. As a spatially explicit modeling approach integrating spatial heterogeneity with nonlinear learning, the performance of the GWRF model largely depends on bandwidth selection and the balance between local and global learning. Accordingly, multiple local–global weight combinations within the range of 0.1–1.0 were tested. Model performance was evaluated using four indicators, including the coefficient of determination (R2), root mean square error (RMSE), relative root mean square error (RRMSE), and mean absolute error (MAE), based on the agreement between predicted and observed values. The results indicate that model performance improves as the local weight increases. Considering model stability and generalization ability, the model with a local weight of 0.9 and a global weight of 0.1 was selected as the optimal specification.
To further assess model performance, the GWRF model was compared with three commonly used models, namely, the Ordinary Least Squares (OLS) regression model, the Geographically Weighted Regression (GWR) model, and the random forest (RF) model. Model comparisons were conducted based on in-sample fitting results, and the corresponding results are summarized in Table 5. The comparison results show that the GWRF model achieved superior fitting performance across all evaluation metrics. Therefore, the GWRF model was adopted for subsequent analyses in this study.

3.3.3. Importance Ranking of the Influencing Factors

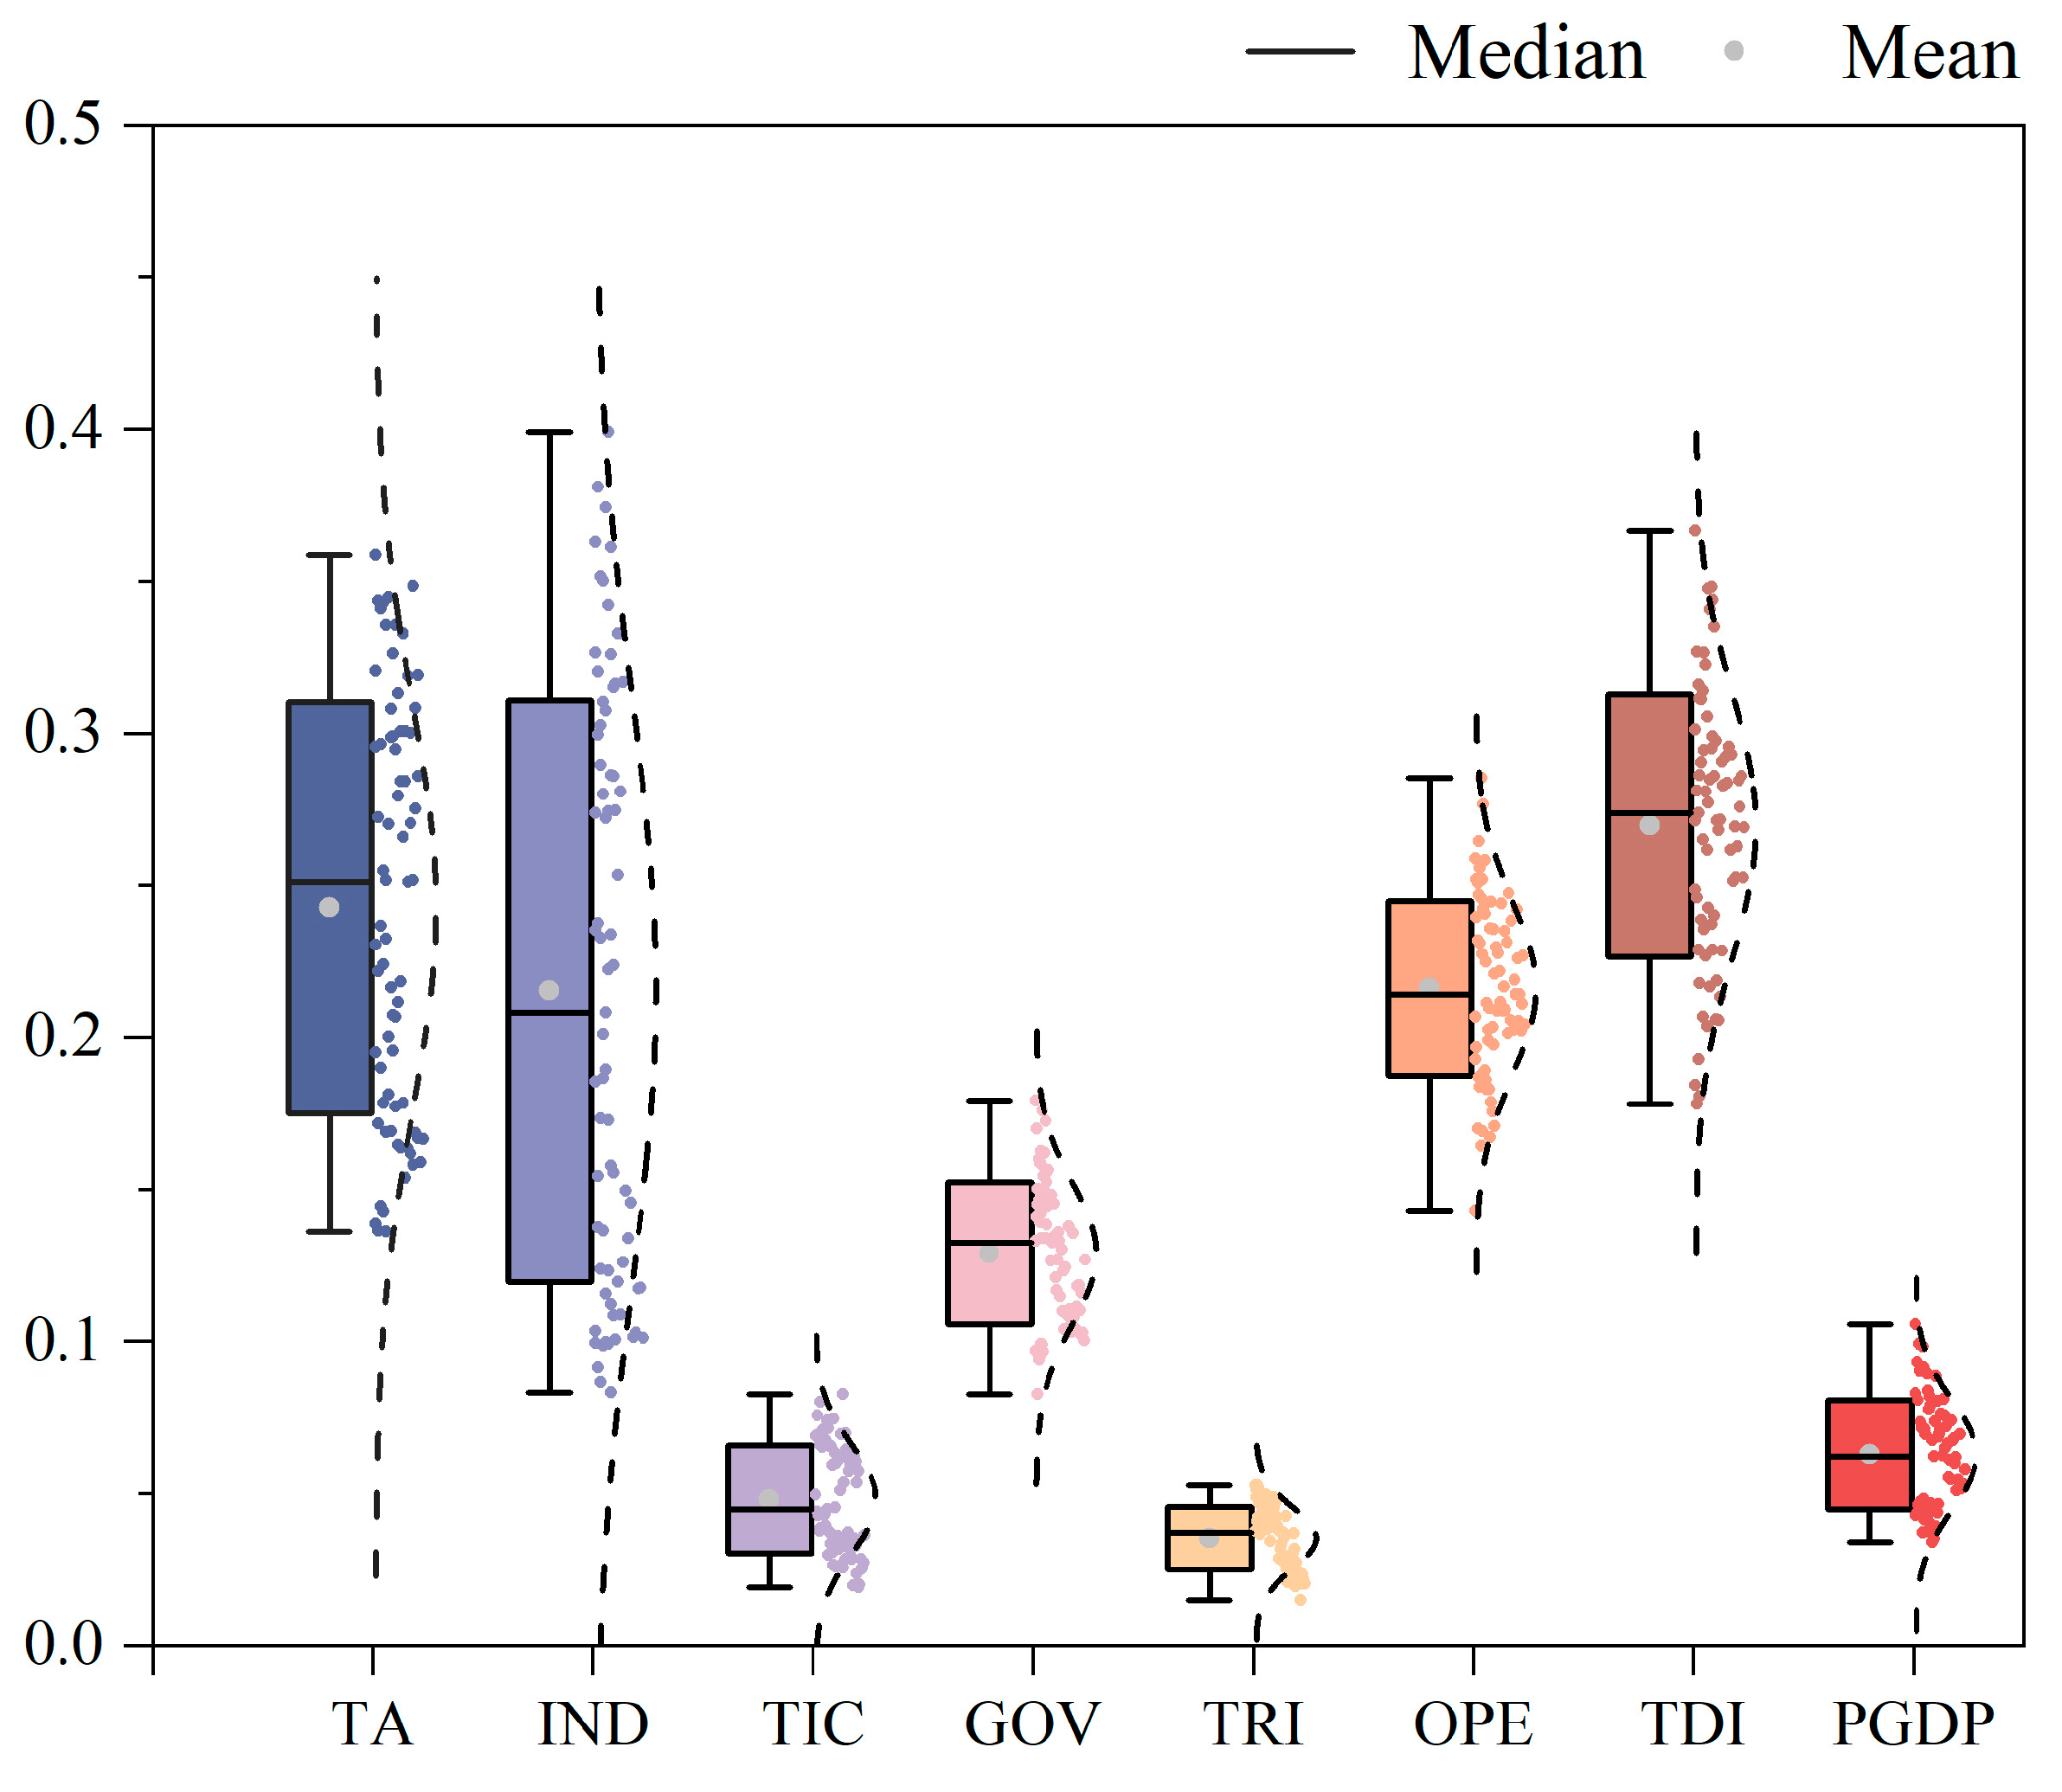
Based on the boxplots of local feature importance derived from the GWRF model (Figure 9), the tourist density index (TDI) exhibits the highest median and mean values across all cities, followed by transportation accessibility (TA), indicating relatively high overall importance in explaining tourism economic system resilience at the basin-wide scale. TA shows a median importance of approximately 0.25, with a relatively wide distribution, reflecting pronounced spatial heterogeneity in its explanatory power. Industrial structure (IND) and openness (OPE) also demonstrate relatively high importance and exhibit consistently positive effects on resilience across most regions. In contrast, technological innovation capacity (TIC), natural environmental conditions (TRI), and per capita GDP (PGDP) display lower importance scores, indicating weaker explanatory power across the basin. Overall, TA, IND, TDI, and OPE constitute the dominant influencing factors in the tourism economic system, reflecting a pattern of heterogeneous but structurally stable key drivers of resilience.
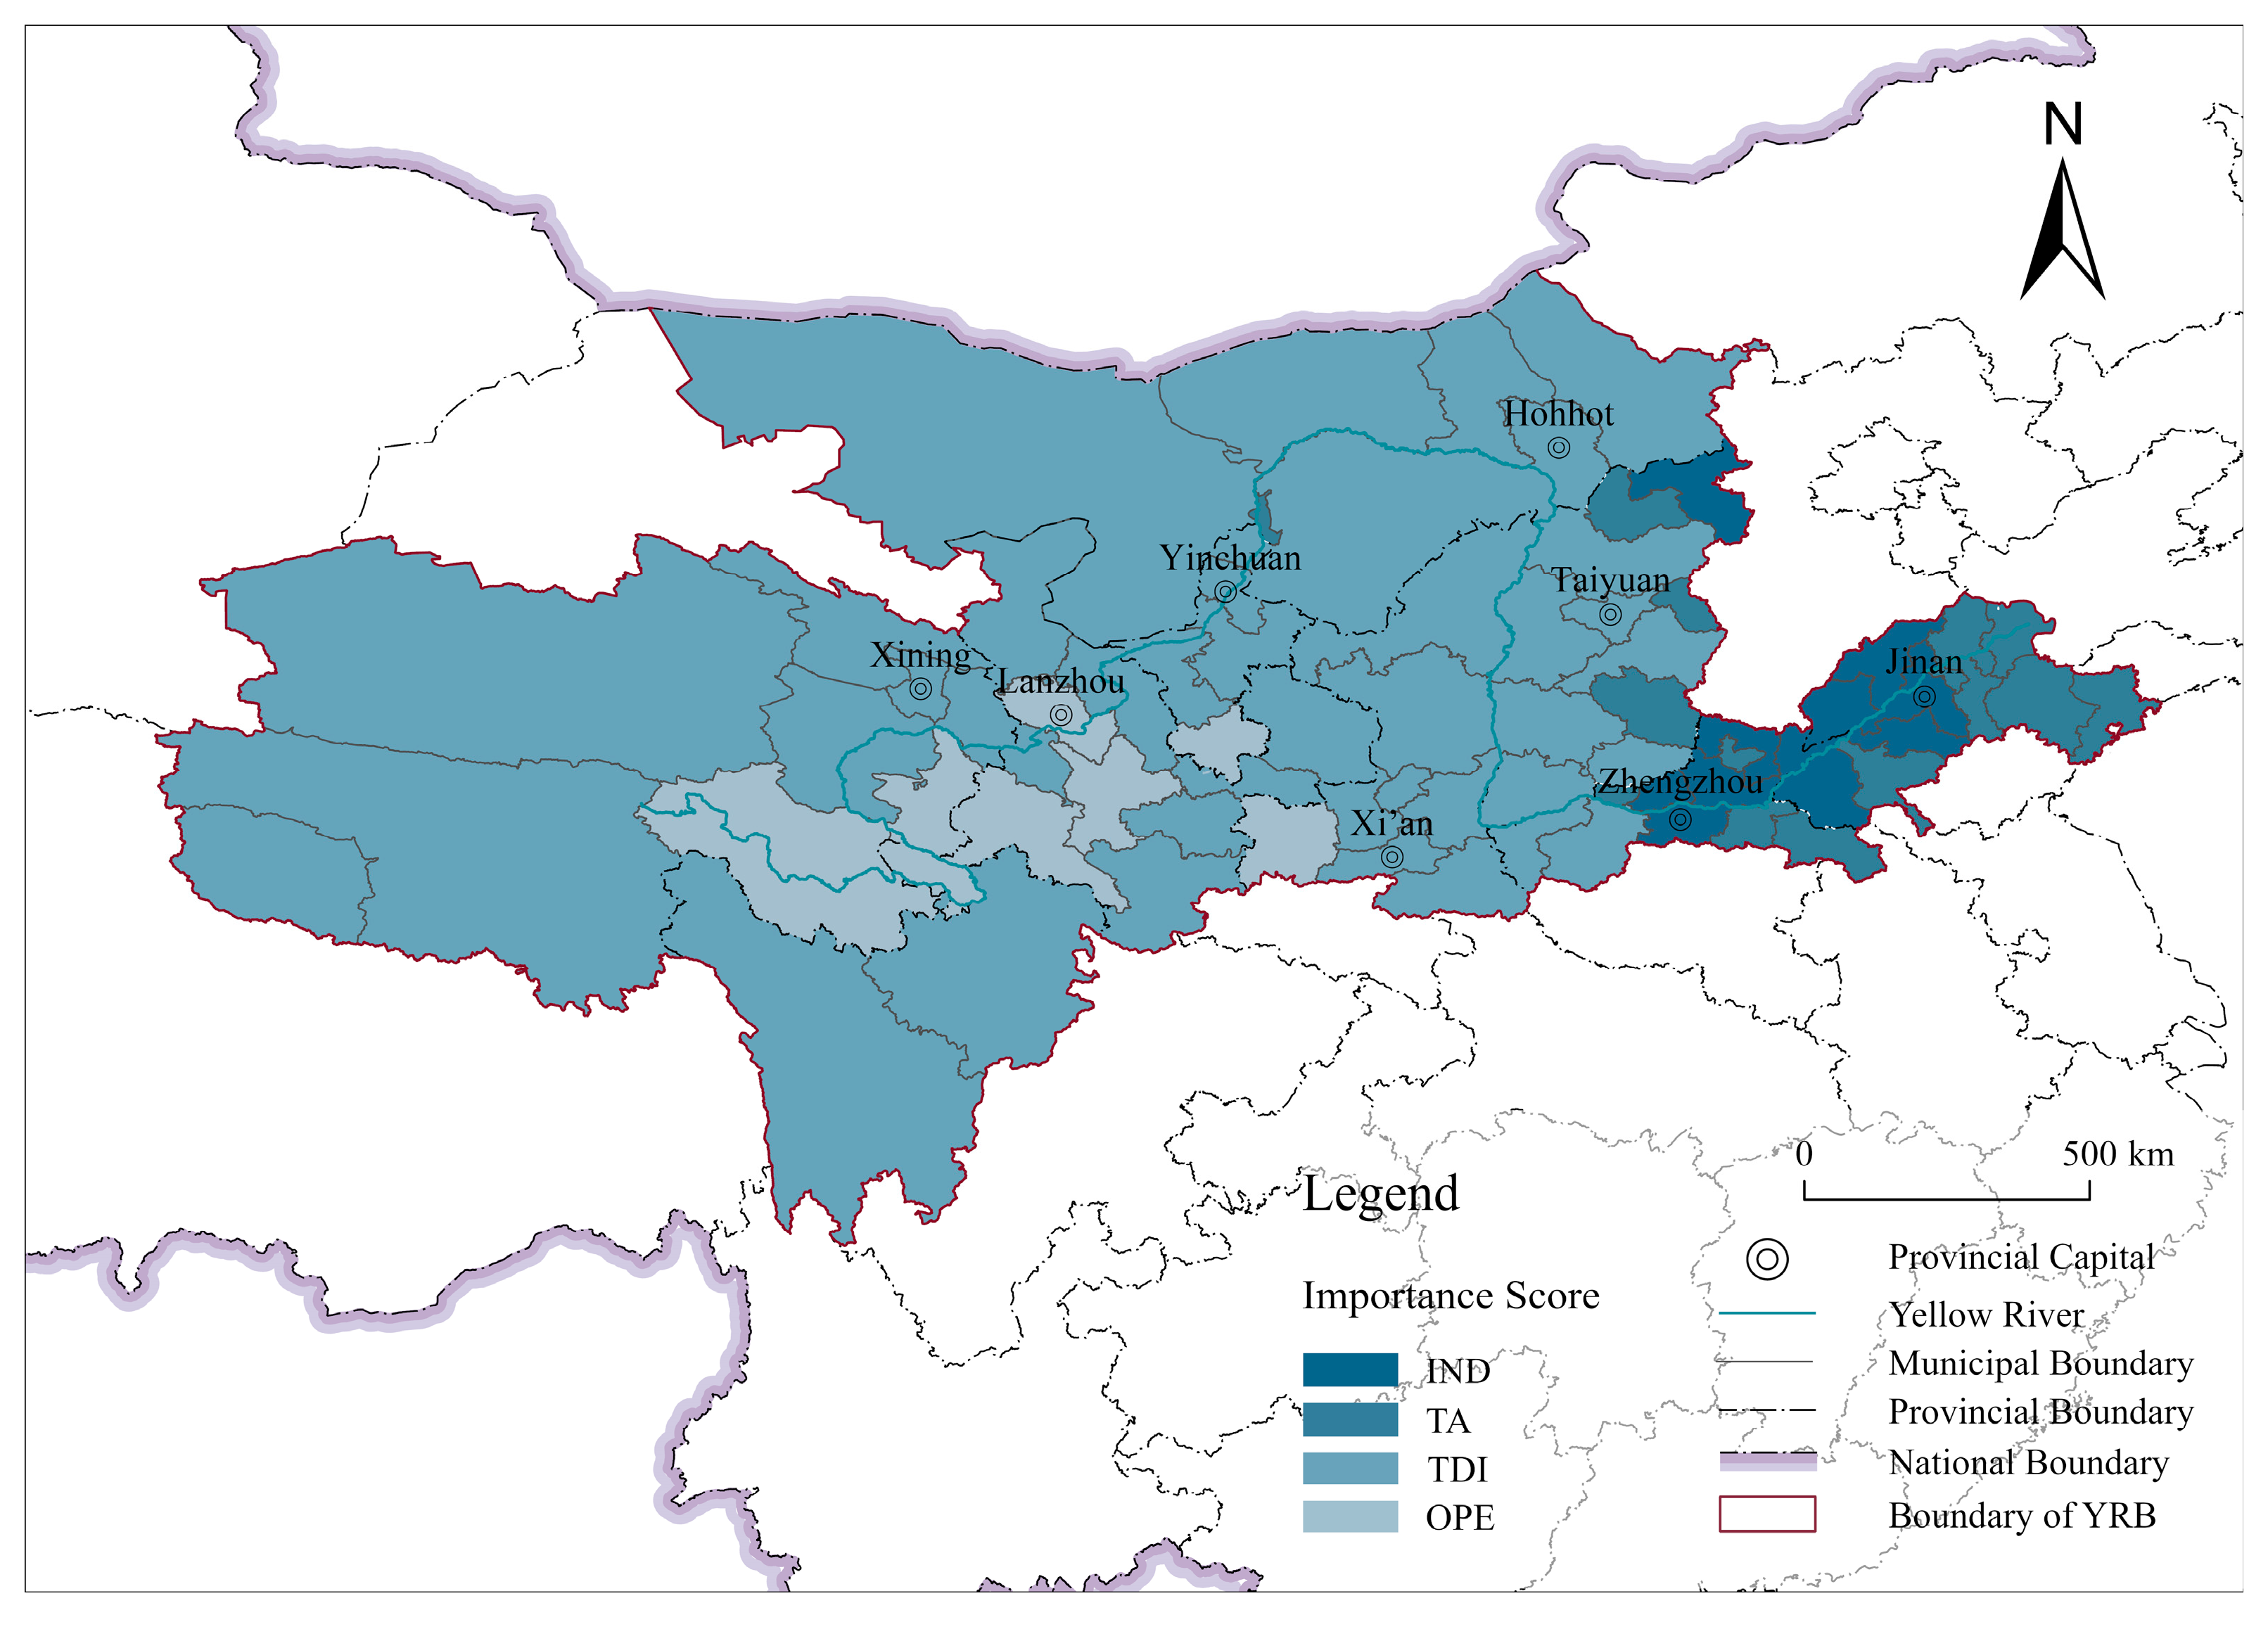
Spatially, cities with the highest explanatory power for transportation accessibility in shaping tourism economic system resilience are primarily concentrated in the central and lower reaches of the Yellow River Basin, particularly in Shandong, Shaanxi, and parts of Henan (Figure 10). The tourist density index (TDI) accounts for nearly half of the cities exhibiting the greatest variability in tourism economic system resilience, with its influence extending across both the central and western parts of the basin. Industrial structure explains approximately 15% of the spatial variance, while openness contributes around 9%, together accounting for 24%. Overall, TDI emerges as the most influential factor shaping the spatial distribution of tourism economic system resilience throughout the Yellow River Basin.
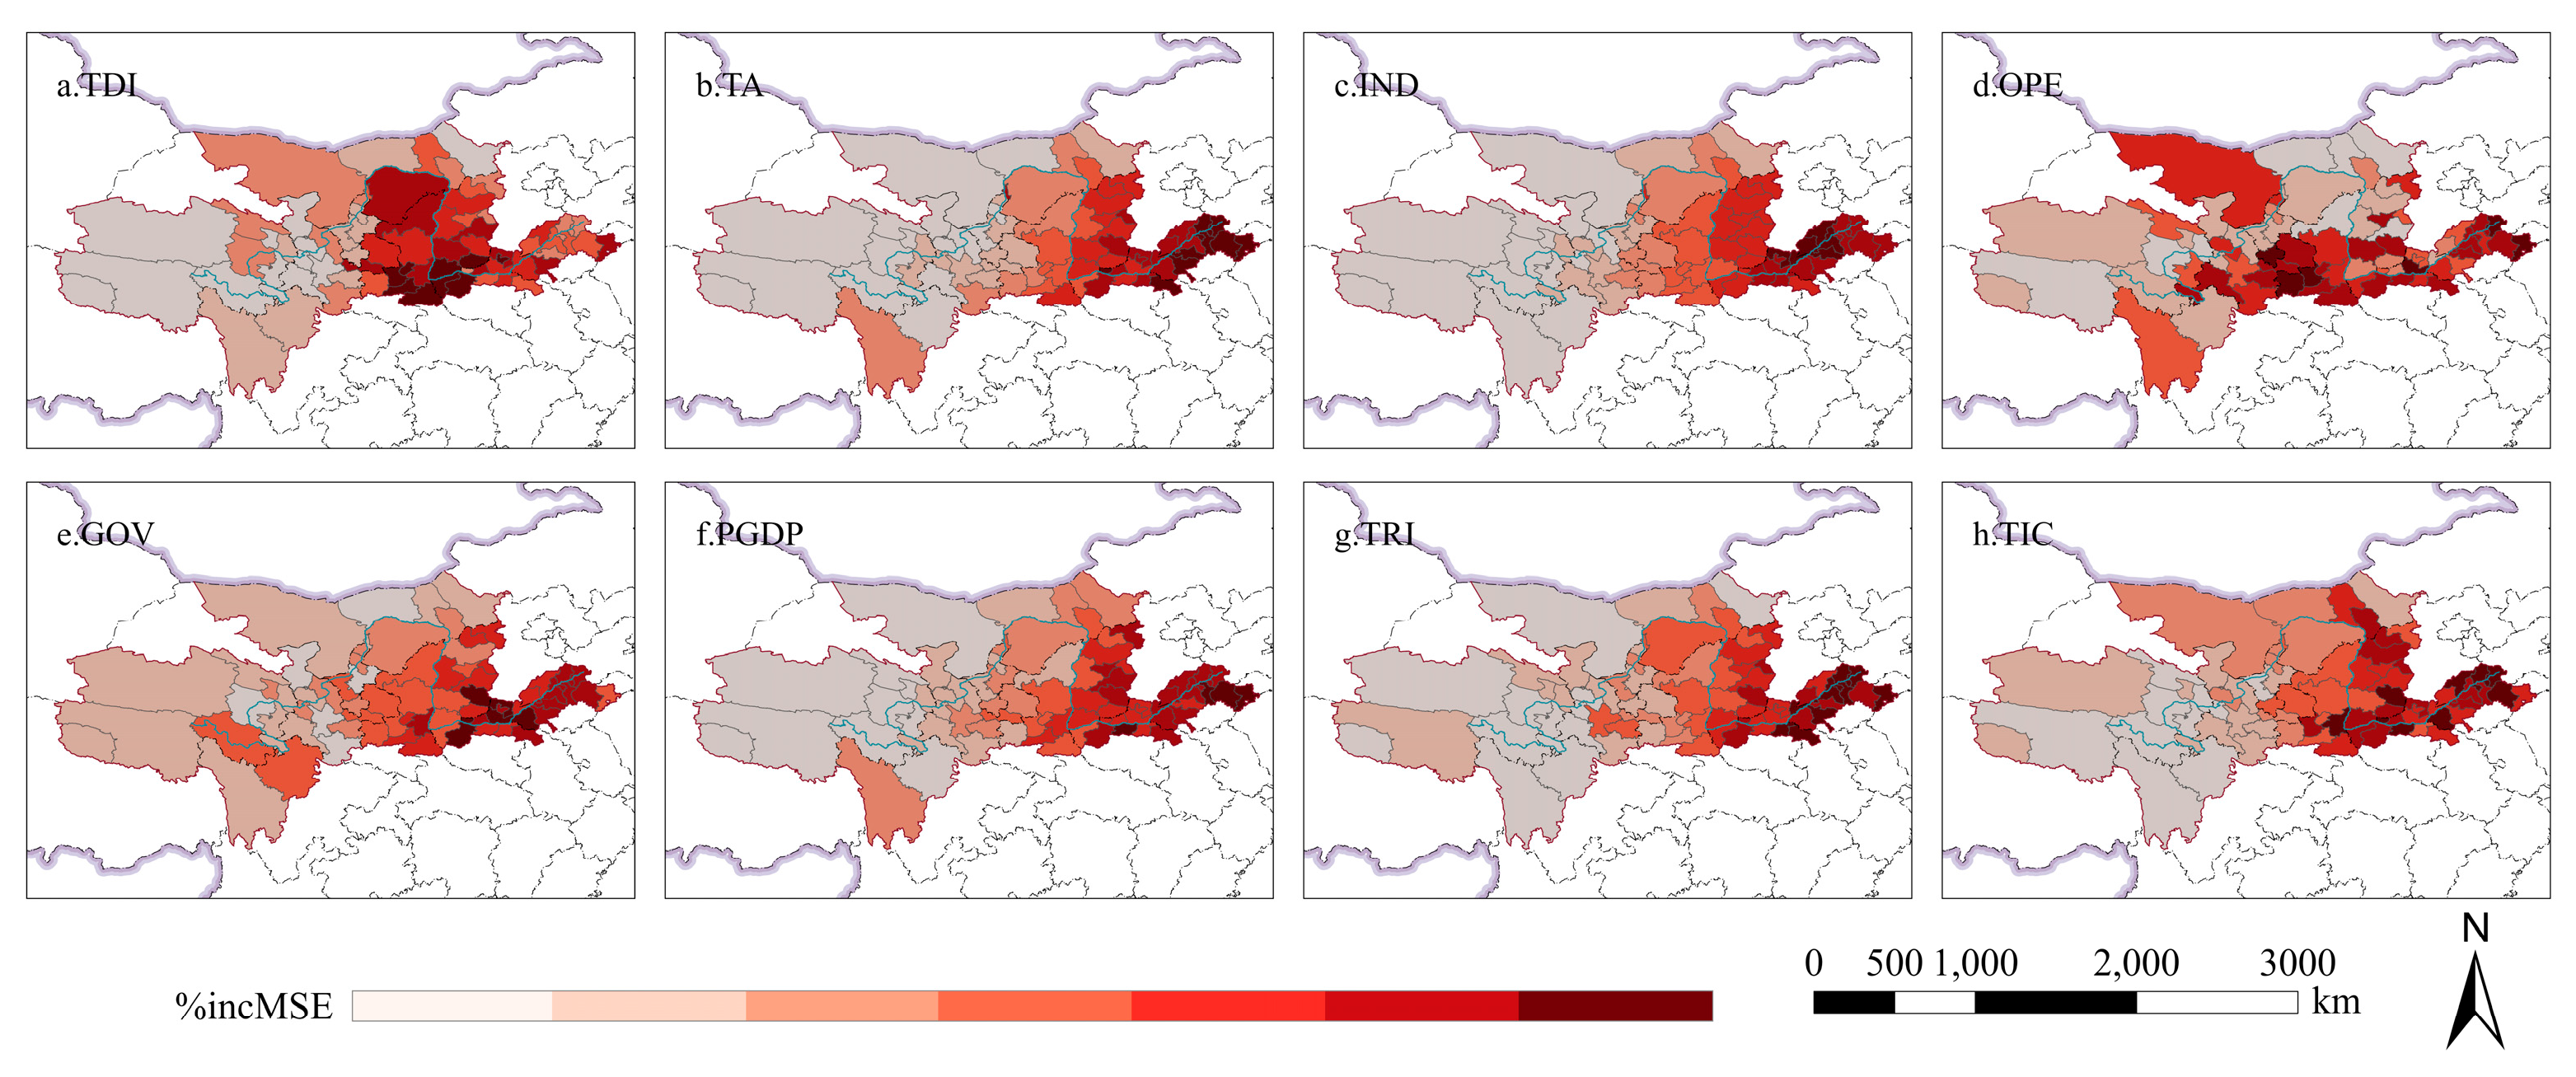
Figure 11 spatially visualizes the importance scores of the influencing factors. The results indicate that transportation accessibility, economic development, natural environmental conditions, and technological innovation generally exhibit an east–west gradient, decreasing from coastal to inland areas. This pattern can be partly attributed to the stronger environmental carrying capacity and superior resource endowments of eastern coastal cities. In contrast, the tourist density index and openness are primarily concentrated in the central and eastern regions, with a tendency to diffuse outward.

3.3.4. Analysis of the Impact of Transportation Accessibility on the Urban Tourism Economic System Resilience

Drawing on the results of the preceding analyses and the high predictive performance of the GWRF model, this study concludes that transportation accessibility is significantly and positively associated with tourism economic system resilience in the cities of the Yellow River Basin, with a particularly strong effect observed in the downstream regions.
Specifically, the GWRF results show that cities where transportation accessibility emerges as the dominant explanatory factor (Figure 10) are primarily concentrated in the central and lower reaches of the Yellow River Basin, including Qingdao, Weifang, Yangquan, and Dongying. These areas are characterized by relatively complete infrastructure, stronger urban economies, and wider accessibility radii for tourism resources. In these cities, transportation accessibility exerts strong explanatory power across three dimensions of tourism economic system resilience—resistance, adaptability, and transformability—suggesting that a well-developed transport network significantly strengthens both the robustness and adaptability of urban tourism systems.
In contrast, western cities such as Yushu Prefecture, Guoluo Prefecture, Zhongwei, and Wuwei, located in the periphery of the basin, suffer from incomplete infrastructure and weak connectivity, resulting in relatively fragile tourism economic resilience. As illustrated in Figure 11, the importance scores for transportation accessibility follow a pronounced east–west gradient pattern, with higher values in the east and lower values in the west, underscoring its foundational role in shaping the spatial pattern of tourism development in the Yellow River Basin. Even centrally located cities such as Baoji, Xianyang, and Yulin face infrastructure constraints due to complex topography and relatively limited economic appeal. Similarly, western cities such as Xining, Lanzhou, and Yinchuan, despite their advantages in tourist density or openness, remain hindered by inadequate transport connectivity, one of the primary obstacles to enhancing tourism system resilience.
Overall, these findings emphasize that improving transportation accessibility—particularly by strengthening intercity connectivity between regional hubs and peripheral areas—represents a critical pathway for promoting more balanced and spatially coordinated development of tourism economic system resilience in the Yellow River Basin.

4. Discussion

4.1. Spatial Correlation Between Transportation Accessibility and Tourism Economic System Resilience

A comprehensive transportation accessibility evaluation model was constructed by integrating weighted average travel time, trunk-line influence, and network density. This composite indicator provides a more accurate representation of overall urban travel conditions and highlights the pronounced accessibility advantages of cities located in the middle and lower reaches of the Yellow River Basin. Partial dependence plots were used to illustrate the marginal associations between each predictor and the tourism economic resilience index. For example, the partial dependence plot for transportation accessibility shows a positive association with the resilience index, suggesting that regions with higher accessibility tend to have higher resilience potential. Enhancements to transportation networks improve intercity tourist mobility and optimize the allocation of tourism resources, thereby indirectly strengthening the adaptive capacity and robustness of tourism systems. These findings are consistent with prior research and further reinforce the argument that transportation accessibility is an important factor of tourism resilience [40,41].

4.2. Identification of the Spatial Heterogeneity of Resilience Constraints: An Empirical Analysis Based on the RF and GWRF Models

Global variable importance analysis based on the RF model shows that transportation accessibility ranks among the most important explanatory variables in terms of average importance (%IncMSE), second only to the tourist density index (TDI), highlighting its critical role in shaping tourism economic system resilience. In several cities located in the middle and lower reaches of the Yellow River Basin, such as Qingdao and Zibo, transportation accessibility exerts a particularly strong influence on resilience. This finding suggests that even coastal cities outside the geographic core of the basin can enhance tourism resilience by capitalizing on their well-developed road networks and transport infrastructure. Overall, the results underscore the capacity of transportation accessibility to reduce spatial frictions and strengthen interregional tourism linkages, thereby contributing substantially to tourism economic system resilience.
A comparison between the RF and GWRF results further reveals that, while the overall ranking of influencing factors remains broadly consistent, substantial local heterogeneity persists across cities. Reliance solely on global models risks obscuring localized resilience constraints, whereas spatially explicit approaches can identify city-level bottlenecks with greater precision. These findings further demonstrate that tourism economic system resilience exhibits pronounced spatial heterogeneity, implying that uniform policy interventions may inadequately address geographically differentiated resilience constraints. Therefore, differentiated and place-based governance strategies are required to better account for local heterogeneity and enhance tourism system resilience.

4.3. Differentiated Policy Recommendations

Building on the spatial heterogeneity patterns revealed by the GWRF model, the dominant factors influencing tourism economic system resilience were identified for different cities, thereby clarifying differentiated development pathways and strategic positioning. Based on these findings, place-based policy recommendations are proposed to address region-specific resilience constraints.
High-resilience and high-accessibility cities, such as Luoyang, Zhengzhou, Qingdao, Jinan, should prioritize “tourism+” modernization, diffuse high-quality resources to neighbors and entrench cross-jurisdictional governance [42,43]. Cities characterized by relatively low resilience but favorable accessibility conditions, including Zibo, Liaocheng, and Jiyuan, can leverage spillover from adjacent cores by building coordinated linkage mechanisms that stimulate local demand and sustain growth. Ecologically sensitive transition areas, such as northern Shaanxi and Lanzhou, must upgrade cross-regional transport while adding value to eco-cultural assets, linking scattered resources into an integrated network [44]. Meanwhile, upstream ecological conservation zones, including Xining and the Sichuan–Tibet fringe, should prioritize ecological restoration over tourism expansion, improve basic transportation connectivity, and promote low-intensity, environmentally sustainable tourism to maintain long-term ecosystem stability [15].

4.4. Limitations of the Study

This study is not without limitations. First, regarding data availability, limited accessibility prevented a comprehensive consideration of the “time–space compression effect” induced by the high-speed rail network. Future research could integrate quantitative simulations, real-time big data–driven traffic models, and measures of both individual and group spatiotemporal accessibility to yield more precise evaluations of transportation accessibility. Second, with respect to model specification, the GWRF model employed a uniform weighting scheme across cities rather than differentiated weights, which may have constrained its ability to fully capture city-specific heterogeneity. Moreover, variable selection was standardized and did not incorporate targeted screening based on city-specific characteristics, potentially overlooking locally salient factors. Third, in terms of temporal scope, the analysis was limited to a single year and thus could not capture longitudinal patterns. As a result, the study can only identify associations between variables and tourism economic system resilience and does not support causal inference. Future studies should adopt panel data to examine the dynamic evolution of tourism economic system resilience over time.
Although the GWRF model demonstrated comparatively strong fitting performance, model validation in this study was based on full-sample fitting rather than independent validation, which may still involve potential overfitting risks. Nevertheless, parameter sensitivity analysis indicated relatively stable performance near the optimal parameter configuration, providing partial support for model robustness. Future research may further incorporate spatial cross-validation, bootstrapping techniques, or independent validation datasets to strengthen model generalizability and predictive reliability.

5. Conclusions

Drawing on 2022 tourism and economic statistical data and traffic network information for the Yellow River Basin, this study examined the spatial differentiation of tourism economic system resilience and evaluated the role of transportation accessibility as a core explanatory factor. The key findings are as follows:
(1) Overall levels of transportation accessibility and tourism economic system resilience across cities in the Yellow River Basin exhibit pronounced spatial disparities, following a clear “core–periphery” spatial structure. Provincial capitals and economically developed cities, supported by relatively advanced infrastructure and concentrated development resources, generally demonstrate stronger tourism economic resilience. At the interregional scale, the eastern region markedly outperforms the central and western regions, forming a spatial gradient that declines from the coast inland. Regarding transportation accessibility, its three constituent components display distinct spatial patterns. In terms of transportation accessibility, its constituent dimensions exhibit differentiated spatial characteristics, jointly reflecting disparities in transport infrastructure development, network connectivity, and regional accessibility conditions.
(2) Tourism economic system resilience exhibits significant spatial clustering and regional heterogeneity across the Yellow River Basin. Bivariate LISA analysis reveals a significant spatial association between transportation accessibility and tourism economic system resilience, indicating that their relationship is spatially structured rather than randomly distributed. Specifically, eastern cities are predominantly characterized by high–high (HH) clusters, while western cities in Qinghai, Gansu, and Sichuan are mainly concentrated in low–low (LL) clusters, reflecting substantial regional differences in resilience capacity and accessibility conditions. These findings demonstrate that transportation accessibility constitutes an important spatial determinant of tourism economic system resilience and highlight the necessity of incorporating spatial heterogeneity into resilience assessment and policy design.
(3) Comparative analysis of the OLS, GWR, RF, and GWRF models demonstrates that the GWRF model provides the best overall fitting performance in explaining tourism economic system resilience. By simultaneously accounting for spatial heterogeneity and nonlinear relationships, the GWRF model exhibits stronger predictive capacity and greater explanatory flexibility in characterizing resilience-related factors.
(4) Drawing on the GWRF regression results, Pearson correlation analysis, and variable importance rankings, this study systematically highlights the pivotal role of transportation accessibility in shaping tourism economic system resilience in the Yellow River Basin. Accessibility is positively and significantly associated with resilience, with its explanatory power and spatial influence particularly pronounced in downstream cities, where economic development and transport infrastructure are more advanced. The GWRF results show that cities such as Qingdao, Weifang, Yangquan, and Dongying situated in the eastern and middle–lower reaches benefit from well-developed infrastructure and strong network spillover effects, which enhance the resilience, adaptability, and transformative capacity of their tourism systems. In contrast, peripheral western cities face substantial disadvantages in resilience due to limited accessibility.
Spatially, the importance of transportation accessibility exhibits a clear gradient, with higher values in the east, lower values in the west, and transitional levels in the central region. This pattern underscores the significant influence of geographic location, topographical constraints, and regional economic development on the formation of transport networks and the evolution of tourism resilience. Overall, these findings indicate that enhancing transportation linkages between core hubs and peripheral nodes is a key strategic pathway for promoting more balanced and sustainable tourism resilience throughout the Yellow River Basin.

Author Contributions

Methodology, software, formal analysis, investigation, data curation, visualization, writing—original draft: H.Z.; conceptualization, funding acquisition, validation, writing—review and editing, supervision: Y.L.; data curation, software, E.Y.; data curation, visualization, T.Z. All authors have read and agreed to the published version of the manuscript.

Funding

This research received no external funding.

Institutional Review Board Statement

Not applicable.

Informed Consent Statement

Not applicable.

Data Availability Statement

The data that support the findings of this study are available on reasonable request from the corresponding author.

Conflicts of Interest

The authors declare no conflicts of interest.

References

  1. Gössling, S.; Scott, D.; Hall, C.M. Pandemics, tourism and global change: A rapid assessment of COVID-19. J. Sustain. Tour. 2021, 29, 1–20. [Google Scholar] [CrossRef]
  2. Martin, R. Regional economic resilience, hysteresis and recessionary shocks. J. Econ. Geogr. 2012, 12, 1–32. [Google Scholar] [CrossRef]
  3. Holling, C.S. Resilience and stability of ecological systems. Annu. Rev. Ecol. Syst. 1973, 4, 1–23. [Google Scholar] [CrossRef]
  4. Wang, S.M.; Niu, J.L. Dynamic Evolution and Obstacle Factors of Urban Ecological Resilience in Shandong Peninsula Urban Agglomeration. Econ. Geogr. 2022, 42, 51–61. (In Chinese) [Google Scholar] [CrossRef]
  5. Martin, R.; Sunley, P. On the notion of regional economic resilience: Conceptualization and explanation. J. Econ. Geogr. 2015, 15, 1–42. [Google Scholar] [CrossRef]
  6. Zhao, R.D.; Fang, C.L.; Liu, H.M. Progress and prospect of urban resilience research. Prog. Geogr. 2020, 39, 1717–1731. [Google Scholar] [CrossRef]
  7. Van Meerbeek, K.; Jucker, T.; Svenning, J.C. Unifying the concepts of stability and resilience in ecology. J. Ecol. 2021, 109, 3114–3132. [Google Scholar] [CrossRef]
  8. Khadaroo, J.; Seetanah, B. The role of transport infrastructure in international tourism development: A gravity model approach. Tour. Manag. 2008, 29, 831–840. [Google Scholar] [CrossRef]
  9. Prideaux, B. The role of the transport system in destination development. Tour. Manag. 2000, 21, 53–63. [Google Scholar] [CrossRef]
  10. Connell, J.; Page, S.J. Exploring the spatial patterns of car-based tourist travel in Loch Lomond and Trossachs National Park, Scotland. Tour. Manag. 2008, 29, 561–580. [Google Scholar] [CrossRef]
  11. Albalate, D.; Fageda, X. High speed rail and tourism: Empirical evidence from Spain. Transp. Res. Part A-Policy Pract. 2016, 85, 174–185. [Google Scholar] [CrossRef]
  12. Khan, S.A.R.; Dong, Q.L.; Wei, S.B.; Zaman, K.; Zhang, Y. Travel and tourism competitiveness index: The impact of air transportation, railways transportation, travel and transport services on international inbound and outbound tourism. J. Air Transp. Manag. 2017, 58, 125–134. [Google Scholar] [CrossRef]
  13. Dong, B.L.; Zhang, M.L.; Wang, H.; Wu, J.N. Study on the interaction mechanism among spatial patterns of traditional villages and tourism attractiveness and accessibility in Guizhou province. Sci. Rep. 2025, 15, 10365. [Google Scholar] [CrossRef] [PubMed]
  14. Yang, Z.; Lv, P.Z.; Sun, S.Q. The Impact of New Infrastructure Investment on the International Tourism Industry: Evidence from Provincial-Level Panel Data in China. Sustainability 2025, 17, 2334. [Google Scholar] [CrossRef]
  15. He, X.R.; Cai, C.Y.; Tang, J.X.; Shi, J.Z.; Yang, R.B. Analysis of coupling coordination and obstacle factors between tourism development and ecosystem services value: A case study of the Yellow River Basin, China. Ecol. Indic. 2023, 157, 111234. [Google Scholar] [CrossRef]
  16. Luo, Y.W.; Yan, J.G.; McClure, S.C.; Li, F. Socioeconomic and environmental factors of poverty in China using geographically weighted random forest regression model. Environ. Sci. Pollut. Res. 2022, 29, 33205–33217. [Google Scholar] [CrossRef]
  17. Zhang, S.R.; Zhang, G.H.; Ju, H.R. The spatial pattern and influencing factors of tourism development in the Yellow River Basin of China. PLoS ONE 2020, 15, e0242029. [Google Scholar] [CrossRef]
  18. Jiang, W.G.; Yuan, L.H.; Wang, W.J.; Cao, R.; Zhang, Y.F.; Shen, W.M. Spatio-temporal analysis of vegetation variation in the Yellow River Basin. Ecol. Indic. 2015, 51, 117–126. [Google Scholar] [CrossRef]
  19. Zhou, Z.X.; Sun, X.R.; Zhang, X.T.; Wang, Y. Inter-regional ecological compensation in the Yellow River Basin based on the value of ecosystem services. J. Environ. Manag. 2022, 322, 116073. [Google Scholar] [CrossRef] [PubMed]
  20. Zhao, R.D.; Fang, C.L.; Liu, H.M.; Liu, X.X. Evaluating urban ecosystem resilience using the DPSIR framework and the ENA model: A case study of 35 cities in China. Sustain. Cities Soc. 2021, 72, 102997. [Google Scholar] [CrossRef]
  21. Sun, Y.Y.; Lin, W.Y.; Sun, M.Y.; Chen, P. Spatiotemporal Evolution and Driving Forces of Tourism Economic Resilience in Chinese Provinces. Sustainability 2024, 16, 8091. [Google Scholar] [CrossRef]
  22. Ma, F.; Wang, Z.H.; Sun, Q.P.; Yuen, K.F.; Zhang, Y.X.; Xue, H.F.; Zhao, S.M. Spatial-Temporal Evolution of Urban Resilience and Its Influencing Factors: Evidence from the Guanzhong Plain Urban Agglomeration. Sustainability 2020, 12, 2593. [Google Scholar] [CrossRef]
  23. Wang, Q.; Zhao, L.; Yu, W.; Jia, J. Spatial-temporal evolution characteristics and influencing factors of resilience of tourism economic system in China. Geogr. Geo-Inf. Sci. 2020, 36, 113–118. (In Chinese) [Google Scholar]
  24. Ding, C.H.; Gao, X.; Xie, Z.Y. Analysing the differential impact of the COVID-19 pandemic on the resilience of the tourism economy: A case study of the ChengduChongqing urban agglomeration in China. Int. J. Disaster Risk Reduct. 2024, 102, 104255. [Google Scholar] [CrossRef]
  25. Jiang, L.; Chen, X.P.; Pu, L.L.; Xue, H.J. Spatio-Temporal Evolution Characteristics of Tourism Ecological Resilience in China. Land 2025, 14, 966. [Google Scholar] [CrossRef]
  26. Gutiérrez, J. Location, economic potential and daily accessibility: An analysis of the accessibility impact of the high-speed line Madrid–Barcelona–French border. J. Transp. Geogr. 2001, 9, 229–242. [Google Scholar] [CrossRef]
  27. Chen, P.Y. Effects of the entropy weight on TOPSIS. Expert Syst. Appl. 2021, 168, 114186. [Google Scholar] [CrossRef]
  28. Jin, F.J.; Wang, C.J.; Li, X.W. Discrimination Method and Its Application Analysis of Regional Transport Superiority. ACTA Geogr. Sin. 2008, 63, 787–798. (In Chinese) [Google Scholar]
  29. Sun, H.R.; Liu, Y.J.; Zhou, G.L. The spatiotemporal differentiation and mechanisms of traffic dominance in Northeast China. Acta Geogr. Sin. 2021, 76, 444–458. (In Chinese) [Google Scholar]
  30. Moran, P.A. Notes on continuous stochastic phenomena. Biometrika 1950, 37, 17–23. [Google Scholar] [CrossRef] [PubMed]
  31. Anselin, L. Local indicators of spatial association—LISA. Geogr. Anal. 1995, 27, 93–115. [Google Scholar] [CrossRef]
  32. Anselin, L.; Syabri, I.; Smirnov, O. Visualizing multivariate spatial correlation with dynamically linked windows. In Proceedings of the CSISS Workshop on New Tools for Spatial Data Analysis, Santa Barbara, CA, USA, 20–23 March 2002. [Google Scholar]
  33. Cai, X.L.; Xu, Y.L. Spatiotemporal Evolution and Influencing Factors of Tourism Economic Resilience under the Impact of COVID-19-A Case Study of Coastal Cities in China. Sustainability 2023, 15, 6668. [Google Scholar] [CrossRef]
  34. Huang, G.Y.; Li, D.Z.; Zhu, X.W.; Zhu, J. Influencing factors and their influencing mechanisms on urban resilience in China. Sustain. Cities Soc. 2021, 74, 103210. [Google Scholar] [CrossRef]
  35. Wang, B.; Han, S.; Ao, Y.B.; Liao, F.W. Evaluation and Factor Analysis for Urban Resilience: A Case Study of Chengdu-Chongqing Urban Agglomeration. Buildings 2022, 12, 962. [Google Scholar] [CrossRef]
  36. You, X.T.; Sun, Y.A.; Liu, J.W. Evolution and analysis of urban resilience and its influencing factors: A case study of Jiangsu Province, China. Nat. Hazards 2022, 113, 1751–1782. [Google Scholar] [CrossRef] [PubMed]
  37. Georganos, S.; Grippa, T.; Gadiaga, A.N.; Linard, C.; Lennert, M.; Vanhuysse, S.; Mboga, N.; Wolff, E.; Kalogirou, S. Geographical random forests: A spatial extension of the random forest algorithm to address spatial heterogeneity in remote sensing and population modelling. Geocarto Int. 2021, 36, 121–136. [Google Scholar] [CrossRef]
  38. Georganos, S.; Kalogirou, S. A Forest of Forests: A Spatially Weighted and Computationally Efficient Formulation of Geographical Random Forests. ISPRS Int. J. Geo-Inf. 2022, 11, 471. [Google Scholar] [CrossRef]
  39. Su, Z.W.; Lin, L.; Xu, Z.H.; Chen, Y.M.; Yang, L.M.; Hu, H.H.; Lin, Z.P.; Wei, S.J.; Luo, S.S. Modeling the Effects of Drivers on PM2.5 in the Yangtze River Delta with Geographically Weighted Random Forest. Remote Sens. 2023, 15, 3826. [Google Scholar] [CrossRef]
  40. Espiner, S.; Orchiston, C.; Higham, J. Resilience and sustainability: A complementary relationship? Towards a practical conceptual model for the sustainability–resilience nexus in tourism. J. Sustain. Tour. 2017, 25, 1385–1400. [Google Scholar] [CrossRef]
  41. Gao, Y.; Su, W.; Wang, K. Does high-speed rail boost tourism growth? New evidence from China. Tour. Manag. 2019, 72, 220–231. [Google Scholar] [CrossRef]
  42. Ning, W.P.; Wang, S.M. The coupling coordination and driving factors of tourism economy and urban ecological resilience: A case study of Shandong Province, China. Environ. Dev. Sustain. 2024, 28, 13697–13719. [Google Scholar] [CrossRef]
  43. Wang, K.; Chen, X.T.; Lei, Z.X.; Zhao, S.X.; Zhou, X.; Hall, C.M.; Seabra, C.; Almeida, S.; Peres, R.; Mesquita, S. The Effects of Tourism Development on Eco-Environment Resilience and Its Spatio-Temporal Heterogeneity in the Yangtze River Economic Belt, China. Sustainability 2023, 15, 6124. [Google Scholar] [CrossRef]
  44. Ma, M.Y.; Tang, J.X. Interactive coercive relationship and spatio-temporal coupling coordination degree between tourism urbanization and eco-environment: A case study in Western China. Ecol. Indic. 2022, 142, 109149. [Google Scholar] [CrossRef]
Figure 1. Mechanism framework of transportation accessibility influencing tourism economic resilience.
Sustainability 18 05427 g001
Figure 2. Geographical location and scope of the study area.
Sustainability 18 05427 g002
Figure 3. Technical framework.
Sustainability 18 05427 g003
Figure 4. Spatial distribution of tourism economic resilience in Yellow River Basin cities.
Sustainability 18 05427 g004
Figure 5. Spatial autocorrelation of urban tourism economic resilience in the Yellow River Basin.
Sustainability 18 05427 g005
Figure 6. Spatial pattern of transportation accessibility in Yellow River Basin cities.
Sustainability 18 05427 g006
Figure 7. Bivariate LISA cluster map of tourism economic resilience and transportation accessibility in the Yellow River Basin.
Sustainability 18 05427 g007
Figure 8. Correlation between tourism economic resilience (TER) and influencing factors (* p ≤ 0.05, ** p ≤ 0.01, *** p ≤ 0.001).
Sustainability 18 05427 g008
Figure 9. Boxplots of importance scores for influencing factors of tourism economic system resilience in the Yellow River Basin (GWRF model).
Sustainability 18 05427 g009
Figure 10. Spatial distribution of the top-ranked factors in the GWRF model.
Sustainability 18 05427 g010
Figure 11. Spatial distribution of major factor importance scores (%IncMSE) in the GWRF model.
Sustainability 18 05427 g011
Table 1. Indicator system for assessing tourism economic resilience in the Yellow River Basin.
SystemSubsystemEvaluation IndicatorsUnitIndicator Weight
Tourism Economic System ResilienceTourism Economic Value
(Resistance Capacity)
Number of A-level Tourist Attractionspcs0.0308
Number of Travel Agenciespcs0.0438
Number of Star-rated Hotelspcs0.0263
Number of Domestic Tourists10,000 persons0.0356
Domestic Tourism Revenue100 million RMB0.0545
Comprehensive Economic Capacity
(Recovery Capacity)
Gross Domestic Product (GDP)100 million RMB0.0429
Added Value of the Tertiary Industry100 million RMB0.0646
GDP Per CapitaRMB0.0224
Per Capita Disposable IncomeRMB0.0094
Per Capita Disposable Income of Urban ResidentsRMB0.0096
Growth Rate of Fixed Asset Investment%0.0050
General Public Budget Revenue100 million RMB0.0514
Number of Employees in Accommodation and Cateringpersons0.0733
Environmental Support Capacity
(Reconfiguration Capacity)
Per Capita Park Green Space Aream2/person0.0196
Green Coverage Rate of Built-up Areas%0.0063
Park Green Space Areahectares0.0462
Centralized Sewage Treatment Rate%0.0026
Harmless Disposal Rate of Domestic Waste%0.0019
Air Quality Index (AQI)none0.0069
Proportion of Days with Good Air Quality%0.0123
Highway Passenger Traffic Volume10,000 persons0.0424
Fixed Internet Broadband Access Users10,000 households0.0357
Innovation and Revitalization Capacity
(Renewal Capacity)
Number of Students in Higher Education Institutionspersons0.0799
Number of Higher Education Institutionsinstitutions0.0675
Number of High-tech Enterprisesunits0.1028
Number of Granted Invention Patentsitems0.1063
Table 2. Design speeds of road network by category.
Road typeMotorwayTrunkPrimarySecondaryResidentialService
Speed (km/h)100 km/h70 km/h65 km/h55 km/h30 km/h20 km/h
Table 3. Weights assigned to major transport infrastructure.
TypeSubtypeCriteriaWeightTypeSubtypeCriteriaWeight
HighwayExpresswayPresence of Expressway2AirportHub AirportPresence of Hub Airport2
Within 30 km of an Expressway1.5Within 50 km of a Hub Airport1.5
Within 60 km of an Expressway1Trunk AirportPresence of a Trunk Airport1.5
Other0Within 30 km of a Trunk Airport1
National HighwayPresence of a National Highway0.5Branch AirportPresence of a Branch Airport0.5
Other0Others0
Presence of a High-speed Rail Station2PortMajor PortPresence of a Major Port2
RailwayHigh-speed RailwayWithin 30 km of a High-speed Rail Station1.5Within 30 km of a Major Port1.5
Within 60 km of a High-speed Rail Station1Within 60 km of a Major Port1
Other0General PortPresence of a General Port0.5
Conventional RailwayPresence of a Conventional Railway0.5Others0
Other0
Table 4. Explanatory variables for tourism economic resilience.
TypeVariableCodeIndicator Description
Key explanatory variableTransportation accessibilityTAAccessibility index
Control variablesEconomic development levelPGDPGDP per capita
Industrial structureINDShare of tertiary industry in GDP
Technological innovation capacityTICEducation + science & technology expenditure/fiscal expenditure
Natural environmental conditionsTRITerrain relief
Level of opennessOPEForeign direct investment (FDI)
Tourist density indexTDITourist density index
Government interventionGOVFiscal expenditure/GDP
Table 5. Comparative validation results of OLS, GWR, RF, and GWRF models.
ModelVerification Accuracy
R2RMSErRMSEMAE
OLS0.90560.042628.800.0366
GWR0.90110.035624.050.0288
RF0.63170.084256.870.0467
GWRF0.98830.020213.660.0111
Disclaimer/Publisher’s Note: The statements, opinions and data contained in all publications are solely those of the individual author(s) and contributor(s) and not of MDPI and/or the editor(s). MDPI and/or the editor(s) disclaim responsibility for any injury to people or property resulting from any ideas, methods, instructions or products referred to in the content.