Article

Sustainable Shipping Development and the Optimal Green Finance Portfolio: A Case Study of Taiwan’s Sustainable Shipping and Financial Market Development


1
Department of Shipping and Transportation Management, National Penghu University of Science and Technology, Magong 880011, Taiwan
2
Department of Shipping and Transportation Management, National Taiwan Ocean University, Keelung 202301, Taiwan
3
Department of Information Management, Ming Chuan University, Taipei 111005, Taiwan
*
Author to whom correspondence should be addressed.
Sustainability 2026, 18(11), 5406; https://doi.org/10.3390/su18115406
Submission received: 1 May 2026 / Revised: 22 May 2026 / Accepted: 23 May 2026 / Published: 27 May 2026

Abstract

Smart shipping and achieving net-zero emissions have become pressing priorities in maritime transport, yet limited research has integrated sustainable shipping development with green finance decision-making. To address this gap, this study applies the AHP–RDEMATEL–TOPSIS approach to analyze the interrelationships and relative importance of key sustainability factors and to identify optimal green financing instruments. Incorporating ESG dimensions, the research conducted a survey of large international exporters in Taiwan and senior managers of shipping companies. The results reveal that green infrastructure is the most critical factor for container shipping lines, while energy efficiency and renewable energy technologies are dominant for bulk carriers and shippers. Corporate reputation and image emerge as primary factors impacted across all three groups. In financing decisions, green bonds are most suitable for container lines, whereas green equities are best suited for bulk carriers. This study bridges the theoretical gap between sustainability assessment and finance, providing practical guidance for shipping companies’ financial departments seeking to align decarbonization goals with effective green financing solutions. Ultimately, the primary contribution of this study lies in establishing an empirically validated, multi-criteria decision support framework that empowers maritime stakeholders to systematically optimize their green investment portfolios amid the global transition towards net-zero emissions.

1. Introduction

Although waterborne transport is not the fastest mode of transportation, it remains widely utilized due to its relatively low costs. This comparative cost efficiency is one of the primary advantages of this freight transport mode. Furthermore, ships possess a massive cargo capacity, allowing the volume of goods transported in a single voyage to far exceed that of any other mode of transportation [1].
The traditional financial and maritime industries have long been interconnected through financing, insurance, foreign exchange, letters of credit, and derivative products such as fuel and steel futures. As the traditional maritime industry progresses toward sustainable shipping, the green finance sector can support this transition by offering green financial instruments, such as green loans (GLs) and green bonds (GBs), to provide shipping companies with financing and insurance. These instruments help reduce financing costs, improve access to capital, and narrow the gap associated with green premiums. This is the primary goal of integrating sustainable shipping with green finance.
In the early stages of Taiwan’s green transition, the Financial Supervisory Commission (FSC) developed the “Green Finance Action Plan,” which was approved by the Executive Yuan in 2017. Through the collaborative efforts of the FSC and relevant government agencies, significant progress has been achieved, including the relaxation of credit extension and financing regulations for financial institutions, the establishment and development of Taiwan’s green bond market, and the encouragement of direct and indirect investments by the insurance industry in green energy sectors. Additionally, the plan has promoted green living and consumption, introduced green financial products such as green stocks (GSs), green funds (GFs), and green insurance (GI), and mandated financial and insurance institutions to disclose their management strategies for significant sustainable finance topics in corporate social responsibility reports [2].
At this stage, achieving sustainable development while pursuing economic growth requires substantial financial investment and the reallocation of capital to drive economic transformation. The rise of environmental awareness, however, has caused Environmental, Social and Governance (ESG) to become essential factors in the future development of industries worldwide. This study consolidates recent sustainability-related factors in shipping and, through the dimensions of ESG and various green financial instruments, aims to identify the key factors influencing the development of sustainable shipping. Using the AHP (Analytic Hierarchy Process), RDEMATEL (Revised Decision-Making Trial and Evaluation Laboratory), and TOPSIS (Technique for Order Preference by Similarity to Ideal Solution), the study further seeks to determine the importance and interconnections of these factors and evaluate the most suitable green financial instruments for each criterion. This approach is intended to help shipping companies secure financing and progress toward the goal of sustainable shipping.
To enhance the robustness and clarity of the evaluation process, this study delineates the evaluation framework into three interrelated stages. First, the AHP is used to systematically quantify the relative significance of the ESG dimensions and criteria, thereby deriving priority weights. Second, acknowledging that sustainability factors are seldom isolated and typically interact with one another, the RDEMATEL method is employed to construct an Impact Relations Map (IRM), thereby clarifying the complex causal relationships among the criteria and identifying the principal influencing and affected factors. Finally, based on the structural weights obtained via the AHP, the TOPSIS is applied to objectively assess and rank various alternative green financial instruments. This comprehensive multi-criteria decision-making (MCDM) framework facilitates a rigorous transition from expert-assigned criterion weights to an objective evaluation of shipping operators’ selection of green financial instruments.
The traditional link between the shipping and financial industries has long centered on mechanisms such as financing, insurance, foreign exchange, and derivatives. However, as the world moves toward net-zero transitions, effectively integrating sustainable shipping and green finance decision-making has become a critical research issue. Existing studies have primarily focused on policy frameworks or individual financial instruments, while systematic analyses of the interactions between sustainability factors and green financial products remain limited.
This research extends beyond the limitations of previous scholarly work by employing an integrated AHP–RDEMATEL–TOPSIS approach to empirically investigate, for the first time, the interrelations and priority rankings among various ESG factors and green financial instruments within the framework of sustainable operational planning for the shipping industry. Through this analysis, this study delineates the most appropriate green finance solutions. Furthermore, it not only addresses the theoretical gap between sustainable shipping and financial strategy but also offers tangible decision-making support to Taiwanese shipping companies in their transition towards a low-carbon future.
Regarding the structure, Section 2 compiles research on sustainable shipping, green finance, evaluation dimensions, criteria, and research methodologies. Section 3 explains the operational steps of the AHP, RDEMATEL, and TOPSIS. Section 4 analyzes the importance and interconnections of key factors influencing the sustainable development of shipping as chosen by the planning departments of shipping companies and shippers, as well as the optimal combinations of green financial instruments selected by the financial departments of shipping companies. Finally, the conclusions and recommendations are presented.

2. Literature Review and Analysis

2.1. Sustainable Shipping Drivers and Stakeholder Priorities

With the development of the global economy and the shipping industry, green shipping and sustainable shipping have garnered attention from both the shipping community and academia. However, the concepts of green shipping and sustainable shipping remain ambiguous in most studies. In fact, sustainable shipping encompasses a broader scope, not only involving green shipping but also addressing numerous issues related to Corporate Social Responsibility (CSR) and the sustainable transformation of enterprises in social, economic, and technological dimensions [3]. Zhou et al. [4] compiled extensive research to clarify the differences between the two, effectively aiding shipping companies in understanding the distinctions. This prevents an excessive focus on the narrow aspects of green shipping, which might overlook the broader concept of sustainable shipping. Additionally, their review consolidates numerous factors influencing the development of sustainable shipping from previous studies.
The development of sustainable shipping represents the most significant challenge that the shipping industry will face in the future, making identifying key factors influencing sustainable shipping development particularly critical. Tran et al. [5] studied the prioritization of key factors for sustainable shipping among Vietnamese shipping companies. A company’s internal financial resources emerged as the most critical factor among these. Xue and Lai [6] pointed out that research and analysis within the shipping industry on “Shipping’s Social Responsibility” are notably insufficient. Therefore, they explored the industry’s performance and development direction regarding “responsibility” by focusing on the three key pillars of shipping sustainability: economic, environmental, and social.
Koray [7] utilized the International Maritime Organization’s (IMO) 2050 regulatory compliance, emission reduction, energy efficiency, and digitalization and optimization standards to determine whether newly constructed ships meet the operational needs of shipping companies and seek to provide shipping companies with a roadmap and plans for green transformation. The findings revealed that, in terms of incentive programs, cost-effectiveness, shipbuilding facilities, and investment costs, green ships cannot compete with traditional ships in the short term. However, financing support through green financial products could effectively reduce the green premium associated with shipbuilding, enhance shipbuilding technologies, and accelerate the construction of green ships that comply with IMO regulatory requirements.
In shipping practices, aside from voluntary transformation efforts, another driver of transformation stems from the spillover effect created by international corporations responding to environmental requirements. For example, Taiwanese exporters aiming to comply with sustainability or green product and transport regulations imposed by importing countries in Europe and the United States often include green or sustainable criteria as necessary conditions when selecting shipping companies. The strength of this influence can be observed in the importance ranking of the “Vendors’ focus” factor by [5].
Although the aforementioned studies provide valuable insights into sustainability priorities, regulatory compliance, and market pressures, their analytical scope remains somewhat fragmented. They primarily focus on environmental compliance requirements or internal managerial perspectives, without sufficiently establishing connections to the financial mechanisms necessary for facilitating a sustainable transition. Furthermore, existing research seldom considers the heterogeneity among various stakeholders—for instance, the differing perceptions of sustainability between shipping companies and international exporters. Consequently, the interactive relationship between sustainability drivers and green financial instruments remains an underexplored domain. This study aims to address this gap by integrating multi-criteria decision analysis with a dual-stakeholder perspective, thereby linking sustainability assessment with green financial decision-making to advance the maritime industry’s green transition in both theoretical and practical contexts.

2.2. Green Financing Instruments and Adoption Enablers

For a long time, the shipping industry has been a labor- and capital-intensive sector with slim profit margins. However, under the constraints of environmental, regulatory, and economic external factors, shipping companies are increasingly driven to develop more sustainable practices voluntarily. On the path toward sustainable development, financing will likely become a significant challenge [8]. To support the sustainable development of shipping, green finance allows capital to flow toward industries prioritizing sustainability and environmental protection while encouraging businesses needing funding to emphasize sustainable development issues more.
However, within the development of green finance, the definition of “green” is crucial. It affects the rights, obligations, risk levels, and responsibilities of all parties involved in green financial activities, including banks and shipowners [9]. Shipowners require substantial capital to construct environmentally friendly vessels and develop energy-saving technologies to meet net-zero emission goals. Without clear regulations on green finance, financial institutions may struggle to define which shipping practices qualify as “green” and “sustainable”. This ambiguity could result in shipowners being unable to access funding due to varying definitions and standards across financial systems or abandoning their transformation efforts altogether.
In the past, traditional financial instruments such as equity financing, debt financing, and bond issuance were the most commonly used financing methods for shipping companies. However, the benefits of modern green financial products for the development of sustainable shipping have been confirmed by studies from Iqbal et al. [10] and Xu and Liu [11]. Lin [12] further explored China’s green finance development trends by analyzing green financial products; the rapid development of green credit (GC) in China is primarily attributed to strong governmental policy support. Policy banks and local government banks offer favorable loan conditions and incentives for GC, such as preferential interest rates, extended repayment periods, higher loan limits, streamlined approval processes, and cash subsidies that have significantly promoted the growth of GC.
Regarding the types of green finance, Meng and Shaikh [13] proposed three green financial products based on ESG standards—green bonds, sustainable agriculture funds, and renewable energy funds—and four green investment strategies: impact investing, ESG integration, shareholder engagement, and thematic investing. These financial tools and strategies aim to support and encourage businesses to progress toward low-carbon and sustainable development.
In the shipping sector, sophisticated financial arrangements serve as a crucial enabler of technological transformation and corporate value creation. Puleikiene [14] illustrates that specialized green financial solutions can directly stimulate technological innovation in ports and vessels, while concurrently fostering sustainable corporate growth by mitigating environmental pollution and expanding the institutional funding base. However, shipping companies operating under various business models must thoroughly consider sector-specific differences in the allocation of green capital. Shi et al. [15] identify an inherent peer effect in green investments within the shipping industry, wherein long-term freight premiums and fuel efficiency are closely associated with the scale of green fleet expansion. An oversupply of any particular green technology will diminish subsequent economic returns, emphasizing the necessity for individual shipping companies to precisely calibrate their sustainable capital allocation in response to market fluctuations.
Furthermore, the implementation of an optimal green finance portfolio necessitates a robust framework capable of addressing risk behaviors specific to varying market conditions and asset characteristics. Nautiyal et al. [16] affirm that the integration of green and sustainable financial assets yields superior risk diversification benefits. From an equity perspective, Naimoli and Storti [17] demonstrate that green equities display risk profiles that are markedly distinct from those of conventional assets when subjected to climate policy shocks and geopolitical tensions. This indicates that shipping companies must adopt asset-specific evaluation frameworks, rather than relying solely on generic shipping or financial indices, when constructing resilient portfolios under extreme market conditions. Concerning debt financing, Opoku et al. [18] examined the allocation models of green financial instruments and showed that green credit presents a significantly lower default risk in comparison to traditional loans. This low default risk profile offers both theoretical and practical justification for the preference of shipping operators and financial institutions for green financial instruments as the financing option of choice when undertaking large-scale, capital-intensive sustainable infrastructure and decarbonization initiatives.
In contrast, Taiwan’s green finance is still in its early development stage, primarily focusing on GLs. The issuance of GFs and GI remains limited, while GBs and carbon trading have yet to be developed. Recently, the government has identified the green economy as a key policy priority. The Ministry of Economic Affairs has been actively promoting the development of green energy industries to encourage green investment. At the same time, the Financial Supervisory Commission has also emphasized the importance of green finance, incorporating it into policy initiatives.
Recent scholarly publications have highlighted the pivotal role of green technology innovation in advancing sustainable development. Du et al. [19], for instance, demonstrate that low-carbon policies substantially improve macro-level ecological efficiency primarily through green technology innovation. While that study primarily addresses the broader urban context, it provides valuable reference for sustainable maritime practices. The current investigation shifts focus from macro-level policy considerations to micro-level strategic implementation of ESG practices by container liner shipping companies (CLSs). Within the shipping industry, the adoption of green technology necessitates significant capital investment. This emphasizes the fundamental contribution of the present research: by analyzing optimal green financing strategies to support shipping operators’ ESG and green innovation requirements, it effectively connects green development theory with practical industry applications.
In summary, the diversity of green financial products offers the shipping industry tailored financing options to meet varying capital needs. From the financial sector’s perspective, increasing the range of financing products can be a key strategy to mitigate financing risks [20]. To associate factors influencing sustainable shipping development factors with green financial instruments, this study posits that various sustainability drivers correspond to distinct categories of green financing mechanisms. For example, sustainable infrastructure initiatives typically favor green bonds or green funds, which offer long-term, low-cost capital; energy efficiency and renewable energy technologies are more aligned with green equities; and entities emphasizing liquidity and risk management may opt for green deposits. This connection elucidates how sustainability considerations translate into specific financing decisions and establishes a sound basis for the subsequent TOPSIS-based criteria and alternative ranking.

2.3. MCDM Methods

The shipping industry, as a vital component of the global transportation network, encounters significant sustainability challenges across various aspects. In recent years, the leading five CLSs—MSC, Maersk, CMA CGM, COSCO, and Hapag–Lloyd—have strategically adjusted their operational approaches to align with the principles of sustainable shipping, with particular emphasis on environmental conservation. Nevertheless, the existing scholarly literature has predominantly concentrated on assessing shipping companies through financial performance and freight rates, often neglecting the comprehensive dimensions of ESG. Drawing upon the literature on sustainable development and integrating practical insights from both academic and industry experts, Huang and Yin [21] utilize the AHP methodology to thoroughly evaluate and rank the various ESG strategy needs of container liner shipping companies. Subsequently, they propose concrete strategies and recommendations aimed at enhancing current industry practices.
In applying the RDEMATEL method to sustainable shipping research, Ho and Lee [22], from the perspective of shipping companies, used the method to explore the interrelations between factors influencing Taiwanese shipping companies’ decisions to install scrubbers. They provided short-term and long-term recommendations for CSBC Corporation, Taiwan’s (CSBC) installation of scrubbers. Moshiul et al. [23], from the perspective of shipowners and senior management in shipping companies, employed the TOPSIS to evaluate technical, environmental, and economic dimensions; their study aimed to identify the primary considerations for decision-makers when selecting alternative marine fuels. Finally, Motlagh et al. [24] integrated the AHP and TOPSIS to assess the prioritization of decarbonization factors in CSLs and propose relevant solutions.
Although the AHP, DEMATEL, and TOPSIS have been extensively utilized in MCDM analyses, each methodology possesses intrinsic limitations. Nonetheless, when these three approaches are integrated, they can effectively offset each other’s methodological weaknesses. The AHP offers highly consistent criterion weights, thereby improving the reliability of weight assignments in the DEMATEL and TOPSIS; the DEMATEL facilitates the identification of causal relationships among criteria, addressing the structural limitations inherent in the AHP’s hierarchical framework; and the TOPSIS allows for a practical ranking based on weighted and interrelated criteria. The integrated AHP–DEMATEL–TOPSIS hybrid model thus enhances decision transparency, minimizes subjective bias, and fortifies model robustness—rendering it particularly appropriate for complex and dynamic contexts such as sustainable maritime shipping [24].

2.4. Literature Review

In sustainable shipping research, scholars from various countries have conducted extensive studies on sustainable shipping and green finance, providing a solid foundation for this study. This research integrates evaluation criteria based on the factors identified in recent studies on sustainable shipping by Tran et al. [5], Xue and Lai [6], Huang and Yin [21], and Moshiul et al. [23], with a significance ratio exceeding 50%. Furthermore, drawing on the “Vendors’ focus” concept from [5], SHPs operating on European and American trade routes were included in the survey to analyze the differences in key factors influencing sustainable development between shipping companies with different operational characteristics and their SHPs. Regarding green financial products, Xu and Liu [11] confirmed that green finance significantly impacts industrial transformation. Accordingly, green financing solutions proposed by Lin [12], Meng and Shaikh [13], Guo [25], and Chandran and Chandran [26] were compiled to define the types of green financial products and the concept of green finance used in this study.
While conventional operational factors remain crucial to sustainability within the shipping industry, the primary aim of this study is to integrate sustainable shipping practices with financial decision-making concerning green financial instruments. In capital markets, financial institutions and investors predominantly depend on standardized ESG frameworks rather than operational indices for daily evaluation when determining the eligibility of shipping companies to issue green bonds or green equities. Consequently, the evaluation framework has been intentionally developed around ESG dimensions, rather than solely operational metrics. By adopting ESG as the core evaluation criteria, the framework effectively aligns shipping sustainability with the assessment standards of the financial sector.
However, the existing literature has not explicitly analyzed the importance and interrelation of key factors in sustainable shipping development for CSLs, bulk shipping companies (BSCs), and SHPs. This gap makes it difficult to accurately reflect the current and future state of sustainable development in the shipping industry. To achieve the goal of sustainable shipping development through green financial product financing, it is essential first to understand the current types and characteristics of green financial products. Only then can preferences for green financing solutions be established for various aspects of sustainable development in shipping companies.
In summary, this study focuses on Taiwanese container BSCs and SHPs on European and American trade routes. By integrating the relevant literature on factors influencing sustainable shipping development and green financial products, along with insights from expert experience and knowledge, this study employs the AHP to objectively rank the importance of evaluation criteria while minimizing uncertainty in expert opinions. Subsequently, this study utilizes the RDEMATEL method to analyze the causal relationships among evaluation criteria, ensuring convergence in the initial direct relation matrix. Finally, this study applies the TOPSIS, which provides a sound logical framework for rational decision-making and calculates the best and worst alternative values. The findings of this study are expected to serve as a crucial strategic reference for financing decisions in sustainable shipping development.

3. Research Methodology and Assessment Framework

3.1. AHP

The AHP method systematically decomposes complex problems into hierarchical levels, integrating opinions from experts, scholars, and decision-makers at various levels. By conducting pairwise comparisons among factors and utilizing quantitative methods, the AHP establishes a pairwise comparison matrix to derive the eigenvector of each matrix. The eigenvector is then used to determine the priority ranking among hierarchical factors, calculating the maximum eigenvalue to assess the relative strength of weights in the consistency index of the pairwise comparison matrix for comprehensive evaluation. The AHP computational steps are as follows:
  • Identify Evaluation Issues and List Key Influencing Factors
The key aspect of the overall hierarchical structure lies in problem identification. Therefore, through a comprehensive literature review, all factors influencing the problem are incorporated into the evaluation framework.
2.
Construct a Hierarchical Structure
This is the most critical step in the AHP, where decision-makers must break down the problem into multiple interrelated decision elements. The first level represents the ultimate goal to be achieved; the second level consists of the relevant dimensions of the study; the third level includes the evaluation criteria under each dimension.
3.
Questionnaire Design and Administration
The AHP employs a pairwise comparison method for judgment, with the questionnaire designed to capture respondents’ relative emphasis on each evaluation dimension and criterion under pairwise comparison conditions.
4.
Build a Pairwise Comparison Matrix
Using the hierarchical structure model of the AHP, each level’s factors are compared in pairs based on the established dimensions and criteria, forming a judgment matrix. We establish a pairwise comparison matrix using the pairwise comparison method, which evaluates two factors against each other, as shown in Equation (1).
A = 1 a 1 n 1 a 1 n 1 = w 1 w 1 w 1 w n 1 n w 1 w n w n
5.
Find the Priority Vectors and Maximum Eigenvalues of Each Level
After constructing the pairwise comparison matrix, the priority vector and the maximum eigenvalue can be determined. The priority vector represents the weight of each element at different levels, while calculating the maximum eigenvalue serves primarily to verify the consistency of the pairwise comparison matrix.
6.
Check for Consistency
The CR measures the judgment matrix’s consistency, and only when the CR is less than or equal to 0.1 does the pairwise comparison matrix meet the consistency requirement. The consistency test is expressed as Equation (2).
C R = C I C R

3.2. RDEMATEL

Through the DEMATEL, the interrelationships among factors can be analyzed to calculate their direct, indirect, and overall effects, thereby clarifying the nature of the problem, resolving complex entanglements, and enhancing the understanding of specific issues. However, the traditional DEMATEL approach lacks convergence in its initial direct relation matrix. This issue was addressed by Lee et al. [27], who introduced a minimal positive value into the formula when computing the direct, indirect, and total relation matrices. This modification ensures that the initial direct relation matrix of the original DEMATEL converges to zero, thereby resolving the non-convergence problem. The computation steps for the RDEMATEL are as follows:
  • Define Factors and Assess Relationships
Generally, key factors are identified through literature review or brainstorming and can be determined based on expert subjective experience regarding the relationships among factors. Additionally, methods such as cluster analysis, the Fuzzy Delphi Method (FDM), and the Modified Delphi Method (MDM) can be used to refine and select the most relevant key factors.
2.
Generate a Direct-Relation Matrix and Find the Average Matrix A
Each expert’s evaluation forms a non-negative n × n matrix B ( k ) = b i j ( k ) , where 1 k H . Consequently, the matrices B ( 1 ) , B ( 2 ) , , B ( H ) represent the responses collected from all H experts. The diagonal elements of matrix B ( k ) are 0, indicating that a factor does not influence itself. The values b i j within the matrix represent the degree to which criterion i influences criterion j .
Based on this, an n × n average matrix A is computed by averaging the responses from all H experts, as shown in Equation (3).
a i j = 1 H k = 1 H b i j ( k )
3.
Calculate the Standardized Direct-Relation Matrix
The initial direct-relation matrix A is standardized and represented as X = x i j . The calculations are performed as shown in Equations (4) and (5).
s = m a x max 1 i n j = 1 n a i j , ε + max 1 j n i = 1 n a i j
From this, we obtain
X = A s .
4.
Calculate the Total-Relation Matrix for Direct and Indirect Effects
After standardizing the initial direct-relation matrix X , the m t h power of the matrix, denoted as X m , represents the accumulated influence after m iterations. The total influence and total relations can be obtained by summing X , X 1 , X 2 ,   X 3 , X , where X m will eventually converge to a zero matrix. The total-relation matrix is formulated as shown in Equation (6).
T = lim m ( X + X 2 + + X m ) = X ( I X ) 1
5.
Construct the Impact Relations Map (IRM)
The sum ( D + R ) represents prominence, indicating the total influence exerted and received by a factor. The difference ( D R ) represents the degree of causality, where a positive value denotes an influencing factor, while a negative value signifies an influenced factor.

3.3. TOPSIS

The objective is to identify the alternative closest to the positive ideal solution and farthest from the negative ideal solution. Based on this concept, the distances of each alternative to the positive ideal solution and negative ideal solution are calculated, and the relative distances are compared to determine the optimal selection. The computational steps of TOPSIS are as follows:
  • Construct the Decision Matrix D = x i j m × n V
D = x 11 x 1 n x m 1 x m n
where x i j represents the score of the i th alternative under the j th criterion.
2.
Normalize the Decision Matrix R = r i j m × n
Since the units of different evaluation criteria may vary, making comparisons and calculations difficult, the decision matrix is transformed into a unit-free normalized matrix, as shown in Equation (8).
r i j = x i j / i = 1 m x i j 2 , i = 1 , , m ; j = 1 , , n
Here, r i j represents the normalized performance value of the i th feasible alternative under the jth evaluation criterion.
3.
Construct the Weighted Normalized Decision Matrix V = v i j m × n
Each criterion has its relative importance, represented by the weight matrix W = w 1 , w 2 , , w n , where w j is the weight of the jth evaluation criterion, and j = 1 n w j = 1 .
The weighted normalized decision matrix V is obtained as shown in Equation (9).
V = v i j m × n , v i j = w j r i j
4.
Determine the Positive Ideal Solution A + and the Negative Ideal Solution A
The positive and negative ideal solutions are defined as shown in Equations (10) and (11).
A + = v 1 + , v 2 + , v 3 + , , v n + = max i v i j | j J 1 , min i v i j | j J 2 | i = 1 , , m ; J 1 + J 2 = n
A = v 1 , v 2 , v 3 , , v n = min i v i j | j J 1 , min i v i j | j J 2 | i = 1 , , m ; J 1 + J 2 = n
where J 1 and J 2 represent the number of benefit attributes and cost attributes, respectively.
5.
Calculate the Distance between Each Alternative and the Positive Ideal Solution and the Negative Ideal Solution
The distance of each alternative from the positive ideal solution d i + and the distance from the negative ideal solution d i are calculated as shown in Equations (12) and (13).
d i + = J = 1 n ( v i j v j + ) 2 , i = 1 , , m
d i = J = 1 n ( v i j v j ) 2 , i = 1 , , m
6.
Calculate the Closeness Coefficient of Each Alternative to the Ideal Solution
The optimal alternative cannot be determined solely based on its proximity to the positive ideal solution. This is measured by the closeness coefficient (CC). The calculation method for the closeness coefficient C C i of alternative A i is shown in Equation (14).
C C i = d i / d i + + d i
7.
Rank the Alternatives Based on the Closeness Coefficient
The feasible alternatives are ranked in descending order of C C i , with the alternative having the highest closeness coefficient being the optimal choice.
This study integrates the AHP, RDEMATEL, and TOPSIS to combine the strengths of hierarchical decision-making, causal relationship analysis, and multi-criteria ranking. First, the AHP quantifies the weights of different ESG dimensions, ensuring consistency and comparability among decision criteria. Second, the RDEMATEL identifies causal relationships between these dimensions, further revealing the interactive structure of sustainability factors. Finally, the TOPSIS evaluates the relative suitability of various green financial instruments by measuring their distance from ideal and negative ideal solutions. The integration of these three methods allows the study to simultaneously reflect the objectivity of weight allocation, the structural nature of factor interactions, and the practicality of decision outcomes, thereby offering a more comprehensive and decision-oriented analytical framework than traditional single-method approaches.

3.4. Evaluation Framework and Alternative Solutions

In today’s globalization and economic diversification era, encouraging global enterprises and organizations to fulfill their social responsibilities and adopt sustainable practices requires emphasizing the importance of ESG factors in corporate operations and investment decisions. Given the pressing reality of climate change, ESG is no longer merely an aspect of corporate social responsibility or sustainable management but a critical survival strategy.
Recognizing ESG as a key indicator for sustainable corporate investment now and in the future, Li et al. [28] employed ESG as an evaluation framework to analyze the importance and interrelation of key factors in China’s green financial system. Similarly, Meng and Shaikh [13] assessed the critical factors of green financial development using the ESG framework. Further, they integrated various green financial product investment strategies to identify the most optimal green financial investment products or strategies at the current stage.
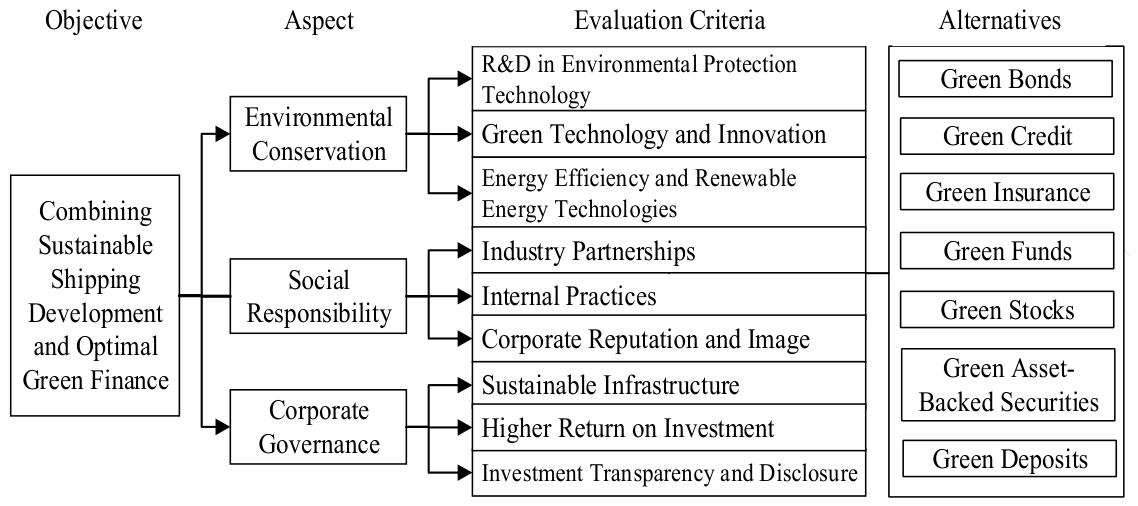
This study uses ESG to analyze the importance and interrelation of key influencing factors in sustainable shipping development. The evaluation criteria and content included in ESG are shown in Table 1.
As shown in Table 1, environmental conservation includes three evaluation criteria: research and development of environmental protection technology, green technology and innovation, and energy efficiency and renewable energy technology. Social responsibility includes three evaluation criteria: industry partnerships, internal practices, and corporate reputation and image. Corporate governance comprises three evaluation criteria: sustainable infrastructure, higher returns on investment, and investment transparency and disclosure.
Regarding the optimal combination of green financial products, numerous green financial products have been discussed in the literature. This study first eliminates investment strategies such as impact investing, ESG integration, and shareholder engagement. Next, it excludes green investment schemes that cater to investors rather than shipping companies seeking funding. Finally, it consolidates thematic investing, renewable energy funds, green project loans, and green securities with existing green financial products, such as GFs, GLs, and GSs. Based on the above selection and consolidation principles, the current optimal green financial products for sustainable development in the shipping industry are summarized in Table 2.
As shown in Table 2, the types of green financial products (alternative options) include GBs, GC, GI, GFs, GSs, GA, and GDs, totaling seven options. By integrating this study’s objectives, dimensions, criteria, and alternative options, the evaluation framework for sustainable shipping development and optimal green financial portfolio analysis is illustrated in Figure 1.
The primary objective of this study is to integrate the AHP, RDEMATEL, and TOPSIS to analyze the importance and interrelationships of key factors influencing the sustainable development of shipping companies. Additionally, it aims to identify the most suitable green financing solutions based on the characteristics of these key factors during the sustainable development process. The findings of this study not only provide financial support through green financial products to assist shipping companies in progressing toward sustainable shipping development but also offer insights for Taiwan’s financial industry in establishing environmentally friendly and sustainable financial products and strategies in the future.

4. Empirical Analysis

4.1. Questionnaire Survey Analysis

This study conducted a survey using expert questionnaires. The shipping company questionnaires were distributed via email, while the questionnaires for SHPs were distributed in paper format. In the first stage of this study, only senior managers from the planning departments of domestic shipping companies and senior managers from the business and shipping departments of large domestic exporters shipping goods from Taiwan to Europe and the United States were chosen as survey respondents. In the first phase of the survey, 30 questionnaires were distributed—17 to shipping companies and 13 to SHPs. The response rate was 16 from shipping companies and 10 from SHPs. After excluding inconsistent responses, 12 valid questionnaires were collected from shipping companies and 8 from SHPs, resulting in an effective response rate of 70.59% for shipping companies and 61.54% for SHPs.
Furthermore, regarding the selection of green financial products, senior managers from the finance departments of shipping companies were surveyed to identify the most suitable green financial products based on different considerations, including sustainable operation planning, costs required for sustainable operations, and methods of obtaining financial support for shipping sustainability. In the second phase of the survey, 30 questionnaires were distributed to both container and BSCs, with 20 responses collected, and 20 valid questionnaires were obtained, resulting in an effective response rate of 66.67%.
Regarding sample size, methodologies such as the AHP, RDEMATEL, and TOPSIS emphasize the professional depth of respondents rather than large-scale statistical sampling. Given the scarcity of senior industry experts and the highly specialized nature of sustainable shipping finance as a subject area, the number of questionnaire respondents in this study, while relatively limited, is nonetheless highly representative. The expert respondents are drawn from Taiwan’s leading CLSs and BSCs—including CMT, EMC, KMS, SNC, TSL, U-MING, WHL, and YML—as well as major multinational exporters, including ASUS, GIANT, INVENTEC, QCT, and VICTOR. As these companies occupy a dominant position in Taiwan’s shipping and export markets, the strategic consensus among them carries a high degree of robustness. Accordingly, the findings of this study possess strong inferential reference value (generalizability) and can serve as an effective practical benchmark for export-oriented shipping hubs with similar economic structures.
Considering that shipping routes, maritime regulatory frameworks, financial market maturity, and capital market characteristics very significantly across different regions and countries. Shipping companies may adopt different development models and approaches in their sustainability strategies and the use of green financial instruments. Therefore, the empirical results of this study primarily reflect the operational characteristics and sustainable finance strategies of Taiwan-based shipping companies operating on export routes to Europe and North America.

4.2. Importance Analysis

To consolidate the individual expert judgments into a single representative pairwise comparison matrix for each stakeholder group, this study employs the geometric mean method. The results of the valid questionnaires, calculated using Excel, indicate that the CI for the three evaluation dimensions is 0.0307, and the CR is 0.0529. For the nine evaluation criteria, the CI value is 0.0272, and the CR value is 0.0470, demonstrating that the valid questionnaires meet the consistency requirements.
The ranking of key factors influencing the sustainable shipping development of shipping companies is shown in Table 3.
From Table 3, it is evident that in the evaluation dimensions, both CSLs and SHPs consider “Environmental Conservation” (36.98%, 50.54%) the most important, followed by “Corporate Governance” (33.15%, 25.99%) and “Social Responsibility” (29.87%, 23.47%). For BSCs, “Environmental Conservation” (53.26%) remains the most critical, followed by “Social Responsibility” (28.47%) and “Corporate Governance” (18.27%).
In terms of evaluation criteria, the top three factors for CSLs are as follows:
  • “Sustainable Infrastructure” (19.13%).
  • “Energy Efficiency and Renewable Energy Technologies” (15.31%).
  • “R&D in Environmental Protection Technologies” (15.16%).
For BSCs, the top three evaluation criteria are as follows:
  • “Energy Efficiency and Renewable Energy Technologies” (22.76%).
  • “R&D in Environmental Protection Technologies” (18.47%).
  • “Corporate Reputation and Image” (15.74%).
For SHPs, the top three evaluation criteria are as follows:
  • “Energy Efficiency and Renewable Energy Technologies” (31.21%).
  • “Sustainable Infrastructure” (11.94%).
  • “Green Technology and Innovation” (10.33%).

4.3. Relationship Analysis

To understand the differences in the relationships between key factors influencing sustainable shipping development among CSLs, BSCs, and SHPs, this study employs the RDEMATEL method for analyzing the relationships between evaluation factors. In their study on the DEMATEL, Si et al. [39] note that if the threshold value is set too low, it may include too many factors, resulting in an overly complex and difficult-to-interpret Influence Relation Map (IRM). They also point out that the threshold value can be determined through expert discussions.
To ensure the reasonable screening of criteria, simplify the causal network, and highlight the interrelationships among key factors, experts in the maritime shipping field recommended applying a “top one-third principle.” Specifically, factors ranking in the top one-third in terms of influence are selected as significant and used to establish the threshold. Threshold values of 0.42, 0.50, and 0.74 are set to retain stronger influencing factors. The causal relationship values of factors affecting sustainable shipping development are shown in Table 4.
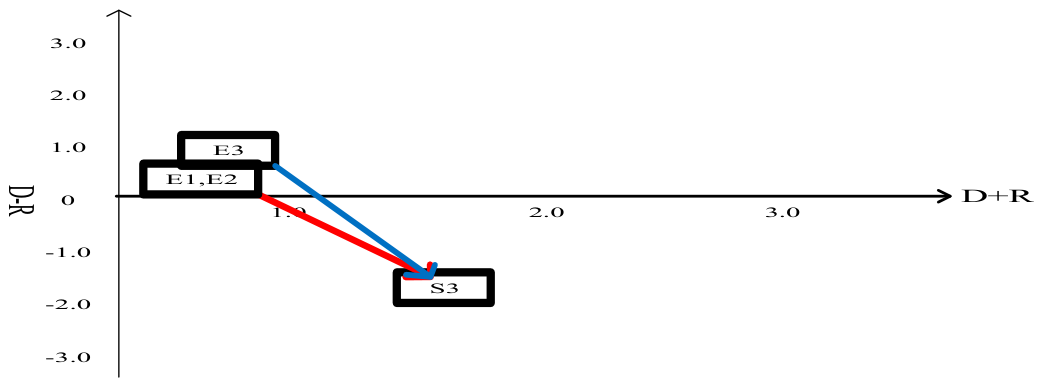
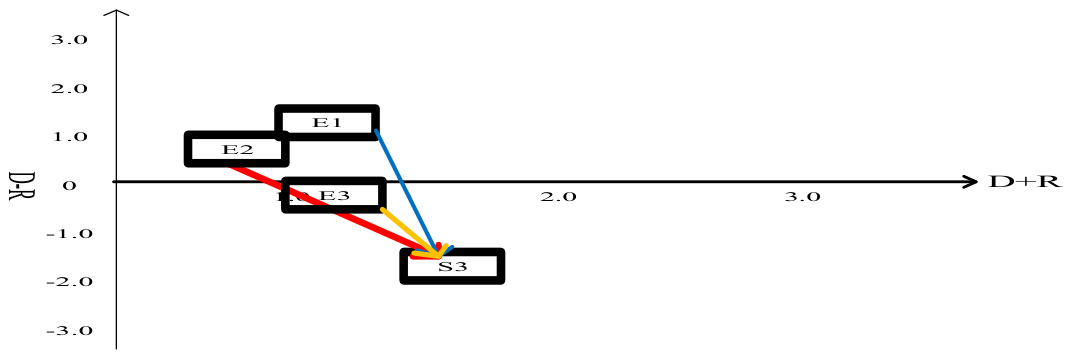
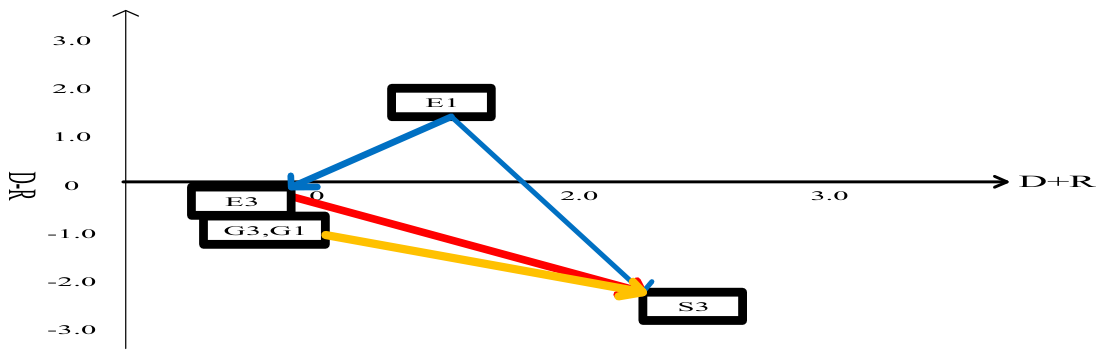
As shown in Table 4, developing environmentally friendly technologies is the primary influencing factor for BSCs and SHPs. In contrast, energy efficiency and renewable energy technologies are the main influencing factors for CSLs. Meanwhile, corporate reputation and image emerge as the primary affected factors across CSLs, BSCs, and SHPs. To better understand and visualize the causal relationships between the key influencing and affected factors for CSLs, BSCs, and SHPs, refer to Figure 2, Figure 3 and Figure 4.

4.4. Optimal Green Financial Product Analysis

Based on the results of the first-phase questionnaire and the AHP analysis, the weight of each evaluation criterion in selecting the optimal green financial product was established. The optimal green financial products were identified by aggregating and calculating the option closest to the positive ideal solution while being furthest from the negative ideal solution. The scores allocated to each alternative based on the respective criteria are obtained from expert responses using a Likert scale, wherein 1 denotes highly unsuitable, 2 denotes unsuitable, 3 denotes neutral, 4 denotes suitable, and 5 denotes highly suitable. The results of the analysis regarding the selection of optimal green financial products for shipping companies are presented in Table 5.
As shown in Table 5, GBs (0.81932) rank first among all green financial products for CSLs, indicating that GBs are closer to the positive ideal solution and further from the negative ideal solution than other financial products. GFs (0.808606) and GDs (0.785916) have similar proximity coefficients, suggesting that their financing feasibility is very close, ranking just behind GBs. On the other hand, GSs (0.395988), GC (0.342872), and GA (0.141423) have relatively lower feasibility.
For BSCs, GSs (0.844837) are the closest to the positive ideal solution and furthest from the negative ideal solution, making them the most viable financing option. GFs (0.791226) also demonstrate high financing feasibility compared to other financial products, followed by GBs (0.696105), which still offer financing advantages. However, GDs (0.465376), GC (0.464559), and GI (0.204748) have relatively lower financing feasibility.
In summary, GBs and GSs are considered the most favorable financing methods for CSLs and BSCs, respectively. Meanwhile, GC, GI, and GA are comparatively less applicable.

4.5. Discussion of Managerial Implications

4.5.1. Discussion of Importance Analysis

Energy efficiency and renewable energy technology, environmental technology R&D, and sustainable infrastructure are the primary key influencing factors for different types of shipping operators and SHPs in achieving sustainable shipping objectives. Additionally, BSCs place particular emphasis on corporate reputation and image, while SHPs emphasize the factors of green technology and innovation.
With increasingly stringent international carbon reduction requirements, sustainable shipping development goals should be dynamically adjusted in response to environmental changes and the constraints of international conventions. Governments, shipping companies, financial institutions, SHPs, consignees, inland transport operators, and port authorities must all actively participate, promote, and implement these initiatives as stakeholders. Therefore, “energy efficiency and renewable energy technology” emerges as the key influencing factor consistently recognized across different stakeholders in this study.
Regarding “environmental technology research and development,” shipping companies recognize the critical importance of formulating maritime research and development strategies. However, there is a significant shortage of research personnel within the industry. To successfully advance the development of green shipping products, the sector must rely on the expertise and manpower of government research institutions and higher education R&D teams.
Regarding “sustainable infrastructure,” CSLs, when planning their routes, primarily call at major international commercial ports, which are subject to international conventions and regulations. As a result, both container carriers and international ports have already placed significant emphasis on environmental conservation. In developing sustainable shipping, key influencing factors for container carriers include procuring green vessels, greening self-operated terminals, implementing energy management and waste recycling, improving fuel efficiency, and reducing carbon emissions.
In maritime operations, the BSC sector, as opposed to CSLs, emphasizes corporate reputation and image more due to its distinct operational characteristics. Factors such as route stability, fuel quality and refueling locations, terminal arrangements, loading and unloading schedules, and cargo types require greater crisis management and response capabilities. A company’s ability to handle crises directly affects stock prices, employee morale, and customer relationships. Additionally, violations of environmental regulations can result in substantial fines and operational disruptions, leading to significant economic losses and severe damage to corporate reputation.
On the other hand, SHPs prioritize green technology and innovation, primarily due to growing public environmental awareness and sustainability requirements from European and American consignees. This has led SHPs to voluntarily or involuntarily bear higher costs for green shipping. Innovations in green technology within the transportation and logistics process will help meet the expectations of consignees in Europe and the U.S. while also enhancing the overall sustainability of maritime shipping.

4.5.2. Discussion of Relationship Analysis

In terms of correlation analysis, both CSLs and BSCs share the perspective that “R&D of environmental protection technologies,” “green technology and innovation,” and “energy efficiency and renewable energy technologies” significantly influence “corporate reputation and image” (as shown in Figure 2 and Figure 3).
If pollution prevention is the primary objective, shipping companies can allocate a certain percentage of their revenue toward energy efficiency improvements and renewable energy technology development. This investment can drive initiatives such as logistics decarbonization, sustainable supply chains, greenhouse gas emissions reduction, maritime R&D strategy formulation, expansion of research institutions and personnel, ship emission controls, vessel and waste recycling, and carbon capture and storage (CCS) technologies. These efforts will contribute to environmental conservation and resource efficiency, thereby enhancing the corporate image of sustainable shipping.
Apart from sharing similar views with shipping companies on the importance of R&D in environmental protection technologies and energy efficiency and renewable energy technologies, SHPs also believe that if shipping companies increase investments in sustainable fixed assets and regularly disclose sustainability assessments and reports, implement corporate social responsibility initiatives, and conduct risk management and performance evaluations, it will enhance the companies’ reputation and image (as shown in Figure 4).
Furthermore, if shipping companies improve transparency and disclosure regarding sustainable infrastructure investments in maritime operations, it will help SHPs comply with the stringent environmental requirements of European and American consignees. This, in turn, enhances their international competitiveness and reduces potential export barriers.
Across all subgroups, “environmental conservation technology” and “green technology and innovation” consistently appear among the causal factors, indicating that these constitute the foundational driving forces of sustainable shipping and require proactive capital investment and structural transformation at the operational level. Conversely, “corporate reputation and image” emerges as an affected factor, indicating that the success of a shipping company’s “corporate reputation and image” is contingent upon the outcomes of investment in green technology, research and development, and infrastructure.
Furthermore, the IRM reveals causal mechanisms tailored to the perspectives of different stakeholder groups. For CSLs and BSCs, the causal relationship between environmental research and development and corporate reputation underscores an operationally oriented sustainability logic in which technical compliance determines market positioning. For SHPs, by contrast, “sustainable infrastructure” and “investment transparency and disclosure” emerge as key factors influencing corporate reputation and international competitiveness. This causal relationship explains why SHPs place particularly high importance on transparent ESG data: within global supply chains, verifiable green shipping practices constitute both a primary threshold requirement and a value-adding factor that enables shippers to navigate stringent regulatory barriers and secure their competitive advantage in European and North American markets. The RDEMATEL results, therefore, do not merely map the interdependencies among criteria: they practically validate how proactive green investment connects and translates into long-term corporate value.

4.5.3. Analysis of Maritime Financing Solutions

Maritime financing can be categorized into internal financing (e.g., self-financing through capital increase) and external financing (e.g., bank loans or corporate bond issuance). For internal financing, in addition to revenue from transportation services, shipping companies can convert profits, charter income, or proceeds from vessel sales into investment funds, which can then be allocated to other hardware and software equipment or the development of sustainable technologies to enhance their competitiveness. Internal financing carries lower financial risk; however, relying solely on internal financing may limit a company’s growth.
In maritime practice, external financing has traditionally relied on bank loans, corporate bonds, and stock issuance as primary sources of capital. With the emergence of diverse green financing options, shipping companies now have more external funding alternatives. By understanding the advantages and characteristics of various green financial products, shipping companies can expand their operations effectively while mitigating financial risks.
Recent empirical research provides compelling evidence that green finance generates synergistic benefits in terms of cost of capital reduction and economic efficiency. Caramichael and Rapp [40] find that green bonds enjoy an average cost advantage of eight basis points relative to conventional bonds. Given the substantial capital requirements associated with fleet retrofitting and the adoption of green technologies, even a seemingly modest reduction of eight basis points in the interest rate can translate into considerable absolute cost savings over the extended lifecycle of shipping loans. The formulation of robust ESG strategies by Taiwanese shipping companies is therefore not merely a matter of regulatory compliance, but is a concrete measure for significantly reducing the cost of capital and mitigating long-term investment risk.
In CSLs, GBs are more favorable than GSs as they do not pose risks related to ownership dilution or corporate control changes. Additionally, GBs can be issued in larger volumes, allowing shipping companies to raise substantial capital. Since issuers only need to pay interest to investors, they appeal to conservative investors who prioritize stable returns over the price volatility of stocks. As a result, GBs tend to have higher investor subscription rates.
Meanwhile, GFs and GDs serve as alternative carbon reduction strategies. They not only align with international environmental regulations but also contribute to CSR initiatives, enhancing corporate reputation, brand value, and other intangible benefits. However, GFs require asset managers to invest in equities, meaning that shipping companies cannot directly access these funds. Consequently, GBs remain the preferred financing instrument over GFs.
Furthermore, GLs do not require collateral; however, they typically involve smaller loan amounts and higher interest rates, making them more suitable for short-term and temporary financing needs. On the other hand, GAs allow shipping companies to use green vessels or green real estate as collateral. This financing option provides access to more significant loan amounts with lower interest rates, but it comes with the trade-off that ownership of the pledged vessel or asset is transferred to the financial institution during the loan period. Additionally, it also raises concerns regarding debt settlement priority in the future.
As for GSs, their market volatility presents higher risks. Issuing new shares could affect shipping companies’ control over operations by diluting existing shareholders’ equity, thereby influencing the number of shares that companies are willing to issue. Moreover, compared to bonds, stock transaction values tend to be lower than bond issue values. Given these security considerations, the funds raised through stock issuance may not be as substantial as those obtained from issuing bonds.
Differences in company size, organizational culture, operational model, and cargo type in the BSC sector distinguish it from CSLs. Since BSC revenues and risks are primarily influenced by tonnage and supply–demand fluctuations, financial forecasting is inherently more challenging. Additionally, the conservative organizational culture in BSCs means that environmental conservation concepts such as “green” initiatives and sustainability are not as deeply embedded as in CSLs. If a BSC issues GSs, it faces less repayment pressure. Additionally, there is less concern about losing control of the company due to a smaller number of shareholders, more significant variability in earnings, higher entry barriers, and specialized industry expertise.
Furthermore, since the concept of green and sustainable development in the BSC sector is relatively underdeveloped, the number of green vessels is limited. As a result, using GI for asset-based financing would yield significantly lower loan amounts compared to CSLs. Lastly, BSCs, characterized by smaller organizational structures and fleet sizes, handle a more diverse range of cargo. As a result, they encounter more significant challenges when complying with international environmental regulations and demonstrating financial stability and repayment capability to regulatory and financial institutions. Given these factors, when selecting green financial instruments for financing, BSCs tend to favor the more traditional approach of issuing GSs.
A significant limitation, however, resides in the implementation of green banking, which is a fundamental component of sustainable finance. It encounters restrictions not solely from market structures and regulatory frameworks but also from institutional pressures and stakeholder expectations. From the perspectives of institutional theory, stakeholder pressure, and organizational legitimacy, numerous emerging markets commonly confront challenges such as regulatory fragmentation, inadequate policy incentives, and underdeveloped ESG disclosure mechanisms. These issues collectively have impeded the advancement of green finance. This phenomenon underscores that the global transition toward green finance is not merely a challenge for individual nations but also reflects a broader tension among institutional adaptability, regulatory coherence, and societal expectations [29].
In response to the progressively stringent international requirements for carbon reduction, governments should, through policies guiding financial supervision and industrial development, enhance collaboration between financial institutions and shipping enterprises within the green financing system. Regulatory authorities may consider establishing specific Sustainable Shipping Financing Guidelines to delineate the scope and criteria for green financial products—such as green bonds, green loans, and green funds—in the maritime industry. Additionally, they could offer incentives, including tax reductions or credit guarantees, to mitigate financing costs for shipping companies involved in environmental technology research and development, energy-efficient retrofitting, and green infrastructure initiatives.
Governments may also encourage financial institutions to establish “Sustainable Shipping Project Financing Platforms” that, through inter-ministerial cooperation, combine the research and development capabilities of academic research institutions and corporate enterprises, thereby compensating for the shortage of R&D manpower and technological investment in the shipping industry. This approach would incentivize shipping companies to invest in energy-saving and renewable energy technologies, environmental technology R&D, and sustainable infrastructure, creating a virtuous cycle among financial support, industrial transformation, and policy oversight, thereby accelerating the development of a sustainable shipping ecosystem.
Although the hybrid approach integrating the AHP, RDEMATEL, and TOPSIS introduces additional computational complexity, maritime professionals can circumvent the intricate mathematical procedures by inputting various evaluation scores aligned with their current operational environment and specific requirements. Therefore, it is recommended to transform this framework into a user-friendly spreadsheet-based decision support tool, ensuring its reproducibility, transparency, and practical applicability within the shipping industry.
Furthermore, the developed AHP-RDEMATEL-TOPSIS framework can be flexibly applied in response to changes in financial and environmental conditions. Financial teams can recalculate results using updated parameters to maintain the adaptability of sustainable shipping investment strategies. The proposed framework can serve as a reference for policy evaluation and investment design in economies that share similar environmental disclosure requirements, green finance instruments, and maritime governance standards as Taiwan.

5. Conclusions and Recommendations

5.1. Conclusions

Through the integrated AHP-RDEMATEL-TOPSIS framework grounded in the ESG framework, this study bridges the critical gap between shipping sustainability assessment and financial strategy, aiming to elucidate and establish the linkage between shipping operators’ sustainable development and the financing of green financial instruments.
Based on the empirical analysis, the AHP results indicate that sustainability priorities vary across operational models. CSLs uniquely identify “sustainable infrastructure” as their foremost priority, reflecting their dependence on fixed sailing schedules and calls at major international ports subject to stringent environmental conservation regulations. By contrast, BSCs and SHPs identify “energy efficiency and renewable energy technologies” as their top priority. This divergence stems from the fact that BSCs must ensure vessel compliance in the highly volatile global tramp shipping market, while SHPs must leverage such compliance to overcome the stringent environmental export barriers imposed by European and North American consignees.
Furthermore, the RDEMATEL results clearly validate the functional logic of CSR, with “corporate reputation and image” consistently emerging as an affected factor across all stakeholder groups, while factors such as “R&D in environmental protection technology” and “energy efficiency and renewable energy technologies” are the unequivocal influencing factors. Senior shipping management must decisively reallocate capital from public relations campaigns to technical decarbonization. Corporate reputation can only be reinforced after verifiable green investments demonstrate tangible results.
Regarding the most appropriate green financial instruments, the findings provide shipping companies’ finance departments with an empirically grounded strategy for effectively accessing external capital and mitigating transition risks. This offers shipping operators a practical guide for navigating the capital-intensive green transition. CSLs prioritize “GBs” as their primary choice, followed sequentially by GFs, GDs, GI, GSs, GC, and GAs. When integrating the analysis of key influencing factors, CSLs prefer to utilize “GFs” to finance sustainable infrastructure projects. For initiatives related to “energy efficiency and renewable energy technologies” as well as “environmental technology R&D,” GBs are the preferred financial instrument. Conversely, BSCs prioritize “GSs” as their primary option, followed by GFs, GBs, GAs, GDs, GC, and GI. Specifically, BSCs favor “GSs” for financing “energy efficiency and renewable energy technologies,” “GBs” for “environmental technology R&D,” and “GAs” for projects aimed at enhancing “corporate reputation and brand image.”
The findings of this study align with the recent conclusions of Puleikiene [14], Naimoli [17], and other scholars, who assert that market-oriented green financial instruments are fundamental to maritime logistics. However, while previous research has predominantly concentrated on individual, generalized GBs, the portfolio optimization approach presented in this study distinctly illustrates that, within Taiwan’s highly volatile bulk shipping market, GSs may also furnish an enhanced risk mitigation framework.

5.2. Recommendations

This study integrates sustainable shipping and green finance decision-making by applying the AHP–Revised DEMATEL–TOPSIS multi-criteria decision-making approach to systematically analyze the interrelationships and relative importance of key factors in the sustainable development of the shipping industry and to identify the most suitable green financial instruments. The research not only bridges the theoretical gap between sustainability assessment and financial strategy in maritime transport but also provides practical financial decision-making references for shipping companies pursuing net-zero transitions.
However, the questionnaire sample size is limited, covering only large Taiwanese shipping companies and exporters operating on Europe–U.S. routes. As a result, the external validity of the findings remains constrained. Future studies could broaden the sample scope to include shipping companies in the Asia–Pacific, South America, and the Middle East and incorporate long-term panel data and carbon emissions performance indicators to deepen understanding of global trends in sustainable finance for shipping. Furthermore, future research may undertake a comparative analysis across the various groups to evaluate whether the differences observed among stakeholder groups are statistically significant.
Although this study has constructed an evaluation framework for shipping operators’ selection of green financial instruments through the ESG framework, it remains subject to constraints in data availability and the scope of certain vessel operational dimensions. Specifically, vessel-level empirical environmental indicators—such as actual CO2 emissions, the Carbon Intensity Indicator (CII), and the Energy Efficiency Existing Ship Index (EEXI)—are currently embedded only implicitly within the broader criteria, which limits the quantitative linkage between capital input and measurable environmental benefit. At the same time, the framework does not incorporate stress testing for variable financing conditions and carbon price trajectories. Future research should integrate empirical carbon emissions data directly into the decision-making model, so as to precisely quantify and audit the environmental effectiveness of specific green investments. In addition, it is recommended that subsequent research develop scenario analysis and stress testing for green financing conditions (such as credit spreads, maturities, and policy incentives) in order to validate the robustness and practical value of various financial decisions within a dynamic and evolving sustainable finance environment.

Author Contributions

Conceptualization, T.-C.H.; methodology, H.-S.L.; software, T.-C.H. and H.-S.L.; validation, T.-C.H.; formal analysis, T.-C.H.; investigation, T.-C.H.; resources, T.-C.H.; data curation, T.-C.H. and H.-S.L.; writing—original draft preparation, T.-C.H.; writing—review and editing, T.-C.H. and H.-S.L.; visualization, T.-C.H.; supervision, H.-S.L.; project administration, T.-C.H.; funding acquisition, T.-C.H. and H.-S.L. All authors have read and agreed to the published version of the manuscript.

Funding

This research received no external funding.

Institutional Review Board Statement

Ethical review and approval were waived for this study by Institution Committee as per the Human Research Act of Taiwan.

Informed Consent Statement

Verbal informed consent was obtained from the participants.

Data Availability Statement

The original contributions presented in this study are included in the article. Further inquiries can be directed to the corresponding author.

Conflicts of Interest

The authors declare no conflicts of interest.

References

  1. Macioszek, E.; Jurdana, I. Transport of goods on the example of a selected section of transport in Poland. Sci. J. Silesian Univ. Technol. Ser. Transp. 2023, 121, 127–140. [Google Scholar] [CrossRef]
  2. Green Finance Action Plan 2.0. Available online: https://www.fsc.gov.tw/ch/home.jsp?id=818&parentpath=0,7,616 (accessed on 27 March 2024).
  3. Yeh, M.T.; Tsai, F.M.; Kurrahman, T. Assessing Hierarchical Corporate Sustainability Transition Practices under Uncertainty: An Approach in the Port and Shipping Industry in Southeast Asia. J. Mar. Sci. Technol. 2023, 31, 428–450. [Google Scholar] [CrossRef]
  4. Zhou, Y.; Li, X.; Yuen, K.F. Sustainable Shipping: A Critical Review for a Unified Framework and Future Research Agenda. Mar. Policy 2023, 148, 105478. [Google Scholar] [CrossRef]
  5. Tran, T.M.T.; Yuen, K.F.; Li, K.X.; Balci, G.; Ma, F. A Theory-driven Identification and Ranking of the Critical Success Factors of Sustainable Shipping Management. J. Clean. Prod. 2020, 243, 118401. [Google Scholar] [CrossRef]
  6. Xue, Y.; Lai, K.H. Responsible Shipping for Sustainable Development: Adoption and Performance Value. Transp. Policy 2023, 130, 89–99. [Google Scholar] [CrossRef]
  7. Koray, M. Determining the Main Criteria Required for the Green Transition of the Maritime Industry in Terms of MTME. Int. J. Environ. Geoinform. 2023, 10, 53–64. [Google Scholar] [CrossRef]
  8. Pangalos, G. Financing for a Sustainable Dry Bulk Shipping Industry: What Are the Potential Routes for Financial Innovation in Sustainability and Alternative Energy in the Dry Bulk Shipping Industry? J. Risk Financ. Manag. 2023, 16, 101. [Google Scholar] [CrossRef]
  9. Rebelo, P. Green Finance for a Sustainable Maritime Transport System: Developing a Universal Vernacular for Green Shipping. Aust. N. Z. Marit. Law. J. 2020, 34, 16–30. [Google Scholar]
  10. Iqbal, S.; Taghizadeh-Hesary, F.; Mohsin, M.; Iqbal, W. Assessing the Role of the Green Finance Index in Environmental Pollution Reduction. Stud. Appl. Econ. 2021, 39, 1–15. [Google Scholar] [CrossRef]
  11. Xu, S.; Liu, Y. Research on the Impact of Carbon Finance on the Green Transformation of China’s Marine Industry. J. Clean. Prod. 2023, 418, 138143. [Google Scholar] [CrossRef]
  12. Lin, H.K. Green Finance Development in China: Setting a Model? Or Maverick? Taiwan Econ. Res. Mon. 2023, 46, 84–89. [Google Scholar] [CrossRef]
  13. Meng, X.; Shaikh, G.M. Evaluating Environmental, Social, and Governance Criteria and Green Finance Investment Strategies Using Fuzzy AHP and Fuzzy WASPAS. Sustainability 2023, 15, 6786. [Google Scholar] [CrossRef]
  14. Puleikiene, K. The Impact of Sustainable Innovations’ Ecosystem Change on Increasing Enterprise Value in Maritime Sector Companies. Sustainability 2026, 18, 3924. [Google Scholar] [CrossRef]
  15. Shi, Y.; Papapostolou, N.C.; Marchese, M.; Moutzouris, J.C.; Efstathiou, A. Interplay between Green Investment and Market Price Premia in Global Shipping. Int. J. Financ. Econ. 2026, 1–20. [Google Scholar] [CrossRef]
  16. Nautiyal, N.; Alrababa’a, A.R.; Rehman, M.U.; Vo, X.V.; Al-Faryan, M.A.S. Portfolio Risk and Return between Energy and Non-Energy Stocks. Heliyon 2024, 10, e31199. [Google Scholar] [CrossRef]
  17. Naimoli, A.; Storti, G. A Comparative Analysis of Green and Brown Stocks: The Impact of Uncertainty Indices on Tail-Risk Forecasting. Forecasting 2026, 8, 31. [Google Scholar] [CrossRef]
  18. Opoku, A.; Danquah, R.D.; Aklashie, S.; Larbi, J.A.; Qiao, Y.A. Digital Green Finance Models for Sustainable Urban Development: Current Trends and Future Perspectives. Green Financ. 2026, 8, 63–84. [Google Scholar] [CrossRef]
  19. Du, M.; Antunes, J.; Wanke, P.; Chen, Z. Ecological Efficiency Assessment under the Construction of Low-Carbon City: A Perspective of Green Technology Innovation. J. Environ. Plan. Manag. 2022, 65, 1727–1752. [Google Scholar] [CrossRef]
  20. Dai, Y.; Solangi, Y.A. Evaluating and Prioritizing the Green Infrastructure Finance Risks for Sustainable Development in China. Sustainability 2023, 15, 7068. [Google Scholar] [CrossRef]
  21. Huang, S.T.; Yin, T.J. Prioritize the ESG Strategies of Liner Shipping Industry. Qual. Mag. 2023, 59, 30–35. [Google Scholar]
  22. Ho, T.C.; Lee, H.S. An Analysis of the Technology, Service Quality, and Relevance for CSBC Corporation: Taiwan’s Installation of Scrubber Systems. Sustainability 2023, 15, 5641. [Google Scholar] [CrossRef]
  23. Moshiul, A.M.; Mohammad, R.; Hira, F.A. Alternative Fuel Selection Framework toward Decarbonizing Maritime Deep-Sea Shipping. Sustainability 2023, 15, 5571. [Google Scholar] [CrossRef]
  24. Motlagh, H.R.S.; Zadeh, S.B.I.; Garay-Rondero, C.L.M. Towards International Maritime Organization Carbon Targets: A Multi-Criteria Decision-Making Analysis for Sustainable Container Shipping. Sustainability 2023, 15, 16834. [Google Scholar] [CrossRef]
  25. Guo, H.R. The Current Status of Global Green Finance Development. Cent. Bank Repub. China -Int. Financ. Ref. Mater. 2016, 69, 1–16. [Google Scholar]
  26. Chandran, R.; Chandran, M.C.S. Green Finance and Sustainability: Mapping Research Development through Bibliometric Analysis. Discov. Sustain. 2024, 5, 339. [Google Scholar] [CrossRef]
  27. Lee, H.S.; Tzeng, G.H.; Yeih, W.C.; Wang, Y.J. Revised DEMATEL: Resolving the Infeasibility of DEMATEL. Appl. Math. Model. 2013, 37(10–11), 6746–6757. [Google Scholar] [CrossRef]
  28. Li, Y.; Zhang, Y.; Solangi, Y.A. Assessing ESG Factors and Policies of Green Finance Investment Decisions for Sustainable Development in China Using the Fuzzy AHP and Fuzzy DEMATEL. Sustainability 2023, 15, 15214. [Google Scholar] [CrossRef]
  29. Chandran, M.C.S.; Chandran, R.; Das, D.; Vinodkumar, K. Examining the Role of Smart Cities and Sustainability Research in Achieving SDGs through Bibliometric Lens. Discov. Sustain. 2025, 6, 679. [Google Scholar] [CrossRef]
  30. Pluskota, P.; Słupińska, K.; Wawrzyniak, A.; Wąsikowska, B. The Application of Artificial Intelligence (AI) in the Implementation of ESG-Oriented Sustainable Development Strategies in the Banking Sector: A Case Study. Sustainability 2026, 18, 732. [Google Scholar] [CrossRef]
  31. Liu, S.; Wei, W. Green Trade Barriers and Industrial Chain Resilience: Is Green Finance Still Effective? Systems 2025, 13, 867. [Google Scholar] [CrossRef]
  32. Explanation of the Definition of Green Finance. Available online: https://bank.sinopac.com/sinopacBT/personal/article/eco-friendly/green-finance.html (accessed on 6 October 2024).
  33. Tsai, F. Green Economy and Green Finance; China Renmin University Press: Beijing, China, 2023. [Google Scholar]
  34. Green Finance: A Powerful Engine for Sustainable Development. Available online: https://www.cathayholdings.com/holdings/esg/media/articles/esg-life/green_finance (accessed on 7 October 2024).
  35. Green Finance is Coming. Available online: https://www.dbs.com/livemore/tw-zh/sustainability/wm215.html (accessed on 7 October 2024).
  36. Green Finance and ESG, Sustainable Financial Development, Green Goods Drive Net-Zero Transition. Available online: https://mkp.taishinbank.com.tw/s/2023/conscientious/greenbanking.html (accessed on 6 October 2024).
  37. Guidebook to Carbon Neutrality in China-Macro and Industry Trends Under New Constraints; CITIC Press Corporation: Beijing, China, 2022.
  38. Important Measures and Results of the Green Finance Action Plan 2.0. Available online: https://www.fsc.gov.tw/websitedowndoc?file=chfsc/202208261508120.pdf&filedisplay=%E7%B6%A0%E8%89%B2%E9%87%91%E8%9E%8D%E8%A1%8C%E5%8B%95%E6%96%B9%E6%A1%882.0%E8%BE%A6%E7%90%86%E6%83%85%E5%BD%A2%E5%AE%98%E7%B6%B2%E6%9B%B4%E6%96%B0_111Q2.pdf (accessed on 27 March 2024).
  39. Si, S.L.; You, X.Y.; Liu, H.C.; Zhang, P. DEMATEL Technique: A Systematic Review of the State-of-the-Art Literature on Methodologies and Applications. Math. Probl. Eng. 2018, 2018, 3696457. [Google Scholar] [CrossRef]
  40. Caramichael, J.; Rapp, A.C. The Green Corporate Bond Issuance Premium. J. Bank. Financ. 2024, 162, 107126. [Google Scholar] [CrossRef]
Figure 1. Research framework for sustainable shipping development and optimal green financial portfolio.
Sustainability 18 05406 g001
Figure 2. Causal relationship diagram—CSLs’ perspective.
Sustainability 18 05406 g002
Figure 3. Causal relationship diagram—BSCs’ perspective.
Sustainability 18 05406 g003
Figure 4. Causal relationship diagram—SHPs’ perspective.
Sustainability 18 05406 g004
Table 1. Evaluation criteria and content of key influencing factors in sustainable shipping development.
AspectEvaluation CriteriaData Source
Environmental ConservationR&D in Environmental Protection Technology[4,5,21]
Green Technology and Innovation[3,4]
Energy Efficiency and Renewable Energy Technologies[4,5,7,13,21]
Social ResponsibilityIndustry Partnerships[3,5,7,21]
Internal Practices[3,4,5,6,13]
Corporate Reputation and Image[3,4,13]
Corporate GovernanceSustainable Infrastructure[3,4,6,29]
High Return on Investment[4]
Investment Transparency and Disclosure[4,5,6]
Table 2. Optimal green financial product types and their descriptions.
Green Financial ProductsData Source
GB[2,9,12,13,20,30,31,32,33,34,35,36,37,38]
GC[2,12,31,33,34,36,37,38]
GI[2,12,20,32,33,34,35,36,37,38]
GF[2,12,13,20,33,34,35,36,38]
GS[2,25,33]
Green Asset-Backed Securities (GA)[12,32]
Green Deposits (GDs)[32,34,36]
Table 3. Ranking of key factors influencing sustainable shipping development.
AspectWeight (Ranked)Evaluation CriteriaWeightWeight (Ranked)
CSLsBSCsSHPsCSLsBSCsSHPsCSLsBSCsSHPs
Environmental Conservation0.3698
(1)
0.5326
(1)
0.5054
(1)
R&D Environmental Conservation Technology0.41000.34670.17810.1516
(3)
0.1847
(2)
0.0900
(5)
Green Technology and Innovation0.17590.22600.20430.0650
(7)
0.1204
(4)
0.1033
(3)
Energy Efficiency and Renewable Energy Techno0.41400.42730.61760.1531
(2)
0.2276
(1)
0.3121
(1)
Social Responsibility0.2987
(3)
0.2847
(2)
0.2347
(3)
Industry Partner Relationships0.20250.26690.33700.0605
(8)
0.0760
(5)
0.0791
(7)
Internal Implementation0.32490.18020.42040.0970
(5)
0.0513
(8)
0.0987
(4)
Corporate Reputation and Image0.47270.55290.24260.1412
(4)
0.1574
(3)
0.0569
(9)
Corporate Governance0.3315
(2)
0.1827
(3)
0.2599
(2)
Sustainable Infrastructure0.57710.39430.45930.1913
(1)
0.0720
(6)
0.1194
(2)
High Return on Investment0.17390.35970.21920.0576
(9)
0.0657
(7)
0.0569
(8)
Investment Transparency and Disclosure0.24900.24600.32150.0825
(6)
0.0449
(9)
0.0836
(6)
Note: The individual CR values for the evaluation dimensions are 0.0670 (CSLs), 0.0426 (BSCs), and 0.0492 (SHPs). For the evaluation criteria, the individual CR values are 0.0441 (CSLs), 0.0524 (BSCs), and 0.0447 (SHPs); ( ) Numbers in parentheses indicate ranking.
Table 4. Causal relationship values of key influencing factors for sustainable shipping development as perceived by CSLs, BSCs, and SHPs.
Evaluation CriteriaDkRkDk + Rk
(Ranked)
DkRk
(Ranked)
CSLsBSCsSHPsCSLsBSCsSHPsCSLsBSCsSHPsCSLsBSCsSHPs
(E1) R&D of Environmental Protection Technology0.4241.0601.5270 *000.4241.0601.5270.4241.0601.527
(E2) Green Technology and Innovation0.4240.527-- *00--0.4240.527--0.4240.527--
(E3) Energy Efficiency and Renewable Energy Technology0.4500.511000.5180.7420.4501.0290.7420.450−0.007−0.742
(S3) Corporate Reputation and Image0001.7391.5802.2831.7391.5802.283−1.739−1.580−2.283
(G1) Sustainable Infrastructure----0.751----0----0.751----0.751
(G3) Investment Transparency and Disclosure----0.748----0----0.748----0.748
* Notes: “0” indicates no influence; “--“ denotes that the factor did not meet the threshold value.
Table 5. Analysis of optimal green financial product financing.
Green Financial ProductS+S−Proximity Coefficient (Ranked)
CSLsBSCsCSLsBSCsCSLsBSCs
GB0.0055160.0255610.0250120.058550.819320 (1)0.696105 (3)
GC0.0282030.048140.0147160.0417680.342872 (6)0.464559 (6)
GI0.0157290.0606280.0181090.0156090.535176 (4)0.204748 (7)
GF0.0083020.0162630.0350760.0616350.808606 (2)0.791226 (2)
GS0.020230.0109970.0132630.0598750.395988 (5)0.844837 (1)
GA0.0302030.0342870.0049750.0471780.141423 (7)0.579121 (4)
GD0.0074240.0467060.0272540.0406560.785916 (3)0.465376 (5)
Notes: ( ) Numbers in parentheses indicate ranking.
Disclaimer/Publisher’s Note: The statements, opinions and data contained in all publications are solely those of the individual author(s) and contributor(s) and not of MDPI and/or the editor(s). MDPI and/or the editor(s) disclaim responsibility for any injury to people or property resulting from any ideas, methods, instructions or products referred to in the content.