Article

Driving Sustainable Circular Economy in Agriculture Through Napier Grass Cultivation: The Case of Rural West Bengal, India

Graduate School of Energy Science, Kyoto University, Yoshidahonmachi, Sakyo Ward, Kyoto 6068501, Japan
*
Author to whom correspondence should be addressed.
Sustainability 2026, 18(11), 5387; https://doi.org/10.3390/su18115387
Submission received: 21 April 2026 / Revised: 19 May 2026 / Accepted: 25 May 2026 / Published: 27 May 2026
(This article belongs to the Section Bioeconomy of Sustainability)

Abstract

This study evaluates the scalability and sustainability impacts of integrating Napier grass cultivation with biofertilizer production and dairy systems in rural West Bengal. Field-level evidence indicates that biofertilizer application and irrigation optimization significantly enhance soil organic carbon (SOC), improving nutrient availability and enabling Napier yields of up to 500 tons/acre on fallow land. A technoeconomic model shows strong economies of scale, with production costs decreasing by 40% when area under cultivation is simulated from 1 acre to 100 acres. Statewide scaling scenarios demonstrate significant development potential. Under 10% adoption of fallow land by 2040, approximately 75 million tons of biomass can be grown annually, benefiting 3.75 million households, doubling under a 20% adoption scenario by 2050. The system enables a 2.5–4× increase in household income while delivering substantial climate co-benefits. Avoided emissions from manure management are estimated at ~40 Mt CO2 annually by 2040, increasing to ~80 Mt CO2 by 2050, alongside additional gains from soil carbon sequestration and reduced high-emission urea-use. Overall, the proposed circular model offers a scalable pathway for achieving multiple Sustainable Development Goals through integrated agricultural transformation.

1. Introduction

Modern day agriculture is highly mechanized and efficient in the developed world but suffers from social and economic inefficiencies in the developing world. Consequently, farmers form the backbone of the population of most countries in the global south, and the case is no different for India. India is a rapidly progressing developing economy, with a Gross Domestic Product (GDP) above USD 4 trillion, as of 2025 [1]. However, while farmers form about 55–60% of the populace, the GDP of the agricultural sector is <16% [2]. While the national GDP grows at 6–8% average, agricultural GDP grows at a meagre 3.5–4% [3]. To put into perspective, a population greater than all of the countries except India and China live off a GDP of just USD 800 billion, growing annually at sub-4% levels. Poverty is the biggest social issue plaguing Indian agriculture, with more than 200 million farmers having below poverty line (BPL) livelihoods. Socially engineering and innovating agriculture is of the utmost importance for a just society and holistic sustainable development goals’ (SDGs’) achievement.
In this paper, we focus on eastern India’s West Bengal state, which is a major agricultural hub. Historically, West Bengal contributed 10% GDP towards the national share in the 1960s, but has significantly dipped to 5.6% in 2024 [4]. While the issue is multi-faceted, slow penetration of innovation is one major contributor for the downfall [5]. Moreover, food and cash crops are primarily produced by large landholding farmers and corporations, most often having access to alluvial soils and modern fertilizers [6]. In fact, smallholders and marginalized farmers have minimal access to high-quality fertilizers and less-productive soils that perpetuate their poverty [7]. Such farmers are often burdened by fertilizer loans and fallow lands, which have given rise to the terrible phenomena of suicide among farmers [8]. Similarly, dairy farmers are also affected. Fragmented landholdings, seasonal fallow lands, and high fodder costs constrain rural incomes and dairy productivity [9].
On the environmental side, several issues persist. Firstly, soil health has been recorded to be extremely poor in rural patches of West Bengal, specifically farmland owned by marginalized farmers [7]. Soil organic carbon (SOC) is reported to be below 0.5%, when the international average is 2% [10,11]. This causes nitrate leeching, eutrophication, soil acidity, and intensifies the use of chemical fertilizers that further degrade the soil without established guidelines of application [12,13]. Urea is the most commonly used nitrogenous fertilizer, which is known to be produced from methane reforming and Haber–Bosch, carrying a high life-cycle CO2 emission [14]. Public health is also compromised when dairy farmers are forced to inject chemical hormones for increasing milk output, which often compensate for growing fodder prices [15]. These challenges present an opportunity for circular agricultural interventions that simultaneously enhance soil fertility, increase land productivity, and reduce input costs. The cultivation of Napier grass integrated with biofertilizer derived from livestock waste represents one such circular model with potential multi-sectoral benefits. Our experimental intervention in the district of Bankura in West Bengal shows promise, which we introduce in this paper.
The rest of the paper is organized as follows: Section 1.1 list the objectives of the study and Section 1.2 provides a brief literature review on similar studies. In Section 2, the detailed data for experiments, technoeconomic analysis, and baselining are provided, along with the analysis methods for each part of the study. Section 3 is divided into two parts: (a) the experimental results and technoeconomic analysis, and (b) the potential scalability and SDG achievements by the years 2040 and 2050. In Section 4, a brief policy implication draws the relevance of the study to the context of rural West Bengal, India, and in Section 5, the paper is concluded with the key takeaways.

1.1. SDG Achievement Objectives

Our objectives are centered on the achievement of SDGs 1, 8, 12, 13, and 15. The direct experimental results show a local achievement, and then we evaluate the potential of achieving the SDG targets in a state-wide scope by adoption of our circular model through to 2040 and 2050.
Napier grass (Pennisetum purpureum) is a high-biomass perennial fodder crop capable of thriving on marginal lands while contributing to soil organic carbon accumulation [16,17]. When combined with biofertilizer-based soil management, the system reduces reliance on synthetic nitrogen fertilizers such as urea [11], thereby lowering greenhouse gas emissions associated with fertilizer manufacturing (SDG 13: Climate Action). Furthermore, integrating Napier into dairy value chains reduces fodder costs, improves milk yields, and enhances household-level economic resilience, as shown by our findings. Such circular interactions create pathways for poverty alleviation among both fodder growers and dairy farmers, directly aligning with SDG 1.
West Bengal contains substantial tracts of cultivable fallow land, particularly in rainfed districts such as Bankura, Purulia, and Paschim Medinipur [18]. Utilizing a portion of these lands for perennial fodder cultivation could generate additional income streams, enhance employment opportunities, and strengthen rural value chains, contributing to SDG 8 (Decent Work and Economic Growth). Simultaneously, improvements in soil organic carbon and nutrient cycling promote efficient resource utilization, supporting SDG 12 (Responsible Consumption and Production), and aid in thriving biomass that binds soil to improve its porosity (SDG 15: Life on Land). The avoidance of synthetic fertilizer production and enhanced carbon sequestration further contribute to climate mitigation targets under SDG 13 (Climate Action).

1.2. Novelty and Literature Review

From the perspective of socioeconomic improvement of marginalized farmers, a significant portion of studies focus on economic analyses. For example, studies have shown that lower caste farmers often own land that is less productive [6] and lack access to agricultural extension services [19], which guide them for appropriate usage of fertilizers. Marginalized farmers are also disadvantaged towards access to modern energy [20], and since fertilizers (including ammonia) are key components of the energy infrastructure, they are unable to get nutrient-efficient fertilizers [13]. Several studies have proposed policy reforms for improving the condition of marginalized farmers, including strengthening farmers cooperatives [19], shifting away from chemical fertilization and incentivizing traditional methods [21], integrating solar pumping for irrigation [22,23] and benchmarking the price of seeds for high-value crops [6]. Specifically, one study in eastern India concluded that small landholding farmers do not benefit from higher mechanized farming and low rice/wheat productivity, and the path for poverty alleviation is off-farm jobs and multi-sectoral agricultural transition [7]. While these measures are very policy oriented, the implementation often takes decades due to bureaucratic slowdowns [24], not improving the condition of the farmers. Our study demonstrates a framework that shifts the method of rural agriculture from multiple dimensions and brings them under one umbrella, capable of being implemented at small community, village, and district levels.
Academic literature dealing with fertilization for Napier cultivation is recently growing traction as a high-yield perennial fodder crop capable of producing substantial biomass under tropical and subtropical conditions. In a study from Kenya, the smallholder farmers’ situation was highlighted on the premise of growing Napier under different fertilizers in the central highlands [25]. The study found that Di-ammonium Phosphate (DAP) and rabbit urine-based manure composition yielded the maximum Napier. Yield-wise, fresh biomass yields have been reported to be ranging from 60 to 350 t ha−1 yr−1 depending on soil fertility, irrigation, and cutting frequency, with higher productivity achieved under integrated nutrient management [16,26,27]. Simultaneously, Napier grass has also been shown to have sufficient nutrient value to manage fodder for smallholder farming ecosystems, having the potential to replace exorbitant fodder available in markets that are typically meant for large-scale dairy farms [28,29,30]. Economic analyses indicate that Napier-based fodder systems significantly reduce feed costs, which typically account for 60–70% of dairy production expenses in smallholder systems [25,31]. In fact, it has also been studied that milk yield improves by 20–25% if nutrient management of Napier can be implemented by controlling the time of cutting [31,32]. The environmental benefits associated with Napier are carbon sequestration and ability to grow on non-synthetic fertilizers. The crop’s deep root system contributes to soil organic carbon accumulation and improved soil structure, enhancing long-term land productivity [33,34]. Integration of organic fertilizers or manure has been shown to improve biomass yield while lowering reliance on synthetic nitrogen fertilizers, thereby reducing production costs and greenhouse gas emissions [11,35]. While these studies have driven innovation in smallholder and dairy farming systems, an integrated management is yet to be proven experimentally. Furthermore, these studies have not evaluated the potential to achieve holistic sustainable development in marginalized farming communities.
To address the gaps above, the results of this study experimentally show the achievement of the circular model from 2023 to early 2026 from the perspectives of soil fertility, milk yield, cost inputs, biomass production, and biofertilizer integration. This study further evaluates the statewide scalability of a circular Napier–biofertilizer–dairy nexus across rural West Bengal. Specifically, the research quantifies (i) poverty alleviation potential through reduced input costs and increased dairy income, (ii) economic value creation from fallow land utilization, (iii) greenhouse gas emission reductions from avoided urea use and soil carbon sequestration, and (iv) improvements in soil health and resource efficiency. Scenario analysis models the adoption of this system on 10% of fallow land by 2040 and 20% by 2050 to estimate cumulative socioeconomic and environmental impacts. Sensitivity analysis is conducted to evaluate uncertainty in yield, adoption rate, and price variability. The findings aim to inform sustainable agricultural policy and scalable circular economy interventions in smallholder-dominated landscapes.

2. Materials and Methods

2.1. Napier–Agro–Dairy Circular Model

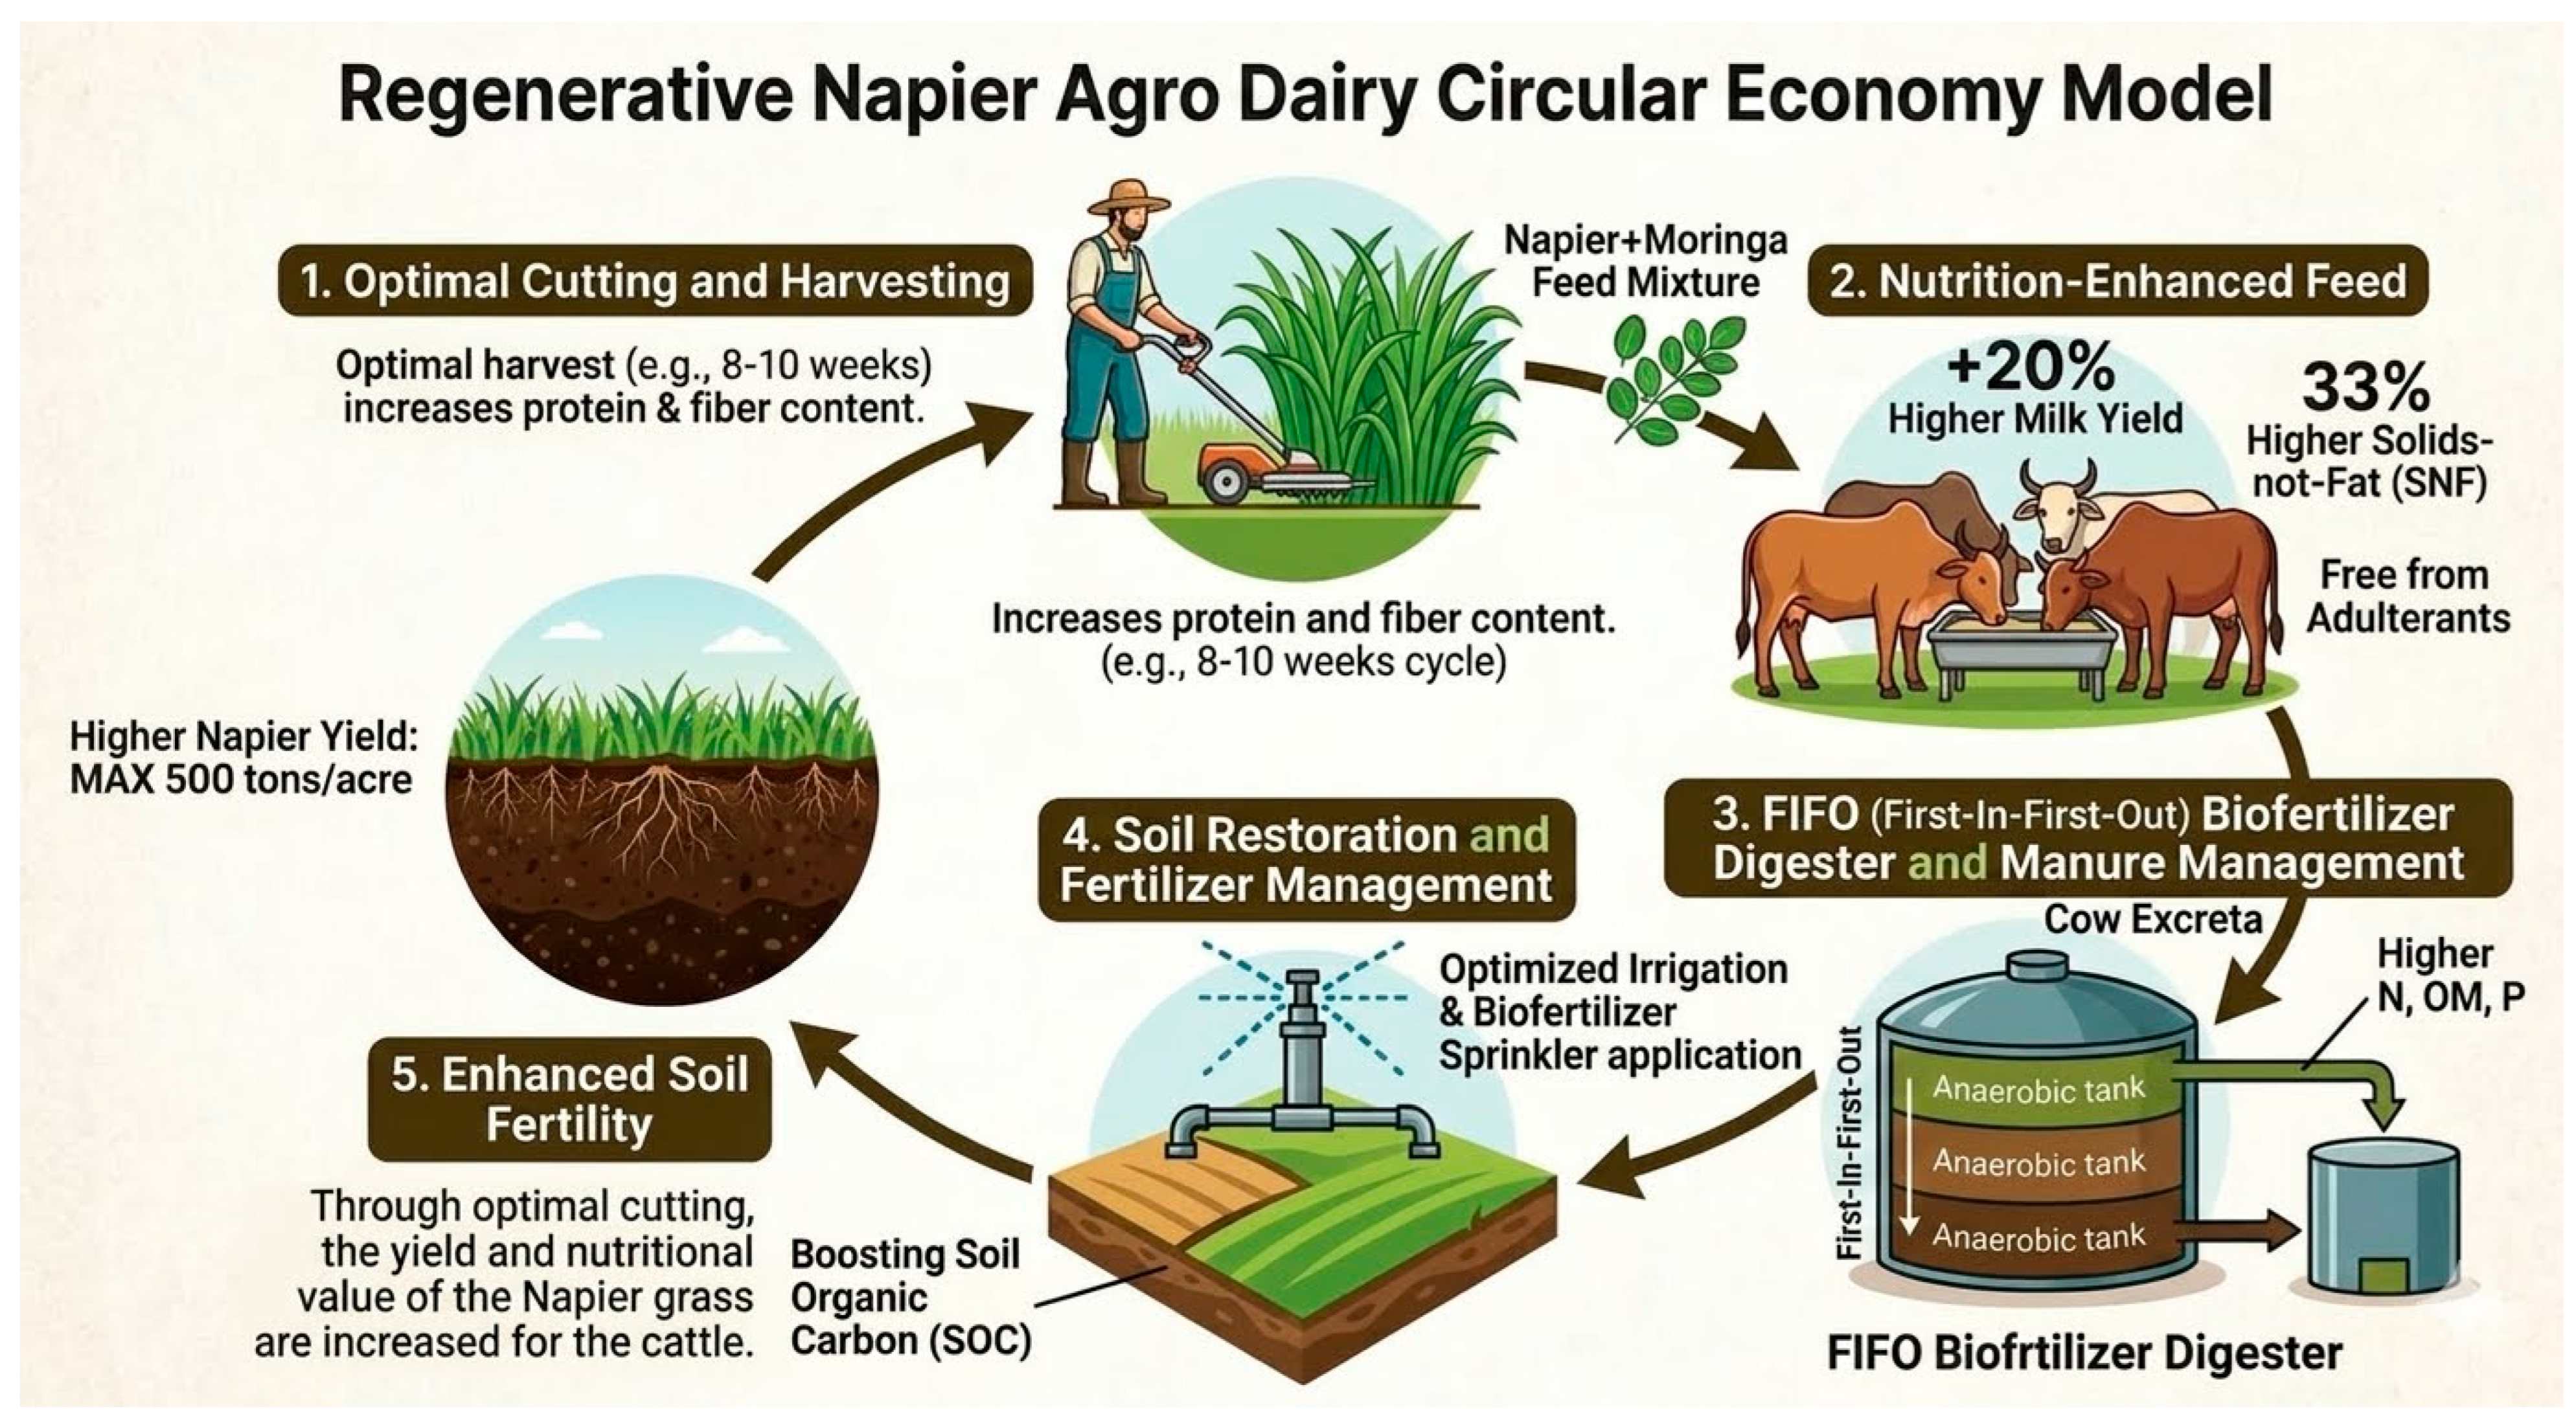
The preliminary results of our experiment are published in a recent study [11]. While the results are reported until June 2025 in the previous study, this paper reports the results achieved until March 2026. Significant developments are noted when compared to the previous publication, specifically with details of the biofertilizer composition and revised economic implications. This study also sets out the context of statewide scalability in an empirical manner, which is completely novel. The experiment is ongoing, with further results to be reported in the future. Figure 1 shows the circular Napier–agro–dairy nexus that has been implemented at Bishnupur, Bankura, West Bengal. The coordinates for the site of the experiment are 23.02293 N, 87.18964 E. Bishnupur town is characterized by red soils, rich in Fe-oxides, which are significantly less fertile than the alluvial soils of the Indo–Gangetic plain. Our preliminary measurements of SOC in July 2023 showed a value of 0.35% (Supplementary Material S1), which can be considered as fallow land. The detailed soil data are provided in Table 1.
The details of the circular agro cycle are as follows:
  • Stage 1: Optimized Fodder Input. Napier is cut 6–7 times per year (8–10 weeks) to improve the protein content. Using a third-party blind analysis, the protein content was found to be 14–16% by weight (on near-infrared (NIR) spectrometry on PerkinElmer DA 5540). Unlike expensive concentrates in market-available fodder [31], we utilize a moringa buffer. Moringa oleifera acts as a protein catalyst, which also increases the fiber content of the cattle feed [36].
  • Stage 2: Enhanced Milk Output. Due to the higher protein and fiber feed, along with efficient upkeep of the health of cattle, milk production improved by 20%, with a 33% higher solids-not-fat (SNF) ratio, improving nutritional value (measured on ABS Milk Analyzer-SNF testing machine: Essae 222V AC).
  • Stage 3: Nutrient Recovery for Fertilization. The most critical part of the model is the recovery of higher N/P content from the excreta of the indigenous cows fed the Napier + moringa fodder mix. The detailed content of the excreta is given in Table 1 (measured with Agros Nova MK2 meter, Agros, Lidköping, Sweden). A first-in-first-out (FIFO) digester is used to reside the excreta and create a biofertilizer that can improve fallow lands (results are given in Section 3.1).
  • Stage 4: Soil Rejuvenation. Using optimized irrigation methods that combines water with bio-slurry (10:1) ratio, the biofertilizer is applied. Unlike composting of soil during the transplantation stage of other crops [37], grass growth is stimulated with irrigation-controlled organic fertilizer application (results shown in Section 3.1). As SOC increases, evapotranspiration control measures are implemented to further improve the water holding capacity (WHC) of the soil.
  • Stage 5: Biomass Peak and Yield. SOC alone is not enough for maximizing Napier yield. First, the saplings are spaced 30 cm × 30 cm during the plantation phase, the improves the Napier rooting system to tap into nutrients [25]. Thereafter, the lignification threshold is maintained to reach a peak of 500 tons/acre with increasing SOC, which is much higher than the reported 180–250 tons/acre in India [38].

2.2. Techno-Economics of Napier Cultivation

Napier cultivation, under the specific conditions of biofertilizer use and optimized cutting cycles, has to consider a lot of factors. Since, our soil rejuvenation and Napier cultivation are simultaneous processes, the maximum yield of 500 tons/acre is not achievable in the first year of implementation, but a gradual process. Therefore, the effects of SOC-increase and Napier yield on the economics of the nexus are compounded. Climatic variables like rainfall and sunshine play a crucial role in determining yield of Napier. Microbial activity is another variable that influences the nutrient availability to the plants. Finally, soil factors like pH and soil degradation rate also affect the ultimate yield. Equation (1) shows the yield modelling for Napier, adopted in this study.
Y t = Y m a x f S O C ( t ) f r a i n ( t ) f s u n ( t ) f m i c r o ( t ) f s o i l ( t )
where Yt is the yield in year t (ton acre−1 yr−1), Ymax is the maximum yield (500 ton acre−1 yr−1 at SOC = 2%), fSOC is the soil organic carbon response, frain is the rainfall factor, fsun is the solar radiation factor, fmicro is the microbial activity factor, and fsoil is the acidity (pH) and soil degradation factor.
SOC is primarily increased due to the presence of microbial content and nutrient concentration in the biofertilizer. However, the increment is gradual and modeled as:
S O C t = S O C t 1 + Δ S O C b i o f e r t Δ S O C l o s s
where SOC in year t is based on the amount of organic matter (OC) added by the biofertilizer and the loss of microbes.
Optimal yields of Napier require ≥1100 mm annual rainfall and sufficient sunshine, based on regional data from tropical/subtropical regions [39]. Irrigation is used to provide the shortfall of water required by the plantation, but extreme rainfall or drought reduces yield. Equation (3) shows the rainfall factor calculation.
f r a i n = m i n T o t r a i n + W a t e r i r r i 1100 , 1
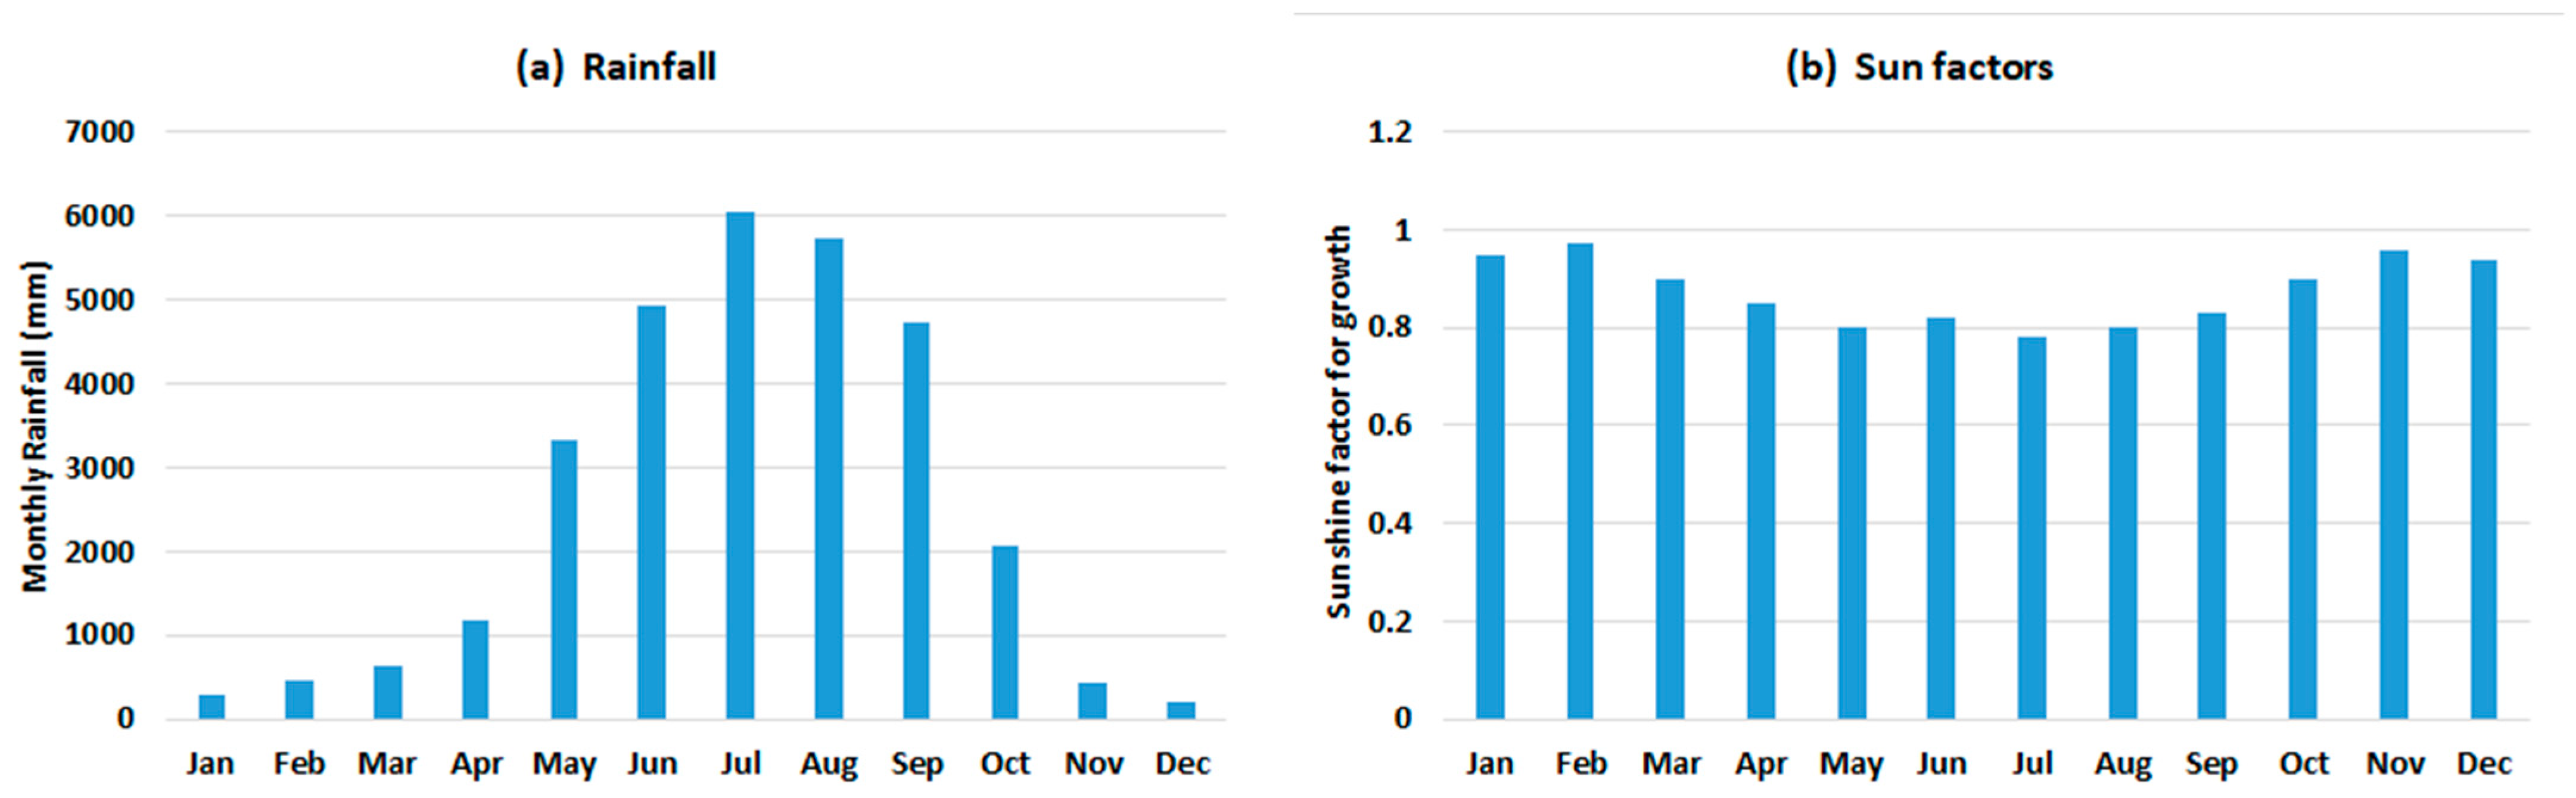
where the total rainfall (and consequently, irrigation water supplied) is considered to have stochastic variations, which is coded into MATLAB R2024a (Supplementary Material S2). Figure 2a shows the average monthly rainfall of the study region, Bishnupur (historical data covers the past 5 years, 2021–2025). Sunshine factor (fsun) is dependent on the monthly sunshine hours (Figure 2b), where the values are adopted from the literature [17,39] (the factors are lesser when average sunshine is lower). Stochastic variations are also considered in the monthly sunshine hours, reflecting real-world situations (Supplementary Material S2).
The pH of the soil changes every year with accumulation of salts and rainfall amount. To counter acidification of soil, lime treatment is done every 3 years for pH upliftment. The variation of pH is given as:
p H t = p H t 1 + 0.1 t t 3 0.03 T o t r a i n 1200 > 1 + r a n d 0.05
where t is the count of the years until lime treatment is done and rand is stochastic variations in pH level due to other environmental factors.
Microbial activity and nutrient release depend on pH level and SOC content. It is found that for the latitude of the location of Bishnupur, West Bengal, the maximum activity occurs at SOC of 2% and pH of 6.3 [21,34]. Equation (5) models the microbial factor.
f m i c r o = O C % 2 % × 1 p H 6.3 0.3
After the yield factors, the costs are modeled for analyzing the economies-of-scale. Capital (CAPEX) and operational (OPEX) expenditures are derived from a mix of actual inputs and assumptions from the literature, particularly for the scaling based on per-unit area of land (Table 2). The CAPEX components (Ccomp) are modeled as:
C c o m p = C b a s e l a n d s c a l e
where Cbase is the base cost per unit of land and scale is the scaling factor.

2.3. Baseline Data

In this section, we show the initial situation of fodder economics, dairy farmers’ income, and other factors, when we conducted interviews of 250 farming households in the vicinity of the project from July 2024 to March 2025. The ethical standards for the interviews were approved retrospectively by the Kyoto University ethics committee, in the attached certificate (Supplementary Material S3—dated 28 November 2025).
Table 3 shows this baseline data, where it can be seen that the cost of cattle rearing can reach up to INR 80/L of milk, opposed to a cost of INR 40/L. Additionally, the data for estimating the potential of implementing the framework in West Bengal from the perspectives of SDGs 1, 8, 12, 13, and 15 is shown. This data is reported by data aggregators and government agencies. Both smallholder dairy farmers and marginal fodder farmers earn well below the international poverty line of USD 3/day [41], particularly making this population quite vulnerable to social and environmental shocks. Simultaneously, the value of land owned by marginalized farmers (typically fallow land) is extremely less, which is where the innovation of this study focuses. Environmentally, the agricultural sector also performs quite poorly, with emissions coming mainly from fertilizer supply chains and absence of circularity in dairy farming.

2.4. SDG Achievement Potential Method

In this section, we evaluate how much the above presented nexus can aid in holistic sustainability achievement and rural transformation of West Bengal. To evaluate the statewide sustainability impacts of the Napier–biofertilizer–dairy nexus, a bottom-up scaling framework was developed by integrating the field-level technoeconomic model (Section 2.2) with land-use, socioeconomic, and environmental baseline datasets for West Bengal (Section 2.3). Two adoption scenarios were defined in this study, to suggest the scope beyond the completion of SDG targets by 2030:
  • Scenario A (Moderate Adoption): 10% of total fallow land by 2040
  • Scenario B (Accelerated Adoption): 20% of total fallow land by 2050
The details of all the estimation data and model specifications are given in the Appendix. Firstly, the total fallow land conversion to Napier cultivation is calculated. Let total fallow land in West Bengal be Afallow (acre). Then, the effective Napier cultivation area is:
A t = A f a l l o w α t
where At is the total area under Napier cultivation using the scheme presented in Figure 1 in the year t and α t is the adoption rate (0.1 in 2040 and 0.2 in 2050) for Napier on fallow land, which is ramped up linearly from 2027.
The state-level biomass production from Napier is computed using yields from the technoeconomic model (MATLAB—Supplementary Material S2), as
B t = A t Y t
where Bt is the biomass yielded (tons/year) from Napier in the year t and Y t is the stochastic yield of Napier (tons/acre/year).

2.4.1. Poverty Alleviation and Income Growth (SDGs 1 and 8)

This achievement is calculated from the perspective of Napier farmers and dairy farmers. Marginalized societies growing Napier for fodder on fallow land is assumed to generate INR 10,000/acre/year as the baseline, the current maximum economic intensity of fallow land (Table 3). Then, the income for per unit land can be calculated as:
I l a n d = ( P f o d d e r C t ) Y t
where Ct is the cost of cultivating Napier (INR/ton/year) in the year t, taken from the technoeconomic model in Section 2.2. Pfodder is the selling price of Napier, initially taken as INR 2/ton, and Iland is the profit in INR/ton/acre/year. Then, the total income generated (Itotal) can be represented as:
I t o t a l = I l a n d A t
From the perspective of dairy farmers, income increment comes from higher dairy yields and lower cost of fodder. The savings per cow (Sdairy) can be calculated as:
S d a i r y = C b a s e C n e w M o u t p u t
where Cbase and Cnew are the costs of milk production from indigenous cows (INR/L) in the baseline and the new framework, respectively. Moutput is the total milk yield from one cow. The total savings of dairy farmers (Stotal) is calculated based on the assumption that 25 kg of Napier fodder is consumed per day by an indigenous cow.
S t o t a l = S d a i r y B t 0.025 365

2.4.2. Environmental Impact Assessment (SDGs 13 and 15)

Effects on climate change is examined by how much emissions are avoided when using the circular framework to grow Napier for fodder by using biofertilizer, instead of emissions-heavy urea and DAP. The emissions reduction from dairy farming, by incentivizing the utilization of cattle excreta, improves the quality of life on land. The total avoided emissions in Napier cultivation are calculated as:
C O 2 . a v o i d = A t F r e q E F f e r t
where Freq is the area-based amount of fertilizer required for cultivating Napier (Table 3) in tons/acre/year and EFfert is the life-cycle emissions’ factor for manufacturing nitrogenous fertilizers (primarily urea in Table 3). The emission from the current circular model is dependent on methane from the manure:
C O 2 . c a t t l e = N c a t t l e e x c B F e m s
where Ncattle is the number of cattle being covered under this nexus following the adoption rate of Napier in 2040 and 2050, exc is the excreta amount (tons/year) per indigenous cow and BFems is the emission factor for producing biofertilizer from excreta as the manure emits CH4. The biofertilizer ultimately aids in increasing the SOC, which then helps in soil carbon sequestration, calculated as:
S O C g a i n = S O C f i n a l S O C i n i t i a l A t B D D
C O 2 . s o i l = S O C g a i n 3.67
where SOCfinal is the modeled increment of SOC at the end of 2040 and 2050, following the soil rejuvenation process, and D and BD are the average depth and bulk density, respectively, of red soil in West Bengal. The constant 3.67 is the equivalence of CO2 gas from SOC.

2.4.3. Resource Efficiency (SDG 12)

Soil rejuvenation by SOC increase reflects the efficient usage of fallow land as a natural resource. A Soil Regeneration Index is defined as:
S R I = S O C g a i n / S O C i n i t i a l

2.5. AI Usage

Generative AI tools were used in a limited manner for generating graphics of Figure 1, and for limited language editing. All research design, analysis, and interpretation were conducted by the authors, who take full responsibility for the manuscript.

3. Results

3.1. Napier-Agro-Dairy Nexus Results

3.1.1. Biofertilizer Composition

After recovering the nutrients from the excreta of Napier–moringa fed indigenous cows (Table 1), the FIFO digester prepares the biofertilizer that is responsible for soil rejuvenation. The duration of anerobic digestion for the input manure is 45 days, and the capacity of the digester is 50 L per day.
Table 4 shows the composition of the biofertilizer, which demonstrates superior nutrient mineralization and stability compared to traditional vermicompost. While vermicompost is characterized by high porosity and microbial enzymatic activity (e.g., protease and urease) [50,51], the FIFO anaerobic digestion of a Napier–moringa based bovine excreta significantly enhances the concentration of plant-available nitrogen ( N H 4 + -N) and total potassium [52]. Unlike standard batch digesters or aerobic composting [51], the FIFO mechanism ensures uniform hydraulic retention [53,54], preventing the “short-circuiting” of raw feedstock and resulting in a more homogenous mineral profile with a stabilized C:N ratio (typically 12:1 to 15:1). Furthermore, the incorporation of Moringa oleifera into the cattle diet serves as a mineral catalyst, enriching the digestate with secondary and micro-nutrients that are often more bioavailable than those found in standard vermicast [36,50]. While vermicompost excels in improving immediate soil physical structure [52,55], the liquid digestate from the FIFO system provides a rapid nutrient flux that is critical for achieving the peak biomass yields (up to 500 tons/acre) required in high-intensity Napier cultivation.

3.1.2. Soil Fertility and Crop Yield

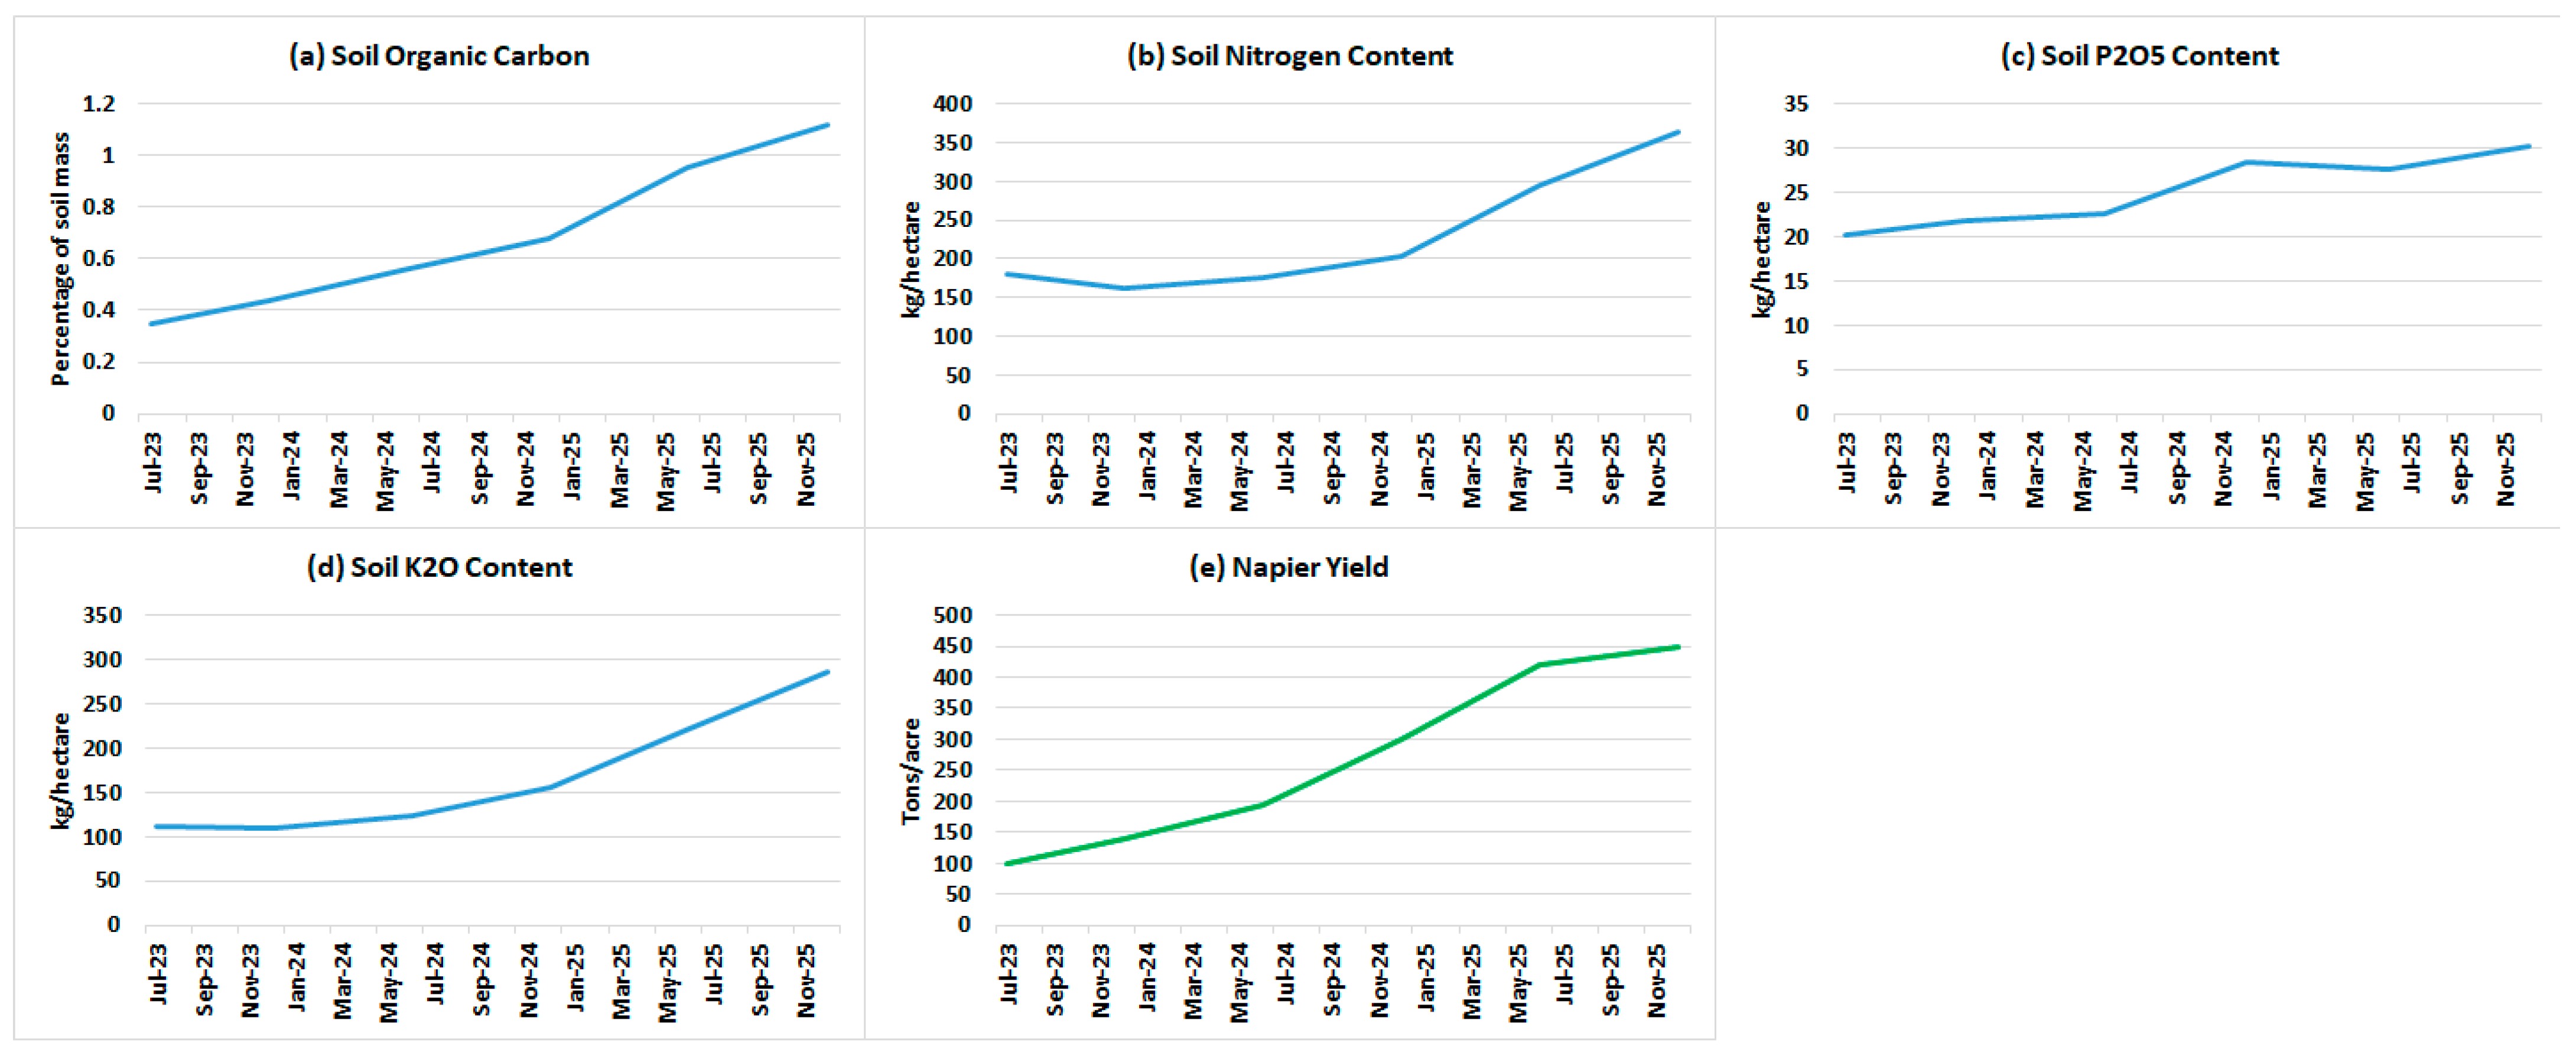
The fertilization schedule, nutrients extracted from the Napier-fed cattle, complete anerobic digestion, and the composition of the water-to-fertilizer ratio enabled soil rejuvenation at the experiment site in Bishnupur, Bankura, West Bengal. Figure 3 documents the evolution of the characteristics of the red soil at the test site and the Napier yields achieved from the start of the treatment to present.
The tests are performed every six months (Supplementary Materials S1 and S4 show the tests performed on July 2023 and April 2025 (it has to be noted that the soil tests are outsourced to two independent testing centers.)), with the SOC increasing almost linearly with the application of the biofertilizer. SOC increase directly results from introducing organic matter derived from the Napier-fed cattle [56]. However, nitrogen content actually decreases initially, before increasing in the soil. This is because the initial nitrogen content was severely low in the soil, and upon increasing the presence of microbes and organic matter, the microbes multiply fast. The higher number of microbes consume more nitrogen at the beginning. Thereafter, the action of the nitrogen-fixing bacteria in the biofertilizer continues to increase the soil nitrogen content, ultimately achieving a standard 350 kg/ha [57]. This is a significant increase of SOC and nitrogen from our last reported value in the publication [11]. Soil phosphorous was almost at the optimal level when the treatment started in 2023 [58], which is why the P2O5 content did not increase significantly with fertilizer application, although it remained at the optimum level. Soil K2O content increased very slowly at first, due to the action of microbes and the growing Napier plants. Thereafter, the potassium content increased significantly to an optimum level of >280 kg/ha [58], within 2 years of application of the biofertilizer. Potassium increased quicker due to faster microbial action in the Napier-derived excreta, than nitrogen-fixing bacteria.
The Napier yield increases from 100 tons/acre in the first cutting cycle to about 200 tons/acre within one year. This results from optimal cutting and biomass growth due to the cutting schedule rather than improvement in soil characteristics. Compared to the academic literature [26,27,39], this is a significant finding, as previous studies do not report the effect of biomass management of Napier as fodder to increase the yield. Thereafter, the yield increases to 450 tons/acre by December 2025, which is a direct result of SOC increase, along with higher nitrogen activity in the soil. This proves that sustainable measures to treat soil with a package of practices in the Napier–agro–dairy nexus (Figure 1) can give higher yields than even chemical fertilizer treatment [25]. Moreover, this result was achieved on fallow land in a drought-prone red soil, which an even more significant outcome for solving fodder availability in fallow land areas.

3.1.3. Economics of the Napier-Agro-Dairy Nexus

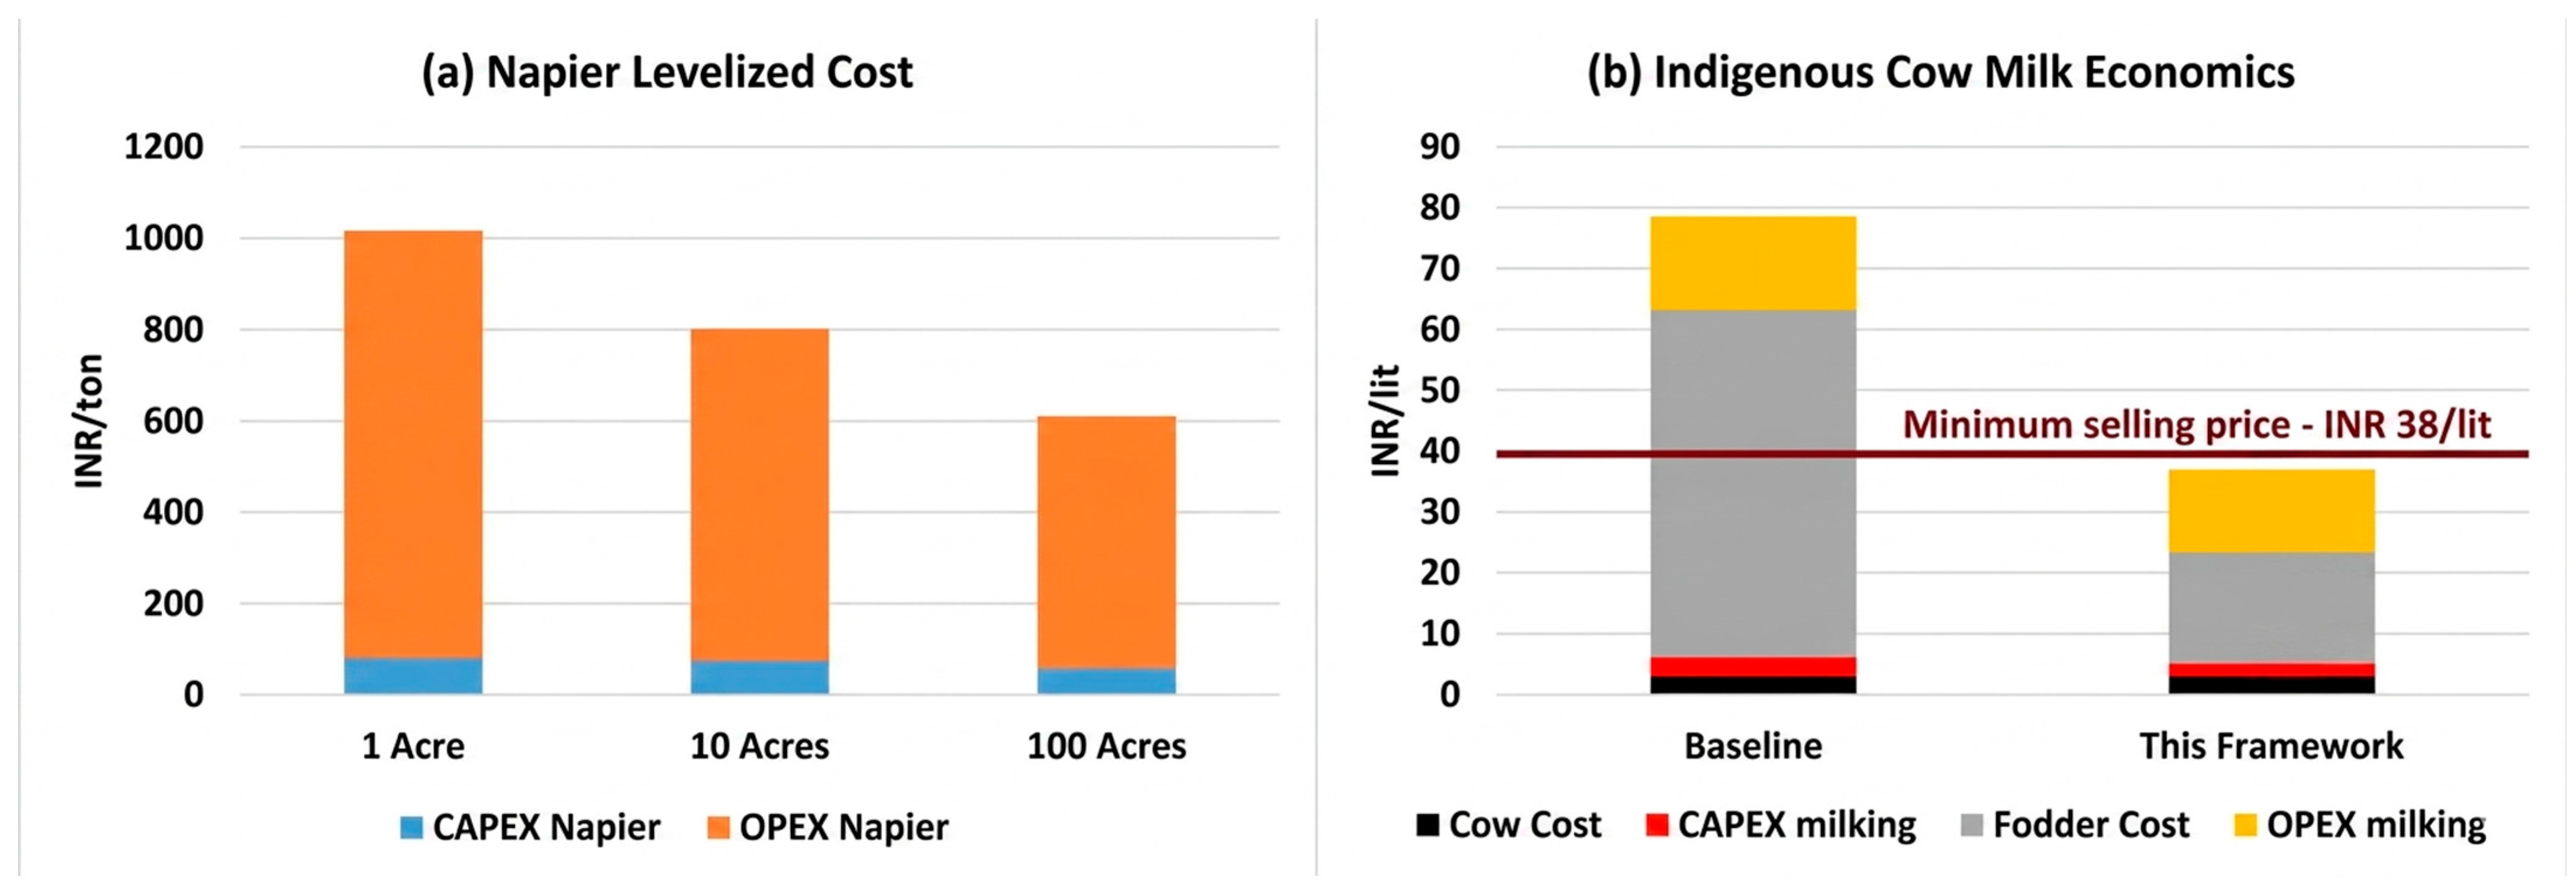
Figure 4 shows the results of the technoeconomic analysis of Napier cultivation under the framework presented in this study and the economics of dairy from indigenous cows by smallholder farmers in Bishnupur, Bankura, West Bengal. The economies-of-scale are clearly evident in the Napier cultivation system. As of March 2026, 10 acres of land have been cultivated for Napier at the project site, while 100 acres is a future scenario that has been modeled. As the scale increases, the per ton cost of harvesting labor and fuel and land lease tends to reduce sharply. This shows competitiveness even at small scales of 1 acre, which is where smallholder farmers can have a significant benefit, even if fodder is sold at INR 2000/ton. At the same rate, large-scale farmers (owning more than 50 acres land) can make significantly more profit per ton than the expenditure. It can be inferred that soil rejuvenation and biofertilizer action can bring about profitable and sustainable Napier fodder cultivation on fallow lands.
The cost of milk production is where the key improvement is seen. In the baseline scenario, fodder cost is the key driver for poverty among smallholder dairy farmers in India. Indigenous cows have lower milk output that other breeds [32], yet the amount of fodder consumed is almost the same. Smallholder farmers do not have access to breeds like jersey cows or Holter–Friesian, and introducing such breeds across-the-board may lead to a loss of genetic diversity. In fodder, concentrates and cow-feed are priced exorbitantly (Table 3), often driving the cost of milking production to twice the minimum selling price for smallholder farmers. Napier grown under this nexus has much higher protein and fiber, obtained along with moringa, which enables expensive fodder supplements to be not required, and still meet the nutritional requirement of cows. Moreover, smallholder farmers are often unable to afford expensive fodder, which leads to poor cattle health and sub-par milk yields [9]. Our findings show that controlling the nutritional content in the fodder and optimized feeding, actually improves the milk-output per cow. This brings the cost of fodder down from INR 58/L to INR 18/L, bringing the expenditure of milk below the minimum mandated selling price. Considering that higher SNF milk obtained from the Napier-fed cattle can be sold at a premium price of INR 50–55/L, our results demonstrate that this nexus can be a model for poverty alleviation in marginalized dairy farmers in West Bengal.

3.2. Statewide Potential Implications

The field-scale experimental results were integrated into a statewide projection framework to estimate the potential socioeconomic and environmental impacts of large-scale adoption. The experimental system boundaries included Napier yield, soil organic carbon enhancement, biofertilizer-mediated nutrient availability, irrigation requirements, and dairy fodder substitution. These experimentally derived parameters were subsequently used as inputs for a scenario-based simulation model representing statewide adoption dynamics.
Regional impacts were not inferred directly from field observations; instead, they were estimated using the technoeconomic scaling framework constrained by fallow land availability, adoption-rate scenarios, livestock demand, and stochastic variability in climatic and market conditions. Adoption scenarios of 10% (2040) and 20% (2050) of statewide fallow land were used to evaluate potential long-term impacts.
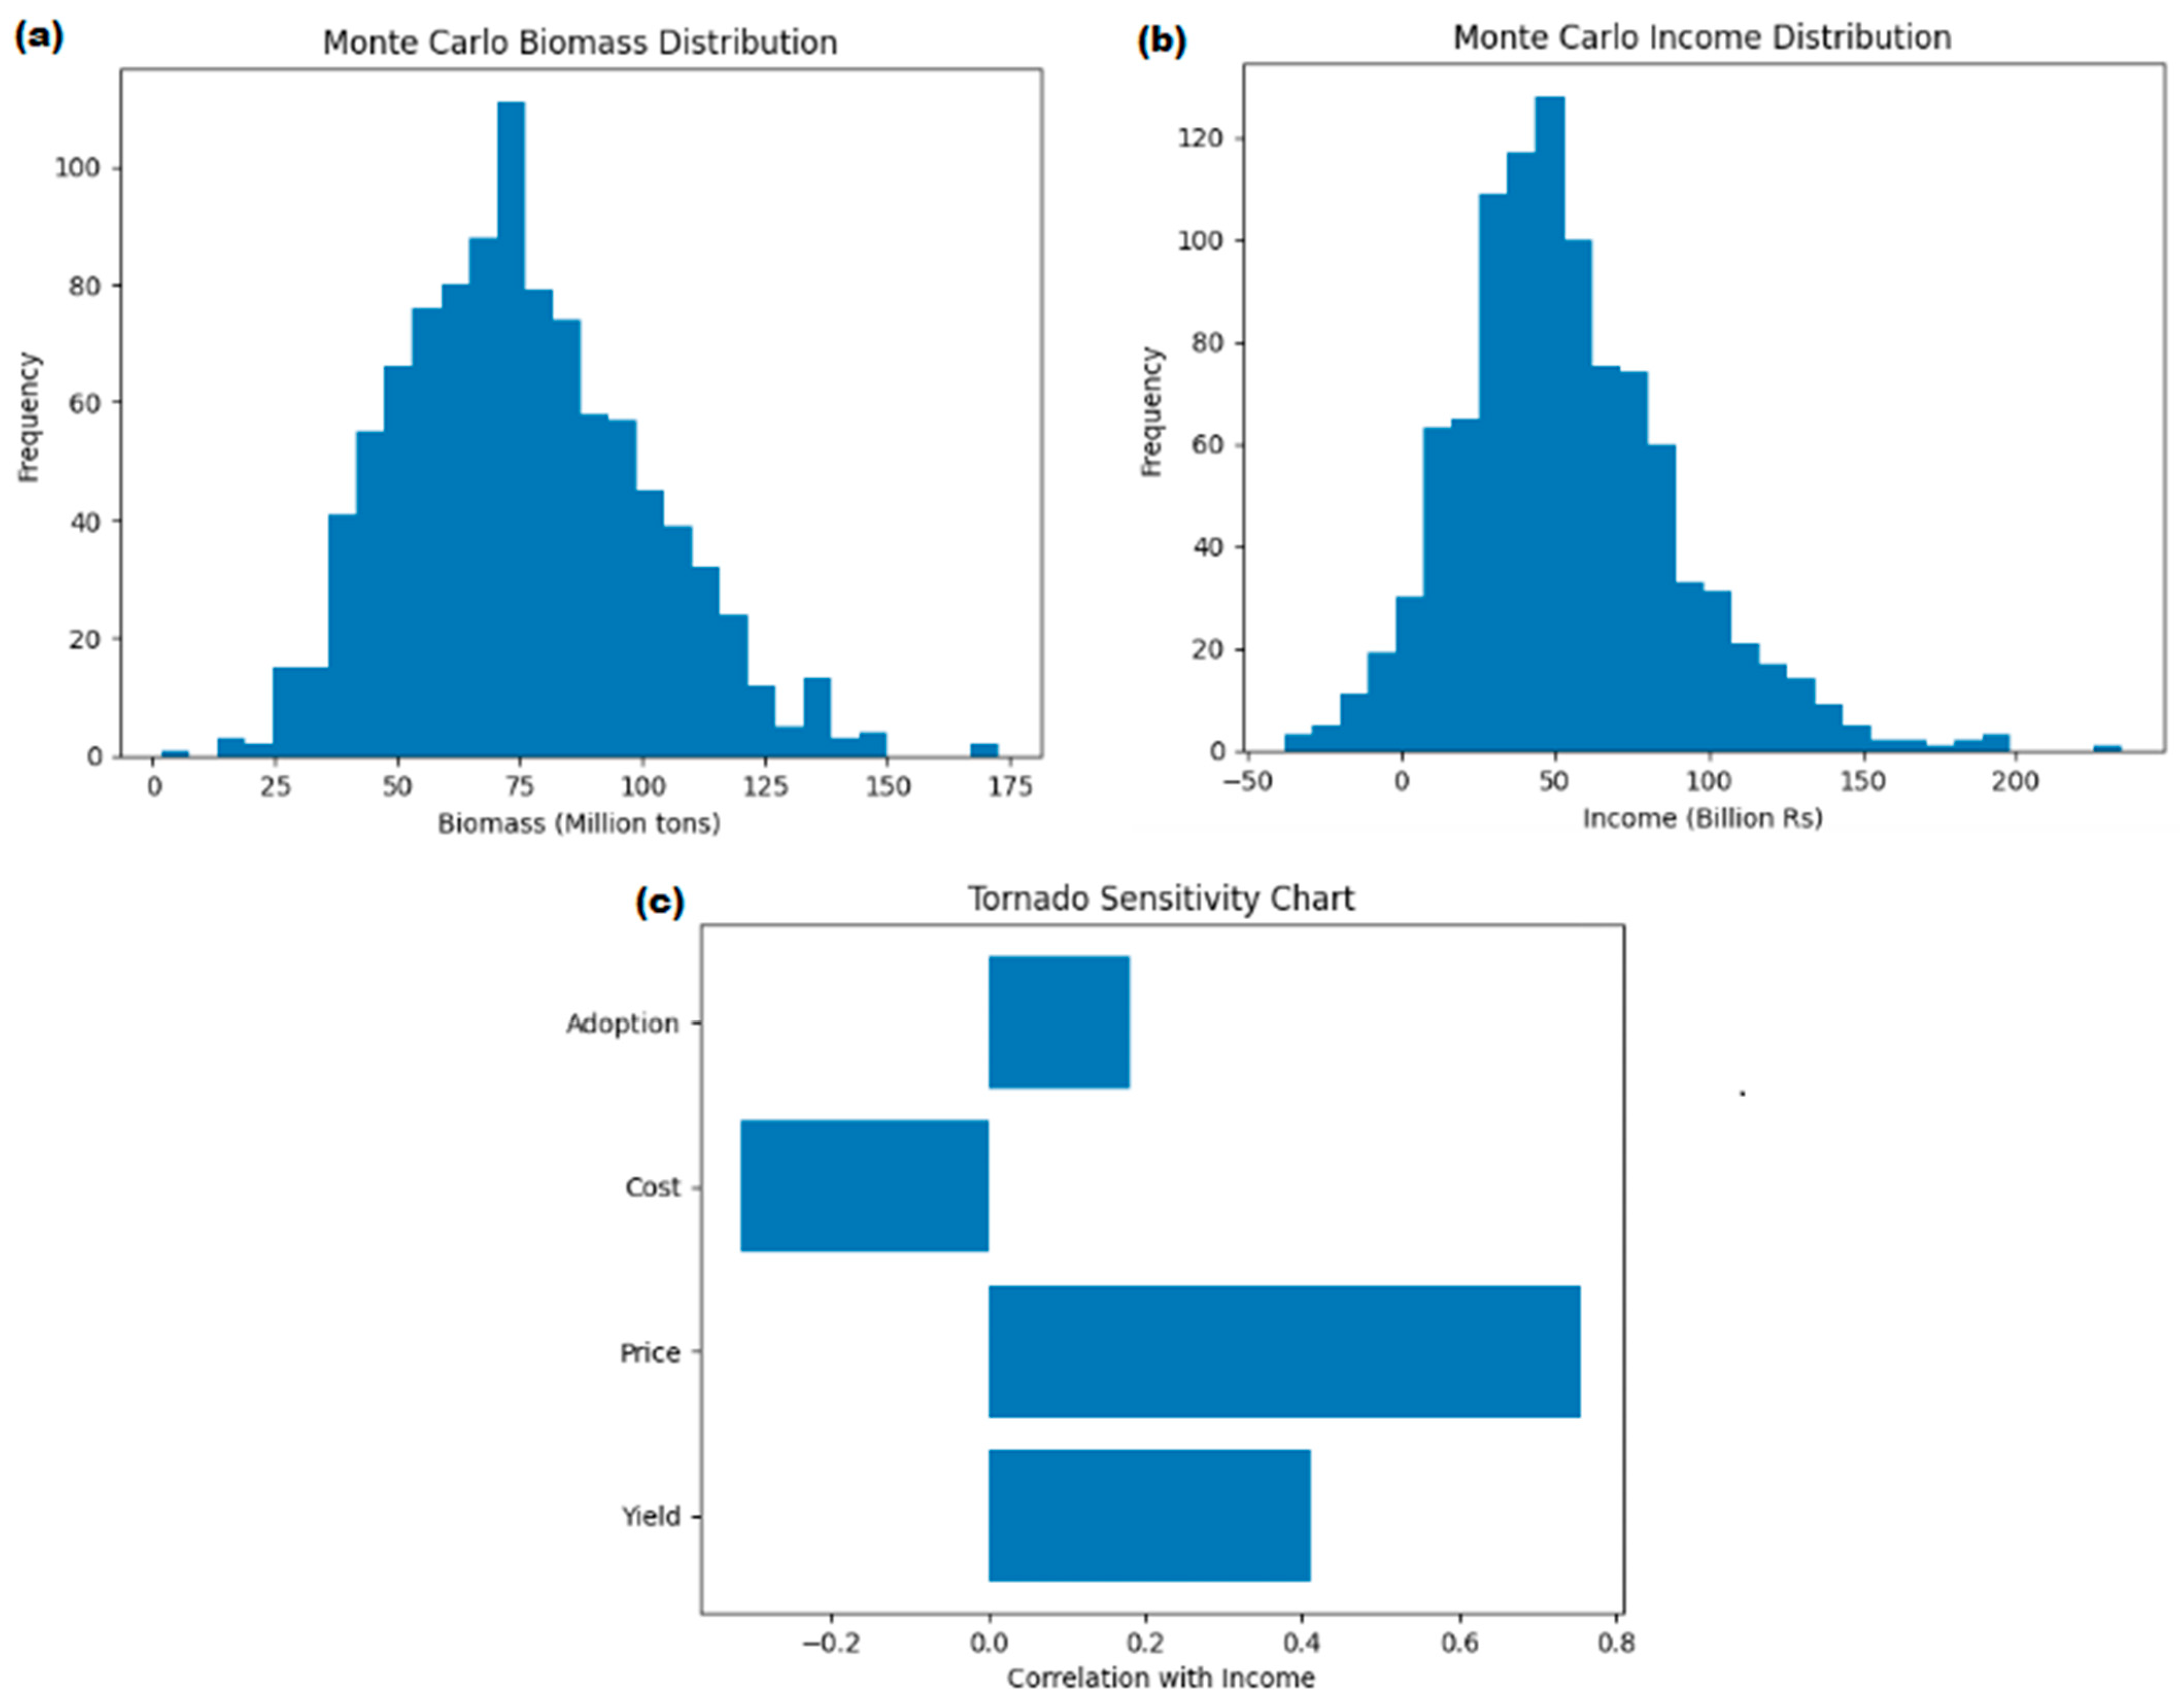
Monte Carlo simulations (n = 1000) were employed to account for uncertainty in biomass yield, rainfall variability, fodder prices, production costs, and adoption rates (Table A2 in Appendix gives the details of the Monte Carlo parameters). Therefore, the statewide socioeconomic outcomes presented in this study should be interpreted as scenario-based projections rather than deterministic forecasts.

3.2.1. SDG Achievement Potentials in 2040 and 2050

The efficacy of the Napier–agro–dairy nexus can be transformative for poverty alleviation, economic development and environmental conservation in the agricultural sector. In this section, the potential for these achievements is estimated for West Bengal, through to the years of 2040 and 2050, as adoption of this circular package of practices will take sufficient time. Table 5 shows the potential of SDG achievements in the years 2040 and 2050, following adoption rates of 10% and 20% of fallow lands in West Bengal, respectively.
  • Biomass scaling (SDG 15): The statewide scaling of the Napier–agro–dairy nexus demonstrates substantial potential across economic, environmental, and social dimensions. Under the 10% adoption scenario (2040), approximately 0.25 million acres of fallow land are converted into productive biomass systems, generating an estimated 110–120 million tons of Napier biomass annually. This increases to above 220 million tons under the 20% adoption scenario (2050).
  • Poverty Alleviation Potential (SDG 1): The model indicates that the proposed system can benefit approximately 3.75 million households by 2040 and 7.5 million households by 2050, depending on adoption rates and yield conditions. Income per household increases by a factor of 2.5–4×, effectively lifting marginal farmers above the baseline income threshold. The dual-benefit structure—income generation for Napier growers and cost reduction for dairy farmers—creates a distributed economic impact, improving resilience across the rural economy. This aligns strongly with SDG 1 targets related to income security and livelihood diversification.
  • Economic growth (SDG 8): The total income generated under these scenarios is estimated at INR 60–70 billion/year by 2040 and INR 120–150 billion/year by 2050, indicating a significant transformation of currently underutilized land into productive economic assets. These results highlight the scalability of perennial fodder systems in resource-constrained agricultural landscapes.
  • Land value creation (SDGs 8 and 15): Fallow land, which currently contributes minimal economic value (~INR 0–10,000/acre/year), is transformed into a high-value asset generating up to INR 160,000–INR 200,000/acre/year. At scale, this corresponds to a multi-billion-rupee rural bio-economy, driven by biomass production and dairy integration. This transformation not only enhances economic productivity but also contributes to land restoration and sustainable land management, directly supporting SDG 8 (economic growth) and SDG 15 (land restoration).
  • Environmental Effects (SDG 13): The substitution of synthetic fertilizers with biofertilizers results in measurable reductions in greenhouse gas emissions. Avoided emissions from fertilizer use are estimated at 0.1–0.3 Mt CO2 annually, while soil carbon sequestration contributes significantly larger mitigation potential, estimated at 25–70 Mt CO2 over the study horizon. Additionally, the emissions avoided from dairy farming by repurposing methane-containing excreta for biofertilizer amounts to 2–3 Mt CO2 annually by 2040 and 4–6 Mt CO2 annually by 2050. With CO2 emissions from fertilizers’ production being 7–8 Mt annually by 2040 and 14–16 Mt by 2050, the residual emissions from the circular model represent 10–15% of emissions avoided. These results indicate that soil carbon enhancement is the dominant climate mitigation pathway, reinforcing the importance of regenerative agricultural practices.
  • Soil health and resource efficiency (SDG 12): Soil organic carbon increases from baseline levels of 0.2–0.5% to up to 2%, representing a 3–6-fold improvement. This leads to enhanced water retention, nutrient availability, and long-term productivity. The Soil Regeneration Index confirms substantial improvements in resource efficiency, indicating that the system contributes to sustainable intensification without increasing external inputs.

3.2.2. Uncertainty and Sensitivity Analysis

To account for variability in agronomic, economic, and climatic parameters, a Monte Carlo simulation (n = 1000) was performed for biomass production and income generated, shown in Figure 5a,b. Yield, fodder price, adoption rate, and production costs were varied within ±20–30% ranges based on the literature [11,26,39], and field variability shows the income sensitivity in Figure 5c. All the calculations are shown for the 10% adoption rate by 2040.
The results indicate that biomass production and income generation exhibit significant uncertainty, with coefficients of variation exceeding 30%. Biomass production ranged between 40 and 130 million tons for the 10% adoption scenario, with a mean value of ~80 million tons. The distribution is moderately right-skewed, reflecting sensitivity to yield variability and rainfall stochasticity. Total income generation exhibits substantial variability, ranging from near-zero to INR 150 billion under adverse and favorable conditions, respectively. The mean estimated income (~INR 60 billion) suggests significant poverty alleviation potential, although outcomes are highly sensitive to yield and market price fluctuations.
With regards to the sensitivity analysis, this study generates significant findings for implementing this framework for circularity in agriculture and market policy implications. The following findings can be concluded:
  • Market price is the most influential variable, showing that agricultural coops and the local governments need to ensure strict control for Napier pricing, as supply increase can lead to almost negligible income for smallholder farmers.
  • Yield is the second most critical factor. A strong positive correlation between yield and total income was observed, indicating that agronomic improvements and soil health management are critical determinants of economic success.
  • Cost is intuitively negatively correlated to income. From the implementation side, local bodies and agricultural coops should guide farmers to appropriate irrigation and fertilization intensity to optimize the input costs.
  • Adoption rate has negligible impact on ultimate outcome, primarily because most households in marginalized communities own very small patches of land, and reclamation of fallow land will likely increase the coverage of impoverished households.

3.3. Limitations

The limitations to the scalability have to be acknowledged. Firstly, the results are based on a single-site experiment in Bankura, West Bengal, which does not represent the entirety of the fallow land soils in the Fe-oxide dominant red soil belt. While the findings are optimistic, future results will shed more clarity on the ability of the biofertilizer treatment to improve SOC and thereby, Napier yields. Secondly, the scalability model assumes homogenous agro-ecological and socio-economic conditions, which may be quite different among distinct regions of West Bengal. Thirdly, there may be several political and market barriers, which may delay or even prevent the adoption of this system at a state-wide scale. Specifically, on the third issue, future research should go in the direction of the political economy of agricultural innovation and energy transition, and highlight specific issues persisting in this region of India.

4. Policy Implications

The findings of this study provide strong evidence for the inclusion of circular fodder-based systems within regional and national agricultural policy frameworks. To enable large-scale adoption and maximize SDG outcomes, the following policy interventions are recommended:
  • Promotion of Fallow Land Utilization Programs: State-level agricultural policies should prioritize the productive use of fallow lands through targeted incentives, including land leasing support, input subsidies, and integration with rural employment schemes such as MGNREGA [13]. Mapping and classification of fallow land suitability for perennial fodder crops can further enhance implementation efficiency.
  • Strengthening Dairy–Fodder Value Chains: Given that fodder costs constitute a major component of dairy production, integrating Napier cultivation into dairy development programs can enhance sectoral efficiency. Policy support should include: (a) establishment of fodder cooperatives at village-levels, (b) guaranteed procurement mechanisms, along with minimum support price (MSP)-like frameworks for fodder, and (c) linkages with dairy federations and milk unions. This will ensure price stability, which has been identified as the most critical determinant of economic outcomes.
  • Climate Finance and Carbon Incentives: The significant CO2 emission mitigation potential of the system—particularly from soil carbon sequestration and avoided methane emissions—positions it well for inclusion in climate finance mechanisms. Policymakers should: (a) develop carbon credit frameworks for smallholder agriculture, (b) integrate such systems into state climate action plans, and (c) facilitate access to voluntary carbon markets. This can provide additional revenue streams for farmers while contributing to national climate commitments.
  • Extension Services and Capacity Building: the sensitivity of outcomes to yield variability highlights the need for robust agricultural extension systems. Investments should be made in: (a) farmer training programs on Napier cultivation and soil health, (b) dissemination of best practices for irrigation and harvesting, and (c) digital advisory platforms for real-time decision support.

5. Conclusions

This study demonstrates that the integration of Napier cultivation with biofertilizer production and dairy systems represents a scalable circular agricultural model with significant socioeconomic and environmental benefits for rural West Bengal. By converting fallow land into productive biomass systems, the proposed framework generates substantial value across multiple Sustainable Development Goals (SDGs), particularly SDG 1 (No Poverty), SDG 8 (Decent Work and Economic Growth), SDG 12 (Responsible Consumption and Production), SDG 13 (Climate Action), and SDG 15 (Life on Land).
From the field experiments, it was observed that biofertilizer and irrigation optimization can unlock higher yields of Napier, reaching 500 tons/acre on fallow land. This mainly results from increasing SOC, which also enables increments of soil nitrogen, phosphorous, and potassium contents. The circular model is extremely scalable where the cost of Napier cultivation at the 1-acre scale is INR 1000/ton and comes down to INR 600/ton, when increased to 100 acres. This enables fodder to be cheaper and readily available for dairy farmers, bringing the cost of milk production of indigenous cows down from INR 78/L to INR 35/L.
Under a 10% adoption scenario by 2040, approximately 0.25 million acres of fallow land can be utilized to produce ~75 million tons of biomass annually, benefiting an estimated 3.75 million households. This impact doubles under a 20% adoption scenario by 2050. The system enables a 2.5–4× increase in household income while simultaneously reducing fodder costs for dairy farmers. In addition, large-scale substitution of synthetic fertilizers with biofertilizers and the productive use of livestock excreta result in substantial greenhouse gas emission reductions, particularly through avoided methane emissions and enhanced soil carbon sequestration.
Beyond economic gains, the framework delivers strong environmental co-benefits. The replacement of synthetic fertilizers with biofertilizers and the productive utilization of livestock excreta contribute to significant greenhouse gas mitigation. Avoided emissions from manure management alone are estimated at ~40 Mt CO2 annually by 2040, increasing to ~80 Mt CO2 by 2050, while additional gains arise from reduced fertilizer use and enhanced soil carbon sequestration. Soil organic carbon improvements—from baseline levels of ~0.3% to up to 2%—correspond to a Soil Regeneration Index of ~5.7, indicating substantial restoration of degraded soils and long-term productivity enhancement.
The proposed Napier–biofertilizer–dairy nexus provides a replicable model for other regions with similar agroecological and socioeconomic conditions. By simultaneously addressing land degradation, rural poverty, and climate change, the system aligns with integrated sustainability pathways and demonstrates the potential of circular agriculture in smallholder contexts.


Supplementary Materials

The following supporting information can be downloaded at: https://www.mdpi.com/article/10.3390/su18115387/s1.

Author Contributions

Conceptualization, S.B.; methodology, S.B.; software, S.B.; validation, S.B. and T.O.; formal analysis, S.B.; investigation, S.B.; resources, S.B.; data curation, S.B.; writing—original draft preparation, S.B.; writing—review and editing, S.B. and T.O.; visualization, S.B.; supervision, T.O.; project administration, S.B.; funding acquisition, S.B. All authors have read and agreed to the published version of the manuscript.

Funding

This research was funded by K. Matsushita Foundation, grant number 24-G34, given to Soumya Basu.

Institutional Review Board Statement

The study was conducted in accordance with the Declaration of Helsinki, and approved by the Ethics committee of the Legislative Assembly of West Bengal, Bankura Assembly constituency (28 November 2025). There is no protocol number assigned by Kyoto University, as the Ethics committee decided that the data was baseline and non-interventional in nature.

Informed Consent Statement

Informed consent was obtained from all subjects involved in the study.

Data Availability Statement

Data will be made available upon request to the corresponding author.

Acknowledgments

The authors are grateful for the collaboration with Bithi Farm (https://www.bithifarm.com/, accessed on 5 April 2026), led by Sudipta Guchhait, for implementing this sustainable circular system, and enabling us to disseminate the knowledge on a scientific platform. GenAI of Google was used to refine minor language issues and generate graphics for Figure 1.

Conflicts of Interest

The authors declare no conflicts of interest. The funders had no role in the design of the study; in the collection, analyses, or interpretation of data; in the writing of the manuscript; or in the decision to publish the results.

Abbreviations

The following abbreviations are used in this manuscript:
SOCSoil Organic Carbon
GDPGross Domestic Product
BPLBelow Poverty Line
SDGSustainable Development Goals
DAPDi-Ammonium Phosphate
SNFSolids-Not-Fat
NIRNear-Infra-Red
WHCWater holding Capacity
FIFOFirst-In-First-Out
CAPEXCapital Expenditure
OPEXOperational Expenditure
SRISoil Regeneration Index
MSPMinimum Support Price

Appendix A

The key assumptions for the scalability assessment and SDG achievement potential are given in the following Table A1, and the uncertainty analysis description is given in Table A2.
Table A1. Key assumptions scalability model and uncertainty analysis.
ParameterAssumed DataJustification
Fallow   land   ( A f a l l o w ) 2.2–2.7 million acresEstimate of West Bengal, India
Adoption   rate   ( α t ) 10%/20%Scenarios for 2040 and 2050
Yield   ( Y t ) 300 tons/acre/year (mean)Comes from the steady state of the technoeconomic model
Fodder   requirement   ( F r e q ) 20 tons/HH/yearSmallholder dairy farmers’ mean
Cattle   per   household   ( N c a t t l e ) 2Typical for smallholder dairy farmers in West Bengal
Dairy household no.Derived valueComes from the model analysis
Napier   cos t   ( P f o d d e r ) INR 1.5–2/kgAssumed for keeping margin
Baseline fodder costINR 3–5/kgMarket situation and current practice
Manure per cattle (exc)10 kg/dayData is derived from NDDB estimate
CH 4   from   manure   ( B F e m s ) 1.5 kg CO2-eq/kg manureEstimated from IPCC
SOC initial0.3%Measured value
SOC final2%From the technoeconomic model
Table A2. Monte Carlo simulation description.
ParameterDistributionMeanVariation
Napier yieldNormal300 tons/acre±30%
RainfallNormalHistorical mean±20%
Fodder priceTriangularINR 1500/ton₹1000–2000
Production costNormalINR 800/ton±20%
Microbial activity factorNormal1.0±10%
SOC growthLognormalDerived from model±25%

References

  1. World Bank. GDP (Current US$), India. World Development Indicators. Available online: https://data.worldbank.org/indicator/NY.GDP.MKTP.CD?locations=IN (accessed on 20 January 2024).
  2. The World Bank. 4.2 World Development Indicators: Structure of Value Added. World Development Indicators. 2025. Available online: https://wdi.worldbank.org/table/4.2 (accessed on 24 October 2025).
  3. Ministry of Finance- India. Agriculture Will Be Central to Achieving Viksit Bharat, Driving Inclusive Growth and Improving the Livelihoods of Millions: Economic Survey. New Delhi, India. 2026. Available online: https://www.pib.gov.in/PressReleasePage.aspx?PRID=2219960&reg=3&lang=2 (accessed on 24 November 2025).
  4. Sanyal, S.; Arora, A. Relative Economic Performance of Indian States: 1960–61 to 2023–24. New Delhi, India. 2024. Available online: https://eacpm.gov.in/wp-content/uploads/2024/09/State-GDP-Working-Paper_Final_240916_190207.pdf (accessed on 24 November 2025).
  5. Dutta, T.; Dey, D. An exploratory study to identifythe possible reasons for the decline of economic status of West Bengal since the early 1950s. SSRN Electron. J. 2025. [Google Scholar] [CrossRef]
  6. Khan, M.R.; Haque, M.I.; Zeeshan; Khatoon, N.; Kaushik, I.; Shree, K. Caste, land ownership and agricultural productivity in India: Evidence from a large-scale survey of farm households. Dev. Pract. 2021, 31, 421–431. [Google Scholar] [CrossRef]
  7. Urfels, A.; Mausch, K.; Harris, D.; McDonald, A.J.; Kishore, A.; van Halsema, G.; Struik, P.C.; Craufurd, P.; Craufurd, T.; Singh, V.; et al. Farm size limits agriculture’s poverty reduction potential in Eastern India even with irrigation-led intensification. Agric. Syst. 2023, 207, 103618. [Google Scholar] [CrossRef] [PubMed]
  8. Kannuri, N.K.; Jadhav, S. Cultivating distress: Cotton, caste and farmer suicides in India. Anthropol. Med. 2021, 28, 558–575. [Google Scholar] [CrossRef]
  9. Mondal, B. Assessment of the Status of Dairying and Potential to Improve Socio- Economic Status of the Milk Producers in West Bengal; Technical Report 187; Visva Bharati University: Kolkata, India, 2017. [Google Scholar] [CrossRef]
  10. Feeney, C.J.; Bentley, L.; De Rosa, D.; Panagos, P.; Emmett, B.A.; Thomas, A.; Robinson, D.A. Benchmarking soil organic carbon (SOC) concentration provides more robust soil health assessment than the SOC/clay ratio at European scale. Sci. Total Environ. 2024, 951, 175642. [Google Scholar] [CrossRef]
  11. Basu, S.; Guchhait, S. Disrupting poverty and ensuring soil rejuvenation through a circular Napier-Biofertilizer-Dairy nexus in rural India. Soc. Impacts 2026, 7, 100179. [Google Scholar] [CrossRef]
  12. Sapkota, T.B.; Bijay-Singh. India’s fertilizer policies: Implications for food security, environmental sustainability, and climate change. Reg. Environ. Change 2025, 25, 63. [Google Scholar] [CrossRef]
  13. Kumar, V.; Kutumbale, V. Perspectives of Farm Mechanization in India—A Review Paper. J. Gujarat Res. Soc. 2019, 21, 0374–8588. [Google Scholar]
  14. Yoshida, M.; Ogawa, T.; Imamura, Y.; Ishihara, K.N. Economies of scale in ammonia synthesis loops embedded with iron- and ruthenium-based catalysts. Int. J. Hydrogen Energy 2021, 46, 28840–28854. [Google Scholar] [CrossRef]
  15. Yadav, A.K.; Gattupalli, M.; Dashora, K.; Kumar, V. Key Milk Adulterants in India and their Detection Techniques: A Review. Food Anal. Methods 2023, 16, 499–514. [Google Scholar] [CrossRef]
  16. Mutegi, J.K.; Mugendi, D.N.; Verchot, L.V.; Kung’u, J.B. Combining napier grass with leguminous shrubs in contour hedgerows controls soil erosion without competing with crops. Agrofor. Syst. 2008, 74, 37–49. [Google Scholar] [CrossRef]
  17. Ko, S.-S.; Li, T.R.; Hung, J.C.; Kuo, H.C.; Li, M.J.; Lin, J.B.; Chung, P.H.; Lee, L.H.; Lin, Y.H.; Lin, H.P.; et al. Seasonal growth and biomass production of cold-tolerant Napier Grass line L2201. Biomass Bioenergy 2025, 201, 108048. [Google Scholar] [CrossRef]
  18. Manik, D.; Nandi, R.; Das, S.; Bandyopadhyay, P.K. Stability and erodibility of some soils of West Bengal in relation to their aggregating agents. J. Indian Soc. Soil Sci. 2020, 68, 138–148. [Google Scholar] [CrossRef]
  19. Krishna, V.V.; Aravalath, L.M.; Vikraman, S. Does caste determine farmer access to quality information? PLoS ONE 2019, 14, e0210721. [Google Scholar] [CrossRef] [PubMed]
  20. Irfan, M.; Yadav, S.; Shaw, K. The adoption of solar photovoltaic technology among Indian households: Examining the influence of entrepreneurship. Technol. Forecast. Soc. Change 2021, 169, 120815. [Google Scholar] [CrossRef]
  21. Khan, M.T.; Aleinikovienė, J.; Butkevičienė, L.-M. Innovative Organic Fertilizers and Cover Crops: Perspectives for Sustainable Agriculture in the Era of Climate Change and Organic Agriculture. Agronomy 2024, 14, 2871. [Google Scholar] [CrossRef]
  22. Djanibekov, U.; Gaur, V. Nexus of energy use, agricultural production, employment and incomes among rural households in Uttar Pradesh, India. Energy Policy 2018, 113, 439–453. [Google Scholar] [CrossRef]
  23. Khurana, T.; Sangita, S. Household access to electricity and non-farm business in rural India: A panel data analysis. Energy Sustain. Dev. 2022, 67, 125–134. [Google Scholar] [CrossRef]
  24. Basu, S.; Ishihara, K. On the resiliency of post-crisis decoupling in higher-order economy-energy-environment nexus in high-inflation developing economies. Qual. Quant. 2025, 59, 657–719. [Google Scholar] [CrossRef]
  25. Ndwiga, B.W.; Arunga, E.E.; Ngetich, F.K. Economic Assessment of Napier Grass Production Using Different Fertilizer Combinations under Smallholder Farming Conditions in the Central Highlands of Kenya. Int. J. Plant Soil Sci. 2019, 29, 1–6. [Google Scholar] [CrossRef]
  26. Ntege, I.; Kiggundu, N.; Wanyama, J.; Nakawuka, P. Napier yield response under different irrigation strategies in a tropical setting. Agric. Water Manag. 2023, 287, 108403. [Google Scholar] [CrossRef]
  27. Ntege, I.; Kiggundu, N.; Wanyama, J.; Nakawuka, P. Assessing the Effect of Irrigation Water Management Strategies on Napier Productivity—A Review. Agric. Sci. 2021, 12, 1447–1461. [Google Scholar] [CrossRef]
  28. FAO. The State of Food and Agriculture 2020; FAO: Roma, Italy, 2020. [Google Scholar]
  29. Kabirizi, J.; Ziiwa, E.; Mugerwa, S.; Ndikumana, J.; Nanyennya, W. Dry season forages for improving dairy production in smallholder systems in Uganda. Trop. Grassl.-Forrajes Trop. 2013, 1, 212. [Google Scholar] [CrossRef][Green Version]
  30. Hidosa, D.; Kibiret, S. Evaluation of Pennisetum perpureum Grass Variety to Improve Feed Availability in South Omo. Trends Appl. Sci. Res. 2020, 15, 193–200. [Google Scholar] [CrossRef]
  31. Soder, K.J.; Heins, B.J.; Chester-Jones, H.; Hafla, A.N.; Rubano, M.D. Evaluation of fodder production systems for organic dairy farms. Prof. Anim. Sci. 2018, 34, 75–83. [Google Scholar] [CrossRef]
  32. Vinothraj, S.; Alagesan, P.; Saravanakumar, S.; Srinivasan, R.D. Impact of Mixed Fodder Cultivation in Dairy Cattle Milk Yield. Int. J. Curr. Microbiol. Appl. Sci. 2019, 8, 1000–1003. [Google Scholar] [CrossRef]
  33. Kongsager, R.; Napier, J.; Mertz, O. The carbon sequestration potential of tree crop plantations. Mitig. Adapt. Strateg. Glob. Change 2013, 18, 1197–1213. [Google Scholar] [CrossRef]
  34. Muttappanavar, R.K.; Shekara, B.G.; Agrawal, R.K.; Chikkarugi, N.M. Carbon stock dynamics in soil as influenced by perennial grass-legume mixtures in southern dry zone of Karnataka. Range Manag. Agrofor. 2024, 45, 314–320. [Google Scholar] [CrossRef]
  35. Borisoot, K.; Suriharn, K.; Maneewan, S.; Punlek, C.; Suksri, A.; Wongwuttanasatian, T. Maximizing yield with novel Napier grass breed for tropical region: A case study of Thailand. Environ. Technol. Innov. 2025, 40, 104551. [Google Scholar] [CrossRef]
  36. Mohai Ud Din, R.; Eman, S.; Zafar, M.H.; Chong, Z.; Saleh, A.A.; Husien, H.M.; Wang, M. Moringa oleifera as a multifunctional feed additive: Synergistic nutritional and immunomodulatory mechanisms in livestock production. Front. Nutr. 2025, 12, 1615349. [Google Scholar] [CrossRef]
  37. Díaz-Pérez, J.C.; Germishuizen, P.; Da Silva, A.L.B.R. Effect of Compost Application at Transplant Stage and before Planting to the Field on Plant Growth and Fruit Yield in Bell Pepper (Capsicum annum L.). Commun. Soil Sci. Plant Anal. 2021, 52, 2793–2802. [Google Scholar] [CrossRef]
  38. Kumar, R.M.; Yamanura, M.; Nagangoudar, M.B.; Venkatesh, P.; Karthik, A.N.; Boraiah, B.; Ganiga, J.; Nagesha, N.; Ranganath, G. Evaluating forage land-use systems in semi-arid tropics of India: A multi-criteria assessment of productivity, profitability, energy, and environmental impact. Environ. Sustain. Indic. 2025, 27, 100790. [Google Scholar] [CrossRef]
  39. Islam, M.R.; Garcia, S.C.; Sarker, N.R.; Islam, M.A.; Clark, C.E.F. Napier grass (Pennisetum purpureum Schum) management strategies for dairy and meat production in the tropics and subtropics: Yield and nutritive value. Front. Plant Sci. 2023, 14, 1269976. [Google Scholar] [CrossRef] [PubMed]
  40. Weatherspark. Climate and Average Weather Year Round in Bishnupur. Available online: https://weatherspark.com/y/111381/Average-Weather-in-Bishnupur-West-Bengal-India-Year-Round (accessed on 25 November 2025).
  41. World Bank. Poverty Headcount Ratio at National Poverty Lines (% of Population), India. World Development Indicators (WDI). 2023. Available online: https://data.worldbank.org/indicator/SI.POV.NAHC?locations=IN (accessed on 24 March 2024).
  42. National Dairy Development Board. Dairying in West Bengal: A Statistical Profile. Anand, Gujarat, India. 2017. Available online: https://www.nddb.coop/sites/default/files/pdfs/NDDB-WB_05-05-17.pdf (accessed on 30 March 2026).
  43. National Bank for Agriculture and Rural Development. All India Rural Financial Inclusion Survey 2021–22. New Delhi, India. 2022. Available online: https://www.nabard.org/auth/writereaddata/tender/pub_0910240156351156.pdf (accessed on 30 March 2026).
  44. National Sample Survey Organization. Situation Assessment Survey of Agricultural Households. New Delhi, India. 2019. Available online: https://mospi.gov.in/sites/default/files/publication_reports/Report_587m_0.pdf (accessed on 30 March 2026).
  45. West Bengal Directorate of Agriculture. Annual Administrative Report. Kolkata, India. 2025. Available online: https://ard.wb.gov.in/upload/annualreports/QW5udWFscmVwb3J0LWVuZy0377824.pdf (accessed on 30 March 2026).
  46. Ramamurthy, V. Y Response of napier bajra hybrids to integrated nitrogen management. Indian J. Agron. 2001, 47, 455–459. [Google Scholar] [CrossRef]
  47. Ministry of Environment Forest and Climate Change. India Fourth biennial Update Report. New Delhi, India. 2024. Available online: https://unfccc.int/sites/default/files/resource/India BUR-4.pdf (accessed on 30 March 2026).
  48. National Dairy Development Board. Evaluating the Impact of Ration Balancing on Methane Emission in Dairy Animals. Gurgaon, India. 2020. Available online: https://www.nddb.coop/sites/default/files/pdfs/baseline/1_Evaluating_the_impact_of_Ration_Balancing_on_Methane_Emission_in_Dairy_Animals_Ludhiana.pdf (accessed on 30 March 2026).
  49. Kim, G.W.; Alam, M.A.; Lee, J.J.; Kim, G.Y.; Kim, P.J.; Khan, M.I. Assessment of direct carbon dioxide emission factor from urea fertilizer in temperate upland soil during warm and cold cropping season. Eur. J. Soil Biol. 2017, 83, 76–83. [Google Scholar] [CrossRef]
  50. Manzoor, A.; Naveed, M.S.; Ali, R.M.A.; Naseer, M.A.; Ul-Hussan, M.; Saqib, M.; Hussain, S.; Farooq, M. Vermicompost: A potential organic fertilizer for sustainable vegetable cultivation. Sci. Hortic. 2024, 336, 113443. [Google Scholar] [CrossRef]
  51. Kashem, M.A.; Sarker, A.; Hossain, I.; Islam, M.S. Comparison of the Effect of Vermicompost and Inorganic Fertilizers on Vegetative Growth and Fruit Production of Tomato (Solanum lycopersicum L.). Open J. Soil Sci. 2015, 5, 53–58. [Google Scholar] [CrossRef]
  52. Lazcano, C.; Gómez-Brandón, M.; Domínguez, J. Comparison of the effectiveness of composting and vermicomposting for the biological stabilization of cattle manure. Chemosphere 2008, 72, 1013–1019. [Google Scholar] [CrossRef]
  53. Komatsu, T.; Kimura, T.; Kuriyama, Y.; Isshiki, Y.; Kawano, T.; Hirao, T.; Masuda, M.; Yokoyama, K.; Matsumoto, T.; Takeda, M. Anaerobic digestion of organic waste in Japan: The first demonstration plant at Kyoto City. Water Sci. Technol. 2002, 45, 113–118. [Google Scholar] [CrossRef]
  54. Ezemagu, I.G.; Ejimofor, M.I.; Menkiti, M.C.; Diyoke, C. Biofertilizer production via composting of digestate obtained from anaerobic digestion of post biocoagulation sludge blended with saw dust: Physiochemical characterization and kinetic study. Environ. Chall. 2021, 5, 100288. [Google Scholar] [CrossRef]
  55. Owamah, H.I.; Dahunsi, S.O.; Oranusi, U.S.; Alfa, M.I. Fertilizer and sanitary quality of digestate biofertilizer from the co-digestion of food waste and human excreta. Waste Manag. 2014, 34, 747–752. [Google Scholar] [CrossRef] [PubMed]
  56. Yang, Y.-Y.; Goldsmith, A.; Herold, I.; Lecha, S.; Toor, G.S. Assessing Soil Organic Carbon in Soils to Enhance and Track Future Carbon Stocks. Agronomy 2020, 10, 1139. [Google Scholar] [CrossRef]
  57. Gebeyehu, G.; Soromessa, T. Status of soil organic carbon and nitrogen stocks in Koga Watershed Area, Northwest Ethiopia. Agric. Food Secur. 2018, 7, 9. [Google Scholar] [CrossRef]
  58. Tnau, A.P. Rating Chart for Soil Test Data. Available online: https://agritech.tnau.ac.in/agriculture/agri_soil_soilratingchart.html (accessed on 27 August 2025).
Figure 1. Schematic of the Napier–agro–dairy nexus, implemented in Bankura district of West Bengal, India. (Note: Graphics are generated with GenAI of Google).
Sustainability 18 05387 g001
Figure 2. (a) Monthly rainfall of Bishunupur, Bankura, West Bengal, averaged over 5 years and (b) sun factors (derived from solar irradiation). Daylight ranges 10.7–13.5 h, peak solar energy in April (~6.6 kWh/m2/day), reduced June–September due to clouds [40].
Sustainability 18 05387 g002
Figure 3. The results of soil fertility increase from the start of implementing the Napier–agro–dairy nexus (a). SOC, (b). Nitrogen, (c). P2O5, and (d). K2O) and (e). Napier yield on treated soil.
Sustainability 18 05387 g003
Figure 4. (a) Levelized cost of Napier cultivation, including CAPEX and OPEX at different scales in the Napier–agro–dairy nexus, and (b) dairy production cost (unit economics) for indigenous cows under smallholder farmers (2–3 cows owned), when fodder cost is INR 2/kg.
Sustainability 18 05387 g004
Figure 5. Parameterized uncertainty calculations: (a) Monte Carlo distribution of Napier biomass production shows uncertainty in SDGs 8 and 15 outcomes, (b) Monte Carlo distribution of total income generated shows uncertainty in SDG 1 outcome, and (c) sensitivity of income to various factors.
Sustainability 18 05387 g005
Table 1. Technical data on initial soil conditions and the nutrient content of indigenous cattle’s excreta at Bishnupur, Bankura, West Bengal.
ParameterValue
Soil TypeRed (Fe oxides)
Initial Soil pH—July 20235.2 to 5.5 (acidic)
Initial SOC—July 2023 (%)0.35 (average)
Initial N—July 2023 (kg/ha)180.5 (average)
Initial P2O5—July 2023 (kg/ha)20.2 (average)
Initial K2O—July 2023 (kg/ha)110.7 (average)
Number of adult indigenous cows25
Number of calves10
Amount of dung (kg/cow/day)9.5~10
Volume of urine (L/cow/day)6.0~6.3
Dry matter (kg/cow/day)2.15~2.54
Organic matter (kg/cow/day)1.82 (average)
Nitrogen (kg/cow/day)0.0195 (average)
Phosphate (kg/cow/day)0.0164 (average)
Potash (kg/cow/day)0.0190 (average)
Table 2. CAPEX and OPEX inputs for Napier economics at Bishnupur, Bankura, West Bengal.
ParameterValue
Cost of Napier sticksINR 4/stick
Sticks per unit land (optimized [11])11,000 sticks/acre
Lifetime of each stick8 years
Biofertilizer cost *INR 10/L **
Fertilization intensity5000 L/acre
Electricity price ***INR 7/kWh
Irrigation requirement [11,27]2.5 mm/day/acre
Irrigation energy demand [11,27]4 kWh/mm/acre
Land preparation cost (labor)INR 12,000/acre
Annual land maintenance cost (labor)INR 4000/acre
Drainage infrastructure cost #INR 10,000/acre
Annual drainage maintenance costINR 2000/acre
Lime application cost ##INR 6000/acre (every 3 years)
Land acquisition costINR 30,000/acre
Annual lease cost for landINR 25,000/acre
Annual harvesting fuel costINR 30,000/acre
Annual harvesting labor costINR 40,000/acre
Annual de-weeding cost ###INR 6800/acre
Scaling factors (per acre) [11,16,25,39]
  Land-preparation0.8
  Drainage system0.8
  Harvesting0.7
  Labor0.6
  De-weeding0.85
  Land lease cost0.8
  Lime application0.9
* Costs of biofertilizer unit are not detailed in this table. The FIFO digester outputs 1 to 1.2 tons per day, wherein the costs include electricity, CAPEX of the tank, pipes, and man labour. ** $1 = INR91.2 (as of 9 March 2026). *** Price of electricity is averaged for all consumers below 400 kWh/month in Bankura (for March 2026). # Poor natural drainage in fallow lands risk waterlogging during monsoon season. Drainage trenches with rocks and pipes are constructed to maintain soil porosity. ## pH trends may require lime application (~1 ton/acre) every 3 years at INR 6000/ton. ### De-weeding involves six man-days/acre (bi-annually) and INR 2000/acre fuel cost.
Table 3. Baseline data of fodder and dairy economics at Bishnupur, Bankura, West Bengal, and SDG indicators for West Bengal in 2025.
ParameterValue
Indigenous cow economics (from survey)
  Cost of cowINR 45,000–50,000/cow
  Salvage value30% of purchase cost
  Milking days per year310–320 days/year
  Milking life9–10 years
  Volume of milk3.5–4 L/day
  Cattle feed cost [42]INR 18–20/kg
  Green fodder cost [42]INR 1.5–2/kg
  Dry fodder cost [42]INR 4–5/kg
  Mineral mix feed [42]INR 50–60/kg
  Total cost of fodderINR 160–180/day/cow
  Minimum selling price [42]INR 35–38/L milk
  Farmers’ expenditureINR 78–82/L milk
SDG indicators (average for West Bengal)
  Farmer’s income—bottom quartile (SDG 1) a [43]INR 30 k–40 k/year
  Dairy farmer’s income—smallholder (SDG 1) [44]INR 25 k–45 k/year
  Total fallow land (SDG 15) [45]2.2–2.7 million acres
  Fallow land value (SDG 8 and 15) b [45]INR 5 k–10 k/year
  Napier economic intensity (SDG 8) c [46]INR 160 k–240 k/year
  SOC—red soil (SDG 12) [34]0.2–0.4%
  Nitrogenous fertilizer use—Napier d (SDG 12) [46]270 kg N/acre/year
  Agricultural emissions (SDG 13) [47]18–22 Mt CO2-eq/year
  Dairy industry emissions (SDG 13) e [48]10–15 Mt CO2-eq/year
  Urea emission factor (SDG 13) [49]1.6–1.8 kg CO2/kg urea
  DAP emission factor (SDG 13) [49]1.3–1.5 kg CO2/kg DAP
a: Average income for all farmers (2020): INR 6762/month = INR 81,144/year. Bottom quartile estimate (40–50% of average) = INR 30,000–40,000/year. b: Extra value of agricultural land = INR 5000–10,000/acre (assumed to be fallow land value). c: Typical yield in India = 80–120 ton/acre/year. Sold at INR 2/kg = INR 160,000–240,000 acre/year. d: Combination of urea, DAP, and NPK fertilizer inputs. e: Emissions per indigenous cow = 1.0–1.5 t CO2-eq/year. With West Bengal cattle population at 10 million, dairy emissions = 10–15 Mt CO2-eq/year.
Table 4. Composition, range of values, and critical significance of biofertilizer in the Napier–Agro–Dairy nexus.
ParameterValue Range *Scientific Significance
Biofertilizer output1~1.2 tons/dayThis is the amount obtained from twenty-five grown cows, one bull, and ten calves, after a feed rate of 25 kg and 5 kg fodder per day to adult and young cattle, respectively.
Water:Biofertilizer ratio40:1This is the ratio for application with irrigation water.
Microbes count500~600 million/LThese are the total number of useful bacteria present that can enable the utilization of nutrients in the biofertilizer for the Napier grass and soil rejuvenation.
Total Nitrogen (N)1.8~2.5%Higher due to the protein-rich moringa + Napier cattle diet. Anerobic process enables ammoniacal nitrogen to be readily available, compared to “raw manure”. (Primary microbe: Azotobacter chroococcum).
Phosphorous (P2O5)1.2~1.8%The FIFO digestion process mineralizes organic phosphorus, making it more soluble for the Napier roots. Above 1%, it is critical for the ATP energy cycle in the subsequent Napier crop. (Primary microbe: Pseudomonas fluorescens).
Potassium (K2O)1.5~2.2%Napier is a ‘heavy feeder” of potassium, which regulates stomatal opening, aiding in Evapotranspiration Control. (Primary microbe: Frateuria aurantia).
Organic Carbon (OC)25~35%This is mainly derived from dry matter of excreta. The primary driver for Boosting SOC in fallow land.
C:N Ratio12:1~15:1This is optimized for rapid microbial uptake without nitrogen immobilization.
Humic and Fulvic Acids5~8%The FIFO process facilitates the breakdown of complex lignins into these stable organic compounds. These are responsible for adhering soil particles together, improving soil structure, cation exchange capacity (CEC), and Evapotranspiration Control.
Secondary NutrientsCa, Mg (0.5%)These are essential for the structural integrity of the Napier stalks.
Trace NutrientsZn, Fe, Mn, Cu, B (0.2%)These act as enzymatic catalysts for the indigenous cattle when they eventually consume the grass.
PhytohormonesAuxin (0.03%) and Cytokinin (0.02%)Triggered by bacterial growth in the anerobic digestion process. These trigger rapid regrowth of Napier grass after each cutting.
* All values were measured by independent blind test by two external third parties. Devices include: INOSN, Qingdao Innova Bio-Meditech (Qingdao, China), Agros Nova MK2 meter (Lidköping, Sweden), and BHU-Vision by ICAR (BHU, Varanasi, India).
Table 5. Scenario results for SDG achievement in the years of 2040 and 2050 following implementation of the Napier–agro–dairy nexus.
Metric2040 (10% Adoption)2050 (20% Adoption)
Cultivation area0.22–0.25 million acres0.47–0.51 million acres
Total Biomass per year110–120 million tons220–240 million tons
Fallow land economic intensityINR 160k–180k/acre/yearINR 180k–200k/acre/year
Napier Income generated (total)~INR 750 billion~INR 1.5 trillion
Dairy farming savings (total)~INR 1.68 trillion~INR 3.35 trillion
Avoided CO2 emissions (Napier)0.16–0.18 Mt-CO20.32–0.35 Mt-CO2
Avoided CO2 emissions (Cattle)41–43 Mt-CO280–85 Mt-CO2
CO2 sequestered25–35 Mt-CO250–70 Mt-CO2
CO2 emitted from manure7–8 Mt-CO214–16 Mt-CO2
Soil Regeneration Index5.75.7
Households benefitted3.75–3.8 million7.4–7.6 million
Disclaimer/Publisher’s Note: The statements, opinions and data contained in all publications are solely those of the individual author(s) and contributor(s) and not of MDPI and/or the editor(s). MDPI and/or the editor(s) disclaim responsibility for any injury to people or property resulting from any ideas, methods, instructions or products referred to in the content.