Article

Scope 3 Dominance in Processed Food Systems: Cradle-to-Grave Life Cycle Emissions of Infant Cereal Production


by
Jorge Vareda Gomes
1,* and
Catarina Moreira
2
1
ECEO—School of Economic and Organizational Sciences, Universidade Lusófona, 1749-024 Lisboa, Portugal
2
Department of Economic and Business Sciences, Autonomous University of Lisbon, 1169-023 Lisbon, Portugal
*
Author to whom correspondence should be addressed.
Sustainability 2026, 18(11), 5384; https://doi.org/10.3390/su18115384
Submission received: 31 March 2026 / Revised: 30 April 2026 / Accepted: 21 May 2026 / Published: 27 May 2026

Abstract

Agri-food systems account for a substantial share of global greenhouse gas (GHG) emissions, with a significant proportion arising from upstream supply-chain activities beyond direct operational control. In this context, effective decarbonization requires systematic assessment of emissions across all life-cycle stages. This study applies an ISO 14040/44-compliant cradle-to-grave Life Cycle Assessment (LCA) to CERELAC® infant cereal, a processed dairy-based product, to quantify Scope 1, Scope 2, and Scope 3 emissions and identify mitigation pathways across the full product life cycle. Results indicate that Scope 3 emissions account for 94.3% of total product emissions, with product use (44.7%) and purchased goods and services (36.9%) as the primary contributors. Upstream agricultural inputs—particularly milk powder—emerge as the dominant hotspot due to methane emissions and energy-intensive processing. Scenario-based evaluation suggests that regenerative sourcing, ingredient optimization, packaging redesign, logistics improvements, and consumer-phase engagement could significantly reduce life cycle emissions. The findings demonstrate how product-level LCA can operationalize Scope 3 decarbonization strategies in processed food systems, bridging corporate net-zero ambitions with actionable supply chain interventions. These results provide transferable insights for cleaner production transitions within the agri-food sector.

1. Introduction

Climate change mitigation requires rapid reductions in greenhouse gas (GHG) emissions across energy-intensive production systems. The agri-food sector is a major contributor to global emissions due to its reliance on agricultural inputs, land use change, energy-intensive processing, packaging, and long-distance distribution [1,2]. Beyond direct operational emissions, a substantial share of environmental impact originates upstream and downstream in supply chains, particularly in agricultural production and consumer use phases.
As regulatory pressures intensify and corporate net-zero commitments expand following the Paris Agreement [3], food manufacturers face increasing scrutiny regarding Scope 3 emissions—those occurring outside their direct control but within their value chains. Addressing these emissions requires systematic, product-level assessment tools capable of identifying emission hotspots and guiding cleaner production strategies [4].
Life Cycle Assessment (LCA) has emerged as a critical framework for quantifying environmental impacts across cradle-to-grave stages and supporting evidence-based decarbonization pathways in complex food systems.

1.1. Sustainability in Agri-Food Supply Chains

As part of the broader transition toward low-carbon food systems, multinational food manufacturers have adopted net-zero targets and expanded the use of Life Cycle Assessment (LCA) to quantify value-chain emissions [5,6]. Evidence shows that most environmental impacts in agri-food products occur outside direct operational boundaries, particularly in upstream agricultural production and downstream consumption stages [7,8]. Consequently, addressing Scope 3 emissions has become a critical challenge for cleaner production strategies in the food sector [4].
Processed infant nutrition products represent a particularly relevant case due to their reliance on dairy-based ingredients, energy-intensive processing, and distributed supply chains. Dairy production is associated with high methane emissions and significant land-use impacts [9,10]. Despite growing attention to food system decarbonization, limited research has examined infant cereal products through a comprehensive Scope 1–3 framework that integrates agricultural inputs, packaging, logistics, and consumer-phase emissions within a single operational assessment.

1.2. Research Problem and Objectives

Despite the expanding application of Life Cycle Assessment (LCA) within agri-food systems, significant methodological and operational gaps remain in translating product-level emission accounting into actionable decarbonization strategies [6,7]. Existing studies frequently concentrate on primary agricultural production or isolated processing stages, while limited research integrates upstream agricultural inputs, packaging systems, logistics networks, and consumer-phase emissions within a unified cradle-to-grave Scope 1–3 framework [4,8]. Moreover, the operationalization of Scope 3 mitigation pathways in processed food products remains underexplored, despite evidence that supply-chain emissions often dominate total carbon footprints [4,5].
Processed infant cereals represent a particularly relevant case due to their dependence on dairy-derived ingredients, energy-intensive transformation processes, packaging materials, and geographically distributed supply chains. Dairy production, in particular, is associated with substantial methane emissions and land-use impacts [9,10]. While food-sector LCAs have increased in number, comprehensive assessments of infant cereal products integrating agricultural, packaging, transport, and consumer-use phases remain limited.
Accordingly, this study addresses the following research question:
How can cradle-to-grave life cycle assessment identify and operationalize Scope 3 decarbonization pathways in processed infant cereal supply chains?
To address this question, the study pursues four objectives:
  • Quantify Scope 1, 2, and 3 greenhouse gas (GHG) emissions across the full life cycle of a processed infant cereal product, following ISO 14040/44 standards [11].
  • Identify emission hotspots and structural drivers within agricultural, packaging, logistics, and consumer phases.
  • Evaluate mitigation scenarios, including regenerative sourcing, ingredient optimization, packaging redesign, and logistics improvements, consistent with cleaner production principles [12,13].
  • Assess the systemic implications and feasibility of these interventions for advancing supply-chain-integrated carbon neutrality in agri-food systems [14].
By integrating cradle-to-grave emission accounting with scenario-based mitigation analysis, the study contributes empirical evidence on Scope 3 structural dominance in processed food systems and demonstrates how product-level LCA can inform cleaner production transitions beyond direct operational boundaries [15].

2. Literature Review

2.1. Sustainability and Cleaner Production in Agri-Food Systems

Sustainability in agri-food systems increasingly requires the integration of environmental performance into production and supply-chain decision-making. Rather than relying solely on broad conceptual frameworks such as the Triple Bottom Line [16], recent research emphasizes operational tools capable of quantifying environmental impacts across value chains [6]. In food systems, sustainability challenges are closely linked to agricultural emissions, resource intensity, packaging systems, and logistics networks [4,7].
Cleaner production approaches in the food sector therefore extend beyond operational efficiency toward supply-chain-integrated mitigation strategies. This shift is particularly relevant in the context of climate change, where anthropogenic greenhouse gas (GHG) emissions are the primary driver of global warming [17]. Achieving carbon neutrality—defined as balancing emissions with removals [18]—requires systemic transformations across production and consumption systems, including resource-intensive sectors such as agri-food [19,20].
However, emissions in agri-food systems are distributed across multiple life cycle stages, including agricultural production, processing, packaging, transport, retail, and consumer use. A substantial proportion of these emissions occurs outside direct operational boundaries, falling within Scope 3 categories [5]. This structural complexity highlights the need for integrated analytical approaches capable of capturing cradle-to-grave impacts and supporting cleaner production strategies across the entire value chain.

2.2. Environmental Management and Scope 3 Decarbonization

Environmental management systems provide structured mechanisms for organizations to monitor, control, and reduce environmental impacts while ensuring regulatory compliance [21]. Tools such as carbon accounting, environmental impact assessments, and sustainability certifications have become widely adopted across manufacturing sectors [22,23]. However, these approaches have traditionally focused on direct operational emissions (Scopes 1 and 2), potentially underestimating the significance of value-chain impacts.
In agri-food systems, a substantial share of emissions arises upstream in agricultural production and downstream in distribution and consumption stages [4,7]. Consequently, effective environmental management requires the integration of life cycle thinking to capture Scope 3 emissions and support supply-chain decarbonization pathways [6]. Without such integration, corporate sustainability initiatives risk overlooking structural emission drivers embedded in agricultural inputs, packaging systems, and logistics networks.
Corporate strategies have increasingly evolved toward net-zero commitments that extend beyond operational boundaries [5]. In the food sector, companies commonly prioritize renewable energy adoption, energy efficiency improvements, and waste reduction to address Scope 1 and Scope 2 emissions [13]. However, evidence consistently shows that Scope 3 emissions dominate total product footprints, reinforcing the need for supply-chain-integrated mitigation approaches.

2.3. Corporate Net-Zero and Supply Chain Challenges

Despite the growing adoption of net-zero strategies, addressing Scope 3 emissions presents significant structural challenges. These emissions depend on supplier practices, land-use dynamics, and consumer behavior, which are often outside direct corporate control [6]. In agri-food systems, upstream agricultural production, packaging materials, and logistics networks represent key emission sources, complicating mitigation efforts [4,7]. Various initiatives—including regenerative agriculture, circular packaging systems, and supplier engagement programs—have gained traction as potential mitigation pathways. However, empirical evidence assessing their combined effectiveness at the product level remains limited. Furthermore, carbon offset mechanisms, such as reforestation programs, cannot substitute for systemic emission reductions embedded within supply chains [18].
These challenges highlight the need for robust analytical frameworks capable of identifying structural emission hotspots and informing targeted interventions. Translating corporate net-zero commitments into operational practice therefore requires product-level assessment approaches that capture the complexity of supply-chain emissions and support evidence-based decision-making.

2.4. Climate Change, Carbon Neutrality, and Scope 3 Complexity

Life Cycle Assessment (LCA) provides a standardized framework for quantifying environmental impacts across the full life cycle of products, from raw material extraction to end-of-life disposal [11,24]. By systematically accounting for material and energy flows, LCA enables the identification of emission hotspots and supports the development of targeted mitigation strategies [6].
In agri-food systems, LCA has become a central analytical tool due to the distributed nature of emissions. Agricultural inputs, processing activities, packaging materials, and transportation networks collectively shape product-level carbon footprints [7,8]. Studies consistently show that upstream agricultural production—particularly livestock-related methane emissions—often dominates total GHG impacts [9,10].
Beyond methodological application, LCA supports scenario analysis and comparison of alternative production and supply-chain configurations, enabling evidence-based evaluation of decarbonization pathways [25]. However, its implementation faces several challenges, including data uncertainty, variability in system boundaries, and limited integration of downstream consumer-phase emissions [6,26].
Despite these limitations, LCA remains uniquely positioned to bridge corporate sustainability commitments and operational decarbonization strategies. By adopting a cradle-to-grave perspective and integrating Scope 1–3 emissions, LCA enables comprehensive product-level assessments that capture structural emission drivers across complex supply chains.
Notwithstanding the growing body of literature, relatively few studies provide integrated cradle-to-grave assessments of processed infant cereal products that simultaneously account for agricultural inputs, manufacturing, packaging, logistics, and consumer use within a unified Scope 1–3 framework [27]. Addressing this gap is essential for advancing cleaner production strategies in processed food systems and for supporting the transition toward carbon-neutral agri-food supply chains [12].

3. Methodology

This study applies an attributional Life Cycle Assessment (LCA) to quantify greenhouse gas (GHG) emissions associated with CERELAC® infant cereal production. The assessment follows the ISO 14040 [28] and ISO 14044 [11] standards and adopts a cradle-to-grave system boundary encompassing raw material extraction, ingredient processing, manufacturing, packaging, distribution, consumer use, and end-of-life treatment.

3.1. Goal and Scope Definition

The goal of this study is to quantify greenhouse gas (GHG) emissions associated with the production and consumption of CERELAC® infant cereal and to identify emission hotspots across Scope 1, 2, and 3 categories to evaluate mitigation pathways aligned with carbon neutrality objectives.
An attributional Life Cycle Assessment (LCA) approach was adopted in accordance with ISO 14040 and ISO 14044 standards.
The functional unit is defined as 1 kg of CERELAC® consumed, including packaging, downstream distribution, consumer preparation, and end-of-life management. This functional unit ensures consistency across all life cycle stages and aligns with food-sector LCA practice [7].
The Life Cycle Assessment is consistently conducted using 1 kg of product consumed as the functional unit, which forms the basis for all impact calculations, life cycle stage comparisons, and hotspot identification. References to annual production volumes are used exclusively for result scaling and contextualization purposes, allowing illustration of system-level implications without affecting the interpretation of life cycle impacts at the functional-unit level. To avoid ambiguity, all comparative and analytical results are now explicitly reported per functional unit, while aggregated annual emission values are clearly identified as extrapolations derived from functional-unit results. This distinction ensures methodological consistency with ISO 14040/44 standards and prevents misinterpretation between product-level environmental intensity and total production-level emissions.
The system boundary follows a cradle-to-grave perspective and includes:
  • Upstream agricultural production (milk powder, cereals);
  • Ingredient processing;
  • Manufacturing at the Avanca facility;
  • Packaging production;
  • Transportation and distribution;
  • Consumer preparation (energy and water use);
  • End-of-life treatment of packaging (recycling, landfill, incineration).
Infrastructure, capital goods, and employee commuting were excluded from the system boundary due to their estimated contribution of less than 1% of total impacts. A cut-off criterion of 1% of total mass and energy flows was applied, with cumulative exclusions not exceeding 5% of total system impacts.
Emission sources were categorized according to the GHG Protocol Corporate Value Chain (Scope 3) Standard to ensure consistency between LCA stages and Scope reporting.

3.2. Life Cycle Inventory (LCI)

The Life Cycle Inventory was developed using a combination of primary and secondary data sources.
Primary data were obtained from Nestlé’s manufacturing facility in Avanca, Portugal, for the most recent full production year available. These data included:
  • Ingredient mass flows (kg per functional unit);
  • Electricity consumption (kWh/kg product);
  • Thermal energy inputs;
  • Packaging material composition and mass;
  • Waste generation rates;
  • Transportation distances and modes.
Primary data are considered geographically and technologically representative of current production practices.
Secondary data were sourced from the World Food LCA Database (WFLDB), IPCC emission factors, and peer-reviewed literature for upstream agricultural processes and background systems, including electricity grid mixes and fuel combustion factors.
The LCA model was implemented using standard life cycle assessment software (e.g., SimaPro (7.3.3) or openLCA (2.5.0)), or alternatively through a structured spreadsheet-based modelling approach, ensuring consistent aggregation of inventory flows and impact characterization.
Allocation procedures:
  • Economic allocation was applied to dairy co-products.
  • Mass allocation was used for cereal processing co-products where applicable.
Annual emissions were calculated by multiplying functional-unit results by total annual production volume for the reference year.

3.3. Life Cycle Impact Assessment (LCIA)

The LCIA was conducted using the IPCC 2021 [29] Global Warming Potential (GWP100) characterization factors to convert carbon dioxide (CO2), methane (CH4), and nitrous oxide (N2O) emissions into carbon dioxide equivalents (kg CO2-eq).
The primary impact category assessed was Climate Change, consistent with the study’s carbon neutrality objective. Other environmental impact categories were not included, as the analysis focuses specifically on greenhouse gas emissions and Scope 1–3 accounting.
Impact calculations were performed at the functional-unit level and subsequently scaled to annual production.

3.4. Interpretation and Sensitivity Analysis

Hotspot analysis was conducted by disaggregating life cycle emissions at the functional-unit level and calculating the percentage contribution of each life cycle stage to total greenhouse gas emissions. Stages exceeding 10% of total emissions were classified as structural hotspots and prioritized for mitigation analysis.
To evaluate the robustness of results, a deterministic sensitivity analysis was performed on key assumptions with high influence and uncertainty. The following parameters were tested:
  • Allocation method for dairy co-products: Economic allocation was compared with mass-based allocation to assess variability in upstream milk-related emissions.
  • Electricity grid emission factors: ±20% variation was applied to reflect potential differences in grid carbon intensity and renewable energy penetration.
  • Consumer preparation energy demand: Energy use assumptions were varied ±25% to account for differences in household heating methods and preparation behavior.
Changes in total carbon footprint and hotspot ranking were evaluated for each variation scenario. Results indicated that although absolute emission values varied within expected ranges, the structural dominance of upstream agricultural inputs and consumer-phase energy use remained consistent across scenarios.
This approach strengthens the robustness of conclusions and addresses uncertainty inherent in agri-food supply chain modelling.
Data accuracy and uncertainty were addressed through a structured data quality assessment and sensitivity analysis. Primary data were evaluated according to temporal, geographical, and technological representativeness, while secondary datasets were selected based on their relevance to the assessed processes and regional context. To account for uncertainty in high-influence parameters, deterministic sensitivity analyses were conducted on key assumptions, including dairy allocation methods, electricity emission factors, transportation distances, and consumer preparation energy demand. These analyses assessed the effect of parameter variation on total emissions and life cycle stage contributions. Although absolute emission values varied within expected ranges, the relative importance of life cycle stages and the dominance of Scope 3 emissions remained consistent. This confirms the robustness of the identified emission hotspots and supports the reliability of the study’s conclusions despite inherent data uncertainty.

3.5. Case Study Context

Nestlé S.A. is a multinational food and beverage manufacturer operating across global supply chains. The company produces a wide range of processed food products, including infant nutrition cereals. The present study focuses on CERELAC®, an infant cereal manufactured at Nestlé’s facility in Avanca, Portugal. The factory supplies domestic and export markets and relies on internationally sourced agricultural inputs, including dairy-derived ingredients and cereals.
The Portuguese operations include production facilities for cereals and coffee, as well as a national distribution center. The selected case provides a representative example of a processed food product characterized by dairy inputs, energy-intensive processing, packaging requirements, and distributed logistics networks. These characteristics make it analytically relevant for assessing cradle-to-grave greenhouse gas emissions and identifying Scope 1–3 hotspots within agri-food supply chains.
The selection of Nestlé’s Portuguese production facility serves exclusively as an empirical context for the application of cradle-to-grave Life Cycle Assessment. The study does not constitute a corporate sustainability evaluation, benchmarking exercise, or performance comparison. Instead, the facility provides the necessary operational data to support a product-level LCA of a representative processed food product. All conclusions are methodological and analytical in nature and should be interpreted within the scope of life cycle assessment rather than corporate sustainability performance.

3.6. CERELAC®: Product Context

CERELAC® was selected as the case product due to its suitability for examining structurally dominant greenhouse gas emission drivers in processed food systems. As a dairy-containing infant cereal, the product combines upstream agricultural processes associated with methane-intensive milk production, energy-intensive manufacturing stages, packaged distribution, and a consumer preparation phase that requires household energy input. This configuration makes the product particularly relevant for analysing Scope 3 emissions across the full life cycle. Moreover, cradle-to-grave LCAs of infant cereals remain limited in the literature, especially those integrating downstream consumer preparation impacts alongside upstream agricultural inputs. The selected product therefore provides a scientifically relevant and analytically representative case for investigating Scope 3 dominance in processed agri-food supply chains, with findings that are transferable beyond the specific product examined.
CERELAC® is a processed infant cereal composed primarily of cereal flours (e.g., wheat, oats, rice), dairy-derived ingredients (notably milk powder), vitamins, and mineral fortifications. The product requires thermal processing, drying, blending, and packaging prior to distribution. These stages involve energy consumption, material inputs, and packaging components that contribute to greenhouse gas emissions across the value chain.
The product’s supply chain includes upstream agricultural production of cereals and dairy inputs, ingredient processing, manufacturing at the Avanca facility in Portugal, national and international distribution, consumer preparation (typically involving hot water or milk), and packaging end-of-life treatment. Packaging consists predominantly of paper-based materials with inner barrier components designed to preserve product quality.
The presence of dairy-derived ingredients, combined with energy-intensive processing and distributed logistics, makes this product category particularly suitable for cradle-to-grave emission assessment. These characteristics enable identification of Scope 1, 2, and 3 emission drivers and evaluation of mitigation strategies within a representative processed food system.

3.7. Data Collection and Quality Assessment

The Life Cycle Inventory (LCI) was developed using a combination of primary and secondary data sources. Primary data were obtained from Nestlé’s manufacturing facility in Avanca, Portugal, and included:
  • Ingredient mass flows (kg per functional unit);
  • Electricity and thermal energy consumption (kWh per kg product);
  • Packaging material composition and mass;
  • Waste generation rates;
  • Transportation distances and modes.
Primary data correspond to the most recent full production year available and are considered geographically and technologically representative of current operations.
Secondary data were sourced from the World Food LCA Database (WFLDB), IPCC emission factors, and peer-reviewed literature for upstream agricultural processes and background systems, including electricity grid mixes and fuel combustion factors. Emission factors were harmonized using IPCC 2021 Global Warming Potential (GWP100) characterization values.
Data quality was evaluated according to temporal, geographical, and technological representativeness criteria. Where site-specific data were unavailable—particularly for upstream agricultural inputs—proxy datasets from WFLDB were selected based on similarity in production system and regional context. Sensitivity analysis was conducted to assess the influence of key assumptions, including electricity grid emission factors and dairy allocation methods.
The LCA model was implemented using [software/platform], ensuring consistent aggregation of material and energy flows across life cycle stages. A cut-off criterion of 1% of total mass and energy inputs was applied, with cumulative exclusions not exceeding 5% of overall system impacts. Emission sources were mapped to Scope 1, 2, and 3 categories in accordance with the GHG Protocol Corporate Value Chain Standard to ensure consistency between life cycle stages and corporate emission reporting frameworks. Annual emissions were derived by scaling functional-unit results using total production volume for the reference year.
This study was conducted exclusively for academic research purposes. None of the authors are employed by, affiliated with, or represent Nestlé S.A., and all authors declare the absence of conflicts of interest. Primary data were provided by the manufacturing facility solely to support life cycle modelling and were used in aggregated form. No confidential, commercially sensitive, or proprietary information is disclosed in this manuscript. The company was not involved in the study design, data analysis, interpretation of results, or preparation of the manuscript, thereby ensuring full scientific independence.
To enhance transparency and support reproducibility of the Life Cycle Assessment, a detailed Life Cycle Inventory (LCI) has been made available as Supplementary Material (Table S1). The supplementary inventory reports all relevant input and output data per functional unit (1 kg of product consumed), including ingredient composition, packaging materials, energy consumption by process, transportation distances and modes, and emission factors applied. Primary data are presented in aggregated and normalized form to preserve commercial confidentiality, while secondary data are referenced from established LCA databases and IPCC sources. Although absolute site-specific values cannot be fully disclosed, the structure, parameterization, and assumptions of the inventory enable independent reproduction of the modelling approach and verification of the methodological choices adopted in the study.

3.8. Data Transparency and Assumptions

This study applies a cradle-to-grave Life Cycle Assessment (LCA) to CERELAC® infant cereal, produced at Nestlé’s manufacturing facility in Avanca, Portugal, selected as a representative processed dairy-based infant cereal. Primary data were collected at the production site and used in aggregated form, while secondary data were obtained from established life cycle databases and IPCC sources. Scope 2 emissions were calculated using site-specific electricity and thermal energy consumption data combined with national electricity emission factors. Scope 3 emissions were modelled using a combination of primary aggregated data (ingredients, packaging, transportation) and secondary datasets for upstream agricultural production, logistics, consumer preparation, and end-of-life treatment. Key model assumptions include geographically representative agricultural production systems, average transportation distances and modes, standardized household preparation practices (heating water or milk), and representative waste management scenarios based on regional statistics. To ensure transparency and reproducibility while preserving data confidentiality, a detailed Life Cycle Inventory is provided as Supplementary Material (Table S1), where all inventory values are reported per functional unit in a normalized and representative form. Data quality was evaluated based on temporal, geographical, and technological representativeness, and sensitivity analyses were conducted for high-influence parameters, confirming that the dominance of Scope 3 emissions and the identified hotspots are robust despite uncertainty in absolute values.

4. Results

4.1. Overall Carbon Footprint and Scope Distribution

The cradle-to-grave Life Cycle Assessment quantified total greenhouse gas emissions of 11.19 kg CO2-eq per functional unit (1 kg CERELAC® consumed). When scaled to the 2018 production year, total emissions amounted to 58,579 tCO2-eq annually. Scope 3 emissions represent 94.3% of total life cycle emissions, whereas Scopes 1 and 2 collectively account for 5.7%.

4.2. Life Cycle Stage Contributions

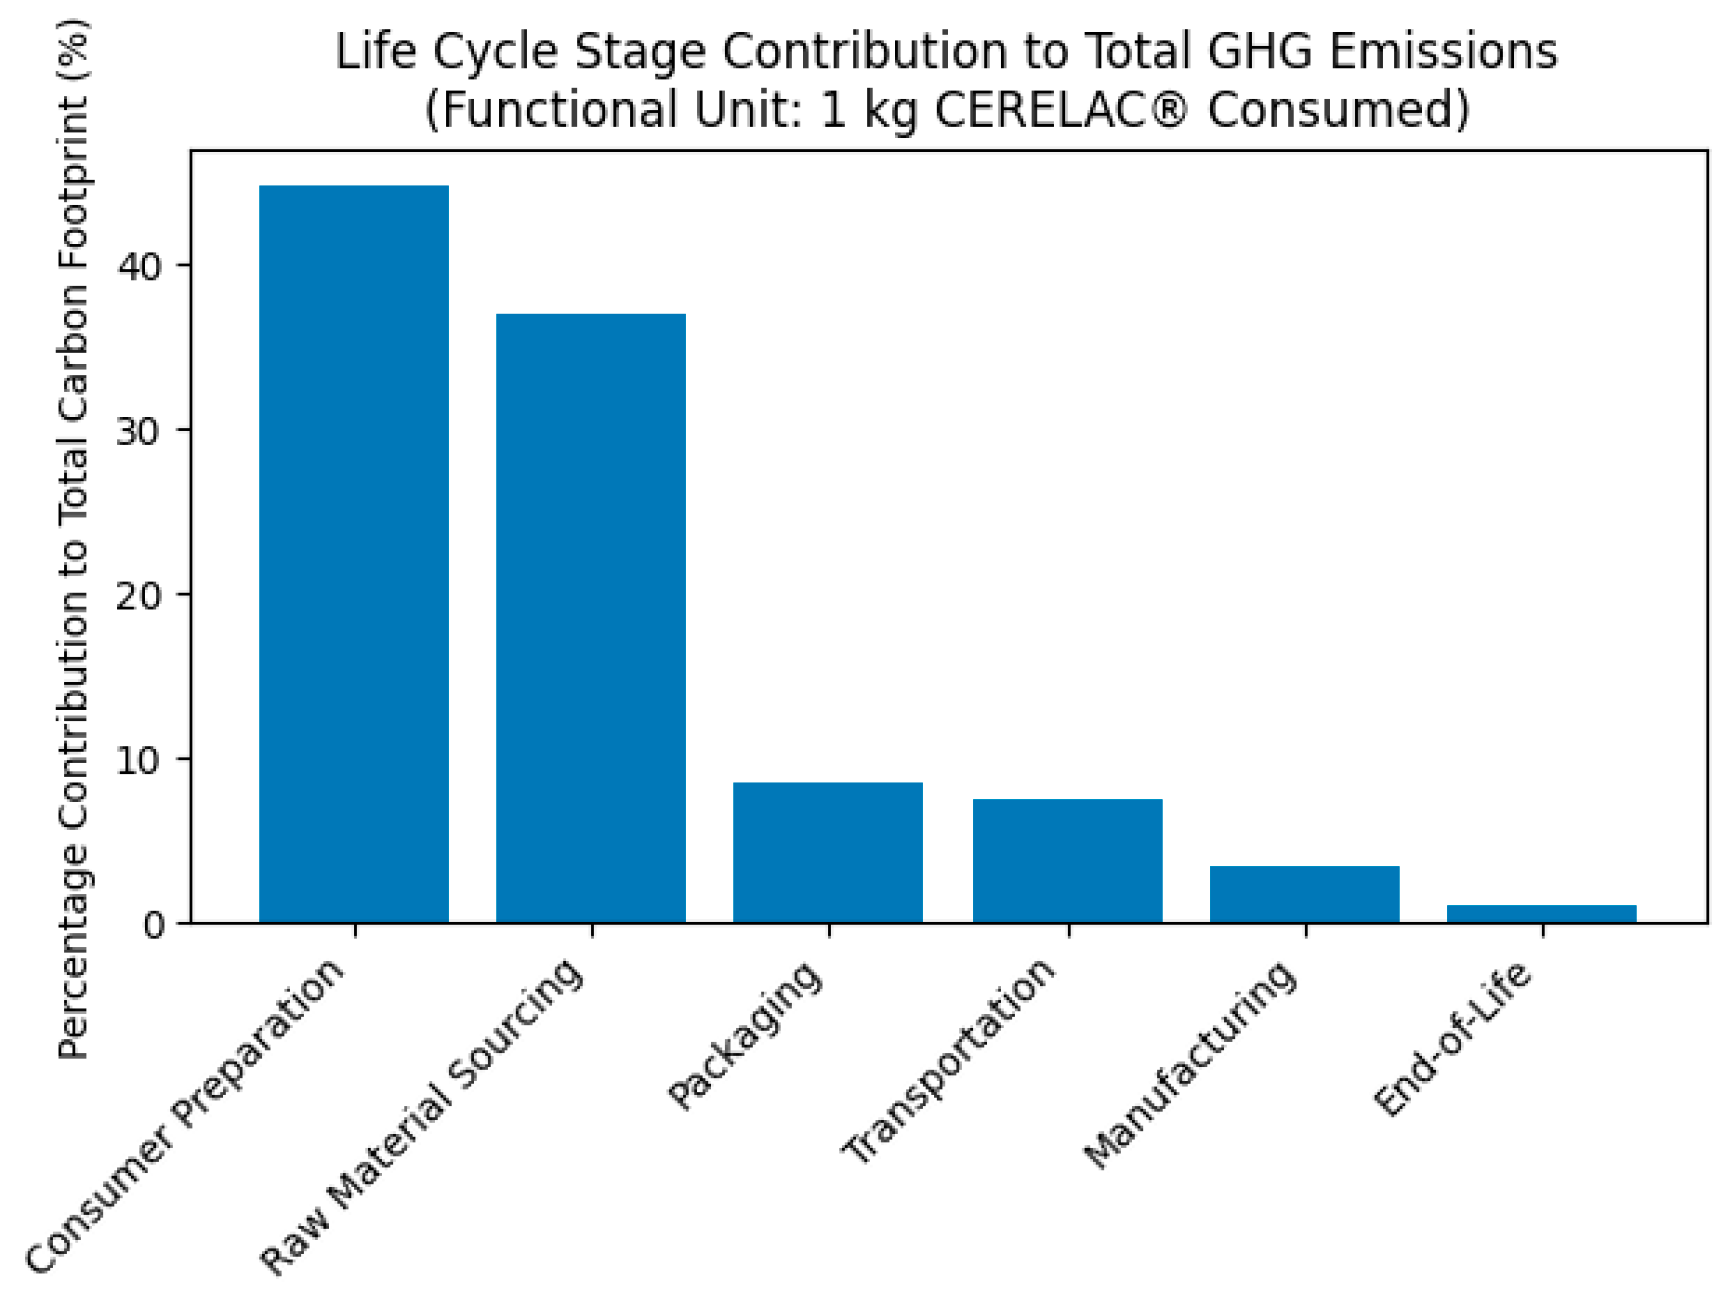
Figure 1 presents the percentage contribution of each life cycle stage to the total carbon footprint.
The breakdown is as follows:
  • Consumer preparation: 44.7%;
  • Raw material sourcing (ingredients): 36.9%;
  • Packaging production: approximately 8–9%;
  • Transportation and distribution: approximately 7–8%;
  • Manufacturing (Scopes 1 and 2): approximately 3–4%;
  • End-of-life treatment: less than 2%.
Together, upstream ingredients and consumer preparation account for more than 80% of the total carbon footprint.

4.3. Raw Material Sourcing

Upstream agricultural inputs represent a major emission source, contributing 36.9% of total emissions.
Within this category:
  • Milk powder production accounts for 21% of total emissions, making it the single largest supply-chain hotspot.
  • Cereal flours contribute 7% of total emissions.
  • The remaining ingredients (including oils, sugars, and micronutrients) collectively contribute approximately 9%.
The high impact of milk powder is primarily associated with enteric methane emissions from dairy production and energy-intensive drying processes.

4.4. Manufacturing

Manufacturing emissions contribute approximately 3–4% of total emissions. These impacts arise from thermal energy use during drying and blending processes and residual electricity consumption. The relatively low contribution reflects renewable electricity sourcing and energy efficiency measures at the production facility.

4.5. Packaging

Packaging contributes approximately 8–9% of the total carbon footprint, corresponding to approximately 802 tCO2e annually. Emissions are primarily associated with the production of cardboard and multi-layer packaging components. Although packaging represents a smaller share than ingredient sourcing or consumer use, it remains a structurally significant contributor.

4.6. Transportation and Distribution

Transportation and distribution activities account for approximately 7–8% of total emissions (approximately 648 tCO2e annually). Emissions originate from both upstream transport of raw materials and downstream distribution of finished products. Long-distance logistics and fossil-fuel-based freight systems drive this contribution.

4.7. Consumer Preparation and End-of-Life

Consumer preparation represents the largest life cycle stage, contributing 44.7% of total emissions. These emissions result primarily from household energy used to heat water or milk during product preparation.
End-of-life treatment contributes less than 2% of total emissions. Emission intensity varies depending on disposal pathways, including recycling, landfill, or incineration.

4.8. Hotspot Identification and Robustness

Based on contributions exceeding 10% of total emissions, three structural hotspots were identified:
  • Consumer preparation (44.7%);
  • Milk powder production (21%);
  • Total ingredient sourcing (36.9%).
Sensitivity analysis confirmed that variations in allocation method, electricity grid factors, and consumer preparation energy assumptions influenced absolute emission values but did not alter hotspot ranking. This indicates structural robustness of the identified emission drivers.

5. Discussion

This study assessed the cradle-to-grave life cycle of CERELAC® to quantify greenhouse gas (GHG) emissions and identify structurally dominant emission drivers. Results demonstrate that Scope 3 emissions account for 94.3% of total emissions, with consumer-phase preparation (44.7%) and purchased goods and services (36.9%) representing the largest contributors. In contrast, Scopes 1 and 2 collectively account for 5.7%, indicating that value-chain emissions substantially outweigh direct operational impacts.
Life cycle stage analysis identified three primary structural hotspots: (1) upstream ingredient production—particularly milk powder; (2) consumer preparation; and (3) packaging and transportation. These findings align with existing agri-food LCA literature, which consistently shows that agricultural production and downstream use-phase activities dominate food product carbon footprints [4,7]. The prominence of milk-derived ingredients reflects the well-documented contribution of enteric methane and fertilizer-related nitrous oxide emissions in dairy supply chains [9].
Given the distribution of impacts, upstream agricultural interventions represent a critical mitigation pathway. Measures such as regenerative agricultural practices, improved livestock efficiency, and optimized fertilizer management may reduce upstream emission intensity. Packaging redesign and logistics optimization also offer additional reduction potential, though their relative contribution is smaller compared to agricultural and consumer-phase emissions.
Importantly, the dominance of Scope 3 emissions highlights the limited influence of direct operational improvements alone. Effective decarbonization in processed food systems therefore requires coordinated action across suppliers, logistics networks, and consumers. Targeting the identified hotspots may enable substantial Scope 3 emission reductions, but implementation feasibility depends on economic, technical, and behavioral factors beyond direct facility control.

5.1. Opportunities for GHG Reduction: Regenerative Agricultural Practices

Upstream agricultural production—particularly dairy inputs—represents a structurally dominant emission source in this study, accounting for 36.9% of total emissions, with milk powder alone contributing 21%. Given this distribution, interventions at the agricultural stage offer the greatest potential for Scope 3 emission reduction.
Regenerative agriculture has been proposed as a systems-based approach to rehabilitating soil ecosystems while maintaining agricultural productivity [30]. Relevant practices include reduced tillage to enhance soil carbon retention [31], substitution of synthetic fertilizers with organic amendments [32], diversified crop rotation to prevent soil degradation, and rotational grazing to maintain grassland health [33]. In livestock systems, improved feed efficiency and methane-reducing feed additives may reduce enteric methane emissions, a key contributor in dairy supply chains [34].
These practices target the primary emission drivers identified in the LCA—namely nitrous oxide emissions from fertilizer use and methane emissions from livestock. However, the magnitude of achievable reductions depends on adoption rates, regional agronomic conditions, and long-term soil carbon permanence [35]. While regenerative approaches may reduce upstream emission intensity, their effectiveness must be evaluated through follow-up LCA modelling to account for yield variability, land-use effects, and supply-chain scaling constraints [36].
Given the structural dominance of upstream emissions in this case, agricultural system transformation represents a critical—but complex—pathway for reducing the carbon footprint of processed infant cereal products [36].
Regenerative agriculture, defined as a system that rehabilitates and conserves agricultural and food systems, is central to reducing Scope 3 emissions in CERELAC®’s life cycle. It improves soil health, enhances productivity, and supports farm profitability while mitigating climate change [30]. Key practices include reduced soil tillage to enhance organic matter and limit erosion [31]; substitution of chemical fertilizers with organic alternatives [32]; seasonal crop rotation to prevent soil exhaustion; shading systems to preserve soil moisture and buffer climatic extremes [37]; rotational grazing to protect grassland regeneration [33]; and adoption of sustainable livestock feed, including methane-reducing additives [34].
Together, these practices contribute to emission reductions by lowering fertilizer-related nitrous oxide release, improving livestock management, and enhancing soil carbon sequestration. By embedding regenerative agriculture into supply chains, Nestlé and other food companies can address major Scope 3 hotspots, strengthen farmer resilience, and support global goals for carbon neutrality [38].

5.2. Targeted Mitigation Pathways

5.2.1. Ingredient Reformulation and Dairy Intensity

Milk and flour represent the largest contributors within the ingredient category, accounting for 21% and 7% of total emissions, respectively. The impact of milk is primarily associated with enteric methane emissions and fertilizer-related nitrous oxide in dairy supply chains [10], while wheat cultivation contributes through fertilizer use and soil management practices [39].
Complete substitution of dairy ingredients is constrained by nutritional and functional requirements in infant products. However, partial reformulation strategies—such as optimizing dairy intensity or incorporating validated lower-emission protein sources—may reduce upstream emissions without compromising nutritional adequacy [40]. Any reformulation must be evaluated against life cycle trade-offs, supply-chain feasibility, and compliance with infant nutrition standards [41]. Given the structural dominance of agricultural emissions identified in this study, even incremental reductions in dairy intensity could yield measurable carbon footprint improvements [35].

5.2.2. Packaging Optimization

Packaging contributes approximately 802 tCO2e annually, with cardboard accounting for 339 tCO2e. Emissions are largely associated with pulp processing and energy-intensive material production [42,43].
Potential mitigation measures include increasing recycled fiber content, lightweighting components, and transitioning toward mono-material or fully recyclable designs [44]. Although packaging represents a smaller share of total emissions compared to agricultural inputs and consumer preparation, it remains a relatively controllable domain for reduction, as interventions can be implemented directly within manufacturing and supplier networks.

5.2.3. Logistics and Distribution

Transportation accounts for approximately 648 tCO2e annually, driven by long-distance freight and fossil-fuel dependence. Route optimization, modal shifts, and low-emission fleet technologies have been identified as viable mitigation strategies [45]. While the proportional contribution is lower than upstream agriculture or consumer-phase emissions, logistics optimization offers incremental reduction potential with comparatively clear operational pathways.

5.2.4. System-Level Implications

Collectively, ingredient sourcing, packaging, and transportation constitute structurally significant Scope 3 emission sources. However, the analysis demonstrates that upstream agricultural production and consumer preparation (44.7% of total emissions) remain the primary drivers of the product carbon footprint. Sensitivity analysis confirmed that hotspot ranking remains stable under variations in allocation methods and energy assumptions, reinforcing the structural nature of these emission drivers.
This distribution underscores the systemic challenge of decarbonization in processed food systems. Direct operational improvements alone are insufficient; meaningful carbon reduction requires coordinated supply-chain transformation and attention to downstream consumption patterns.

5.2.5. Feasibility of Mitigation Interventions

The LCA results indicate that upstream agricultural production, consumer preparation, packaging, and logistics represent structural emission hotspots. The feasibility of mitigation interventions across these domains depends on economic, technical, and systemic considerations.

5.2.6. Regenerative and Low-Emission Agricultural Practices

Upstream dairy production represents the largest ingredient-level hotspot (21% of total emissions). Transitioning toward regenerative or lower-emission agricultural practices offers significant mitigation potential. However, implementation requires investment in soil management, livestock efficiency improvements, and supply chain coordination [35].
Economic feasibility depends on long-term yield stability, carbon pricing mechanisms, and supplier engagement models. While such transitions may increase short-term costs, they can enhance resilience to climate variability and reduce long-term exposure to regulatory carbon constraints. Importantly, these interventions do not alter product nutritional composition but require value-chain collaboration beyond direct operational control [46].

5.2.7. Packaging Redesign

Packaging contributes approximately 8–9% of total emissions. Material substitution (e.g., lightweighting, mono-material design, or increased recyclability) presents a technically viable pathway for emission reduction. However, feasibility is influenced by material performance requirements, shelf-life protection, and compatibility with existing manufacturing infrastructure [44].
Economic trade-offs arise from higher unit costs of alternative materials and potential capital expenditures for equipment adjustments. Nevertheless, improved recyclability and material efficiency may partially offset costs through reduced material intensity and waste management burdens [47].

5.2.8. Logistics Optimization

Transportation accounts for approximately 7–8% of total emissions. Optimization strategies include improved route efficiency, modal shifts, and fleet decarbonization. While capital investment may be required for fleet upgrades or infrastructure adaptation, long-term fuel savings and regulatory decarbonization pressures increase the strategic relevance of such measures [48].
These interventions do not affect product composition or safety but require coordination across distribution networks and suppliers.

5.2.9. Consumer-Phase Emissions

Consumer preparation represents the largest life cycle stage (44.7%). Mitigation potential in this phase is constrained by behavioral variability and limited direct corporate control. Strategies such as consumer education, product design optimization (e.g., reduced preparation energy demand), or communication of low-energy preparation methods may influence impact magnitude; however, behavioral uncertainty reduces predictability of emission reductions [49].

5.2.10. Overall Feasibility Considerations

Across all intervention domains, feasibility is shaped by three structural dimensions:
  • Economic viability, including capital expenditure and supply chain restructuring [50,51];
  • Technical compatibility, ensuring product safety, quality, and regulatory compliance [52];
  • System-level coordination, particularly for upstream agricultural and downstream consumer-phase emissions [53].
While some mitigation pathways require substantial investment and cross-stakeholder collaboration, LCA results provide a prioritized framework for targeting structurally dominant emission sources.

5.2.11. Consumer Engagement and Behavioral Mitigation

Consumer preparation accounts for 44.7% of total cradle-to-grave emissions, representing the largest life cycle stage. Unlike upstream agricultural processes, this phase is influenced primarily by household energy use and behavioral practices, which limits direct corporate control [35].
Mitigation potential in this stage depends on influencing preparation methods and energy intensity. Information-based interventions—such as eco-labeling, preparation guidance, or energy-saving recommendations—are generally low-cost relative to structural supply-chain modifications. However, their effectiveness depends on behavioral responsiveness and clarity of communication [54].
Digital tools, including QR codes or product-level environmental information platforms, may facilitate transparency and improve consumer awareness. Nevertheless, behavioral interventions are subject to variability and rebound effects, and their actual impact on emissions reduction remains uncertain without empirical evaluation [55].
Importantly, communication strategies must ensure that recommendations do not compromise product safety, nutritional adequacy, or regulatory compliance. Any proposed preparation optimization should align with established food safety guidelines [56].
Given the structural dominance of consumer-phase emissions in this study, future mitigation pathways should consider behavioral dimensions alongside supply-chain interventions. However, measurable emission reductions in this stage require cautious interpretation due to high variability and limited enforceability.

5.2.12. Implications, Limitations and Future Research

The findings of this study carry implications at multiple levels.
For food manufacturers, the dominance of Scope 3 emissions (94.3%) demonstrates that meaningful decarbonization requires action beyond direct operations. Upstream agricultural inputs and consumer-phase preparation represent the primary leverage points. Life Cycle Assessment (LCA) provides a structured method for identifying these hotspots and prioritizing interventions within complex agri-food supply chains [57].
For the broader food sector, the results reinforce the systemic nature of emissions in processed food systems. Incremental operational efficiency improvements are insufficient when upstream dairy production and downstream consumer behavior dominate total footprint. Industry-wide progress therefore depends on supplier engagement, product reformulation strategies, and demand-side awareness [35].
For policymakers, the concentration of emissions in agriculture and logistics highlights the importance of regulatory and infrastructural frameworks that support low-emission farming practices, recyclable packaging systems, and low-carbon transport networks. Coordinated policy mechanisms can facilitate supply-chain decarbonization while maintaining food safety and nutritional standards [57].
Overall, the study underscores that carbon reduction in processed infant cereal products requires system-level coordination across producers, suppliers, and consumers.

5.2.13. Study Limitations

Several limitations should be acknowledged.
First, the Life Cycle Assessment relies partly on secondary data sources and emission factor databases, particularly for upstream agricultural processes. Although sensitivity analysis was conducted, data variability may influence absolute emission values.
Second, system boundary choices and allocation methods—particularly in dairy supply chains—can affect impact distribution, despite robustness in hotspot ranking.
Third, consumer-phase emissions were modeled based on standardized preparation assumptions. Actual household energy use may vary significantly, introducing behavioral uncertainty into downstream impact estimates.
While the analysis focuses on a single product, the identified emission patterns—particularly the dominance of upstream agricultural inputs and consumer use—reflect structural characteristics common to many processed dairy-based food products. As such, the insights derived from this case are analytically transferable to comparable product categories, although absolute emission values may vary depending on formulation, sourcing, and consumer behavior.
Finally, the study does not model scenario-based mitigation pathways quantitatively. Proposed interventions were evaluated conceptually rather than through dynamic LCA simulations.

5.2.14. Future Research Directions

Future research should focus on strengthening both methodological robustness and sectoral applicability.
Longitudinal assessments are needed to quantify the real-world impact of agricultural transitions, packaging redesign, and logistics optimization on emission reductions. Comparative LCAs across infant nutrition and dairy-based food products would provide benchmarking insights for the sector.
Further research should also integrate behavioral studies to better quantify variability in consumer preparation practices, given the structural dominance of the use phase. Finally, advances in digital monitoring tools and real-time environmental accounting could improve data accuracy and reduce uncertainty in agri-food LCA.

Supplementary Materials

The following supporting information can be downloaded at: https://www.mdpi.com/article/10.3390/su18115384/s1, Table S1: Life Cycle Inventory (LCI) for CERELAC®.

Author Contributions

Conceptualization, C.M.; Methodology, J.V.G. and C.M.; Validation, J.V.G.; Formal analysis, J.V.G.; Investigation, C.M.; Writing—original draft, C.M.; Writing—review & editing, J.V.G. and C.M.; Visualization, C.M.; Project administration, J.V.G.; Funding acquisition, J.V.G. All authors have read and agreed to the published version of the manuscript.

Funding

This research received no external funding.

Institutional Review Board Statement

Not applicable.

Informed Consent Statement

Not applicable.

Data Availability Statement

The original contributions presented in this study are included in the article/Supplementary Material. Further inquiries can be directed to the corresponding author.

Conflicts of Interest

The authors declare no conflict of interest.

References

  1. Seneviratne, S.I.; Zhang, X.; Adnan, M.; Badi, W.; Dereczynski, C.; Di Luca, A.; Ghosh, S.; Iskandar, I.; Kossin, J.; Lewis, S.; et al. Weather and climate extreme events in a changing climate. In Climate Change 2021: The Physical Science Basis. Contribution of Working Group I to the Sixth Assessment Report of the Intergovernmental Panel on Climate Change; Masson-Delmotte, V., Zhai, P., Pirani, A., Connors, S.L., Péan, C., Berger, S., Caud, N., Chen, Y., Goldfarb, L., Gomis, M.I., et al., Eds.; Cambridge University Press: Cambridge, UK, 2021; pp. 1513–1766. [Google Scholar] [CrossRef]
  2. Vetter, S.H.; Sapkota, T.B.; Hillier, J.; Stirling, C.M.; Macdiarmid, J.I.; Aleksandrowicz, L.; Green, R.; Joy, E.J.; Dangour, A.D.; Smith, P. Greenhouse gas emissions from agricultural food production to supply Indian diets: Implications for climate change mitigation. Agric. Ecosyst. Environ. 2017, 237, 234–241. [Google Scholar] [CrossRef]
  3. United Nations Framework Convention on Climate Change (UNFCCC). The Paris Agreement. In Proceedings of the 21st Conference of the Parties (COP21), Paris, France, 12 December 2015; Entered into Force 4 November 2016. Available online: https://unfccc.int/process-and-meetings/the-paris-agreement/the-paris-agreement (accessed on 2 January 2022).
  4. Liu, T.-C.; Wu, Y.-C.; Chau, C.-F. An Overview of Carbon Emission Mitigation in the Food Industry: Efforts, Challenges, and Opportunities. Processes 2023, 11, 1993. [Google Scholar] [CrossRef]
  5. Chen, L.; Msigwa, G.; Yang, M.; Osman, A.I.; Fawzy, S.; Rooney, D.W.; Yap, P.-S. Strategies to achieve a carbon neutral society: A review. Environ. Chem. Lett. 2022, 20, 2277–2310. [Google Scholar] [CrossRef] [PubMed]
  6. Sala, S.; Amadei, A.M.; Beylot, A.; Ardente, F. The evolution of life cycle assessment in European policies over three decades. Int. J. Life Cycle Assess. 2021, 26, 2295–2314. [Google Scholar] [CrossRef]
  7. Notarnicola, B.; Sala, S.; Anton, A.; McLaren, S.J.; Saouter, E.; Sonesson, U. The role of life cycle assessment in supporting sustainable agri-food systems: A review of the challenges. J. Clean. Prod. 2017, 140, 399–409. [Google Scholar] [CrossRef]
  8. Cucurachi, S.; Scherer, L.; Guinée, J.; Tukker, A. Life cycle assessment of food systems. One Earth 2019, 1, 292–297. [Google Scholar] [CrossRef]
  9. IPCC. Agriculture, forestry and other land use (AFOLU). In Climate Change 2014: Mitigation of Climate Change. Contribution of Working Group III to the Fifth Assessment Report of the Intergovernmental Panel on Climate Change; Cambridge University Press: Cambridge, UK, 2014; Available online: https://www.ipcc.ch (accessed on 20 May 2026).
  10. Peterson, C.B.; Mitloehner, F.M. Sustainability of the dairy industry: Emissions and mitigation opportunities. Front. Anim. Sci. 2021, 2, 760310. [Google Scholar] [CrossRef]
  11. ISO 14044:2006; Environmental Management—Life Cycle Assessment—Requirements and Guidelines. International Organization for Standardization: Vernier, Switzerland, 2006.
  12. Bhatia, M.; Meenakshi, N.; Kaur, P.; Dhir, A. Digital technologies and carbon neutrality goals: An in-depth investigation of drivers, barriers, and risk mitigation strategies. J. Clean. Prod. 2024, 451, 141946. [Google Scholar] [CrossRef]
  13. Hermundsdottir, F.; Aspelund, A. Competitive sustainable manufacturing: Sustainability strategies, environmental and social innovations, and their effects on firm performance. J. Clean. Prod. 2022, 370, 133474. [Google Scholar] [CrossRef]
  14. Yadav, A.; Garg, R.K.; Sachdeva, A. Artificial intelligence applications for information management in sustainable supply chain management: A systematic review and future research agenda. Int. J. Inf. Manag. Data Insights 2024, 4, 100292. [Google Scholar] [CrossRef]
  15. Kaynak, E.; Piri, I.S.; Das, O. Revisiting the Basics of Life Cycle Assessment and Lifecycle Thinking. Sustainability 2025, 17, 7444. [Google Scholar] [CrossRef]
  16. Slaper, T.F.; Hall, T.J. The triple bottom line: What is it and how does it work? Indiana Bus. Rev. 2011, 86, 4–8. [Google Scholar]
  17. IPCC. Climate Change 2023: Synthesis Report. Contribution of Working Groups I, II and III to the Sixth Assessment Report of the Intergovernmental Panel on Climate Change; Lee, H., Romero, J., Eds.; IPCC: Geneva, Switzerland, 2023. [Google Scholar] [CrossRef]
  18. IPCC. Climate Change 2022: Impacts, Adaptation and Vulnerability; Intergovernmental Panel on Climate Change: Geneva, Switzerland, 2022; Available online: https://www.ipcc.ch/report/ar6/wg2/downloads/report/IPCC_AR6_WGII_SummaryVolume.pdf (accessed on 20 May 2026).
  19. De La Peña, L.; Guo, R.; Cao, X.; Ni, X.; Zhang, W. Accelerating the energy transition to achieve carbon neutrality. Resour. Conserv. Recycl. 2022, 177, 105957. [Google Scholar] [CrossRef]
  20. Nunes, L.J.R. The Rising Threat of Atmospheric CO2: A Review on the Causes, Impacts, and Mitigation Strategies. Environments 2023, 10, 66. [Google Scholar] [CrossRef]
  21. He, F.; Miao, X.; Wong, C.W.Y.; Lee, S. Contemporary corporate eco-innovation research: A systematic review. J. Clean. Prod. 2018, 174, 502–526. [Google Scholar] [CrossRef]
  22. De Wolf, C.; Cordella, M.; Dodd, N.; Byers, B.; Donatello, S. Whole life cycle environmental impact assessment of buildings: Developing software tool and database support for the EU framework Level(s). Resour. Conserv. Recycl. 2023, 188, 106642. [Google Scholar] [CrossRef]
  23. Johnstone, L. A systematic analysis of environmental management systems in SMEs: Possible research directions from management accounting and control stance. J. Clean. Prod. 2020, 244, 118802. [Google Scholar] [CrossRef]
  24. Mabee, W.E.; Blair, M.J.; Carlson, J.T.; DeLoyde, C.N.M. Sustainability. In International Encyclopedia of Human Geography, 2nd ed.; Kobayashi, A., Ed.; Elsevier: Amsterdam, The Netherlands, 2020; pp. 157–163. [Google Scholar] [CrossRef]
  25. Barjoveanu, G.; Teodosiu, C.; Mihai, M.; Morosanu, I.; Fighir, D.; Vasiliu, A.-M.; Bucatariu, F. Chapter 12—Life cycle assessment for eco-design in product development. In Assessing Progress Towards Sustainability; Teodosiu, C., Fiore, S., Hospido, A., Eds.; Elsevier: Amsterdam, The Netherlands, 2022; pp. 247–271. [Google Scholar] [CrossRef]
  26. Hellweg, S.; Milà i Canals, L. Emerging approaches, challenges, and opportunities in life cycle assessment. Science 2014, 344, 1109–1113. [Google Scholar] [CrossRef]
  27. Jadhav, Y.; Manjare, S. Assessment of environmental impacts associated with production of breakfast cereal using life cycle assessment: Approach for sustainable development. Environ. Sci. Pollut. Res. 2025, 1–19. [Google Scholar] [CrossRef]
  28. ISO 14040:2006; Environmental management—Life Cycle Assessment—Principles and Framework. International Organization for Standardization: Vernier, Switzerland, 2006.
  29. Intergovernmental Panel on Climate Change. Climate Change 2021: The Physical Science Basis. Contribution of Working Group I to the Sixth Assessment Report of the Intergovernmental Panel on Climate Change; Cambridge University Press: Cambridge, UK, 2021; Available online: https://www.ipcc.ch/report/ar6/wg1/ (accessed on 20 May 2026).
  30. Sher, A.; Li, H.; Ullah, A.; Hamid, Y.; Nasir, B.; Zhang, J. Importance of regenerative agriculture: Climate, soil health, biodiversity, and its socioecological impact. Discov. Sustain. 2024, 5, 462. [Google Scholar] [CrossRef]
  31. Al-Shammary, A.A.G.; Al-Shihmani, L.S.S.; Fernández-Gálvez, J.; Caballero-Calvo, A. Optimizing sustainable agriculture: A comprehensive review of agronomic practices and their impacts on soil attributes. J. Environ. Manag. 2024, 364, 121487. [Google Scholar] [CrossRef] [PubMed]
  32. Wang, L.; Lyu, J.; Zhang, J. Explicating the Role of Agricultural Socialized Services on Chemical Fertilizer Use Reduction: Evidence from China Using a Double Machine Learning Model. Agriculture 2024, 14, 2148. [Google Scholar] [CrossRef]
  33. Frongia, A.; Pulina, A.; Tanda, A.; Seddaiu, G.; Roggero, P.P.; Moreno, G. Assessing the effect of rotational grazing adoption in Iberian silvopastoral systems with Normalized Difference Vegetation Index time series. Ital. J. Agron. 2023, 18, 2185. [Google Scholar] [CrossRef]
  34. Dalmonte, T.; Barbieri, N.B.; Giacomozzi, S.G.; Palmonari, A.; Indio, V.; Vecchio, Y.; Guluzade, G.; Abdullayev, I.A.; Formigoni, A.; Serraino, A.; et al. Use of Feed Additives to Reduce Enteric Methane Emissions in Dairy Cattle: A Meta-Analysis of Data Retrieved Through a Systematic Review. Front. Anim. Sci. 2026, 6, 1754069. [Google Scholar] [CrossRef]
  35. Mandouri, J.; Onat, N.C.; Kucukvar, M.; Jabbar, R.; Al-Quradaghi, S.; Al-Thani, S.; Kazançoğlu, Y. Carbon footprint of food production: A systematic review and meta-analysis. Sci. Rep. 2025, 15, 35630. [Google Scholar] [CrossRef]
  36. Tadiello, T.; Arellano Vazquez, D.A.; Millar, N.; Cammarata, M.; Oliviero, G.; Sharma, P.; Gallo, M.; Del Borghi, A.; Basso, B. Regenerative practices reduce global warming impact and intensity of maize systems in north-central Italy. Agric. Syst. 2026, 233, 104587. [Google Scholar] [CrossRef]
  37. Ahmed, H.; Al-Faraj, A.; Abdel-Ghany, A. Shading greenhouses to improve the microclimate, energy and water saving in hot regions: A review. Sci. Hortic. 2016, 201, 36–45. [Google Scholar] [CrossRef]
  38. Tan, S.S.X.; Kuebbing, S.E. A synthesis of the effect of regenerative agriculture on soil carbon sequestration in Southeast Asian croplands. Agric. Ecosyst. Environ. 2023, 349, 108450. [Google Scholar] [CrossRef]
  39. Kheiralipour, K.; Brandão, M.; Holka, M.; Choryński, A. A Review of Environmental Impacts of Wheat Production in Different Agrotechnical Systems. Resources 2024, 13, 93. [Google Scholar] [CrossRef]
  40. Tinghäll Nilsson, U.; Lönnerdal, B.; Hernell, O.; Kvistgaard, A.S.; Jacobsen, L.N.; Karlsland Åkeson, P. Low-protein infant formula enriched with alpha-lactalbumin during early infancy may reduce insulin resistance at 12 months: A follow-up of a randomized controlled trial. Nutrients 2024, 16, 1026. [Google Scholar] [CrossRef]
  41. Nemecek, T.; Roesch, A.; Bystricky, M.; Jeanneret, P.; Lansche, J.; Stüssi, M.; Gaillard, G. Swiss Agricultural Life Cycle Assessment: A method to assess the emissions and environmental impacts of agricultural systems and products. Int. J. Life Cycle Assess. 2024, 29, 433–455. [Google Scholar] [CrossRef]
  42. Furszyfer Del Rio, D.D.; Sovacool, B.K.; Griffiths, S.; Bazilian, M.; Kim, J.; Foley, A.M.; Rooney, D. Decarbonizing the pulp and paper industry: A critical and systematic review of sociotechnical developments and policy options. Renew. Sustain. Energy Rev. 2022, 167, 112706. [Google Scholar] [CrossRef]
  43. Wang, S.; Liu, Q.; Li, J.; Wang, Z. Methane in wastewater treatment plants: Status, characteristics, and bioconversion feasibility by methane oxidizing bacteria for high value-added chemicals production and wastewater treatment. Water Res. 2021, 198, 117122. [Google Scholar] [CrossRef] [PubMed]
  44. Hemachandra, S.; Hadjikakou, M.; Pettigrew, S. A scoping review of food packaging life cycle assessments that account for packaging-related food waste. Int. J. Life Cycle Assess. 2024, 29, 1899–1915. [Google Scholar] [CrossRef]
  45. Oloruntobi, O.; Mokhtar, K.; Rozar, N.M.; Gohari, A.; Asif, S.; Chuah, L.F. Effective technologies and practices for reducing pollution in warehouses—A review. Clean. Eng. Technol. 2023, 13, 100622. [Google Scholar] [CrossRef]
  46. Souza, D.T.; Paim, F.A.P.; Nogueira Júnior, L.R.; Ronquim, C.C.; Cavalcante Filho, P.G. Carbon pricing in agriculture: A systematic literature review. Rev. Econ. Sociol. Rural 2025, 63, e288293. [Google Scholar] [CrossRef]
  47. Nordahl, S.L.; Scown, C.D. Recommendations for life-cycle assessment of recyclable plastics in a circular economy. Chem. Sci. 2024, 15, 9397–9407. [Google Scholar] [CrossRef]
  48. Kaack, L.H.; Vaishnav, P.; Morgan, M.G.; Azevedo, I.L.; Rai, S. Decarbonizing intraregional freight systems with a focus on modal shift. Environ. Res. Lett. 2018, 13, 083001. [Google Scholar] [CrossRef]
  49. Brahema, S.; Favia, C.; Favi, C. LCA comparison of freestanding kitchens adopting three technologies: Electric, gas and induction. Procedia CIRP 2025, 135, 101–105. [Google Scholar] [CrossRef]
  50. França, W.T.; Barros, M.V.; Salvador, R.; de Francisco, A.C.; Moreira, M.T.; Piekarski, C.M. Integrating life cycle assessment and life cycle cost: A review of environmental-economic studies. Int. J. Life Cycle Assess. 2021, 26, 244–274. [Google Scholar] [CrossRef]
  51. El Haouat, Z.; Essalih, S.; Bennouna, F.; Amegouz, D. Development of a Global Framework for an Integrated Life Cycle Assessment (LCA) Model in Quality, Safety and Environmental (QSE) Management Systems: Improving Environmental, Social and Economic Sustainability Performance. Sustainability 2025, 17, 3521. [Google Scholar] [CrossRef]
  52. GHG Protocol. Corporate Value Chain (Scope 3) Accounting and Reporting Standard. 2011. Available online: https://ghgprotocol.org/corporate-value-chain-scope-3-standard (accessed on 20 May 2026).
  53. European Commission, Joint Research Centre. European Platform on Life Cycle Assessment (EPLCA)—Methodological Guidance Linking LCA with Product Performance and Regulatory Frameworks. 2005. Available online: https://eplca.jrc.ec.europa.eu (accessed on 20 May 2026).
  54. Gruber, L.M.; Brandstetter, C.P.; Bos, U.; Lindner, J.P.; Albrecht, S. LCA study of unconsumed food and the influence of consumer behavior. Int. J. Life Cycle Assess. 2016, 21, 773–784. [Google Scholar] [CrossRef]
  55. Daignault, J.; Wallace, C.; Watkins, D.; Handler, R.H.; Yang, Y.; Heaney, D. A household-scale life cycle assessment model for understanding the food–energy–water nexus. Front. Environ. Sci. 2023, 11, 1059301. [Google Scholar] [CrossRef]
  56. World Health Organization. Food Safety. 2024. Available online: https://www.who.int/news-room/fact-sheets/detail/food-safety (accessed on 20 May 2026).
  57. Marques, C.; Güneş, S.; Vilela, A.; Gomes, R. Life-cycle assessment in agri-food systems: A circular economy perspective. Foods 2025, 14, 1553. [Google Scholar] [CrossRef] [PubMed]
Figure 1. Percentage contribution of life cycle stages to total cradle-to-grave greenhouse gas emissions (functional unit: 1 kg CERELAC® consumed).
Sustainability 18 05384 g001
Disclaimer/Publisher’s Note: The statements, opinions and data contained in all publications are solely those of the individual author(s) and contributor(s) and not of MDPI and/or the editor(s). MDPI and/or the editor(s) disclaim responsibility for any injury to people or property resulting from any ideas, methods, instructions or products referred to in the content.