Article

Effect of Fly Ash Content and Aggregate Type on Concrete Mechanical, Durability, and Environmental Performance


1
Department of Civil Engineering, Bursa Uludag University, Nilufer, 16059 Bursa, Türkiye
2
Department of Civil Engineering, University of Ottawa, Ottawa, ON K1H 8M5, Canada
*
Author to whom correspondence should be addressed.
Sustainability 2026, 18(11), 5386; https://doi.org/10.3390/su18115386
Submission received: 24 March 2026 / Revised: 13 May 2026 / Accepted: 21 May 2026 / Published: 27 May 2026

Abstract

This study investigates the influence of fly ash (FA) content and aggregate type on the mechanical performance and environmental efficiency of concrete. Twelve concrete mixtures were prepared using limestone and basalt aggregates, with FA replacement levels of 0%, 15%, and 35% and water-to-binder (w/b) ratios of 0.4 and 0.7. Compressive strength (CS), the modulus of elasticity (MoE), water absorption, and freeze–thaw resistance were measured. Basalt aggregates enhanced the CS and MoE while reducing water absorption and freeze–thaw deterioration compared to limestone. Although a higher FA content lowered early-age strength and stiffness, it contributed to long-term improvements and greater eco-efficiency. A new MoE prediction model incorporating CS, unit weight, aggregate type, and FA content demonstrated better accuracy than current standards. Assessment of binder usage and CO2 intensity confirmed that all mixtures remained below the average literature values. The optimal combination was achieved with basalt aggregates, a high FA content, a low w/b ratio, and extended curing, highlighting strategies for sustainable concrete production.

1. Introduction

The mechanical performance and durability of concrete depend on the complex interaction of numerous parameters involved in the mix design [1]. Although the effects of water/cement ratio, aggregate type, and mineral admixtures on compressive strength and the modulus of elasticity are widely discussed in the literature [2,3,4,5,6], data examining the simultaneous effects of fly ash and aggregate type at different water/cement ratios are still insufficient. In the literature, the effects of fly ash content and aggregate type on concrete properties have mostly been studied separately. However, studies that evaluate these two parameters together under different water/cement ratios are limited. In particular, the interaction between aggregate mineralogy and pozzolanic additives at low and high water/cement ratios, in terms of both mechanical and strength properties, has not been comprehensively addressed. Most existing estimation models primarily rely on compressive strength, while they fail to adequately account for the combined influence of aggregate mineralogy, unit weight, and pozzolanic additives. This approach is limited in accurately capturing the variations in the modulus of elasticity observed in concretes with similar compressive strengths but different aggregate types. Therefore, more comprehensive models that consider the multi-phase nature of concrete and the interactions among its components are required. Research on the connection between mechanical qualities and concrete design has been ongoing for many years [7,8,9,10,11,12]. It is acknowledged that the compressive strength (CS) of concrete influences its modulus of elasticity (MoE). However, because concrete has a multi-phase and porous structure, it has been highlighted that this relationship is quite complex [13]. The CS of concrete and its MoE have formed numerous relationships. The connections suggested by ACI 318-02 [14], CEB-FIP [15], and TS500 [16] are frequently utilized. These relationships make it clear that, although it is not precise, the MoE rises in proportion to the square or cubic root of the CS. In order to obtain the MoE from the strength values, it is necessary to use the coefficients in the relations. The static elastic modulus of concrete can be determined using four approaches: the initial tangent modulus, the tangent modulus, the secant modulus, and the chord modulus. In certain instances, the initial portion of the stress–strain response of concrete specimens may appear concave. As a result, the chord modulus is generally considered a more appropriate option for evaluating the static elastic modulus of concrete [17]. In this method, the elastic modulus is defined as the slope of a straight line connecting two points on the stress–strain curve. Specifically, the chord modulus refers to the gradient of the line drawn from a strain level of 5 × 10⁻⁵ to the point corresponding to 40% of the material’s ultimate strength. Apart from experimental methods, most proposed equations for determining the modulus of elasticity (MoE) typically do not consider the type of aggregate. Nevertheless, the strength and MoE of concrete mixtures are influenced by experimental conditions [18], the properties of the cement paste [19], the cement–aggregate interface [20], and, most importantly, the characteristics of the aggregates [13,19,20,21,22,23,24].
Studies have highlighted that aggregate properties have a greater impact on the compressive strength (CS) and modulus of elasticity (MoE) of concrete when the concrete has a low water-to-binder (w/b) ratio and high strength [21]. In high-strength concrete, the hardness of the aggregate influences concrete properties more significantly than the aggregate’s strength [20]. The strength of concrete mixtures is directly influenced by the strength of the aggregates used. Moreover, concrete samples with the same compressive strength (CS) but made from different aggregates can exhibit varying modulus of elasticity (MoE) values [25]. Variations in aggregate particle size distribution affect the strength properties, MoE and freeze–thaw resistance of concrete samples [26,27]. In concrete mixtures with a low water-to-binder (w/b) ratio, research has shown that compressive strength (CS) generally decreases as the maximum aggregate size increases. This trend is primarily due to the formation of denser microcracks and more critical interfacial transition zones in the confined areas created by larger aggregates within low w/b cement pastes. These results indicate that the negative effect of aggregate size becomes more pronounced as both the quality of the cement paste and the aggregate size increase [28]. Test conditions have been shown to have a significant impact. For multi-phase materials like concrete, the modulus of elasticity (MoE) or stiffness depends on the volume fraction, density, and MoE of the constituent components (cement paste and aggregates), as well as the volume of voids and microcracks. The durability of concrete under freeze–thaw cycles is affected by factors such as the structure, number, size, arrangement, and connectivity of internal voids [29], the volume of freezable water, the water-to-cement ratio, curing conditions, and the tensile strength of the concrete. Porosity plays a central role in linking the mechanical properties of concrete, including compressive strength (CS) and the modulus of elasticity (MoE). Studies indicate that the MoE of concrete generally increases with age, and reducing porosity in the concrete matrix typically enhances the MoE [30,31]. Additionally, the type of aggregate has a notable impact on the elastic response of concrete, especially at early ages such as 14 days [20]. Research has shown that the MoE is influenced by multiple factors, including the mixture proportions, aggregate characteristics, cement paste properties, water-to-cement ratio, air content, pozzolanic material content, and degree of hydration [30,31]. Supplementary cementitious materials, such as fly ash, are commonly used to lower production costs while improving the mechanical and physical performance of concrete composites [32,33,34,35,36,37,38,39]. Many studies have examined the effects of aggregate type and fly ash content on both the compressive strength and static modulus of elasticity of concrete [40,41,42,43,44,45,46,47,48]. According to the research carried out by Góra et al. [19], six types of aggregates (including basalt, granite, granodiorite, dolomite, quartzite, and gravel) were analyzed in terms of characteristics that influence the strength properties of concrete. Findings from the study revealed a strong relationship (r = 0.92) between aggregate strength and the MoE of concrete. On the other hand, this relationship was found to be moderate (r = 0.64) in the case of CS, suggesting that CS has a limited impact on the MoE. Moreover, the results showed that basalt aggregate exhibited the highest strength, while the granite aggregate demonstrated the lowest resistance. In a study performed by Kılıç et al. [49] using gabbro, basalt, quartzite, limestone, and sandstone aggregate types, the CS of concrete mixtures was parallel to the uniaxial CS of the aggregate used in the concrete mixtures. In a study conducted by [50], it was stated that basalt is one of the most preferred natural stones in today’s construction sector and transportation infrastructure due to its quality and long lifespan. In a study conducted by Ubi et al. [51], the effect of using basalt and granite aggregates on the performance of concrete mixtures was investigated. As a result, it was determined that basalt aggregate is a more suitable coarse aggregate for achieving higher strength with a certain amount of other components of the concrete mix compared to granite. In a study by Zhang et al. [52], it was reported that when the basalt substitution rate was increased from 50% to 100%, the cubic compressive strength and elastic modulus decreased by approximately 9.07% and 9.87%, respectively. In a study by Li et al. [53], the effect of the fly ash substitution ratio on the porosity, water permeability coefficient, abrasion resistance, compressive strength, stress–strain curve, and microstructure of the mixtures was investigated. As a result, it was determined that the use of fly ash and basalt fiber improved the strength and ductility. When the fly ash substitution ratio was 6% and the basalt fiber content was 4 kg/m3, the compressive strength was highest at 24.3 MPa, the abrasion resistance was best, and the mass loss ratio was 6.66%.
Shah and Ahmad found that increasing the maximum aggregate size results in a higher MoE [54]. Beushausen H. et al. [20] observed that aggregate type and hardness have a high effect on the MoE of concrete mixtures. It has been stated that mixtures produced using hard aggregates have a higher MoE. A similar result has been reported by other researchers [55]. The effect of aggregate specific gravity on the MoE of concrete mixtures was investigated by Yazdani et al. [24]. For this purpose, three series of concrete mixtures were prepared by utilization of Calera limestone aggregate, Brooksville limestone aggregate and stream gravel having a specific gravity of 2.72, 2.43 and 2.63, respectively. Test results demonstrated that the modulus of elasticity of concrete mixtures containing the Calera limestone aggregate with the highest specific gravity was higher than that of the other ones. Karahan and Atiş [56] explained that the CS decreased and the water absorption values increased with the increase in fly ash content of the concrete mixtures. It has been indicated that the MoE of concrete decreases but its CS increases over time [54]. A study conducted by Wu et al. [57] explored how different types of coarse aggregates affect compressive strength (CS), splitting tensile strength, fracture energy, and the modulus of elasticity (MoE) in concrete. In this research, crushed forms of quartzite, granite, limestone, and marble were selected as coarse aggregate materials. When the water-to-cement ratio is kept constant, the mechanical properties of concrete—such as strength, stiffness, and fracture energy—are found to be strongly impacted by the kind of aggregate used, especially in high-performance concretes. Furthermore, selecting coarse aggregates that combine high strength with low brittleness contributes to the production of high-strength concrete exhibiting improved toughness. Binici et al. [58] conducted a study examining how the use of basalt aggregate in both powdered and sand forms influences the durability of mixtures under freeze–thaw conditions. The findings revealed that when 40% basalt sand was incorporated as the fine aggregate and 10% basalt powder was used as a binder, the freeze–thaw durability of the concrete mixtures was enhanced. Previous research has investigated the influence of aggregate types and pozzolanic materials on concrete’s compressive strength (CS), modulus of elasticity (MoE), and freeze–thaw resistance. However, studies examining the combined effects of aggregate type and pozzolan content in mixtures with varying water-to-binder (w/b) ratios are limited. Moreover, the impact of mineral admixtures and aggregate characteristics is often neglected in MoE prediction models.
In this experimental study, the effects of fly ash content and aggregate type on CS at 28, 90, and 180 days, static MoE, water absorption, and freeze–thaw durability were evaluated for concrete mixtures with two different w/b ratios. Two aggregate types (limestone and basalt) were used. Based on the experimental results, a new empirical equation was developed to estimate static MoE, incorporating compressive strength, unit weight, type of mineral admixture, and aggregate type. The accuracy of the proposed equation was assessed and compared with existing models using error analysis. The novelty of the present study over the existing literature is the synergistic interaction of specific types of aggregates with the high-volume fly ash using a robust statistical framework. While the effects of these materials are well understood individually, this research fills the gap by establishing highly significant empirical correlations (p < 0.001) between the permeation properties (water absorption) and the static mechanical performance (compressive strength and static modulus of elasticity). The results offer a new level of statistical reliability in predicting the service life and stiffness of sustainable concrete mixes, resulting in a more accurate tool for civil engineering applications than traditional experimental reports. The study also evaluates the eco-efficiency of the mixtures using a binder intensity analysis, which indicates that the optimized combination of fly ash and certain aggregates reduces the environmental footprint per unit of strength. Moreover, the long-term freeze–thaw durability results provide a unique comparative perspective on the role of aggregate mineralogy in improving the pore structure of high-volume fly ash concrete. Together, these results provide a holistic performance-based framework for the design of sustainable and resilient infrastructure.

2. Materials and Methods

2.1. Materials

CEM I 42.5 R type cement in accordance with the EN 197-1 Standard [59] and Type F fly ash in accordance with the EN 450-1 Standard [60] were both supplied by Çimentaş (İzmir, Turkey). The chemical composition and some mechanical and physical properties obtained from the producers of cement and fly ash are given in Table 1 and Table 2, respectively.
Crushed limestone (CL) and basalt (CB) aggregates, supplied by Çimentaş (İzmir, Turkey), were utilized in three different particle size intervals: 0–5 mm, 5–15 mm, and 15–25 mm. Table 3 provides an overview of their physical characteristics. The density and water absorption characteristics of these aggregates were determined following the EN 1097-6 Standard [61].
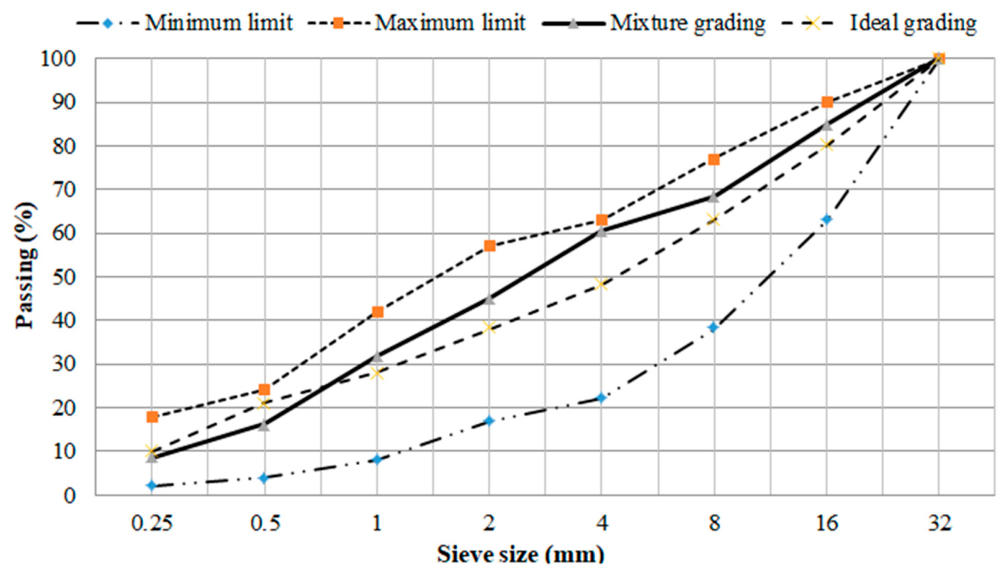
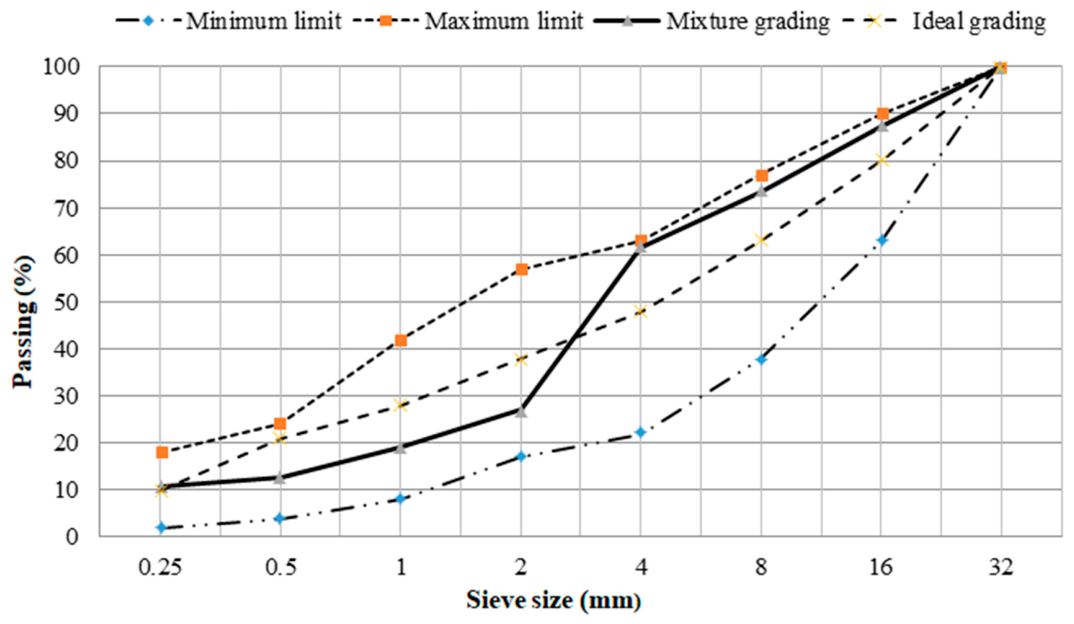
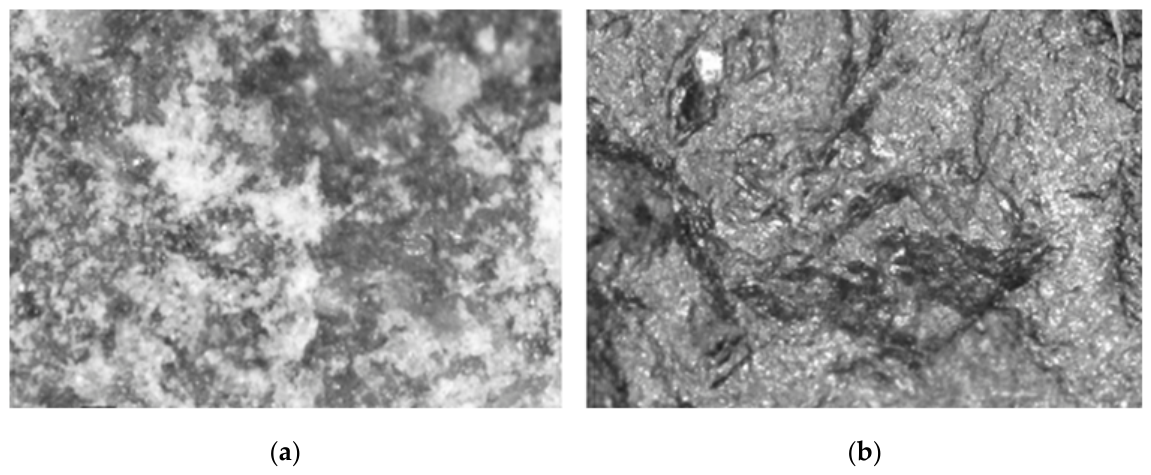
The combined aggregate grading, composed of 60% 0–5 mm, 20% 5–15 mm, and 20% 15–25 mm fractions, along with the relevant standard limits for limestone and basalt aggregates, is illustrated in Figure 1 and Figure 2. A polycarboxylate-based water-reducing admixture, supplied by Draco Construction Chemicals, was used in different proportions to achieve a slump target of 120 ± 20 mm in concrete mixtures. Los Angeles test (in accordance with the EN 1097-2 Standard) [62] results and surface views of the limestone and basalt aggregates used in the experimental study are shown in Table 4 and Figure 3, respectively. Some properties of the admixture given by the manufacturer are shown in Table 5.

2.2. Concrete Mixing Procedures and Mix Proportions

All concrete mixtures were produced using a laboratory-type pan mixer with a capacity of 50 L. The mixing sequence was standardized across all batches to minimize variability. Initially, the fine and coarse aggregates were placed in the mixer and dry-mixed for 1 min to ensure homogeneity. Following this, the binder materials (cement and fly ash) were introduced and mixed with the aggregates for an additional 2 min. The total mixing water, pre-mixed with the required amount of water-reducing admixture, was then gradually added over a period of 30 s while the mixer was in operation. Wet mixing was continued for 3 min. After a resting period of 3 min, the concrete was remixed for a final 2 min prior to discharge.
Immediately after mixing, the slump test was performed in accordance with ASTM C143/C143M [63]. The measured slump values for each mixture are presented in Table 6. The fresh concrete was placed into 150 × 300 mm cylindrical molds in three layers of approximately equal depth. Each layer was consolidated using a tamping rod (25 strokes per layer) and subsequently vibrated on a vibrating table for 10 s to ensure adequate compaction and the removal of entrapped air voids.
Twelve different concrete mixtures were prepared by varying the water-to-binder ratio, aggregate type, and fly ash percentage, in accordance with ACI 211.1-91 [64]. Table 6 presents the material quantities used for producing 1 m3 of each mixture. The naming of the mixtures was carried out based on the type of aggregate, the w/b ratio, and the proportion of fly ash. For instance, a mix made with limestone aggregate, a w/b ratio of 0.4, and no fly ash is labeled as L-0.4-0FA. On the other hand, a mix that includes basalt aggregate, a w/b ratio of 0.7, and 35% fly ash is identified as B-0.7-35FA.
As shown in Table 6, the demand for a water-reducing admixture decreased as expected in order to meet the desired slump when the water-to-cement ratio increased. In mixtures prepared with basalt aggregate, obtaining the target slump required a higher dosage of admixture. According to Figure 3, basalt particles exhibit a rougher texture in comparison to limestone aggregates. This increases the interparticle friction, negatively impacting workability. Consequently, the admixture requirement rises. Independent of both the w/b ratio and aggregate type, a higher fly ash content in the mixture resulted in a reduced demand for the admixture to reach the desired slump level. This reduction became more evident as the fly ash replacement level increased. It is also recognized that the hydration rate of the Type F fly ash employed in this investigation is lower than that of cement.
Fly ash replacement levels of 15% and 35% were selected to represent both typical industrial usage and the upper limits of high-volume fly ash applications, aimed at balancing mechanical performance with enhanced eco-efficiency. These ranges allowed for a clear evaluation of the synergistic effects between aggregate mineralogy and pozzolanic activity under contrasting water-to-binder ratios.
The concrete mixtures produced were placed in 150 × 300 mm cylinder molds in three layers conforming to the standard. The cylindrical samples were demolded after 24 h and kept in water saturated with lime at 23 ± 1.7 °C until the test day.

2.3. Test Methods

2.3.1. Compressive Strength

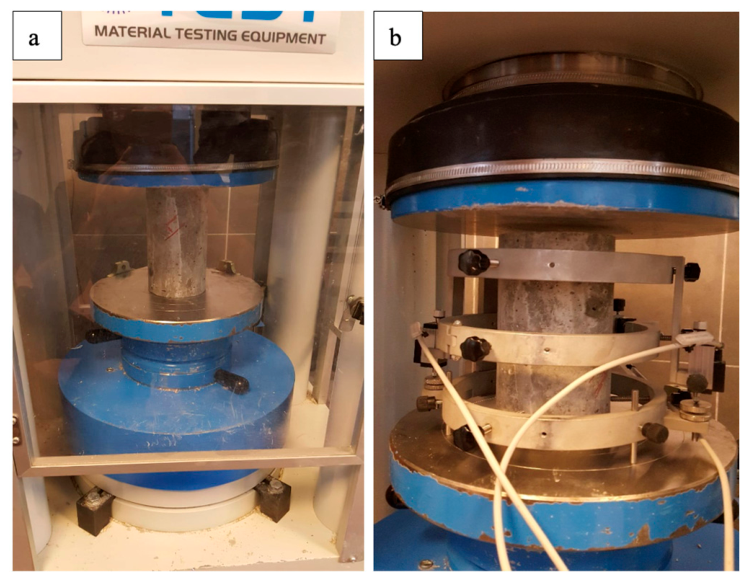
Compressive strength tests were carried out on 150 × 300 mm cylinders using a 3000 kN capacity universal testing machine (UTEST, Material testing equipment, Ankara/TURKEY), following EN 12390-3 [65]. The load was applied at a constant rate between 0.5 and 0.8 MPa/s until failure. Before testing, both ends of each cylinder were capped with a sulfur compound to obtain plane and parallel bearing surfaces. Three cylinders were tested for each mixture at each curing age, and the average value was recorded.

2.3.2. Modulus of Elasticity

The static modulus of elasticity was determined on 150 × 300 mm cylinders in accordance with ASTM C469 [66]. Longitudinal strain was measured over a central gauge length of 150 mm using a compressometer frame fitted with two diametrically opposed linear variable differential transformers (LVDTs) (Figure 4). Each specimen underwent at least two preloading cycles to roughly 40% of the estimated peak load before the actual test. The specimen was then loaded at a steady rate of 0.25 ± 0.05 MPa/s. Load and strain readings were logged continuously. The chord modulus was taken as the slope of the line connecting a strain of 50 × 10−6 to the point at 40% of the failure load. Three specimens were tested per mixture.

2.3.3. Water Absorption Capacity

Water absorption was measured according to TS 3624 [67] using 100 mm diameter by 50 mm thick discs sawn from the middle portion of the original cylinders. The discs were oven-dried at 105 ± 5 °C to constant mass, then weighed (Md). They were then fully submerged in water at 23 ± 2 °C until saturation, defined as two consecutive mass readings differing by less than 0.5%. The saturated surface-dry mass (Mi) was recorded. Water absorption was calculated as [(Mi − Md)/Md] × 100. The result for each mixture is the mean of three separate discs.

2.3.4. Freeze–Thaw Resistance

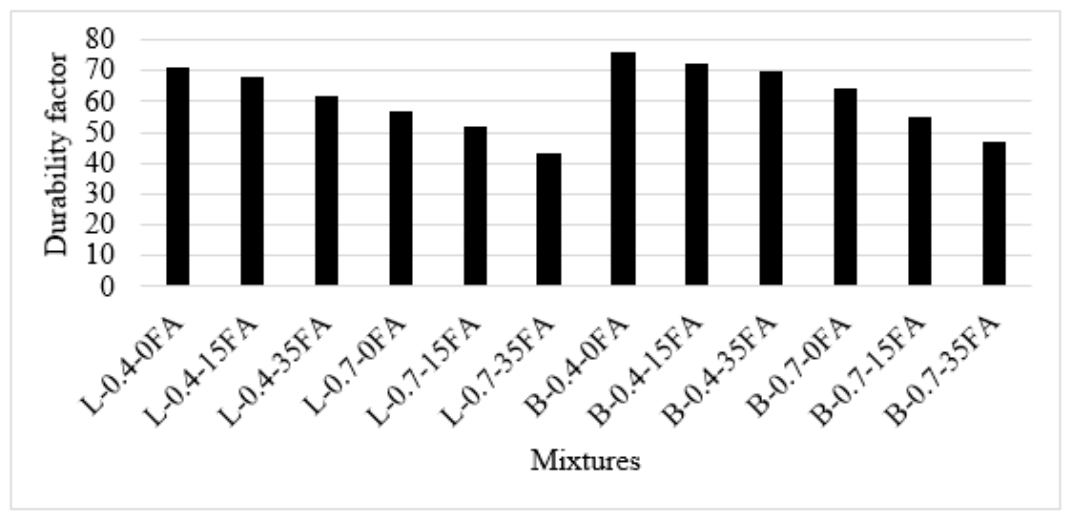
Freeze–thaw testing was performed on 90-day-old 150 × 300 mm cylinders in line with ASTM C666/C666M-03 [68]. An automated freeze–thaw cabinet was used. Each 4 h cycle consisted of a 3 h freezing phase, where the core temperature of a control specimen dropped from 5 ± 2 °C to −18 ± 2 °C in air, followed by a 1 h thawing phase in water at 5 ± 2 °C. Specimens were subjected to 300 cycles. The fundamental transverse frequency of each cylinder was measured periodically using the resonant frequency method (ASTM C215) to compute the dynamic modulus of elasticity. The specimen’s weight loss (W) was calculated using Equation (1) according to TS 3699 [69]. In addition, the durability factor (Df) of concrete mixtures was determined using Equation (2) proposed by Neville [70]. Freeze–thaw testing was performed on three 150 × 300 mm cylinders per mixture. After 300 cycles, some specimens, especially those with lower durability, exhibited surface scaling and cracking. The mean values obtained from the specimens that successfully completed the 300 cycles are reported in Figure 5, Figure 6 and Figure 7.
W = [ ( W 2 W 1 ) W 1 ] × 100
D f = n 3 [ E d n E d 0 ]
Here, W1 represents the initial weight of the specimen before testing, while W2 denotes its weight upon 300 cycles of freezing and thawing (in grams). Edₙ refers to the dynamic modulus of elasticity (MoE) of the concrete measured after completing the 300 cycles (in MPa), and Ed0 is the dynamic MoE at the start of the test (in MPa). According to the classification in [70], a durability factor (Df) below 40 suggests that the concrete is likely unsuitable, values between 40 and 60 imply uncertainty regarding its performance, and values above 60 generally indicate acceptable durability.
Due to the destructive nature of the testing and the completion of the experimental phase, raw replicate data (n = 3) for each mixture were not available for a formal ANOVA. However, results are discussed based on average values and typical measurement variability observed in the literature.
The experimental data obtained through these standardized procedures were subsequently analyzed to evaluate the synergistic effects of aggregate type and fly ash content, as detailed in the following section.

3. Test Results and Discussion

Following the methodologies described in the previous section, the mechanical and durability performances of the twelve concrete mixtures were determined.

3.1. Results of Compressive Strength and Elastic Modulus of Concrete Samples

Table 7 presents the 28-, 90- and 180-day CS and MoE values of the concrete samples. The CS and MoE of the concrete mixtures increase over time, regardless of the aggregate type. Values represent the mean of three measurements. Statistical significance was estimated based on typical experimental error ranges. The CS and MoE of the concrete mixture were close to the control mixture for the 180-day samples. This behavior can also be attributed to the low-calcium nature of the fly ash used in this study, which exhibits slower pozzolanic reaction kinetics [71]. Due to its low CaO content, strength development at early ages is limited. However, continued pozzolanic reactions at later ages contribute to additional C–S–H formation, resulting in improved long-term mechanical properties [72]. Similarly, a study by Siddique et al. [73] showed that the values at 28 days of age showed improved values depending on the fly ash content, and the improvement in mechanical properties continued up to 365 days. In a study conducted by Islam et al. [74], a 365-day examination of concrete classes (M28, M33, and M38) and fly ash ratios revealed that the rate of increase in strength increased as the concrete class increased. Accordingly, it was stated that fly ash substitution (10–40%) increased the strength by 2% to 20% compared to OPC concrete after 365 days of curing.
It is understood that this increase is higher in the mixtures containing basalt aggregate. In addition, the CS results were affected more by the increase in the sample age. Regardless of the aggregate type, with the increase in the w/b ratio from 0.4 to 0.7, the CS of the mixtures decreased by 42–49% and the MoE decreased by 20–32%. The CS and MoE of the concrete mixtures containing basalt aggregate were higher than the mixtures containing limestone aggregate at all ages. Based on the observed mean values, the use of basalt aggregate instead of limestone aggregate showed an experimental tendency toward an increase in CS of 8–31% and an increase in MoE of 4–22%; however, formal statistical significance was not confirmed due to the absence of raw replicate data. Considering the typical coefficient of variation (COV) of 2–5% accepted by RILEM and ASTM for hardened concrete tests, the observed 8–31% difference between basalt and limestone mixtures is well above this experimental error margin, representing a significant experimental tendency. This situation is thought to be due to basalt aggregate being harder and denser than limestone aggregate. Similar statements have been reported by other researchers [19]. As can be seen from Table 4, the abrasion resistance of basalt aggregate in Los Angeles was 31% higher than limestone aggregate. It is also understood from Table 3 that the water absorption rate of basalt aggregate is lower than limestone aggregate and that the loose bulk density value is higher. These are indicators that basalt aggregate has a denser structure. Another parameter affecting the mechanical properties of concrete is the roughness of the aggregate surface [75]. As can be seen from Figure 3, basalt aggregate has a rougher surface than limestone aggregate. The rough surface of the aggregate is hypothesized to enhance the aggregate–paste interface to be stronger [76]. This potentially leads to a reduction in the void volume, although microstructural confirmation is required. Depending on these two positive parameters, the mixture containing basalt aggregate performed better in terms of the CS and MoE. This effect was more pronounced in concretes with low w/b ratios. Since the matrix and aggregate–paste interface phases are strong in concrete mixtures with a low w/b ratio, fractures occurring as a result of loading take place in the aggregate phase [22]. In such a case, the effect of the aggregate property parameter on the strength and MoE becomes more obvious. Regardless of the w/b ratio and aggregate type, decreases in CS and MoE were measured by adding fly ash to the mixture. This decrease is more evident with the increase in the usage ratio of fly ash. However, the difference between the CS and MoE decreased over time. This situation can be explained by the physico-chemical effect of fly ash [77]. Since the fly ash used has higher Blaine fineness compared to cement (Table 2), it is considered to potentially contribute to the physical filling of voids in concrete, consistent with the filler effect hypothesis [78]. From a chemical standpoint, the pozzolanic reaction converts calcium hydroxide (CH) into calcium silicate hydrate (C-S-H), which is expected to contribute to a denser matrix and a more robust bond at the interface, consistent with the observed mechanical performance [79]. It is known that the pozzolanic reaction that fly ash shows due to its fineness takes a longer time [80]. The CS and MoE of the concrete mixture were close to the control mixture for the 180-day samples. This effect was more pronounced as a result of the higher amount of binder in mixtures with a lower w/b ratio. With the increase in the rate of fly ash, the most affected property of the concrete mixtures is the CS. The reduction in CS with the use of fly ash is between 15 and 31% in mixtures with limestone aggregates and 8 and 33% in mixtures containing basalt aggregate. This decrease is 4–19% and 5–16% for the MoE values of the concrete mixtures containing limestone and basalt aggregate, respectively. With the increase in the use of fly ash, the most significant change in the CS and MoE was found to be in the mixture containing basalt aggregate with a w/b ratio of 0.7 and limestone with a w/b ratio of 0.4, respectively.
In mixtures with a low w/b ratio, aggregate type is a more effective parameter on the CS and MoE of the mixtures compared to the fly ash content. The opposite was observed in mixtures prepared with high w/b ratios.

3.1.1. 28-Day CS–MoE Relationship of Concrete Mixtures Containing Limestone and Basalt Aggregate

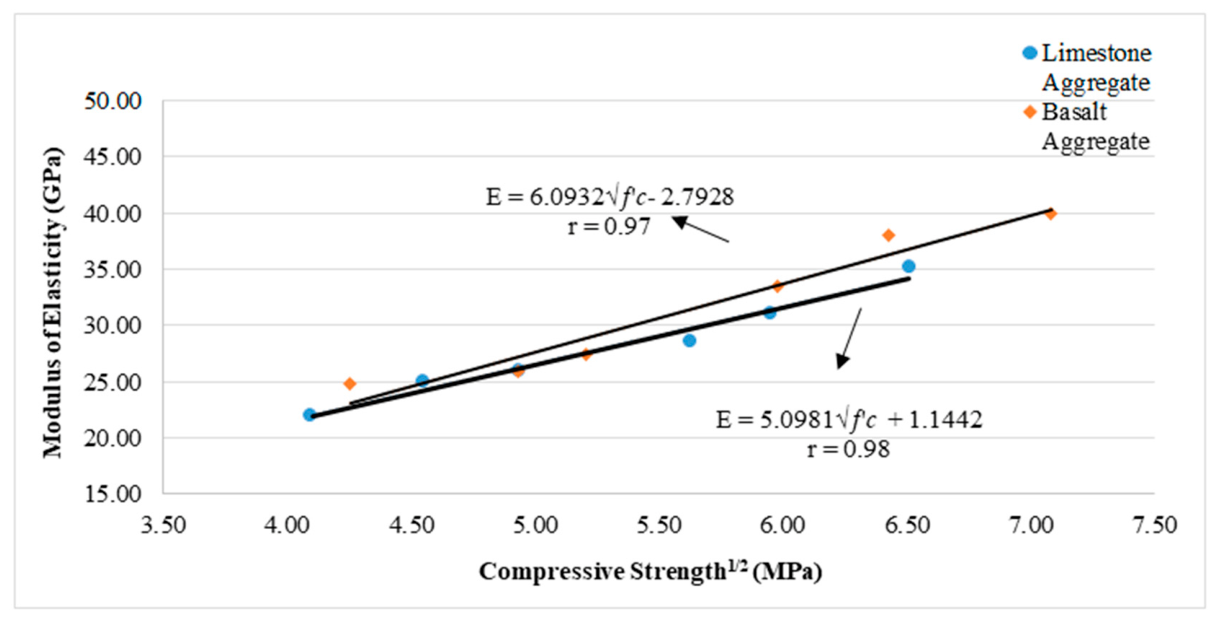
The relationship between the CS and static MoE of the 28-day concrete samples is presented in Figure 5. As expected, there is a strong positive linear relationship between the CS and the MoE of the concrete samples regardless of the type of aggregate. It is understood from Figure 5 that this correlation is stronger in mixtures containing limestone aggregate (r = 0.98) compared to mixtures containing basalt aggregate (r = 0.97).

3.1.2. Comparison of the Static MoE Obtained Within the Scope of Experimental Study with the Correlations of ACI 318-02 and CEB-FIP Model Code

The MoE values of concrete mixtures containing different aggregate types and pozzolans obtained by using equations from different classifications (ACI 318-02 [14] and CEB-FIP Model Code [15], TS500 [16] etc.) were compared with the values obtained as a result of experimental study. The relationships proposed by standards for predicting the MoE of normal concrete are shown in Table 8.
E shows the 28-day MoE (MPa) of concrete, f c is the characteristic CS (MPa) of concrete, γ is the unit weight of concrete (t/m3), and ε0 is the unit strain of concrete at fracture.
Within the scope of this study, a relationship between CS and MoE was obtained for concrete mixtures containing different aggregate types and different rates of fly ash.
The elasticity modules of concrete mixtures obtained experimentally within the scope of this study have a linear correlation with the CS and unit volume weight values of the samples. Equation (3) created in this context is shown below.
E = k 1 k 2 × 0.4744 × γ × ( f c ) 5 / 6 + 10.909   ( GPa )
Depending on the type of aggregate used, the coefficient k1 in the equation was taken as 0.955 for basalt and 0.938 for limestone aggregates. Furthermore, fly ash-containing mixtures exhibited a higher modulus of elasticity (MoE) than the control group. Accordingly, the coefficient k2 was assigned values of 1.04 and 1, corresponding to the presence and absence of fly ash in the mix, respectively.
As presented in Table 9, Equation (3), developed within the framework of this study for estimating the MoE of normal-strength concrete, yielded the highest precision with a mean absolute percentage error of 2.49%. In contrast, the FHWA correlation resulted in the lowest accuracy, showing an error rate of 29.52%. The errors associated with ACI 318-02 [14], CEB-FIP [15], and TS500 [16] equations, which are widely accepted for calculating the modulus of elasticity, were determined as 8.26%, 12.69%, and 10.86%, respectively. Moreover, the correlation proposed in this study demonstrated the strongest agreement with experimental data (r = 0.987), while the weakest correlation was obtained from the JASS5 model [85] (r = 0.708). Among the other models, ACI 318-02 [14] showed a higher correlation (r = 0.980) compared to TS500 [16] (r = 0.969) and the CEB-FIP model [15] (r = 0.787). It should be noted that the reported accuracy represents a tailored empirical relationship for the materials investigated, rather than a generalized predictive tool. The generalizability of the proposed equation is limited by the current dataset of 12 mixtures, and its validation against broader independent datasets remains a subject for future research.
Based on Table 9, the MoE values calculated using Equation (3) proposed in this research closely matched those obtained from the ACI 318-02 [14] Standard. The results also indicated that the MoE values estimated through the CEB-FIP model [15], based on 28-day compressive strength tests, were notably lower for limestone mixtures and higher for basalt mixtures when compared to the other two models. These findings suggest that the ACI 318-02 [14] formula can effectively predict the MoE of normal-weight concrete incorporating fly ash at proportions similar to those evaluated in this study.
A detailed comparison between the experimentally measured 28-day modulus of elasticity values and those calculated using Equation (3) and other selected models is presented in Appendix A (Table A1).

3.2. Water Absorption

The 28-, 90- and 180-day water absorption capacity values of the mixtures are given in Table 10. As anticipated, lowering the w/b ratio led to a reduction in the water absorption capacity of the mixtures, independent of the aggregate type and fly ash content. With the change in the w/b ratio and aggregate type, the most affected property of concrete mixtures was the water absorption capacity. As the w/b ratio of the mixtures increased from 0.4 to 0.7, the water absorption values increased by 140–227%. This phenomenon was more pronounced in the limestone aggregate mixture containing 35% fly ash. The water absorption capacity of the mixtures containing basalt aggregate was lower compared to the limestone aggregate mixture. The water absorption values of the basalt aggregate mixtures were measured 10–37% lower than the limestone aggregate mixture. The influence of aggregate type on water absorption was more evident in the mix containing 35% fly ash with a water-to-binder ratio of 0.7. This is likely due to the inherently lower water absorption capacity of basalt aggregate, as previously mentioned. Furthermore, the rougher texture of basalt is thought to improve the bond at the interface, which may result in a reduction in void content. The incorporation of fly ash generally led to an increase in water absorption; however, the magnitude of this increase was found to be highly dependent on the water-to-binder ratio, aggregate type, and curing age. For mixtures with a low w/b ratio and basalt aggregate, the effect of fly ash on water absorption was minimal. For example, at 180 days, the water absorption of B-0.4-35FA (1.59%) was only 0.06% higher than that of the control mixture B-0.4-0FA (1.53%). Considering the typical coefficient of variation (2–5%) associated with water absorption measurements for hardened concrete, this small difference is likely within the range of experimental error. In contrast, for mixtures with a high w/b ratio and limestone aggregate, the increase in water absorption due to fly ash replacement was substantial and clearly beyond measurement uncertainty (e.g., L-0.7-0FA: 5.57% vs. L-0.7-35FA: 5.85% at 180 days). Similar observations have been reported in earlier research [96,97]. Conversely, other studies in the literature suggest that fly ash can reduce water absorption by physically filling the internal pores [98,99]. The apparent contradiction may be attributed to differences in fly ash fineness and mixture composition. Over time, the mixtures incorporating fly ash exhibited a decline in water absorption, which can be explained by the pozzolanic reaction leading to a denser microstructure [96]. This reduction in water absorption became more significant with age, especially in mixtures made with limestone aggregates.
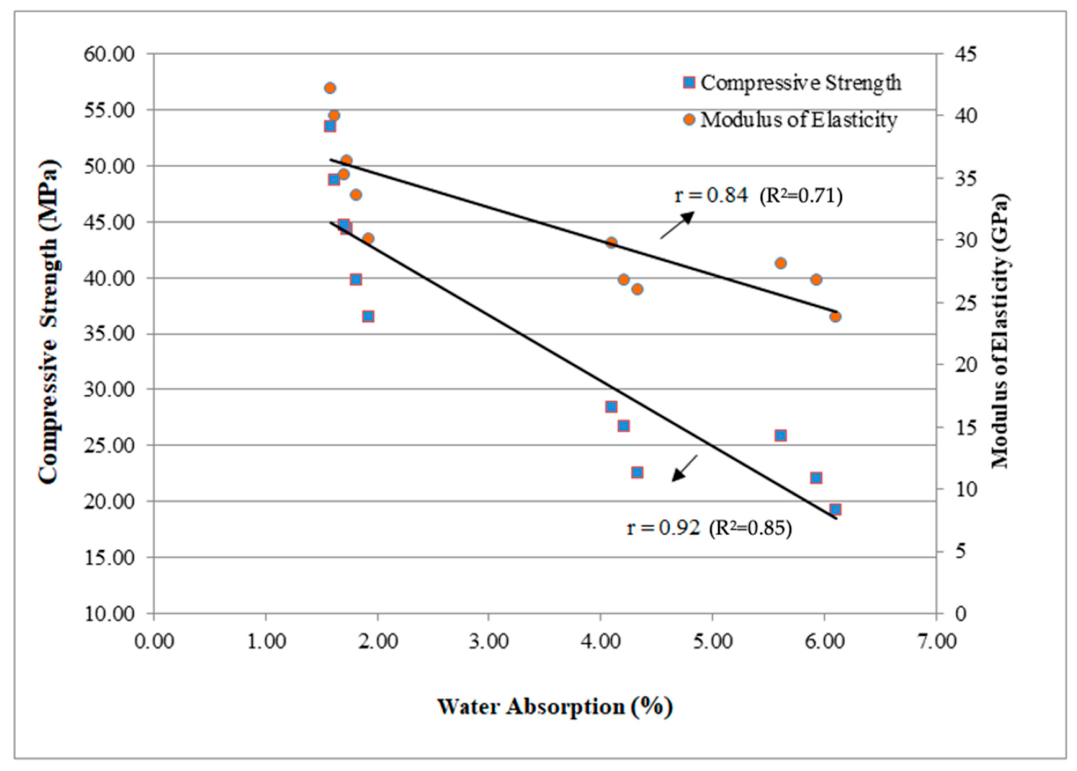
Figure 6 presents the correlation between 90-day water absorption, compressive strength, and the modulus of elasticity (MoE). A strong linear relationship was observed between water absorption and both CS and MoE values of the concrete mixtures, with the correlation being more robust in the case of compressive strength.
The relationship between water absorption and mechanical properties (compressive strength and modulus of elasticity) was evaluated using Pearson correlation analysis (Figure 6). The correlation coefficients (r) were 0.92 and 0.84, respectively. The significance test for a sample size n = 12 was used to check the reliability of these correlations. The calculated p-values were 0.00002 for compressive strength and 0.0006 for the modulus of elasticity (p <0.001), indicating that the observed correlations are statistically highly significant. The points show little scatter, and this is attributed to the nature of concrete and the surface properties of the different types of aggregates used in this study.
Values represent the means of three replicate measurements. The typical standard deviation for water absorption tests of hardened concrete ranges from 0.04% to 0.08% (COV ≈ 2–5%). Therefore, differences smaller than approximately 0.10% should be considered within experimental error.

3.3. Freeze–Thaw Resistance

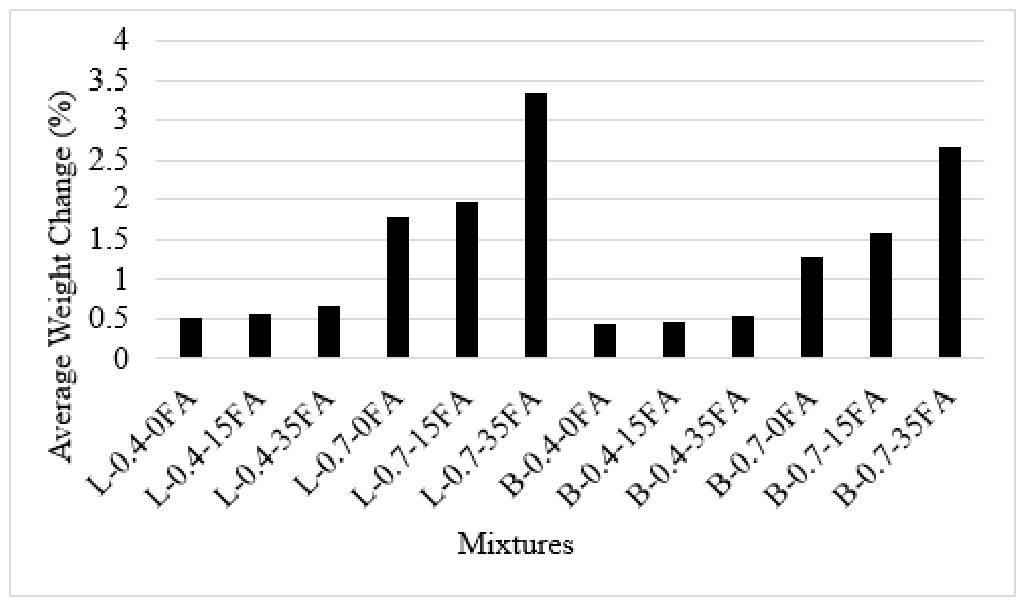
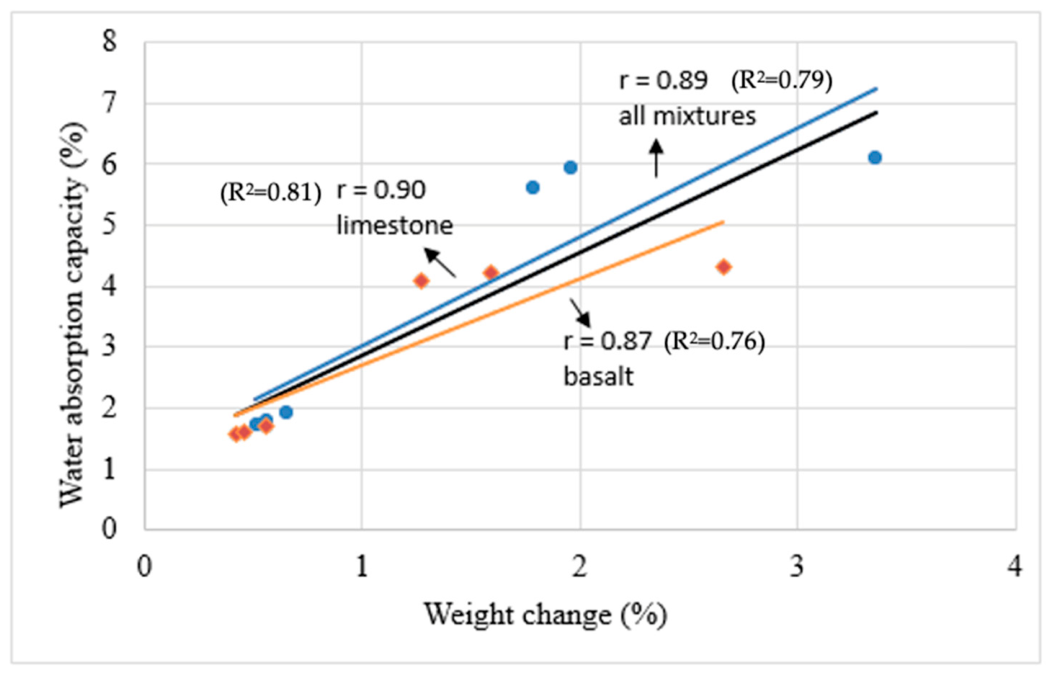
Changes in weight, CS losses, the relationship between water absorption capacity and weight variation, and the durability performance of concrete mixtures subjected to 300 freeze–thaw cycles are presented in Figure 7, Figure 8 and Figure 9. The results represent the mean of three separate measurements.
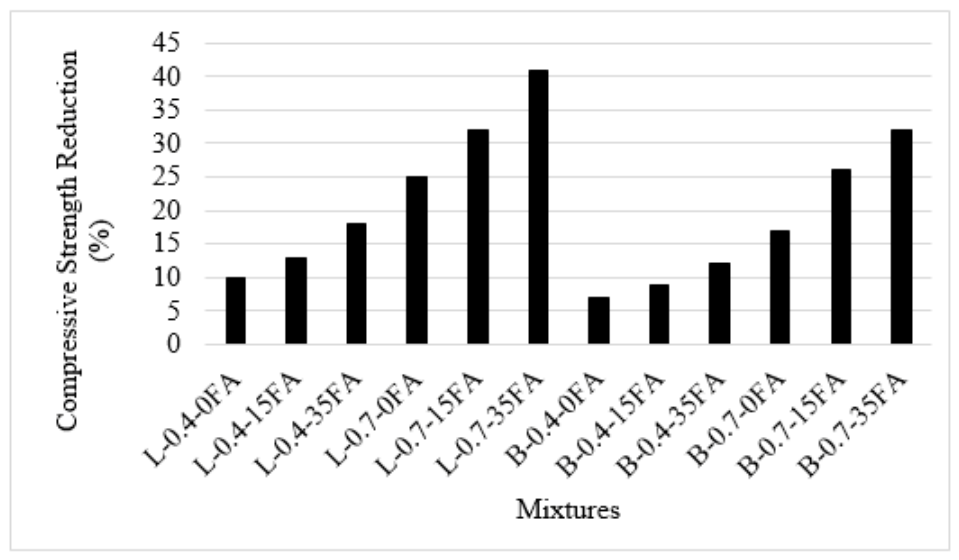
As illustrated in Figure 7 and Figure 8, both the weight and compressive strength of all mixtures showed a reduction after undergoing 300 freeze–thaw cycles. Regardless of the water-to-binder ratio or fly ash amount, mixtures made with limestone aggregate experienced more weight loss than those with basalt aggregate. This suggests that limestone-based mixes absorb greater amounts of water and are more susceptible to damage from freeze–thaw action. As anticipated, a strong correlation (r = 0.89) was observed between the 90-day water absorption values and the weight loss of concrete exposed to 300 freeze–thaw cycles (Figure 9). This correlation was slightly lower in basalt aggregate mixtures (r = 0.87) compared to those made with limestone (r = 0.90), likely due to the more compact and rigid structure of basalt particles. Additionally, weight loss increased as the water-to-binder ratio rose, independent of the aggregate type used. This effect is potentially associated with the likelihood that an increase in the w/b ratio leads to a higher number and volume of capillary pores, which is the main cause of internal pressure during freezing [100]. This situation became clearer with the increase in the amount of fly ash. However, the low weight change of mixtures containing basalt aggregate is thought to be due to the hard structure of basalt.
It was found that compressive strength (CS) losses upon 300 cycles of freezing and thawing ranged from 10% to 41% in limestone-containing mixtures and from 7% to 32% in those made with basalt aggregate. The superior freeze–thaw resistance of concrete with basalt aggregates can be attributed to the rough texture of basalt, which is hypothesized to enhance bonding and potentially reduce capillary porosity, although pore network analysis was not performed [54]. Furthermore, the degradation was further accelerated with higher incorporated levels of fly ash, and the compressive strength losses after the freeze–thaw cycles were more pronounced.
The influence of aggregate type on freeze–thaw durability is more pronounced at low water-to-binder (w/b) ratios. This is because mixtures with low w/b ratios develop a more distinct interfacial transition zone between the aggregate and paste, promoting crack formation under load. Consequently, the L-0.7-35FA mix showed the greatest weight and strength loss (3.36% and 41%), whereas the B 0.4-0FA mix exhibited the lowest losses (0.42% and 7%).
As shown in Figure 10, all mixes with a 0.4 w/b ratio had durability factors above 60—the minimum requirement for durable concrete according to Neville [70]—regardless of aggregate type. On the other hand, mixes with a 0.7 w/b ratio showed durability factors ranging between 40 and 60, indicating marginal performance. Furthermore, a higher fly ash content was associated with a decrease in the durability factor.

3.4. Eco-Efficiency

The eco-efficiency indicators bi factor and ci factor, proposed by Damineli et al. [101], offer a practical and effective means to simultaneously assess the material efficiency and environmental impact of concrete mixtures. The binder intensity (bi) factor is defined as the amount of total binder used to achieve one unit of CS (kg/m3·MPa), while the carbon dioxide intensity (ci) factor refers to the amount of CO2 emitted per unit of strength gained (kg/m3·MPa). Based on a broad literature dataset, Damineli et al. [101] reported average values of 17 kg/m3·MPa for the bi factor and 12 kg/m3·MPa for the ci factor. These benchmark values serve as critical references for evaluating the relative performance of concrete in terms of both resource use and environmental footprint. The emission factors used in the CO2 concentration (ci) calculations were determined in accordance with the commonly accepted principles in the literature and the methodology proposed by Damineli et al. [101]. In order to maintain the homogeneity of the data at this stage, emissions from the transportation of aggregates and raw materials and the carbonation process of concrete (CO2 reabsorption) were excluded. In the literature [102], it is stated that the share of these factors in the total CO2 balance is quite low compared to clinker production.
The binder intensity and CO2 intensity factor of all concrete mixtures are presented in Table 11 and Table 12, respectively. In this study, twelve concrete mixtures—using limestone or basalt aggregates—were designed with varying fly ash contents (0%, 15%, and 35%) and two water-to-binder ratios (0.4 and 0.7). The bi and ci factors were calculated at 28, 90, and 180 days of curing. For all mixtures and curing ages, both indicators remained below the average values reported in the literature [101]. At 28 days, the average bi factor was 12.9 kg/m3·MPa, about 24% lower than the 17 kg/m3·MPa benchmark. Likewise, the average ci factor was 9.0 kg/m3·MPa, roughly 25% lower than the reference value. None of the individual mixtures exceeded these thresholds. As the curing period extended, the values decreased further: at 180 days, the average bi factor dropped to 11.1 kg/m3·MPa and the ci factor to 7.7 kg/m3·MPa. These results demonstrate that the concrete mixtures developed in this study achieved, on average, a 35% reduction in binder demand and a 36% decrease in CO2 intensity relative to global averages.
A detailed analysis by mix parameters revealed the key contributors to these improvements. The mixtures incorporating a 35% FA substitution exhibited the lowest bi and ci factors, reaching as low as 11.76 and 6.11 kg/m3·MPa, respectively, at 180 days. The construction industry is increasingly transitioning towards sustainable, bio-based, and circular economy-oriented materials to mitigate the carbon footprint of structural applications [103,104]. The use of a lower w/b ratio (0.4) consistently yielded better performance than 0.7, consistent with an expected improvement in the microstructure and strength development efficiency. Moreover, mixtures with basalt aggregates showed 5–7% lower bi and ci factors compared to those with limestone, likely due to the superior mechanical characteristics of basalt. The most efficient results were observed in mixtures combining low w/b ratios, a high FA content, and extended curing durations. These conditions not only enhanced binder utilization but also substantially minimized CO2 emissions.
Overall, the findings confirm that concrete mixtures can be optimized to perform well below the average bi and ci factors reported by Damineli et al. [101] through rational mix design strategies. Increasing the FA substitution, lowering the w/b ratio, selecting high-performance aggregates, and allowing longer curing periods all contributed to greater eco-efficiency. These results provide clear guidance for developing sustainable concretes with significantly reduced environmental impact and improved material productivity—without compromising structural integrity or performance.
It should be acknowledged that the current environmental analysis focuses on the binder-related emissions (cradle-to-gate, excluding aggregate production). The exclusion of aggregate quarrying, crushing, and transportation is a limitation of this study, as basalt extraction is generally more energy-intensive than limestone. Therefore, the reported eco-efficiency advantages of basalt mixtures should be interpreted within this specific system boundary.

4. Conclusions

In summary, this study provides a new perspective on sustainable concrete design by simultaneously evaluating the synergistic effects of aggregate mineralogy and fly ash replacement across a wide range of water-to-binder ratios. Unlike existing literature that often focuses on these variables in isolation, our findings establish a comprehensive link between mechanical stability, long-term durability, and carbon footprint efficiency. The identification of the optimal balance between basalt aggregate performance and high-volume fly ash content offers a practical and scientifically grounded framework for reducing the environmental impact of the construction industry without compromising structural integrity. The main conclusions are outlined below:
(1)
Increasing fly ash content reduced the required amount of water-reducing admixture to achieve the target slump; however, it also led to decreases in compressive strength (CS), the modulus of elasticity (MoE), and freeze–thaw durability, while increasing water absorption. Among these, CS was the most significantly affected parameter.
(2)
Aggregate type had a significant influence on both fresh and hardened properties. Mixtures with basalt aggregate required higher admixture dosages to reach the target slump and exhibited higher CS, MoE, and freeze–thaw resistance, along with lower water absorption and weight loss compared to limestone mixtures. These effects were more pronounced at lower water-to-binder (w/b) ratios, whereas fly ash content became more dominant at higher w/b ratios.
(3)
A strong linear correlation was observed between CS and MoE, particularly in limestone aggregate mixtures. The proposed MoE equation showed good agreement with the ACI 318-02 model, indicating that incorporating aggregate and admixture-specific factors provides a more tailored fit for MoE estimation in these specific systems; however, further validation is needed for broader application.
(4)
The combined use of low w/b ratios, high fly ash content, and extended curing periods provided optimal performance in terms of sustainability, significantly reducing CO2 emissions while maintaining acceptable mechanical properties.
(5)
Although basalt aggregate is more expensive than limestone aggregate, its high mechanical performance makes it economically competitive in high strength classes. While limestone aggregate offers the most economical solution in fly ash-containing systems for low strength requirements, the use of basalt indirectly provides savings in high-performance projects by reducing the total amount of material. This demonstrates that balancing regional material prices with the target strength class is critical in optimal design.
(6)
The findings obtained in this study are based on the use of fly ash with a low calcium content. Since pozzolanic reaction mechanisms and hydration kinetics may differ in high-calcium systems, the generalization of these results to high-calcium fly ash systems is limited. Future studies are recommended to comparatively examine the effects on binder systems with different calcium contents.
(7)
A limitation of this study should be noted. Freeze–thaw testing according to ASTM C666 is destructive in nature. After 300 cycles, some specimens exhibited significant surface scaling and cracking, preventing reliable replicate measurements for all mixture groups. Therefore, standard deviations for freeze–thaw results could not be reported. The presented values represent the mean of available specimens.

Author Contributions

Conceptualization, A.M., H.G.Ş., Ö.B. and M.T.; methodology, A.M., H.G.Ş., Ö.B. and M.T.; investigation, A.M., H.G.Ş., Ö.B. and M.T.; resources, A.M., H.G.Ş., Ö.B. and M.T.; writing—original draft preparation, A.M., H.G.Ş., Ö.B. and M.T.; writing—review and editing, A.M., H.G.Ş., Ö.B. and M.T.; supervision, A.M., H.G.Ş., Ö.B. and M.T. All authors have read and agreed to the published version of the manuscript.

Funding

This research was funded by the Bursa Uludag University Scientific Research Projects Unit (BAP), grant number FBG-2025-2550.

Institutional Review Board Statement

Not applicable.

Informed Consent Statement

Not applicable.

Data Availability Statement

All data, models, and code generated or used during the study appear in the submitted article.

Acknowledgments

The second author acknowledges the TUBITAK 2211-A program, and the first author acknowledges the Turkish Academy of Sciences (TÜBA).

Conflicts of Interest

The authors declare that they have no known competing financial interests or personal relationships that could have appeared to influence the work reported in this paper.

Appendix A

Table A1. Comparison of 28-day static modulus of elasticity values calculated using Equation (3) and various prediction models.
Classification/MixL-0.4-0FAL-0.4-15FAL-0.4-35FAL-0.7-0FAL-0.7-15FAL-0.7-35FAB-0.4-0FAB-0.4-15FAB-0.4-35FAB-0.7-0FAB-0.7-15FAB-0.7-35FA
Proposed equation34.831.829.825.924.322.140.436.633.328.227.223.6
ACI 363 [81]29.426.525.123.822.020.233.830.728.326.124.922.3
ACI 318 [14]32.228.526.524.321.919.437.833.630.427.025.321.7
CEB-FIP Model Code (GPa) [15]31.329.528.426.024.723.044.241.439.536.034.731.4
Voellmy Correlation (GPa) [82]28.227.224.826.125.122.126.730.529.127.325.924.9
Smith–Young Correlation [83]38.236.833.735.434.029.936.244.939.437.035.133.7
BS 5400-4 [84]31.829.928.826.224.823.133.831.630.027.326.223.7
JASS 5 [85]34.834.532.628.729.026.532.232.329.725.326.523.7
CSA A23.3-04 [86]29.626.825.324.022.220.434.031.028.626.425.122.5
CAN A23.3-M94 [87]32.529.728.224.622.720.535.432.129.926.024.621.3
EC2-04 [88]33.932.131.128.727.425.735.733.732.329.728.726.3
FHWA [89]25.022.821.618.917.515.727.224.723.020.018.916.3
NS-3473 [90]28.626.225.024.122.420.732.430.028.026.325.222.8
EHE [91]34.832.831.629.027.525.636.934.633.030.029.026.3
NBR-6118 [92]36.433.331.527.625.523.039.736.033.529.227.623.8
TS-500 [16]35.133.332.330.028.827.33734.933.430.93027.8
GBJ 11-89 [93]33.131.430.427.625.823.434.632.931.628.727.624.3
IDC 3274 [94]37.133.932.128.125.923.440.436.634.129.728.124.3
GDC 2000 [95]31.028.326.823.521.719.533.730.628.524.823.520.3

References

  1. DeRousseau, M.A.; Kasprzyk, J.R.; Srubar, W.V., III. Computational design optimization of concrete mixtures: A review. Cem. Concr. Res. 2018, 109, 42–53. [Google Scholar] [CrossRef]
  2. Badalyan, M.M.; Muradyan, N.G.; Shainova, R.S.; Arzumanyan, A.A.; Kalantaryan, M.A.; Sukiasyan, R.R.; Barseghyan, M.G. Effect of silica fume concentration and water–cement ratio on the compressive strength of cement-based mortars. Buildings 2024, 14, 757. [Google Scholar] [CrossRef]
  3. Susanti, E.; Istiono, H.; Komara, I.; Pertiwi, D.; Septiarsilia, Y.; Syahputra, F.K. Effect of fly ash to water-cement ratio on the characterization of the concrete strength. In IOP Conference Series: Materials Science and Engineering; IOP Publishing: Bristol, UK, 2021; Volume 1010, p. 012035. [Google Scholar]
  4. Sosa, M.E.; Zaccardi, Y.A.V.; Zega, C.J. A critical review of the resulting effective water-to-cement ratio of fine recycled aggregate concrete. Constr. Build. Mater. 2021, 313, 125536. [Google Scholar] [CrossRef]
  5. Ju, L.; Zhu, J.; Zhong, W.; Ba, M.; Shu, K.; Fang, X.; Li, G.; Zou, Y. A New Modified CDP Constitutive Model for Jute Fiber-Reinforced Recycled Aggregate Concrete and Its Sustainable Application in Precast Cable Trench Joints. Sustainability 2026, 18, 707. [Google Scholar] [CrossRef]
  6. Ahadian, F.; Işıkdağ, Ü.; Bekdaş, G.; Nigdeli, S.M.; Cakiroglu, C.; Geem, Z.W. Interpretable Machine Learning for Compressive Strength Prediction of Fly Ash-Based Geopolymer Concrete. Sustainability 2026, 18, 2227. [Google Scholar] [CrossRef]
  7. Mehta, P.K.; Monteiro, P.J.M. Concrete: Structure, Properties, and Methods, 2nd ed.; Prentice-Hall: Englewood Cliffs, NJ, USA, 1993. [Google Scholar]
  8. Mindess, S. Interfaces in concrete. In Materials Science of Concrete I; American Ceramic Society: Westerville, OH, USA, 1989; pp. 163–180. [Google Scholar]
  9. Ozturan, T.; Cecen, C. Effect of coarse aggregate type on mechanical properties of concretes with different strength. Cem. Concr. Res. 1997, 27, 165–170. [Google Scholar] [CrossRef]
  10. Kaplan, M.F. Ultrasonic Pulse Velocity, Dynamic Modulus of Elasticity, Poisson’s Ratio and the Strength of Concrete Made with Thirteen Different Cements’ Aggregate. In Rilem Synpo; Rilem: Paris, France, 1959. [Google Scholar]
  11. Davis, D.E.; Alexander, M.G. Properties of aggregate in concrete (Part 1); Hippo Quarrie: Sandton, South Africa, 1989. [Google Scholar]
  12. Davis, D.E.; Alexander, M.G. Properties of Aggregate in Concrete (Part 2); Hippo Quarrie: Sandton, South Africa, 1992. [Google Scholar]
  13. Nili, M.; Ehsani, A. Investigating the effect of the cement paste and transition zone on strength development of concrete containing nanosilica and silica fume. Mater. Des. 2015, 75, 174–183. [Google Scholar] [CrossRef]
  14. ACI 318R-02; Building Code Requirements for Structural Concrete. American Concrete Institute: Farmington Hills, MI, USA, 2002.
  15. CEB-FIP. CEB-FIP Model Code for Concrete Structures; Euro-International Committee for Concrete: Lausanne, Switzerland, 1990. [Google Scholar]
  16. TS 500; Betonarme Yapıların Tasarım ve Yapım Kuralları. Türk Standartları Enstitüsü: Ankara, Turkey, 2000. (In Turkish)
  17. Han, S.H.; Kim, J.K. Effect of temperature and age on the relationship between dynamic and static elastic modulus of concrete. Cem. Concr. Res. 2004, 34, 1219–1227. [Google Scholar] [CrossRef]
  18. Mehta, P.K.; Monteiro, P.J.M. Concrete: Microstructure, Properties, and Materials, 4th ed.; McGraw Hill Education: New York, NY, USA, 2014. [Google Scholar]
  19. Góra, J.; Piasta, W. Impact of mechanical resistance of aggregate on properties of concrete. Case Stud. Constr. Mater. 2020, 13, e00438. [Google Scholar] [CrossRef]
  20. Beushausen, H.; Dittmer, T. The influence of aggregate type on the strength and elastic modulus of high strength concrete. Constr. Build. Mater. 2015, 74, 132–139. [Google Scholar] [CrossRef]
  21. de Larrard, F.; Belloc, A. The influence of aggregate on the compressive strength of normal and high-strength concrete. ACI Mater. J. 1997, 94, 417–426. [Google Scholar] [CrossRef]
  22. Ahmad, S.; Alghamdi, S.A. A study on effect of coarse aggregate type on concrete performance. Arab. J. Sci. Eng. 2012, 37, 1777–1786. [Google Scholar] [CrossRef]
  23. Neville, A.M. Properties of Concrete, 5th ed.; Wiley: New York, NY, USA, 2011. [Google Scholar]
  24. Yazdani, N.; McKinnie, B.; Haroon, S. Aggregate-based modulus of elasticity for Florida concrete. Transp. Res. Rec. 2005, 1914, 15–23. [Google Scholar] [CrossRef]
  25. Noguchi, T.; Tomosawa, F.; Nemati, K.M.; Chiaia, B.M.; Fantilli, A.P. A practical equation for elastic modulus of concrete. ACI Struct. J. 2009, 106, 690. [Google Scholar] [CrossRef]
  26. Yaşar, E.; Erdoğan, Y.; Kılıç, A. Effect of limestone aggregate type and water–cement ratio on concrete strength. Mater. Lett. 2004, 58, 772–777. [Google Scholar] [CrossRef]
  27. Mbaraga, A.N.; Jenkins, K.J.; van de Ven, M. Influence of beam geometry and aggregate size on the flexural strength and elastic moduli of cement-stabilized materials. Transp. Res. Rec. 2014, 2401, 22–29. [Google Scholar] [CrossRef]
  28. Akçaoğlu, T.; Tokyay, M.; Çelik, T. Effect of coarse aggregate size and matrix quality on ITZ and failure behavior of concrete under uniaxial compression. Cem. Concr. Compos. 2004, 26, 633–638. [Google Scholar] [CrossRef]
  29. Basheer, L.; Kropp, J.; Cleland, D.J. Assessment of the durability of concrete from its permeation properties: A review. Constr. Build. Mater. 2001, 15, 93–103. [Google Scholar] [CrossRef]
  30. Mehta, P.K.; Monteiro, P.J.M. Concrete: Microstructure, Properties, and Material, 3rd ed.; McGraw-Hill: New York, NY, USA, 2006. [Google Scholar]
  31. Li, Z. Advanced Concrete Technology; Wiley: Hoboken, NJ, USA, 2011. [Google Scholar]
  32. Bentz, D.P.; Ferraris, C.F. Rheology and setting of high volume fly ash mixtures. Cem. Concr. Compos. 2010, 32, 265–270. [Google Scholar] [CrossRef]
  33. Van den Heede, P.; Gruyaert, E.; De Belie, N. Transport properties of high-volume fly ash concrete: Capillary water sorption, water sorption under vacuum and gas permeability. Cem. Concr. Compos. 2010, 32, 749–756. [Google Scholar] [CrossRef]
  34. Mehta, P.K. Concrete technology for sustainable development in the twenty-first century. In Proceedings of the Cement Manufactures’ Association; CMA: New Delhi, India, 1999; pp. 1–22. [Google Scholar]
  35. Bilodeau, A.; Malhotra, V.M. High-volume fly ash system: Concrete solution for sustainable development. ACI Mater. J. 2000, 97, 41–48. [Google Scholar] [CrossRef]
  36. Nassif, H.; Suksawang, N. Effect of curing methods on durability of high-performance concrete. Transp. Res. Rec. 2002, 1798, 31–38. [Google Scholar] [CrossRef]
  37. Bouzoubaa, N.; Fournier, B.; Malhotra, V.M.; Golden, D.M. Mechanical properties and durability of concrete made with high-volume fly ash blended cement produced in cement plant. ACI Mater. J. 2002, 99, 560–567. [Google Scholar] [CrossRef] [PubMed]
  38. Giaccio, G.M.; Malhotra, V.M. Concrete incorporating high volumes of ASTM Class F fly ash. Cem. Concr. Aggreg. 1988, 10, 88–95. [Google Scholar] [CrossRef]
  39. Atiş, C.D. Properties of fly ash roller compacted concrete. Turk. J. Eng. Environ. Sci. 2001, 25, 503–515. (In Turkish) [Google Scholar]
  40. Elices, M.; Rocco, C.G. Effect of aggregate size on the fracture and mechanical properties of a simple concrete. Eng. Fract. Mech. 2008, 75, 3839–3851. [Google Scholar] [CrossRef]
  41. Nassif, H.H.; Najm, H.; Suksawang, N. Effect of pozzolanic materials and curing methods on the elastic modulus of HPC. Cem. Concr. Compos. 2005, 27, 661–670. [Google Scholar] [CrossRef]
  42. Corinaldesi, V. Mechanical and elastic behaviour of concretes made of recycled-concrete coarse aggregates. Constr. Build. Mater. 2010, 24, 1616–1620. [Google Scholar] [CrossRef]
  43. Altun, M.G.; Özen, S.; Mardani-Aghabaglou, A. Effect of side chain length change of polycarboxylate-ether–based high-range water–reducing admixture on properties of cementitious systems containing fly ash. J. Mater. Civ. Eng. 2021, 33, 04021015. [Google Scholar] [CrossRef]
  44. Mardani-Aghabaglou, A.; Karakuzu, K.; Kobya, V.; Hatungimana, D. Durability performance and dimensional stability of road concrete containing dry-shake surface hardener admixture. Constr. Build. Mater. 2021, 274, 121789. [Google Scholar] [CrossRef]
  45. Mardani-Aghabaglou, A.; Öztürk, H.T.; Kankal, M.; Ramyar, K. Assessment and prediction of cement paste flow behavior; Marsh-funnel flow time and mini-slump values. Constr. Build. Mater. 2021, 301, 124072. [Google Scholar] [CrossRef]
  46. Kaya, Y.; Biricik, Ö.; Bayqra, S.H.; Mardani, A. Effect of fibre type and utilisation rate on dimensional stability and frost resistance of pavement mortar mixture. Int. J. Pavement Eng. 2023, 24, 2154351. [Google Scholar] [CrossRef]
  47. Mardani-Aghabaglou, A.; Kankal, M.; Nacar, S.; Felekoğlu, B.; Ramyar, K. Assessment of cement characteristics affecting rheological properties of cement pastes. Neural Comput. Appl. 2021, 33, 12805–12826. [Google Scholar] [CrossRef]
  48. Mardani-Aghabaglou, A.; Yüksel, C.; Hosseinnezhad, H.; Ramyar, K. Performance of steel micro fiber reinforced mortar mixtures containing plain, binary and ternary cementitious systems. J. Green Build. 2016, 11, 109–130. [Google Scholar] [CrossRef]
  49. Kılıç, A.; Atiş, C.D.; Teymen, A.; Karahan, O.K.; Özcan, F.; Bilim, C.; Özdemir, M.E. The influence of aggregate type on the strength and abrasion resistance of high strength concrete. Cem. Concr. Compos. 2008, 30, 290–296. [Google Scholar] [CrossRef]
  50. Çetin, S.Y. An experimental study of basalt aggregate concrete according to different size effect laws. Alex. Eng. J. 2025, 120, 358–370. [Google Scholar] [CrossRef]
  51. Ubi, S.E.; Nkra, P.O.; Agbor, R.B.; Ewa, D.E.; Nuchal, M. Efficacy of basalt and granite as coarse aggregate in concrete mixture. Int. J. Eng. Technol. Manag. Res. 2020, 7, 1–9. [Google Scholar] [CrossRef]
  52. Zhang, X.; Zhou, G.; Xu, P.; Fu, L.; Deng, D.; Kuang, X.; Fan, Y. Mechanical properties under compression and microscopy analysis of basalt fiber reinforced recycled aggregate concrete. Materials 2023, 16, 2520. [Google Scholar] [CrossRef]
  53. Li, K.; Luo, J.; Zhang, F.; Ma, B.; Zhu, Z.; Liang, W.; Yuan, S. Experimental study on the fly ash-basalt fiber reinforced recycled coarse aggregate pervious concrete. Phys. Chem. Earth Parts A/B/C 2024, 135, 103652. [Google Scholar] [CrossRef]
  54. Ahmad, S.H.; Shah, S.P. Structural properties of high strength concrete and its implications for precast prestressed concrete. PCI J. 1985, 30, 92–119. [Google Scholar] [CrossRef]
  55. Uysal, M. The influence of coarse aggregate type on mechanical properties of fly ash additive self-compacting concrete. Constr. Build. Mater. 2012, 37, 533–540. [Google Scholar] [CrossRef]
  56. Karahan, O.; Atiş, C.D. The durability properties of polypropylene fiber reinforced fly ash concrete. Mater. Des. 2011, 32, 1044–1049. [Google Scholar] [CrossRef]
  57. Wu, K.R.; Chen, B.; Yao, W.; Zhang, D. Effect of coarse aggregate type on mechanical properties of high-performance concrete. Cem. Concr. Res. 2001, 31, 1421–1425. [Google Scholar] [CrossRef]
  58. Binici, H.; Yardim, Y.; Aksogan, O.; Resatoglu, R.; Dincer, A.; Karpuz, A. Durability properties of concretes made with sand and cement size basalt. Sustain. Mater. Technol. 2020, 23, e00145. [Google Scholar] [CrossRef]
  59. EN 197-1; Cement—Part 1: Composition, Specifications and Conformity Criteria for Common Cements. European Standard: Brussels, Belgium, 2010.
  60. EN 450-1:2012; Fly Ash for Concrete—Definition, Specifications and Conformity Criteria. British Standards Institution: London, UK.
  61. EN 1097-6; Tests for Mechanical and Physical Properties of Aggregates—Part 6: Determination of Particle Density and Water Absorption. European Standard: Brussels, Belgium, 2007.
  62. EN 1097-2:2020; Tests for Mechanical and Physical Properties of Aggregates. Methods for the Determination of Resistance to Fragmentation. British Standards Institution: London, UK, 2020.
  63. ASTM C 143/C 143M; Standard Test Method for Slump of Hydraulic-Cement Concrete. ASTM International: West Conshohocken, PA, USA, 2015.
  64. ACI 211.1-91; Standard Practice for Selecting Proportions for Normal, Heavyweight, and Mass Concrete. American Concrete Institute: Farmington Hills, MI, USA, 1997.
  65. EN 12390-3; Concrete Testing-Hardened Concrete—Part 3: Compressive Strength Test Samples. European Standard: Brussels, Belgium, 2010.
  66. ASTM C 469; Standard Test Method for Static Modulus of Elasticity and Poisson’s Ratio of Concrete in Compression. ASTM International: West Conshohocken, PA, USA, 1994.
  67. TS 3624; Sertleşmiş Betonda Özgül Ağırlık, su Emme ve Boşluk Oranı Tayini. Türk Standartları Enstitüsü: Ankara, Turkey, 1981.
  68. ASTM C 666/C 666M-03; Standard Test Method for Resistance of Concrete to Rapid Freezing and Thawing. ASTM International: West Conshohocken, PA, USA, 2008.
  69. TS 3699; Doğal Yapı Taşları Muayene ve Deney Metotları. Türk Standartları Enstitüsü: Ankara, Turkey, 1987.
  70. Neville, A. Concrete Technology, 2nd ed.; Longman: London, UK, 2010. [Google Scholar]
  71. Mardani, N.; Kazemi, R.; Unverdi, M.; Mardani, A.; Mirjalili, S. ANN trained by BBO for modeling of fly ash cementitious systems with high range water reducing admixtures. Sci. Rep. 2026, 16, 4540. [Google Scholar] [CrossRef]
  72. Altun, M.G.; Karakuzu, K.; Özen, S.; Hatungimana, D.; Mardani, A.; El-Mir, A.; Assaad, J.J. Influence of sulfonate and phosphate groups in polycarboxylate ethers on properties of fly ash blended cementitious systems. Constr. Build. Mater. 2025, 494, 143570. [Google Scholar] [CrossRef]
  73. Siddique, R.; Khatib, J.M. Abrasion resistance and mechanical properties of high-volume fly ash concrete. Mater. Struct. 2010, 43, 709–718. [Google Scholar] [CrossRef]
  74. Islam, M.M.; Islam, M.S. Strength and durability characteristics of concrete made with fly-ash blended cement. Aust. J. Struct. Eng. 2013, 14, 303–319. [Google Scholar] [CrossRef]
  75. Hong, L.; Gu, X.; Lin, F. Influence of aggregate surface roughness on mechanical properties of interface and concrete. Constr. Build. Mater. 2014, 65, 338–349. [Google Scholar] [CrossRef]
  76. Fic, S.; Lyubomirskiy, N.; Barnat-Hunek, D. The Influence of the natural aggregate roughness on the ITZ adhesion in concrete. Mater. Sci. Forum 2018, 931, 564–567. [Google Scholar] [CrossRef]
  77. Mardani-Aghabaglou, A.; Sezer, G.İ.; Ramyar, K. Comparison of fly ash, silica fume and metakaolin from mechanical properties and durability performance of mortar mixtures view point. Constr. Build. Mater. 2014, 70, 17–25. [Google Scholar] [CrossRef]
  78. Saha, A.K. Effect of class F fly ash on the durability properties of concrete. Sustain. Environ. Res. 2018, 28, 25–31. [Google Scholar] [CrossRef]
  79. Kayali, O. Effect of high volume fly ash on mechanical properties of fiber reinforced concrete. Mater. Struct. 2004, 37, 318–327. [Google Scholar]
  80. Moghaddam, F.; Sirivivatnanon, V.; Vessalas, K. The effect of fly ash fineness on heat of hydration, microstructure, flow and compressive strength of blended cement pastes. Case Stud. Constr. Mater. 2019, 10, e00218. [Google Scholar] [CrossRef]
  81. ACI 363R-92; State-of-the-Art Report on High-Strength Concrete. American Concrete Institute: Farmington Hills, MI, USA, 1997.
  82. Popovics, S. Strength and Related Properties of Concrete: A Quantitative Approach; John Wiley & Sons: New York, NY, USA, 1998. [Google Scholar]
  83. Ortiz, M. A Constitutive Theory for the Inelastic Behavior of Concrete. Mech. Mater. 1985, 4, 67–93. [Google Scholar] [CrossRef]
  84. BS 5400-4; Steel, Concrete and Composite Bridges, Part 4: Code of Practice for Design of Concrete Bridges. British Standards Institution: London, UK, 1990.
  85. Park, W.J.; Noguchi, T.; Shin, S.H.; Oh, D.Y. Modulus of elasticity of recycled aggregate concrete. Mag. Concr. Res. 2015, 67, 585–591. [Google Scholar] [CrossRef]
  86. CSA A23.3-04; Design of Concrete Structures. Canadian Standards Association: Mississauga, ON, Canada, 2004.
  87. CSA A23.3-94; Design of Concrete Structures. Canadian Standards Association: Rexdale, ON, Canada, 1994.
  88. EN 1992-1-1; Eurocode 2: Design of Concrete Structures—Part 1-1: General Rules and Rules for Buildings. European Committee for Standardization: Brussels, Belgium, 2004.
  89. Graybeal, B.A. Material Property Characterization of Ultra-High Performance Concrete; Federal Highway Administration: McLean, VA, USA, 2000.
  90. NS 3473; Concrete Structures—Design Rules. Norwegian Council for Standardization: Oslo, Norway, 1992.
  91. EHE-98; Spanish Code for Structural Concrete. Ministry of Public Works: Madrid, Spain, 1998.
  92. NBR 6118; Design of Concrete Structures. Brazilian Association of Technical Standards: Rio de Janeiro, Brazil, 2003.
  93. GBJ 11-89; Chinese Code for Seismic Design of Buildings. New World Press: Beijing, China, 1994.
  94. IDC 3274; Italian Design Code. Public and Health Ministry: Rome, Italy, 2003.
  95. GDC-2000; Greek Design Code. Greek National Code Center: Athens, Greece, 2000.
  96. Hatungimana, D.; Taşköprü, C.; İçhedef, M.; Saç, M.M.; Yazıcı, Ş. Compressive strength, water absorption, water sorptivity and surface radon exhalation rate of silica fume and fly ash based mortar. J. Build. Eng. 2019, 23, 369–376. [Google Scholar] [CrossRef]
  97. Khatib, J.M. Performance of self-compacting concrete containing fly ash. Constr. Build. Mater. 2008, 22, 1963–1971. [Google Scholar] [CrossRef]
  98. Kanthe, V.N.; Deo, S.V.; Murmu, M. Effect of fly ash and rice husk ash on strength and durability of binary and ternary blend cement mortar. Asian J. Civ. Eng. 2018, 19, 963–970. [Google Scholar] [CrossRef]
  99. Dinakar, P.; Babu, K.G.; Santhanam, M. Durability properties of high volume fly ash self compacting concretes. Cem. Concr. Compos. 2008, 30, 880–886. [Google Scholar] [CrossRef]
  100. Mardani-Aghabaglou, A.; Andiç-Çakir, Ö.; Ramyar, K. Freeze–thaw resistance and transport properties of high-volume fly ash roller compacted concrete designed by maximum density method. Cem. Concr. Compos. 2013, 37, 259–266. [Google Scholar] [CrossRef]
  101. Damineli, B.L.; Kemeid, F.M.; Aguiar, P.S.; John, V.M. Measuring the eco-efficiency of cement use. Cem. Concr. Compos. 2010, 32, 555–562. [Google Scholar] [CrossRef]
  102. Flower, D.J.; Sanjayan, J.G. Green house gas emissions due to concrete manufacture. Int. J. Life Cycle Assess. 2007, 12, 282–288. [Google Scholar] [CrossRef]
  103. Balo, F. Development and Performance Evaluation of New Sustainable Bio-Based Building Insulation Materials. Sustainability 2026, 18, 2874. [Google Scholar] [CrossRef]
  104. Łaźniewska-Piekarczyk, B.; Czop, M. Sustainable Valorisation of Hazardous MSWI Air Pollution Control Fly Ash in Portland Composite Cement: Performance, Environmental Safety and Circular Economy Perspective. Sustainability 2026, 18, 3322. [Google Scholar] [CrossRef]
Figure 1. Gradation curve of combined limestone aggregate and the limits.
Sustainability 18 05386 g001
Figure 2. Gradation curve of combined basalt aggregate and the limits.
Sustainability 18 05386 g002
Figure 3. Surface images of aggregates: (a) limestone; (b) basalt.
Sustainability 18 05386 g003
Figure 4. Experimental test setups employed in the study: (a) compressive strength testing of a 150 × 300 mm cylindrical specimen, (b) instrumentation setup for static modulus of elasticity measurement showing the compressometer frame with attached LVDTs.
Sustainability 18 05386 g004
Figure 5. Relationship between static MoE and CS of 28-day concrete mixtures (limestone and basalt aggregate).
Sustainability 18 05386 g005
Figure 6. Relationship of water absorption value with CS and MoE.
Sustainability 18 05386 g006
Figure 7. Weight change of 90-day concrete mixtures following 300 cycles of freezing and thawing. Values represent the mean of specimens that successfully completed the 300 cycles (n = 2–3 per mixture, depending on specimen integrity). Error bars are not presented due to the destructive nature of the test and the loss of specimen integrity in some groups.
Sustainability 18 05386 g007
Figure 8. CS reduction of 90-day mixtures at the end of 300 cycles of freezing and thawing. Values represent the mean of specimens that successfully completed the 300 cycles (n = 2–3 per mixture). Error bars are not presented due to the destructive nature of the test.
Sustainability 18 05386 g008
Figure 9. Relationship between water absorption and weight change of 90-day concrete mixtures upon 300 cycles of freezing and thawing.
Sustainability 18 05386 g009
Figure 10. The durability factor of mixtures upon 300 cycles of freezing and thawing. The durability factor (Df) was calculated using Equation (2). Values represent the mean of available specimens after 300 cycles. Error bars are not presented.
Sustainability 18 05386 g010
Table 1. Oxide composition of cement and fly ash and their standard limits.
Oxide (%)EN 197-1CementEN 450-1Fly Ash
CaO-64.09≤10.001.64
SiO2-20.06≥25.0056.20
Al2O3-5.68-25.34
Fe2O3-2.23-7.65
MgO-1.45-1.80
SO3≤4.003.09≤3.000.32
Na2O-0.29-1.13
K2O-0.93-1.88
LOI≤5.001.74≤5.002.10
Table 2. Cement and fly ash: physical and mechanical characteristics.
PropertiesCementFly Ash
CS (MPa)2-day25.4-
7-day39.9-
28-day48.6-
Strength activity index (%)7-day-69
28-day-79
90-day-82
FinenessBlaine specific gravity (g/cm2)33623600
Retained on 90 µm (%)0.76.1
Retained on 45 µm (%)-27.6
Retained on 32 µm (%)-40.1
Table 3. Physical properties of aggregates.
AggregateBulk SSD Specific GravityAbsorption Capacity (%)Loose Bulk Density (kg/m3)
TypeSize (mm)
Limestone0–52.700.651630
5–152.690.451380
15–252.690.401380
Basalt0–5
5–15
15–25
2.79
2.81
2.83
0.29
0.32
0.30
1660
1410
1370
Table 4. Abrasion resistance results from the Los Angeles test for limestone and basalt aggregates.
Aggregate TypeLoss on Weight (%)
Limestone25
Basalt19
Table 5. Some properties of chemical admixtures used in the study.
TypeAlkali Content
(%) (Na2O)
Density
(g/cm3)
Solids
Content (%)
Chloride
Content (%)
pH, 25 °COperating *
Range (%)
Polycarboxylate ether-based superplasticizer <51.09835.730.0125.970.6–2.0
* By weight of cement.
Table 6. Mix proportions of the concrete mixtures.
MixtureOPC
(kg/m3)
Fly Ash
(kg/m3)
SSD Aggregate (kg/m3)Slump
(mm)
Polycarboxylate-Based Water-Reducing Admixture Admixture
(kg/m3)
Water
(kg/m3)
0–5 mm5–15 mm15–25 mm
L-0.4-0FA48809913373391004.8195
L-0.4-15FA414739723303331054.6
L-0.4-35FA3171719523233261054.5
L-0.7-0FA279010943723751103.3
L-0.7-15FA2374210843683711203.1
L-0.7-35FA1819810723643671152.8
B-0.4-0FA488010593563581055.1
B-0.4-15FA4147310433503531004.9
B-0.4-35FA31717110223433451104.5
B-0.7-0FA279011723943961103.4
B-0.7-15FA2374211633903931153.3
B-0.7-35FA1819811513863891153.1
Table 7. CS and MoE of concrete mixtures cured at 28, 90, 180 days.
Mixture28-D90-D180-D
CS (MPa)MoE (GPa)CS (MPa)MoE (GPa)CS (MPa)MoE (GPa)
L-0.4-0FA42.335.2244.336.445.637.3
L-0.4-15FA35.431.2439.833.642.335.1
L-0.4-35FA31.728.5636.630.141.533.4
L-0.7-0FA24.326.1225.828.127.129.3
L-0.7-15FA20.725.0722.126.825.228.2
L-0.7-35FA16.822.0719.323.923.326.3
B-0.4-0FA50.240.0753.442.355.243.8
B-0.4-15FA41.338.0748.840.152.442.1
B-0.4-35FA35.833.4344.735.350.138.03
B-0.7-0FA27.127.3228.529.830.330.5
B-0.7-15FA24.325.9226.726.929.428.5
B-0.7-35FA18.124.9022.526.126.927.6
Table 8. Estimation equation of MoE.
ClassificationEstimation Equation of MoE
Proposed Equation E = k 1 k 2 × 0.4744 × γ × ( f c ) 5 / 6 + 10.909 (GPa)
k 1 Lithological type of coarse aggregate k 2 Type of addition
0.938Crushed limestone1.04Fly ash
0.955Crushed basalt1No addition
ACI 363 [81] E = 10 3 × 3320 f c 0.5 + 6900 × ( γ 2.320 ) 1.5 (GPa)
ACI 318 [14] E = 10 3 × 0.043 × ( 10 3 ×   γ ) 1.5 × f c 0.5 (GPa)
CEB-FIP Model Code (GPa) [15] E = 10 3 × α × 2.15 × 10 4 × ( f c 10 ) 1 / 3 (GPa)
α 1.201.000.900.70
Type of aggregateBasalt, dense limestoneQuartziticLimestoneSandstone
Voellmy Correlation (GPa) [82] E = 2 × f c ε 0
0C20C30C40C50C80
Micro-strain of concrete at the time of breaking 2 × 10 3 2.3 × 10 3 2.5 × 10 3 3 × 10 3 3 × 10 3
Smith–Young Correlation [83] E =   e × f c ε 0 (GPa)
Ꜫ0Micro-strain of concrete at the time of breaking
C20 2 × 10 3
C30 2.3 × 10 3
C40 2.5 × 10 3
C50 3 × 10 3
C80 3 × 10 3
BS 5400-4 [84] E = 8.6475 × f c 0.348 (GPa)
JASS 5 [85] E = k 1 k 2 × 33.5 ( γ 2.4 ) 2 ( f c 60 ) 1 / 3 (GPa)
k 1 Lithological type of coarse aggregate
1.20Crushed limestone, calcined bauxite
0.95Crushed quartzitic aggregate, crushed andesite, crushed basalt, crushed clay-slate, crushed cobble stone
1.00Coarse aggregate other than the above
k 2 Type of addition
0.95Silica fume, ground granulated blast furnace slag, fly ash fume
1.10Fly ash
1.00Addition other than the above
CSA A23.3-04 [86] E = 10 3 × ( 3300 × f c 0.5 + 6900 ) × ( γ 2.3 ) 1.5 (GPa)
CAN A23.3-M94 [87] E = 5 × ( f c ) 0.5 (GPa)
EC2-04 [88] E = 10 3 × 2200 × ( f c 10 ) 0.3 (GPa)
FHWA [89] E = 10 3 × 3837 × ( f c 10 ) 0.5 (GPa)
NS-3473 [90] E = ( 9.5 × f c 0.3 ) × ( γ 2.4 ) 1.5 (GPa)
EHE [91] E = 10 × ( f c ) 1 / 3 (GPa)
NBR-6118 [92] E = 5.6 × ( f c ) 0.5 (GPa)
TS-500 [16] E = 3.25 × ( f c ) 0.5 + 14 (GPa)
GBJ 11-89 [93] E = 100 / ( 2.2 + 34.7 f c ) (GPa)
IDC 3274 [94] E = 5.7 × ( f c ) 0.5 (GPa)
GDC 2000 [95] E = 4.76 × ( f c ) 0.5 (GPa)
Table 9. Indications of the accuracy of the MoE equations.
Classification/MixMean Absolute Percentage Error
(p, %)
Maximum Absolute Percentage Error (pmax, %)Standard Deviation (σ)Relative Value of Standard Deviation
r)
Correlation
(r)
Proposed equation2.495.240.760.030.987
ACI 363 [81]11.8619.2817.920.600.975
ACI 318 [14]8.2613.047.220.240.980
CEB-FIP Model Code (GPa) [15]12.6933.8223.200.780.787
Voellmy Correlation (GPa) [82]9.3733.3427.950.940.767
Smith-Young Correlation [83]25.2035.5153.801.800.752
BS 5400-4 [84]5.8317.089.100.310.965
JASS 5 [85]10.9019.8515.170.510.708
CSA A23.3-04 [86]11.0918.6016.210.540.975
CAN A23.3-M94 [87]8.1515.608.780.290.969
EC2-04 [88]8.5016.477.440.250.964
FHWA [89]29.5235.2383.892.810.969
NS-3473 [90]11.9721.1921.130.710.968
EHE [91]8.2616.056.640.220.965
NBR-6118 [92]4.6710.402.470.080.969
TS-500 [16]10.8623.7911.060.370.969
GBJ 11-89 [93]6.2013.686.470.220.945
IDC 3274 [94]5.7712.373.560.120.969
GDC 2000 [95]12.5619.6517.490.590.969
Table 10. The 28-, 90- and 180-day water absorption of the mixtures (%).
Mix28-D90-D180-D
L-0.4-0FA1.811.721.68
L-0.4-15FA1.991.811.70
L-0.4-35FA2.151.921.83
L-0.7-0FA5.835.615.57
L-0.7-15FA6.155.935.73
L-0.7-35FA7.026.115.85
B-0.4-0FA1.621.581.53
B-0.4-15FA1.781.621.56
B-0.4-35FA1.861.711.59
B-0.7-0FA4.304.103.98
B-0.7-15FA4.384.214.02
B-0.7-35FA4.474.334.17
Table 11. Binder intensity factor of all concrete mixtures.
Mix IDbics (kg × m−3 × MPa−1)
28-D90-D180-D
L-0.4-0FA11.511.010.7
L-0.4-15FA13.812.211.5
L-0.4-35FA15.413.311.8
L-0.7-0FA11.510.810.3
L-0.7-15FA13.512.611.1
L-0.7-35FA16.614.512.0
B-0.4-0FA9.79.18.8
B-0.4-15FA11.810.09.3
B-0.4-35FA13.610.99.7
B-0.7-0FA10.39.89.2
B-0.7-15FA11.510.49.5
B-0.7-35FA15.412.410.4
Table 12. CO2 intensity factor of all concrete mixtures.
Mix IDcics (kg × m−3 × MPa−1)
28-D90-D180-D
L-0.4-0FA9.28.88.6
L-0.4-15FA9.48.37.8
L-0.4-35FA8.06.96.1
L-0.7-0FA9.28.78.2
L-0.7-15FA9.28.67.5
L-0.7-35FA8.67.56.2
B-0.4-0FA7.87.37.1
B-0.4-15FA8.06.86.3
B-0.4-35FA7.15.75.1
B-0.7-0FA8.27.87.4
B-0.7-15FA7.87.16.4
B-0.7-35FA8.06.45.4
Disclaimer/Publisher’s Note: The statements, opinions and data contained in all publications are solely those of the individual author(s) and contributor(s) and not of MDPI and/or the editor(s). MDPI and/or the editor(s) disclaim responsibility for any injury to people or property resulting from any ideas, methods, instructions or products referred to in the content.