Article

Differential Effects of Human–Environment Interactions on Multidimensional Common Prosperity: A Case Study of Guangdong Province

1
School of Economics and Finance, Xi’an Jiaotong University, Xi’an 710049, China
2
Xi’an Branch, Agricultural Bank of China, Xi’an 710049, China
*
Author to whom correspondence should be addressed.
Sustainability 2026, 18(11), 5389; https://doi.org/10.3390/su18115389
Submission received: 16 April 2026 / Revised: 23 May 2026 / Accepted: 25 May 2026 / Published: 27 May 2026
(This article belongs to the Section Sustainable Urban and Rural Development)

Abstract

Common prosperity is an important feature of Chinese modernization, and human–environment interaction is the underlying geographical foundation of regional development. So, the level of coupling coordination of human–environment interaction directly affects the advancement process and regional balance of multidimensional common prosperity. This study took Guangdong Province as the study area, selected long-term municipal panel data, LandScan data, and construction land data from 2010 to 2025, and used the coupling coordination model, random forest, and other methods to systematically carry out an empirical study on the relationship between human–environment interaction and multidimensional common prosperity. The results showed that the coupling coordination degree of human–environment interaction and the level of multidimensional common prosperity in Guangdong Province both showed an overall upward trend, and both exhibited the spatial characteristics of core polarization and peripheral lag. At the same time, the effect of the coupling coordination of human–environment interaction on common prosperity showed significant dimensional heterogeneity. Specifically, the coupling coordination of human–environment interaction could stably promote prosperity development, but it showed a threshold effect of first promoting and then inhibiting in the dimension of shared equity, while its driving effect on the dimension of ecological sustainability was relatively weak. This study not only enriched the relevant explanation of the driving mechanism of common prosperity from a geographical perspective but also provided scientific decision reference for optimizing the allocation of human–environment elements, promoting coordinated regional development, and realizing sustainable development practices in which prosperity and equity improved at the same time.

1. Introduction

Common prosperity is the essential requirement of socialism. It is not simple egalitarianism, but a development goal. This goal takes high-quality development as the foundation. It aims to realize the common improvement of all people in material life and spiritual life and promotes the balanced and coordinated development between urban and rural areas, between regions, and among different groups [1]. Against the background that China’s economic development has entered a new stage and the problem of unbalanced and inadequate regional development remains relatively prominent, promoting common prosperity becomes the key path to solving the contradiction of unbalanced and inadequate development. This is because it has irreplaceable strategic significance for satisfying the people’s ever-growing needs for a better life [2,3].
Human–environment interaction is a core proposition in geography. It is a complex system formed by the interplay and mutual constraint between human activities and the geographical environment. The spatial pattern and evolutionary characteristics of this interaction directly determine the basic conditions of regional development and resource allocation efficiency. Consequently, they constitute the underlying logic that influences the process of achieving common prosperity and its spatial disparities [4]. Core elements of human–environment interaction, such as population distribution and land-use structure, directly affect a region’s population carrying capacity, industrial layout, employment opportunities, and public service provision. Therefore, they form an important material foundation that shapes regional development gaps and income distribution differences [5]. Furthermore, the coordination level of human–environment interaction dictates a region’s sustainable development capacity. Unbalanced interaction intensifies the development gap between regions and between urban and rural areas. Conversely, optimized interactions improve resource allocation and promote balanced spatial layouts, thereby providing vital support for common prosperity [6]. Therefore, analyzing how human–environment interactions differentially affect multidimensional common prosperity is essential. This perspective not only reveals the internal coupling mechanisms between human–environment elements and common prosperity but also provides theoretical references and typical cases for achieving coordinated regional development.
Research on human–environment interaction fundamentally centers on the interplay and coordinated development between human activities and the geographical environment [7]. Over time, the scope of this research has expanded significantly. It has transitioned from traditional studies on regional system evolution and the diagnosis of human–environment contradictions to diverse subfields. These subfields include the coupling coordination between population and land elements, the human driving mechanisms of land-use change, and the relationship between human–environment interaction and regional development quality [8,9,10]. Regarding data sources, advancements in spatial information technology have diversified the materials used in this field. Researchers now combine high-precision spatial data (e.g., LandScan population data, construction land distribution, and remote-sensing imagery) to accurately portray spatial patterns and dynamic changes [11,12,13]. Concurrently, statistical panel data (e.g., census, land-use change, and socio-economic data) are utilized to analyze temporal evolutionary characteristics [14,15,16]. In terms of methodology, a comprehensive system combining qualitative and quantitative research has emerged. Qualitative approaches, such as literature reviews and case studies, primarily serve to outline evolutionary patterns and analyze mechanism formations [17,18]. Conversely, quantitative research widely employs spatial econometric models, GIS spatial analysis, and coupling coordination degree models to quantify the associations and effects among human–environment elements [19,20,21,22]. As a core perspective spanning geography, economics, and sociology, human–environment interaction research breaks the boundaries of single disciplines. It not only deepens the understanding of internal laws governing regional development but also provides new analytical frameworks for various interdisciplinary studies. Ultimately, it offers vital theoretical support and methodological guidance for resolving diverse developmental challenges [23].
Existing research on multidimensional common prosperity typically constructs analytical frameworks based on three core dimensions: prosperity level, equality, and sustainable development [24,25]. Specifically, the prosperity dimension focuses on economic growth effectiveness, resident income levels, industrial vitality, and material living standards [26,27]. The equality dimension emphasizes the urban-rural gap, regional balance, public service equalization, and inclusive rights for diverse groups [28,29]. Meanwhile, the sustainable development dimension examines resource carrying capacity, ecological quality, developmental resilience, and long-term supply–demand balance. Together, these three dimensions constitute the foundational system for evaluating common prosperity [30,31]. Regarding data application, current research mostly relies on socio-economic statistical yearbooks, livelihood survey panels, and records of fiscal revenues and public services. Recently, some studies have gradually integrated remote-sensing imagery and land-use monitoring data to support sustainability evaluations. However, fine-grained micro-geographical elements, such as high-precision spatial population data and dynamic construction land data, remain underexplored and have not yet been deeply incorporated into the mechanism analysis of multidimensional common prosperity [32,33,34]. Methodologically, scholars commonly employ the entropy weight–TOPSIS method, the analytic hierarchy process (AHP), and coupling coordination models to measure comprehensive development levels. Additionally, spatial autocorrelation analysis, panel regression, and obstacle degree models are frequently used to identify spatiotemporal characteristics and key constraining factors [35,36,37]. Overall, while existing studies have established relatively mature evaluation systems, they primarily focus on macro-administrative units. There is still a notable lack of differentiated mechanism research conducted from the perspective of micro human–environment spatial matching [38,39].
Currently, research analyzing common prosperity through the human–environment interaction framework remains limited. Most existing studies focus on only one specific dimension of common prosperity, typically sustainable development [40]. These studies primarily examine the optimization of territorial spatial patterns, land-use transitions, and environmental carrying capacity [3,41]. Methodologically, researchers typically combine remote sensing, ecological monitoring, and conventional statistical data. Using tools like GIS spatial overlay, coupling coordination models, and ecological threshold measurements, they analyze how human–environment matching affects ecological protection, resource utilization, and long-term resilience. Consequently, relatively mature theoretical paradigms and empirical paths for this specific dimension have emerged [42,43]. In contrast, insufficient attention has been paid to the other two core dimensions of common prosperity: the improvement of prosperity levels and the equality of development rights. This gap stems from two main reasons. First, traditional human–environment research has long been rooted in ecological geography and resource management, thereby rarely addressing core socio-economic issues such as income distribution, public service provision, and urban–rural welfare equalization [44]. Second, there is a data mismatch. Prosperity and equality indicators mostly rely on administrative-level statistical records, making it difficult to precisely align them with micro-spatial data, such as LandScan gridded population and fine-grained construction land data [45]. Ultimately, while the existing literature heavily favors the sustainable development dimension, it lacks in-depth exploration of the prosperity and equality dimensions [46]. Furthermore, due to the inadequate integration of multi-source fine-grained spatial data with socio-economic statistics, a comprehensive analytical framework encompassing all three dimensions—prosperity, equality, and sustainability—has not yet been established [47].
Building upon the aforementioned research foundation, this study constructs an analytical framework tailored to the connotations of multidimensional common prosperity. Specifically, it utilizes core human–environment elements, namely spatial population distribution and construction land patterns. By doing so, the study clarifies how various characteristics of human–environment interactions produce differentiated effects on each dimension of common prosperity. Ultimately, this approach achieves a dual improvement in both theoretical perspective and empirical methodology. To empirically test this framework, Guangdong Province is selected as the case study. The remainder of this paper is structured as follows. The first part analyzes the spatial pattern of the human–environment coupling relationship in Guangdong. The second part measures the common prosperity indices across different dimensions. Finally, the third part explores the differentiated effects of the human–environment coupling relationship on multidimensional common prosperity.

2. Materials and Methods

2.1. Study Area

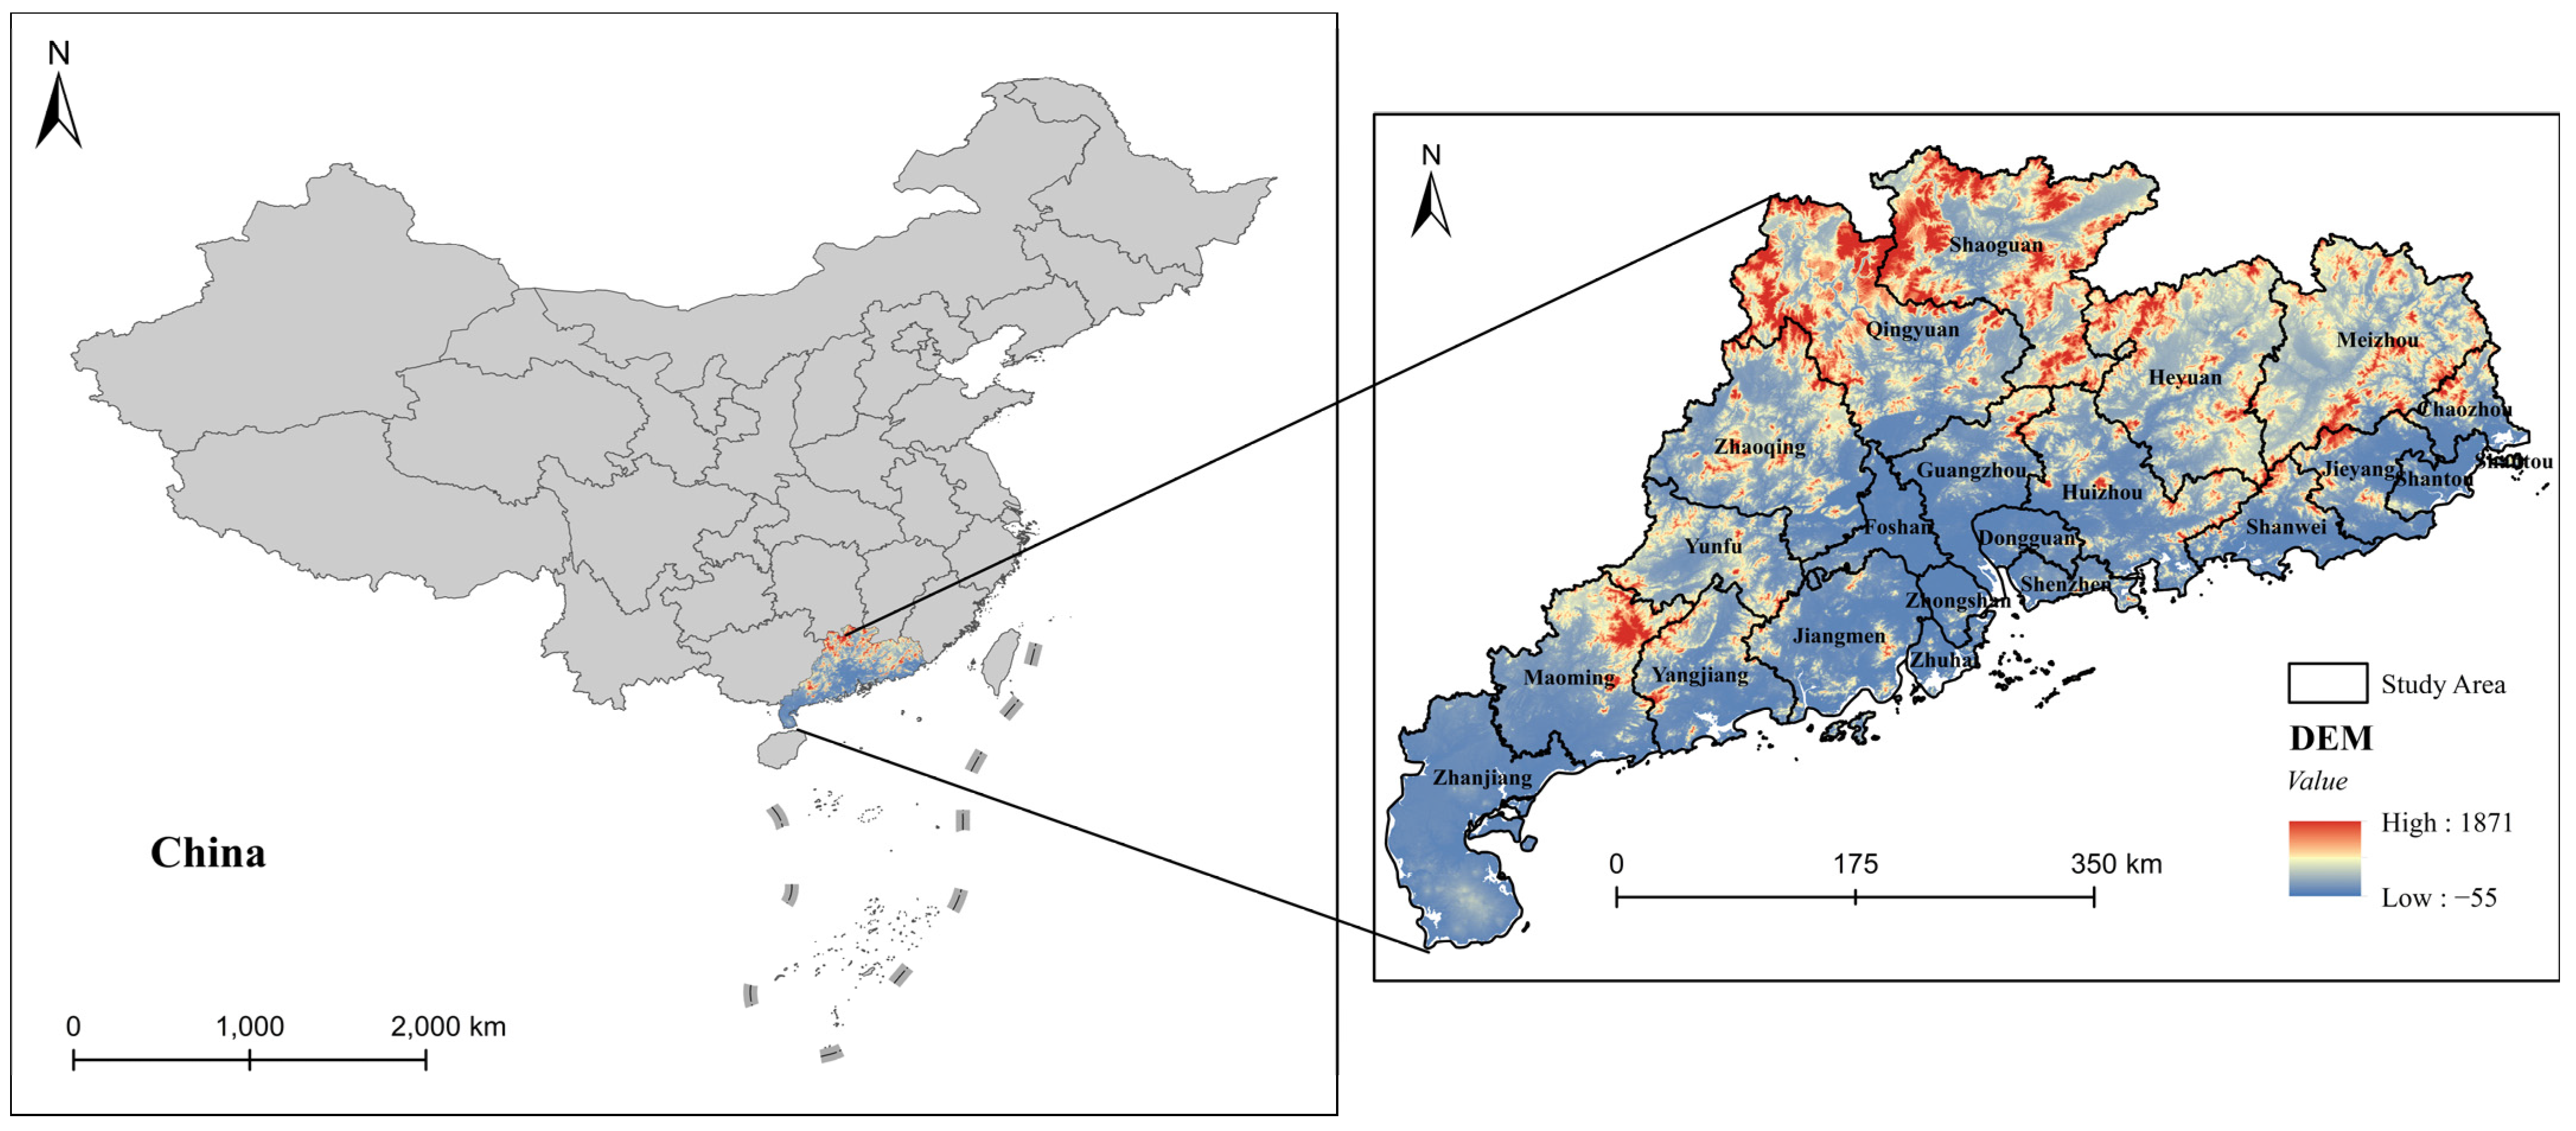
Guangdong Province was selected as the study area due to its unique locational advantages, distinctive human–environment interactions, and typical regional developmental disparities. Although it accounts for only 1.9% of China’s total land area, Guangdong supports 8.9% of the national population and generates 10.9% of the national economic aggregate. Consequently, the province faces prominent human–environment contradictions, alongside significant pressure to balance cultivated land protection with economic development. Furthermore, imbalanced urban–rural and regional development remains a major challenge in Guangdong. Specifically, Eastern, Western, and Northern Guangdong cover nearly 70% of the province’s land area but contribute less than 20% of its total economic output (Figure 1). Spatially, the Pearl River Delta exhibits a highly concentrated population and dense construction land. In contrast, the other three regions feature relatively scattered populations and uneven construction land layouts. This regional disparity in the spatial matching of human–environment elements closely corresponds to the spatial differentiation of multidimensional common prosperity [48]. Therefore, Guangdong serves as an ideal empirical sample. By focusing on this region, this study can precisely capture the complex evolutionary characteristics of human–environment interactions. Furthermore, it allows for a clear analysis of their differentiated effects on multidimensional common prosperity. Ultimately, the research findings derived from this typical case possess broad application value.

2.2. Study Data

2.2.1. LandScan Data

LandScan provides high-resolution population distribution data based on multi-source information modeling [49]. It accurately reflects real spatial population patterns. Therefore, this dataset was selected as the core data for this study. It was utilized to depict Guangdong’s population distribution and analyze human–environment coupling relationships. LandScan offers distinct advantages over traditional administrative-level statistical data. These advantages include stronger spatial continuity, higher resolution, and superior accuracy in depicting population agglomeration and diffusion. Consequently, this dataset is widely applied in related research [50]. Such studies typically focus on human–environment interactions, regional development disparities, and environmental carrying capacity.
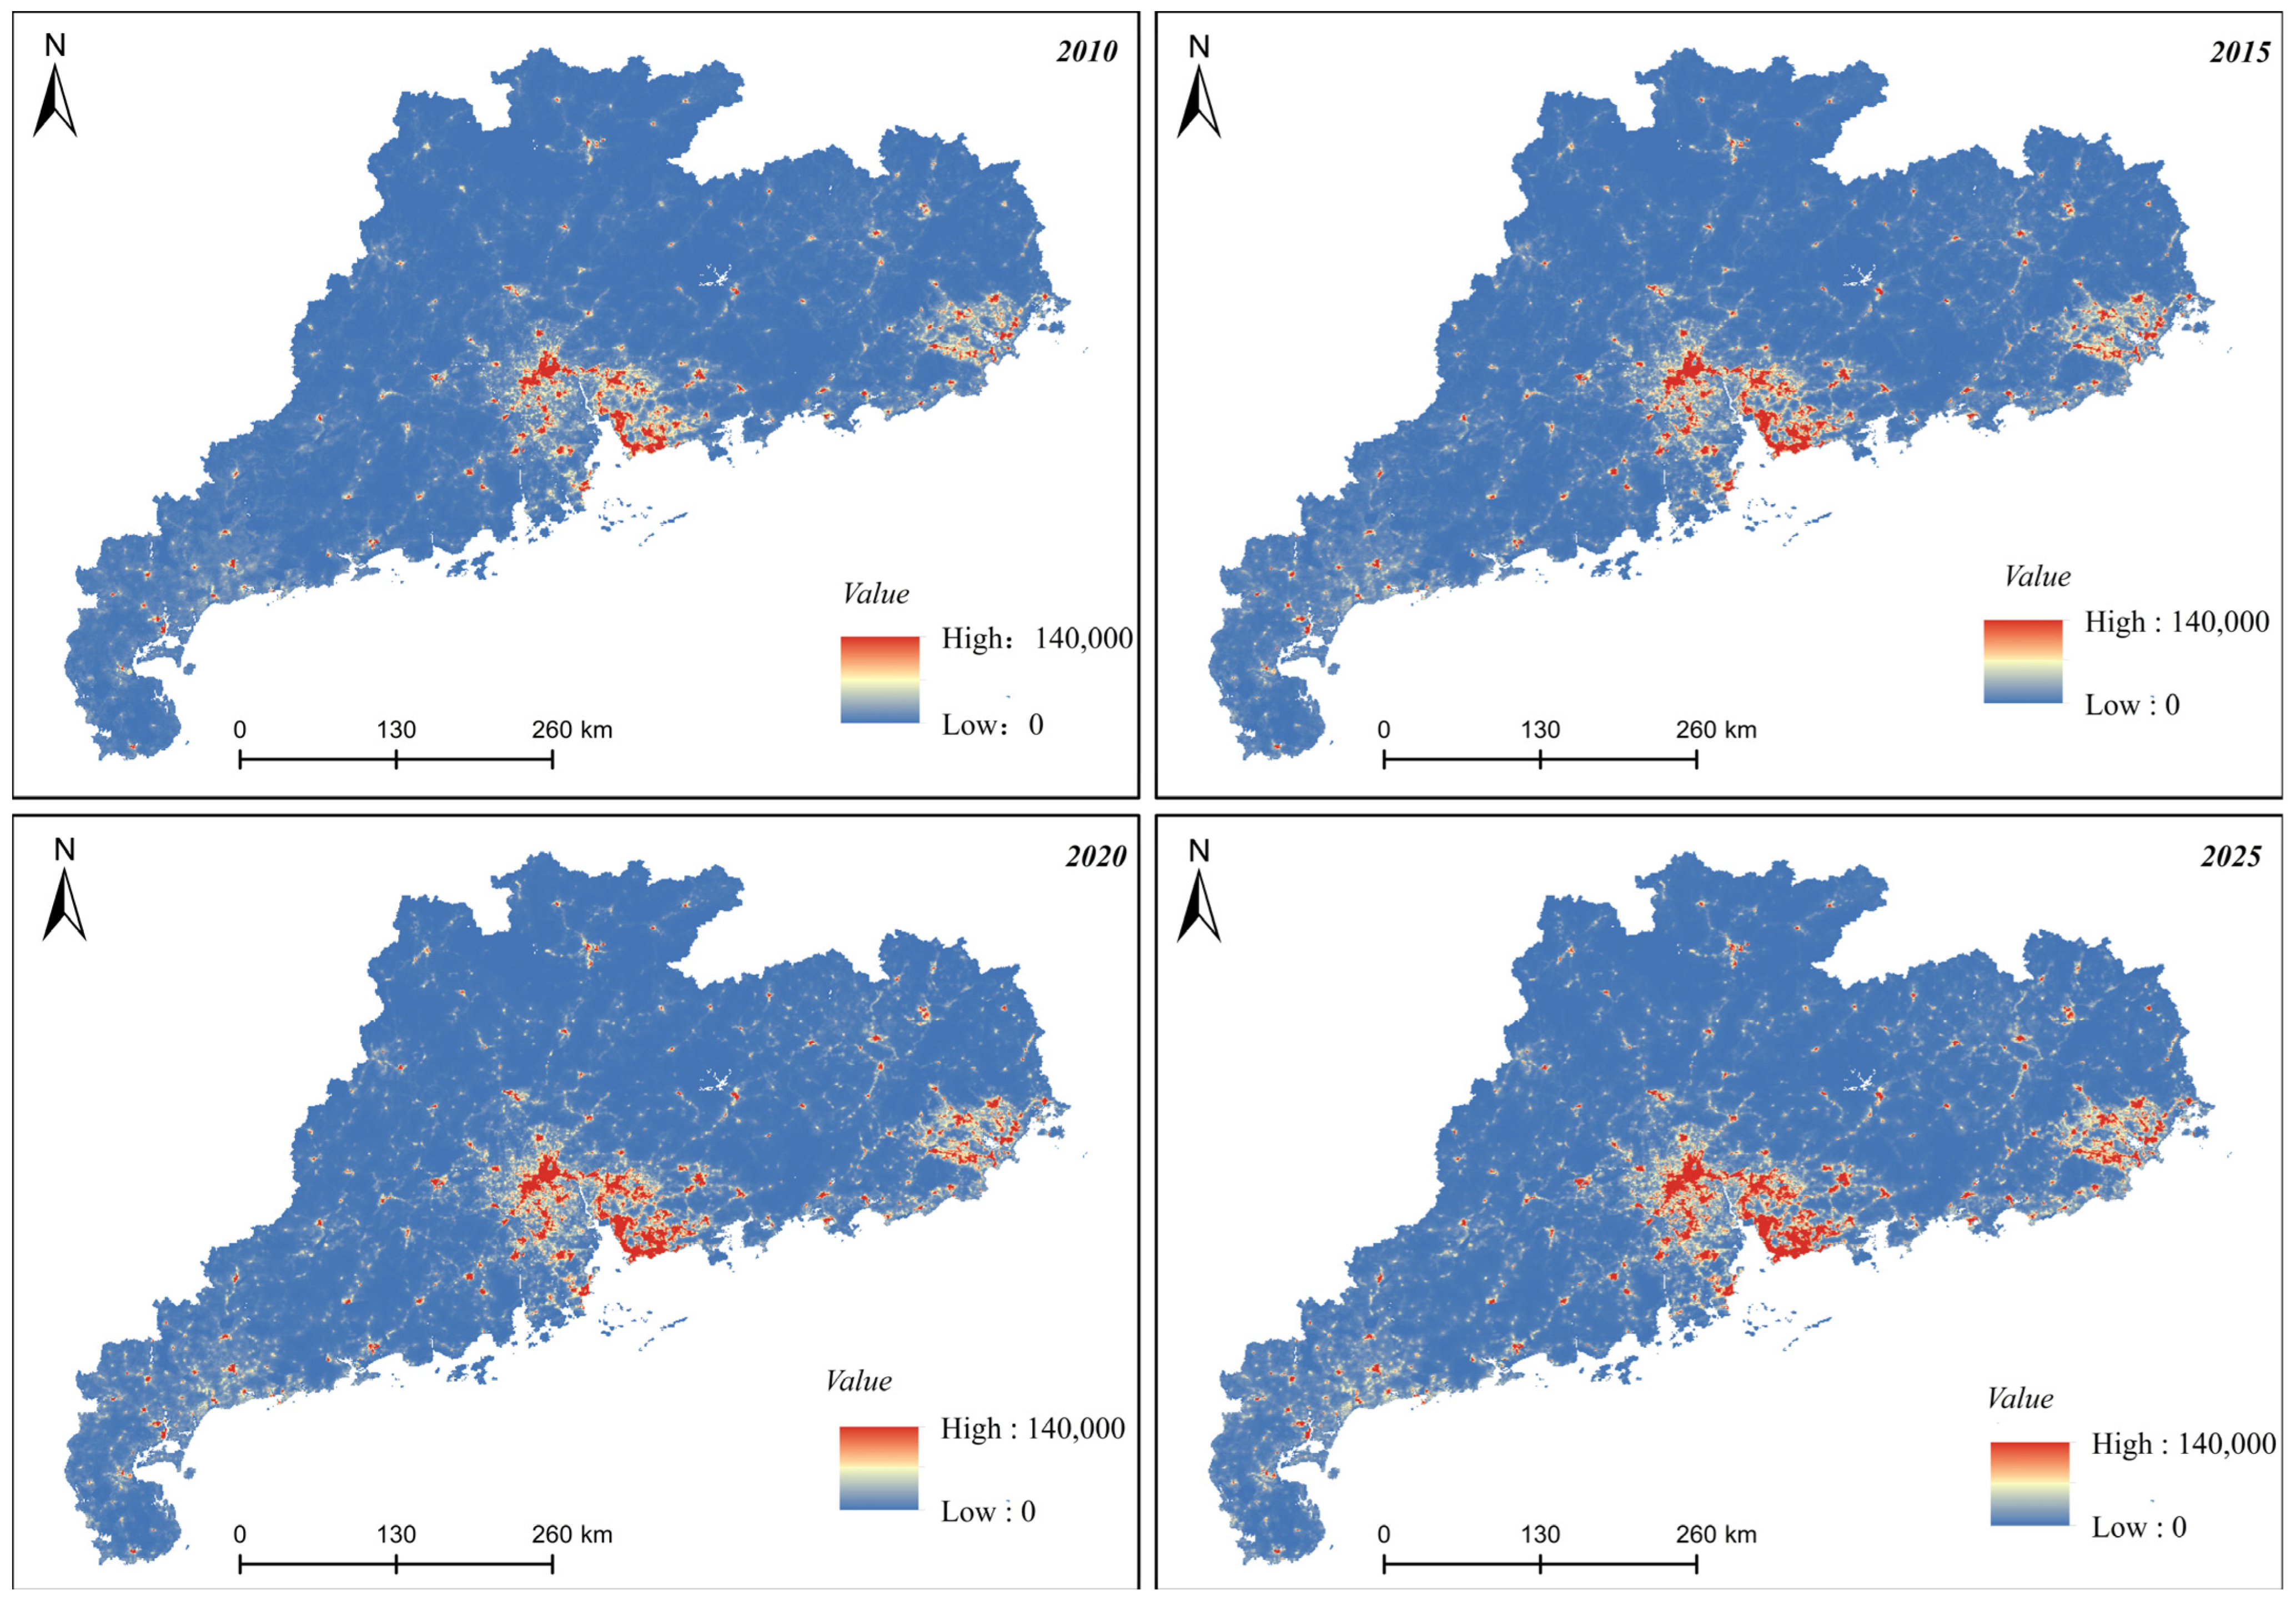
The LandScan population data is published by the Oak Ridge National Laboratory (ORNL). It is a global high-resolution population raster product. The spatial resolution of this dataset is 1 km. The raw data was acquired from the official LandScan platform (https://landscan.ornl.gov). Systematic preprocessing was applied to the dataset. This process included indicator conversion and dimensional unification. It also involved outlier screening, correction, and spatial consistency verification. Following preprocessing, population density raster data was generated. This final dataset covers the entire Guangdong Province and its municipalities from 2010 to 2025 (Figure 2).

2.2.2. CLCD Data

The China Land Cover Dataset (CLCD) is published by Wuhan University. It is a high-resolution land cover dataset derived from multi-source remote-sensing images [51]. This dataset accurately reflects the spatial distribution and dynamic evolution of regional land use types. Therefore, the CLCD was selected as the core data for this study. It was utilized to extract construction land information in Guangdong Province and depict the spatial patterns of human–environment interactions. Compared to traditional statistical data and low-resolution products, the CLCD offers higher spatial resolution, stronger temporal continuity, and better classification accuracy. It precisely captures the spatial differentiation and dynamic changes of land use. Consequently, this dataset has been widely applied in studies concerning human–environment coupling, land-use transition, urbanization, and ecological monitoring [52].
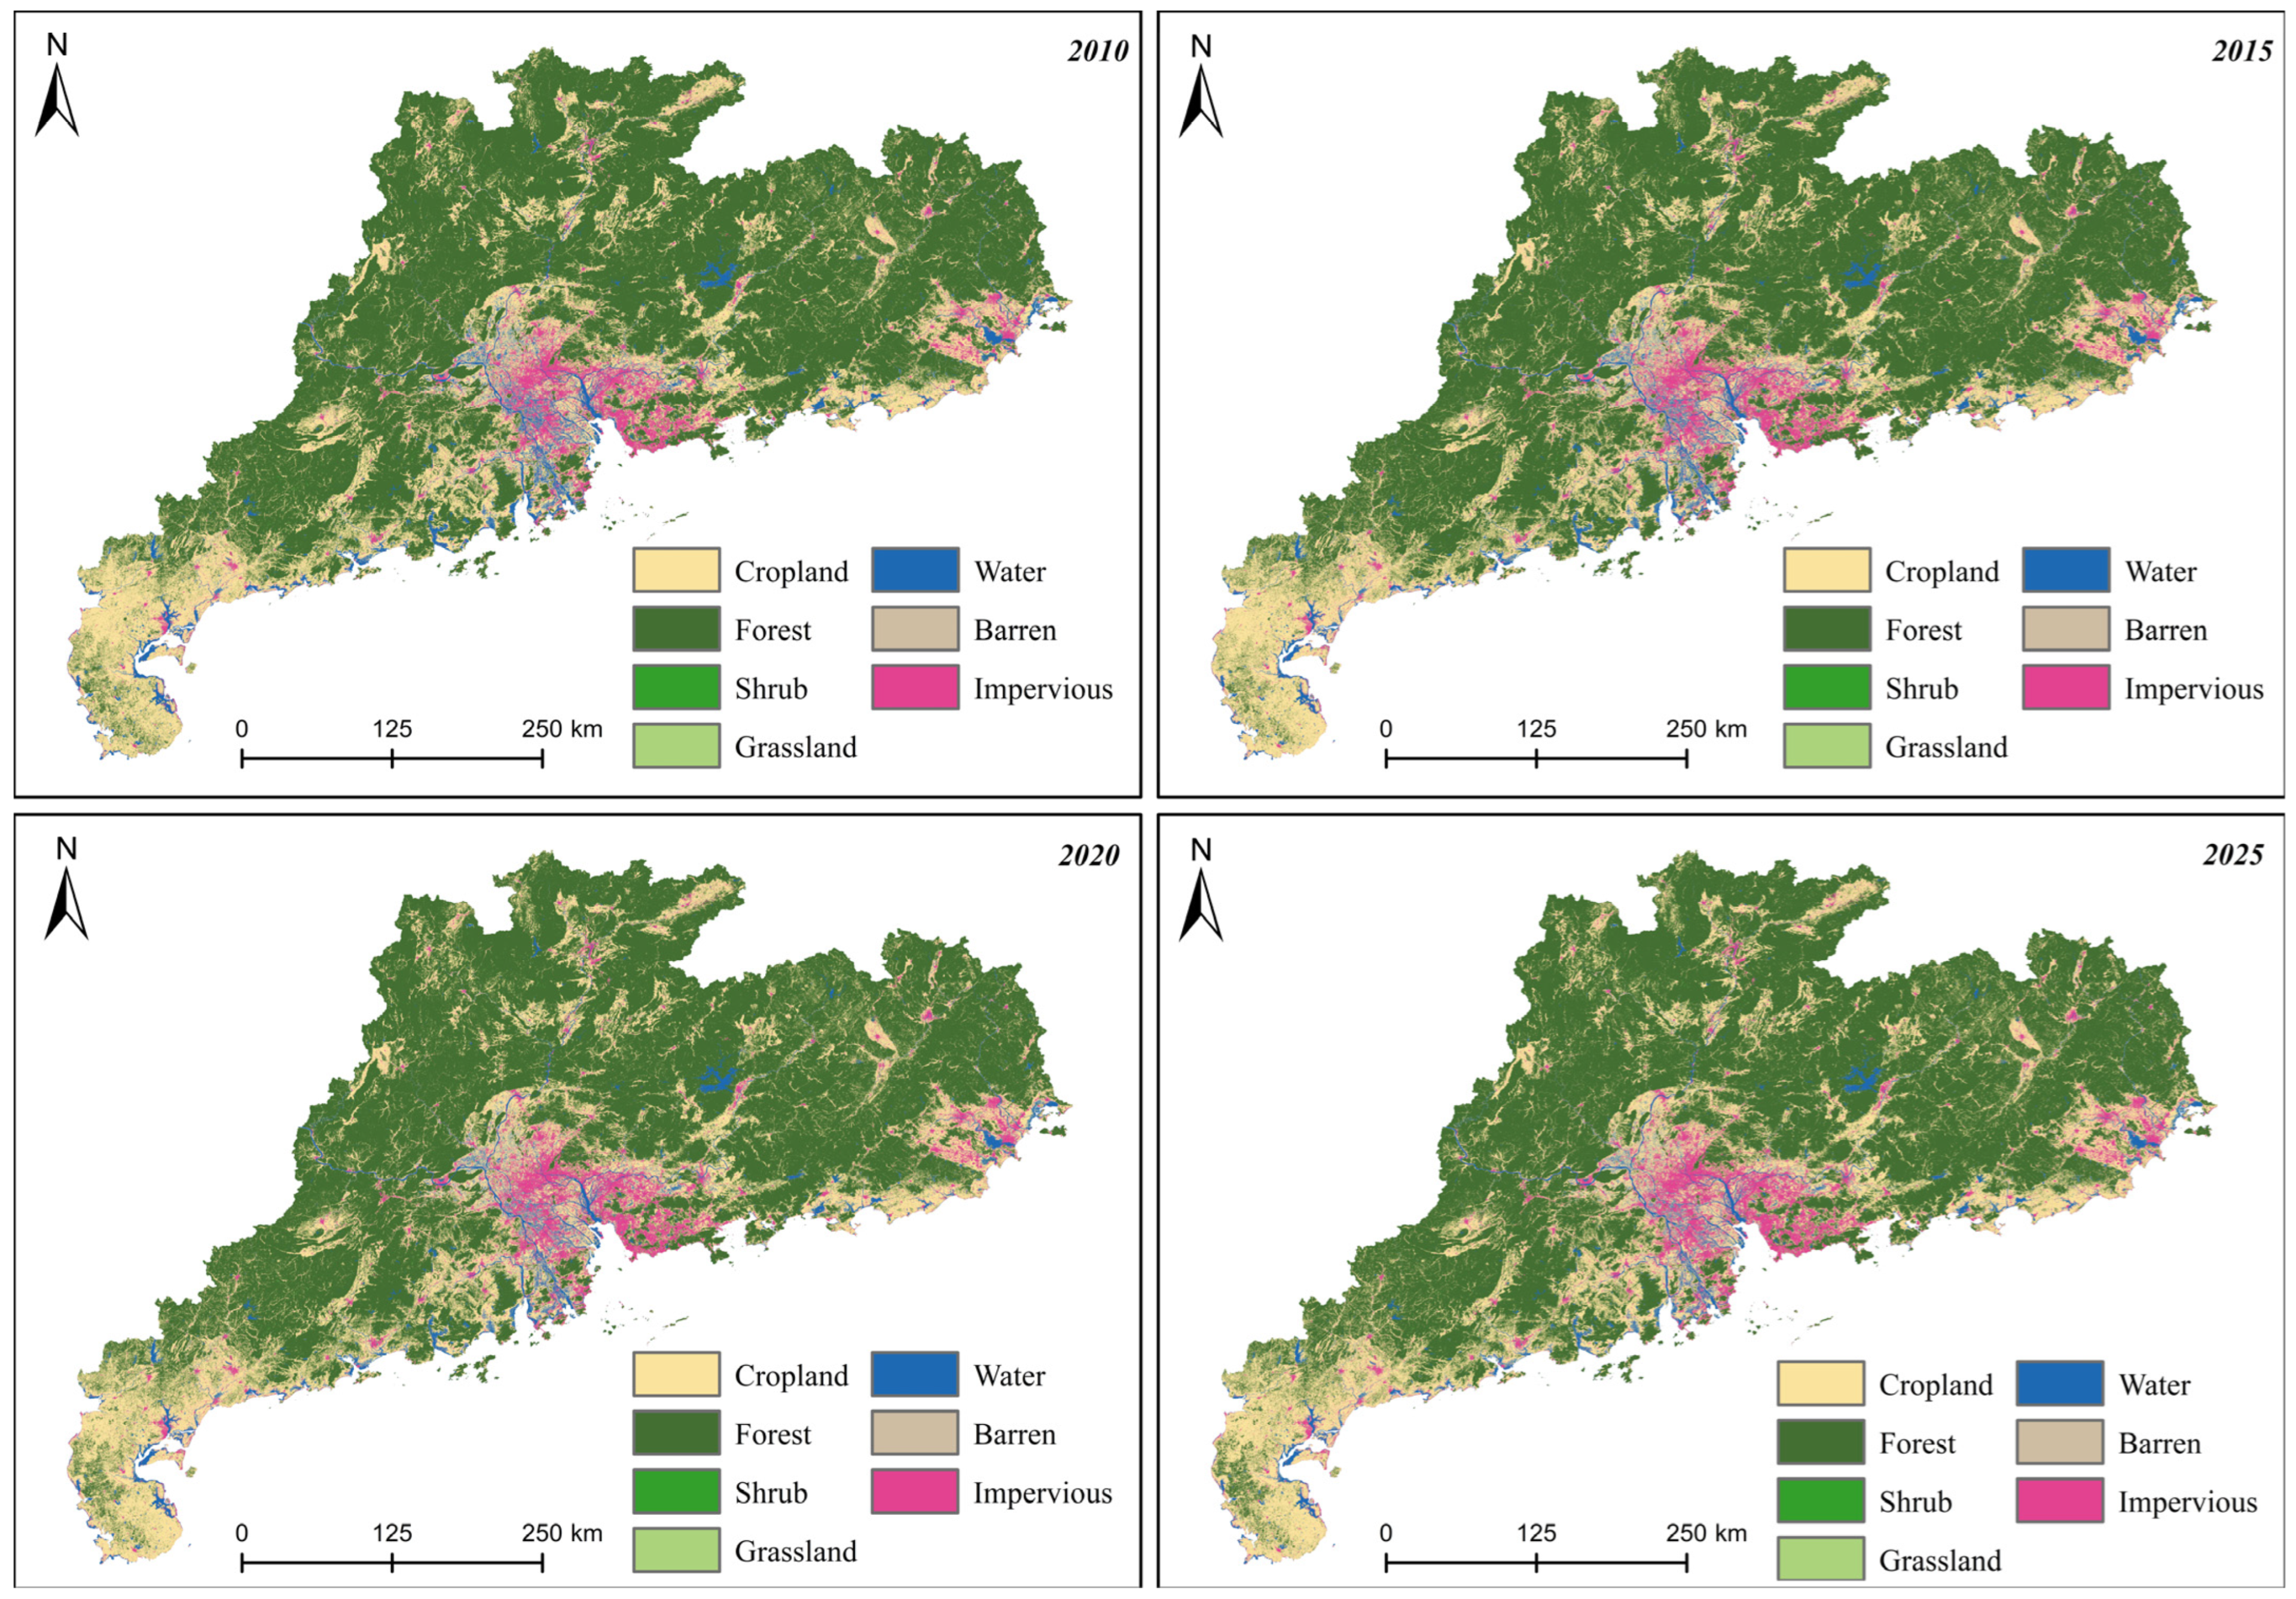
To facilitate further analysis, the CLCD data was preprocessed. This procedure included format conversion, regional clipping, and construction land extraction. It also involved noise removal, boundary correction, and spatial consistency verification. Following these steps, construction land raster data was generated. This final dataset covers the entire Guangdong Province and its municipalities from 2010 to 2025 (Figure 3, Table 1).

2.2.3. Common Prosperity Index

The Common Prosperity Index systematically reflects the comprehensive quality of regional development. Therefore, it was selected as the core statistical data for this study. It was utilized to quantify regional balance and represent the effects of human–environment coupling. Compared to single economic indicators, this multidimensional dataset offers a balanced and comprehensive evaluation. It precisely captures regional performance across material supply, public services, ecological security, and innovation-driven development. Consequently, this index has been widely applied in evaluating coordinated regional development at county and municipal scales. To quantitatively represent Guangdong’s prosperity level, an evaluation system was constructed [53,54,55]. This system is based on three primary dimensions: prosperity, sharing, and sustainability. Additionally, it includes 6 secondary indicators and 19 tertiary basic indicators (Table 2).
Specifically, the prosperity dimension includes two secondary indicators: material prosperity and spiritual prosperity. It directly reflects residents’ income levels, living security, and cultural supply capacity. The sharing dimension contains two secondary indicators: public service equalization and regional development coordination. It captures disparities in resource allocation, such as education, healthcare, and elderly care. Additionally, it measures the development balance between urban and rural areas and among counties. The sustainability dimension comprises two secondary indicators: ecological environmental quality and technological innovation capacity. This dimension highlights the foundation of regional green development and the driving forces for endogenous growth.
The basic data for evaluating common prosperity were collected from authoritative public statistics. Primary sources included the Guangdong Statistical Yearbook, Guangdong Rural Statistical Yearbook, China City Statistical Yearbook, and the annual municipal statistical bulletins. Additionally, ecological indicators were supplemented by annual public monitoring data from the Department of Ecology and Environment of Guangdong Province. These official sources strictly ensure the consistency, authority, and reliability of the indicators. Ultimately, a standardized panel database (from 2010 to 2025) was constructed for Guangdong Province and its prefecture-level cities. This database supported the subsequent empirical analysis of human–environment coupling and prosperity differentiation mechanisms (Table 3).

2.3. Methods

2.3.1. Coupling Coordination Degree

The coupling coordination degree (CCD) model is a quantitative method based on systems theory [56]. It evaluates the coordinated development of multiple systems by quantifying their interactions and interdependence. Its core logic measures the coupling and coordination degrees to reveal evolutionary patterns. In this study, the CCD model was applied to analyze the human–environment coupling state in Guangdong Province. Specifically, it quantified the interaction intensity and coupling association between population and land subsystems. Furthermore, it assessed their coordinated development levels. This evaluation provided a solid foundation for analyzing how human–environment coupling affects multidimensional common prosperity [57,58,59].
The calculation of the coupling coordination degree model in this study includes two steps, namely the calculation of the coupling degree and the calculation of the coordination degree, and the specific formulas are as follows.
Coupling degree:
C = U 1 × U 2 ( U 1 + U 2 ) 2
Coordination degree:
D = C × T
T = α U 1 + β U 2
where C represents the degree of human–environment coupling, and its value ranges from 0 to 1. The closer C is to 1, the stronger the interaction between the population system and the land system is. D represents the degree of human–environment coupling coordination, and its value ranges from 0 to 1. It is the core indicator that measures the level of coordinated development between the population system and the land system. The closer D is to 1, the higher the level of coordinated development between the two systems is. U 1 represents the comprehensive development index of the population system. It was calculated using standardized LandScan 1 km population density raster data. This index reflects the intensity of regional population agglomeration, spatial distribution balance, and population carrying efficiency. Similarly, U 2 represents the comprehensive development index of the land system. It was derived from CLCD construction land raster data by extracting and standardizing construction land density, proportion, and spatial intensification. This index reflects land development intensity, spatial layout rationality, and overall land-use efficiency. T represents the comprehensive development level index of the human–environment system, which serves to revise the influence of coupling degree on coordination degree and improve the scientific nature of the calculation results. α and β represent weight coefficients. In light of the focus of this study and considering that population elements and land elements have equal importance in human–environment interaction, this study sets α equal to β equal to 0.5.

2.3.2. Random Forest

Random forest is an ensemble learning algorithm proposed by Breiman in 2001 [60]. It performs classification and regression through the integrated voting of multiple decision trees. The algorithm constructs these independent trees using bootstrap resampling. It then uses out-of-bag (OOB) data to verify model accuracy. Furthermore, RF quantifies the contribution of each indicator by calculating feature importance. These contributions are subsequently converted into indicator weights. Therefore, RF serves as an objective and efficient machine learning weighting method [61,62].
This study calculates the weights of 19 common prosperity indicators on the basis of the random forest feature importance weighting method, and the core formulas and steps are as follows, which mainly center on the calculation of feature importance and the normalization of weights.
Feature importance:
I m p o r t a n c e j = t = 1 T Δ G i n i t . j
t = 1 T Δ G i n i t . j = G i n i t . p a r e n t k = 1 2 n t , k n t , p a r e n t G i n i t . k
Indicator weight normalization:
W j = I m p o r t a n c e j j = 1 m I m p o r t a n c e j
where I m p o r t a n c e j represents the feature importance of the j-th third-level indicator of common prosperity, and its value range is from 0 to positive infinity. The larger the value is, the higher the contribution of this indicator to the overall level of common prosperity. T represents the number of decision trees in the random forest. G i n i t . j represents the reduction in the Gini coefficient when the j-th indicator splits in the t-th decision tree, and it is the core indicator for measuring indicator importance. W j represents the final weight of the j-th third-level indicator of common prosperity, and its value range is from 0 to 1. The sum of the weights of all 19 indicators is 1, which ensures the normativeness and additivity of the weights. m represents the total number of third-level indicators of common prosperity, and in this study, m equals 19, which covers all third-level indicators under the three dimensions of prosperity, sharing, and sustainability.
The comprehensive index of common prosperity is calculated as follows:
C P = j = 1 19 W j × Z j
where W j represents the weight of the j -th indicator. Z j denotes its min–max normalized score.

2.3.3. Geographically Weighted Regression (GWR)

Geographically Weighted Regression (GWR) is a local spatial regression method based on spatial heterogeneity theory. It breaks the traditional assumption of homogeneous global regression coefficients. By assigning specific weights to samples at different spatial locations, the algorithm constructs local regression models. This mechanism allows regression coefficients to vary spatially. Consequently, GWR accurately captures the spatial heterogeneity of how explanatory variables affect dependent variables. It also quantifies regional differences in both influence intensity and direction. Therefore, GWR serves as a crucial empirical method in geography for exploring spatially differentiated mechanisms [63,64].
Its basic form is as follows.
y i = β 0 u i + β 1 u i x i 1 + β 2 u i x i 2 + + β k u i x i k + ε i
where y i is the value of the dependent variable at observation point i . u i is the geographic coordinate of observation point i . β 0 u i is the spatial weight coefficient of the constant term, which changes with geographic location. + β k u i is the spatial regression coefficient of each independent variable, which also changes with geographic location u i . x i k is the value of independent variable k at point i . ε i is the error term.

3. Results

3.1. Spatiotemporal Distribution Characteristics of Human–Environment Coupling Coordination

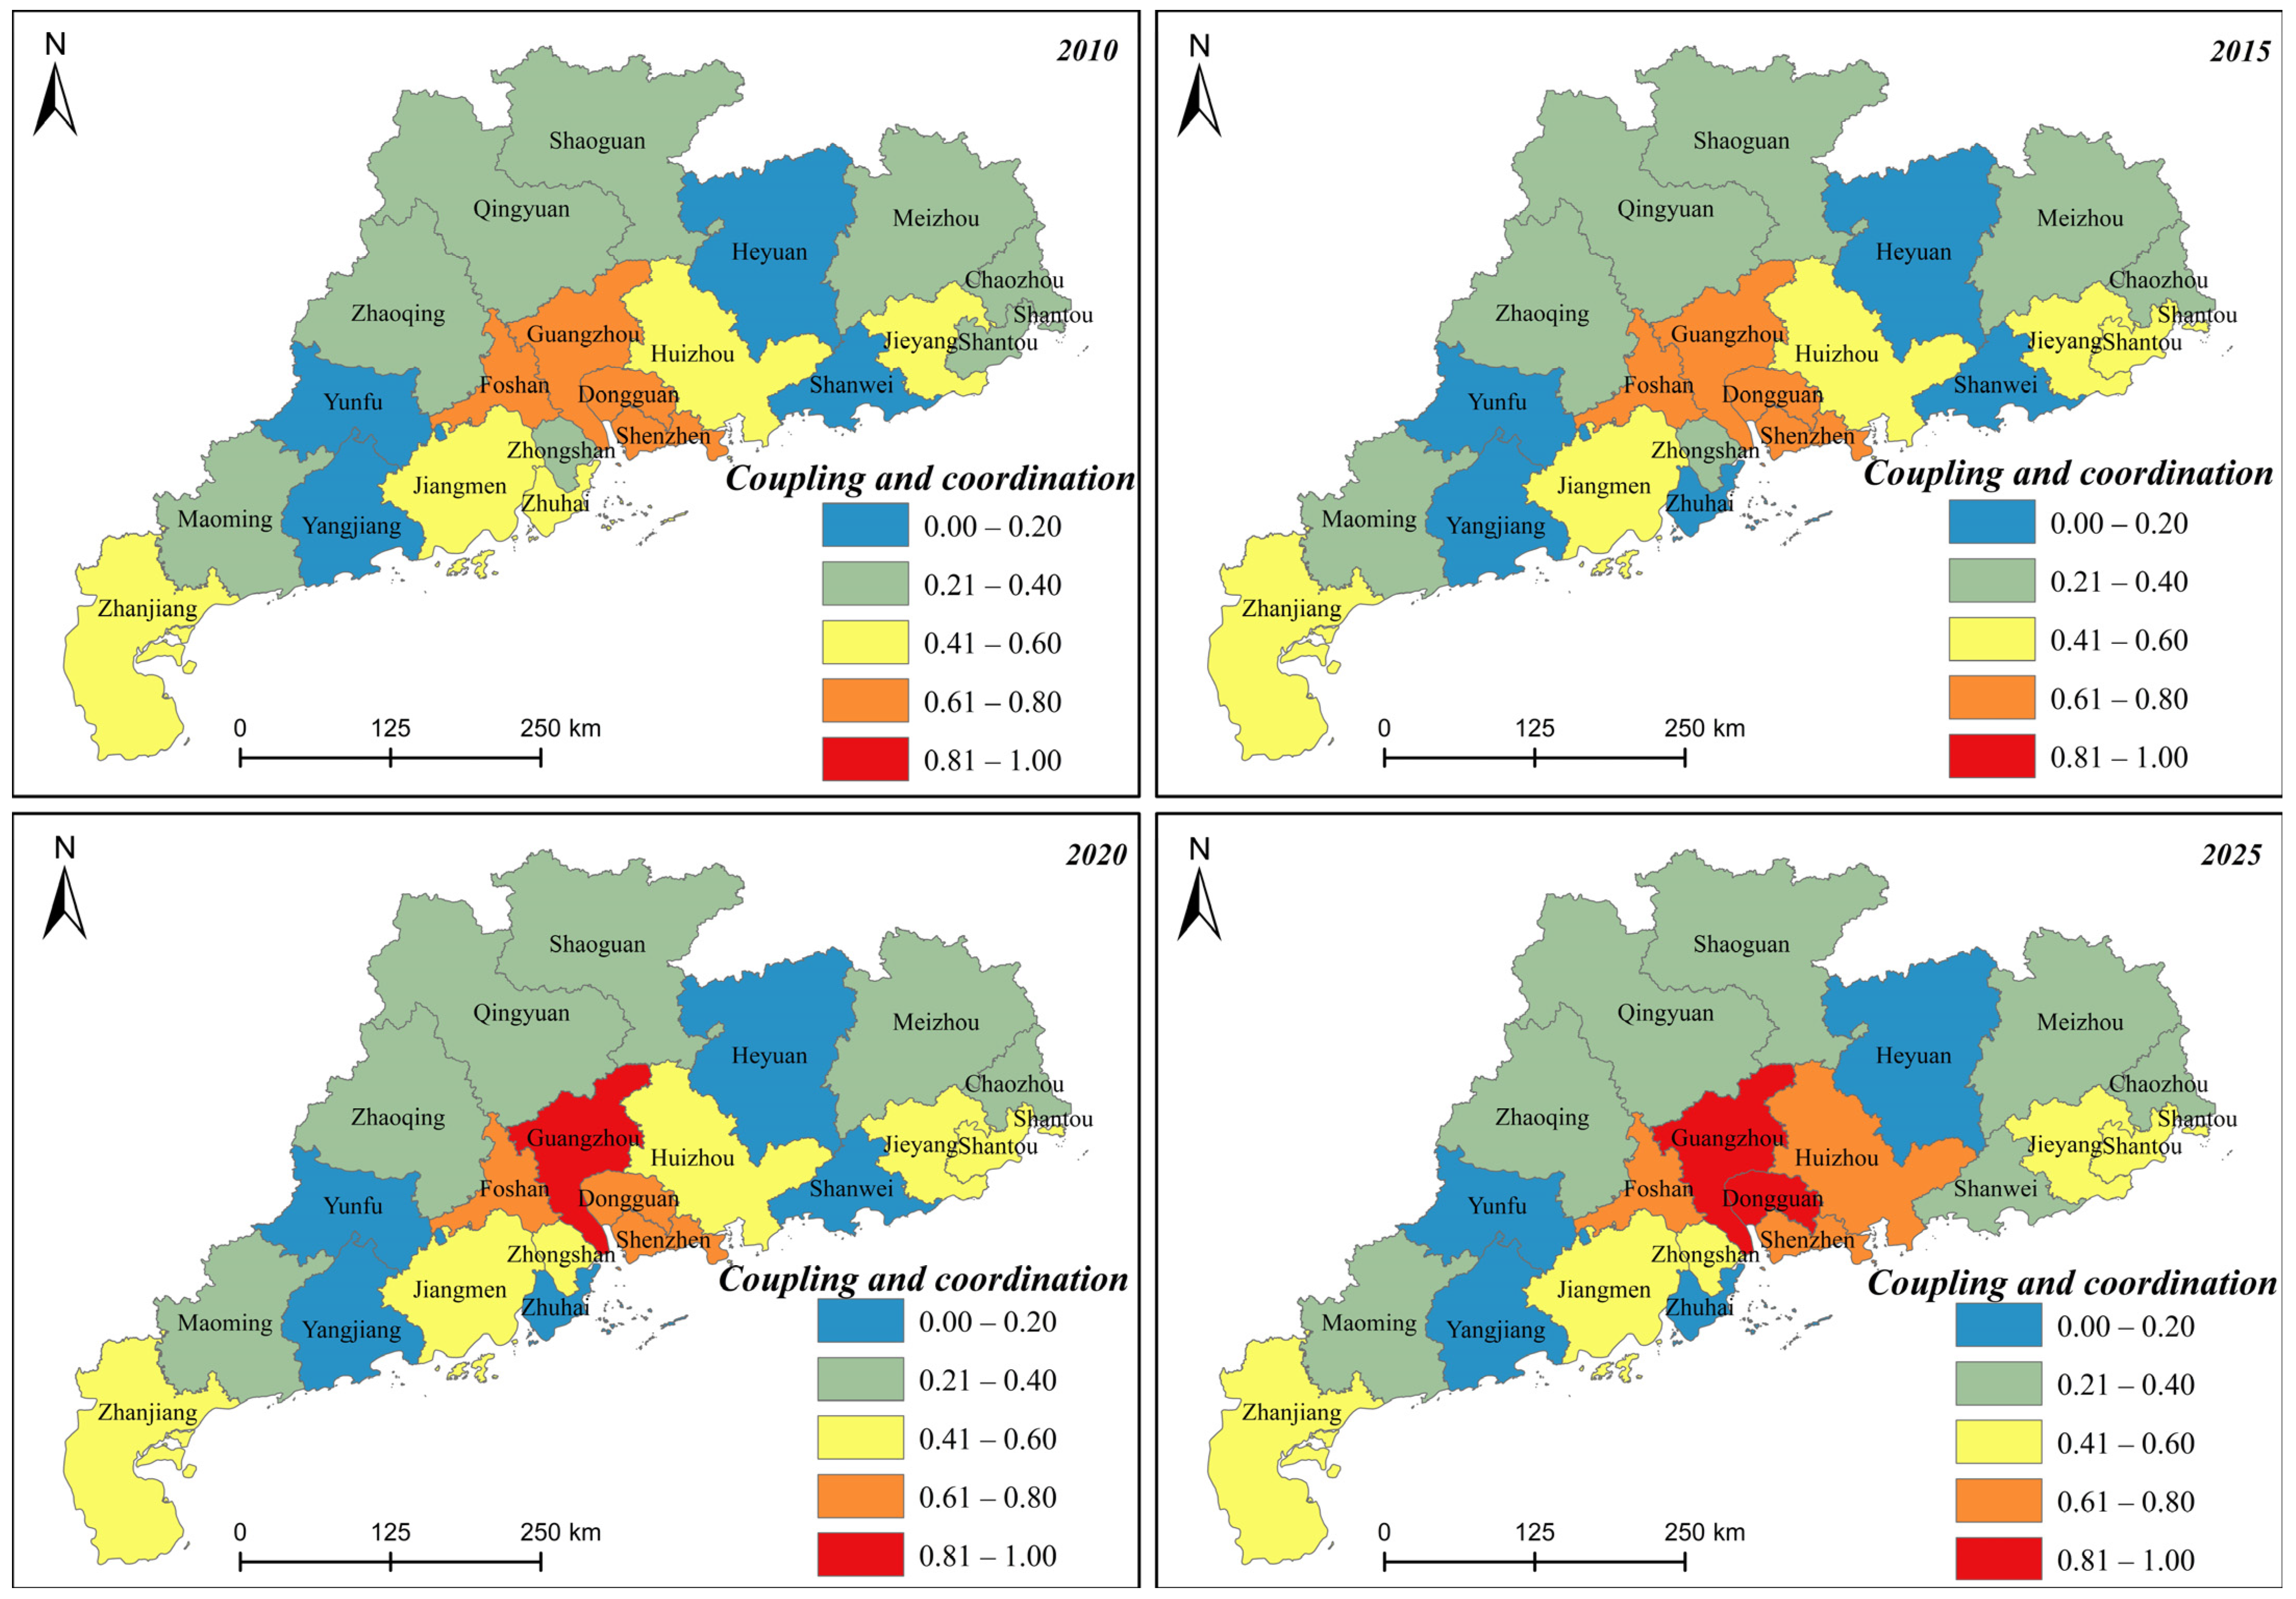
Figure 4 shows the spatiotemporal distribution of human–environment coupling coordination in Guangdong Province (from 2010 to 2025). Temporally, the overall coordination showed a significant upward trend. In 2010, the provincial average was relatively low. Most regions experienced low-level coordination or disorder, indicating prominent human–environment contradictions. These contradictions primarily manifested as mismatched population agglomeration and construction land layouts, alongside low resource utilization efficiency. By 2025, the provincial average improved significantly compared to 2010. Most regions transitioned from low-level to medium- or high-level coordination. Overall, human–environment interactions became more harmonious.
Spatially, the human–environment coupling coordination in Guangdong Province exhibited a clear core–periphery differentiation. Spatial agglomeration was significant, accompanied by obvious regional gaps. High-coordination areas were primarily concentrated in the core Pearl River Delta, particularly in Guangzhou, Shenzhen, Dongguan, and Foshan. As the province’s economic engine, this region possessed dense populations and highly efficient construction land use. This enabled a strong match between population and land elements, resulting in prominent human–environment coordination. Conversely, low-coordination regions were mainly located in Eastern and Western Guangdong. These areas experienced lagging economic development, scattered populations, and unbalanced construction land layouts. Consequently, coordination between population agglomeration and land use was insufficient, which exacerbated human–environment contradictions. This spatial pattern aligned with the regional development gradient of Guangdong Province. It highlighted the critical influence of economic levels, population agglomeration, and land-use efficiency on coupling coordination.
Regarding regional variations, the improvement rate of coupling coordination varied significantly across cities from 2010 to 2025. Overall, peripheral areas improved faster than core areas. The core cities (Guangzhou, Shenzhen, Dongguan, and Foshan) possessed high initial coordination levels, leaving limited room for further growth. Consequently, their improvement remained moderate. Conversely, peripheral regions (Eastern, Western, and Northern Guangdong) started with lower coordination. However, as the infrastructure improved, industrial transfers advanced, and population agglomeration strengthened, their population–land coordination increased significantly. Thus, their growth rate outpaced the core Pearl River Delta, gradually narrowing the regional gap. These differences stemmed from distinct development foundations, resource endowments, and regional strategies. The core region prioritized refining human–environment interactions, whereas peripheral areas focused on rectifying mismatched elements.

3.2. Spatiotemporal Distribution Characteristics of Common Prosperity

The random forest model calculated the following weights: per capita GDP (0.086), per capita disposable income (0.092), Engel’s coefficient (0.041), labor productivity (0.075), and per capita years of education (0.079). Subsequent weights included public library books per 100 people (0.053), cultural industry employment proportion (0.047), primary and secondary school student–teacher ratio (0.068), and hospital beds (0.072). Additional metrics were per capita road area (0.050), urbanization rate (0.061), urban–rural income gap (0.083), registered urban unemployment (0.039), and domestic waste treatment rate (0.022). Finally, the model yielded weights for per capita park area (0.025), CO2 emission intensity (0.031), built-up area green coverage (0.052), and the technology-to-fiscal expenditure ratio (0.044).
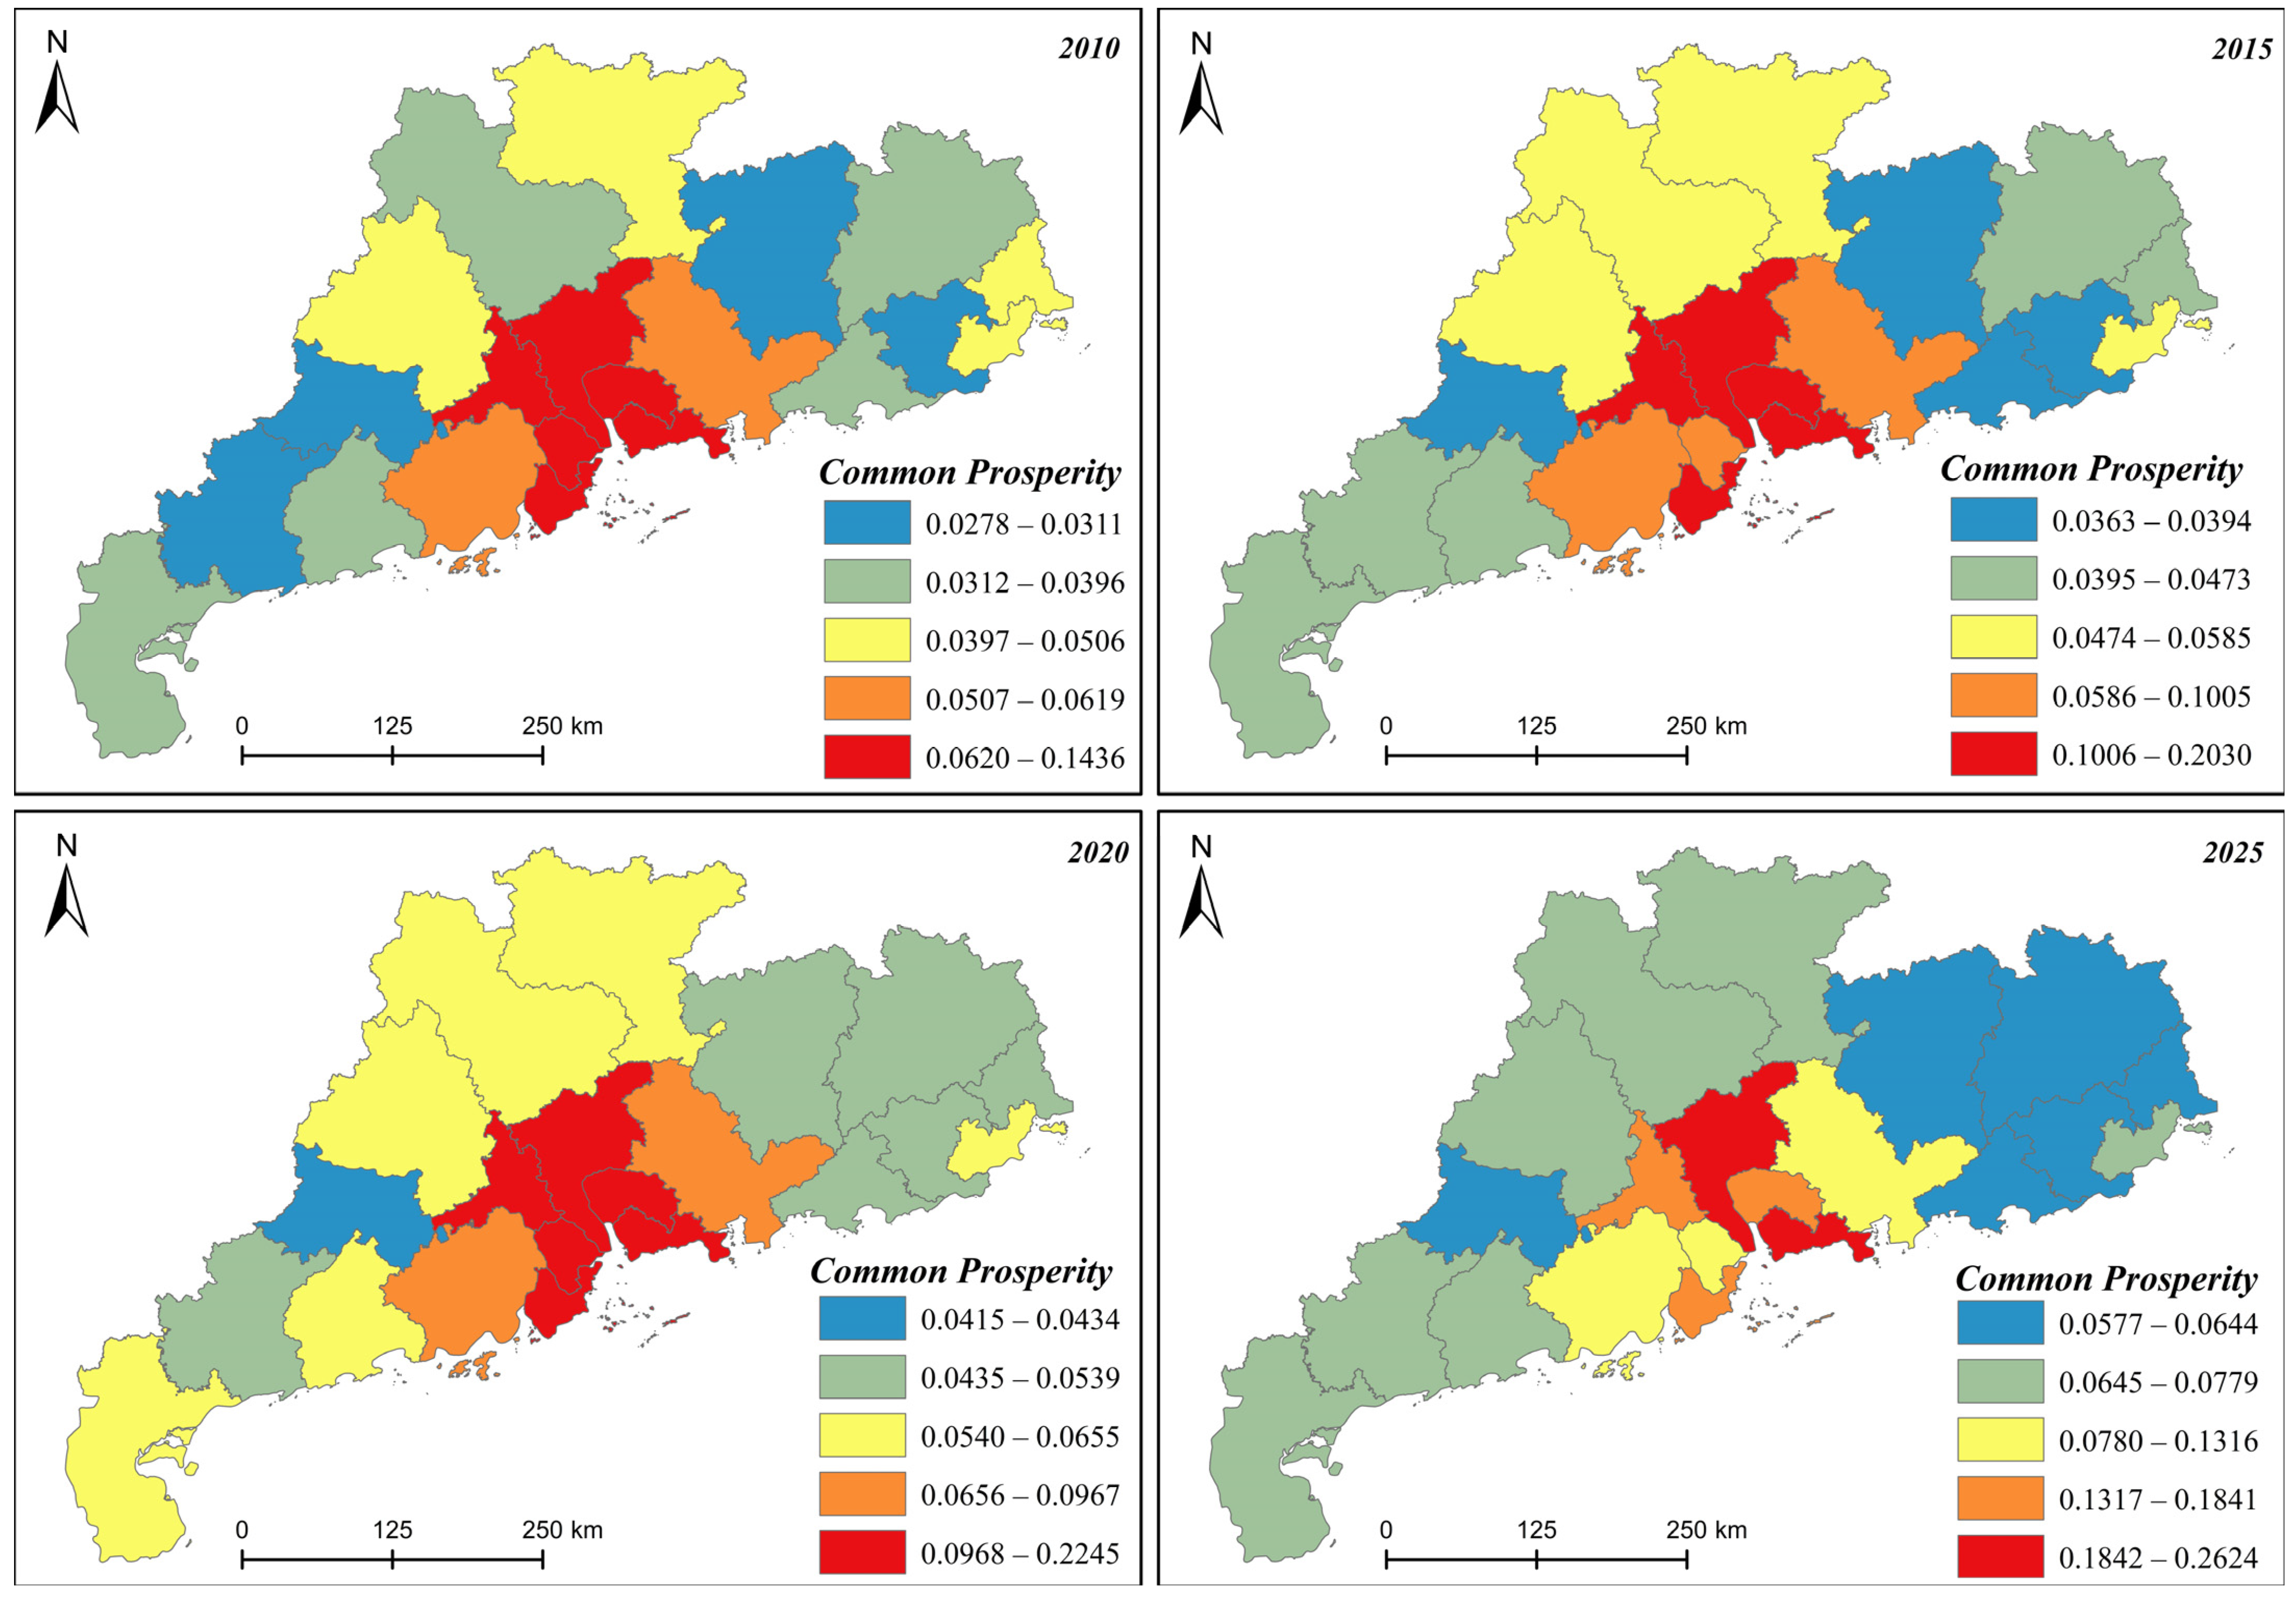
Temporally, the comprehensive index of common prosperity in Guangdong Province increased steadily from 2010 to 2025 (Figure 5). This upward trend strengthened the provincial development foundation. Furthermore, the overall development quality improved through the coordinated advancement of the three dimensions. However, compared to the significant improvements in coupling coordination, the growth of the common prosperity index remained moderate. Incremental progress was limited. This indicated that advancing common prosperity across regions progressed slowly and faced practical difficulties. Additionally, growth rhythms varied significantly across cities and regions with distinct development foundations. Consequently, a balanced pattern of synchronous provincial growth failed to emerge. Long-term developmental shortcomings and resource allocation gaps further constrained the rapid enhancement of common prosperity.
Spatially, high-value areas of common prosperity in Guangdong Province exhibited continuous contraction and intensified polarization during the study period. In 2010, the high-value circle covered core cities in the Pearl River Delta (PRD). Guangzhou, Shenzhen, Foshan, and Dongguan displayed clear advantages. These areas formed a broad, clustered, and contiguous high-level development zone. By 2025, this high-value range shrank significantly. Only Guangzhou and Shenzhen maintained their absolute high-value status. The advantages of other PRD cities weakened, dropping them from the top tier. Meanwhile, low-value areas remained concentrated in peripheral regions (Eastern and Western Guangdong) without significant improvement. Consequently, the high-level circle transitioned from a contiguous pattern to a dual-core leading structure, indicating highly concentrated spatial agglomeration.
Regarding regional differentiation, spatial imbalance increased from 2010 to 2025, gradually widening the regional gap. In 2010, the overall prosperity level was generally low. City development levels were close, and regional gaps were small, resulting in low spatial dispersion. Over time, this differentiation strengthened. By 2025, provincial disparities had expanded significantly. The gap between the core PRD and Western Guangdong became particularly prominent. The PRD maintained a higher development level due to its stronger economic foundation, superior public services, robust industrial agglomeration, and resource allocation advantages. In contrast, Western Guangdong progressed slowly. It faced constraints such as insufficient industrial momentum, lagging public services, and livelihood security shortcomings. Consequently, its gap with the PRD core widened. This reinforced a gradient spatial pattern: high levels in the core and low levels in the periphery.

3.3. Effects of the Human–Environment Coupling Coordination Relationship on Multidimensional Common Prosperity

We constructed a Geographically Weighted Regression (GWR) model to analyze spatial non-stationarity and regional heterogeneity. Human–environment coupling coordination served as the core explanatory variable. Dependent variables included the comprehensive common prosperity index, prosperity, sharing, and sustainability. This model quantified the direction, intensity, and spatial patterns of the impact coefficients across cities. Table 4 summarizes the core regression results.
The GWR model achieved a goodness of fit (R2) of 0.826 for the comprehensive index, indicating that human–environment coupling coordination effectively explained the spatial differences in regional common prosperity. The regression coefficients exhibited a spatial gradient pattern characterized by high positive values in the PRD core, a gradual decrease toward the periphery, and local negative values in Western Guangdong. By leveraging highly agglomerated populations and efficiently allocated construction land, the PRD core formed a linked system of production factors, industries, and public services. Thus, improvements in human–environment coordination rapidly translated into development momentum with strong driving effects and high elasticity. In contrast, constrained by weak resource allocation foundations and insufficient industrial absorption capacities in Eastern and Northern Guangdong, the optimization of the human–environment system struggled to generate comprehensive short-term development gains, resulting in a weaker driving effect. In parts of Western Guangdong, the coefficients turned slightly negative, revealing a transmission rupture between human–environment improvement and prosperity enhancement: land development and population agglomeration failed to simultaneously boost livelihood well-being, public services, and income levels. This reflected a structural contradiction of rapid spatial expansion alongside slow quality improvement.
The prosperity dimension achieved the highest goodness of fit (0.853). All regional regression coefficients were significantly positive, with no negative areas. This demonstrated that human–environment coupling coordination exerted a universal, robust, and long-term driving effect on material prosperity. The highest coefficients appeared in the PRD core. This primarily stemmed from the scale, agglomeration, and land-intensive effects generated by high-density populations and high-intensity construction land. Consequently, these effects significantly enhanced labor productivity, economic output, and residents’ incomes. Although coefficients in peripheral areas were lower, they remained positive. This indicated that an improved matching of human–environment factors could stably promote economic development and material living standards in both developed and underdeveloped regions. From the perspective of spatial heterogeneity, this result corroborated the previous conclusion: human–environment coordination serves as the foundational support for the prosperity dimension.
The sharing dimension achieved a goodness of fit of 0.791. Its spatial pattern exhibited a distinct divergence characterized by core inhibition and peripheral promotion. Consequently, it was the most heterogeneous among all dimensions. Significant negative coefficients appeared in high-coupling core areas, such as Guangzhou and Shenzhen. This indicated that a high level of human–environment coupling triggered a fairness threshold effect. Specifically, excessive population agglomeration caused public service congestion, while high-quality resources polarized toward the core. As a result, urban–rural and regional gaps further widened. Ultimately, efficiency gains from spatial optimization paradoxically weakened fairness. Conversely, cities in Eastern and Northern Guangdong, alongside the PRD periphery, predominantly exhibited significant positive coefficients. This demonstrated that, during the low-to-medium coupling stages, human–environment optimization significantly promoted public service equalization, narrowed urban–rural gaps, and enhanced development coordination. In most parts of Western Guangdong, the coefficients were largely non-significant. This implied that fairness improvement in these areas relied heavily on fiscal transfers and policy safety nets, rather than on spatial factor allocation. This finding clearly revealed a regional differentiation mechanism in pathways for enhancing fairness.
The sustainability dimension achieved the relatively lowest goodness of fit (0.682). Regression coefficients across the entire region were generally small and predominantly weakly positive. This indicated that human–environment coupling coordination exerted a limited direct driving effect and lacked elasticity regarding ecological sustainability. High values appeared exclusively in the ecological functional zones of Northern Guangdong and the fringe cities of the PRD. This was because these areas were oriented toward ecological protection. Consequently, their human–environment relationships approached a state of moderate development and carrying capacity equilibrium. In contrast, the PRD core exhibited high construction land density and immense development intensity. Here, human–environment optimization primarily served economic efficiency. Therefore, its marginal contribution to ecological improvement remained relatively low. Furthermore, coefficients in most parts of Eastern and Western Guangdong were non-significant. This suggested that ecological sustainability was predominantly driven by factors such as policy controls, environmental investments, and energy structures. Human–environment factor allocation merely played an indirect auxiliary role. From a spatial econometric perspective, this finding clearly confirmed a key conclusion: the human–environment relationship is not the core explanatory variable for ecological sustainability.
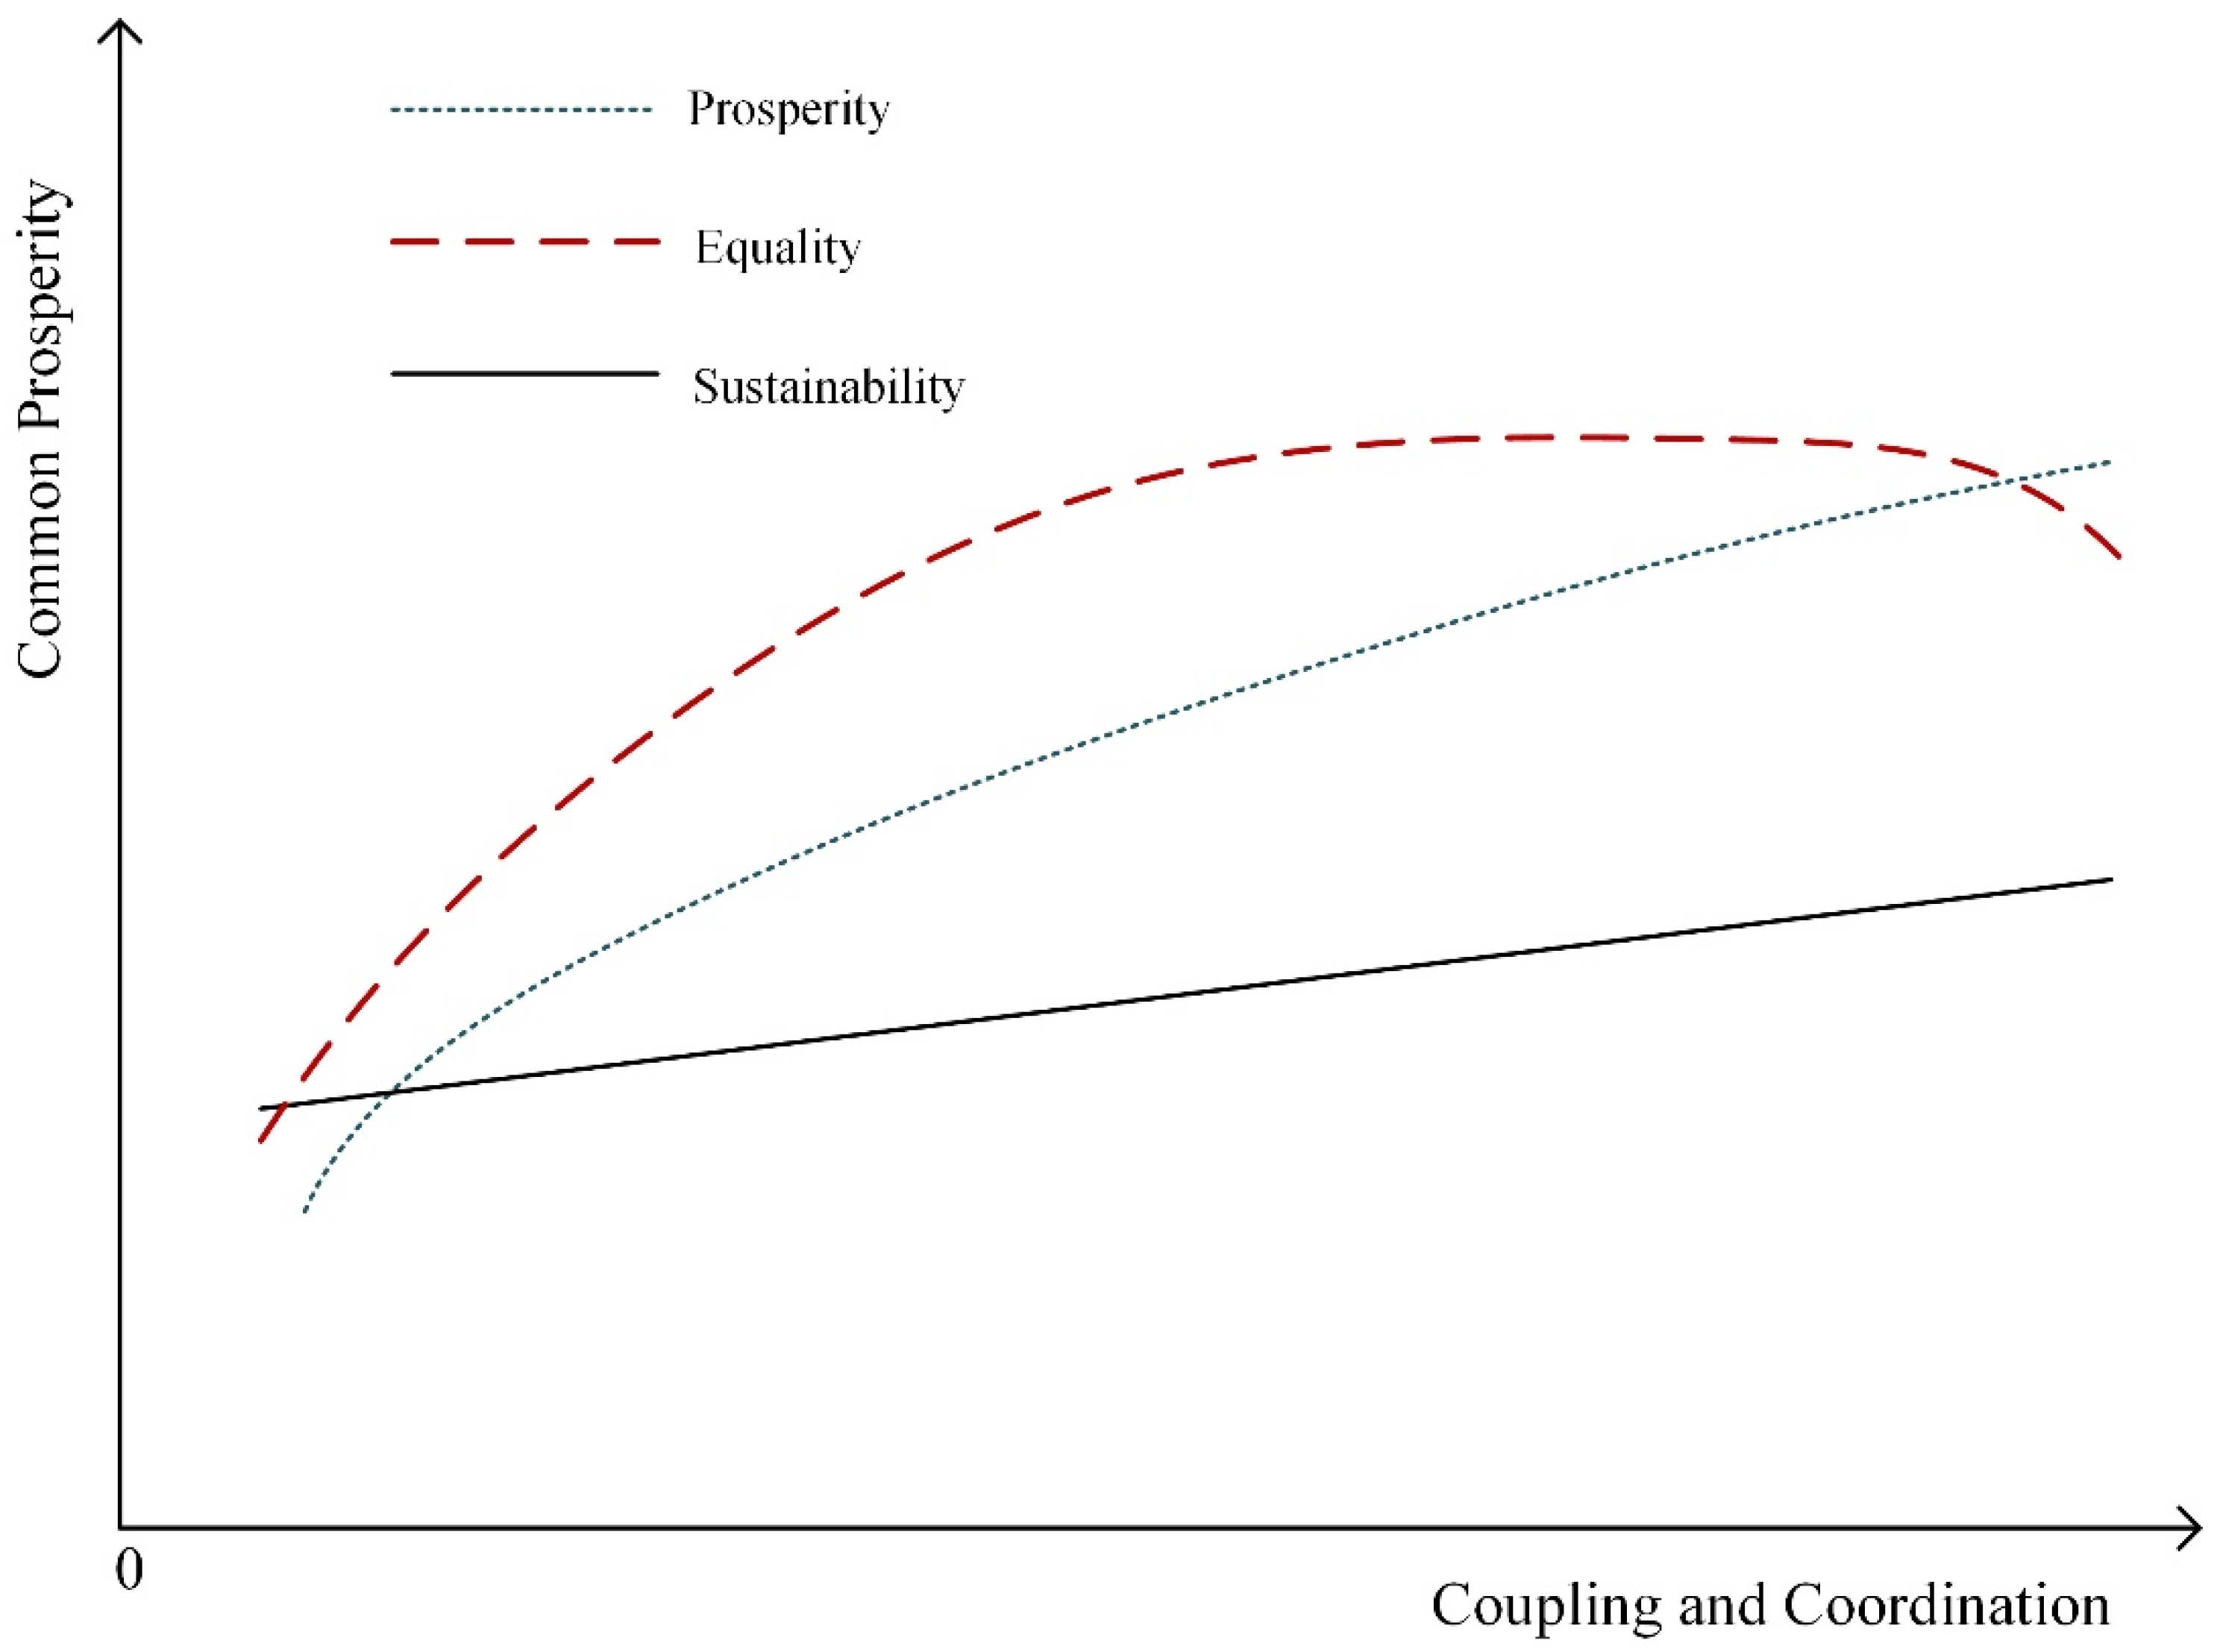
The differences in the effects of human–environment coupling coordination on the overall level of common prosperity and on the three dimensions of prosperity, sharing, and sustainability are shown in Figure 6. In Figure 6, the horizontal axis represents the human–environment coupling coordination degree (range from zero to one). A higher value indicates a stronger level of coordination between the population and land systems. The vertical axis denotes the corresponding dimension index of common prosperity (ranging from zero to one). Similarly, a higher value signifies a more advanced development level for that specific dimension. The curves in the figure illustrate the changing trends of four indicators as the coupling coordination degree increases: the comprehensive prosperity index, prosperity, fairness, and sustainability. Ultimately, this figure aims to reveal the differentiated impacts of human–environment optimization on the multiple dimensions of common prosperity.
Overall, the increase in regional human–environment coupling coordination positively drove the provincial level of common prosperity. However, this driving effect remained limited and failed to generate leapfrog growth. Optimizing the population–land relationship alone could not rapidly resolve deeply rooted imbalances in development and resource allocation. Consequently, the impact of human–environment coupling on the overall common prosperity exhibited clear marginal constraints.
The three dimensions exhibited distinct sensitivities and evolutionary trends in response to improved human–environment coupling coordination. First, the prosperity dimension maintained a stable positive relationship with the coupling coordination. A higher coordination directly enhanced industrial agglomeration, intensive land use, and rational population allocation. Consequently, it consistently drove economic quality and material prosperity upward. Second, the sharing dimension demonstrated nonlinear, stage-based characteristics. As coupling coordination transitioned from low to medium levels, public services and livelihood resources improved rapidly, driving a swift rise in shared equality. However, at the medium-high and high stages, this growth stagnated and even declined. In highly coordinated core regions, excessive population agglomeration and resource siphoning widened the urban–rural gap, effectively offsetting the equality gains generated by human–environment optimization. Third, the sustainability dimension remained generally stable. It showed no significant fluctuations or incremental improvements as the coupling coordination increased. Ecological carrying capacity and green development patterns were structurally stable over the long term. Therefore, human–environment optimization exerted a weak direct effect on ecological sustainability and clearly lacked response elasticity. In summary, the impact of human–environment coupling coordination on common prosperity showed significant dimensional heterogeneity, and its overall driving effect remained limited. Specifically, coordination provided stable and continuous support for material prosperity. However, shared equality exhibited a stage-based pattern, initially rising before subsequently declining. Furthermore, the driving effect on ecological sustainability was moderate, yielding only limited improvements. Ultimately, these dimensional disparities explained why the overall advancement of common prosperity in Guangdong Province remained slow and why regional gaps continued to widen.

4. Discussion

4.1. Comparative Analysis

This study investigated the impact of human–environment interaction on multidimensional common prosperity in Guangdong Province. Previous studies have primarily focused on territorial spatial patterns, land-use transitions, and ecological responses [65]. These studies generally concluded that economically developed regions exhibit higher human–environment coupling coordination, whereas underdeveloped regions face prominent contradictions [66,67]. Consistent with these classic studies [68,69], our research found that the coupling coordination in Guangdong showed high agglomeration in the core Pearl River Delta, steady improvement in peripheral areas, and rapid growth in late-developing regions. This further confirmed that the economic foundation, population agglomeration, and land-use efficiency remained the core determinants of human–environment coordination.
However, traditional research has mostly been limited to describing the spatiotemporal evolution of human–environment systems, rarely extending to livelihood development and shared well-being [70]. To address this gap, our study moved beyond purely ecological or territorial perspectives by integrating human–environment coupling coordination into the analytical framework of multidimensional common prosperity. Rather than merely explaining internal system dynamics, we examined how human–environment interaction exerted differentiated transmission effects on three specific dimensions: prosperity, sharing, and sustainability. Consequently, this research significantly expanded the application boundaries of traditional human–environment interaction studies.
Existing studies on common prosperity generally suggest that regional development improves slowly, core cities maintain long-term dominance, and spatial imbalances gradually intensify [71]. Consistent with these macro-level evaluations, our study found that from 2010 to 2025, the overall growth of the Composite Common Prosperity Index in Guangdong remained weak. The spatial extent of high-value areas shrank, ultimately solidifying into a dual-core pattern of Guangzhou and Shenzhen, while the developmental gap between the Pearl River Delta and Western Guangdong widened. These results demonstrated Guangdong’s practical challenges in promoting common prosperity, such as difficulties in overall quality improvement, slow progress in balanced advancement, and limited outward diffusion of core city advantages [44]. However, previous studies have mostly described this widening gap as a surface phenomenon. They typically attributed these disparities to differences in economic foundations, industrial capacities, and fiscal inputs, thereby lacking an explanation of the underlying geographical mechanisms [72,73]. In contrast, by adopting a human–environment interaction perspective, this study revealed that regional welfare differentiation did not stem solely from economic factors. Instead, it resulted from the long-term, imbalanced spatial allocation of population and land. Consequently, this research significantly addressed the limitations of existing studies that overemphasize economic phenomena while neglecting geographical foundations [2]. Existing studies on the driving factors of common prosperity predominantly focus on socioeconomic indicators—such as per capita GDP, industrial structure, urbanization, and policy support—to explain how capital and industry influence development [74,75,76]. Consequently, these studies generally draw a linear conclusion: economic inputs consistently produce positive driving effects on regional common prosperity [77,78,79]. To move beyond this single-economic-driver framework, our study utilized the coupling coordination degree of human–environment interaction as a deeper explanatory variable, thereby yielding distinctly different insights. First, we verified that optimizing human–environment interaction exerted a stable positive effect only on the prosperity dimension. It continuously consolidated the material foundation for regional economic development, a finding that complemented the existing literature on economic empowerment [80]. Second, this study identified a clear threshold effect within the sharing (equity) dimension. Specifically, as human–environment coordination rose from low to high, regional sharing initially improved. However, once regions entered a high-coupling stage, inclusive development was actually suppressed. This suppression occurred because excessive population concentration in core cities intensified the siphoning of high-quality resources. Ultimately, this demonstrated a paradoxical pattern where higher coordination led to greater regional inequality. This finding directly challenged the traditional assumption that any systemic optimization inherently promotes equity [81].

4.2. Study Contributions

While existing research has primarily focused on the socioeconomic aspects of common prosperity, it largely ignored the underlying geographical constraints and human–environment interactions [82]. To address this gap, this study expanded the theoretical framework of common prosperity by introducing the classical theory of human–environment interaction. Unlike previous studies that often assumed uniform drivers of regional development, our results demonstrated that human–environment coupling coordination had differentiated effects on the three dimensions of common prosperity (prosperity, sharing, and sustainability). Specifically, the optimization of human–environment systems did not generate homogeneous positive outcomes across all dimensions. Therefore, this study enriched the spatial geographical mechanisms of common prosperity. It compensated for the limitations of the current literature by shifting the analytical focus from socioeconomic surface phenomena to the fundamental causes rooted in human–environment interactions.

4.3. Limitations and Future Directions

Although this study provided valuable insights, several limitations highlight directions for future research. First, while we constructed a three-dimensional evaluation system, our analysis primarily focused on the regional macro-level. It did not refine the assessment to micro-levels, thereby limiting our ability to identify differentiated effects across specific demographic groups and urban–rural divisions. Second, the measurement framework omitted indicators of spiritual prosperity, which restricted a fully comprehensive understanding of the multidimensionality of common prosperity. Finally, this study only examined the direct effects of human–environment coupling coordination. It did not explore potential mediating and moderating variables. Consequently, the indirect transmission pathways and the variations of these effects under different contexts remained unexplored. To address these gaps, future studies should build upon our findings by downscaling the spatial analysis, integrating subjective well-being indicators, and investigating the complex indirect mechanisms.

5. Conclusions

Based on municipal panel data from Guangdong Province (2010–2025), this study constructed an evaluation framework for human–environment coupling coordination and multidimensional common prosperity. Utilizing coupling coordination models, random forest weighting, and the GWR method, we systematically analyzed their spatiotemporal evolution and the heterogeneous effects of human–environment interactions on three prosperity dimensions (prosperity, sharing, and sustainability). The main conclusions are as follows. First, both human–environment coordination and common prosperity in Guangdong exhibited continuous upward trends. However, their synergistic enhancement faced clear threshold constraints, indicating that optimizing human–environment elements alone was insufficient to achieve rapid, region-wide improvements in common prosperity. Second, the impacts of human–environment interactions demonstrated significant dimensional heterogeneity. Specifically, these interactions only provided long-term and stable empowerment to material prosperity. Regarding shared equity, the effect followed a “promotion-then-inhibition” pattern. Once a region reached a high-coupling stage, high-quality resources concentrated in core areas, thereby widening the gap in inclusive benefits. Meanwhile, the positive driving effect on ecological sustainability remained generally weak. Finally, Guangdong Province consistently maintained a spatial pattern of “core polarization and peripheral lag.” Although the core Pearl River Delta possessed foundational advantages, its equity levels gradually declined. Conversely, while peripheral regions (Eastern, Western, and Northern Guangdong) experienced faster coordination growth, they remained trapped in a prolonged dilemma of low-level common prosperity. This confirmed that the underlying geographical mechanisms driving regional disparities persisted over time.
By adopting a human–environment coupling perspective, this study clarified the differentiated logic behind multidimensional common prosperity, thereby offering significant practical value. These findings provide a scientific basis for Guangdong Province to optimize spatial layouts, efficiently allocate population and land resources, and implement tailored policies for coordinated regional revitalization. Furthermore, our results demonstrated that optimizing a single spatial element cannot simultaneously enhance prosperity, equity, and ecology. Consequently, this study offers valuable geographical insights for local governments to balance economic growth, livelihood sharing, and ecological protection. Ultimately, it provides decision-making support to mitigate regional polarization and promote long-term, balanced, sustainable development.

Author Contributions

Conceptualization, Y.G.; Methodology, Y.G.; Software, Y.G.; Validation, Y.G.; Formal analysis, Y.G.; Investigation, H.X.; Resources, H.X.; Data curation, H.X.; Writing—original draft, Y.G. and H.X.; Writing—review & editing, H.X.; Project administration, H.X. All authors have read and agreed to the published version of the manuscript.

Funding

This research received no external funding.

Institutional Review Board Statement

Not applicable.

Informed Consent Statement

Not applicable.

Data Availability Statement

Data are contained within the article.

Conflicts of Interest

Author Yi Ge was employed by the Agricultural Bank of China, Xi’an Branch. The remaining authors declare that the research was conducted in the absence of any commercial or financial relationships that could be construed as a potential conflict of interest.

References

  1. Zhong, S.; Zhang, X.; Zhang, L.; Zhao, C. How does digital economy influence urban common prosperity? Evidence from China’s demonstration area for common prosperity. Int. Rev. Econ. Financ. 2025, 104, 104629. [Google Scholar] [CrossRef]
  2. Ge, Y.; Xue, H. The Differential Promoting Effect of Urban–Rural Integration Development on Common Prosperity: A Case Study from Guangdong, China. Land 2026, 15, 253. [Google Scholar] [CrossRef]
  3. Tong, W.; Guo, J.; Lo, K.; Xu, W. Bridging the Gap to Common Prosperity: Rural Development and Urban-Rural Income Disparities in Zhejiang Province, China. Chin. Geogr. Sci. 2026, 36, 207–221. [Google Scholar] [CrossRef]
  4. Adam, A.G. Systematic review of the changing land to people relationship and co-evolution of land administration. Heliyon 2023, 9, e20637. [Google Scholar] [CrossRef]
  5. Liu, M.; Wei, H.; Dong, X.; Wang, X.C.; Zhao, B.; Zhang, Y. Integrating land use, ecosystem service, and human well-being: A systematic review. Sustainability 2022, 14, 6926. [Google Scholar] [CrossRef]
  6. Qiu, Z.; Wen, S.; Yuan, H.; Liu, Z.; Wei, Y.; Yanling, S.; Dai, R.; Li, X.; Gu, Y. Evaluation Methods for the Human–Land Coupling Coordination Relationship in a Metro Station Area: A Case Study of Chengdu Metro Line 1. ISPRS Int. J. Geo-Inf. 2025, 14, 102. [Google Scholar] [CrossRef]
  7. Spears, E.; Schuett, M.A.; Yalvac, B. Landownership as a socio-psychological phenomenon: Exploration of the owner-land relationship. Soc. Sci. J. 2021, 1–15. [Google Scholar] [CrossRef]
  8. Cai, E.; Zhang, S.; Chen, W.; Li, L. Spatio–temporal dynamics and human–land synergistic relationship of urban expansion in Chinese megacities. Heliyon 2023, 9, e19872. [Google Scholar] [CrossRef]
  9. Zhou, K.; Li, Y.; Sun, Z.; Chen, J.; Xie, B. Land Use Transition Under a Tense Human–Land Relationship: A GWR Analysis of Conflicts Between Construction Land and Cropland. Land 2025, 14, 1660. [Google Scholar] [CrossRef]
  10. Zhu, C.; Zhang, X.; Wang, K.; Yuan, S.; Yang, L.; Skitmore, M. Urban–rural construction land transition and its coupling relationship with population flow in China’s urban agglomeration region. Cities 2020, 101, 102701. [Google Scholar] [CrossRef]
  11. He, X.; Zhou, Y.; Yuan, Y. Exploring the relationship between urban polycentricity and consumer amenity development: An empirical study using Dianping Data in China. Cities 2025, 166, 106197. [Google Scholar] [CrossRef]
  12. Xuan, B.; Li, Z.; Kang, J.; Hu, Y. Spatiotemporal Relationship Between Human Activities and Urban Heat in Chinese Megacities Based on Multi-source Remote Sensing. IEEE J. Sel. Top. Appl. Earth Obs. Remote Sens. 2025, 18, 17064–17079. [Google Scholar] [CrossRef]
  13. Qi, L.; Li, J.; Wang, Y.; Gao, X. Urban observation: Integration of remote sensing and social media data. IEEE J. Sel. Top. Appl. Earth Obs. Remote Sens. 2019, 12, 4252–4264. [Google Scholar] [CrossRef]
  14. Yi, Y.; Duan, K.; He, F.; Si, Y. The Effects and Mechanisms of the Rural Homestead System on the Imbalance of Rural Human–Land Relationships: Evidence from the Yangtze River Delta Urban Agglomeration in China. Land 2024, 13, 137. [Google Scholar] [CrossRef]
  15. Wang, G.; Yang, J.; Ou, D.; Xiong, Y.; Deng, O.; Li, Q. Temporal-spatial variations and regional disparities in land-use efficiency, and the response to demographic transition. Sustainability 2019, 11, 4756. [Google Scholar] [CrossRef]
  16. Yang, S.; Jiang, G.; Yu, H. Has rural depopulation reduced agricultural land use efficiency? Mediating roles of cropland abandonment, scale operation, and cultivation structure. Land Use Policy 2025, 159, 107821. [Google Scholar] [CrossRef]
  17. Zhou, Y.; He, X.; Zikirya, B. Boba shop, coffee shop, and urban vitality and development—A spatial association and temporal analysis of major cities in China from the standpoint of nighttime light. Remote Sens. 2023, 15, 903. [Google Scholar] [CrossRef]
  18. Wang, X.; Hu, J.; Zhao, S.; Hu, R. Spatial relationship between population shrinkage and land development in northeast China. Front. Environ. Sci. 2025, 13, 1522999. [Google Scholar] [CrossRef]
  19. Wang, H.; Zhu, Y.; Huang, W.; Yin, J.; Niu, J. Spatio-temporal evolution and driving mechanisms of rural residentials from the perspective of the human-land relationship: A case study from Luoyang, China. Land 2022, 11, 1216. [Google Scholar] [CrossRef]
  20. Liu, Y.; Wei, X.; Jiao, L.; Wang, H. Relationships between street centrality and land use intensity in Wuhan, China. J. Urban Plan. Dev. 2016, 142, 05015001. [Google Scholar] [CrossRef]
  21. Williams, K.J.; Schirmer, J. Understanding the relationship between social change and its impacts: The experience of rural land use change in south-eastern Australia. J. Rural Stud. 2012, 28, 538–548. [Google Scholar] [CrossRef]
  22. Guo, L.; Guo, L.; Li, J.; Zhao, Y.; Jiang, G. Analysis of spatial and temporal variation and influencing factors of rural land dependence from the perspective of human-land relationship. Sustainability 2023, 15, 9861. [Google Scholar] [CrossRef]
  23. Song, X.; Feng, Q.; Xia, F.; Li, X.; Scheffran, J. Impacts of changing urban land-use structure on sustainable city growth in China: A population-density dynamics perspective. Habitat Int. 2021, 107, 102296. [Google Scholar] [CrossRef]
  24. Wan, H.; Knight, J. China’s growing but slowing inequality of household wealth, 2013–2018: A challenge to ‘common prosperity’? China Econ. Rev. 2023, 79, 101947. [Google Scholar] [CrossRef]
  25. Chang, P.; Pang, X.; He, X.; Zhu, Y.; Zhou, C. Exploring the Spatial Relationship between Nighttime Light and Tourism Economy: Evidence from 31 Provinces in China. Sustainability 2022, 14, 7350. [Google Scholar] [CrossRef]
  26. Han, H.; Si, F. Capital assets and poverty transitions in rural China. China Agric. Econ. Rev. 2023, 15, 563–579. [Google Scholar] [CrossRef]
  27. Li, R.; Hu, Y.; Liu, H. Portrait of China’s common prosperity level based on GRA-TOPSIS and deep learning. J. Intell. Fuzzy Syst. 2023, 45, 1923–1937. [Google Scholar] [CrossRef]
  28. Liu, Y.; Dong, X.; Dong, K. Pathway to prosperity? The impact of low-carbon energy transition on China’s common prosperity. Energy Econ. 2023, 124, 106819. [Google Scholar] [CrossRef]
  29. Ma, X.; Ruan, Y.; Yang, Q. Evaluating China’s Common Prosperity Policies against the Background of Green Development by Using the PMC Model. Sustainability 2023, 15, 7870. [Google Scholar] [CrossRef]
  30. Kakwani, N.; Wang, X.; Xue, N.; Zhan, P. Growth and common prosperity in China. China World Econ. 2022, 30, 28–57. [Google Scholar] [CrossRef]
  31. Qin, X.; Sun, H.; Wu, H. Wealth-based common prosperity and household CO2: Evidence from China. China Econ. Rev. 2025, 92, 102421. [Google Scholar] [CrossRef]
  32. Su, F.; Wu, B.; Zhang, H.; Huang, J.; Tang, H.; Chen, X. Examining Digital Village Construction’s Impact on Farmers’ Common Prosperity in China: Dynamic and Spatial Perspectives. Chin. Geogr. Sci. 2025, 35, 1342–1358. [Google Scholar] [CrossRef]
  33. Wei, X.; Yang, Z.; Yan, Y.; Sun, J. Rural E-commerce, Digital finance, and urban–rural common prosperity: A Quasi-natural Experiment Based on China’s Comprehensive Demonstration of E-commerce Entering Rural Areas Policy. Financ. Res. Lett. 2024, 69, 106237. [Google Scholar] [CrossRef]
  34. Zeng, Y.; Zhu, L.; Kang, Q.; Lei, Y. The Expansion of Higher Education Scale in Northeast China and the Pursuit of Common Prosperity: The Dual Moderating Effects of Technological Innovation and Educational Quality. SAGE Open 2025, 15, 21582440251376794. [Google Scholar] [CrossRef]
  35. Zhao, M.; Chan, H.S. Balancing through agglomeration: A third path to sustainable development between common prosperity and carbon neutrality in China. Technol. Forecast. Soc. Change 2024, 208, 123737. [Google Scholar] [CrossRef]
  36. Fan, C.C. China’s eleventh five-year plan (2006–2010): From” getting rich first” to” common prosperity”. Eurasian Geogr. Econ. 2006, 47, 708–723. [Google Scholar] [CrossRef]
  37. Liu, D.; Jin, Y.; Deng, H.; Pray, C.E. Bridging and Dividing: The Dual Effects of Digital Inclusive Finance on Income Inequality in China. Aust. J. Agric. Resour. Econ. 2026, 70, 556–572. [Google Scholar] [CrossRef]
  38. Mu, D. Between distinction and ‘common prosperity’: How Chinese designers navigate Shanzhai and China’s intellectual property policy. Int. J. Cult. Policy 2025, 1–21. [Google Scholar] [CrossRef]
  39. Yu, J.; Ge, J.; Xu, Y.; Huang, B. Debating China’s common prosperity with evidence from policy practice. J. Chin. Gov. 2025, 10, 511–531. [Google Scholar] [CrossRef]
  40. Li, H.; Meng, L.; Zhang, Y. How Common Is the Prosperity? The Trends and Nature of China’s Income Inequality, 1988–2018. Econ. Transit. Institutional Change 2026, 34, 369–385. [Google Scholar] [CrossRef]
  41. Ren, Y.; Yu, G.; Ren, Y.; Wang, D. Digital inclusive finance, industrial structure upgrading and common prosperity: Evidence from China. Appl. Econ. 2025, 1–13. [Google Scholar] [CrossRef]
  42. Zhao, X.; Long, L.; Yin, S. Regional common prosperity level and its spatial relationship with carbon emission intensity in China. Sci. Rep. 2023, 13, 17035. [Google Scholar] [CrossRef] [PubMed]
  43. Xie, T.; Zhang, Y.; Song, X. Research on the spatiotemporal evolution and influencing factors of common prosperity in China. Environ. Dev. Sustain. 2024, 26, 1851–1877. [Google Scholar] [CrossRef]
  44. Liu, B.; Qi, C.; Xue, B.; Yang, Z. Measuring urban–rural integration through the lenses of sustainability and social equity: Evidence from China. Habitat Int. 2025, 165, 103559. [Google Scholar] [CrossRef]
  45. Li, Z.; Xing, Z.; Xia, H.; Yang, Y.; Jiang, Y. Bridging Digital Divides: An Empirical Analysis of the Digital Economy’s Impact on Sustainable Prosperity. SAGE Open 2025, 15, 21582440251365789. [Google Scholar] [CrossRef]
  46. Yang, Z.; Guan, C.; Zhu, P. Agricultural production services and their influence on rural common prosperity: Evidence from eastern China. Front. Sustain. Food Syst. 2025, 9, 1659553. [Google Scholar] [CrossRef]
  47. Liu, Y.; Dong, K.; Wang, J.; Taghizadeh-Hesary, F. Towards sustainable development goals: Does common prosperity contradict carbon reduction? Econ. Anal. Policy 2023, 79, 70–88. [Google Scholar] [CrossRef]
  48. Li, W.; Yi, P.; Yu, H.; Lin, W.; Wu, X. Assessment on sustainable development of three major urban agglomerations in China based on sustainability-differentiation-combined weighting method. Sustain. Dev. 2023, 31, 2678–2693. [Google Scholar] [CrossRef]
  49. Dobson, J.E.; Bright, E.A.; Coleman, P.R.; Durfee, R.C.; Worley, B.A. LandScan: A global population database for estimating populations at risk. Photogramm. Eng. Remote Sens. 2000, 66, 849–857. [Google Scholar]
  50. Thomson, D.R.; Rhoda, D.A.; Tatem, A.J.; Castro, M.C. Gridded population survey sampling: A systematic scoping review of the field and strategic research agenda. Int. J. Health Geogr. 2020, 19, 34. [Google Scholar] [CrossRef]
  51. Yang, J.; Huang, X. The 30 m annual land cover dataset and its dynamics in China from 1990 to 2019. Earth Syst. Sci. Data 2021, 13, 3907–3925. [Google Scholar] [CrossRef]
  52. He, X.; Zhang, L.; Zhao, X.; Yuan, X.; Yuan, Y.; Zhou, C. Patterns and Mechanisms of Relative Urban Spatial Growth in China from 2000 to 2020. Sustain. Cities Soc. 2025, 135, 107041. [Google Scholar] [CrossRef]
  53. Huang, Q.; Guo, Y.; Lin, S. Can Data Elements Facilitate Common Prosperity for Urban Low-Income Residents? An Empirical Analysis Based on the 2014–2020 CFPS Survey in China: Q. Huang et al. Soc. Indic. Res. 2025, 180, 887–921. [Google Scholar] [CrossRef]
  54. Wang, H.; Liu, H.; Fu, Q. Effects of common prosperity on China’s education expenditure—Empirical analysis based on CFPS quasi-micro panel data. Int. Rev. Econ. Financ. 2024, 91, 440–455. [Google Scholar] [CrossRef]
  55. Zhang, J.; Huang, B.; Chen, X.; Zhu, C.; Gan, M. Multidimensional evaluation of the quality of rural life using big data from the perspective of common prosperity. Int. J. Environ. Res. Public Health 2022, 19, 14166. [Google Scholar] [CrossRef] [PubMed]
  56. Cheng, Z.; Wang, M.; Shen, Z.A.; Sun, C. Unraveling the Interaction and Synergies between Urban Agriculture and Urban–Rural Integration in China: A Case Study of Xi’an. J. Urban Plan. Dev. 2025, 151, 05024047. [Google Scholar] [CrossRef]
  57. Hu, S.; Liu, J.; Que, J.; Li, Y.; Su, X.; Li, B.; Wang, G. Assessing urban rewilding potential: Plant diversity and public landscape perceptions in urban wildscapes of Harbin, China. Urban For. Urban Green. 2025, 112, 128958. [Google Scholar] [CrossRef]
  58. He, X.; Zhou, Y.; Yuan, X.; Zhu, M. The coordination relationship between urban development and urban life satisfaction in Chinese cities-An empirical analysis based on multi-source data. Cities 2024, 150, 105016. [Google Scholar] [CrossRef]
  59. Man, J.; Liu, J.; Cui, B.; Sun, Y.; Sriboonchitta, S. Coupling and coordination between digital economy and Urban–Rural Integration in China. Sustainability 2023, 15, 7299. [Google Scholar] [CrossRef]
  60. Zhou, Y.; Yang, S. Roles of review numerical and textual characteristics on review helpfulness across three different types of reviews. IEEE Access 2019, 7, 27769–27780. [Google Scholar] [CrossRef]
  61. Hong, T.; Yim, S.H.; Heo, Y. Interpreting complex relationships between urban and meteorological factors and street-level urban heat islands: Application of random forest and SHAP method. Sustain. Cities Soc. 2025, 126, 106353. [Google Scholar] [CrossRef]
  62. Kim, Y.; Safikhani, A.; Tepe, E. Machine learning application to spatio-temporal modeling of urban growth. Comput. Environ. Urban Syst. 2022, 94, 101801. [Google Scholar] [CrossRef]
  63. Tang, L.; Lin, Y.; Li, S.; Li, S.; Li, J.; Ren, F.; Wu, C. Exploring the influence of urban form on urban vibrancy in shenzhen based on mobile phone data. Sustainability 2018, 10, 4565. [Google Scholar] [CrossRef]
  64. Tu, W.; Zhu, T.; Xia, J.; Zhou, Y.; Lai, Y.; Jiang, J.; Li, Q. Portraying the spatial dynamics of urban vibrancy using multisource urban big data. Comput. Environ. Urban Syst. 2020, 80, 101428. [Google Scholar] [CrossRef]
  65. Li, Z.; Wang, C.; Wang, J. Research on spatial coupling coordination of population shrinkage and land use efficiency from the human–land relationship perspective: Case study of Zhejiang Province, China. Land 2025, 14, 811. [Google Scholar] [CrossRef]
  66. Long, H. Theorizing land use transitions: A human geography perspective. Habitat Int. 2022, 128, 102669. [Google Scholar] [CrossRef]
  67. Wang, Y.; Cao, W.; Gao, M.; Gao, Y.; Chi, X.; Meng, X.; Li, S.; Hu, G. Examining spatial coordination of human-land-industry-service system from a regionalization approach: A case study of Beijing. Land Use Policy 2024, 137, 107010. [Google Scholar] [CrossRef]
  68. Yu, D.; Mu, H.; Chen, S. The “Production-Living-Ecological Spaces” and human-land relationship in poverty alleviation and relocation areas—An example of Zhaotong City, Yunnan Province. Ecol. Indic. 2025, 178, 114034. [Google Scholar] [CrossRef]
  69. Zhang, Z.; Zhang, J.; Li, L.; Tang, L. Exploring the spatiotemporal evolution and driving factors of the coordination and response between ecological pressure on land and human well-being in Chongqing, China. Environ. Dev. Sustain. 2026, 1–26. [Google Scholar] [CrossRef]
  70. Huang, Y.; Li, M.; Qu, L. Identification and Revitalization Strategies of Rural Regional System Types Based on Human-Land Coupling: A Case Study in the Loess Plateau, China. Land Degrad. Dev. 2025, 36, 1579–1593. [Google Scholar] [CrossRef]
  71. Liu, X.; Li, Y. The impact of agriculture–tourism integration on common prosperity: Evidence from the urban–rural income gap. Econ. Anal. Policy 2025, 89, 90–106. [Google Scholar] [CrossRef]
  72. Raja, S.S.; Raju, V.; Husnain, M.; Sarfraz, S.; Malik, F.; Raja, S.S. Framework for sustainable rural development through entrepreneurial initiatives in emerging economies. Sustainability 2022, 14, 11972. [Google Scholar] [CrossRef]
  73. Xiao, H.; Cheng, J.; Wang, X. Does the Belt and Road Initiative promote sustainable development? Evidence from countries along the Belt and Road. Sustainability 2018, 10, 4370. [Google Scholar] [CrossRef]
  74. Xu, X.; Jiao, L.; Xu, G. A spatiotemporal knowledge graph for driving factor analysis and growth prediction of regional economy in China. GIScience Remote Sens. 2025, 62, 2561474. [Google Scholar] [CrossRef]
  75. Zhu, H.; Mao, X.; Xie, X. Coupling Coordination Relationship and Driving Factors Between Common Prosperity and Tourism Development Levels in the Five Northwestern Provinces of China. Land 2025, 14, 1101. [Google Scholar] [CrossRef]
  76. Wei, Y. Research on the spatio-temporal dynamic evolution and driving forces of digital inclusive finance in developing countries: A case study of China. Int. Rev. Econ. Financ. 2025, 103, 104590. [Google Scholar] [CrossRef]
  77. Zhang, C.; Zhu, Y.; Zhang, L. Effect of digital inclusive finance on common prosperity and the underlying mechanisms. Int. Rev. Financ. Anal. 2024, 91, 102940. [Google Scholar] [CrossRef]
  78. Zhou, M.; Guo, F. Mechanism and spatial spillover effect of digital economy on common prosperity in the Yellow River Basin of China. Sci. Rep. 2024, 14, 23086. [Google Scholar] [CrossRef]
  79. Xu, Q.; Zhong, M.; Dong, Y. Digital finance and rural revitalization: Empirical test and mechanism discussion. Technol. Forecast. Soc. Change 2024, 201, 123248. [Google Scholar] [CrossRef]
  80. He, X.; Xi, H.; Li, X. Multi-Dimensional Decomposition, Measurement, and Governance Mechanism of Relative Poverty in Chinese Households under the Goal of Common Prosperity: Empirical Analysis Based on CFPS2020 Data. Sustainability 2024, 16, 5181. [Google Scholar] [CrossRef]
  81. Sun, F.; Li, J.; Bai, F.P. Mechanism of digital business model innovation for common prosperity: Based on resource orchestration perspective. Chin. Manag. Stud. 2025, 19, 734–757. [Google Scholar] [CrossRef]
  82. Jiao, W.; Zhang, C.; Wang, Y. The impact of digital government construction on common prosperity—Using data collected from 293 prefecture-level cities in China over the 2016–2022 period. Int. Rev. Econ. Financ. 2025, 102, 104353. [Google Scholar] [CrossRef]
Figure 1. Study Area. (Location of the study area, the Pearl River Delta includes Guangzhou, Shenzhen, Zhuhai, Foshan, Huizhou, Dongguan, Zhongshan, Jiangmen, and Zhaoqing. Eastern Guangdong comprises Shantou, Shanwei, Chaozhou, and Jieyang. Western Guangdong consists of Zhanjiang, Maoming, Yangjiang, and Yunfu. Northern Guangdong covers Shaoguan, Heyuan, Meizhou, and Qingyuan).
Sustainability 18 05389 g001
Figure 2. Population distribution in Guangdong from 2010 to 2025.
Sustainability 18 05389 g002
Figure 3. Distribution of land-use types in Guangdong province from 2010 to 2025.
Sustainability 18 05389 g003
Figure 4. Spatiotemporal distribution characteristics of human–environment coupling coordination in Guangdong Province from 2010 to 2025.
Sustainability 18 05389 g004
Figure 5. Spatiotemporal distribution characteristics of common prosperity in Guangdong Province from 2010 to 2025.
Sustainability 18 05389 g005
Figure 6. Impact trends of human–environment coupling coordination on the dimensions of common prosperity in Guangdong Province. (X-axis: human–environment coupling coordination; Y-axis: dimensional indices. Curves represent overall prosperity, the prosperity dimension, the sharing dimension, and the sustainability dimension, respectively).
Sustainability 18 05389 g006
Table 1. Land use transition matrix for Guangdong Province (2010–2025).
20122016
CroplandForestShrubGrasslandWaterBarrenImperviousArea (km2)
Cropland41,954.763251.74050.443745.1611154.0260.4698701.044246,107.6453
Forest3400.6257112,419.30784.98961.28250.5184052.2531115,878.9771
Shrub2.782811.094348.67473.255300065.8071
Grassland59.46757.64640.515793.30487.66445.129128.2636201.9915
Water658.134925.396203.18785852.66673.300384.07356626.7594
Barren2.71260.003602.42914.252523.77985.270438.448
Impervious0.48960.0090029.44809085.72779115.6743
Area (km2)46,078.9731115,715.197854.6237148.62066048.57632.6799956.6325178,035.3027
20162020
CroplandForestShrubGrasslandWaterBarrenImperviousArea (km2)
Cropland42,876.96932315.40481.249223.467.88250.1764793.890946,078.9731
Forest3991.4298111,663.771319.20060.91170.2367039.6477115,715.1978
Shrub2.22127.531244.15760.713700054.6237
Grassland37.50217.04161.343773.80631.35364.995922.5774148.6206
Water603.16659.766804.25885315.51613.1338112.7346048.576
Barren1.61190.007200.8190.665125.51684.05932.679
Impervious0.063900011.5209945.04869956.6325
Area (km2)47,512.9647114,003.522965.9511103.90955397.17433.822910,917.9576178,035.3027
20202024
CroplandForestShrubGrasslandWaterBarrenImperviousArea (km2)
Cropland43,561.03323310.54470.774913.1247108.43830.1566518.892347,512.9647
Forest3575.4408110,396.75587.56180.76772.4282020.5686114,003.5229
Shrub3.260726.490635.57160.628200065.9511
Grassland44.35835.85090.596739.3571.90622.01969.8208103.9095
Water804.463218.494102.69194491.64891.773978.1025397.174
Barren4.6260.00901.66680.391522.67014.459533.8229
Impervious83.05561.730700.680429.50740.239410,802.744110,917.9576
Area (km2)48,076.2378113,759.875844.50558.91674634.320526.859611,434.5873178,035.3027
Table 2. Common prosperity index.
First Level IndicatorSecond Level IndicatorThird Level Indicator
ProsperityMaterial prosperityGDP per capita
Disposable income per capita
Engel coefficient
Labor productivity (Average years of schooling × Number of employed persons)
Spiritual prosperityYears of schooling per capita
Public library collections per 100 persons
Employment in culture and related industries/total employment
SharingPublic servicesTeacher–student ratio in primary and secondary schools
Number of beds in hospitals and health centers
Road area per capita
Coordination of developmentUrbanization rate
Urban–rural income gap
Number of registered urban unemployed persons
SustainabilityEcological environmentDomestic waste treatment rate
Park green area per capita
Carbon dioxide emission intensity
Green coverage rate of built-up areas
Scientific and technological innovationScience and technology expenditure/total fiscal expenditure
Table 3. Summary of the research datasets.
DatasetSourcePurpose
LandScanhttps://landscan.ornl.gov (accessed on 1 December 2025)Calculating population agglomeration
CLCDhttps://zenodo.org/records/18180184 (accessed on 30 November 2025)Analyzing land-use changes
Common Prosperity IndexStatistical yearbooksMeasuring common prosperity
Table 4. Core GWR results of human–environment coupling coordination on multidimensional common prosperity.
Dependent VariableSamples (n)Goodness of Fit (R2)Coefficient RangePositively Significant RegionsNegatively Significant RegionsNon-Significant Regions
Composite Common Prosperity Index210.826−0.031~0.278Core PRD (Guangzhou, Shenzhen, Dongguan, Foshan)Parts of Western GuangdongScattered cities in Eastern and Northern Guangdong
Prosperity210.8530.024~0.295Entire province (strongest in PRD)NoneNone
Sharing210.791−0.185~0.212Eastern/Northern Guangdong, PRD peripheryCore urban areas of Guangzhou and ShenzhenMost of Western Guangdong
Sustainability210.6820.003~0.087Northern Guangdong ecological zone, PRD edgesNoneMost of Eastern and Western Guangdong
Disclaimer/Publisher’s Note: The statements, opinions and data contained in all publications are solely those of the individual author(s) and contributor(s) and not of MDPI and/or the editor(s). MDPI and/or the editor(s) disclaim responsibility for any injury to people or property resulting from any ideas, methods, instructions or products referred to in the content.