1. Introduction
Renewable energy systems are inherently characterised by spatial and temporal variability, which poses fundamental challenges for power system stability, reliability, and long-term energy planning. As the penetration of variable renewable energy (VRE) increases, failure to adequately address this variability may compromise system reliability and hinder decarbonisation targets [
1]. Consequently, contemporary energy system planning requires the integration of flexibility mechanisms and advanced optimisation strategies capable of accommodating the stochastic nature of renewable resources [
2].
One of the most effective approaches to mitigating these challenges is the coordinated integration of complementary renewable resources. In this context, wind–solar complementarity provides a synergistic mechanism whereby the temporal and spatial generation patterns of one resource compensate for the deficits of the other. Exploiting such complementarity has been shown to enhance system reliability, reduce dependence on large-scale storage, and improve grid integration [
3], while analysing spatiotemporal resource heterogeneity is essential for the development of cost-effective and resilient energy systems [
4]. These findings highlight the need to interpret complementarity as a coupled spatiotemporal process rather than as independent temporal or spatial effects.
Previous research has increasingly recognised that renewable resource complementarity is a multidimensional phenomenon operating across both spatial and temporal scales. Temporal complementarity describes the anticorrelation between resource availability at a given location, whereas spatial complementarity exploits geographic diversity to stabilise aggregated energy output across regions [
5]. Large-scale studies have further demonstrated that geographic dispersion of renewable generation can significantly reduce variability in electricity supply [
6], while regional climatic conditions and geographic positioning play a critical role in shaping spatiotemporal resource distributions [
7].
Despite these advances, existing studies remain largely scale-dependent, often focusing on continental or offshore analyses that do not adequately resolve the influence of complex terrestrial landscapes on renewable resource interactions. This limitation is particularly critical in regions characterised by strong physiographic heterogeneity, where terrain–atmosphere interactions fundamentally govern the spatial organisation of renewable resources.
Topography exerts a dominant control on wind regimes, atmospheric circulation, and solar radiation patterns. In complex terrains, orographic forcing and boundary-layer processes introduce significant spatial heterogeneity and temporal variability in wind characteristics. As demonstrated by [
8], mountainous environments are characterised by increased turbulence and flow fragmentation, which disrupt wind persistence and reduce alignment with solar radiation. In contrast, coastal regions influenced by the marine boundary layer tend to exhibit smoother wind regimes, favouring more stable wind–solar interactions. These dynamics indicate that complementarity is not spatially uniform but emerges from terrain-dependent atmospheric processes.
Recent analytical approaches have begun to adopt integrated frameworks that explicitly account for these interactions. For instance, ref. [
9] demonstrates that spatiotemporal relationships between renewable resources form distinct regional patterns governed by seasonal variability and local physiographic conditions. Similarly, large-scale European and Mediterranean studies highlight the importance of coordinated renewable deployment and atmospheric circulation patterns in shaping complementarity [
10,
11], while recent European and Mediterranean-scale analyses have further examined wind–solar complementarity under diverse climatic conditions, emphasising the role of large-scale atmospheric dynamics and regional variability in shaping resource interactions [
12,
13]. In parallel, related assessments across marine and hybrid energy systems further confirm the broader importance of resource complementarity in enhancing system performance [
14,
15,
16].
However, despite increasing attention to renewable energy complementarity, the role of terrain as a primary structuring mechanism remains insufficiently explored, particularly in complex Mediterranean environments, where strong physiographic heterogeneity exerts substantial control on atmosphere–surface interactions. Existing studies have substantially advanced the understanding of renewable resource interactions across spatial and temporal dimensions; however, many analyses remain scale-dependent and primarily focus on large-scale or offshore environments, where physiographic controls are comparatively less pronounced. Consequently, terrain-driven complementarity regimes and localised atmosphere–terrain interactions may not be adequately captured within broader-scale assessments. In this context, the present study introduces a terrain-resolved framework in which physiographic structure is treated as a primary control on wind–solar interactions. Unlike conventional approaches that analyse spatial or temporal complementarity in isolation, this framework explicitly integrates terrain-driven atmospheric processes within a unified spatiotemporal perspective. By stratifying Albania into three physiographic zones—coastal (<20 m), western lowlands (20–200 m), and mountainous areas (>200 m)—the analysis isolates the influence of the marine boundary layer and orographic forcing on resource complementarity. An integrated spatiotemporal approach is adopted, combining spatial, temporal, and hybrid complementarity indices to provide a comprehensive and physically consistent assessment of renewable resource interactions.
This framework enables the systematic evaluation of complementarity patterns across different physiographic settings and temporal scales. The objective of this study is to quantify and explain terrain-driven variability in wind–solar complementarity across Albania. Specifically, the study aims to: (i) quantify spatial complementarity using a Spatial Complementarity Index (SCI); (ii) analyse temporal complementarity and seasonal dynamics using a Temporal Complementarity Index (TCI); and (iii) evaluate the influence of terrain on hybrid system suitability across different physiographic zones. By identifying terrain-controlled complementarity regimes, this study provides a robust and decision-relevant framework for the assessment and optimisation of hybrid renewable energy systems in complex Mediterranean environments.
2. Materials and Methods
This study applies a spatially explicit analytical framework to quantify wind–solar complementarity across Albania. The methodological approach integrates terrain-based spatial stratification, a regular sampling grid, and multi-year meteorological datasets to assess spatiotemporal interactions between wind and solar resources. Complementarity is evaluated across two dimensions: temporal complementarity, which quantifies the degree of anticorrelation at individual locations, and spatial complementarity, which reflects the geographic distribution of resource availability across distinct physiographic zones.
2.1. Study Area and Physiographic Stratification
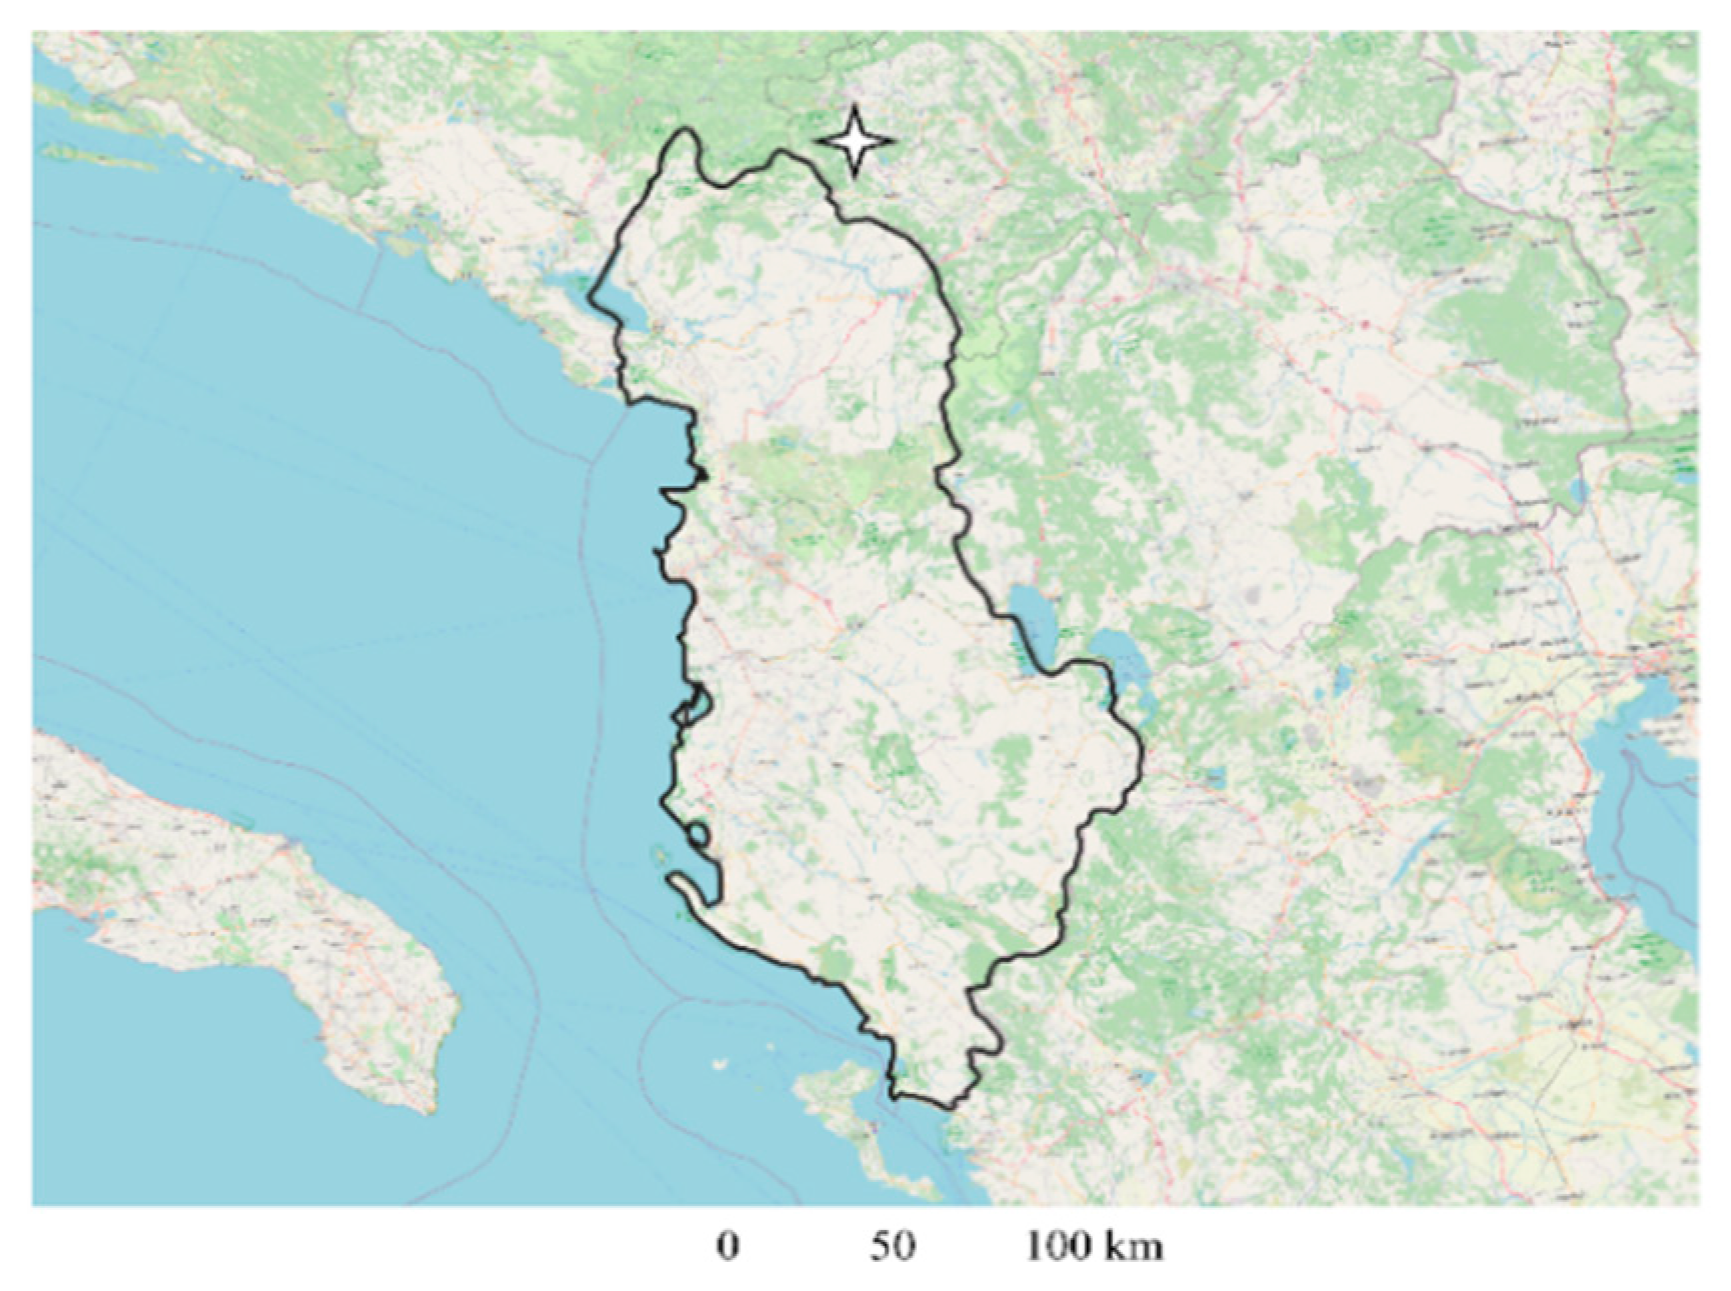
Albania is located in the western Balkan Peninsula in southeastern Europe (39–42° N, 19–21° E) and covers approximately 28,700 km
2 (
Figure 1). The country is characterised by pronounced topographic heterogeneity, ranging from coastal plains at sea level to mountainous regions exceeding 2700 m, resulting in substantial spatial variability in renewable energy potential.
National boundaries were defined using the Natural Earth Admin 0 Countries dataset at 1:10 m resolution [
17], and all spatial datasets were reprojected to the ETRS89/LAEA Europe coordinate reference system (EPSG: 3035), recommended for pan-European spatial analyses due to its equal-area properties [
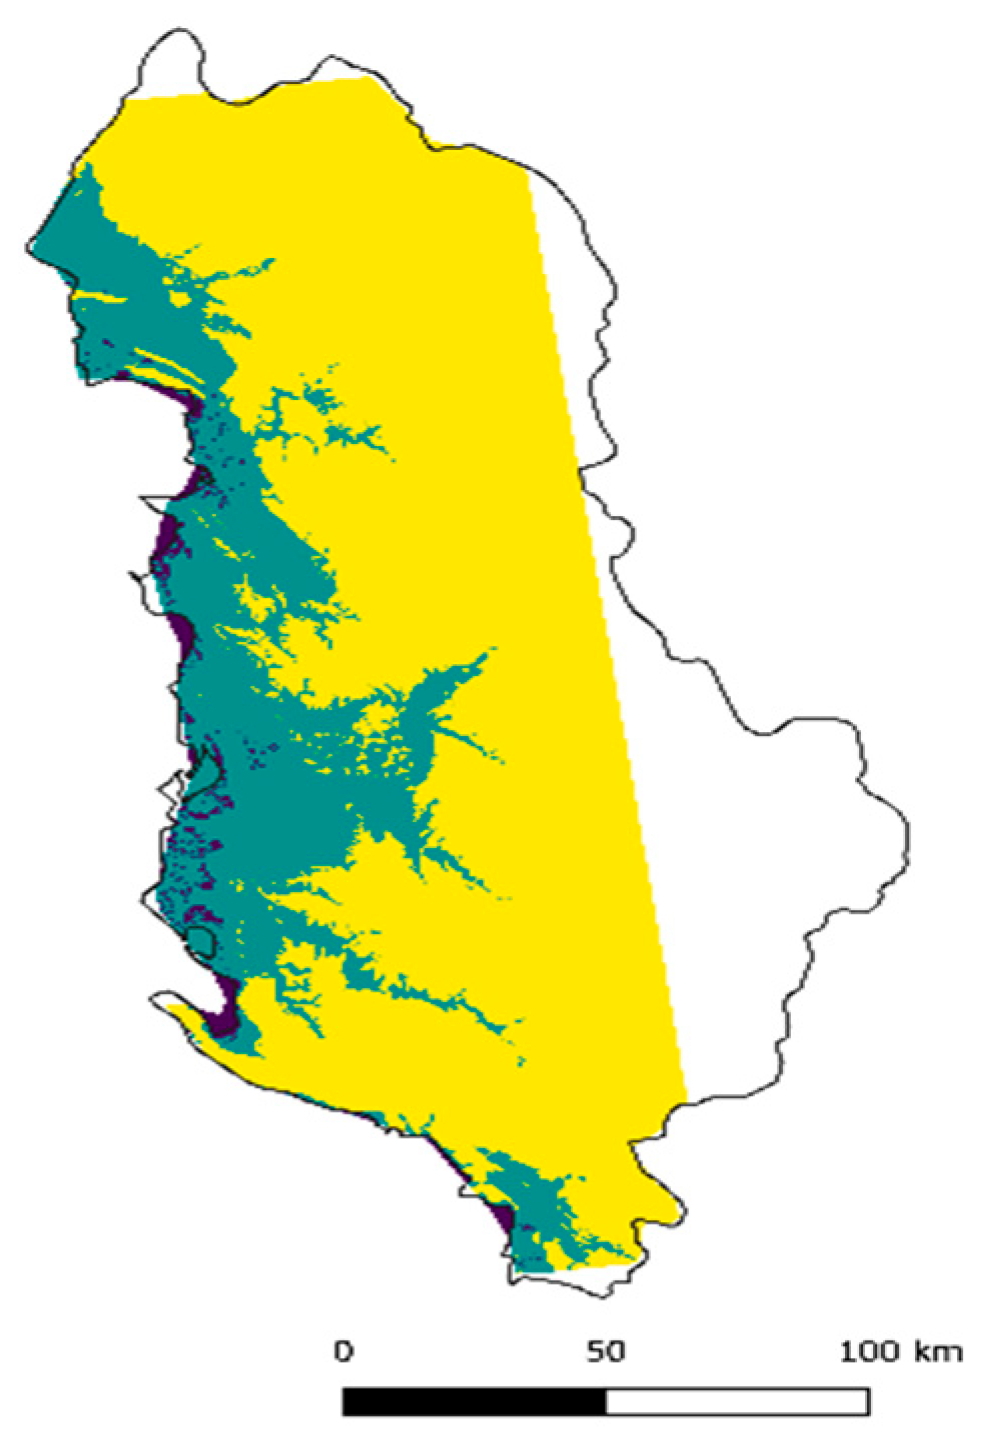
18]. To isolate the effects of terrain on wind–solar interactions, the study area was stratified into three physiographic zones derived from a 100 m resolution Digital Elevation Model (DEM) (
Figure 2), [
19]. Spatial analysis was conducted using
QGIS v3.40 (QGIS Development Team, Bratislava release), selected due to its extensive validation in environmental modelling and renewable energy resource mapping [
20,
21].
The physiographic zones were defined as follows:
Coastal area: <20 m above sea level (a.s.l.);
Western lowlands: 20–200 m (a.s.l.);
Mountainous area: >200 m (a.s.l.).
These elevation thresholds (20 m and 200 m) were selected to represent distinct physiographic and atmospheric regimes relevant to wind–solar interactions. Elevations below 20 m correspond to coastal environments strongly influenced by the marine boundary layer, while elevations between 20 m and 200 m represent lowland areas characterised by transitional atmospheric conditions. Elevations above 200 m are associated with increased terrain complexity and orographic effects, which significantly influence wind dynamics and spatial variability.
These elevation classes represent distinct regimes of surface roughness, atmospheric circulation, and solar exposure, which influence the local availability and interaction of wind and solar resources.
2.2. Spatial Sampling Framework and Data Harmonisation
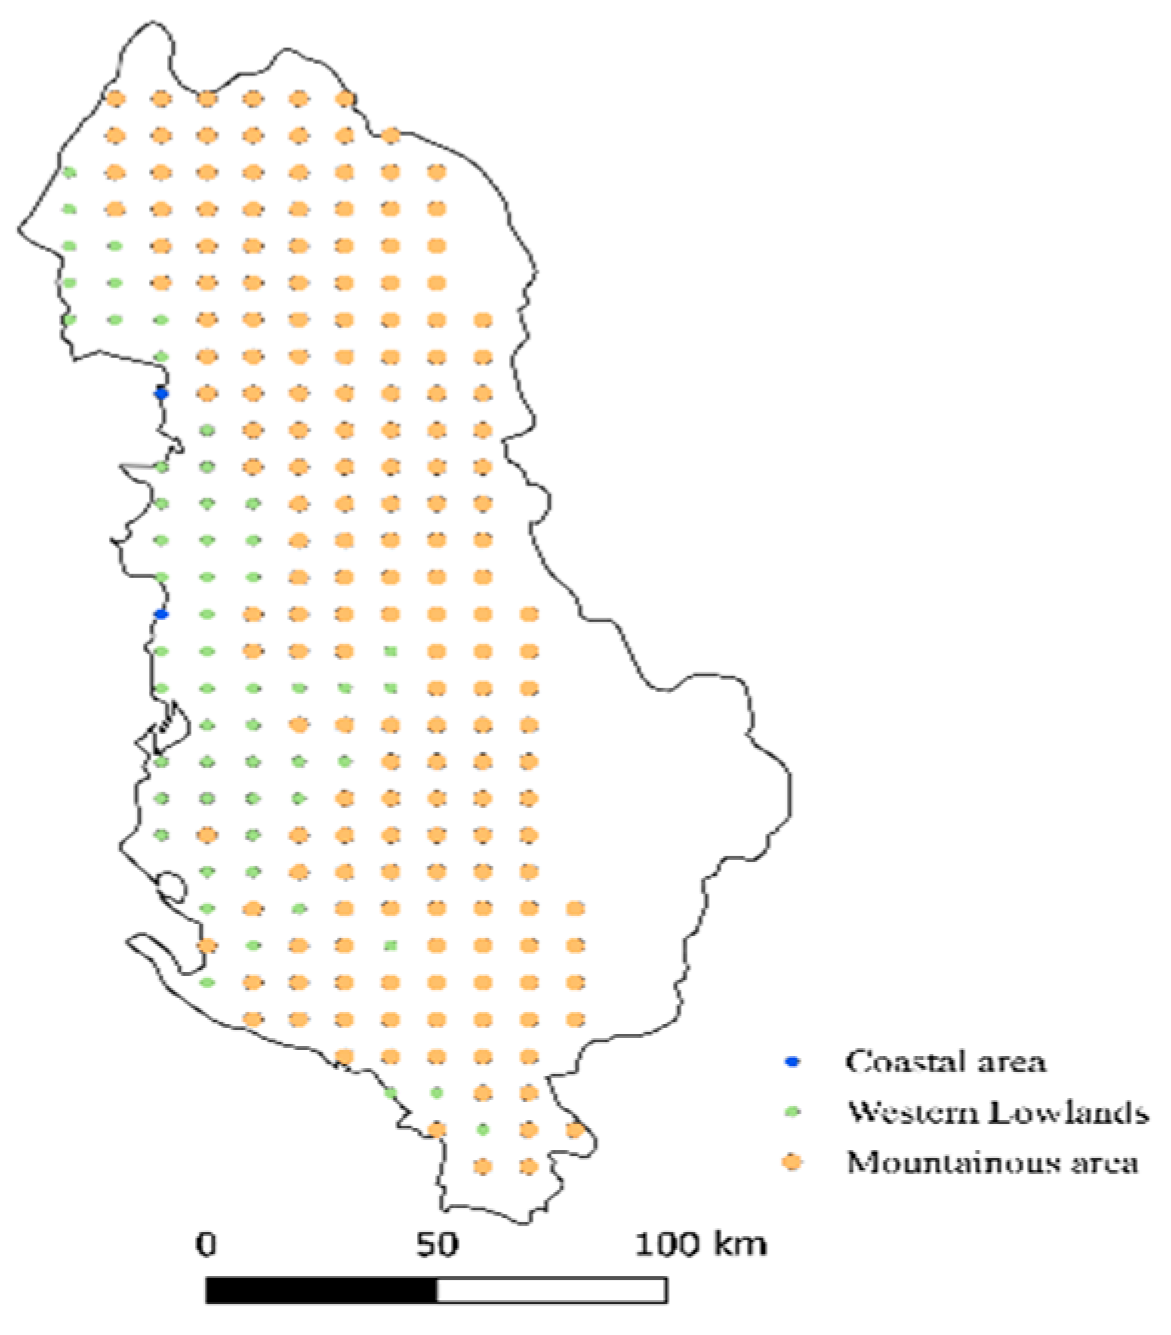
A regular sampling grid with a spatial resolution of 10 × 10 km was generated to ensure homogeneous spatial coverage, facilitate direct comparison among physiographic zones, and reduce interpolation bias (
Figure 3). Such grid-based approaches are widely used in environmental modelling to improve spatial representativeness, minimise interpolation uncertainty, and maintain spatial consistency across heterogeneous environments [
22,
23].
A total of 234 sampling points (grid centroids) were extracted across the study area and assigned to the three physiographic zones using a point-in-polygon spatial overlay.
The distribution of sampling points is as follows:
The limited number of sampling points in the coastal zone reflects the narrow spatial extent of the coastal strip in Albania. While this configuration is consistent with the adopted grid resolution, it may influence the robustness of statistical comparisons between physiographic zones and should therefore be considered when interpreting coastal results.
The higher density of sampling points in mountainous areas reflects both the larger spatial extent of this zone and the increased terrain heterogeneity that influences local atmospheric processes.
Wind and solar datasets covering the 2014–2024 period were harmonised within a unified spatial framework. All raster datasets were reprojected to EPSG: 3035 and resampled to a uniform spatial resolution of 5 × 5 km, ensuring consistency across variables and enabling accurate extraction of meteorological parameters at each sampling location [
24]. The resampling procedure was applied exclusively for spatial harmonisation and consistent variable extraction and should not be interpreted as explicit dynamical or statistical downscaling of ERA5 data. The original meteorological information remains constrained by the native ERA5 spatial resolution (~0.25°), which may limit representation of fine-scale terrain-induced variability.
2.3. Meteorological Data Acquisition and Preprocessing
The primary meteorological variables were retrieved from the ERA5 reanalysis dataset, produced by the European Centre for Medium-Range Weather Forecasts (ECMWF) and disseminated via the Copernicus Climate Data Store [
25]. ERA5 provides hourly atmospheric parameters on a regular latitude-longitude grid with a native spatial resolution of approximately 0.25° (~27 km at the study latitude). For this investigation, a continuous hourly time series spanning an 11-year period from January 2014 to December 2024 was extracted for the entire Albanian territory to ensure long-term statistical robustness [
26]. The selected period was intended to capture interannual climate variability and reduce the influence of individual anomalous years, thereby allowing the analysis to reflect broader climatological patterns rather than short-term fluctuations.
To bridge the gap between the coarse reanalysis grid and the high-resolution requirements of Albania’s complex topography, the following preprocessing protocols were implemented to derive physically consistent energy metrics:
Wind Speed Derivation: Hourly wind speed ( was computed from the eastward (u) and northward (v) horizontal wind components at 100 m above ground level using the vector magnitude relationship: . This height was selected to align with the operational hub heights of modern utility-scale wind turbines.
Solar Irradiance Transformation: The Surface Solar Radiation Downwards (SSRD), originally provided as accumulated radiant exposure in Joules per square meter (), was converted into hourly average irradiance () by dividing the accumulated values by the hourly integration interval (3600 s). For the final energy assessment, these values were aggregated into daily energy totals () to match international energy assessment standards.
Temporal Aggregation: The hourly datasets were systematically aggregated into daily resolutions specifically the daily arithmetic mean for wind speed and the daily sum for solar radiation. This multi-scale approach captures the synoptic-scale variability essential for complementarity analysis while filtering out sub-hourly operational noise.
This pre-processing workflow ensures a consistent spatiotemporal resolution between variables, preserving the dominant daily variability patterns required for robust, correlation-based complementarity indices (TCI) and subsequent statistical validation across the defined physiographic tiers.
ERA5 has a relatively coarse spatial resolution (~0.25°), it is well-suited for regional-scale assessments of renewable energy variability. Given that this study focuses on physiographic and seasonal complementarity patterns rather than site-specific resource estimation, the dataset provides an appropriate balance between spatial coverage and temporal consistency.
2.4. Data Normalisation and Index Quantification
To ensure comparability between wind speed, V () and solar irradiance which possess inherently different physical magnitudes, a rigorous data harmonisation protocol was implemented. This step is essential for integrated spatiotemporal analysis, as it enables the simultaneous evaluation of heterogeneous meteorological variables within a unified, dimensionless framework.
Initially, a Min–Max scaling procedure was applied to transform the raw datasets into a standardised range of [0, 1], where 0 and 1 represent the minimum and maximum observed values over the 11-year study period, respectively. This normalisation ensures that both variables contribute comparably to subsequent analyses, without bias arising from differences in their physical units or magnitudes. In addition, Min–Max normalisation preserves the relative differences between observations while constraining all variables within a common [0–1] range, thereby facilitating direct comparability across complementarity indices and supporting interpretation within the adopted multi-index framework.
Based on this harmonised dataset, the analysis adopts a multi-index framework to enable an integrated assessment of wind–solar interactions. This framework captures complementary aspects of resource behaviour across both spatial and temporal dimensions, reflecting the inherently multidimensional nature of renewable energy complementarity. No single metric is sufficient to fully characterise these interactions; therefore, the combined use of multiple indices provides a more comprehensive and physically consistent representation of complementarity patterns.
Accordingly, a set of complementary indices was defined to quantify resource synergy across spatial and temporal dimensions, following recent approaches in hybrid renewable energy system analysis [
27].
2.4.1. Hybrid Suitability Index (HSI): Quantifying Combined Magnitude
To evaluate the combined spatial magnitude of wind and solar resources for hybrid deployment potential, a Hybrid Suitability Index (HSI) was computed. This index utilises a Weighted Linear Combination (WLC) approach, a widely used method in multi-criteria decision analysis for integrating heterogeneous variables into a unified suitability metric, particularly in renewable energy planning.
The HSI is defined as follows:
where
and
represent the normalised solar irradiance and wind speed, respectively, and
and
are their corresponding weights.
In the absence of predefined policy preferences, equal weighting was adopted to reflect a neutral hybrid configuration. This assumption avoids introducing bias toward a specific energy source and allows the analysis to focus on intrinsic resource availability.
The use of equal weights provides a neutral baseline and avoids introducing subjective bias into the analysis. However, in practical applications, variations in resource availability, development costs, and policy priorities may justify alternative weighting schemes. Sensitivity analysis under different weighting configurations is therefore recommended as a direction for future research.
The HSI provides a dimensionless measure of combined resource magnitude, identifying locations where both wind and solar resources are simultaneously strong. As such, it represents the baseline suitability for hybrid system deployment, complementing the SCI and TCI metrics, which capture balance and temporal interaction, respectively. Higher HSI values indicate increased suitability for hybrid wind–solar deployment.
2.4.2. Spatial Complementarity Index (SCI)
The Spatial Complementarity Index (SCI) was computed to evaluate the degree of balance between wind and solar resources across the study area.
The SCI provides a dimensionless measure of spatial equilibrium between normalised wind and solar resources. Values approaching unity indicate a high degree of balance, where both resources contribute comparably at a given location, whereas values closer to zero reflect increasing dominance of one resource over the other.
Unlike HSI, which captures overall resource magnitude, SCI specifically characterises the relative compensation structure between wind and solar energy. This distinction is critical for identifying locations where hybrid systems can reduce dependency on a single resource and enhance generation stability. By quantifying resource balance, SCI supports a more robust assessment of spatial complementarity in complex terrains and the identification of zones with reduced variability for hybrid energy deployment [
28]. The selected formulation additionally provides a simple and physically interpretable framework for location-specific physiographic comparison. Unlike covariance-based approaches, which primarily characterise statistical co-variation, SCI was designed to assess spatial resource interactions across heterogeneous terrain conditions.
2.4.3. Temporal Complementarity Index (TCI)
The Temporal Complementarity Index (TCI) was used to quantify the degree of anti-correlation (time-based compensation) between wind and solar resources at each sampling centroid. This index is derived from the Pearson correlation coefficient (
) of the daily time series:
This transformation rescales the correlation coefficient from the range to , enabling direct comparability with other complementarity metrics. Values of indicate negative correlation and therefore favourable temporal complementarity, where periods of low availability in one resource are compensated by higher availability in the other.
Pearson correlation was selected because it provides a transparent and widely used measure of temporal synchronisation, enabling consistent comparison of temporal complementarity patterns across physiographic zones.
By capturing the temporal structure of resource interaction, TCI provides a quantitative measure of time-based compensation, which is essential for assessing the ability of hybrid systems to mitigate intermittency and improve supply stability. This approach is consistent with recent studies demonstrating the effectiveness of correlation-based indices in evaluating renewable energy complementarity [
29].
2.5. Seasonal Aggregation
To capture the intra-annual dynamics of wind–solar complementarity, the 11-year dataset was aggregated into four distinct seasons. This temporal stratification is essential for identifying seasonal shifts in resource availability, as complementarity levels between wind and solar resources often exhibit significant seasonal variability depending on the geographic context [
30]. Recent assessments emphasize that these variations are critical for evaluating the interrelationship between power factors at both daily and seasonal scales, particularly in regions with diverse topographic features [
31].
2.6. Statistical Framework and Robustness Testing
To ensure the empirical rigour and scientific validity of the findings, a comprehensive statistical framework was established. This stage enables a quantitative assessment of variability and determines whether the observed differences between coastal, lowland, and mountainous regions are statistically significant. The implementation of this framework is essential for supporting a national-scale evaluation of resource complementarity and stability.
This multi-zonal approach aligns with contemporary data-driven frameworks that employ spatial clustering and non-parametric validation to identify regional energy patterns [
32]. Furthermore, it supports policy-relevant assessments of renewable energy integration while accounting for regional variability in atmospheric drivers [
33,
34].
2.6.1. Descriptive Statistics and Dispersion Metrics
The distributional characteristics and stability of wind and solar resources, alongside the derived indices (TCI and SCI), were evaluated using the following metrics:
Coefficient of Variation (CV): Used to quantify relative variability and assess the temporal stability of resource potential across sampling locations.
Interquartile Range (IQR): Applied as a robust measure of statistical dispersion, enabling the identification of variability patterns and potential outliers that may influence mean-based estimates.
2.6.2. Non-Parametric Comparative Analysis
Given the non-Gaussian nature of meteorological time series, non-parametric methods were employed for inter-regional comparisons. Such rank-based approaches are widely used in renewable energy studies to assess spatial variability and statistical differences across heterogeneous regions [
35]. This framework ensures that observed differences between physiographic zones are supported by robust statistical evidence.
Kruskal–Wallis H-test: A rank-based one-way analysis of variance was used to determine whether statistically significant differences exist in TCI and SCI values across the three physiographic zones (Coastal, Lowland, and Mountainous).
Mann–Whitney U test: Following the Kruskal–Wallis test, pairwise comparisons were conducted using the Mann–Whitney U test to identify specific regional differences in complementarity patterns.
3. Results
Given the non-normal distribution of the data, central tendency is described using medians and dispersion is described using interquartile ranges (IQR), ensuring consistency with the applied non-parametric statistical framework.
The results reveal a consistent physiographic organisation of wind–solar complementarity across Albania, with clear differentiation between coastal, lowland, and mountainous regions. Across all seasons, SCI values are highest in coastal areas, decrease in the western lowlands, and reach lower and more heterogeneous levels in mountainous regions, indicating a stable spatial gradient.
3.1. Results of Spatial Complementarity Index (SCI)
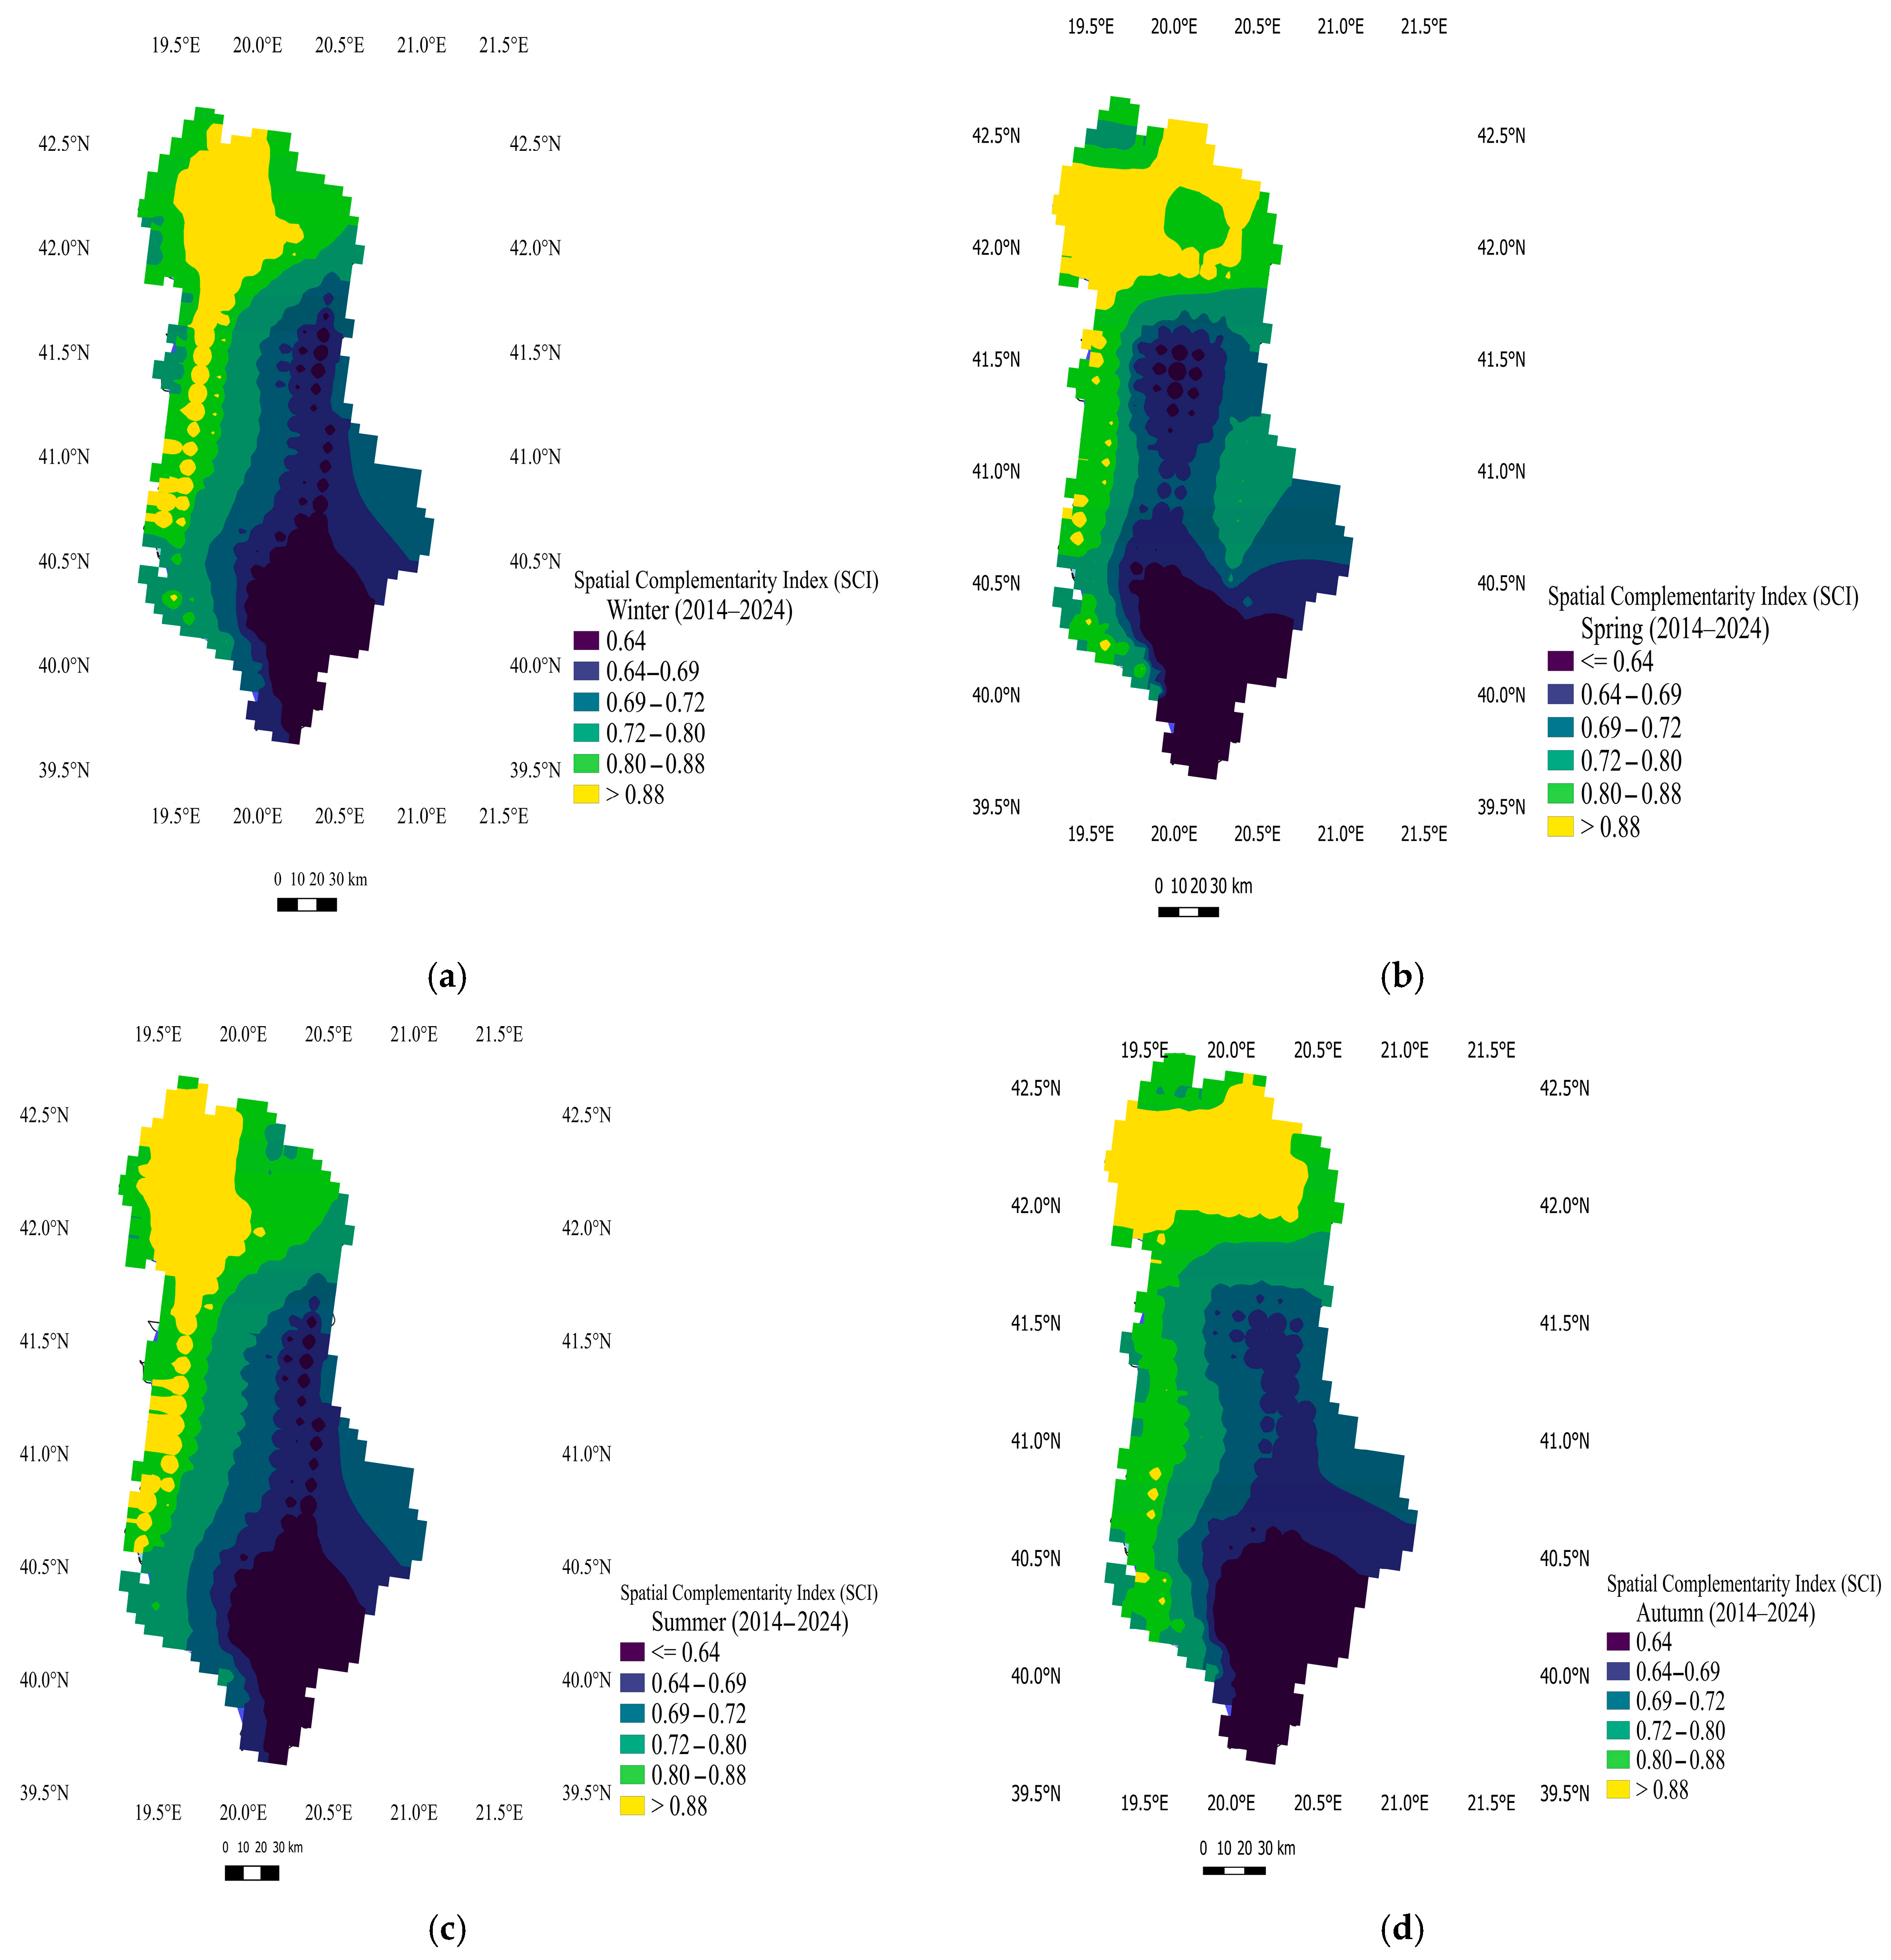
The spatial distribution of the Spatial Complementarity Index (SCI) across Albania reveals a clear and consistent physiographic gradient (
Figure 4). SCI values exhibit a consistent decrease from coastal and lowland environments towards mountainous regions, where spatial heterogeneity becomes more pronounced.
This pattern is observed across all seasons, indicating a stable terrain-controlled spatial structure of complementarity.
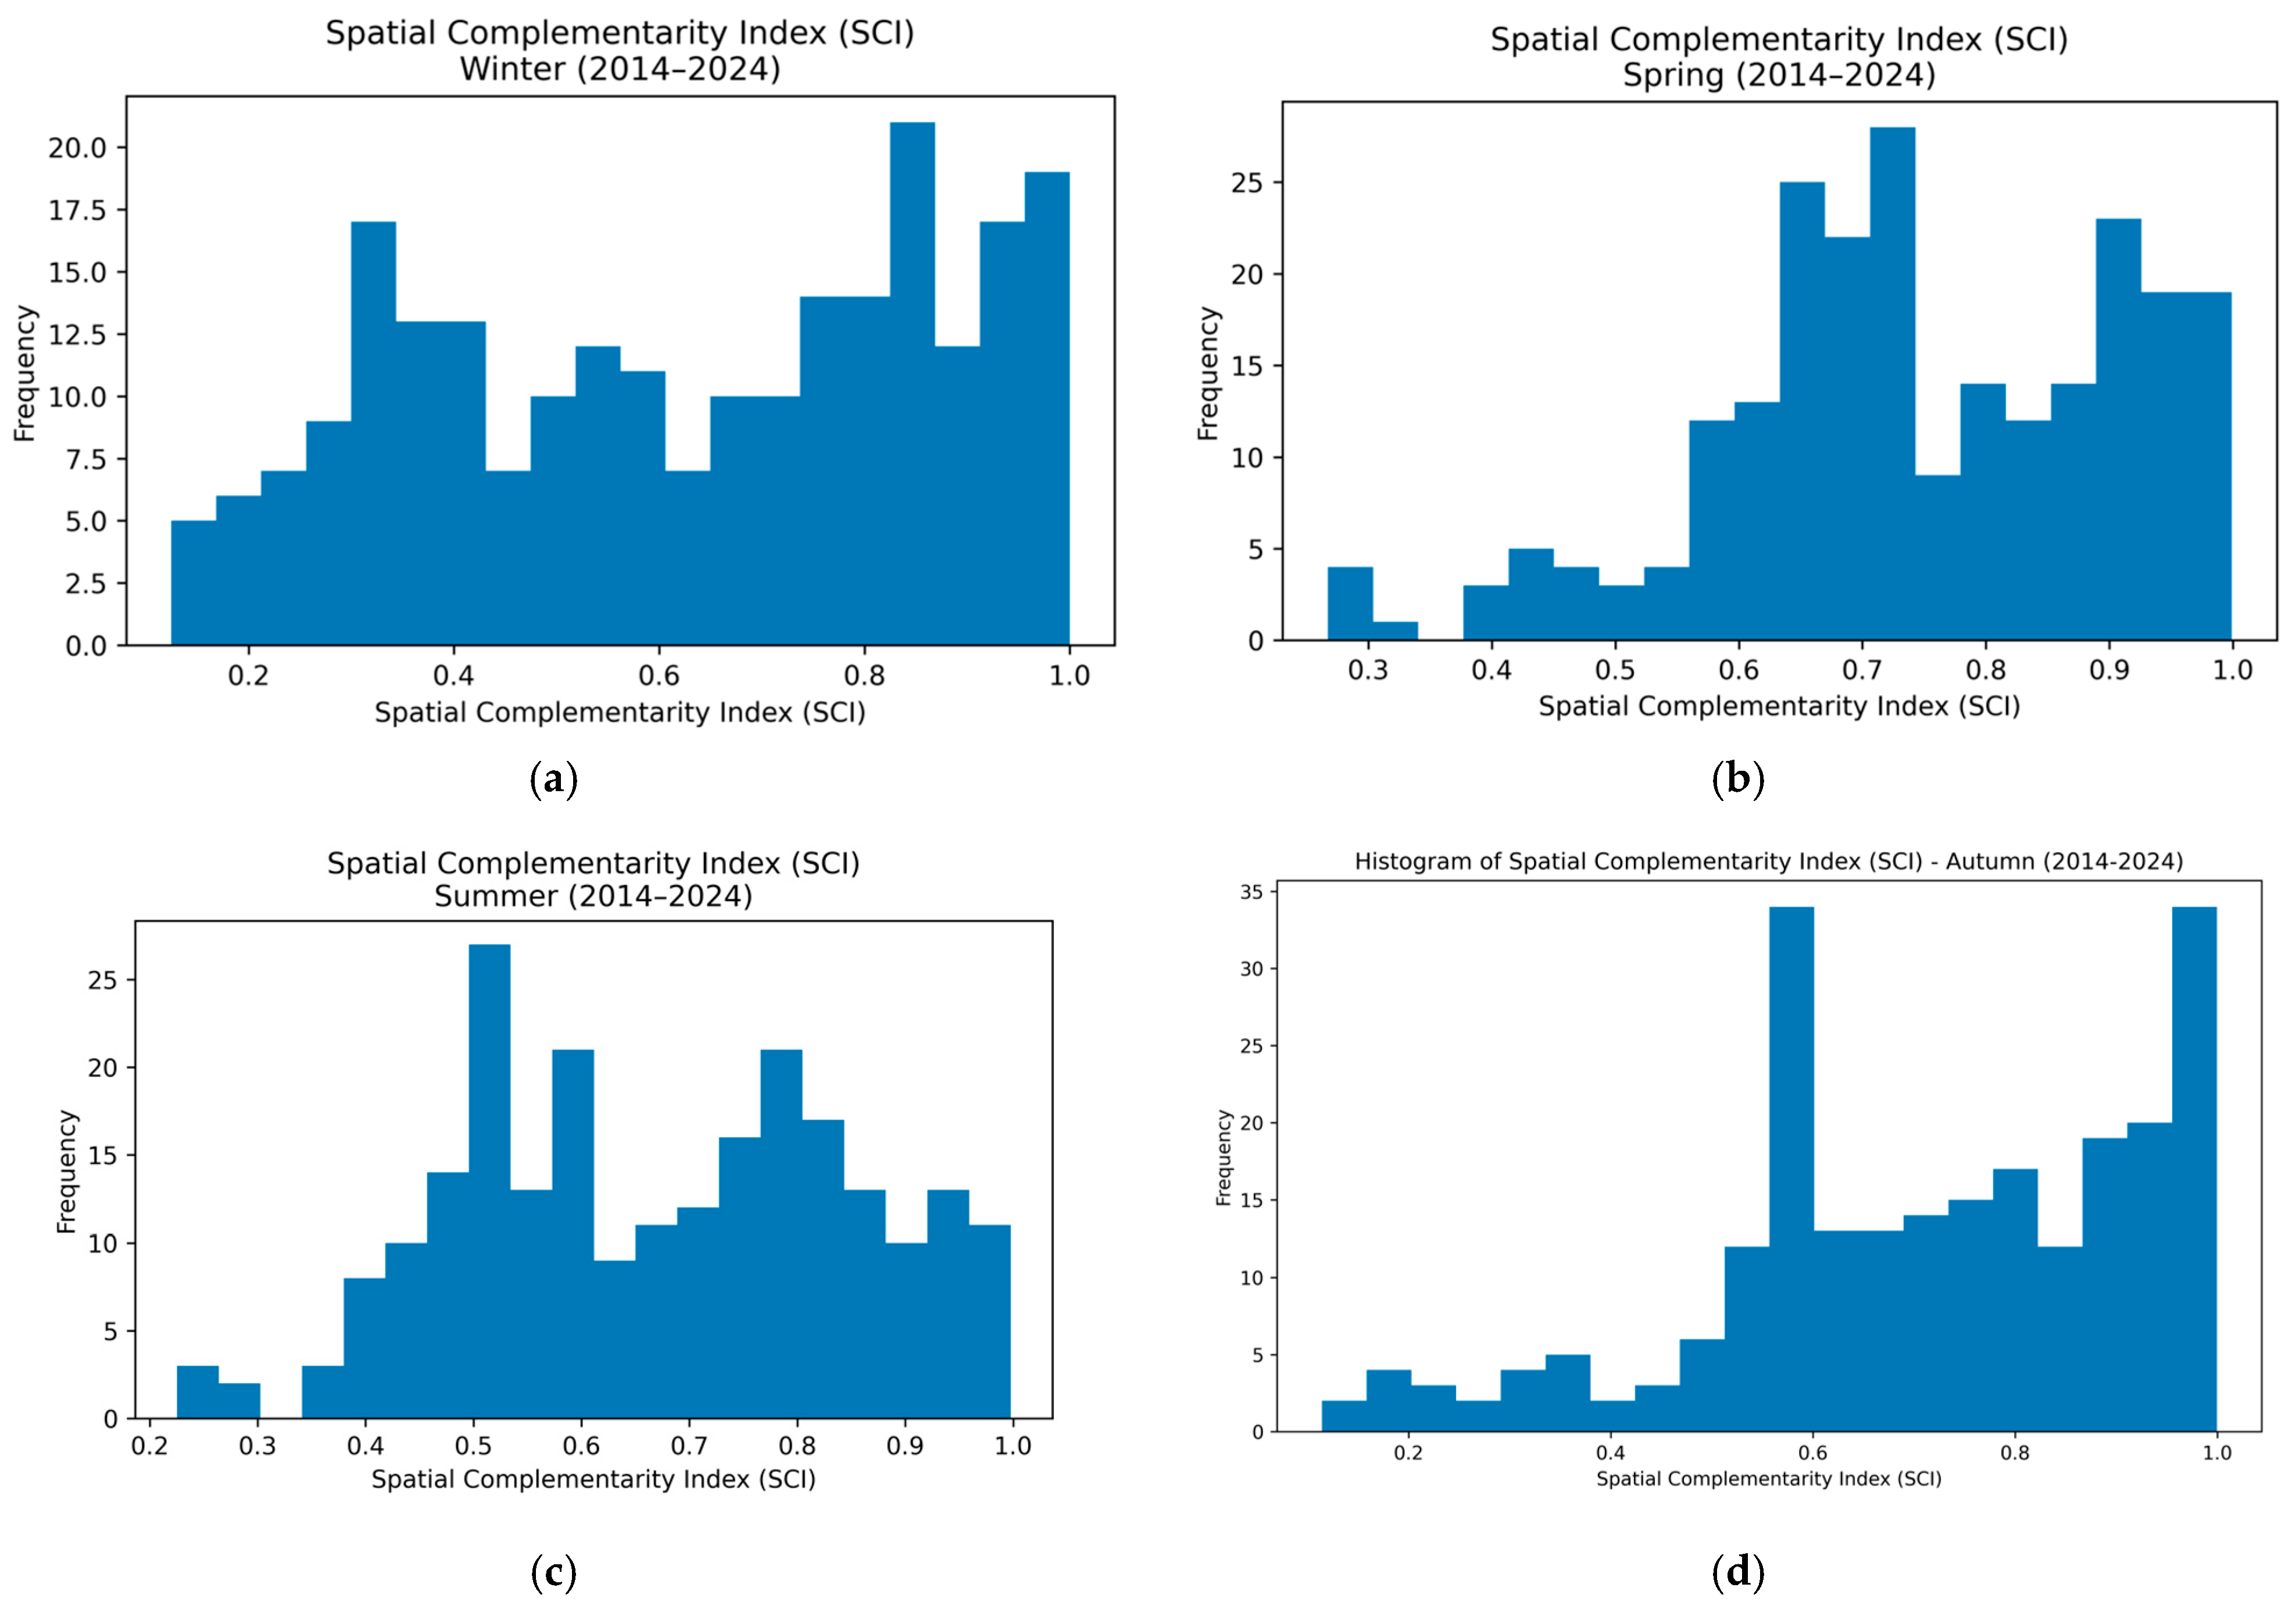
The frequency distribution of SCI further highlights seasonal variability in complementarity patterns (
Figure 5). SCI values are generally concentrated within moderate to high ranges, indicating generally favourable complementarity conditions across the study area. Seasonal differences are evident. Spring and autumn exhibit a higher proportion of values above 0.8, whereas summer shows a broader and more dispersed distribution. Winter exhibits intermediate conditions. Low SCI values represent a relatively small proportion of observations, while higher values dominate across all seasons. Coastal zones exhibit consistently high SCI values with limited spatial dispersion, whereas western lowlands show moderately high values with greater variability. Mountainous regions are characterised by lower values and a wider distribution, reflecting increased terrain-induced heterogeneity. The coastal zone is represented by a limited number of sampling points relative to other regions. This spatial hierarchy is consistent across seasons. Higher SCI values are observed during spring and autumn, while summer is associated with reduced and more variable patterns. Winter shows intermediate conditions, with clear separation between low-elevation and mountainous regions.
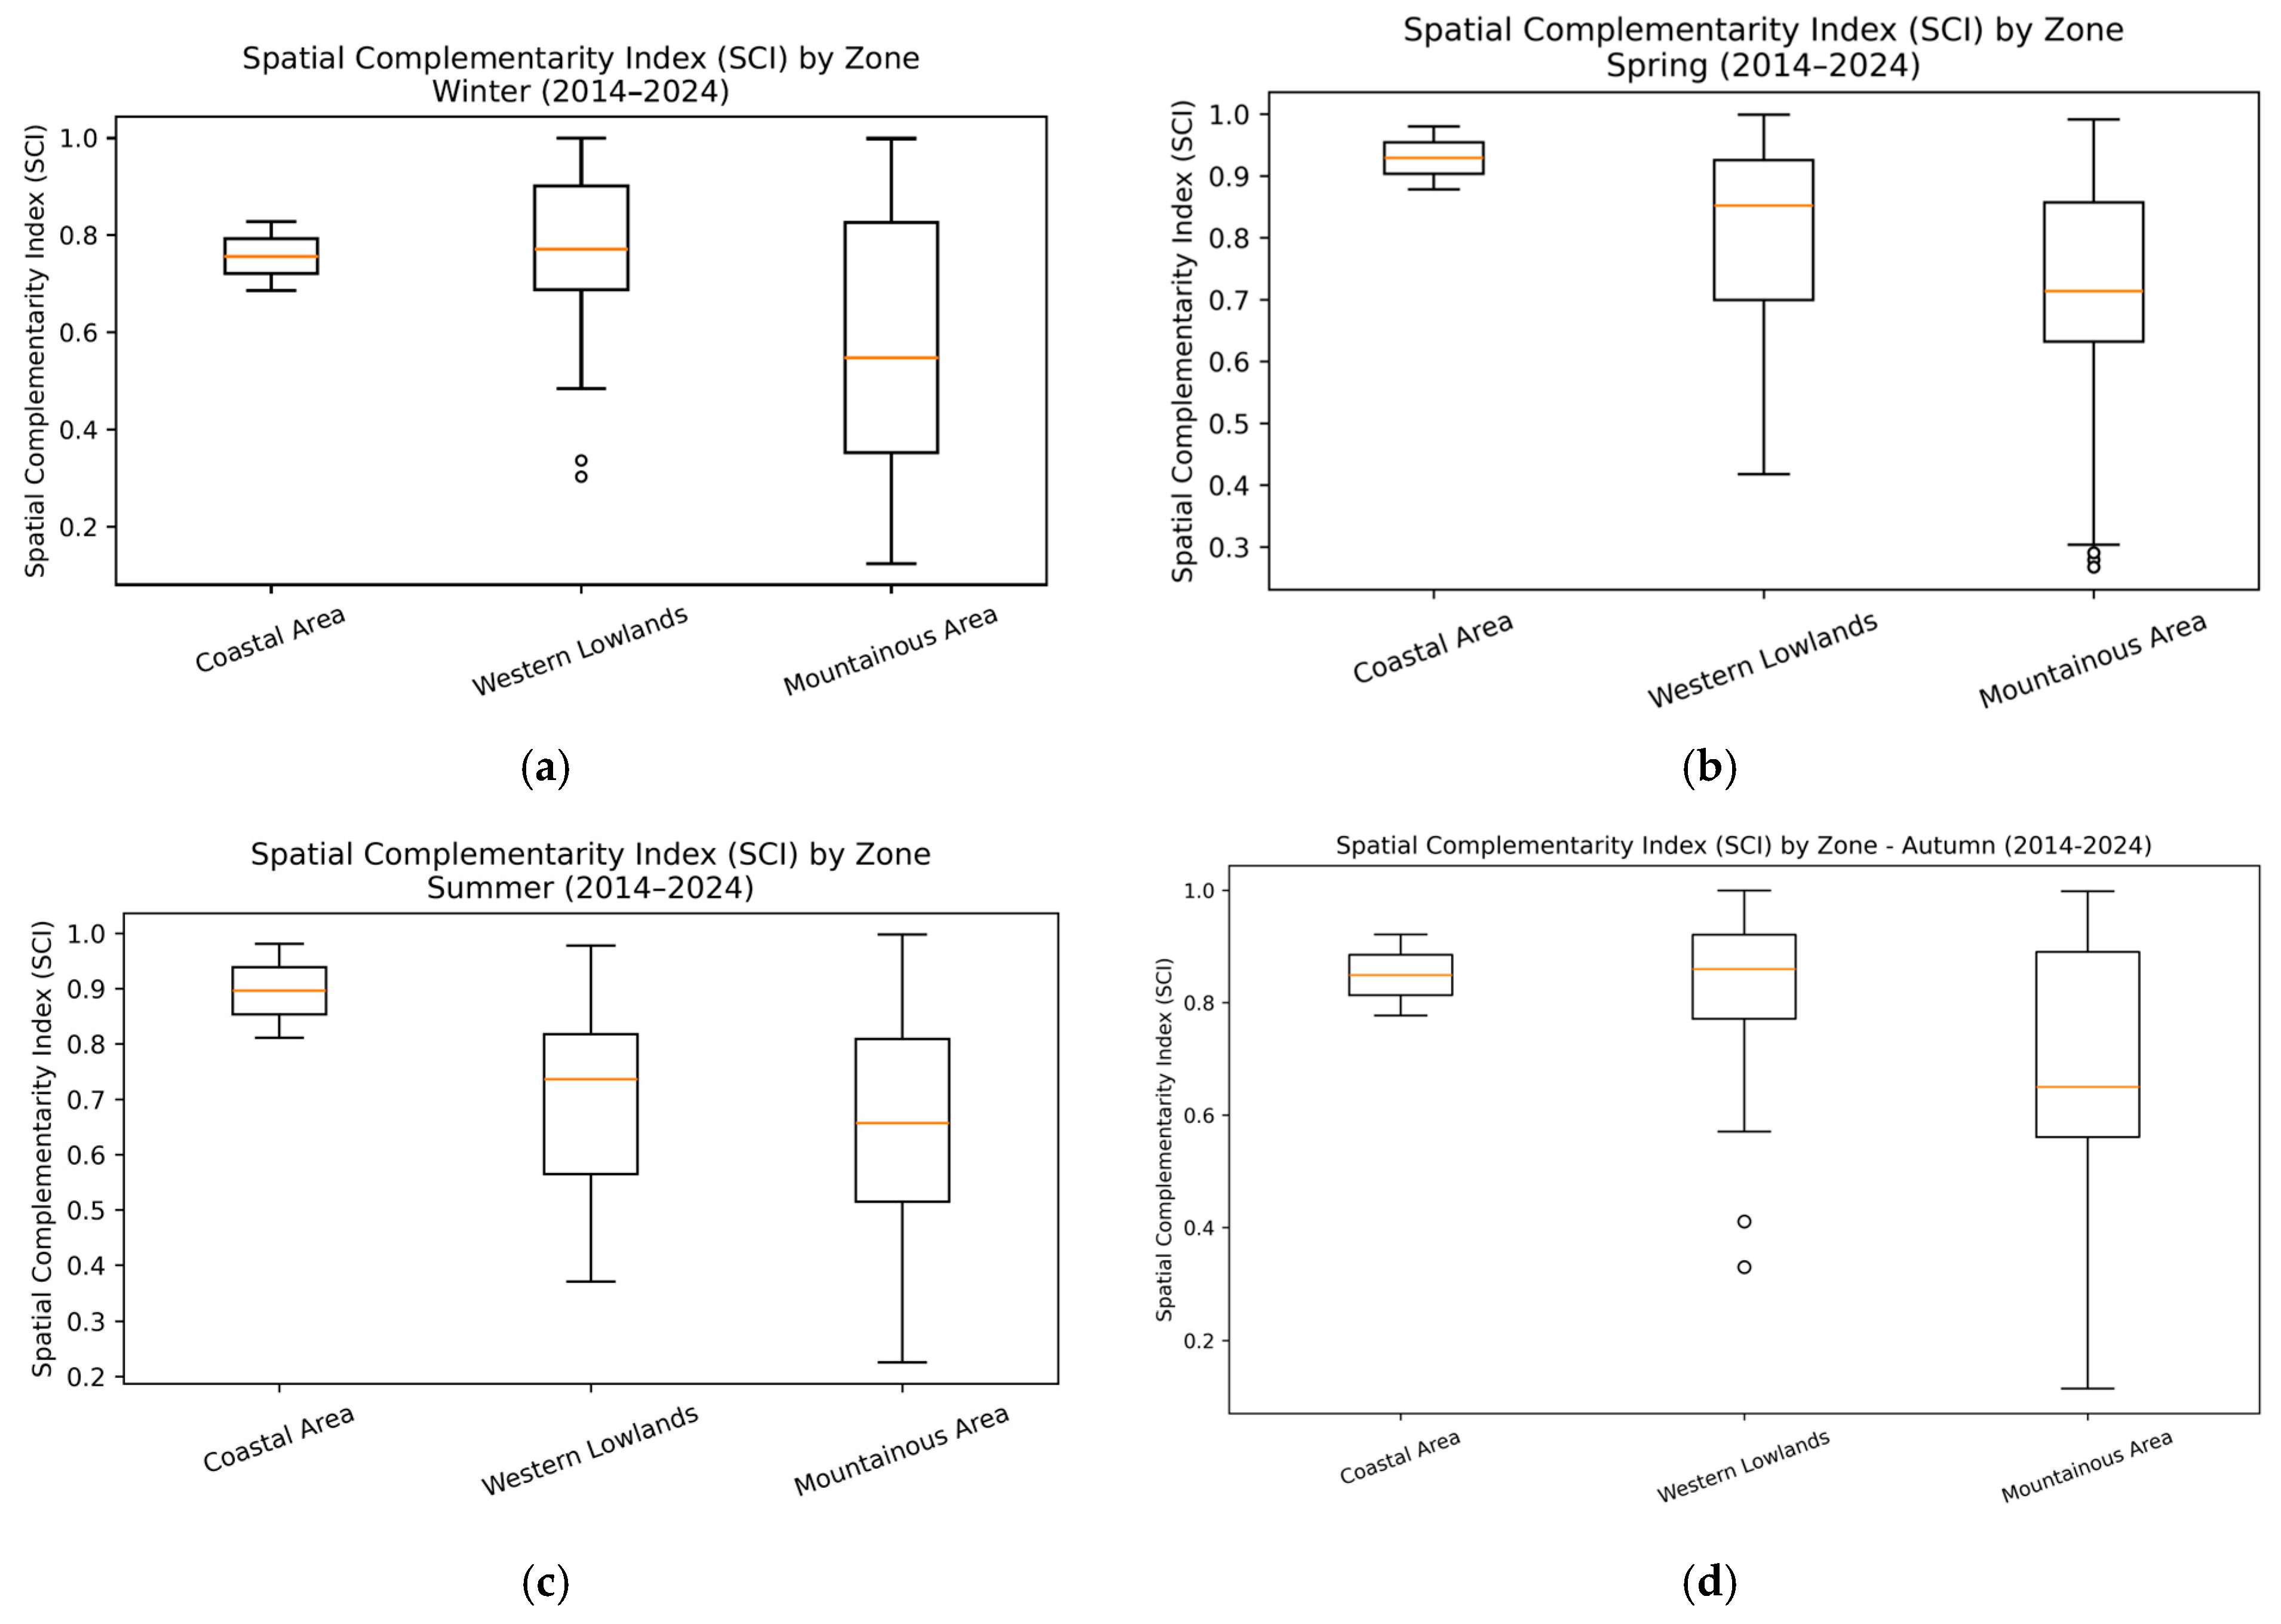
The distribution of SCI across physiographic zones highlights systematic inter-zonal differences (
Figure 6). Coastal areas exhibit the highest SCI values with a narrow interquartile range (IQR), indicating limited variability. The western lowlands display moderately high values with a wider distribution, while mountainous regions show lower median values and a broader range.
This zonal pattern is consistent across all seasons, with variability increasing from coastal to mountainous zones. Seasonal variations are also evident, with higher median values observed during spring and autumn and lower values during summer.
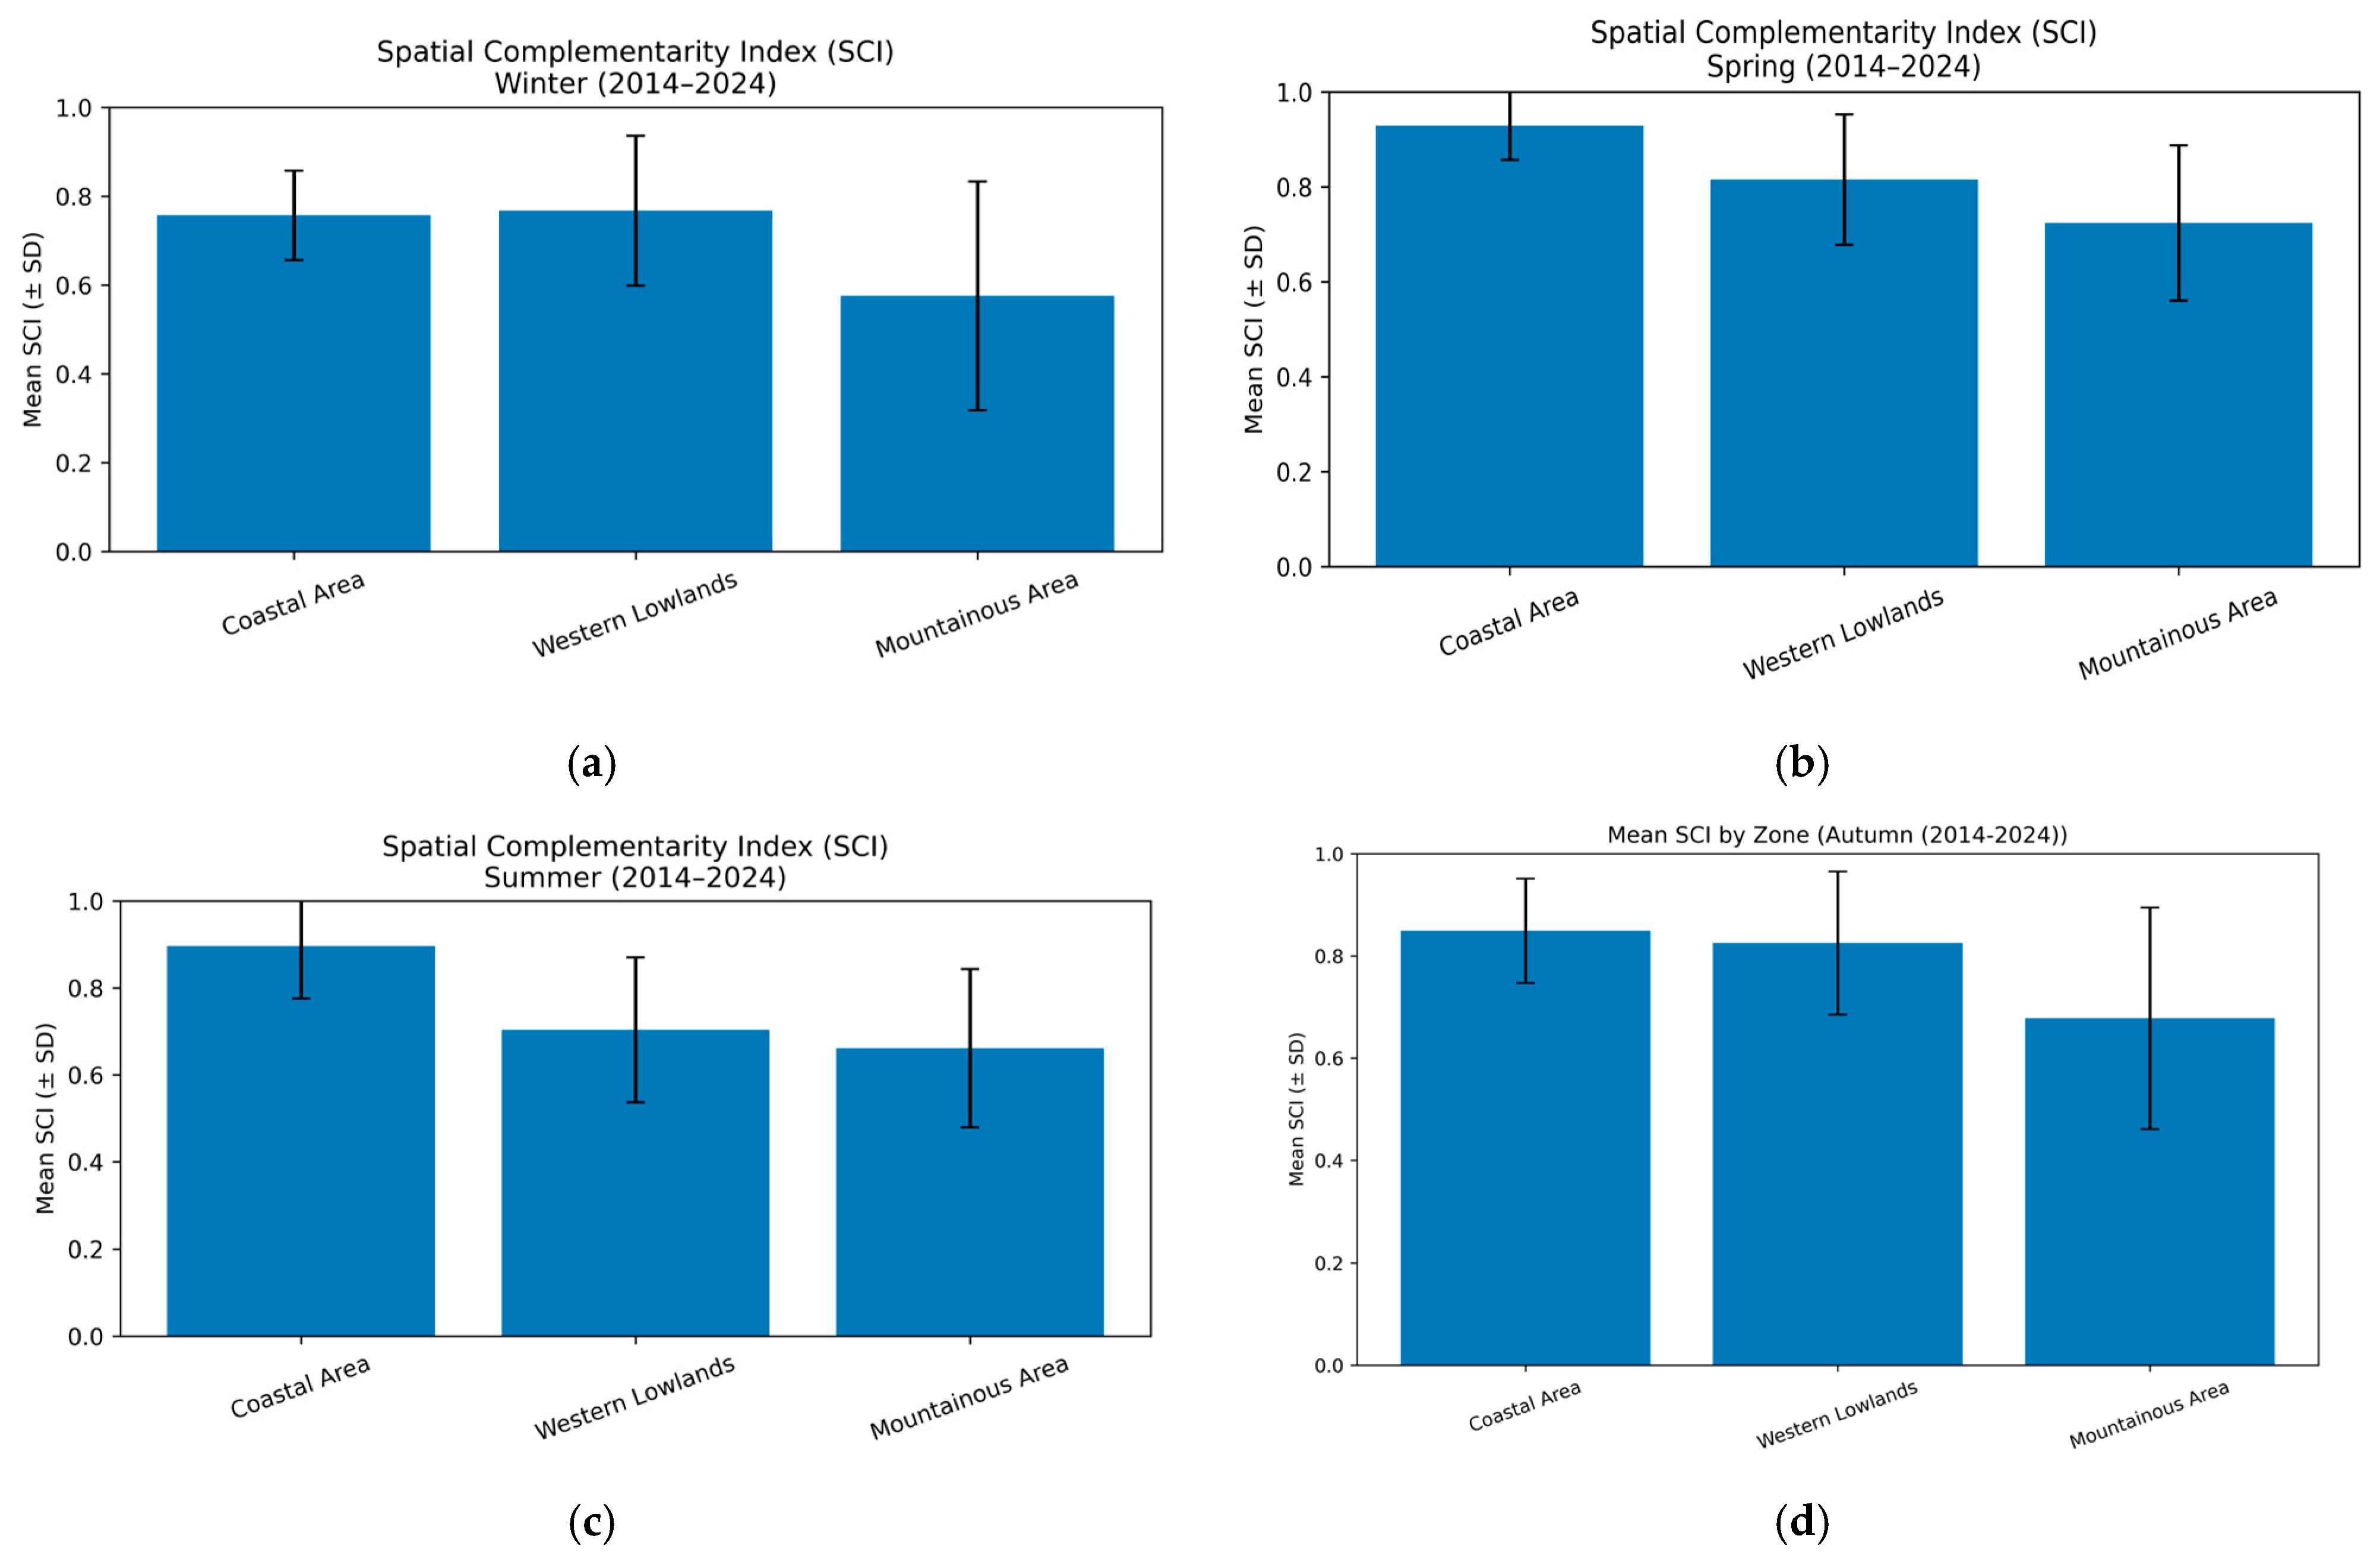
Mean SCI values further confirm the observed spatial and seasonal patterns (
Figure 7). Coastal areas consistently exhibit the highest values, followed by western lowlands, while mountainous regions show lower values and greater variability.
Seasonally, SCI peaks during spring, with coastal areas exceeding 0.90 and lowland areas remaining above 0.80. In contrast, summer shows reduced values, particularly in mountainous regions, where SCI decreases to approximately 0.70 and below. Winter and autumn exhibit intermediate conditions, with relatively high values in coastal and lowland areas (approximately 0.75–0.85), while mountainous regions maintain lower and more variable distributions.
Overall, SCI confirms a persistent spatial gradient and clear seasonal modulation, with decreasing complementarity from coastal to mountainous regions.
3.2. Statistical Analysis of the Spatial Complementarity Index (SCI)
The statistical analysis of the Spatial Complementarity Index (SCI) reveals clear seasonal differences in the significance of spatial variability across physiographic zones (
Table 1).
The Kruskal–Wallis test indicates statistically significant differences in SCI values among physiographic zones during winter, spring, and autumn (p < 0.001 in all cases), confirming the persistence of spatial differentiation across seasons. Post hoc pairwise comparisons show that statistically significant differences occur between the western lowlands and the mountainous region, whereas no significant differences are detected between the coastal area and the other zones.
In contrast, during summer, the Kruskal–Wallis test does not indicate statistically significant differences among physiographic zones (H = 5.27, p = 0.072), and no post hoc comparisons were performed. This absence of statistical significance likely reflects the increased dominance of solar irradiance and the reduced variability of wind conditions during summer. Together, these factors contribute to a more spatially homogeneous distribution of the wind–solar balance across physiographic zones.
Overall, the results indicate that spatial differences in SCI are present in most seasons but are not observed during summer, thereby illustrating the seasonal modulation of terrain-driven complementarity patterns.
3.3. Results of Temporal Complementarity Index (TCI)
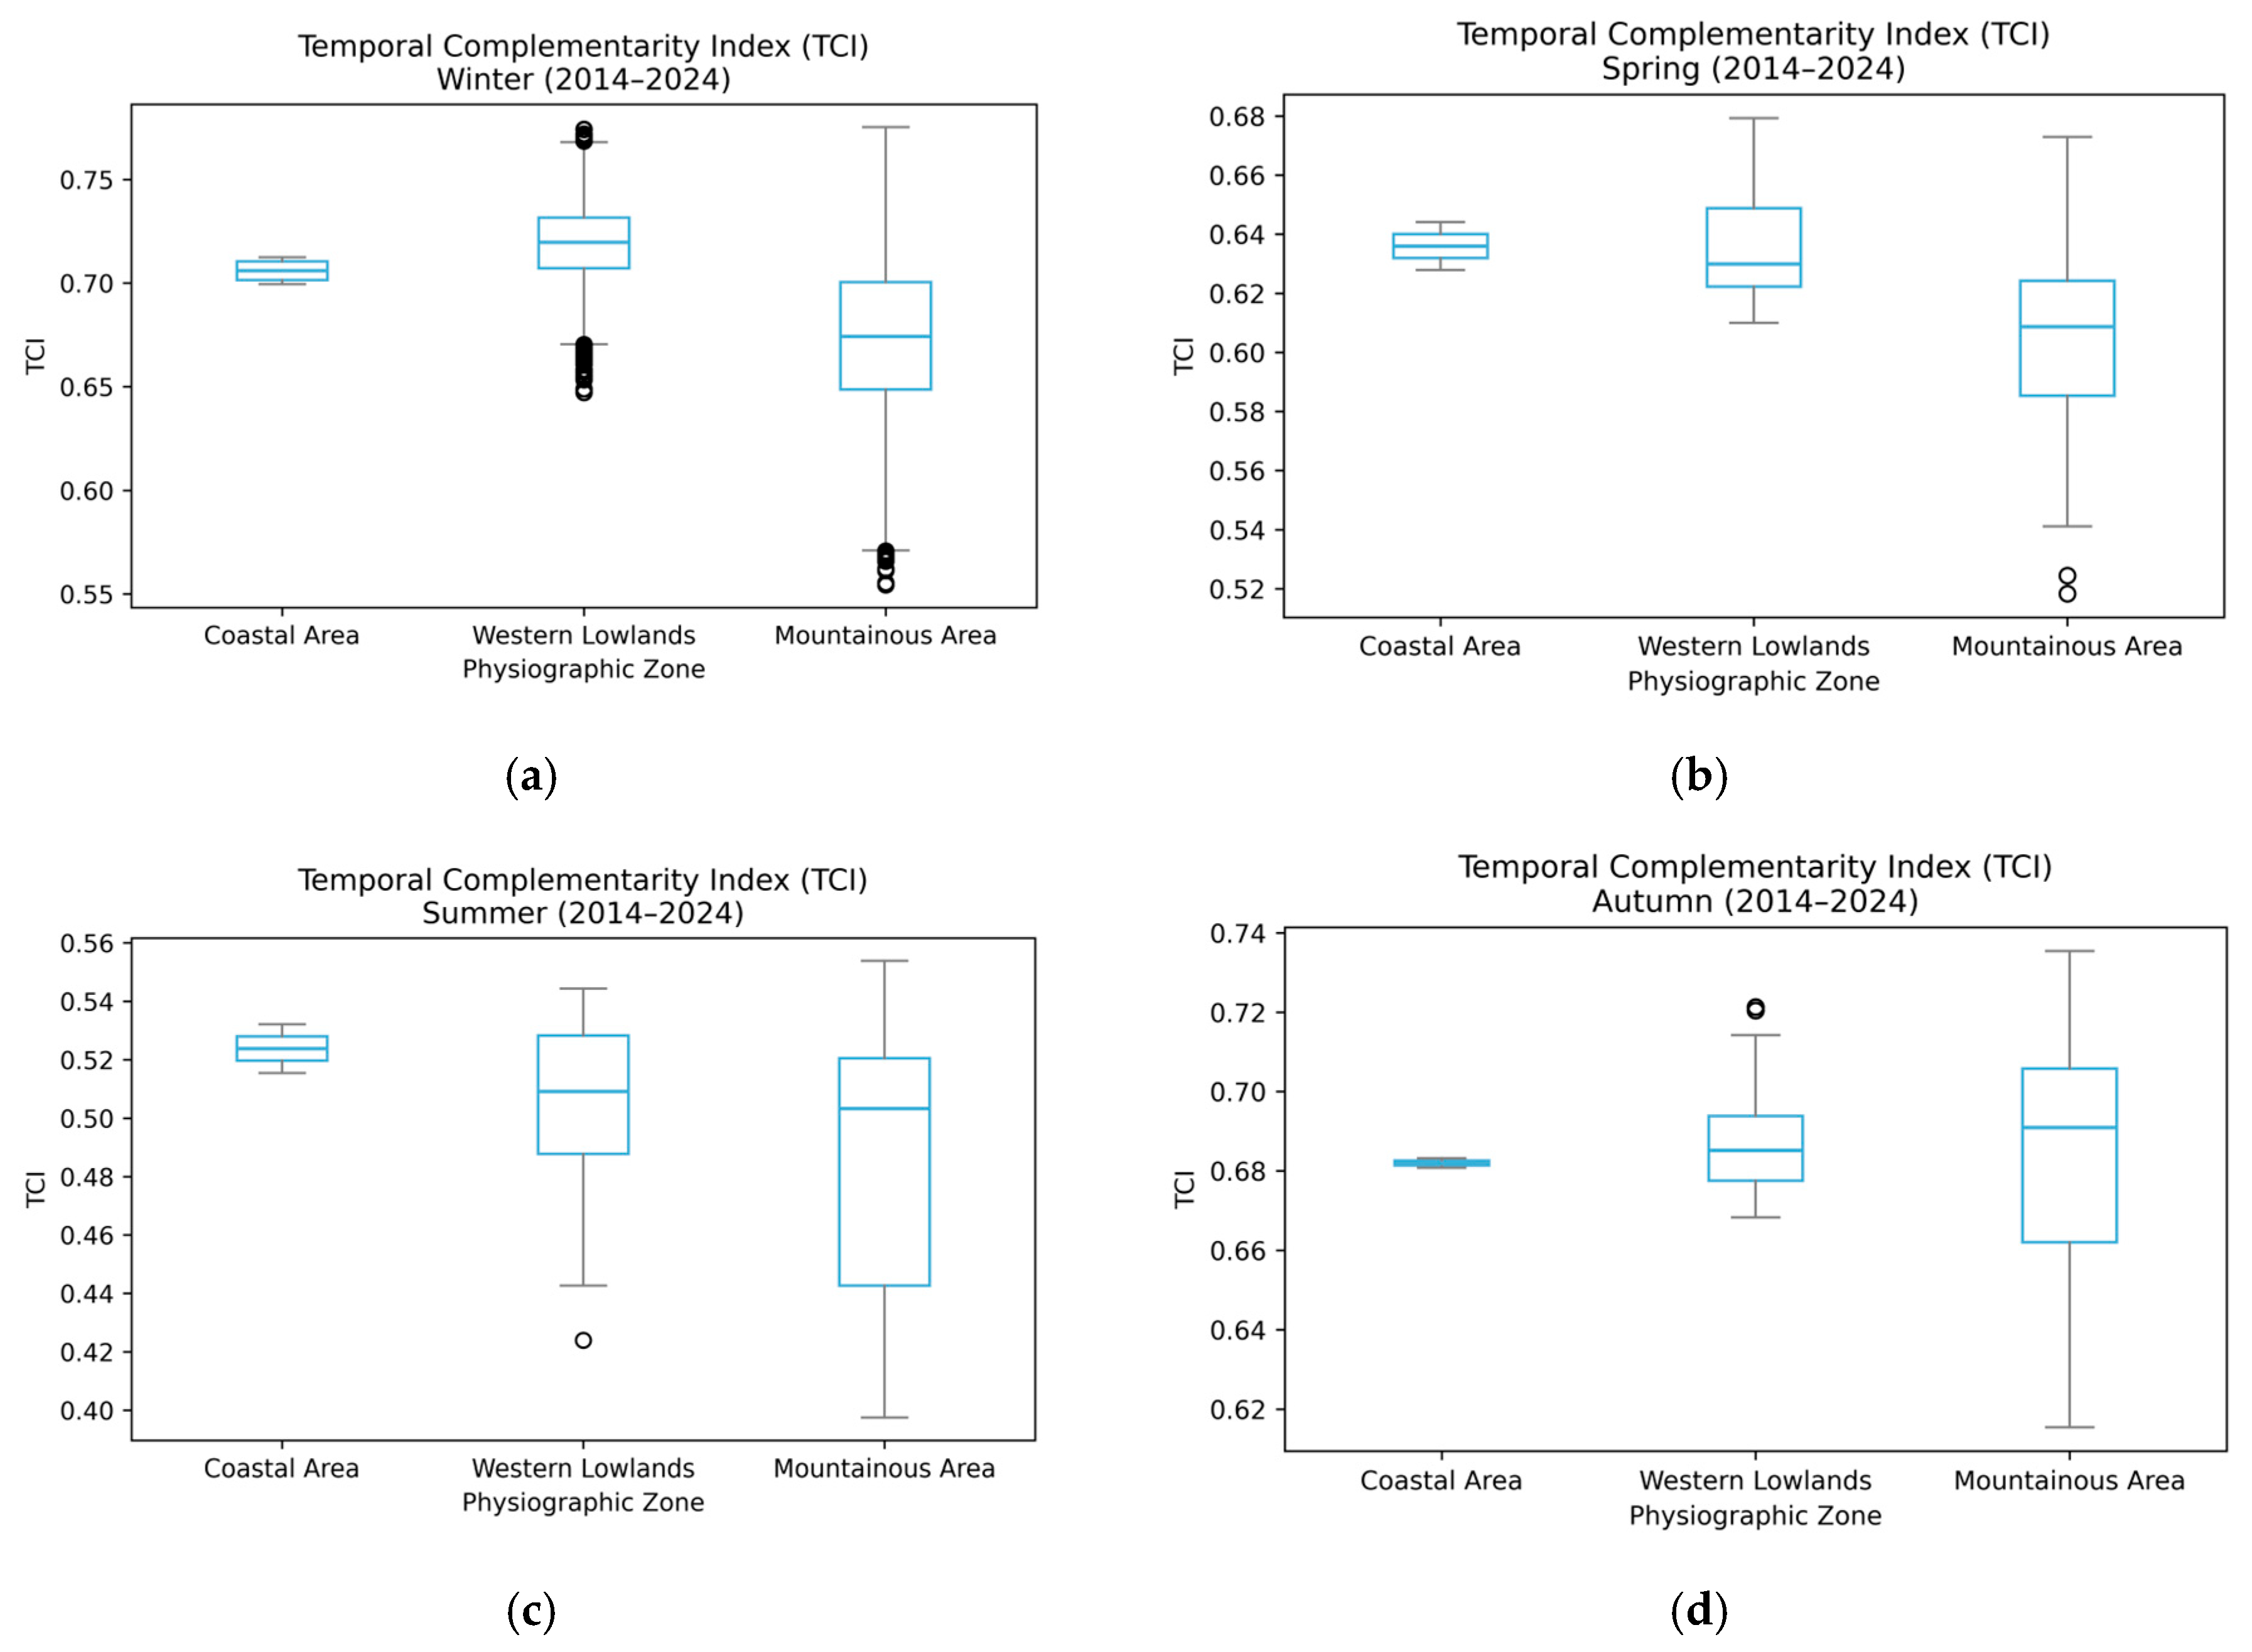
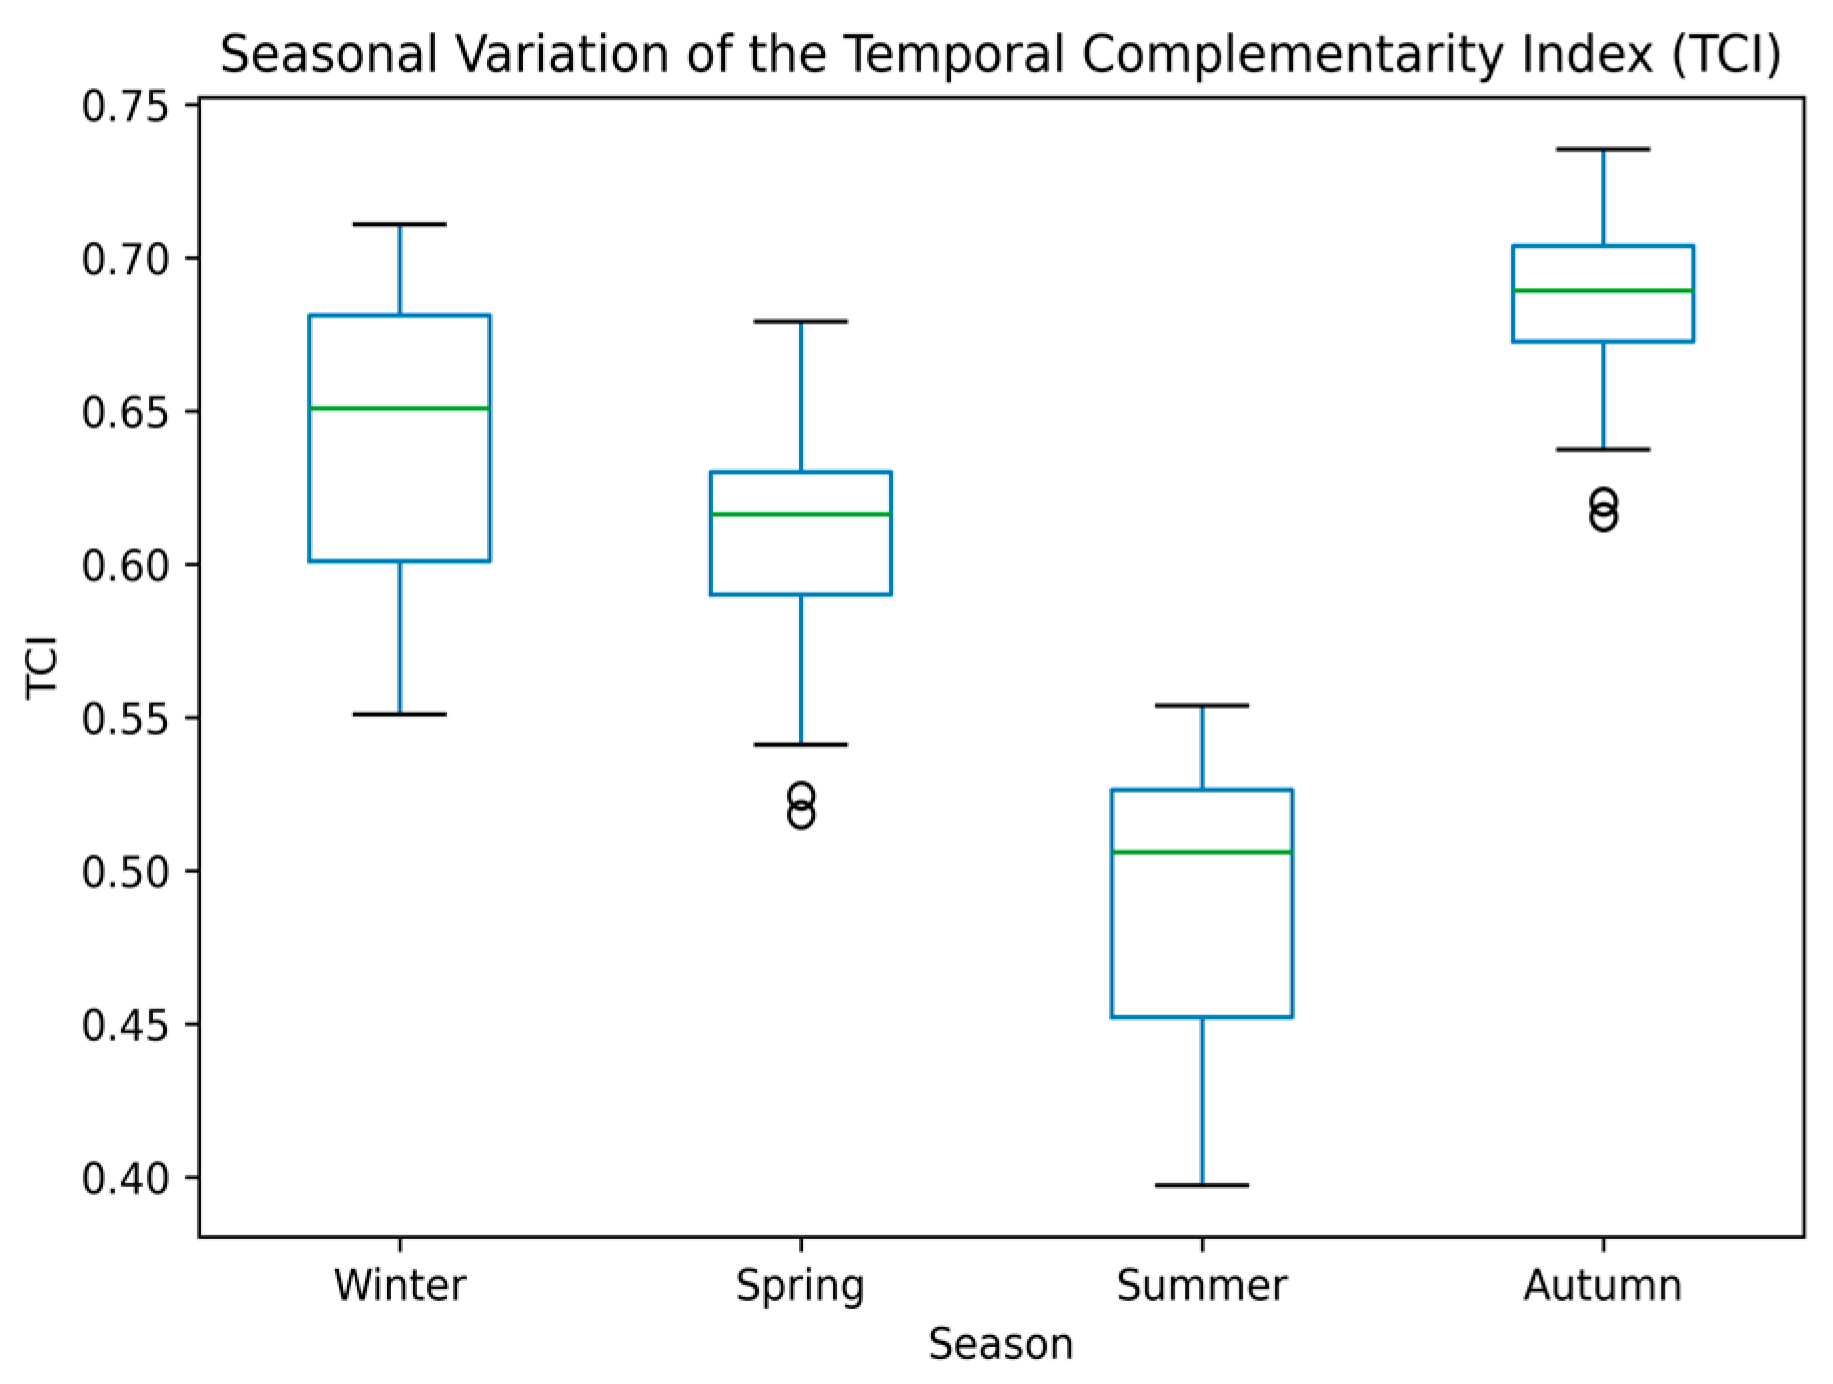
The Temporal Complementarity Index (TCI) shows clear seasonal variability across Albania (
Figure 8 and
Figure 9). Median TCI values reveal a distinct seasonal hierarchy, with peak levels observed during autumn (≈0.68–0.69) and minimum levels during summer (≈0.48–0.52), while winter and spring exhibit intermediate conditions. These patterns are consistent with mean TCI values, which similarly peak during autumn and decline during summer.
Across physiographic zones, coastal and western lowland areas exhibit relatively similar TCI distributions across all seasons, generally ranging between 0.63 and 0.69. In contrast, mountainous regions show lower values, particularly during spring and summer, where median values decrease to approximately 0.60 and 0.48–0.50, respectively. This pattern should be interpreted with caution given the limited coastal sample size.
The distribution of TCI values varies across seasons. Autumn is characterised by a narrow distribution with consistently high values across all zones, whereas summer shows a broader distribution with lower median values and increased variability. Winter and spring present intermediate distributions, with moderate variability and visible differences between physiographic zones.
TCI values reveal a coherent seasonal structure across Albania, with higher values during autumn and lower values during summer, alongside persistent regional variability across physiographic settings.
3.4. Statistical Analysis of TCI
The statistical analysis of the Temporal Complementarity Index (TCI) shows seasonal differences in the significance of spatial variability across physiographic zones (
Table 2).
The statistical analysis of the Temporal Complementarity Index (TCI) reveals clear seasonal differences in the significance of spatial variability across physiographic zones. Statistically significant inter-zonal differences are observed during winter and spring (p < 0.001), with post hoc comparisons indicating that these differences primarily occur between the western lowlands and mountainous regions. No statistically significant differences are identified for coastal areas relative to the remaining physiographic zones; however, these findings should be interpreted with caution given the limited coastal sample representation.
During summer, pairwise comparisons indicate significant differences between the western lowlands and mountainous regions despite the lower overall seasonal variability in TCI values. Conversely, autumn does not exhibit statistically significant differences among physiographic zones (H = 0.17, p = 0.917), indicating a more spatially homogeneous temporal complementarity regime across Albania during this season.
These patterns indicate that temporal complementarity displays weaker spatial differentiation and stronger seasonal dependence across physiographic zones.
3.5. Hybrid Complementarity Index (HCI)
The Hybrid Complementarity Index (HCI) shows clear spatial and seasonal variability across Albania (
Table 3).
Across all observations, HCI values follow a consistent physiographic organisation, with the highest levels observed in coastal areas, intermediate conditions in the western lowlands, and lower levels in mountainous regions. Seasonal differences are evident in both the magnitude and distribution of HCI values. Coastal areas consistently maintain high HCI values across all seasons, with mean levels generally ranging between approximately 0.68 and 0.83 and low variability. In contrast, mountainous regions show lower mean values, particularly during spring (approximately 0.32–0.39) and winter (approximately 0.43–0.47), accompanied by higher variability.
The western lowlands display intermediate HCI values, typically ranging between approximately 0.55 and 0.78, with moderate variability. Differences between zones are also reflected in the proportion of locations exceeding the threshold (HCI > 0.7), which is highest in coastal areas (approximately 50–100%), moderate in the western lowlands (approximately 30–70%), and lowest in mountainous regions (generally below 20%, with seasonal increases during summer). Seasonal variability is further reflected in monthly patterns. Coastal areas remain relatively stable throughout the year, whereas inland regions exhibit stronger variability, with lower values during spring and winter and higher values during summer and early autumn.
Taken together, these findings demonstrate a persistent spatial organisation of HCI across physiographic zones, accompanied by seasonal and monthly variability in complementarity conditions.
4. Discussion
The results demonstrate that wind–solar complementarity in Albania is systematically structured by the interaction between terrain and seasonal atmospheric dynamics, resulting in distinct complementarity regimes across physiographic zones. These findings are consistent with previous studies highlighting the influence of regional climatic variability on renewable energy resources across Europe [
36], while further indicating that, in complex Mediterranean environments, complementarity is strongly modulated by terrain-dependent atmosphere–surface interactions.
A key outcome of this study is the distinction between spatial and temporal complementarity. The Spatial Complementarity Index (SCI) exhibits a clear physiographic gradient, with higher and more stable values in coastal and lowland regions and lower, more heterogeneous patterns in mountainous areas. In contrast, the Temporal Complementarity Index (TCI) shows a more spatially uniform behaviour and is primarily governed by seasonal atmospheric forcing. This divergence indicates that spatial and temporal complementarity are related but distinct processes.
The results further indicate that terrain primarily governs the spatial organisation and stability of complementarity patterns, whereas seasonal atmospheric circulation exerts stronger control over temporal variability. This distinction underscores the importance of integrated spatiotemporal approaches when evaluating hybrid renewable energy systems in heterogeneous environments.
The observed spatial structure can be attributed to the interaction between the marine boundary layer and orographic forcing. In low-elevation regions, maritime influences promote more stable wind regimes, enhancing complementarity with solar energy resources. In contrast, complex terrain introduces turbulence and flow variability, resulting in less consistent complementarity patterns. These effects are likely associated with terrain-induced flow fragmentation and increased atmospheric heterogeneity, which reduce the persistence and synchronisation of renewable resource availability. Conversely, low-elevation coastal environments benefit from smoother circulation regimes and marine boundary-layer modulation, favouring more stable wind–solar interactions. Similar terrain-driven effects have been reported in other complex environments, where local topographic conditions strongly influence wind dynamics and resource stability [
37].
The combined analysis using the Hybrid Complementarity Index (HCI) further highlights the role of terrain and seasonality in shaping hybrid system suitability. Coastal and lowland regions generally exhibit higher and more stable complementarity conditions, whereas mountainous regions show lower and more variable patterns. The coastal zone, however, is represented by a limited number of sampling points due to its narrow spatial extent, which constrains the representation of variability in this region and may reduce the statistical robustness of the results.
From an energy systems perspective, these findings have direct implications for the design and optimisation of hybrid renewable energy systems. Higher and more stable complementarity may contribute with reduced variability in energy supply, facilitating system integration and improving overall reliability, as demonstrated in previous studies on hybrid system performance [
38]. Conversely, regions characterised by greater variability may require more adaptive system configurations to ensure system stability.
Seasonal variability further modulates complementarity patterns across the study area. Higher levels observed during transitional seasons reflect stronger interactions between wind and solar resources, whereas reduced complementarity during summer indicates a partial decoupling between the two energy sources. This behaviour likely reflects the seasonal dominance of solar irradiance combined with reduced dynamical variability in regional wind systems during summer, thereby weakening compensatory interactions between the two resources. Transitional seasons, by contrast, are characterised by more dynamic atmospheric conditions that favour stronger wind–solar balancing effects. These patterns are consistent with Mediterranean atmospheric regimes, where seasonal circulation strongly influences resource availability [
39].
By explicitly linking complementarity patterns to physiographic structure, this study provides a terrain-resolved perspective on renewable resource interactions. This approach extends beyond conventional large-scale assessments and offers a physically consistent framework for evaluating hybrid renewable energy potential in heterogeneous environments.
Improving spatial resolution, particularly in coastal zones, and incorporating higher-resolution datasets would enhance the representation of local variability. In addition, integrating power generation modelling would strengthen the link between resource complementarity and actual energy system performance.
This study is subject to several limitations that should be considered when interpreting the results. First, the analysis relies on the ERA5 reanalysis dataset, which, despite its temporal consistency and global coverage, has a relatively coarse spatial resolution (~0.25°). Although resampling was applied, this resolution may not fully capture fine-scale atmospheric processes, particularly in complex mountainous terrain. However, the objective of this study is not to reproduce local microscale wind processes, but to assess broader regional and physiographic complementarity patterns using a consistent long-term dataset. Therefore, ERA5 is considered suitable for comparative regional assessment, while the physiographic stratification adopted in this study helps preserve broader terrain-related differences across coastal, lowland, and mountainous zones. Second, the spatial sampling framework includes a limited number of coastal observations (n = 2), reflecting the narrow spatial extent of the Albanian coastal strip relative to the applied 10 × 10 km grid. This constraint reduces statistical robustness and may limit the representation of intra-zone variability; therefore, coastal results should be interpreted with caution. Third, the analysis is based on meteorological variables and complementarity indices rather than direct power generation data, meaning that the results reflect resource potential rather than realised electricity output. Accordingly, the proposed indices should be interpreted as indicators of resource interaction potential and comparative suitability rather than direct predictors of realised electricity generation.
Future research should therefore focus on higher-resolution datasets, improved spatial sampling strategies in constrained zones, and the integration of power generation modelling to strengthen the link between resource complementarity and energy system performance.
5. Conclusions
This study develops a terrain-resolved spatiotemporal framework for assessing wind–solar complementarity in complex Mediterranean environments, using Albania as a representative case. The results demonstrate that complementarity patterns are strongly controlled by the interaction between physiographic structure and seasonal atmospheric dynamics, leading to distinct spatial regimes across coastal, lowland, and mountainous regions. Spatial complementarity (SCI) exhibits a persistent physiographic gradient, with higher and more stable values generally observed in coastal and lowland regions and lower, more heterogeneous patterns in mountainous environments. Temporal complementarity (TCI) displays pronounced seasonal variability, with stronger complementarity during autumn and lower values during summer. The integrated HCI analysis further indicates that hybrid suitability is generally more favourable in coastal and lowland regions and more variable in mountainous areas.
Beyond the identification of spatial and seasonal patterns, the findings provide important insights for the planning and optimisation of hybrid renewable energy systems. Regions characterised by high and stable complementarity, particularly in coastal and lowland areas, offer favourable conditions for reducing variability in energy supply and improving system reliability. In contrast, mountainous regions, where complementarity is lower and more variable, may require more flexible system configurations and additional balancing mechanisms. It should be noted that the limited number of sampling points in the coastal zone may affect the robustness of statistical comparisons, and therefore coastal results should be interpreted with appropriate caution.
The integration of spatial and temporal complementarity through a unified framework highlights the importance of coordinated resource utilisation, particularly in systems with increasing shares of variable renewable energy. These results are directly relevant for power system planning in Albania, where the diversification of renewable energy sources and their integration into the existing electricity grid represent key challenges.
From a broader perspective, the proposed approach provides a transferable methodological framework for assessing hybrid renewable energy potential in other heterogeneous regions. An important next step is the integration of complementarity analysis with power system modelling, including grid constraints, storage requirements, and demand profiles, in order to support more robust and operationally relevant energy planning strategies.