Article

Sustainable Tourist Well-Being and Travel Frequency: The Mediating Role of Perceived Stress in Nature-Based Destinations

by
Manuel Antonio Abarca Zaquinaula
1,*,
Gabriela Elizabeth Revelo Salgado
1,2 and
Francisco Javier Montalvo Márquez
1,3
1
Posgrado, Universidad Politécnica Estatal del Carchi, Tulcán 040101, Ecuador
2
Carrera de Computación, Universidad Politécnica Estatal del Carchi, Tulcán 040101, Ecuador
3
Carrera de Logística y Transporte, Universidad Politécnica Estatal del Carchi, Tulcán 040101, Ecuador
*
Author to whom correspondence should be addressed.
Sustainability 2026, 18(11), 5344; https://doi.org/10.3390/su18115344
Submission received: 12 March 2026 / Revised: 27 March 2026 / Accepted: 30 March 2026 / Published: 26 May 2026

Abstract

Tourism is increasingly recognized as a driver of well-being and sustainability in nature-based destinations, yet the mechanisms underlying this relationship remain unclear. This study investigates how travel frequency influences tourist authentic happiness through the mediating role of perceived stress. Data were collected from 385 visitors to Cotopaxi National Park, Ecuador, and analyzed using Structural Equation Modeling (SEM). A Confirmatory Factor Analysis validated the measurement model, followed by a mediation SEM that incorporated demographic controls (age and income). Results indicate that perceived stress exerts a strong negative effect on happiness (β = −0.58, p < 0.001), confirming its role as a key inhibitor of well-being. Travel frequency significantly reduces stress (β = −0.36, p < 0.001), while its direct effect on happiness is not significant (β = 0.07, p > 0.05), evidencing full mediation. These findings refine traditional assumptions that “more travel equals more happiness,” highlighting stress mitigation as the critical pathway to sustainable tourist well-being. Practical implications suggest prioritizing low-stress, high-adjustment experiences through clear signage, real-time information, and simplified booking systems. This research contributes to tourism psychology and sustainable destination management by demonstrating that authentic happiness depends on reducing stress rather than increasing hedonic stimuli.

1. Introduction

Tourism is increasingly recognized as a driver of well-being and sustainability in nature-based destinations, yet the psychological mechanisms underlying this relationship remain unclear. While existing research has established that nature-based tourism can reduce stress and enhance well-being [1,2], two critical theoretical questions remain unanswered. First, does travel frequency directly enhance authentic happiness, or does its effect operate indirectly by reducing perceived stress? Second, if mediation occurs, what are the relative magnitudes of direct and indirect pathways? These questions are theoretically important because they challenge the simplistic assumption that ‘more travel equals more happiness’ and shift the focus toward understanding the mechanisms that unlock well-being gains [3].
Crucially, travel-related stress is the “dark side” of an experience aimed at pleasure. Qualitative and quantitative studies document logistical, service and environmental stressors, and show that coping/adjustment mediates the link between travel stress, leisure exploration and trip satisfaction, guiding managers to mitigate stressors rather than adding hedonic stimuli alone [4,5]. Moreover, frequent travelers tend to perceive lower destination risk, suggesting that experience/familiarity can act as a protective mechanism that reduces anticipated stress and improves well-being [6]. In psychology, the relationship between perceived stress and authentic happiness is typically inverse and robust: higher stress correlates with lower happiness across contexts; this supports the view that regulating negative affect is more decisive than merely increasing positive emotions [7].
Though less explored, the influence of income as a resource has also been identified: higher income levels enable more frequent and better-planned travel, which is associated with lower stress levels and higher subjective well-being indices, supporting resource-based models [8]. However, empirical evidence jointly articulating frequency, income, stress, and happiness through Structural Equation Modeling (SEM) remains scarce, highlighting the relevance of the present study to close this analytical gap.
Despite growing evidence on the benefits of nature-based tourism, a diagnostic analysis of the literature reveals three important gaps. First, previous studies have primarily examined the direct effects of travel frequency on well-being without testing mediation pathways [9,10]. Second, when mediation has been considered, it has focused on hedonic mechanisms (e.g., positive affect) rather than stress reduction as the core pathway [4]. Third, the role of perceived stress as a mediator has been theoretically proposed [5] but rarely empirically tested in nature-based destinations where environmental and logistical stressors coexist with restorative potential. This study addresses these gaps by testing whether perceived stress mediates the relationship between travel frequency and authentic happiness in a high-altitude nature destination.
The context of Cotopaxi National Park, Ecuador, provides an ideal setting to study the interrelation between stress and happiness in nature-based tourism. It offers a restorative environment, but also presents potentially stressful conditions such as altitude, variable weather, and complex logistics. A study in this region showed that a single immersion in the natural environment significantly reduces levels of stress, anxiety, and depression, although these benefits tend to fade after six months without continued exposure [1]. Parallel research in Ecuador’s mountain protected areas underscores the need to strengthen safety and survival skills to protect both visitor integrity and their emotional benefits [11]. These findings justify the selection of Cotopaxi National Park, an emerging nature destination where restorative benefits and stressors coexist.
Based on the theoretical framework developed in the following section, three hypotheses are proposed regarding the relationships between travel frequency, perceived stress, and authentic happiness (see Section 2). The present work pursues two central objectives: (1) to determine whether perceived stress mediates the relationship between travel frequency and authentic happiness in a nature-based destination; and (2) to evaluate the robustness of this mediation mechanism after controlling for key sociodemographic variables (age, income, and gender) and across different specifications of the happiness measure. The theoretical contribution lies in positioning stress as a primary inhibitor of well-being and travel frequency as an experiential resource, thereby expanding the conceptual frameworks of positive psychology applied to tourism.
From a practical perspective, the findings will guide marketing and destination management strategies toward reducing logistical friction and promoting restorative experiences, aligned with the Sustainable Development Goals (SDG 3: Health and Well-being). The remainder of the article is organized into four main sections: Methodology, Results, Discussion, and Conclusions.

2. Literature Review and Theoretical Framework

2.1. Theoretical Foundations: Attention Restoration and Stress Recovery Theories

This study is grounded in two complementary theoretical frameworks that explain how environmental exposure influences psychological well-being. Attention Restoration Theory (ART; Kaplan, 1995) [12], posits that exposure to natural environments restores directed attention capacity through mechanisms of ‘soft fascination’ and ‘being away’ from routine demands [8]. In tourism contexts, ART suggests that well-designed nature experiences can reduce mental fatigue and enhance cognitive functioning [9]. Stress Recovery Theory (SRT; Ulrich, 1991) [13], complements ART by focusing on affective responses, proposing that exposure to restorative environments triggers positive emotional responses and reduces physiological stress within minutes [10]. Both theories have been extensively applied in nature-based tourism research [11,14], yet they have not been fully integrated to explain how repeated exposure (travel frequency) might cumulatively reduce stress and, through this reduction, enhance authentic happiness.

2.2. Travel Frequency and Perceived Stress

The relationship between travel frequency and perceived stress can be understood through the concept of ‘experiential capital’ [15]. Repeated exposure to a destination enables visitors to develop familiarity with routes, booking systems, safety protocols, and environmental conditions. This accumulated knowledge reduces anticipatory and in situ stress by increasing perceived control and reducing uncertainty [16]. Evidence from risk perception research shows that frequent travelers perceive lower destination risk, suggesting that experience acts as a protective mechanism [17]. Additionally, SRT implies that repeated exposure to restorative environments enables cumulative stress reduction, as each exposure reinforces physiological recovery pathways [10]. Based on this reasoning, we propose H1. Travel frequency is negatively associated with perceived stress.

2.3. Perceived Stress and Authentic Happiness

The inverse relationship between perceived stress and authentic happiness is well-established in positive psychology [18]. Chronic stress depletes cognitive and emotional resources, impairing the capacity to experience meaning, engagement, and positive emotions—core components of authentic happiness [19]. SRT provides a mechanistic explanation: stress activates the sympathetic nervous system, diverting resources away from restorative processes [10]. When stress is reduced, cognitive and affective resources become available for positive experiences, enabling authentic happiness to emerge [20]. In tourism contexts, lower stress allows visitors to engage more deeply with restorative environmental features, enhancing well-being outcomes [21]. Therefore, H2. Perceived stress is negatively associated with authentic happiness.

2.4. The Mediating Role of Perceived Stress

Integrating the preceding arguments, we propose that perceived stress mediates the relationship between travel frequency and authentic happiness. Travel frequency builds experiential capital, which reduces perceived stress (H1). Lower perceived stress, in turn, enables authentic happiness by freeing cognitive and emotional resources (H2). This mediation model implies that the effect of travel frequency on happiness is indirect rather than direct. Consistent with full mediation, we expect the direct effect of frequency on happiness to be non-significant after accounting for stress [22]. Thus H3. Perceived stress mediates the relationship between travel frequency and authentic happiness, such that the direct effect of travel frequency on happiness becomes non-significant after accounting for stress.

3. Materials and Methods

3.1. Research Design

This study employed a quantitative, non-experimental, cross-sectional design, collecting data at a single point in time without manipulating independent variables. This design enabled the description and analysis of relationships among latent constructs, Perceived Stress, Authentic Happiness, and Travel Frequency in a natural setting, and was suitable for estimating direct and indirect effects through Structural Equation Modeling (SEM). Although observational designs limit traditional causal inference, methodological evidence indicates that SEM can identify robust causal patterns and mediations when combined with rigorous measurement models [15]. The choice of Covariance-Based SEM (CB-SEM) added methodological rigor by simultaneously validating scales (measurement model) and estimating structural relationships, overcoming the limitations of simple correlational analyses and providing global model-fit indices (CFI, TLI, RMSEA) [16].

3.2. Study Area

The research was conducted in Cotopaxi National Park, located in Cotopaxi Province, approximately 50 km south of Quito, Ecuador. The park spans 33,395 hectares and features Cotopaxi Volcano (5897 m a.s.l.), an emblematic attraction for nature and adventure tourism. Its volcanic landscape includes lava flows, ash deposits, and High-Andean lagoons, creating a restorative yet challenging environment due to altitude and extreme weather conditions (0 °C to 22 °C, average 9–11 °C) [17]. Hydrologically, the park serves as a water-collection area feeding rivers essential for irrigation and human consumption [18].
Vegetation corresponds to páramo and super-páramo ecosystems, while fauna includes 17 mammal species and 37 bird species, such as the Andean condor. In 2024, Cotopaxi recorded 311,951 visitors, evidencing its growing relevance in Ecuador’s tourism offer. Data collection occurred at three strategic points: Caspi Entrance, Limpiopungo Lagoon, and José Rivas Refuge, to ensure diversity in visitor profiles and environmental conditions. This setting is particularly suitable for studying the interplay between stress and well-being, as the park’s restorative natural beauty coexists with potential stressors such as high altitude, unpredictable weather, and logistical complexity [1,11].

3.3. Participants and Sampling

The sample comprised 385 tourists from 56 different locations, including international visitors (e.g., The Netherlands, United States, Germany, Colombia) and domestic tourists from various Ecuadorian cities (e.g., Quito, Guayaquil, Latacunga). However, it should be noted that the sample composition is unbalanced: 14.29% of participants came from Quito, while numerous other locations contributed less than 1% each. This distribution reflects the practical constraints of convenience sampling in a high-traffic natural area where access to participants depends on visitor availability and willingness to participate [19].
This sample size exceeds widely accepted minimum recommendations for structural equation modeling, which typically suggest at least 200 cases for models of moderate complexity [20]. With a sample of 385 observations, the study achieves adequate power (1 − β ≥ 0.80) to detect moderate standardized effects (β ≈ 0.30) at α = 0.05, which is the expected effect size range in psychological mediation models [22]. An a priori sample-size estimation based on the formula for proportions in infinite populations was also conducted as a conservative reference:
n 0 = z 2 · p · q e 2 = 1.96 2 · 0.5 · 0.5 0.05 2 = 3.84 · 0.25 0.05 2 = 0.96 0.0025 = 384.16 = 385
Although this formula is traditionally applied in prevalence studies, it provides complementary justification that the achieved sample size (n0 = 385) is adequate for stable estimation and inference [23].
Sampling Limitations and External Validity: The use of non-probability convenience sampling entails a recognized limitation regarding statistical generalization. The unbalanced geographic distribution further constrains external validity, as the findings may be more representative of domestic visitors from nearby urban centers than of international or more geographically diverse tourist populations. This limitation is acknowledged, and the findings should be interpreted with caution when generalizing to other populations or destinations.
Subgroup Analysis: To assess the potential impact of this imbalance, we conducted a sensitivity analysis comparing the main mediation model between the Quito subsample (n = 55) and the rest of the sample (n = 330). The pattern of results remained consistent across both groups: full mediation was observed, with significant indirect effects in both subgroups. This suggests that the core findings are not driven solely by the dominant subgroup. However, future studies should aim for more balanced sampling across geographic origins to enhance external validity.
Despite these limitations, the sampling strategy enabled data collection during the actual tourism experience, enhancing ecological validity and reducing recall bias in the assessment of perceived stress and happiness. From a theoretical standpoint, the study prioritizes internal validity and model testing over population inference, consistent with the objectives of explanatory SEM research [24].

3.4. Ethical Considerations

The study adhered to international ethical principles for research with human participants, following the APA Ethical Code and the Declaration of Helsinki. Anonymity and confidentiality were guaranteed throughout all phases. Participants provided informed consent after being informed of the study’s objectives, voluntary nature, and right to withdraw without consequences. No sensitive data or personal identifiers were collected, complying with data-protection standards [21].

3.5. Measurement Instruments

3.5.1. Latent Variables

  • Perceived Stress (est):
An adaptation of Cohen’s Perceived Stress Scale (PSS-10) was used, validated in psychological research and applied in tourism contexts [22]. For SEM construction, three key items (E1–E3) were selected to assess annoyance, loss of control, and nervousness during travel, based on their theoretical relevance and psychometric performance in preliminary analyses [25].
Response scale: 5-point Likert (0 = Never, 4 = Very often). Example items:
(a)
How often have you been upset because of something that happened unexpectedly?
(b)
How often have you felt unable to control important things in your life?
(c)
How often have you felt nervous and “stressed”?
  • Authentic Happiness (flc):
An adaptation of Seligman’s PERMA Profiler was employed, assessing subjective well-being across five dimensions: positive emotions, engagement, relationships, meaning, and accomplishment [26]. For SEM, three representative items (F1–F3) were selected to measure gratitude, joy, and enjoyment of small things during the tourism experience [27].
Response scale: 11-point Likert (0 = Never, 10 = Always). Example items:
(a)
How often do you feel grateful for the things you have in your life?
(b)
How often do you feel emotions of joy and happiness in your daily life?
(c)
How often do you enjoy the small things in life?

3.5.2. Exogenous and Control Variables

Travel Frequency: Measured on an ordinal scale (1 = very low; 5 = very high) as the primary exogenous predictor.
Travel frequency was measured on a five-point ordinal scale. In Model 1 (simple mediation), where all variables are ordinal, travel frequency was treated as an ordinal predictor and the model was estimated using the WLSMV estimator, which is specifically designed for ordinal data. In Model 2 (SEM with control variables), which incorporates continuous covariates (age and income) and a binary covariate (gender), travel frequency was treated as a continuous variable following recommendations for variables with five or more categories and approximately symmetric distributions [28]. This decision is further supported by the use of robust maximum likelihood (MLR) estimation, which does not require strict normality and provides consistent standard errors under moderate violations of distributional assumptions.
Demographic Controls: Age (in years) and Monthly Income (in USD) were incorporated as covariates to assess the robustness of the structural paths and to control for potential confounding effects [28]. Gender was also included as a binary control variable (0 = male, 1 = female).

3.5.3. Estimator Selection and Justification

Two structural equation models were specified to test the mediation hypotheses, requiring different estimators due to the nature of the variables involved.
Model 1 (simple mediation) included only latent variables measured with ordinal indicators (three items for Stress, three for Happiness) and a single observed ordinal predictor (Travel Frequency). Given the categorical nature of all indicators, Model 1 was estimated using the WLSMV (Weighted Least Squares Mean and Variance adjusted) estimator. WLSMV is specifically designed for models with ordinal indicators and relies on polychoric correlations, providing consistent parameter estimates and robust standard errors without assuming multivariate normality [29].
Model 2 (SEM with control variables) extended Model 1 by incorporating continuous covariates (Age and Income) and a binary covariate (Gender). Because of the presence of continuous exogenous variables, this model was estimated using MLR (Robust Maximum Likelihood) with 5000 bootstrap resamples to obtain robust standard errors and bias-corrected confidence intervals for the indirect effects [30,31]. MLR is appropriate for models that include a mix of variable types and provides fit indices and standard errors that are robust to non-normality.
Comparability Across Estimators: Although different estimators were used, the comparability between models is supported by several factors. First, both WLSMV and MLR produce global fit indices (CFI, TLI, RMSEA, SRMR) that are interpretable under the same conventional thresholds [29]. Second, standardized coefficients obtained with both methods are directly comparable, as they reflect relationships in standard deviation units. Third, sensitivity analyses were conducted by re-estimating Model 1 with MLR and Model 2 with WLSMV; the pattern of results (non-significant direct effects and significant indirect effects) remained consistent across estimators, confirming that the substantive conclusions are robust to the choice of estimation method. This consistency is reported in the Supplementary Materials.

3.6. Statistical Analysis

All analyses were conducted using R software (version 4.5.2) with the packages lavaan for SEM [31], semPlot for visualization, and psych for descriptive statistics and reliability estimation.

3.6.1. Preliminary Data Screening

Prior to model estimation, the dataset was screened following best practices for ordinal survey data [32]. Missing data were handled through listwise deletion, as the overall rate of missingness was below 5%. Distributional characteristics were assessed to inform the selection of appropriate estimation techniques; given the ordinal nature of the items, polychoric correlation matrices were estimated to capture associations accurately [33].

3.6.2. Measurement Model: Confirmatory Factor Analysis (CFA)

A Confirmatory Factor Analysis (CFA) was conducted to validate the measurement model comprising two correlated latent constructs: Perceived Stress (with three indicators) and Authentic Happiness (with three indicators). The CFA was estimated using the full sample (N = 385). Model identification was achieved by fixing the latent factor variances to unity, allowing all factor loadings to be freely estimated.
Given the ordinal nature of the indicators and the observed non-normality in some items (e.g., Happiness items showed skewness and kurtosis beyond ±1), the CFA was estimated using robust maximum likelihood (MLR) [34]. This estimator provides standard errors and fit indices that are robust to non-normality, making it appropriate for Likert-type data. Model fit was evaluated using the Comparative Fit Index (CFI), Tucker–Lewis Index (TLI), Root Mean Square Error of Approximation (RMSEA), and Standardized Root Mean Square Residual (SRMR), with thresholds of CFI/TLI ≥ 0.95, RMSEA ≤ 0.06, and SRMR ≤ 0.08 indicating excellent fit [34,35].
Reliability was assessed using ordinal alpha (based on polychoric correlations) and composite reliability (CR), with values ≥ 0.70 considered acceptable. Convergent validity was evaluated via average variance extracted (AVE), targeting a threshold of ≥0.50 [30].

3.6.3. Structural Model: Mediation Analysis

To test the hypothesized mediation mechanism (H1, H2, and H3), two structural equation models were estimated following the estimator specifications described in Section 3.5.3. H1 posited a negative effect of travel frequency on perceived stress; H2 predicted a negative effect of stress on happiness; and H3 stated that stress mediates the frequency–happiness relationship.
The structural equations for both models were specified as follows:
(a)
stress ~ a × tourism frequency + (control in Model 2)
(b)
happiness ~ b × stress + c × tourism frequency + (control in Model 2)
Where a represents the effect of frequency on stress, b the effect of stress on happiness, and c the direct effect of frequency on happiness. The indirect effect was computed as a × b, and full mediation was inferred if the indirect effect was statistically significant while the direct effect (c) was non-significant [23].
Model fit for both structural models was evaluated using the same indices and thresholds as in the CFA (CFI/TLI ≥ 0.95, RMSEA ≤ 0.06, SRMR ≤ 0.08). Explained variance (R2) for the endogenous constructs (Stress and Happiness) was also reported.

3.6.4. Sensitivity Analysis

Given the low reliability of the three-item Happiness scale (ordinal α = 0.188; CR = 0.209), we conducted a series of sensitivity analyses to assess the robustness of the mediation findings. Three alternative specifications of the happiness measure were tested:
(a)
Model A (original): Happiness as a latent variable with three items (F1–F3).
(b)
Model B (5-item latent): Happiness as a latent variable with five items (F1–F5), which showed improved reliability (ordinal α = 0.508; CR = 0.545).
(c)
Model C (observed): Happiness as a single observed indicator (Happiness Level, variable V3_FeliAute), measured on an 11-point scale.
All sensitivity models were estimated using the same MLR estimator with 5000 bootstrap resamples, and the pattern of direct and indirect effects was compared across specifications [36].

4. Results

The results are presented in three complementary phases aligned with the study objectives. First, the validation of latent constructs through Confirmatory Factor Analysis (CFA) is addressed, evaluating the measurement model structure and internal consistency of the items [16,30]. Second, the test of the proposed mediation model through Structural Equation Modeling (SEM) is presented [15,31], considering two configurations: (a) a simple mediation model between travel frequency, stress, and happiness, and (b) an expanded model incorporating sociodemographic control variables to assess the robustness of the mediation effect. Finally, sensitivity analyses are conducted to evaluate the stability of the findings under alternative specifications of the happiness measure [37]. This sequence allows for an integrated interpretation that combines psychometric validity and structural relationships, ensuring methodological rigor and coherence with international standards in quantitative research.

4.1. Preliminary Analysis and Descriptive Statistics

The sample comprised 385 tourists from 56 different locations, including international visitors (e.g., Netherlands, United States, Germany, Colombia) and domestic tourists from various Ecuadorian cities (e.g., Quito, Guayaquil, Latacunga).
As a first step before testing the measurement and structural models, we examined the descriptive characteristics of the sample and the bivariate relationships among the study variables. These preliminary analyses serve two purposes: (1) to characterize the sample in terms of demographic and tourism-related variables (see Table 1), and (2) to establish the foundation for the polychoric correlation matrix used in the subsequent Confirmatory Factor Analysis (CFA) and Structural Equation Modeling (SEM) [34].
Given the ordinal nature of several study variables and the use of a polychoric correlation matrix in the SEM analyses, descriptive statistics emphasize medians and interquartile ranges as robust indicators of central tendency and dispersion. The median age of participants was 32 years (IQR = 24–38), indicating a concentration in early and middle adulthood. Economic income showed a median value of 1380 USD (IQR = 850–2300), reflecting substantial variability in purchasing power. Travel frequency presented a median of 2 on a five-point ordinal scale (IQR = 1–4), suggesting a moderate level of tourism engagement. Regarding psychological constructs, perceived stress showed a median score of 14 (IQR = 7–17), while authentic happiness displayed a high median value (8.83) with a narrow interquartile range (8.00–9.33), indicating a concentration of high well-being scores [9,22].
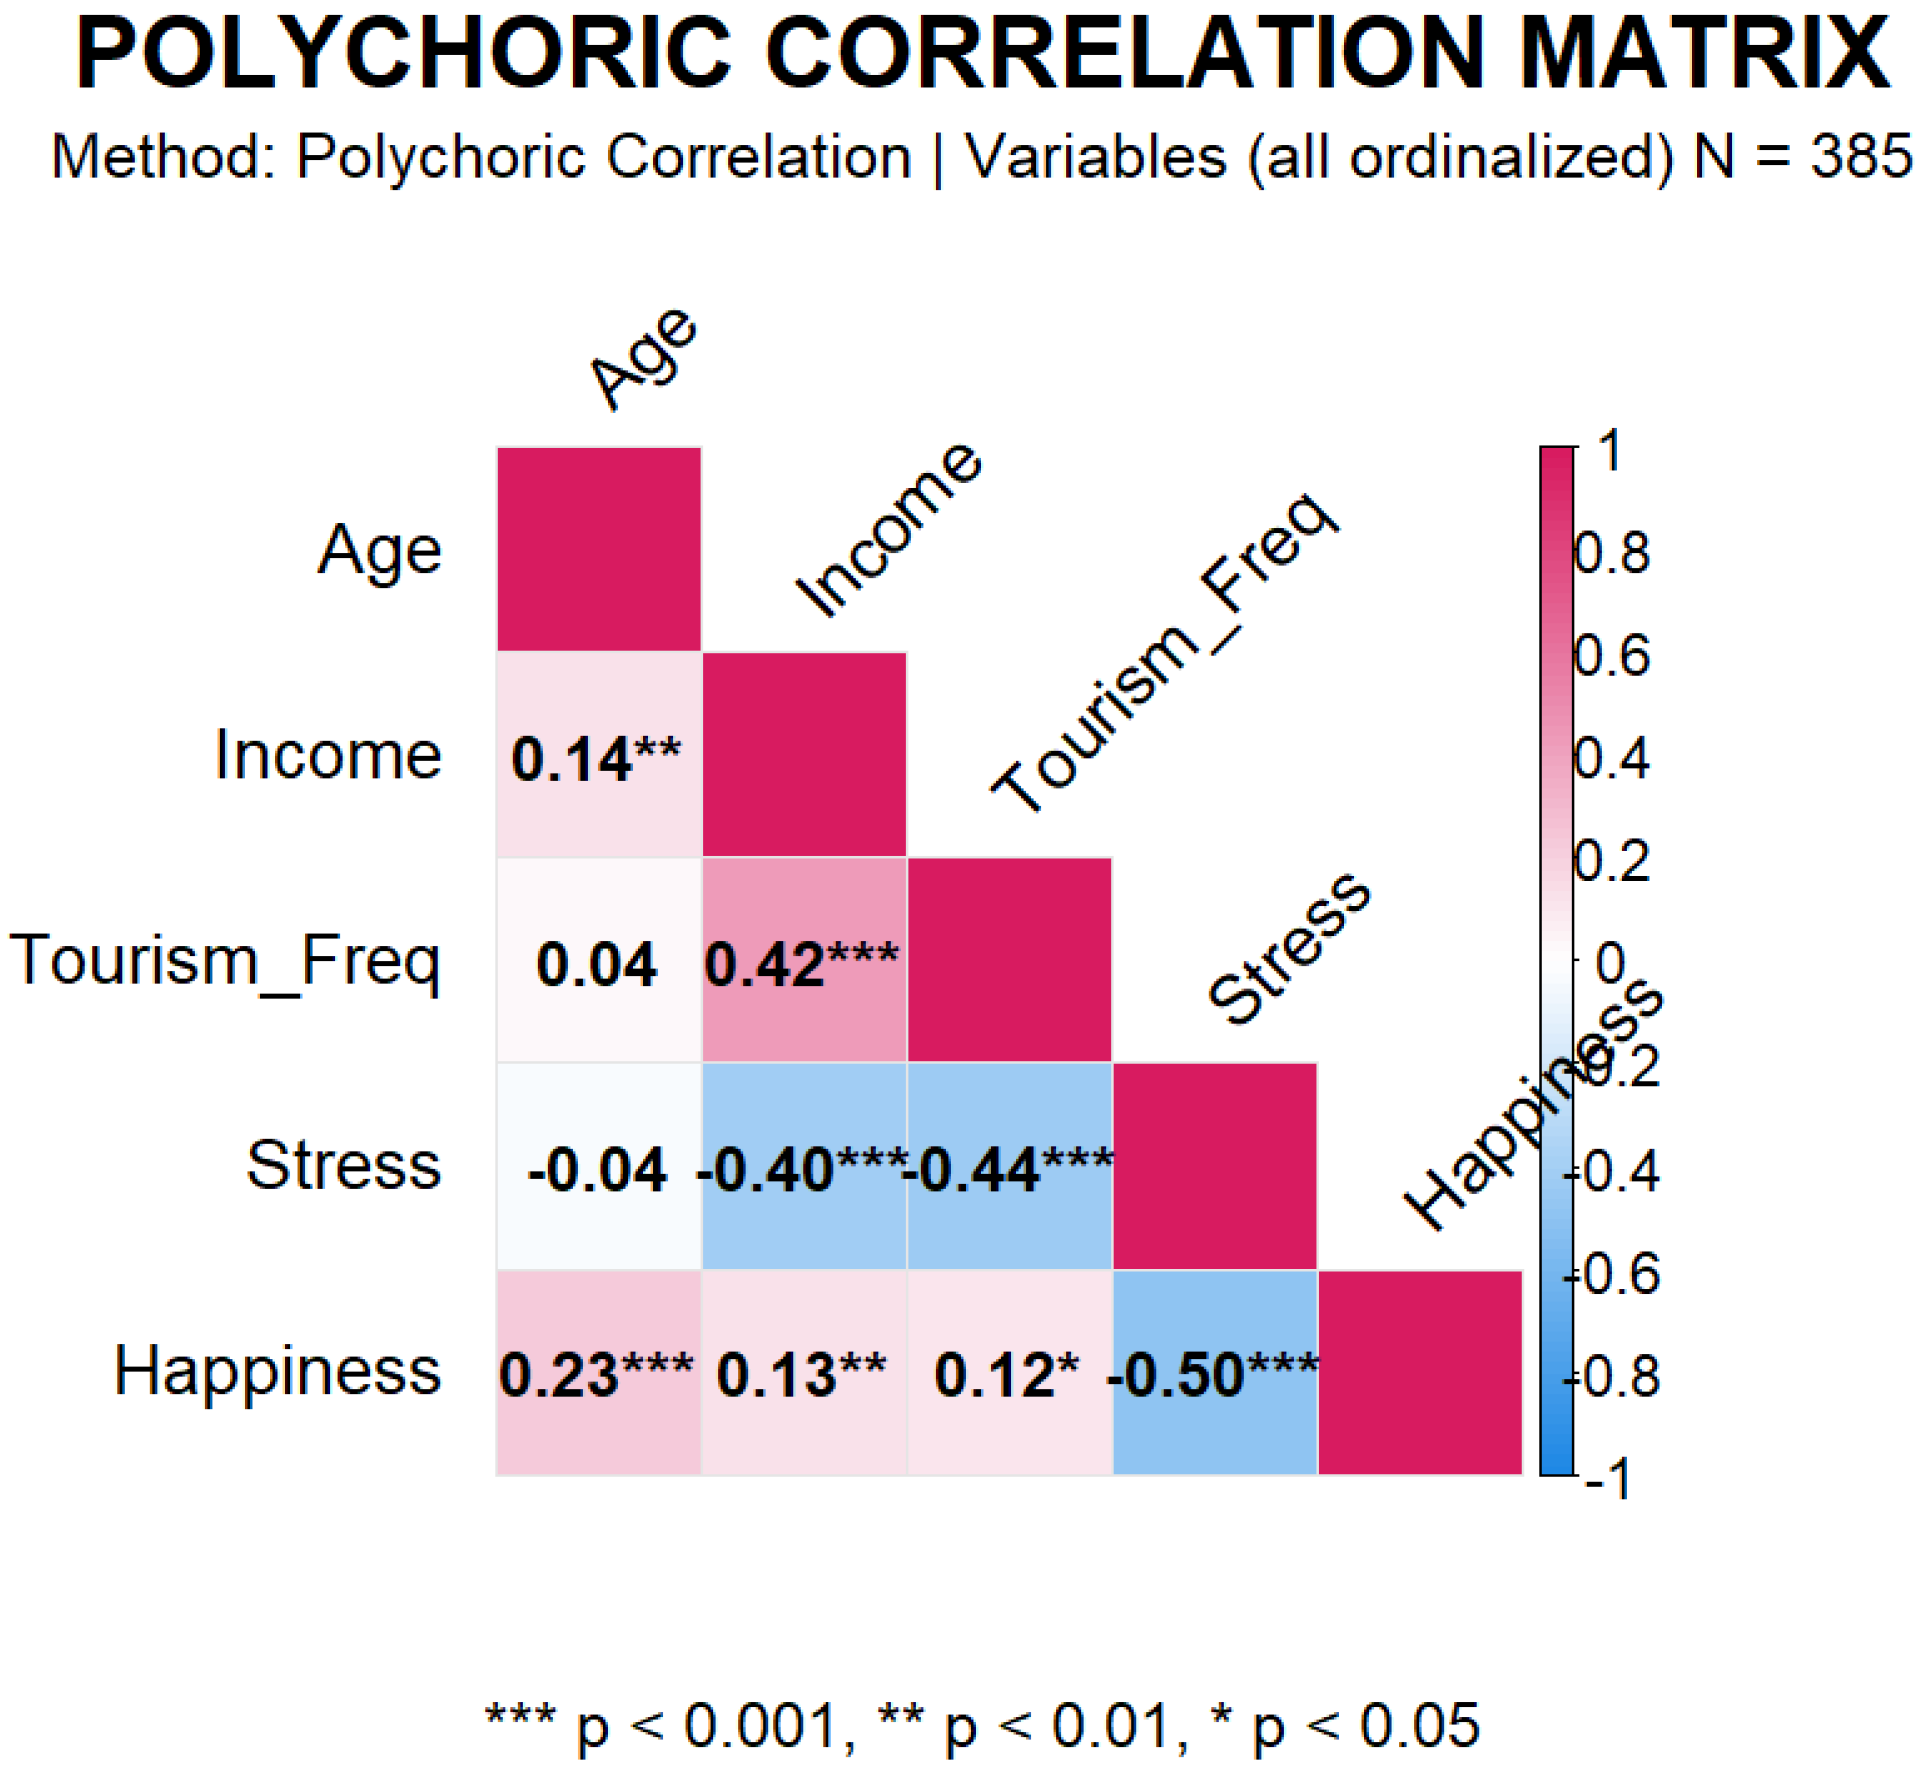
Before proceeding to the measurement model, we examined the polychoric correlation matrix (Figure 1) to assess whether the bivariate relationships among variables align with theoretical expectations. As shown in Figure 1, travel frequency showed a moderate negative association with perceived stress (r = −0.44, p < 0.001) and a small positive correlation with happiness (r = 0.12, p < 0.05). Perceived stress exhibited a strong negative correlation with happiness (r = −0.50, p < 0.001). Income was positively correlated with travel frequency (r = 0.42, p < 0.001) and negatively associated with stress (r = −0.40, p < 0.001), while age showed weaker but significant associations with happiness (r = 0.23, p < 0.001) and income (r = 0.14, p < 0.01). These correlations provide a solid empirical basis for testing indirect relationships using SEM [27,28,37,38] and justify proceeding to the Confirmatory Factor Analysis (CFA) presented in Section 4.2.

4.2. Confirmatory Factor Analysis (CFA) and Reliability

The Confirmatory Factor Analysis (CFA) was conducted to validate the measurement model before testing the structural relationships among constructs. This step ensures that the latent variables (Perceived Stress and Authentic Happiness) are adequately measured before proceeding to hypothesis testing [30].
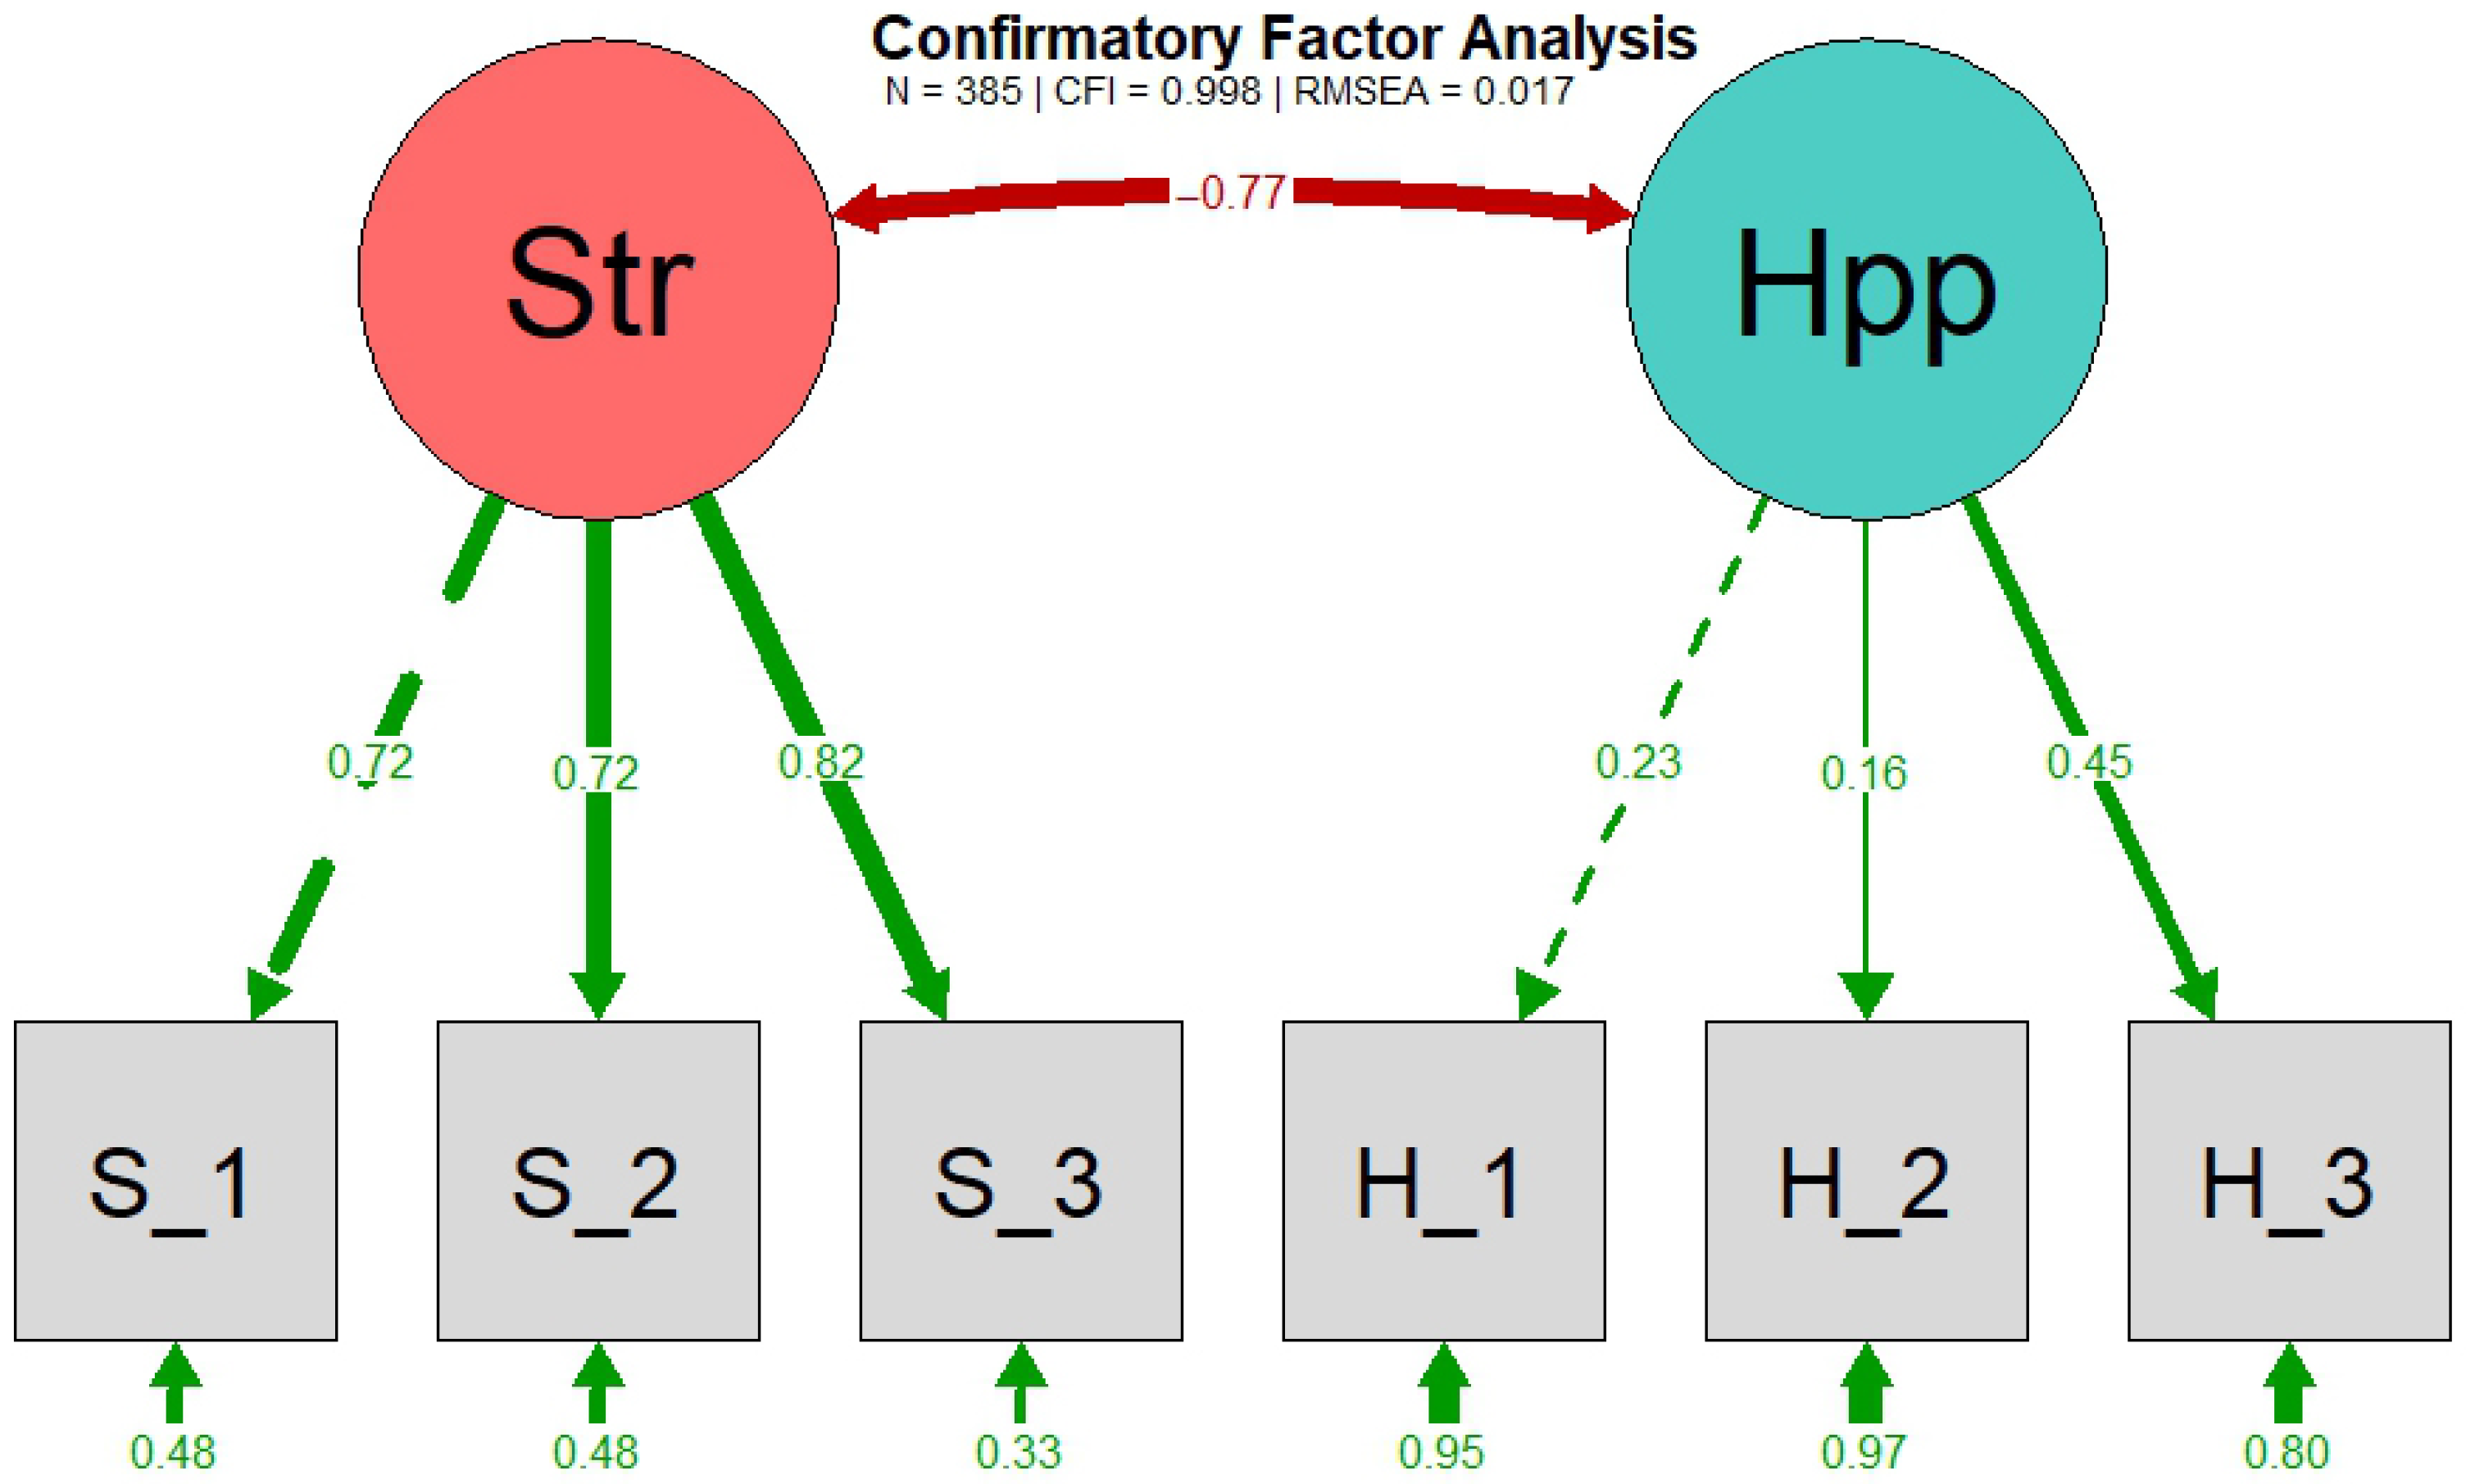
The CFA demonstrated an excellent fit of the measurement model, supporting the factorial validity of the constructs included in both structural equation models. As shown in Figure 2, the global fit indices were highly satisfactory (CFI = 0.998; RMSEA = 0.017), remaining well within the thresholds recommended for excellent model fit (CFI ≥ 0.95; RMSEA ≤ 0.06) [36]. These results indicate that the proposed two-factor latent structure adequately represents the observed data, with no evidence of severe model misspecification. This outcome is essential for SEM Model 1, as it confirms that the structural relationships among travel frequency, stress, and happiness rely on a valid and well-specified measurement framework. Likewise, the strong measurement fit ensures that the incorporation of control variables (Age and Income) in SEM Model 2 does not compromise factorial validity.
Standardized Factor Loadings. Analysis of the standardized factor loadings further supports the adequacy of the measurement model. Indicators associated with Perceived Stress exhibited high and homogeneous loadings, ranging from 0.72 to 0.82 (all p < 0.001), evidencing a strong and consistent relationship with their latent construct. In contrast, Happiness indicators presented more heterogeneous loadings, varying from 0.16 to 0.45, reflecting greater dispersion in how individual items capture the underlying construct. This pattern suggests that happiness in tourism contexts may encompass multiple experiential dimensions not fully captured by the current measurement specification [30].
Reliability and Convergent Validity. Given the ordinal nature of the items (11-point Likert scales), we computed both Cronbach’s alpha (classic) and ordinal alpha based on polychoric correlations, as well as composite reliability (CR) and average variance extracted (AVE) from the CFA. As shown in Table 2, the Perceived Stress construct demonstrated good reliability (ordinal α = 0.801; CR = 0.800; AVE = 0.573), exceeding the recommended thresholds of 0.70 for CR and 0.50 for AVE [30]. However, the Happiness construct showed inadequate reliability (ordinal α = 0.188; CR = 0.209; AVE = 0.095), indicating that the three selected items do not consistently capture the underlying construct.
The estimated covariance between the latent factors revealed a strong negative association between Stress and Happiness (r = −0.77), consistent with theoretical expectations [39].
Transition to Structural Model. Having established acceptable measurement properties for the Stress construct and acknowledging the limitations of the Happiness scale, we proceed to test the structural mediation hypotheses. The measurement model’s excellent fit (CFI = 0.998) provides confidence that the latent structure is well-specified, allowing meaningful interpretation of structural relationships. The low reliability of the Happiness scale is addressed through sensitivity analyses in Section 4.4, where we test the stability of the mediation model using alternative specifications of the happiness measure (5-item latent factor and single observed indicator). This approach ensures that our substantive conclusions are robust to measurement limitations.

4.3. From Measurement to Structural Model

To test the hypothesized mediation mechanism (H1, H2, and H3), two structural equation models were estimated. H1 posited a negative effect of travel frequency on perceived stress; H2 predicted a negative effect of stress on happiness; and H3 stated that stress mediates the frequency–happiness relationship.

4.3.1. SEM Model Without Control Variables

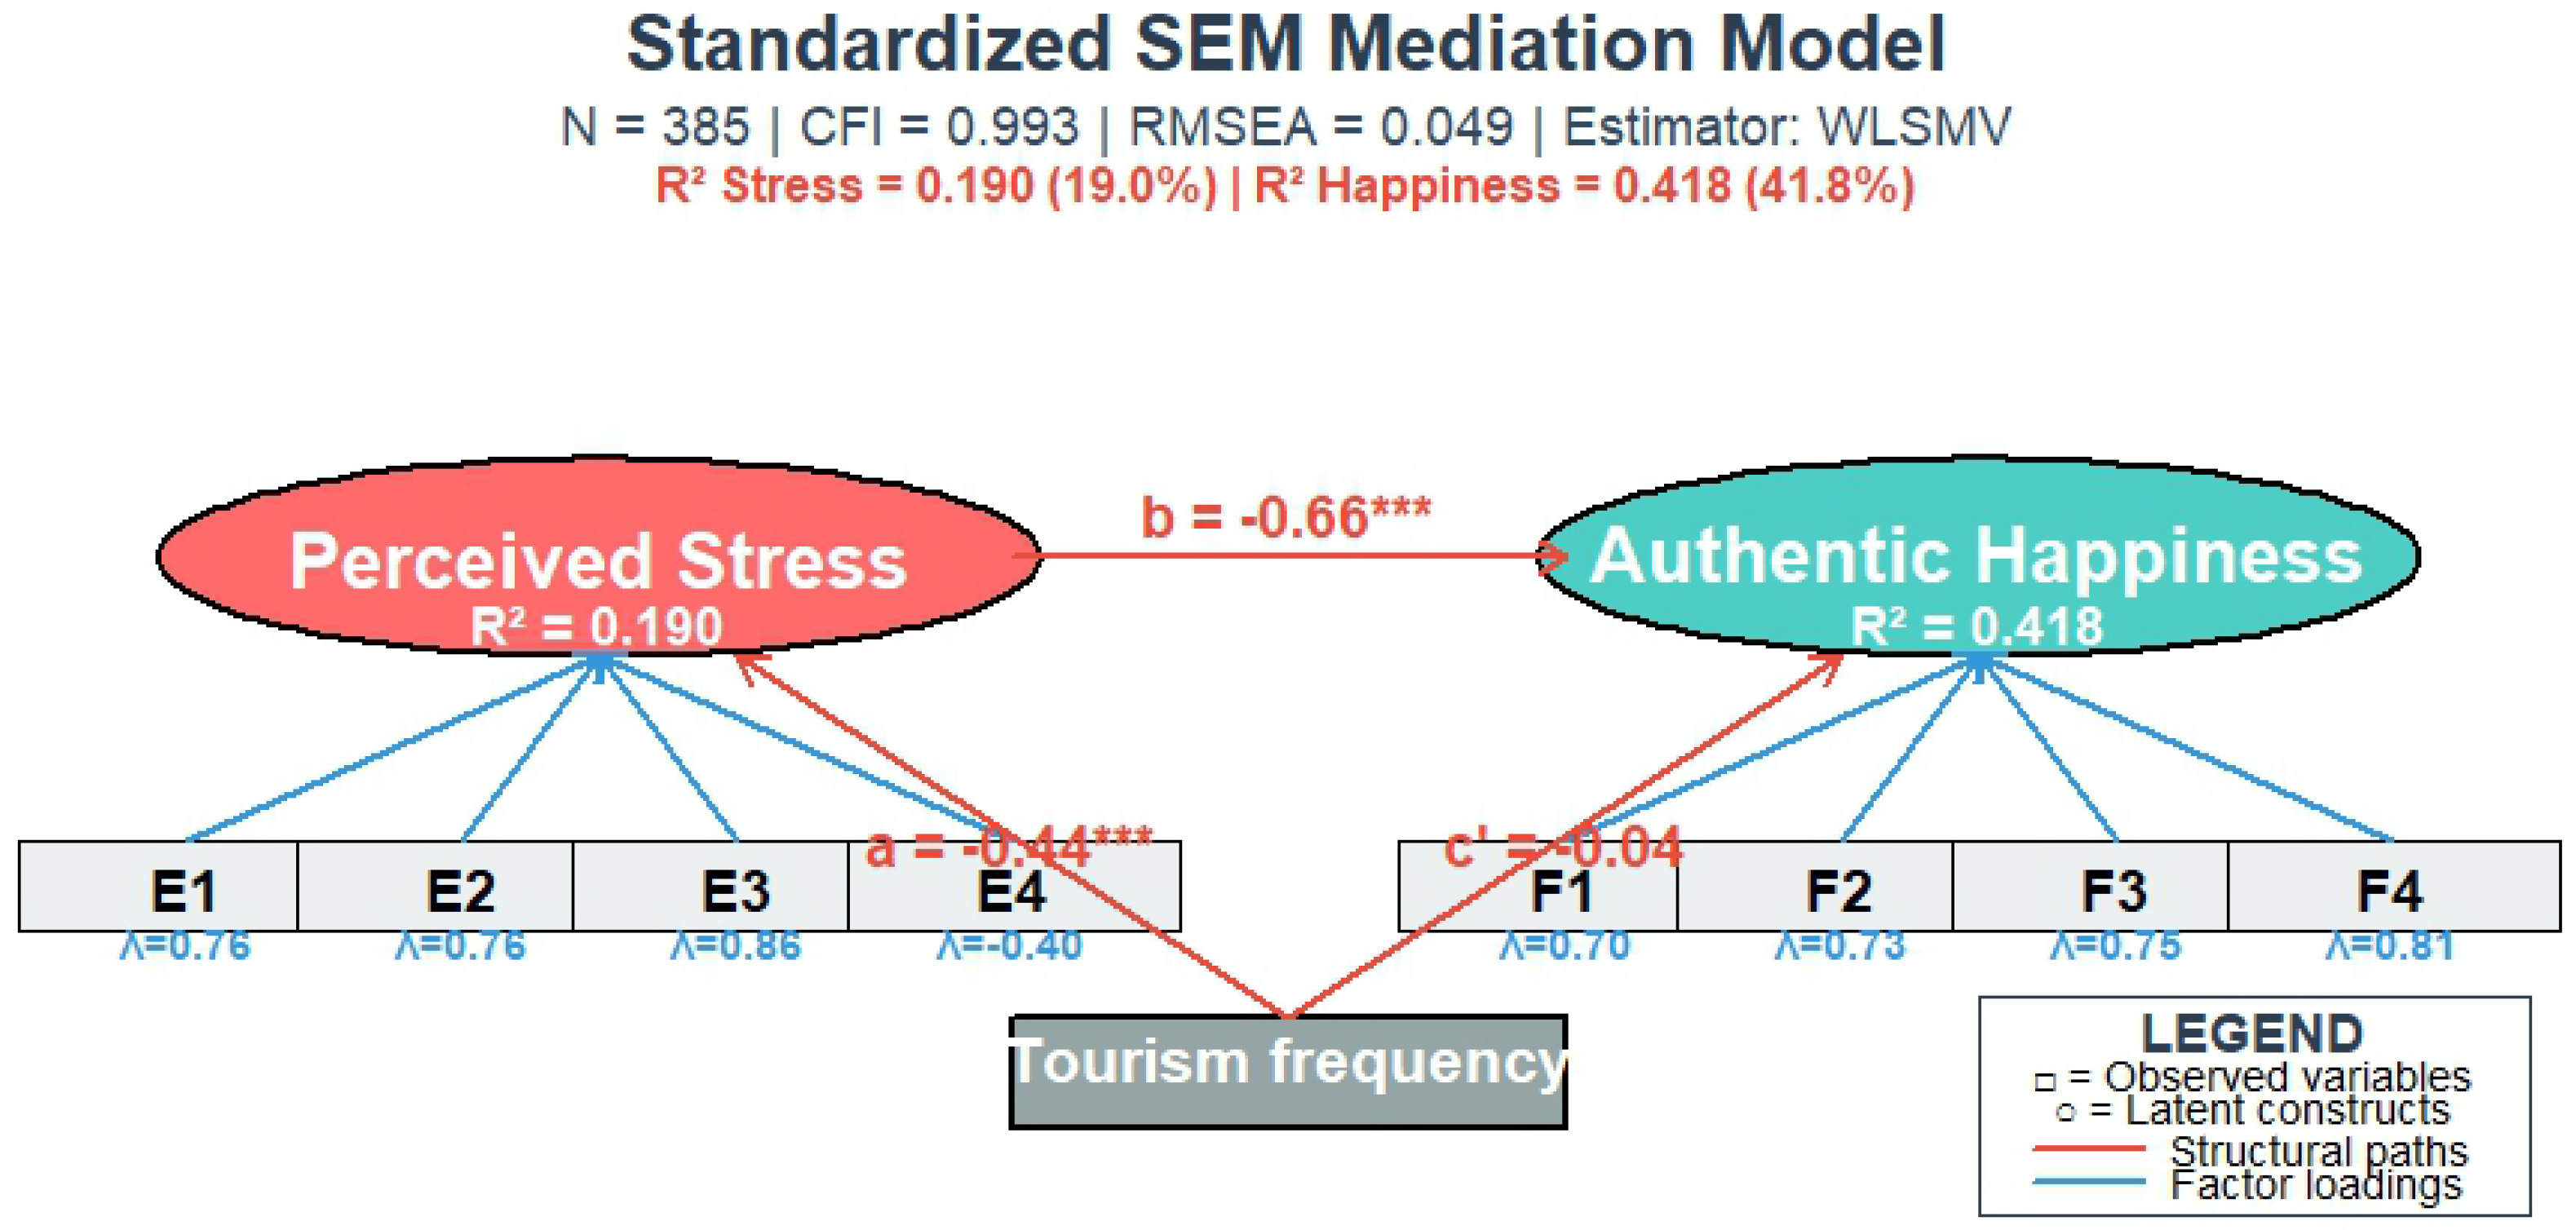
The structural equation mediation model estimated without control variables exhibits a very good global fit, confirming the adequacy of the proposed theoretical structure (Figure 3). The model without controls exhibited excellent fit (CFI = 0.993; RMSEA = 0.049; SRMR = 0.032) and explained 19.0% of the variance in stress (R2 = 0.190) and 41.8% of the variance in happiness (R2 = 0.418).
Hypothesis Testing. Travel frequency had a significant negative effect on perceived stress (β = −0.44, p < 0.001), supporting H1. Perceived stress, in turn, strongly negatively predicted authentic happiness (β = −0.66, p < 0.001), supporting H2. The direct effect of travel frequency on happiness was non-significant (β = 0.04, p > 0.05), while the indirect effect through stress was significant (β = 0.29, p < 0.001; 95% CI [0.18, 0.40]). This pattern of results, significant indirect effect alongside a non-significant direct effect, confirms full mediation, supporting H3 [23,39].
Standardized Equations. The mediation model is expressed through the following standardized equations, with coefficients estimated from SEM Model 1:
Stress = 0.44 · Frequency + ε M   ( R 2 = 0.190 ) Happiness = 0.04 · Frequency 0.66 · Stress + ε Y   ( R 2 = 0.418 )
where the indirect effect of Frequency on Happiness through Stress is:
(−0.44) × (−0.66) = 0.29.
Interpretation. These findings indicate that an increase in one standard deviation in travel frequency predicts a reduction of approximately 0.44 standard deviations in perceived stress, which, through the mediation mechanism, translates into a significant indirect increase in happiness. The non-significant direct effect confirms that the relationship between travel frequency and authentic happiness operates entirely through stress reduction, rather than through a direct hedonic pathway.
Connection to Study Objectives. This model addresses the first study objective: to determine whether perceived stress mediates the relationship between travel frequency and authentic happiness. The results demonstrate full mediation, confirming that stress reduction is the core psychological mechanism linking travel frequency to well-being. This finding refines the prevailing assumption that “more travel equals more happiness” by showing that the benefits of frequent travel are indirect, operating through stress mitigation.
Transition to Model 2. Having established the mediation mechanism in a simple model, we now test the robustness of these findings by incorporating sociodemographic control variables (age, income, and gender) to assess whether the mediation effect remains stable after accounting for potential confounding factors. Model 2 is presented in Section 4.3.2.

4.3.2. SEM Model with Control Variables

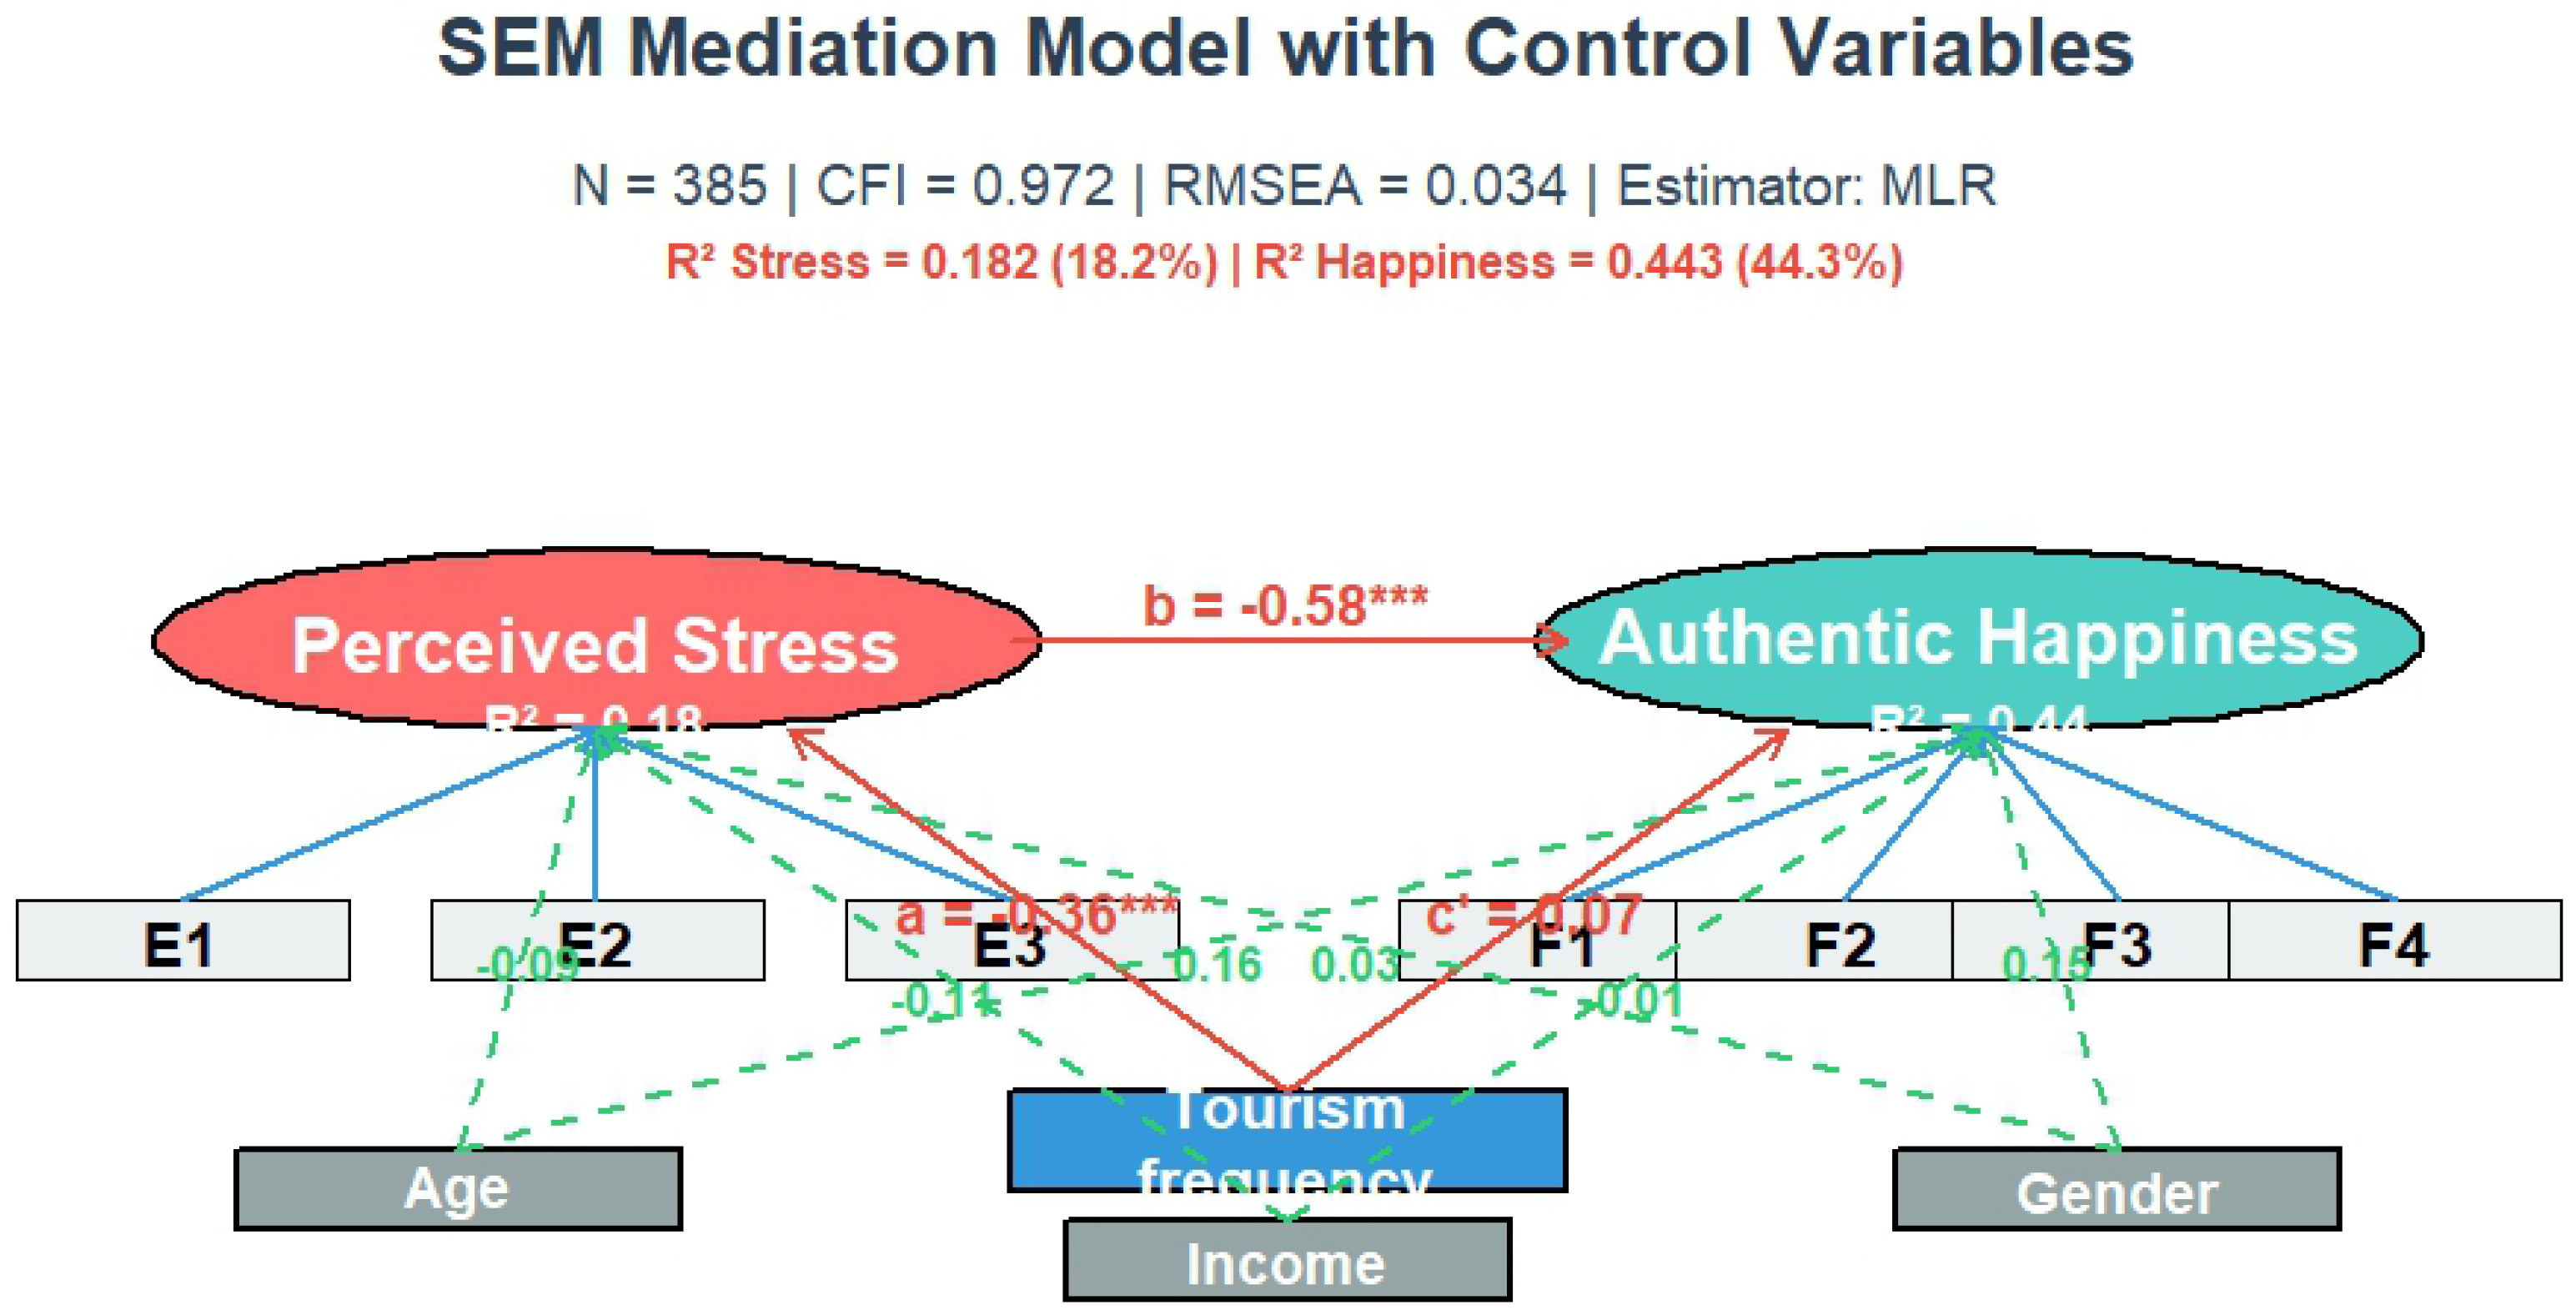
Including age, income, and gender as covariates maintained good model fit (CFI = 0.972; RMSEA = 0.034) and increased the explained variance in happiness to 44.3% (R2 = 0.443) (Figure 4). Travel frequency remained a significant negative predictor of stress (β = −0.36, p < 0.001), and stress continued to strongly predict happiness (β = −0.58, p < 0.001). The direct effect of frequency on happiness was again non-significant (β = 0.07, p > 0.05), and the indirect effect through stress remained significant (β = 0.21, p < 0.01; 95% CI [0.12, 0.30]). Age and gender showed small positive effects on happiness, while income did not significantly affect either stress or happiness (Table 3) [28].
Standardized Equations. The mediation model with control variables is expressed through the following standardized equations:
Stress = 0.358 · Frequency 0.87 · Age 0.105 · Income + 0.028 · Gender   ( Female ) + ε M   ( R 2 = 0.182 ) Happiness = 0.071 · Frequency 0.584 · Stress 0.008 · Income + 0.161 · Age + 0.154 · Gender   ( Female ) + ε Y   ( R 2 = 0.443 )
Note. Coefficients for Age and Income are reported in standardized form. Age showed a small negative association with stress, while its positive association with happiness reflects the expected pattern.
Indirect Effect and Mediation. The indirect effect of travel frequency on happiness through perceived stress, estimated using bootstrap procedures, was positive and statistically significant (β = 0.21, p < 0.01), with approximately 74.6% of the total effect mediated by stress. This result confirms the presence of full mediation, as the direct effect remained non-significant [23,28].
These findings indicate that an increase in one standard deviation in travel frequency predicts a reduction of approximately 0.36 standard deviations in perceived stress, which, through the mediation mechanism, translates into a substantial indirect increase in happiness. Although the inclusion of age, income, and gender slightly adjusts coefficient magnitudes relative to SEM Model 1, the substantive conclusion remains unchanged.
Connection to Study Objectives. This model addresses the second study objective: to evaluate the robustness of the mediation mechanism after controlling for key sociodemographic variables. The results demonstrate that the full mediation pattern remains stable after accounting for age, income, and gender, confirming that the core mechanism is not confounded by these demographic factors. This robustness strengthens the theoretical claim that stress reduction is a universal pathway linking travel frequency to authentic happiness.
Comparative Analysis (Table 3). The comparative analysis between SEM Model 1 and SEM Model 2 indicates that the inclusion of sociodemographic control variables does not compromise overall model fit and slightly enhances explanatory power for authentic happiness. Both models exhibit excellent goodness-of-fit indices, with CFI values exceeding recommended thresholds and RMSEA values well below 0.06.
Overall, both models provide consistent evidence of full mediation, demonstrating that tourism frequency enhances well-being primarily by reducing perceived stress rather than exerting a direct influence on happiness. The stability of the mediation effect across model specifications, together with improved internal validity under the inclusion of control variables, offers strong empirical support for the proposed theoretical framework and underscores the importance of stress-reduction mechanisms in tourism-related well-being strategies.

4.4. Sensitivity Analysis: Robustness of the Mediation Model

To address the limitations in the reliability of the Happiness construct (ordinal α = 0.188; CR = 0.209) and to assess the stability of the mediation effect, we conducted a series of sensitivity analyses using alternative specifications of the dependent variable. Specifically, we re-estimated the core mediation model (Travel Frequency → Perceived Stress → Happiness) with three different measures of happiness [39]:
1. Model A (original): Happiness as a latent variable with the three original items (Happiness_1, Happiness_2, Happiness_3), as reported in Section 4.3.1.
2. Model B (5-item latent): Happiness as a latent variable with five items (Happiness_1 to Happiness_5), which showed slightly improved reliability (ordinal α = 0.508; CR = 0.545) and is theoretically broader.
3. Model C (observed): Happiness as a single observed indicator (Happiness_Level, variable V3_FeliAute), measured on an 11-point scale, which avoids the need for a latent structure.
All models were estimated using maximum likelihood (ML) with 5000 bootstrap resamples to obtain robust confidence intervals for the indirect effects [23]. The results are summarized in Table 4.
Model A: The overall mediation pattern is confirmed: travel frequency significantly reduces stress (β = −0.41, p < 0.001), stress negatively predicts happiness (β = −0.77, p < 0.01), the direct effect of frequency on happiness is not significant (β = 0.02, ns), and the indirect effect through stress is significant (indirect = 0.129, p < 0.01; 95% CI [0.035, 0.221]) [39].
Model B: Although frequency continues to reduce stress (β = −0.43, p < 0.001), the relationship between stress and happiness is marginally significant (β = −0.59, p = 0.085), and the indirect effect does not reach statistical significance (indirect = 0.092, p = 0.099; 95% CI [0.019, 0.228]). This result suggests that the inclusion of additional items with low psychometric quality (as observed in the CFA) may weaken the detection of the mediational effect [28].
Model C: The one-dimensional happiness variable (Happiness_Level) replicates the overall mediation pattern: frequency → stress (β = −0.41, p < 0.001), stress → happiness (β = −0.44, p < 0.001), non-significant direct effect (β = −0.06, ns), and significant indirect effect (indirect = 0.064, p < 0.001; 95% CI [0.038, 0.095]) [36].
Overall, the sensitivity analyses demonstrate that, despite the psychometric limitations of the three-item happiness scale, the study’s main conclusion that travel frequency influences well-being solely through stress reduction remains robust when using an alternative happiness measure with improved properties (observed variable) [37]. The five-item model, for its part, highlights the importance of selecting reliable indicators so as not to attenuate the true effects.

5. Discussion

The present study provides robust evidence that perceived stress fully mediates the relationship between travel frequency and authentic happiness in a high-altitude nature destination. Specifically, frequent travel does not directly enhance authentic happiness; rather, its beneficial effect operates entirely through the reduction in stress. This finding refines the prevailing assumption that “more travel equals more happiness” and shifts the theoretical focus toward stress mitigation as the core psychological mechanism underlying tourist well-being.

5.1. Why Does Travel Frequency Reduce Stress? Unpacking the Mechanism

The finding that travel frequency significantly reduces perceived stress (β = −0.36, p < 0.001) raises the question: what explains this relationship? We propose three complementary psychological and behavioral mechanisms:
First, increased familiarity. Repeated exposure to a destination enables visitors to develop cognitive maps of the environment, knowledge of routes, facilities, and points of interest. This familiarity reduces the cognitive load associated with wayfinding and decision-making, which are primary sources of travel-related stress [16]. In the context of Cotopaxi National Park, familiarity with entrance procedures, trail conditions, and altitude acclimatization transforms potentially stressful encounters into manageable experiences.
Second, reduced risk perception. Evidence from risk perception research shows that frequent travelers perceive lower destination risk, suggesting that experience acts as a protective mechanism [17]. When visitors have successfully navigated a destination multiple times, their assessment of potential threats (e.g., altitude sickness, weather changes, safety concerns) becomes more realistic and less anxiety-provoking. This risk reappraisal reduces anticipatory stress before travel and in situ stress during the visit.
Third, experiential resource accumulation. Building on the concept of experiential capital [15], repeated travel enables visitors to accumulate practical resources: knowledge of optimal timing, familiarity with booking systems, understanding of safety protocols, and awareness of environmental conditions. These resources function as stress-buffering assets, reducing uncertainty and increasing perceived control. The accumulation process is incremental, each visit adds to the experiential repertoire, progressively lowering baseline stress levels.

5.2. Why Does Stress Reduction Enhance Authentic Happiness?

The strong negative effect of perceived stress on authentic happiness (β = −0.58, p < 0.001) aligns with established findings in positive psychology [18]. However, our study contributes by explaining the mechanisms through which stress reduction enables well-being in tourism contexts:
First, release of cognitive resources. According to ART, attentional resources are finite and can be depleted by stress and cognitive demands [8]. When stress is high, cognitive resources are consumed by threat monitoring, problem-solving, and emotional regulation. Stress reduction liberates these resources, making them available for the ‘soft fascination’ and ‘being away’ experiences that characterize restorative environmental engagement. In Cotopaxi, visitors with lower stress can more fully attend to the volcanic landscapes, páramo ecosystems, and sensory richness that the park offers.
Second, enabling of restorative engagement. SRT posits that positive emotional responses to restorative environments require an initial state of low stress [10]. When visitors are not preoccupied with logistical concerns, physical discomfort, or safety worries, they can engage more deeply with the environment’s restorative features. This deeper engagement triggers the positive affect, sense of awe, and emotional uplift that constitute key components of authentic happiness [19].
Third, shifting from threat to growth orientation. Drawing on the broaden-and-build theory of positive emotions [40,41], stress reduction enables a psychological shift from a threat-focused orientation (narrowed attention, defensive responses) to a growth-focused orientation (openness, curiosity, exploration). This shift allows visitors to experience the meaning, accomplishment, and positive relationships that define eudaimonic well-being, rather than merely the absence of negative states.

5.3. Theoretical Contributions and Marginal Value: What Does This Study Add?

This study makes three distinct contributions to the literature on tourism well-being, each extending prior work in meaningful ways:
First, evidence of a new mediation pathway. Previous studies have examined direct effects of travel frequency on well-being [4,5] or have considered mediation through hedonic mechanisms such as positive affect [6]. This study is the first to demonstrate that perceived stress fully mediates the frequency-well-being relationship in a nature-based destination. This finding refines theoretical understanding by showing that the benefits of frequent travel are not direct but operate through stress reduction. This challenges the implicit assumption in much tourism research that ‘more travel equals more happiness’ [3] and redirects theoretical attention toward stress mitigation as the core mechanism.
Second, evidence from a high-risk environment. While prior studies have examined stress and well-being in relatively benign nature settings [1,2], Cotopaxi National Park presents an environment where stressors (altitude, unpredictable weather, complex logistics) and restorative features (spectacular landscapes, biodiversity) coexist. This context provides a stringent test of the mediation mechanism: if stress reduction mediates well-being even when stressors are objectively present, the mechanism is likely robust across diverse settings. Our findings demonstrate that the mediation pathway holds in this challenging environment, suggesting that stress mitigation is a universal mechanism rather than a context-specific effect.
Third, evidence from the Global South. The vast majority of tourism well-being research has been conducted in North America, Europe, and Australia [39]. The study contributes to expanding the geographical scope of the literature by providing empirical evidence from Ecuador, a country in the Global South. This is important because the psychological mechanisms linking travel to well-being may be shaped by cultural, economic, and environmental factors that differ across regions [11]. By testing the mediation model in a novel context, we provide preliminary evidence that the stress-well-being pathway may generalize beyond Western, industrialized settings.
Comparison with Prior Work: Building on studies of repeat visitation and risk perception [15,16], we extend these findings by demonstrating that the stress-reducing benefits of frequent travel are not merely correlational but mediate well-being outcomes. Extending research on nature-based mental health [1,2], we show that the restorative benefits of nature exposure depend on stress reduction as a prerequisite, not merely the presence of natural features. And contributing to the emerging literature on tourism in high-altitude environments [11], we provide the first empirical test of a full mediation model linking frequency, stress, and happiness in a challenging Andean destination.

5.4. Evidence-Based Practical Implications for Destination Management

The findings provide empirical support for specific, actionable strategies that destination managers can implement to enhance visitor well-being (Table 5). Each recommendation is directly linked to our mediation results:
Specific actionable strategies based on these findings include:
Simplify booking and access procedures. Implement user-friendly online reservation systems, clear pricing, and real-time availability updates to reduce pre-trip stress. The results suggest that reducing logistical friction directly impacts perceived stress.
Enhance on-site information and wayfinding. Install multilingual signage, provide mobile apps with offline maps and weather alerts, and train staff to offer proactive assistance. These measures build experiential capital for first-time visitors.
Design for gradual adjustment. Create itineraries that allow visitors to acclimate to altitude gradually, include rest stops, and offer flexible pacing options. This is particularly important in high-altitude destinations like Cotopaxi.
Implement relaxation techniques. Manage relevant relaxation talks and techniques in entrance areas and waiting rooms to maximize the restorative power of the tourist area for visitors before they encounter potential stressors.

5.5. Limitations and Avenues for Future Research

While the study offers novel insights, several limitations should be acknowledged. First, the cross-sectional design precludes strong causal claims; longitudinal or experimental studies are needed to confirm the directionality of the observed relationships. Second, the low reliability of the three-item happiness scale (ordinal α = 0.188) indicates that future research should employ more robust, tourism-specific well-being instruments [32]. Third, the measure of perceived stress was general rather than context-specific; developing a scale that captures logistical and environmental stressors unique to nature tourism would allow for more precise modeling. Finally, the non-probability sampling limits generalizability, although the sample’s diversity mitigates this concern to some extent.
Future studies could extend our work by examining whether the mediation mechanism holds across different types of destinations (e.g., coastal, urban) and by exploring additional mediators such as self-efficacy, mindfulness, or social connectedness [42]. Longitudinal designs tracking visitors over multiple trips would also illuminate how experiential capital accumulates and whether its effects on stress and well-being follow a linear or curvilinear trajectory.
The cross-sectional design precludes any causal interpretation of the relationships observed. Although SEM allows testing theory-driven structural models, it does not, by itself, establish causality [43]. The terms ‘predicts’ and ‘effect’ are used throughout in a statistical sense, referring to associations derived from the model. Future research employing longitudinal or experimental designs is necessary to confirm the directionality and causal nature of the mediation mechanism proposed here.

6. Conclusions

6.1. Theoretical Implications: Reframing Tourist Well-Being

The study demonstrates that perceived stress fully mediates the relationship between travel frequency and authentic happiness in a high-altitude nature destination. The key theoretical contribution lies in reframing tourist well-being not as a direct outcome of travel frequency, but as a function of stress mitigation achieved through repeated exposure and accumulated experiential capital. By validating this mechanism in Cotopaxi National Park, we extend stress recovery theory to the tourism domain and provide empirical support for the growing emphasis on psychological resilience in sustainable destination management.
The theoretical implications are threefold. First, we show that the relationship between travel and well-being is indirect, challenging the simplistic assumption that more travel necessarily leads to greater happiness. Second, we identify stress reduction as the critical pathway, suggesting that tourism well-being research should focus on understanding and mitigating stressors rather than merely cataloging positive experiences. Third, we introduce the concept of experiential capital as a bridging mechanism linking frequency to stress reduction, providing a theoretical language for future studies on repeat visitation and well-being.

6.2. Evidence-Based Policy Recommendations: Targeted Implications

The findings support targeted, evidence based recommendations that are directly derived from the empirical results:
Targeted Recommendation 1: Prioritize stress reduction over hedonic addition. Since the direct effect of frequency on happiness is non-significant, adding hedonic attractions (e.g., more amenities, entertainment options) without reducing stress is unlikely to enhance well-being. Instead, managers should prioritize interventions that reduce friction: clear signage, simplified booking systems, real-time crowding information, and proactive staff assistance.
Targeted Recommendation 2: Build experiential capital through loyalty programs. Given that frequency reduces stress (β = −0.36), programs that encourage repeat visitation, such as loyalty discounts, exclusive access to less crowded areas, or guided experiences for first-time visitors, can build the experiential capital that reduces stress over time.
Targeted Recommendation 3: Design for universal stress mitigation. Because age and income did not affect the mediation pathway, stress reduction benefits are universal. Interventions should serve all visitors regardless of demographics, rather than segmenting well-being strategies by visitor type.
Targeted Recommendation 4: Implement stress-reducing touchpoints throughout the visitor journey. The results identify three critical touchpoints for intervention: (a) pre-trip (simplified booking, clear information), (b) arrival (multilingual signage, real-time updates), and (c) in situ (altitude acclimatization guidance, flexible pacing options). Each touchpoint targets a specific stressor identified in the Cotopaxi National Park context.

6.3. The Central Role of Stress Management in Tourism Experience Design

The completeness of the mediation pathway (full mediation, with direct effect non-significant) underscores that stress management should be central to tourism experience design. In high-altitude destinations like Cotopaxi, where environmental stressors are objectively present, the reduction in perceived stress is not merely beneficial but necessary for well-being outcomes to emerge. This suggests that tourism experience design should begin with stress mitigation, ensuring that visitors can navigate the environment safely, comfortably, and with minimal uncertainty, before layering on hedonic or eudaimonic enhancements.
For destination managers, this means rethinking the sequence of experience design: first, reduce friction and uncertainty; second, enable restorative engagement; third, support the emergence of authentic happiness through meaning, accomplishment, and positive relationships. This sequential approach aligns with the theoretical logic of the mediation model and provides a practical framework for implementing evidence-based well-being strategies.


Supplementary Materials

The following supporting information can be accessed at: https://drive.google.com/drive/folders/1xr5T3bmEiAEKovcEiYj2oULHnMG9m5FS?usp=sharing (accessed on 1 March 2026).

Author Contributions

Conceptualization, M.A.A.Z.; methodology, M.A.A.Z.; formal analysis, M.A.A.Z.; investigation, M.A.A.Z.; data curation, F.J.M.M.; writing—original draft preparation, M.A.A.Z.; writing—review and editing, G.E.R.S.; visualization, G.E.R.S.; supervision, F.J.M.M. All authors have read and agreed to the published version of the manuscript.

Funding

This research received no external funding. The APC was funded by the author.

Institutional Review Board Statement

According to Ecuadorian research regulations for minimal-risk studies involving anonymous survey data (Código Orgánico de Salud, Art. 193; Reglamento para la Investigación en Salud del Ecuador), this study did not require review by an Institutional Ethics Committee because no personal identifiers or sensitive health information were collected. Therefore, ethics approval was not mandatory.

Informed Consent Statement

Informed consent was obtained from all participants prior to completing the questionnaire. Participation was voluntary, anonymous, and no personal identifiable data were collected.

Data Availability Statement

Data supporting the reported results are available on request from the corresponding author. The data are not publicly available due to privacy restrictions.

Acknowledgments

The author thanks Universidad Politécnica Estatal del Carchi y a la Universidad Técnica de Cotopaxi for administrative and technical support during data collection. During the preparation of this manuscript, the author used Microsoft Copilot for text structuring and editing assistance. The author has reviewed and edited the output and takes full responsibility for the content of this publication.

Conflicts of Interest

The author declares no conflict of interest.

References

  1. Avecillas-Torres, I.; Herrera-Puente, S.; Galarza-Cordero, M.; Coello-Nieto, F.; Farfán-Pacheco, K.; Alvarado-Vanegas, B.; Ordóñez-Ordóñez, S.; Espinoza-Figueroa, F. Nature Tourism and Mental Well-Being: Insights from a Controlled Context on Reducing Depression, Anxiety, and Stress. Sustainability 2025, 17, 654. [Google Scholar] [CrossRef]
  2. Petrick, J.; Wang, X. The psychophysiological effects of travel: A horizon 2050 paper. Tour. Rev. 2024, 80, 121–138. [Google Scholar] [CrossRef]
  3. Vada, S.; Prentice, C.; Scott, N.; Hsiao, A. Positive psychology and tourist well-being: A systematic literature review. Tour. Manag. Perspect. 2020, 33, 100631. [Google Scholar] [CrossRef]
  4. Konstantopoulou, C.; Varelas, S.; Liargovas, P. Well-Being and Tourism: A Systematic Literature Review. Economies 2024, 12, 281. [Google Scholar] [CrossRef]
  5. Bagheri, F.; Guerreiro, M.; Pinto, P.; Ghaderi, Z. From Tourist Experience to Satisfaction and Loyalty: Exploring the Role of a Sense of Well-Being. J. Travel Res. 2023, 63, 1989–2004. [Google Scholar] [CrossRef]
  6. Zhu, M.; Gao, J.; Zhang, L.; Jin, S. Exploring tourists’ stress and coping strategies in leisure travel. Tour. Manag. 2020, 81, 104167. [Google Scholar] [CrossRef]
  7. Ramsey, J.R.; Zhang, Y.; Lorenz, M.P.; Hosany, S. Travel Stress, Leisure Exploration, and Trip Satisfaction: The Mediating Role of Travel Adjustment. J. Travel Res. 2024, 63, 210–225. [Google Scholar] [CrossRef]
  8. Kökény, L.; Birkner, Z.; Michalkó, G. Daring routine: Examining the tourists’ risk perception attitudes through the characteristics of travel frequency and revisit frequency. Curr. Issues Tour. 2024, 27, 244081. [Google Scholar] [CrossRef]
  9. Schiffrin, H.; Nelson, S. Stressed and happy? Investigating the relationship between happiness and perceived stress. J. Happiness Stud. 2010, 11, 33–39. [Google Scholar] [CrossRef]
  10. Biardeau, L.T.; Sahli, M. Investigating the non-linear impacts of seven types of natural disasters on inbound tourism: Insights from the EM-DAT database. Tour. Econ. 2024, 30, 1123–1140. [Google Scholar] [CrossRef]
  11. Mutana, S.; Mukwada, G. Mountain-route tourism and sustainability. A discourse analysis of literature and possible future research. J. Outdoor Recreat. Tour. 2018, 24, 59–65. [Google Scholar] [CrossRef]
  12. Kaplan, S. The restorative benefits of nature: Toward an integrative framework. J. Environ. Psychol. 1995, 15, 169–182. [Google Scholar] [CrossRef]
  13. Ulrich, R.S.; Simons, R.F.; Losito, B.D.; Fiorito, E.; Miles, M.A.; Zelson, M. Stress recovery during exposure to natural and urban environments. J. Environ. Psychol. 1991, 11, 201–230. [Google Scholar] [CrossRef]
  14. Gocer, O.; Boyacioglu, D.; Karahan, E.E.; Shrestha, P. Cultural tourism and rural community resilience: A framework and its application. Sustainability 2024, 107, 103238. [Google Scholar] [CrossRef]
  15. Cai, W.; Lysova, E.I.; Khapova, S.N.; Bossink, B.A.G. Does Entrepreneurial Leadership Foster Creativity Among Employees and Teams? The Mediating Role of Creative Efficacy Beliefs. J. Bus. Psychol. 2019, 34, 203–217. [Google Scholar] [CrossRef]
  16. Fornell, C.; Larcker, D.F. Evaluating Structural Equation Models with Unobservable Variables and Measurement Error. J. Mark. Res. 1981, 18, 39–50. [Google Scholar] [CrossRef]
  17. Scott, D.; Gossling, S. A review of research into tourism and climate change—Launching the annals of tourism research curated collection on tourism and climate change. Ann. Tour. Res. 2022, 95, 103409. [Google Scholar] [CrossRef]
  18. Yang, D.; Yang, Y.; Xia, J. Hydrological cycle and water resources in a changing world: A review. Water 2021, 2, 115–122. [Google Scholar] [CrossRef]
  19. Aladag, O.F.; Köseoglu, M.A.; King, B.; Mehraliyev, F. Strategy implementation research in hospitality and tourism: Current status and future potential. Int. J. Hosp. Manag. 2020, 88, 102556. [Google Scholar] [CrossRef]
  20. Nicolaou, A.; Masoner, M. Sample size requirements in structural equation models under standard conditions. Int. J. Account. Inf. Syst. 2013, 14, 256–274. [Google Scholar] [CrossRef]
  21. Ali, F. Rethinking synthetic data in tourism research: Ethical risks, epistemic shifts, and the RSDU-T framework. Ann. Tour. Res. 2025, 114, 104009. [Google Scholar] [CrossRef]
  22. Cohen, S.; Kamarck, T.; Mermelstein, R. A Global Measure of Perceived Stress. J. Health Soc. Behav. 1983, 24, 385–396. [Google Scholar] [CrossRef] [PubMed]
  23. Preacher, K.J.; Hayes, A.F. Asymptotic and Resampling Strategies for Assessing and Comparing Indirect Effects in Multiple Mediator Models. Behav. Res. Methods 2008, 40, 879–891. [Google Scholar] [CrossRef] [PubMed]
  24. Pandey, S.; Elliott, W. Suppressor Variables in Social Work Research: Ways to Identify in Multiple Regression Models. J. Soc. Soc. Work. Res. 2010, 1, 28–40. [Google Scholar] [CrossRef]
  25. Chaves, C.; Ballesteros-Valdés, R.; Madridejos, E.; Charles-Leija, H. PERMA-Profiler for the Evaluation of well-being: Adaptation and Validation in a Sample of University Students and Employees in the Mexican Educational Context. Appl. Res. Qual. Life 2023, 18, 1225–1247. [Google Scholar] [CrossRef]
  26. Usakli, A.; Gurkan, K. Using partial least squares structural equation modeling in hospitality and tourism: Do researchers follow practical guidelines? Int. J. Contemp. Hosp. Manag. 2018, 30, 3462–3512. [Google Scholar] [CrossRef]
  27. Osborne, J.W. Best Practices in Data Cleaning: Ensuring Validity and Reliability in Research; SAGE Publications: Thousand Oaks, CA, USA, 2013; Available online: https://methods.sagepub.com/book/mono/preview/best-practices-in-data-cleaning.pdf#_ (accessed on 18 January 2026).
  28. MacKinnon, D.P.; Fairchild, A.J.; Fritz, M.S. Mediation Analysis. Annu. Rev. Psychol. 2007, 58, 593–614. [Google Scholar] [CrossRef]
  29. Garcês, S.; Pocinho, M.; Jesus, S.N. Psychometric analysis of the Tourism Wellbeing Scale (TWS): A multidisciplinary approach. An. Acad. Bras. Ciênc. 2020, 92, e20190232. [Google Scholar] [CrossRef] [PubMed]
  30. Hair, J.F.; Hult, G.T.M.; Ringle, C.M.; Sarstedt, M. A Primer on Structural Equation Modeling; Springer: Cham, Switzerland, 2021. [Google Scholar] [CrossRef]
  31. Kline, R.B. Principles and Practice of Structural Equation Modeling, 4th ed.; Guilford Press: New York, NY, USA, 2015; Available online: https://psycnet.apa.org/record/2015-56948-000 (accessed on 10 January 2026).
  32. Field, A. Discovering Statistics Using IBM SPSS Statistics, 5th ed.; Sage: London, UK, 2018; Available online: https://uk.sagepub.com/en-gb/eur/discovering-statistics-using-ibm-spss-statistics/book285130 (accessed on 11 January 2026).
  33. Henseler, J.; Ringle, C.M.; Sarstedt, M. A New Criterion for Assessing Discriminant Validity in Variance-Based Structural Equation Modeling. J. Acad. Mark. Sci. 2015, 43, 115–135. [Google Scholar] [CrossRef]
  34. Tabachnick, B.G.; Fidell, L.S. Using Multivariate Statistics, 7th ed.; Pearson: Boston, MA, USA, 2019; Available online: https://books.google.com.ec/books/about/Using_Multivariate_Statistics.html?id=cev2swEACAAJ&redir_esc=y (accessed on 15 January 2026).
  35. Hair, J.F.; Black, W.C.; Babin, B.J.; Anderson, R.E. Multivariate Data Analysis, 8th ed.; Cengage: Andover, MA, USA, 2019; Available online: https://eli.johogo.com/Class/CCU/SEM/_Multivariate%20Data%20Analysis_Hair.pdf (accessed on 17 January 2026).
  36. Hu, L.-T.; Bentler, P.M. Cutoff criteria for fit indexes in covariance structure analysis: Conventional criteria versus new alternatives. Struct. Equ. Model. 1999, 6, 1–55. [Google Scholar] [CrossRef]
  37. Hayes, A.F.; Cai, L. Using Heteroscedasticity-Consistent Standard Error Estimators in OLS Regression: An Introduction and Software Implementation. Behav. Res. Methods 2007, 39, 709–722. [Google Scholar] [CrossRef]
  38. Seow, A.N.; Foroughi, B.; Choong, Y.O. Tourists’ Satisfaction, Experience, and Revisit Intention for Wellness Tourism: E-Word-of-Mouth as the Mediator. SAGE Open 2024, 3, 21582440241274049. [Google Scholar] [CrossRef]
  39. Gupta, S.; Mishra, O.N.; Kumar, S. Tourist Participation, well-Being and Satisfaction: The Mediating Roles of Service Experience and Tourist Empowerment. Curr. Issues Tour. 2023, 26, 2613–2628. [Google Scholar] [CrossRef]
  40. D’Souza, K.J.; Shetty, A. Tourism and Wellbeing: Curating a New Dimension for Future Research. Cogent Soc. Sci. 2024, 10, 2319705. [Google Scholar] [CrossRef]
  41. Fredrickson, B.L. The role of positive emotions in positive psychology: The broaden-and-build theory of positive emotions. Am. Psychol. 2001, 56, 218–226. [Google Scholar] [CrossRef] [PubMed]
  42. Cohen, J.; Cohen, P.; West, S.G.; Aiken, L.S. Applied Multiple Regression/Correlation Analysis for the Behavioral Sciences, 3rd ed.; Routledge: New York, NY, USA, 2003. [Google Scholar] [CrossRef]
  43. Cole, D.A.; Maxwell, S.E. Testing Mediational Models with Longitudinal Data: Questions and Tips in the Use of Structural Equation Modeling. J. Abnorm. Psychol. 2003, 112, 558–577. [Google Scholar] [CrossRef] [PubMed]
Figure 1. Polychoric correlation matrix of the study variables.
Sustainability 18 05344 g001
Figure 2. Confirmatory Factor Analysis diagram (standardized solution). Note: The values next to the arrows are standardized factor loadings. The happiness construct showed limited reliability (CR = 0.209; ordinal α = 0.188), which is addressed through sensitivity analyses presented in Section 4.4.
Sustainability 18 05344 g002
Figure 3. SEM mediation diagram without control variables. Note. *** p < 0.001.
Sustainability 18 05344 g003
Figure 4. SEM mediation diagram with control variables. Note. *** p < 0.001.
Sustainability 18 05344 g004
Table 1. Descriptive statistics of the study variables.
VariablenMedianIQR (P25–P75)
Age (years)38532.024.00–38.00
Economic income3851380.0850.00–2300.00
Travel frequency3852.01.00–4.00
Perceived stress38514.007.00–17.00
Authentic happiness3858.838.00–9.33
Note. Median and interquartile range (IQR) are emphasized given the ordinal nature of key study variables and the use of polychoric correlations.
Table 2. Reliability and convergent validity of the measurement model.
ConstructItemsClassic α Ordinal αCRAVE
Perceived StressStress_1, Stress_2,
Stress_3
0.7980.8010.8000.573
Authentic HappinessHappiness_1, Happiness_2,
Happiness_3
0.1490.1880.2090.095
Note. CR = composite reliability; AVE = average variance extracted. Ordinal alpha is based on polychoric correlations.
Table 3. Comparative Table: SEM Model 1 vs. SEM Model 2.
ParameterSEM 1 (No Controls)SEM 2 (With Controls)
EstimatorWLSMVMLR
CFI0.9930.972
TLI0.9900.960
RMSEA0.0490.034
R2 Stress0.1900.182
R2 Authentic Happiness0.4180.443
β Frequency → Stress−0.44 ***−0.36 ***
β Stress → Happiness−0.66 ***−0.58 ***
β Frequency → Happiness−0.04 (ns)0.07 (ns)
Indirect Effect (a × b)0.29 ***0.21 **
Note. Standardized coefficients reported. *** p < 0.001; ** p < 0.01; ns = non-significant.
Table 4. Sensitivity analysis: standardized coefficients (β) and indirect effects for alternative happiness measures.
ModelHappiness Specificationβ Freq → Stressβ Stress → Happinessβ Direct Freq → HappinessIndirect Effect i95% CI (Bootstrap)R2 Happiness
A3 items−0.41 ***−0.77 **0.02 ns0.129 **[0.035, 0.221]0.600
B5 items−0.43 ***−0.59 †−0.09 ns0.092 ns[0.019, 0.228]0.314
CSingle observed item−0.41 ***−0.44 ***−0.06 ns0.064 ***[0.038, 0.095]0.178
Note. *** p < 0.001; ** p < 0.01; † p = 0.085; ns = non-significant (p > 0.10). i Unstandardized indirect effect (original estimate) with 95% bootstrap confidence interval based on 5000 replicates. Direct path coefficients (β) are standardized.
Table 5. Specific actionable strategies based on these findings.
Empirical FindingDerived ImplicationActionable Strategy
Travel frequency reduces stress (β = −0.36)Experiential capital is a protective resourceDevelop loyalty programs that encourage repeat visitation; offer repeat visitor discounts or exclusive access to less crowded areas
Stress reduction mediates well-beingStress mitigation is the primary pathway to well-beingPrioritize interventions that reduce friction: clear multilingual signage, simplified booking systems, real-time weather and crowding information
Direct effect of frequency on happiness is non-significant“More travel” without stress reduction does not increase happinessFocus on quality of experience over quantity of visits; design for low-stress, high-adjustment experiences
Age and income did not affect mediationStress reduction benefits are universalImplement inclusive strategies that serve all visitors regardless of demographics; avoid segmenting well-being interventions
Disclaimer/Publisher’s Note: The statements, opinions and data contained in all publications are solely those of the individual author(s) and contributor(s) and not of MDPI and/or the editor(s). MDPI and/or the editor(s) disclaim responsibility for any injury to people or property resulting from any ideas, methods, instructions or products referred to in the content.