1. Introduction
Environmental degradation has become one of the most critical structural challenges of the 21st century due to its ecological implications and its impact on the economic and social stability of nations [
1,
2].
In this context, the ecological footprint has emerged as a comprehensive indicator that assesses anthropogenic pressure on ecosystems by comparing the demand for natural resources with the biosphere’s regenerative capacity [
3,
4].
The growing divergence between the ecological footprint and global biocapacity has generated a persistent ecological deficit, associated with phenomena such as climate change, biodiversity loss, and the overexploitation of natural resources [
5,
6].
In Latin America, this issue takes on a particular dimension due to the coexistence of high biodiversity with productive structures historically based on intensive natural resource extraction. This model has shaped a development trajectory characterized by dependence on the primary export sectors, thereby limiting the transition toward more sustainable economies [
7,
8].
Economic growth in the region has traditionally been associated with higher levels of environmental degradation, consistent with the environmental Kuznets curve hypothesis, which suggests a non-linear relationship between income and ecological deterioration [
9,
10].
However, recent evidence questions the universality of this hypothesis, indicating that in developing economies, growth continues to intensify the ecological footprint due to technological and regulatory constraints [
10,
11].
From a structural perspective, international trade has played an ambivalent role. While it can facilitate the diffusion of cleaner technologies, it may also intensify environmental pressure through scale effects and specialization in resource-intensive sectors, particularly in weak institutional contexts [
12,
13].
Energy intensity is also a key determinant of environmental degradation, reflecting an economy’s energy-use efficiency. High energy intensity is associated with greater ecological footprints, especially in fossil-fuel-dependent economies, limiting progress toward sustainable energy transitions [
14,
15,
16].
Thus, improving energy efficiency and diversifying the energy matrix are necessary conditions for decoupling economic growth from environmental pressures.
Simultaneously, information and communication technologies (ICTs) have attracted increasing attention in sustainability research due to their potential to improve productive efficiency, technological modernization, and digital integration [
17,
18]. However, empirical evidence regarding the environmental effects of ICTs remains mixed, particularly in developing economies where technological expansion may coexist with structural, institutional, and energy-related limitations [
19]. In this context, ICT service exports are incorporated in the present study as an exploratory proxy for technological specialization and digital transformation within ALADI countries.
However, empirical evidence on the impact of ICT service exports on the ecological footprint remains inconclusive, particularly in developing economies where technological benefits may be offset by structural and energy constraints [
17].
Environmental degradation is one of the main structural challenges for Latin American economies, particularly in countries where economic growth continues to depend heavily on natural resource exploitation and trade-based production. Despite growing interest in sustainability transitions, important uncertainties remain regarding how economic growth, trade openness, energy intensity, and ICT service exports interact to shape environmental pressure in ALADI countries.
Although previous studies have analyzed some of these relationships independently, most empirical evidence on Latin America focuses primarily on CO2 emissions and relies on static econometric approaches that do not adequately capture dynamic persistence, delayed effects, and endogeneity. Moreover, limited evidence exists for ALADI countries as an integrated regional bloc, particularly concerning the simultaneous role of traditional economic determinants and emerging technological variables within a sustainability-transition framework.
In this context, the main objective of this study is to analyze the dynamic determinants of the ecological footprint in ALADI countries during the period 2000–2021. Specifically, the study examines the effects of economic growth, trade openness, energy intensity, and ICT service exports using a dynamic panel data approach estimated through System GMM.
The contribution of this research is fourfold. First, unlike much of the existing Latin American literature, which focuses primarily on CO2 emissions, this study adopts the ecological footprint as a multidimensional indicator of environmental pressure that captures broader ecological impacts associated with production and consumption dynamics.
Second, the study advances beyond previous dynamic panel analyses by jointly incorporating traditional structural determinants—economic growth, trade openness, and energy intensity—with ICT service exports as an emerging proxy for digital transformation and technological specialization. While ICT variables have been increasingly examined in developed economies, their role in shaping environmental pressure remains largely underexplored in Latin American countries, particularly within ALADI economies.
Third, the study introduces a differentiated lag structure within the dynamic System GMM framework to capture the delayed effects of economic and technological variables on the environment. Specifically, economic growth is incorporated with a four-period lag, while trade openness, energy intensity, and ICT service exports are modeled with distinct lag specifications according to their expected temporal transmission mechanisms. This approach allows for a more realistic representation of the persistence and adjustment dynamics underlying ecological footprint behavior.
Fourth, the application of the two-step System GMM estimator enables simultaneous control for endogeneity, dynamic persistence, and unobserved heterogeneity, thereby providing more robust evidence on the determinants of ecological pressure in developing economies.
Additionally, the study contributes to the Sustainable Development Goals, particularly SDG 7, SDG 8, SDG 12, and SDG 13, by providing empirical evidence on the structural factors that condition the transition toward more sustainable development pathways in Latin America.
1.1. Theoretical Framework
The analysis of the relationship between economic growth, trade openness, energy intensity, and ICT service exports on the ecological footprint requires an integrative theoretical approach that allows for understanding the interactions among economic, technological, and environmental systems.
In this regard, the present study is grounded in a multidimensional conceptual framework that articulates the environmental Kuznets curve, theories of international trade and the environment, and endogenous growth theory, complemented by contemporary approaches to sustainability and structural transition.
1.1.1. Environmental Kuznets Curve and Growth Dynamics
The environmental Kuznets curve (EKC) hypothesis posits that the relationship between economic growth and environmental degradation follows a non-linear, inverted-U-shaped trajectory, in which early stages of economic development generate increased environmental pressure, while higher income levels enable environmental improvements through technological progress, institutional changes, and greater social awareness [
18,
19].
However, recent empirical evidence has called into question the general validity of this hypothesis, particularly in developing economies. Studies published in high-impact journals suggest that economic growth remains associated with persistent increases in the ecological footprint when structural transformations in the productive matrix and significant improvements in energy efficiency are absent [
11,
20].
In this context, the scale effect tends to dominate over technological effects, perpetuating resource-intensive development patterns.
Furthermore, recent research using approaches such as STIRPAT and dynamic panel models shows that the relationship between growth and the ecological footprint is highly dependent on the institutional, energy, and technological contexts of each region [
16].
This case suggests that the EKC does not constitute a universal law but rather a result conditioned by structural factors, which is particularly relevant for Latin America.
1.1.2. International Trade, Specialization, and Environmental Pressure
The link between international trade and environmental degradation is explained through three fundamental mechanisms: scale effect, composition effect, and technique effect [
18,
21].
Trade expansion increases production and resource use (scale effect), while environmental outcomes depend on the sectoral structure of the economy (composition effect) and the adoption of cleaner technologies (technique effect).
In developing countries, the scale effect largely prevails, particularly under specialization in extractive or resource-intensive sectors [
12,
13].
This pattern aligns with the “pollution haven” hypothesis, which posits that environmentally intensive industries relocate to jurisdictions with weaker regulatory frameworks.
Nevertheless, the impact of trade on the ecological footprint is heterogeneous and conditional upon institutional quality, technological development, and export composition [
22,
23].
Accordingly, trade openness may either exacerbate or mitigate environmental degradation depending on the development strategy pursued.
1.1.3. Energy Intensity and the Transition Toward Sustainability
Energy intensity, measured as energy use per unit of output, is a key indicator of energy efficiency and a structural determinant of environmental pressure.
Higher energy intensity reflects inefficient resource use and is associated with higher emissions and an increased ecological footprint [
14,
24].
This relationship is particularly pronounced in fossil fuel-dependent economies, where limited progress toward renewable energy constrains environmental improvements [
16,
25].
Empirical evidence from journals such as the Journal of Cleaner Production and Gondwana Research indicates that energy efficiency gains, combined with the adoption of clean technologies, are necessary conditions for achieving decoupling between economic growth and environmental degradation [
26,
27].
Therefore, energy intensity captures not only technical inefficiencies but also structural constraints within development models, underscoring its central role in sustainability analysis.
1.1.4. Technology, ICT, and Endogenous Growth
Endogenous growth theory posits that technological progress arises from deliberate investments in knowledge, innovation, and human capital, generating positive externalities that sustain long-term growth [
28,
29].
This framework has been extended to environmental analysis by emphasizing the direction of technological change toward cleaner technologies [
30].
ICT has increasingly been incorporated into sustainability research due to its potential association with technological modernization and productive efficiency [
17,
18]. Nevertheless, empirical evidence regarding its environmental effects remains inconclusive, particularly in developing economies where digital expansion may coexist with structural energy dependence and limited technological integration [
27,
31,
32,
33]. Consequently, the environmental contribution of ICT service exports may vary substantially across countries and development contexts.
Empirical evidence suggests that digitalization can reduce the ecological footprint by improving efficiency, driving innovation, and altering consumption patterns [
31,
32].
However, the effects are not unidirectional. In some cases, ICT expansion increases energy demand and environmental pressure, particularly where digital infrastructure relies on non-renewable energy sources [
25,
33]. Thus, the environmental impact of ICT depends on its alignment with energy policies and institutional frameworks.
In developing economies, ICT service exports constitute a particularly relevant proxy for technological change because they reflect not only the diffusion of digital technologies, but also the productive capacity to generate, commercialize, and integrate knowledge-intensive services into international markets. Unlike broader indicators of digitalization or ICT penetration, ICT service exports capture the external competitiveness of technologically oriented sectors and the degree of structural transformation toward more knowledge-based economic activities. In the context of Latin American economies, where productive structures remain strongly dependent on natural resources and low-value-added sectors, the expansion of ICT service exports may signal advances in technological specialization, innovation capacity, and digital integration. Consequently, this variable provides a more structural measure of technological modernization and allows for evaluating whether emerging digital sectors contribute to reducing or intensifying environmental pressure within sustainability transition processes.
1.1.5. Ecological Footprint, Sustainability, and Socioeconomic Transition
The ecological footprint is widely used as a comprehensive indicator of sustainability, measuring human demand on natural resources relative to the Earth’s regenerative capacity. It enables a systemic assessment of environmental pressure by integrating economic, energy, and social dimensions [
34,
35].
Within the Sustainable Development Goals (SDGs), it is directly linked to responsible consumption and production (SDG 12), climate action (SDG 13), and energy transition (SDG 7). Nonetheless, current development models continue to prioritize economic growth over sustainability, generating structural tensions between development and environmental conservation [
34,
36].
From a broader perspective, the ecological footprint is central to the debate over transitioning to a sustainability-oriented development paradigm, which involves structural changes in production, consumption, and economic organization. The interaction among growth, trade, energy, and technology ultimately shapes both environmental outcomes and the feasibility of more sustainable development pathways.
2. Materials and Methods
2.1. Research Design and Data
This study adopts a quantitative, panel-data approach to examine the determinants of the ecological footprint across ten member countries of the Latin American Integration Association (ALADI): Argentina, Bolivia, Brazil, Chile, Colombia, Mexico, Ecuador, Panama, Paraguay, and Peru. The analysis covers the period 2000–2021, yielding a balanced panel dataset comprising 220 observations from 10 ALADI countries over 22 years.
The selected period reflects the availability of consistent data for the variables of interest and allows for capturing the long-term dynamics of economic growth, trade openness, energy transition, and digitalization in the region.
2.2. Empirical Model Specification
To capture the dynamic behavior of the ecological footprint and address endogeneity concerns, a dynamic panel data model is specified, incorporating the lagged dependent variable as a regressor. The general form of the model is:
where:
: ecological footprint.
: lagged ecological footprint (dynamic component).
: GDP variation with a four-year lag.
: lagged trade openness.
: lagged energy intensity.
: first difference of ICT exports (lagged).
: error term.
The lag structure adopted in the model reflects both theoretical considerations and the dynamic nature of the relationships between economic activity, productive structure, and environmental outcomes. In particular, the four-period lag applied to economic growth was selected to capture delayed structural effects associated with industrial expansion, capital accumulation, infrastructure development, and long-term energy demand, which may influence environmental degradation progressively rather than immediately. Previous empirical studies on environmental dynamics and ecological footprint persistence have also employed longer lag structures to account for delayed macroeconomic transmission mechanisms in developing economies [
24,
25,
37,
38].
In contrast, trade openness and energy intensity were incorporated using shorter lag structures because their environmental effects are more directly transmitted through contemporaneous changes in production, energy consumption, and international trade flows. ICT service exports were incorporated in first differences to reduce residual non-stationarity and improve the statistical stability of the dynamic specification while preserving the short-run dynamics associated with technological change.
Additional sensitivity analyses using alternative lag specifications for economic growth, including one- and two-period lags, produced qualitatively similar results in terms of coefficient signs and statistical interpretation. These robustness checks reinforce the stability of the main findings and support the validity of the selected dynamic specification.
ICT service exports were incorporated in first differences because the IPS unit root test indicated stationarity at the 10% significance level after first differencing. This transformation was considered sufficient to reduce non-stationarity and avoid potential spurious dynamic relationships while preserving the short-run variability and economic interpretation of the technological variable within the System GMM framework.
2.3. Estimation Method: System GMM
The model is estimated using the two-step System Generalized Method of Moments (System GMM), as developed by Arellano and Bover [
39] and Blundell and Bond [
40]. The selection of this estimator is particularly appropriate for the present study because the dataset consists of a relatively small number of cross-sectional units (10 ALADI countries) observed over a moderate time dimension (2000–2021), a structure in which traditional panel estimators may generate biased and inconsistent results in the presence of dynamic relationships and endogeneity.
The inclusion of the lagged ecological footprint as an explanatory variable introduces correlation with unobserved country-specific effects, rendering conventional estimators such as ordinary least squares (OLS), fixed effects (FE), or random effects (RE) potentially inconsistent. In addition, the relationship among economic growth, trade openness, technological change, and environmental pressure may involve reverse causality and simultaneity issues, further justifying the adoption of a dynamic estimation framework.
System GMM addresses these limitations by combining equations in differences and levels while using internal instruments derived from lagged values of the variables. This approach improves estimation consistency and reduces endogeneity bias in dynamic panel settings with small
N and moderate
T [
39,
40,
41].
2.4. Diagnostic Tests and Model Validation
To ensure the robustness and validity of the econometric specification, several diagnostic tests were conducted.
Multicollinearity was evaluated using the variance inflation factor (VIF) and the correlation matrix. The results indicate low levels of multicollinearity among the explanatory variables, supporting the stability of the estimated coefficients.
Stationarity was assessed through the Im–Pesaran–Shin (IPS) unit root test, confirming that the variables become stationary after first differencing and reducing the risk of spurious regression.
The validity of the dynamic specification was additionally evaluated using the Arellano–Bond serial correlation tests and the Hansen test of overidentifying restrictions. The AR(2) test confirmed the absence of second-order serial correlation, while the Hansen test supported the joint validity of the instruments.
To mitigate instrument proliferation, the instrument matrix was collapsed, and lag depth was restricted following standard recommendations in the System GMM literature [
41].
2.5. Alternative Models
To strengthen the robustness and consistency of the empirical findings obtained with the System GMM estimator, additional estimations using fixed effects (FE), random effects (RE), and the cross-sectionally augmented ARDL (CS-ARDL) mean group estimator were conducted as complementary specifications. These alternative models allow for a comparison of the direction, magnitude, and statistical significance of the estimated coefficients under different econometric assumptions regarding unobserved heterogeneity and cross-sectional dependence across countries.
The fixed effects model controls for time-invariant country-specific characteristics that may influence the ecological footprint, whereas the random effects model assumes that these individual effects are uncorrelated with the explanatory variables. Additionally, the CS-ARDL mean group estimator explicitly incorporates cross-sectional averages to account for potential cross-sectional dependence and heterogeneous dynamic relationships among ALADI countries.
These alternative estimators are used solely as comparative specifications to examine the stability of coefficient signs and the general consistency of the estimated relationships across different econometric assumptions. Nevertheless, the primary econometric inference of the study relies on the dynamic System GMM estimator, given its suitability for addressing endogeneity, dynamic persistence, simultaneity, and reverse causality within panel structures characterized by endogenous relationships and delayed adjustment effects. The FE, RE, and CS-ARDL estimations are therefore interpreted as complementary robustness and reference models.
3. Results
The empirical analysis was conducted in two complementary stages. First, a descriptive exploration was performed using country-level graphical analysis to identify preliminary patterns and structural heterogeneity. Second, a dynamic panel data model was estimated to robustly assess the determinants of the ecological footprint across ALADI countries.
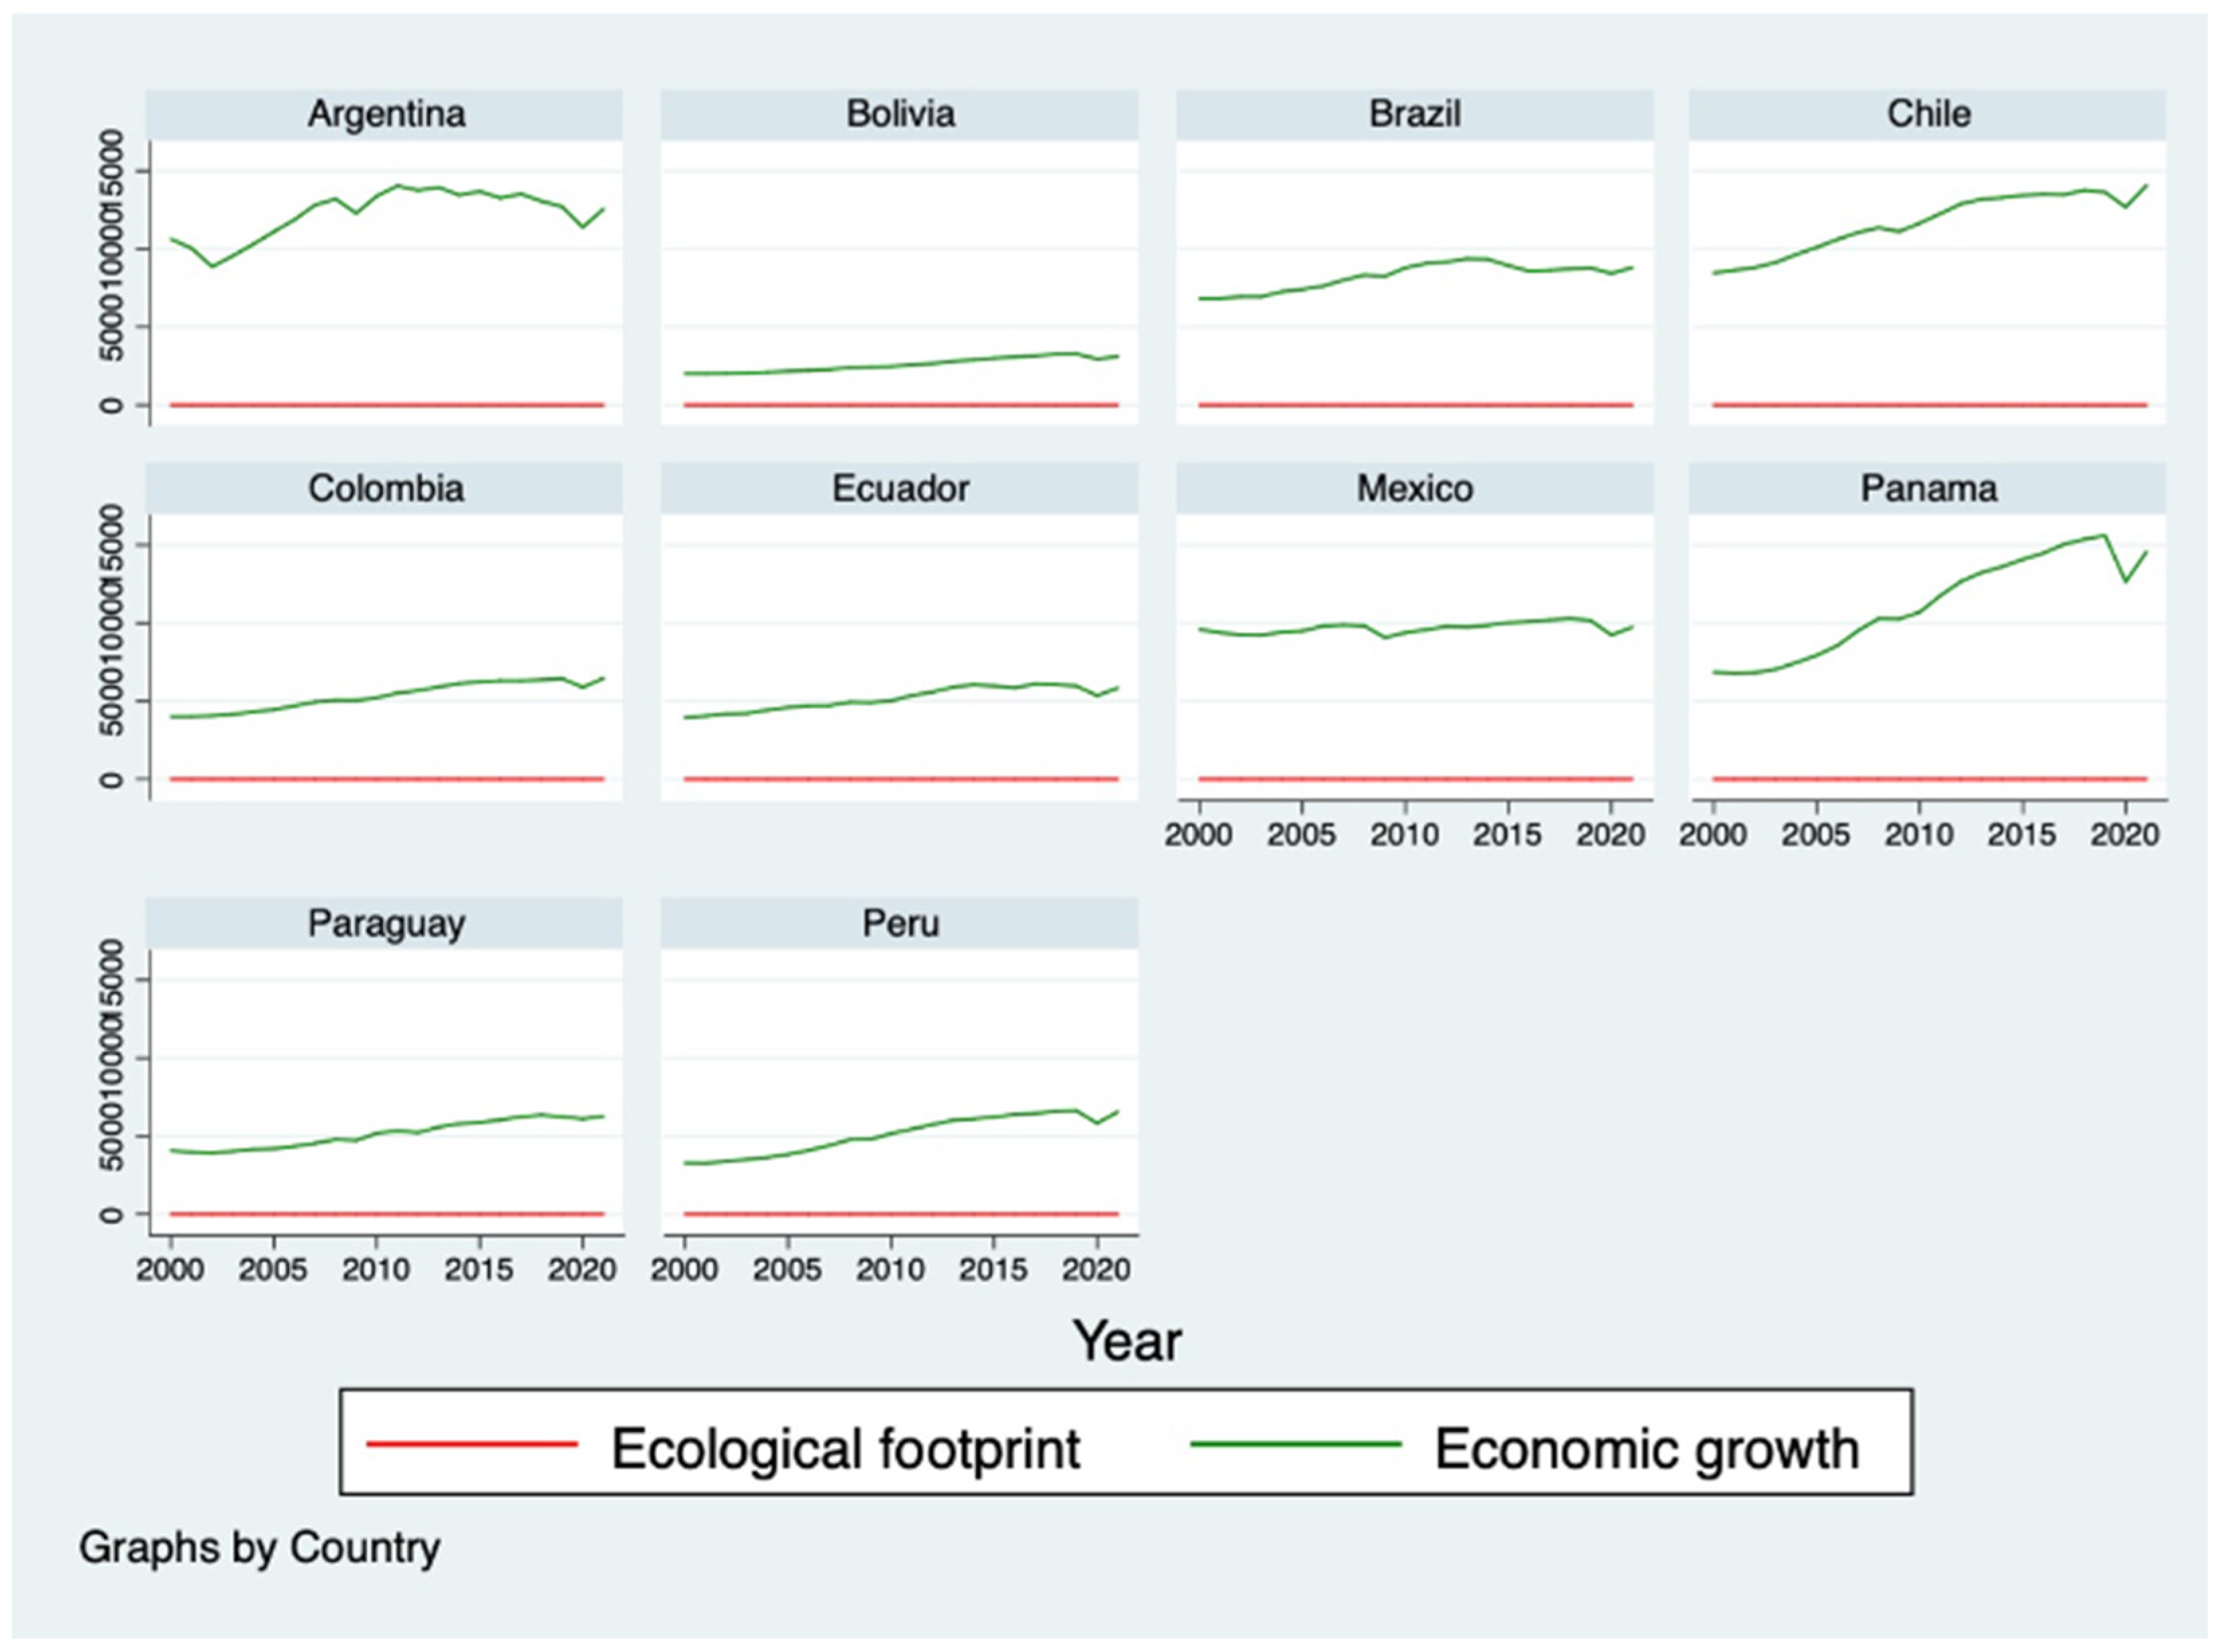
As shown in
Figure 1, GDP per capita exhibited a sustained upward trend in most countries over the period 2000–2021, while the ecological footprint per capita remained relatively stable or showed moderate fluctuations. From a descriptive perspective, this pattern may suggest limited relative decoupling between economic growth and environmental pressures in some countries. In this context, decoupling refers to a situation in which economic growth expands faster than environmental pressures, allowing economic activity to increase without a proportional rise in ecological degradation. However, this interpretation should be approached cautiously, since the study did not implement a formal decoupling analysis. Moreover, the dynamic panel estimations reported later indicate that economic growth continues to have a positive and statistically significant effect on the ecological footprint, suggesting that structural decoupling between economic expansion and environmental degradation has not yet been fully achieved in ALADI economies.
Cross-country differences are also evident within the region. Countries with more industrialized, export-oriented economic structures tend to exhibit higher ecological footprints, whereas economies with lower industrial intensity display more stable environmental trajectories. These patterns suggest that the environmental effects of economic growth remain heterogeneous across ALADI countries.
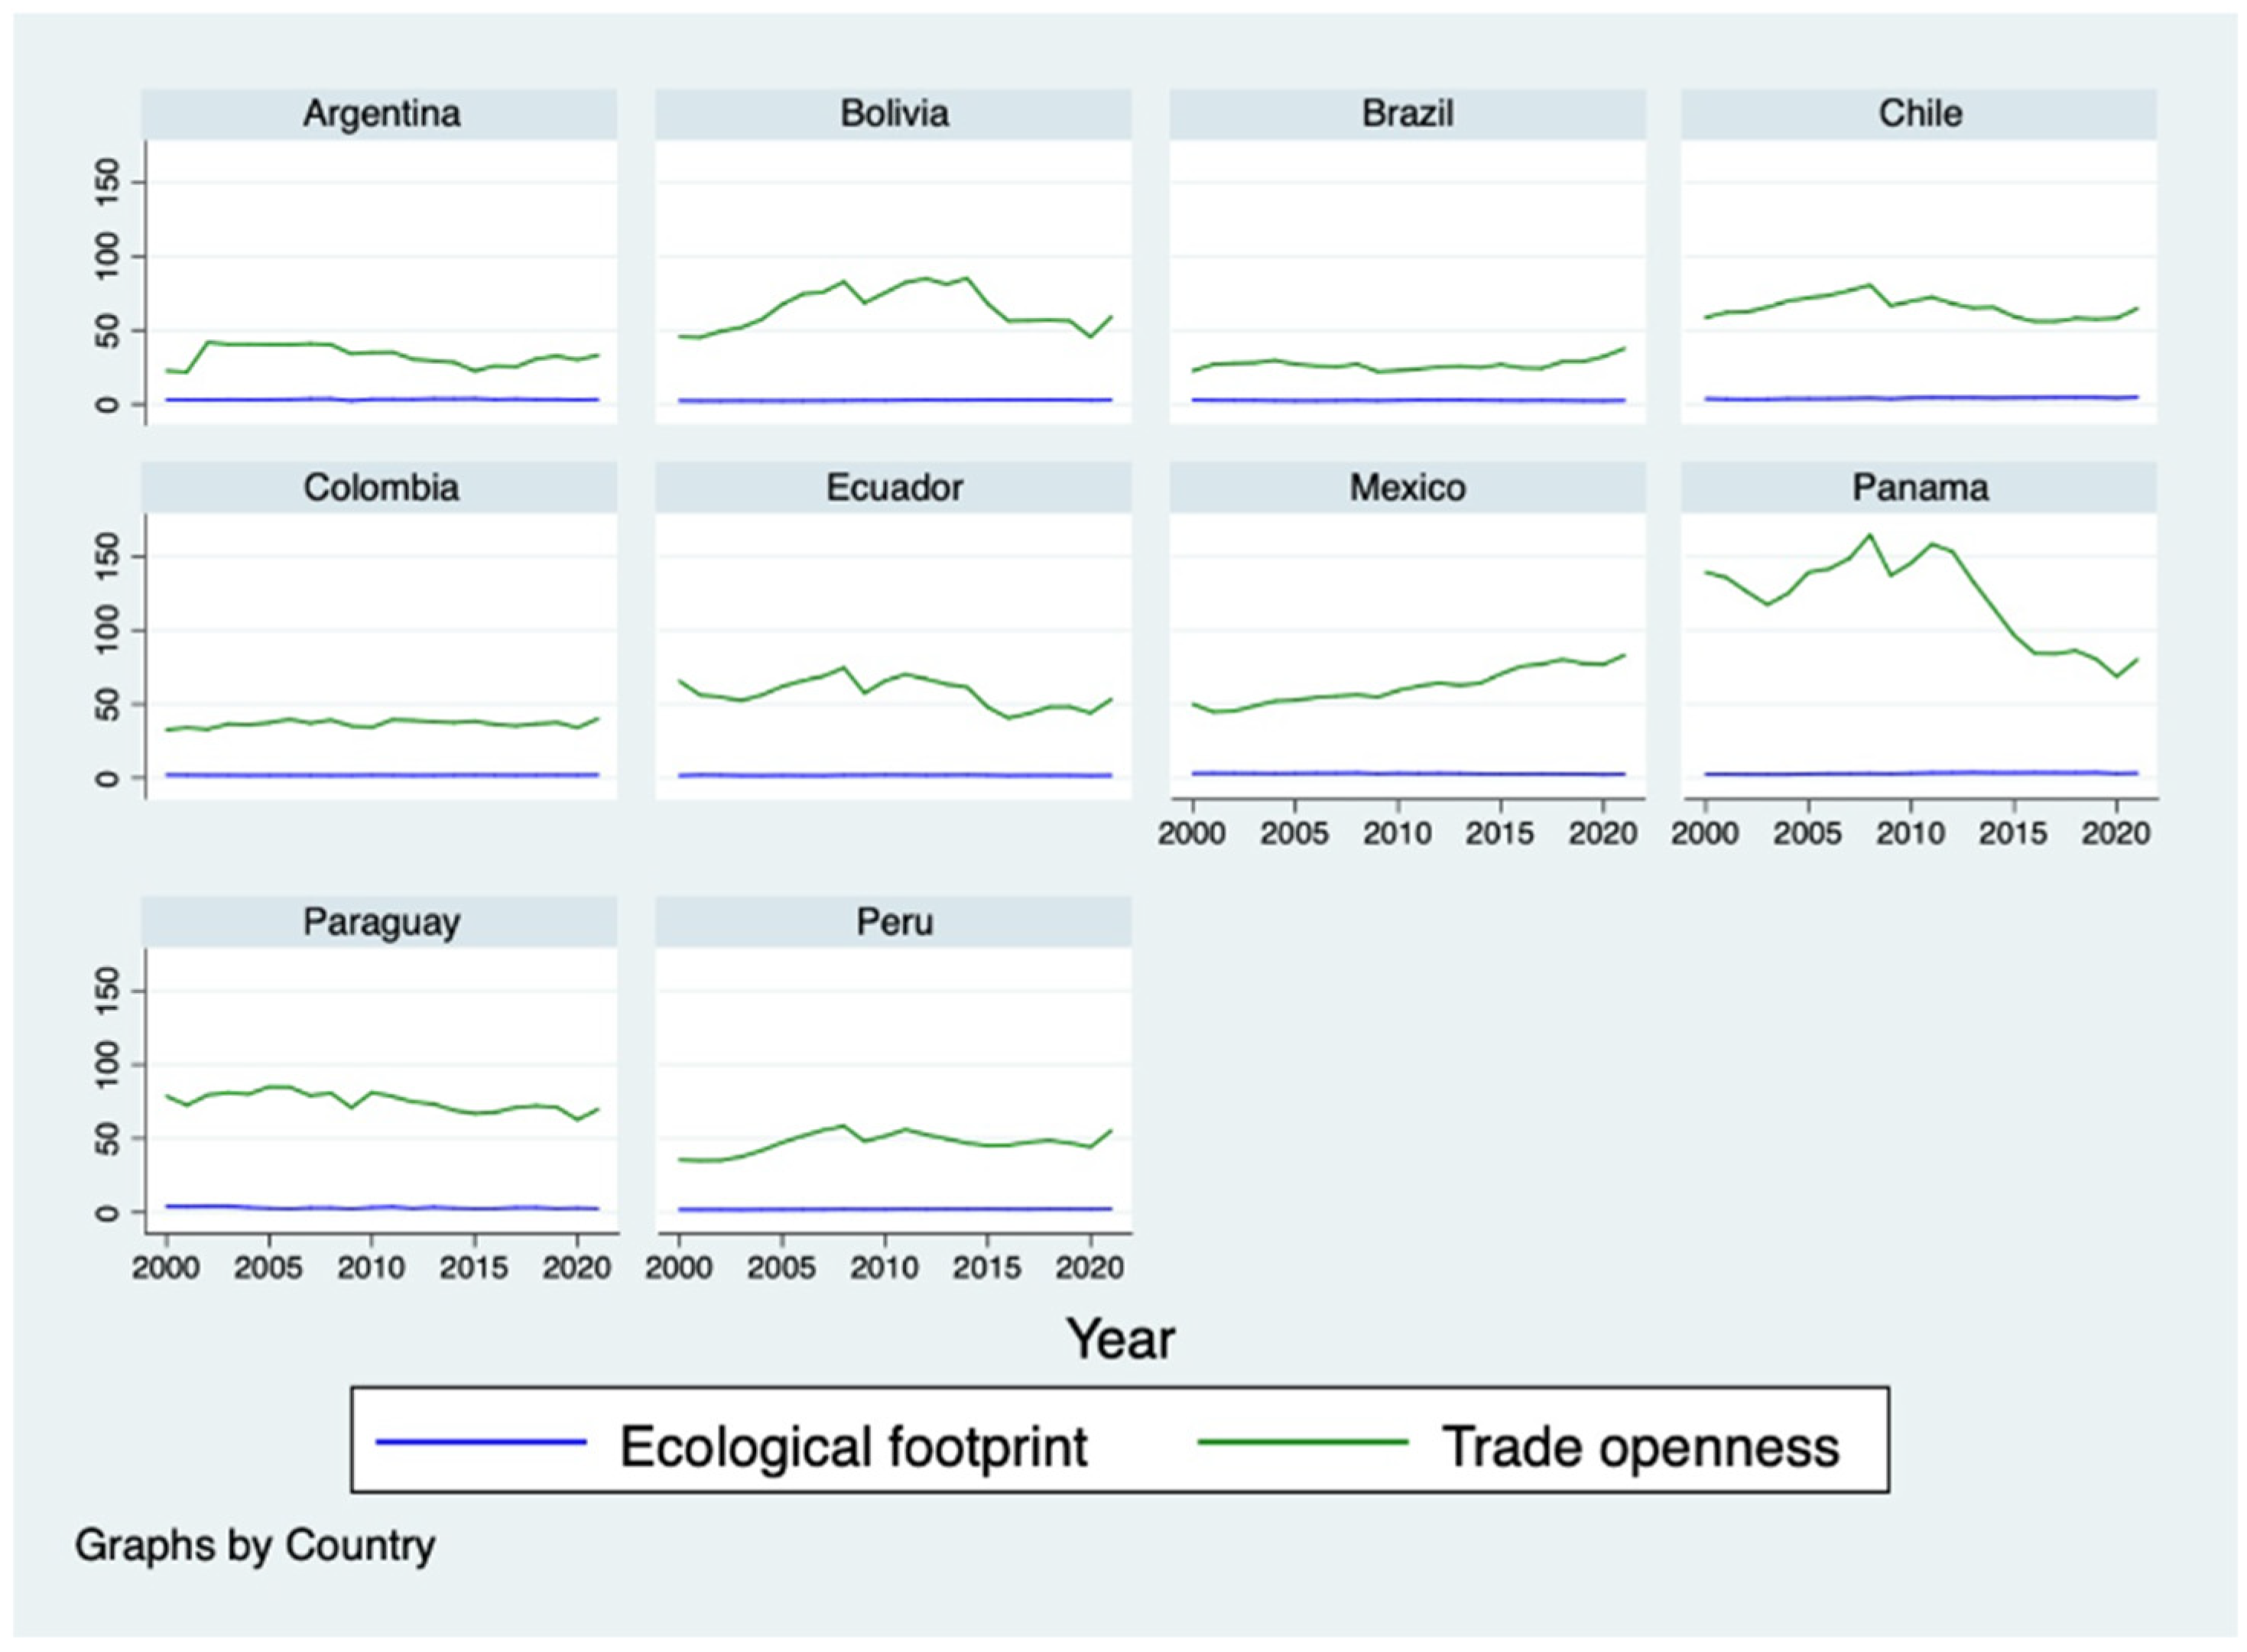
Regarding trade openness,
Figure 2 shows no uniform relationship between trade (as a percentage of GDP) and the ecological footprint per capita. Variations in trade openness do not consistently translate into changes in environmental pressure. This finding suggests that the environmental impact of international trade is context-dependent, shaped by export composition, technological capacity, and the quality of environmental regulation. In some countries, trade appears to intensify environmental pressure, whereas in others, its effect is neutral or ambiguous.
The figure additionally reveals heterogeneous trade dynamics across the region. Countries with stronger export specialization and greater integration into international markets tend to exhibit higher environmental pressure, whereas economies with lower trade exposure show more moderate ecological variations. These differences reinforce the idea that the environmental effects of trade openness depend on productive structure and export composition.
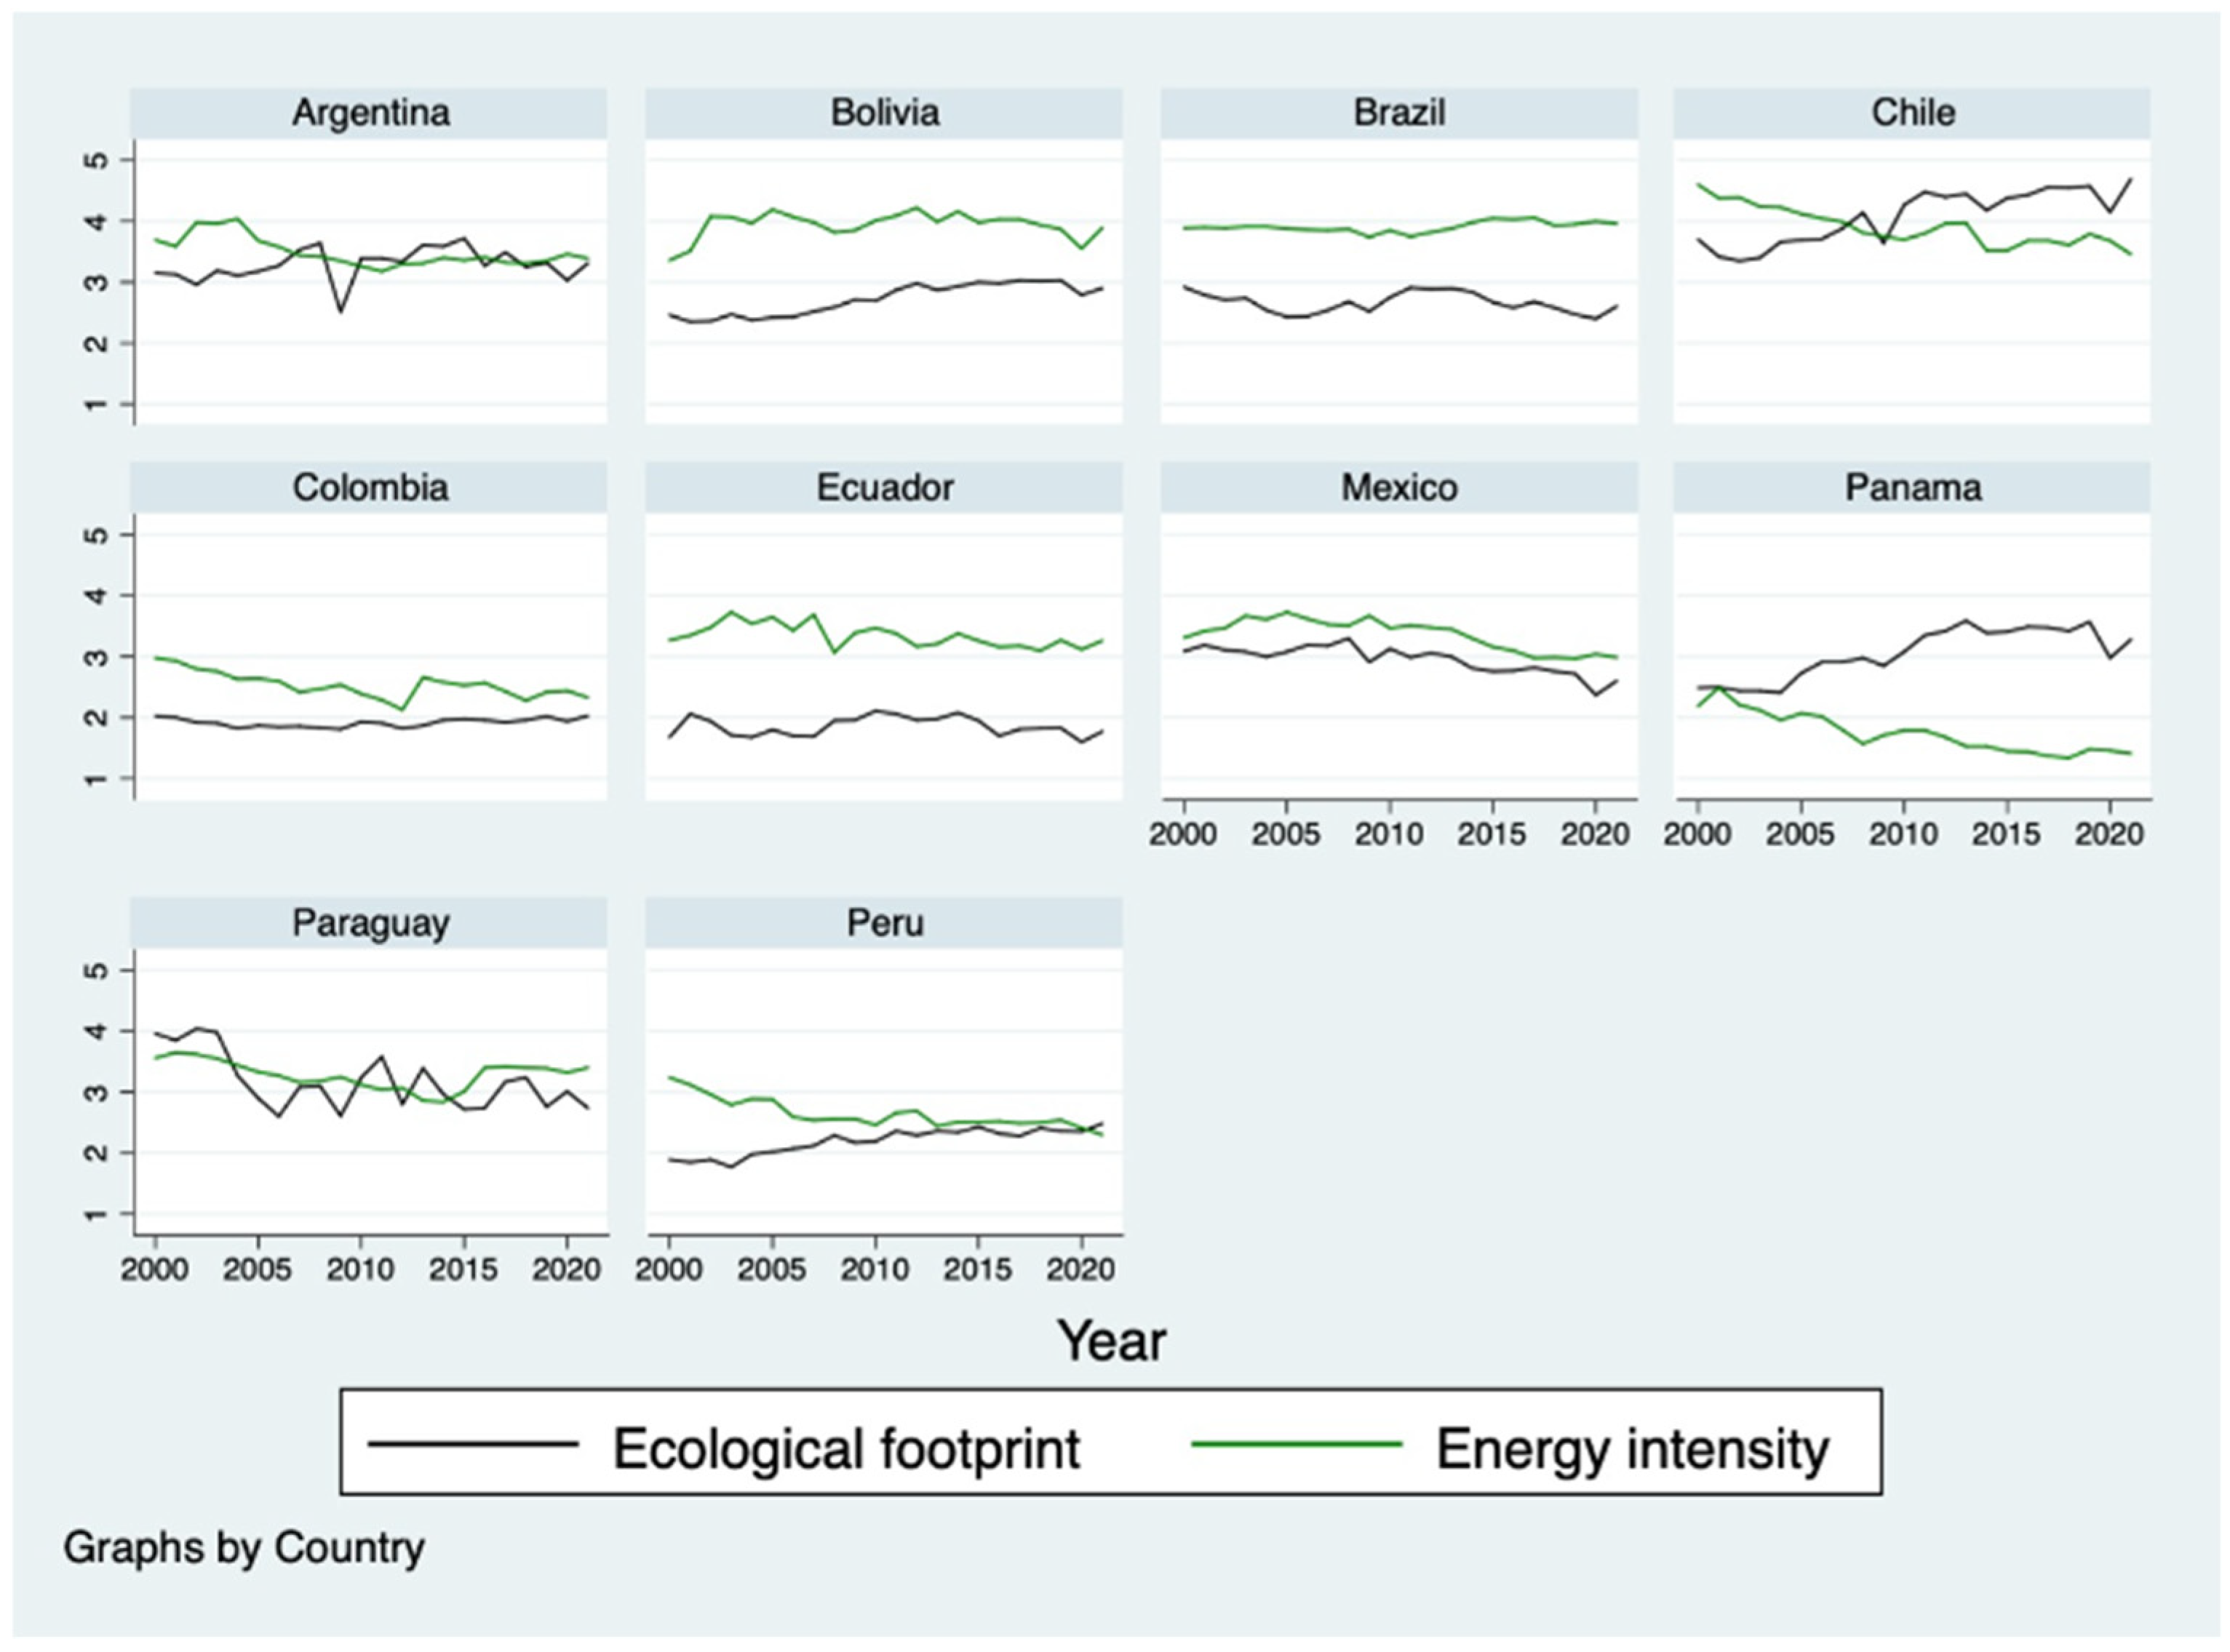
Figure 3 indicates that the relationship between energy intensity and the ecological footprint is heterogeneous across countries. In several cases, improvements in energy efficiency do not translate into clear reductions in the ecological footprint, suggesting that efficiency gains alone are insufficient to mitigate environmental pressure. This result highlights that the environmental impact of energy consumption depends on the energy mix and production structure, particularly in fossil fuel-dependent economies.
Important differences are also observed in the evolution of energy intensity across ALADI countries. While some economies exhibit gradual reductions associated with improvements in energy efficiency and increased participation in renewable energy, others maintain relatively high energy dependence linked to industrial production and fossil fuel consumption patterns. This heterogeneity may partially explain the weak aggregate relationship identified between energy intensity and ecological footprint in the dynamic estimations.
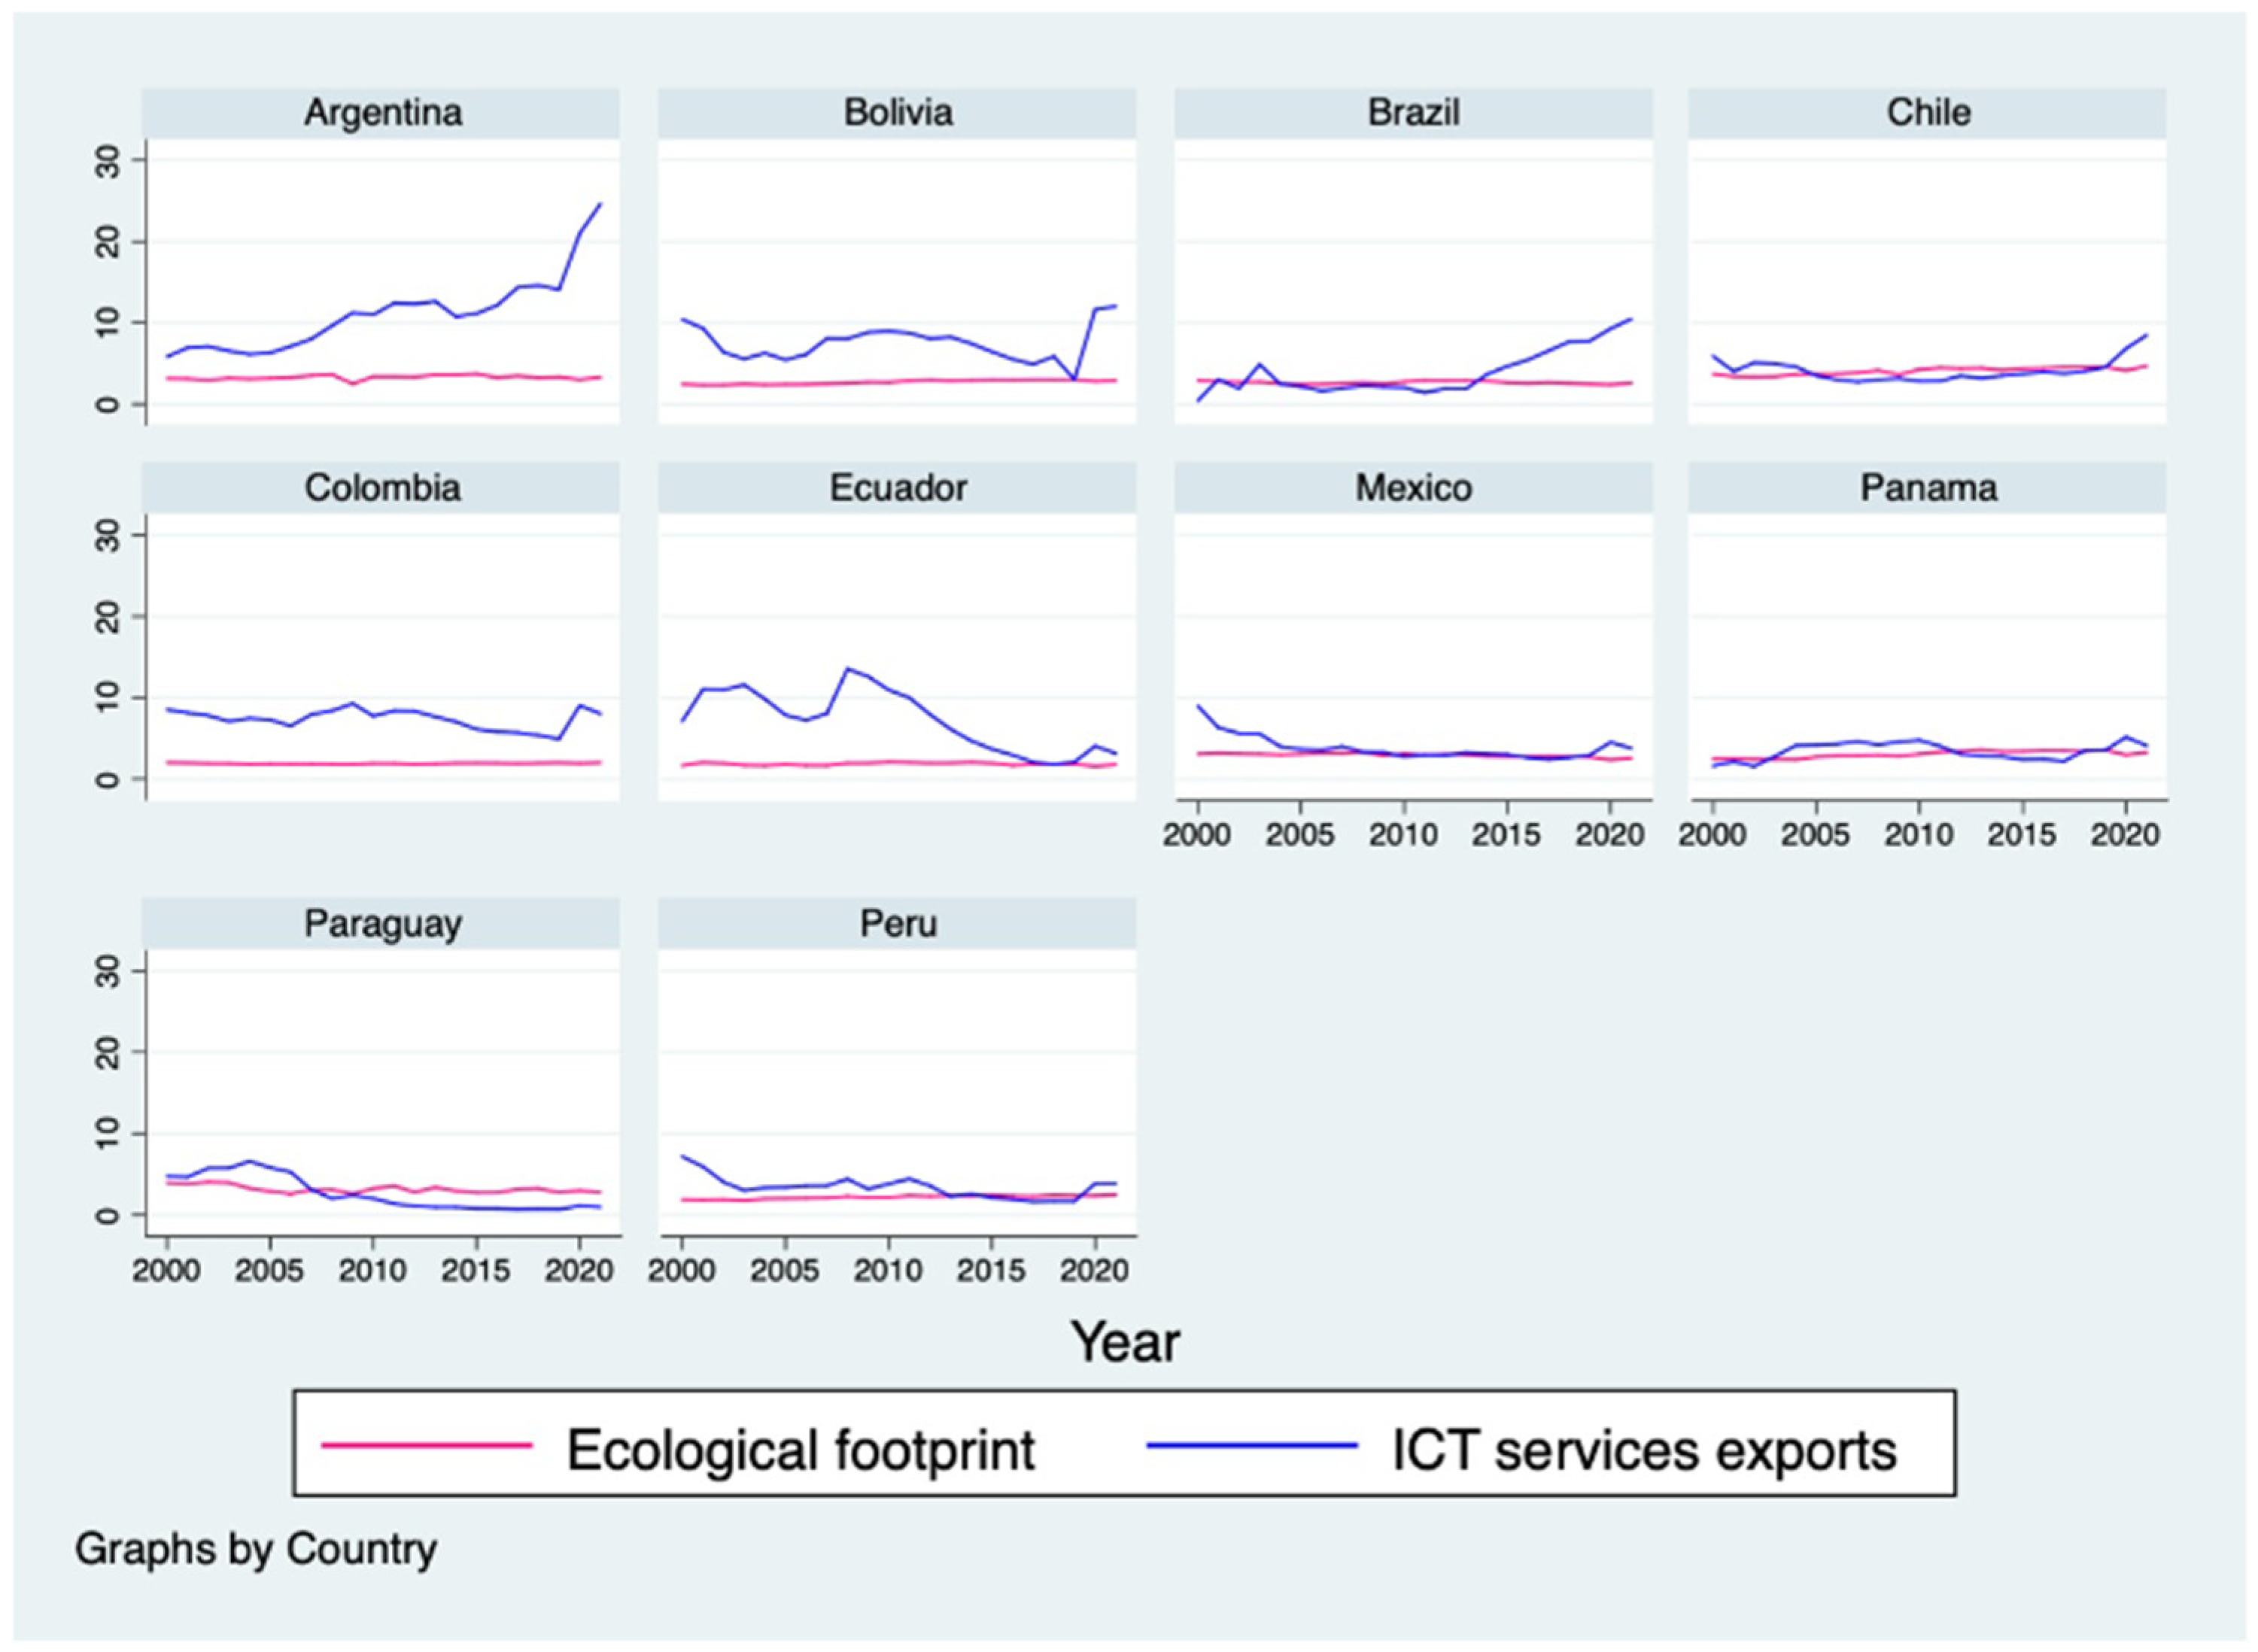
Figure 4 shows that ICT service exports do not exhibit a systematic relationship with the ecological footprint per capita. The evolution of this variable is not consistently associated with changes in environmental pressure, suggesting that digital specialization alone is not a direct determinant of environmental sustainability. This finding underscores that the environmental impact of digitalization depends on its integration with broader energy, technological, and institutional policies.
The expansion of ICT service exports also differs considerably across countries. Economies with greater technological specialization and stronger digital infrastructure exhibit more dynamic ICT export growth, whereas countries with more traditional productive structures show slower integration into digital service markets. These asymmetries reflect the uneven pace of technological transformation within ALADI economies.
Table 1 reports the correlation matrix among the variables included in the model. The results reveal that the explanatory variables present low and moderate correlation coefficients, suggesting the absence of strong linear relationships that could compromise the reliability of the econometric estimations.
The ecological footprint shows a moderate positive correlation with economic growth (0.6543), indicating that increases in economic activity are associated with higher environmental pressure in ALADI countries. This finding is consistent with the theoretical expectation that economic expansion intensifies the use of natural resources and ecological degradation. Likewise, the ecological footprint exhibits weak positive correlations with trade openness (0.2269) and energy intensity (0.2359), suggesting that both variables may contribute to environmental pressure, although their linear association remains limited.
In contrast, ICT service exports display a weak negative correlation with the ecological footprint (−0.0932), implying that digitalization may be slightly associated with reductions in environmental pressure; however, the magnitude of this relationship is relatively small.
Regarding the relationships among the explanatory variables, the highest correlation is observed between trade openness and energy intensity (−0.4167). Nevertheless, this value remains below conventional multicollinearity thresholds, confirming that the variables do not exhibit problematic associations. Overall, the correlation matrix supports the adequacy of the selected variables and reinforces the robustness of the econometric specification.
The variance inflation factor (VIF) results reported in
Table 1 indicate that there is no severe multicollinearity among the explanatory variables in the model. All VIF values remained substantially below the commonly accepted threshold of 5, and even below the more restrictive threshold of 2.5 suggested in the econometric literature, confirming that the independent variables do not exhibit problematic linear relationships.
Specifically, trade openness presents the highest VIF value (1.28), followed by energy intensity (1.24), ICT service exports (1.09), and economic growth (1.02). These low values suggest that each variable provides distinct information to the model and that the estimated coefficients are not distorted by collinearity. Consequently, the reliability and stability of the econometric estimations are strengthened, allowing for a more accurate interpretation of the individual effects of economic growth, trade openness, energy intensity, and ICT service exports on the ecological footprint in ALADI countries.
The results of the cross-sectional dependence (CSD) test were applied to the model residuals. The null hypothesis assumes weak cross-sectional dependence, whereas the alternative hypothesis posits strong cross-sectional dependence among panel units. The obtained CD statistic was −0.34 with a p-value of 0.734, which is statistically insignificant at conventional significance levels.
These results indicate that the null hypothesis of weak cross-sectional dependence cannot be rejected, suggesting that the residuals are not significantly correlated across countries. In practical terms, this finding implies that unobserved shocks or disturbances affecting one ALADI country do not systematically spill over to the others within the estimated model. The absence of strong cross-sectional dependence supports the appropriateness of the econometric specification and reinforces the reliability of the panel estimations, since cross-sectional dependence can otherwise generate biased standard errors and inconsistent inference in panel data models. Consequently, the results provide additional evidence regarding the robustness and validity of the empirical framework adopted in the study.
3.1. Unit Root Tests
The Im–Pesaran–Shin (IPS) unit root test was applied to assess the stationarity of the model variables.
As reported in
Table 2, the variables are non-stationary in levels but become stationary after first differencing. Specifically, ecological footprint, economic growth, energy intensity, and trade openness become stationary in first differences at conventional significance levels. ICT service exports also exhibit stationarity in first differences at the 10% significance level, which is considered acceptable in dynamic panel settings involving moderate sample sizes and heterogeneous cross-sectional structures. These results reduce the risk of spurious regression and support the appropriateness of the dynamic panel specification adopted in the study.
3.2. Model Results
The two-step GMM dynamic panel model showed an adequate overall fit and was statistically significant (F = 35.84;
p = 0.000). As reported in
Table 3, the estimation was based on 220 observations from 10 countries, using 10 instruments to ensure model stability and minimize the risk of overidentification.
The lagged ecological footprint exhibited a negative, statistically significant coefficient, suggesting the presence of dynamic adjustment and mean-reversion processes within the environmental system. Rather than indicating persistence in ecological degradation, this result implies that partial adjustment dynamics follow periods characterized by relatively high ecological footprint levels. In this context, the negative coefficient reflects convergence behavior in which deviations from previous environmental conditions are gradually moderated, although not completely reversed. Similar adjustment dynamics have been identified in dynamic environmental panel models developed by Baloch et al. [
42], who argue that environmental indicators often exhibit gradual correction mechanisms driven by structural and institutional responses.
Economic growth, measured as GDP per capita with a four-period lag, shows a positive, statistically significant effect (coef. = 0.000115; p = 0.044), suggesting that increases in economic activity generate delayed, cumulative environmental impacts. Beyond statistical significance, the magnitude of this coefficient indicates that economic growth constitutes the strongest structural driver of ecological pressure within the estimated model, reinforcing the predominance of scale effects in the region’s development pattern.
Trade openness also presents a positive and statistically significant coefficient (coef. = 0.0033; p = 0.010), although its magnitude is comparatively smaller than that associated with economic growth. This finding suggests that trade integration primarily increases environmental pressure by expanding production and resource-intensive export activities.
In contrast, energy intensity (coef. = 0.1009; p = 0.371) and ICT service exports (coef. = 0.0119; p = 0.170) exhibit positive but statistically insignificant coefficients across the estimated specifications. These findings suggest that neither variable currently exerts a robust or systematic effect on the ecological footprint in ALADI countries. In the case of ICT service exports, the result may reflect the relatively limited scale, heterogeneous development, and uneven productive integration of digital sectors across the region.
Overall, the results indicate that the ecological footprint dynamics in ALADI countries are primarily driven by structural factors related to economic growth and trade openness. In contrast, the estimated effects associated with energy intensity and ICT service exports remain statistically inconclusive, suggesting that these variables currently play a comparatively limited role in explaining ecological footprint dynamics across ALADI countries.
To ensure the validity of the System GMM estimator, diagnostic tests were conducted, as reported in
Table 3.
The validity of the dynamic specification was evaluated through the Arellano–Bond serial correlation tests and the Hansen test of overidentifying restrictions. The AR(1) test confirmed the expected presence of first-order serial correlation in the differenced residuals, whereas the AR(2) test did not indicate evidence of second-order serial correlation, supporting the consistency of the System GMM estimator. Likewise, the Hansen test suggests that the selected instruments are jointly valid and appropriately exogenous within the estimated specification.
To avoid instrument proliferation, the instrument matrix was collapsed, and lag depth was restricted, following Roodman’s [
41] recommendations. The final specification included 10 instruments across 10 cross-sectional groups, maintaining an acceptable instrument-to-group ratio and supporting the reliability of the Hansen test and the overall consistency of the System GMM estimator.
3.3. Robustness Analysis
To strengthen the robustness and credibility of the empirical findings obtained with the dynamic System GMM estimator, additional alternative specifications based on fixed effects (FE) and random effects (RE) models were estimated using level variables, following conventional panel-data estimation procedures. This correction ensures methodological consistency and avoids the inappropriate use of differenced variables in FE and RE estimations. In addition, a Hausman specification test was conducted to determine the most appropriate estimator between the FE and RE models.
Table 4 presents the estimation results from the fixed effects (FE) and random effects (RE) models, which serve as complementary robustness specifications. Overall, the results reveal consistency in the direction and general behavior of the coefficients across models, reinforcing the reliability of the empirical findings. The Hausman test reports a statistically significant result (χ
2 = 12.48;
p = 0.028), indicating that the fixed effects estimator is more appropriate than the random effects specification. This finding suggests a correlation between the unobserved country-specific effects and the explanatory variables, supporting the use of fixed effects in the robustness analysis.
Economic growth exhibits a positive and highly significant effect in both FE and RE estimations (p = 0.000), indicating that increases in economic activity are consistently associated with greater environmental pressure in ALADI countries. The similarity of the coefficients across both models confirms the stability of this relationship and supports the evidence obtained from the dynamic GMM specification.
Trade openness also showed a positive relationship with the ecological footprint. In the FE model, the coefficient was positive and statistically significant (p = 0.036), and in the RE model, it remained statistically significant at conventional levels (p = 0.021). These findings suggest that greater integration into international markets tends to intensify environmental pressure, supporting the hypothesis that trade expansion in developing economies remains associated with resource-intensive production structures.
Energy intensity exhibited positive but statistically insignificant coefficients in q FE and RE estimations, suggesting that its independent contribution to explaining environmental pressure becomes weaker once unobserved heterogeneity across countries is controlled for.
The comparison between the dynamic System GMM model and the alternative fixed effects (FE) and random effects (RE) estimations provides additional evidence regarding the robustness and consistency of the empirical findings. Overall, the three econometric approaches display substantial coherence in the direction and general behavior of the estimated coefficients, reinforcing the validity of the proposed specification.
In particular, economic growth maintained a positive and statistically significant effect across all models, confirming that economic expansion remains a structural driver of environmental pressure in ALADI countries. The persistence of this relationship across different estimation techniques suggests that the positive association between growth and ecological footprint is stable and not sensitive to the econometric specification.
Similarly, trade openness exhibits a consistently positive coefficient in the GMM, FE, and RE models. Although the level of statistical significance differed slightly across estimators, the direction of the relationship remained unchanged, supporting the interpretation that trade integration contributes to environmental pressure by predominantly driving scale effects and resource-intensive production structures in the region.
Regarding ICT service exports, all models consistently reported positive but statistically insignificant effects. This convergence supports the interpretation that digitalization has not yet reached a sufficient scale to have a robust impact on ecological footprints in ALADI economies.
Overall, the FE, RE, and cross-sectionally augmented ARDL (CS-ARDL) mean group estimations revealed coefficient signs broadly consistent with those obtained from the baseline System GMM specification. In particular, economic growth and trade openness continued to have positive effects on the ecological footprint across the alternative estimators, while energy intensity and ICT services exports remained comparatively weaker and statistically inconclusive. The incorporation of the CS-ARDL mean group estimator additionally strengthened the robustness analysis by explicitly accounting for cross-sectional dependence and heterogeneous dynamics across countries. Nevertheless, the primary econometric inference of the study continues to rely on the System GMM estimator, given its suitability for addressing dynamic persistence, endogeneity, simultaneity, and reverse causality within panel structures characterized by endogenous relationships and delayed adjustment effects.
Table 5 reports the results of the robustness analysis estimated through the cross-sectionally augmented ARDL (CS-ARDL) mean group estimator. This alternative specification was incorporated to evaluate whether the main findings obtained from the baseline System GMM model remain stable under a framework that explicitly controls for cross-sectional dependence and heterogeneous dynamic relationships across ALADI countries.
The model exhibited adequate overall statistical performance, as reflected by the significant F-statistic (Prob > F = 0.000), the relatively high explanatory power (R-squared = 0.71; MG R-squared = 0.83), and the statistically insignificant cross-sectional dependence test (CD p-value = 0.379). These results suggest that incorporating cross-sectional averages adequately captures common regional shocks and reduces residual cross-sectional dependence across countries.
Regarding the estimated coefficients, economic growth maintained a positive and statistically significant effect on the ecological footprint (coef. = 0.000118; p = 0.011), confirming that increases in economic activity continue to exert environmental pressure under the alternative dynamic specification. Similarly, trade openness remained positive and statistically significant (coef. = 0.002941; p = 0.009), reinforcing the evidence that trade integration contributes to ecological pressure by expanding production and resource-intensive economic activities.
In contrast, energy intensity (coef. = 0.087614; p = 0.354) and ICT services exports (coef. = 0.009842; p = 0.177) remained statistically insignificant, suggesting that their environmental effects remain comparatively weak, heterogeneous, and structurally inconclusive across ALADI countries. The persistence of these results across both the System GMM and CS-ARDL estimations strengthens the stability and consistency of the main empirical findings.
Overall, the CS-ARDL robustness specification confirms that the positive effects of economic growth and trade openness on ecological footprint remain robust under an alternative dynamic panel framework that explicitly addresses cross-sectional dependence. Nevertheless, the primary econometric inference of the study continues to rely on the System GMM estimator due to its stronger capacity to address endogeneity, dynamic persistence, simultaneity, and reverse causality.
4. Discussion
The results suggest that economic growth constitutes a key determinant of the ecological footprint in ALADI countries, exhibiting a positive, significant, and dynamic effect. This finding suggests that the environmental impacts of growth are not immediate but accumulate progressively over time, reinforcing the persistence of environmentally intensive production patterns within developing economies. These results are consistent with previous studies developed by Danish et al. [
43], Destek and Sarkodie [
44], and Usman et al. [
45] who argue that increases in economic activity tend to intensify natural resource exploitation, industrial production, and environmental degradation when structural sustainability transitions remain limited.
Likewise, the positive, statistically significant coefficient for trade openness suggests that greater integration into international markets increases environmental pressure in ALADI economies. This result supports the scale effect hypothesis and aligns with the pollution haven perspective proposed by Shahbaz et al. [
20] and Mahmood [
13], which holds that trade liberalization may intensify environmental degradation when export structures remain concentrated in resource-intensive sectors and environmental regulations are relatively weak. In several Latin American economies, export specialization continues to rely heavily on commodities and primary products, generating additional pressure on ecosystems through extraction, industrial expansion, and energy consumption.
The negative coefficient associated with the lagged ecological footprint suggests the presence of dynamic adjustment mechanisms within the environmental system. This finding should not be interpreted as an automatic reduction in ecological degradation. Instead, it reflects partial convergence and persistence dynamics over time. Periods characterized by relatively high environmental pressure tend to generate subsequent adjustment processes that moderate the trajectory of the ecological footprint, although without fully reversing the structural environmental pressures associated with economic growth and trade expansion. Similar persistence dynamics have been identified in dynamic environmental panel models developed by Baloch et al. [
42], who emphasize that ecological indicators frequently exhibit gradual adjustment processes conditioned by institutional, productive, and structural transformations.
In contrast, energy intensity exhibited a positive but statistically insignificant effect in the System GMM estimation. Therefore, the results do not provide sufficient empirical evidence to confirm a direct relationship between energy intensity and ecological footprint within the analyzed sample. This lack of significance may reflect the heterogeneous composition of the energy matrix across ALADI countries, where renewable and non-renewable energy sources coexist under different productive and institutional structures. Consequently, the environmental effects of energy consumption may vary substantially depending on the dominant energy source and the level of technological efficiency adopted by each economy. Similar findings have been reported by Apergis and Payne [
46] who argue that the environmental consequences of energy consumption may differ according to the composition of the energy matrix and the stage of economic development.
ICT service exports also exhibited a positive but statistically insignificant coefficient in the System GMM estimation. Consequently, the findings do not provide robust empirical support for a direct relationship between ICT-related technological transformation and ecological footprint within ALADI countries. This result suggests that the environmental implications of digitalization may depend on complementary structural conditions such as institutional quality, productive specialization, and energy composition. In many developing economies, technological modernization continues to coexist with resource-intensive production structures and carbon-intensive energy systems, potentially limiting the environmental benefits of ICT expansion. Similar arguments have been proposed by Škare et al. [
31] and Pata et al. [
32], who emphasize that the environmental effects of technological progress may vary considerably depending on broader economic and institutional conditions.
The robustness analysis based on fixed effects and random effects estimations confirms the general consistency of the System GMM results. Economic growth maintained a positive and statistically significant effect across the alternative specifications, reinforcing the argument that productive expansion remains associated with greater environmental pressure in ALADI countries. Trade openness also maintained a positive coefficient, though its statistical significance varied slightly across estimators. Meanwhile, ICT service exports remained statistically insignificant across models, supporting the interpretation that digital transformation alone is insufficient to guarantee environmental improvements. These results strengthen the reliability of the dynamic panel specification and support the robustness of the estimated relationships.
5. Conclusions
This study analyzed the determinants of the ecological footprint in ALADI countries during 2000–2021 using a dynamic panel approach and the two-step System GMM estimator. The findings reveal that economic growth and trade openness exert a positive, statistically significant effect on the ecological footprint, indicating that the expansion of economic activity and international trade continues to intensify environmental pressure in the region. These results support the argument that productive expansion and trade integration remain closely linked to higher resource consumption and ecological degradation in developing economies.
The negative and statistically significant coefficient associated with the lagged ecological footprint suggests the presence of dynamic adjustment and persistence mechanisms within the environmental system. Rather than indicating a direct reduction in environmental degradation, this result reflects partial convergence dynamics, in which periods of high environmental pressure are followed by gradual adjustment over time.
In contrast, energy intensity and ICT service exports exhibit positive but statistically insignificant effects. These findings suggest that the environmental consequences of energy use and technological transformation may depend on deeper structural conditions, such as the composition of the energy matrix and the level of technological development. In particular, the coexistence of renewable and non-renewable energy sources across ALADI countries may partially explain the weak aggregate relationship between energy intensity and ecological footprint identified in the estimations.
From a policy perspective, the findings suggest the need to differentiate between short-term environmental management measures and long-term structural sustainability strategies. In the short-term, policymakers should strengthen environmental regulations associated with trade expansion, improve the monitoring of resource-intensive activities, and promote stricter environmental standards in export-oriented sectors. These measures may help mitigate the immediate environmental pressure generated by economic growth and trade openness.
In the long-term, the results highlight the importance of advancing toward productive diversification, technological modernization, and cleaner energy transitions that can reduce structural dependence on environmentally intensive activities. In particular, promoting renewable energy adoption, strengthening digital and technological capabilities, and encouraging knowledge-intensive sectors may contribute to more sustainable development trajectories within ALADI economies. Consequently, sustainability policies should combine immediate environmental governance instruments with broader structural transformation strategies that support long-run ecological resilience.
Methodologically, the study contributes to the literature by incorporating differentiated lag structures and ICT services exports within a dynamic System GMM framework, while additional fixed- and random-effect estimations were used as robustness checks. The consistency observed across alternative specifications reinforces the reliability of the estimated relationships and supports the robustness of the proposed econometric approach.
Despite these contributions, the study presents certain limitations that should be acknowledged. First, the analysis is based on a relatively small sample of 10 ALADI countries, which may limit the generalizability of the findings and the variability captured in the dynamic estimations. Second, the use of aggregate national-level data may conceal important sectoral, regional, and institutional heterogeneity across countries, particularly regarding differences in productive structures, environmental regulation, and energy composition. Additionally, the application of higher-order differencing to ICT service exports prioritizes short-run dynamic stability, potentially reducing part of the long-run information contained in the original series. These limitations suggest that the results should be interpreted within the structural context of the selected economies.
Future research may incorporate additional institutional, technological, and social variables, as well as alternative environmental indicators and non-linear dynamic approaches, to deepen the understanding of sustainability transition processes in Latin American economies.




 ,
,