Article

Research on Precise Control of Decoration Waste Based on GF-2 Remote Sensing Images and a BP Neural Network: A Case Study of Henan Province

1
School of Environment, Beijing Jiaotong University, Beijing 100044, China
2
RIOH High Science and Technology Group, Beijing 100044, China
*
Author to whom correspondence should be addressed.
Sustainability 2026, 18(11), 5342; https://doi.org/10.3390/su18115342
Submission received: 8 March 2026 / Revised: 24 April 2026 / Accepted: 27 April 2026 / Published: 26 May 2026

Abstract

Decoration waste, because of its complex composition and the presence of volatile toxic and hazardous substances, has always been a difficult point in the management of urban construction waste. And with the continuous expansion of the town scale, the volume of decoration waste is gradually expanding, which constitutes a major challenge to the sustainable development of the construction industry. In order to solve this difficult problem, this paper took Henan Province as an example, and realized the accurate control of decoration waste based on GF-2 remote sensing images and a BP neural network model. The results of GF-2 remote sensing image interpretation and analysis showed that the spatial distribution of construction waste in the study area was extracted through a combination of manual visual interpretation and machine learning recognition, and as of 2021, the construction waste pile occupied a large proportion of the land area, of which the proportion of decoration waste was about 10%. Based on the trained BP neural network, the goodness-of-fit result was R = 0.95463. Selecting the research data from 2010 to 2021, the error of the predicted annual generation of decoration waste in Henan Province compared with the actual value was less than 15%, which had a high prediction accuracy. Based on the arithmetic sum of the projected figures for each year from 2022 to 2030, it is estimated that by 2030, the cumulative volume of construction and renovation waste generated in Henan Province will reach 49,827,200 tons. Visualization of spatial and temporal distribution characteristics was realized through ArcGIS, and the high production area of decoration waste was distributed from the beginning to the end of the distribution of multi-points to show the characteristics of a concentrated large area distribution, centrally located in southwestern and southeastern Henan Province, with the key cities of Zhumadian City, Luoyang City, Zhoukou City, and Xinyang City, which had obvious regional characteristics. At the same time, as the provincial capital, Zhengzhou has long ranked first in the province in terms of absolute case numbers and is therefore also a key focus of control measures. Uncertainty analysis indicates that the 95% confidence interval for the long-term forecast values is approximately ±12%. It is recommended to use the upper limit of this interval for the redundancy design of the absorption facilities to enhance the robustness of the decision. This study provides a theoretical basis and technical support for the governmental supervision of decoration waste during the development of national urban agglomerations, effectively solves regional urban planning and construction management problems, and promotes the sustainable development of the construction industry.

1. Introduction

In recent years, with the acceleration of the urbanization process in China, buildings in major cities are facing decoration, renovation, and so on. The amount of decoration waste is increasing day by day, and the ensuing problem of regulating decoration waste is gradually attracting people’s attention [1]. According to statistics, the world’s average annual production of construction waste has exceeded 8 billion tons [2]; only China produces no less than 3.5 billion tons per year [3], of which decoration waste accounts for about 13%, and the proportion is on the rise, causing serious damage to the ecological environment, and hindering the rapid development of urban economy [4,5,6]. Decoration waste has a complex composition, containing a large amount of toxic and hazardous substances, and the technology of resource disposal is still backward, with the utilization rate of renewable resources being less than 5% [7,8]. The lack of end-of-pipe disposal technology has resulted in a landfill rate of 83 per cent, with open piles dominating, which not only occupies a large amount of land resources, but also causes serious environmental pollution and even jeopardizes the physical and mental health of human beings, as well as posing a major threat to the sustainable development of society [9,10,11].
With the advancement of globalization and informatization, urban agglomerations have become the highest form of spatial organization, and specific geographical scopes show obvious regional characteristics [12]. Henan Province, as an important birthplace of the Chinese nation and Chinese civilization, has a resident population of 98.72 million. Currently, Henan Province is in a critical period of rapid development and urbanization, and the decoration of old urban areas, urban villages and shantytowns has resulted in the generation of a large amount of decoration waste, with the main problem being how to properly dispose of and manage it [13,14]. Throughout the various regions of the country, problems such as chaotic management of decoration waste, failure to control it at source, and the lack of standardized waste disposal sites still exist [15,16,17]. Therefore, the use of multidisciplinary means to predict and identify the amount of decoration waste generated, in order to do the source control to provide data support, is an important element of urban planning and construction management, and an important condition for resource conservation, environmental friendliness, social harmony and sustainable development; thus, this study has theoretical significance and practical significance.
With the promotion of the establishment of a “waste-free city”, China has increased environmental protection efforts to handle garbage in a timely manner to cover the “dust net” and do a good job of dust control [18,19]. Since much decoration waste ends up in landfills or unregulated sites, this greatly increases the difficulty of automatic identification and change detection from remote sensing imagery. The result is that information on the area and volume of decoration waste is slow to be obtained, and the problem of measuring the waste to be disposed of cannot be effectively solved [20,21,22]. To date, many scholars have launched research on garbage dumps to realize the rapid detection of the location of the dumps and to grasp the change information of the dumps [23,24,25]. As early as 1988, Bagheri et al. had begun to use aerial remote sensing data to identify landfills in New Jersey. With the continuous development of deep learning in the construction industry, a new research direction has been generated by utilizing the characteristics of high-resolution remote sensing image data with high positioning accuracy, high radiometric accuracy, and high resolution, combined with semantic segmentation technology [26,27]. Zhang Xingqiong [28] utilized the remote sensing data of GF-2 in Wuhou District to effectively extract specific information about the storage of garbage in the study area, with a recognition accuracy of 66.23% [29,30]. Therefore, the study of identification and control of decoration waste based on GF-2 remote sensing images not only helps to save land resources, but also accurately obtains effective information about decoration waste and provides significant technical advantages for real-time supervision of decoration waste.
Decoration waste generation forecasting is a prerequisite for the implementation of waste management strategies and is closely related to landfill spatial planning [31,32] and waste management policy development [33,34]. The current research on solid waste generation prediction models mainly includes multiple regression analysis [35,36], gray prediction models [37,38], and BP neural network models [39,40,41]. D. Fatta et al. estimated the generation by analyzing the characteristics of the sources of construction waste in Greece, using the method of multiplying the construction area of a house by a unit waste production factor, and proposed reduction measures and management recommendations [42]. Lu used a gray prediction model to successfully estimate the amount of construction waste generated in the Greater Bay Area of China, but this model is only applicable to the case of exponential growth in the amount of generation [43]. The BP neural network, on the other hand, is highly self-learning and self-adaptive, and can realize the processing of complex data to obtain the desired data, which has great application scope for the research of decoration waste prediction.
The research subject is construction waste, with Henan Province, characterized by high population density and significant urbanization, as the case study. Based on GF-2 remote sensing images, the area occupied by decoration waste piles is calculated and statistically analyzed. A BP neural network model is used to predict the trend of decoration waste generation. ArcGIS is used to visualize the distribution characteristics of waste generation in different regions, and the proportion of waste generation in each city is calculated. The goal is to develop a precise management system for construction waste that incorporates regional characteristics, ranging from spatial distribution identification to volume trend forecasting, through the integration of “air–ground” data and the application of intelligent algorithms. The research findings will provide a scientific basis for local governments to optimize the selection of disposal site locations and formulate dynamic regulatory policies, while also laying the groundwork for the smart management of construction waste in other urban agglomerations across the country.
Compared with existing research, the innovations and contributions of this study are primarily reflected in the following three aspects: At the methodological integration level, a comprehensive technical framework comprising “GF-2 remote sensing spatial identification–BP neural network time-series forecasting–GIS spatiotemporal feature analysis” has been established, addressing the shortcomings of single-technology approaches that previously failed to integrate spatial localization with trend forecasting in the regulation of construction waste. To quantify uncertainty, we have introduced the Bootstrap resampling method, which provides confidence intervals and risk boundaries for the prediction results, thereby enhancing the robustness of control and management decisions. At the regional level, this study is the first to systematically reveal the spatiotemporal distribution patterns and driving mechanisms of construction and renovation waste generation at the provincial level; the differentiated management strategies proposed provide a transferable model for similar regions. Although this study uses Henan Province as a case study, its methodological framework offers universal reference value for the precise management of construction waste in urban agglomerations across the country.

2. Materials and Methods

2.1. Data Collection

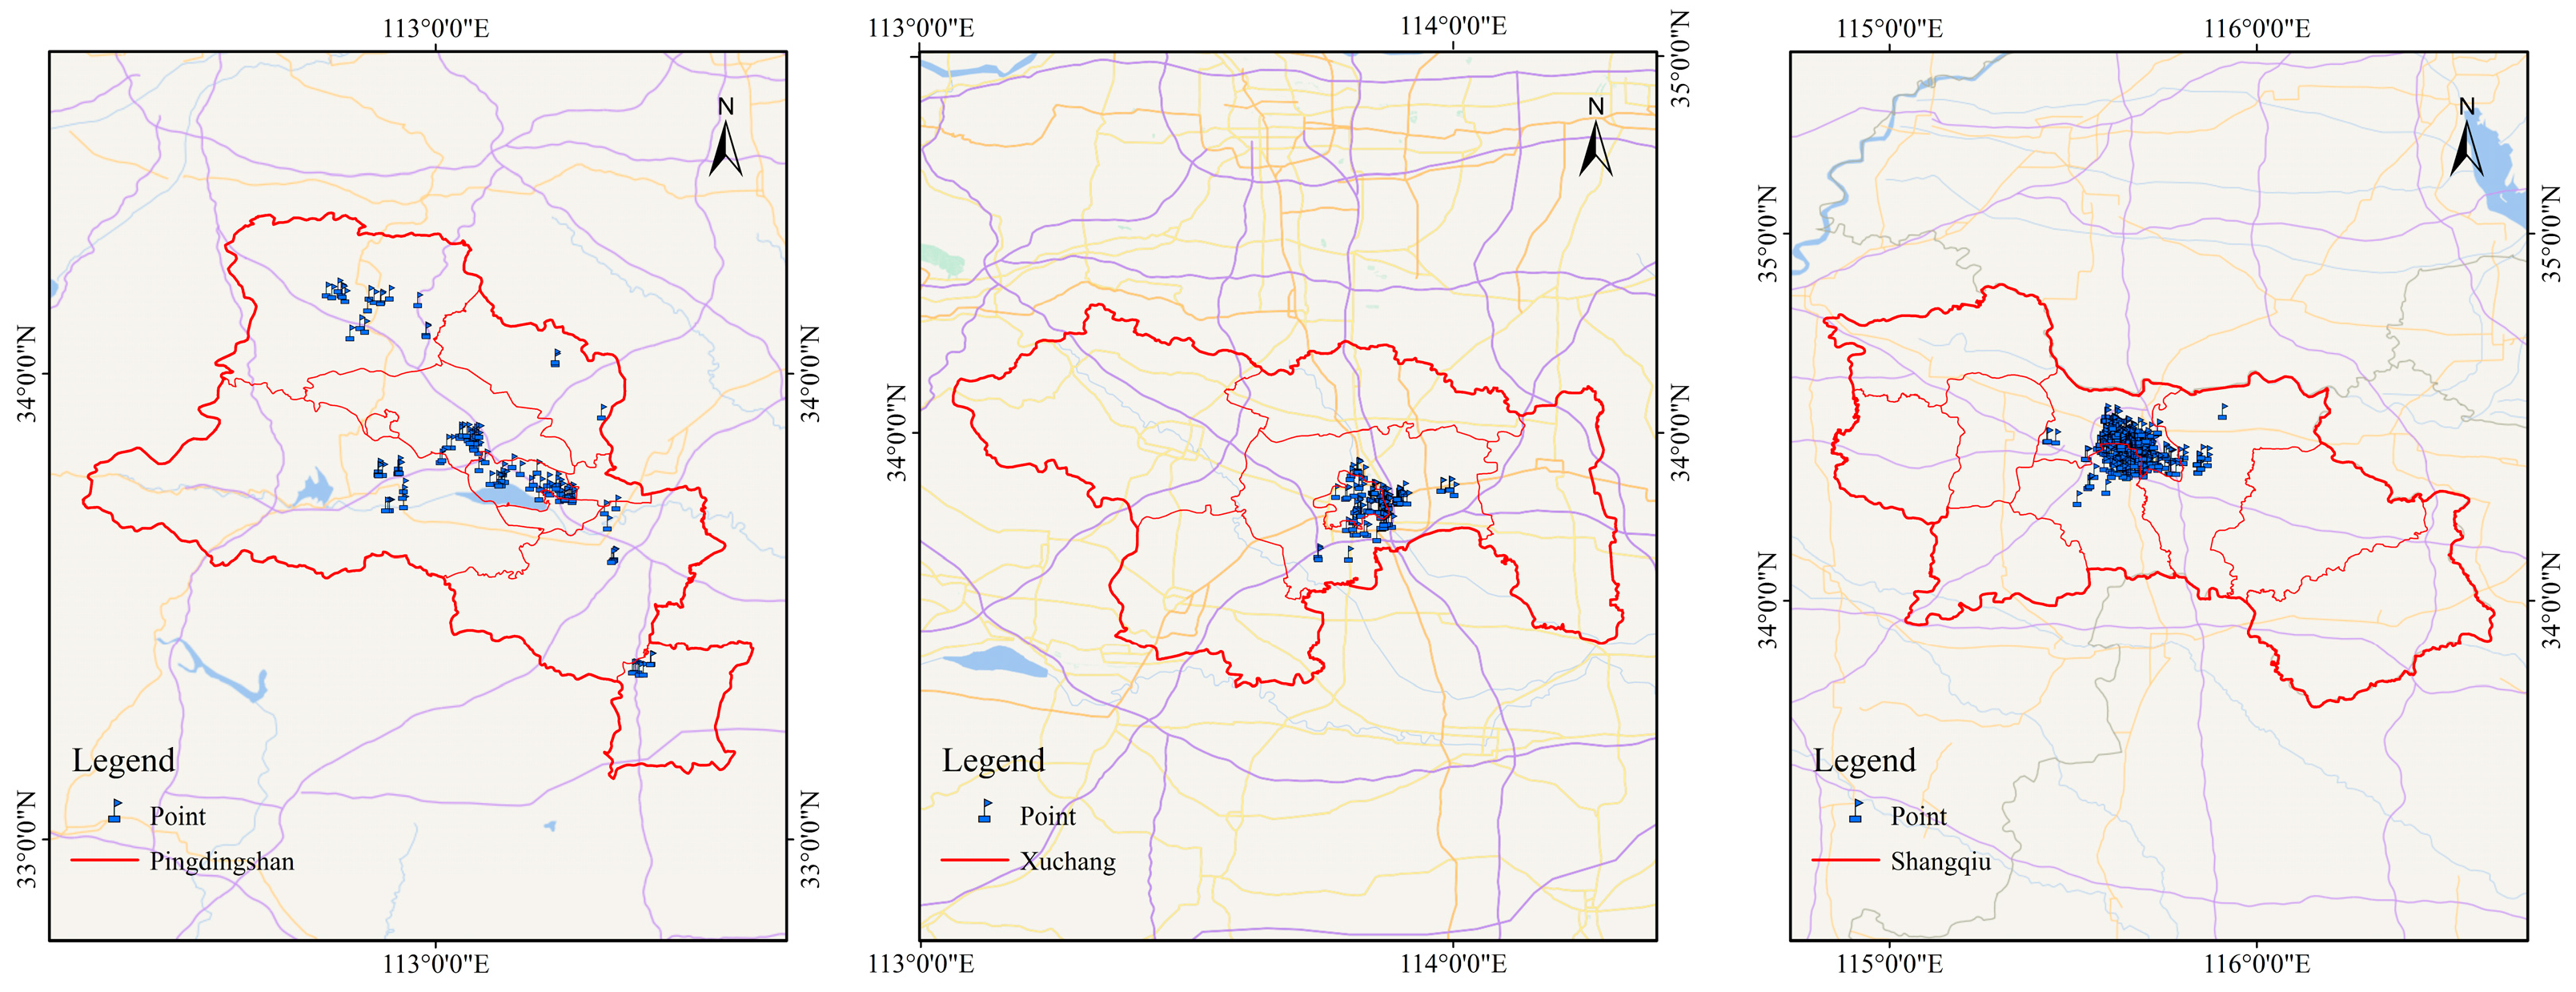
The study area, Henan Province, is located in the middle and lower reaches of the Yellow River (31°23′–36°22′ N and 110°21′–116°39′ E) in the central-eastern part of China and the southern part of the North China Plain, according to the principle of uniform grid placement. The total area of the province is 165,700 km2, accounting for 1.73% of the country’s total area. The GF-2 remote sensing image study data was imaged in 2021, in which a total of 102 construction waste dumps were monitored in Pingdingshan City, 149 construction waste dumps were monitored in Xuchang City, and 310 construction waste dumps were monitored in Shangqiu City, as shown in Figure 1.

2.2. GF-2 Remote Sensing Interpretation

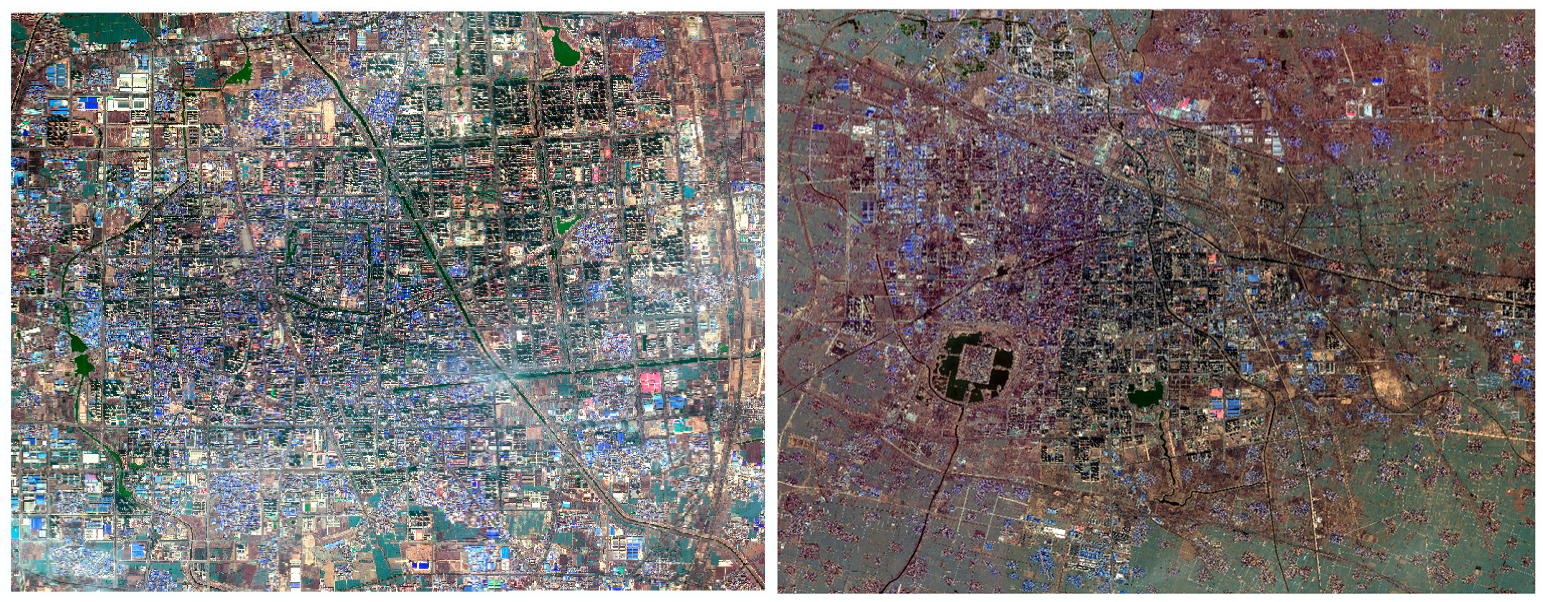
The image preprocessing mainly includes ortho-correction, radiometric calibration, atmospheric correction, geometric fine correction, image fusion, image cropping, etc. The data preprocessing is mainly accomplished using ENVI 5.7 software [44,45]. The pre-processed GF-2 image is shown in Figure 2.
Using multi-temporal GF-2 remote sensing images and the GIS software ArcGIS 10.7, the spatial distribution of construction waste in the study area was extracted through a combination of manual visual interpretation and machine learning recognition, and the construction waste footprint was calculated and counted. The image classification uses the Random Forest algorithm, with texture features derived from the fusion of the blue, green, red, and near-infrared multispectral bands and the panchromatic band of GF-2 imagery serving as input features [46]. To quantitatively assess the accuracy of the GF-2 remote sensing image classification results, 500 validation plots were randomly selected within the study area. By comparing field survey records with high-resolution historical Google Earth imagery from the same period, the model achieved an overall accuracy of 89.40%, a Kappa coefficient of 0.753, and an F1 score of 0.828. The data quality is sufficient to support subsequent area estimation and yield prediction analyses.
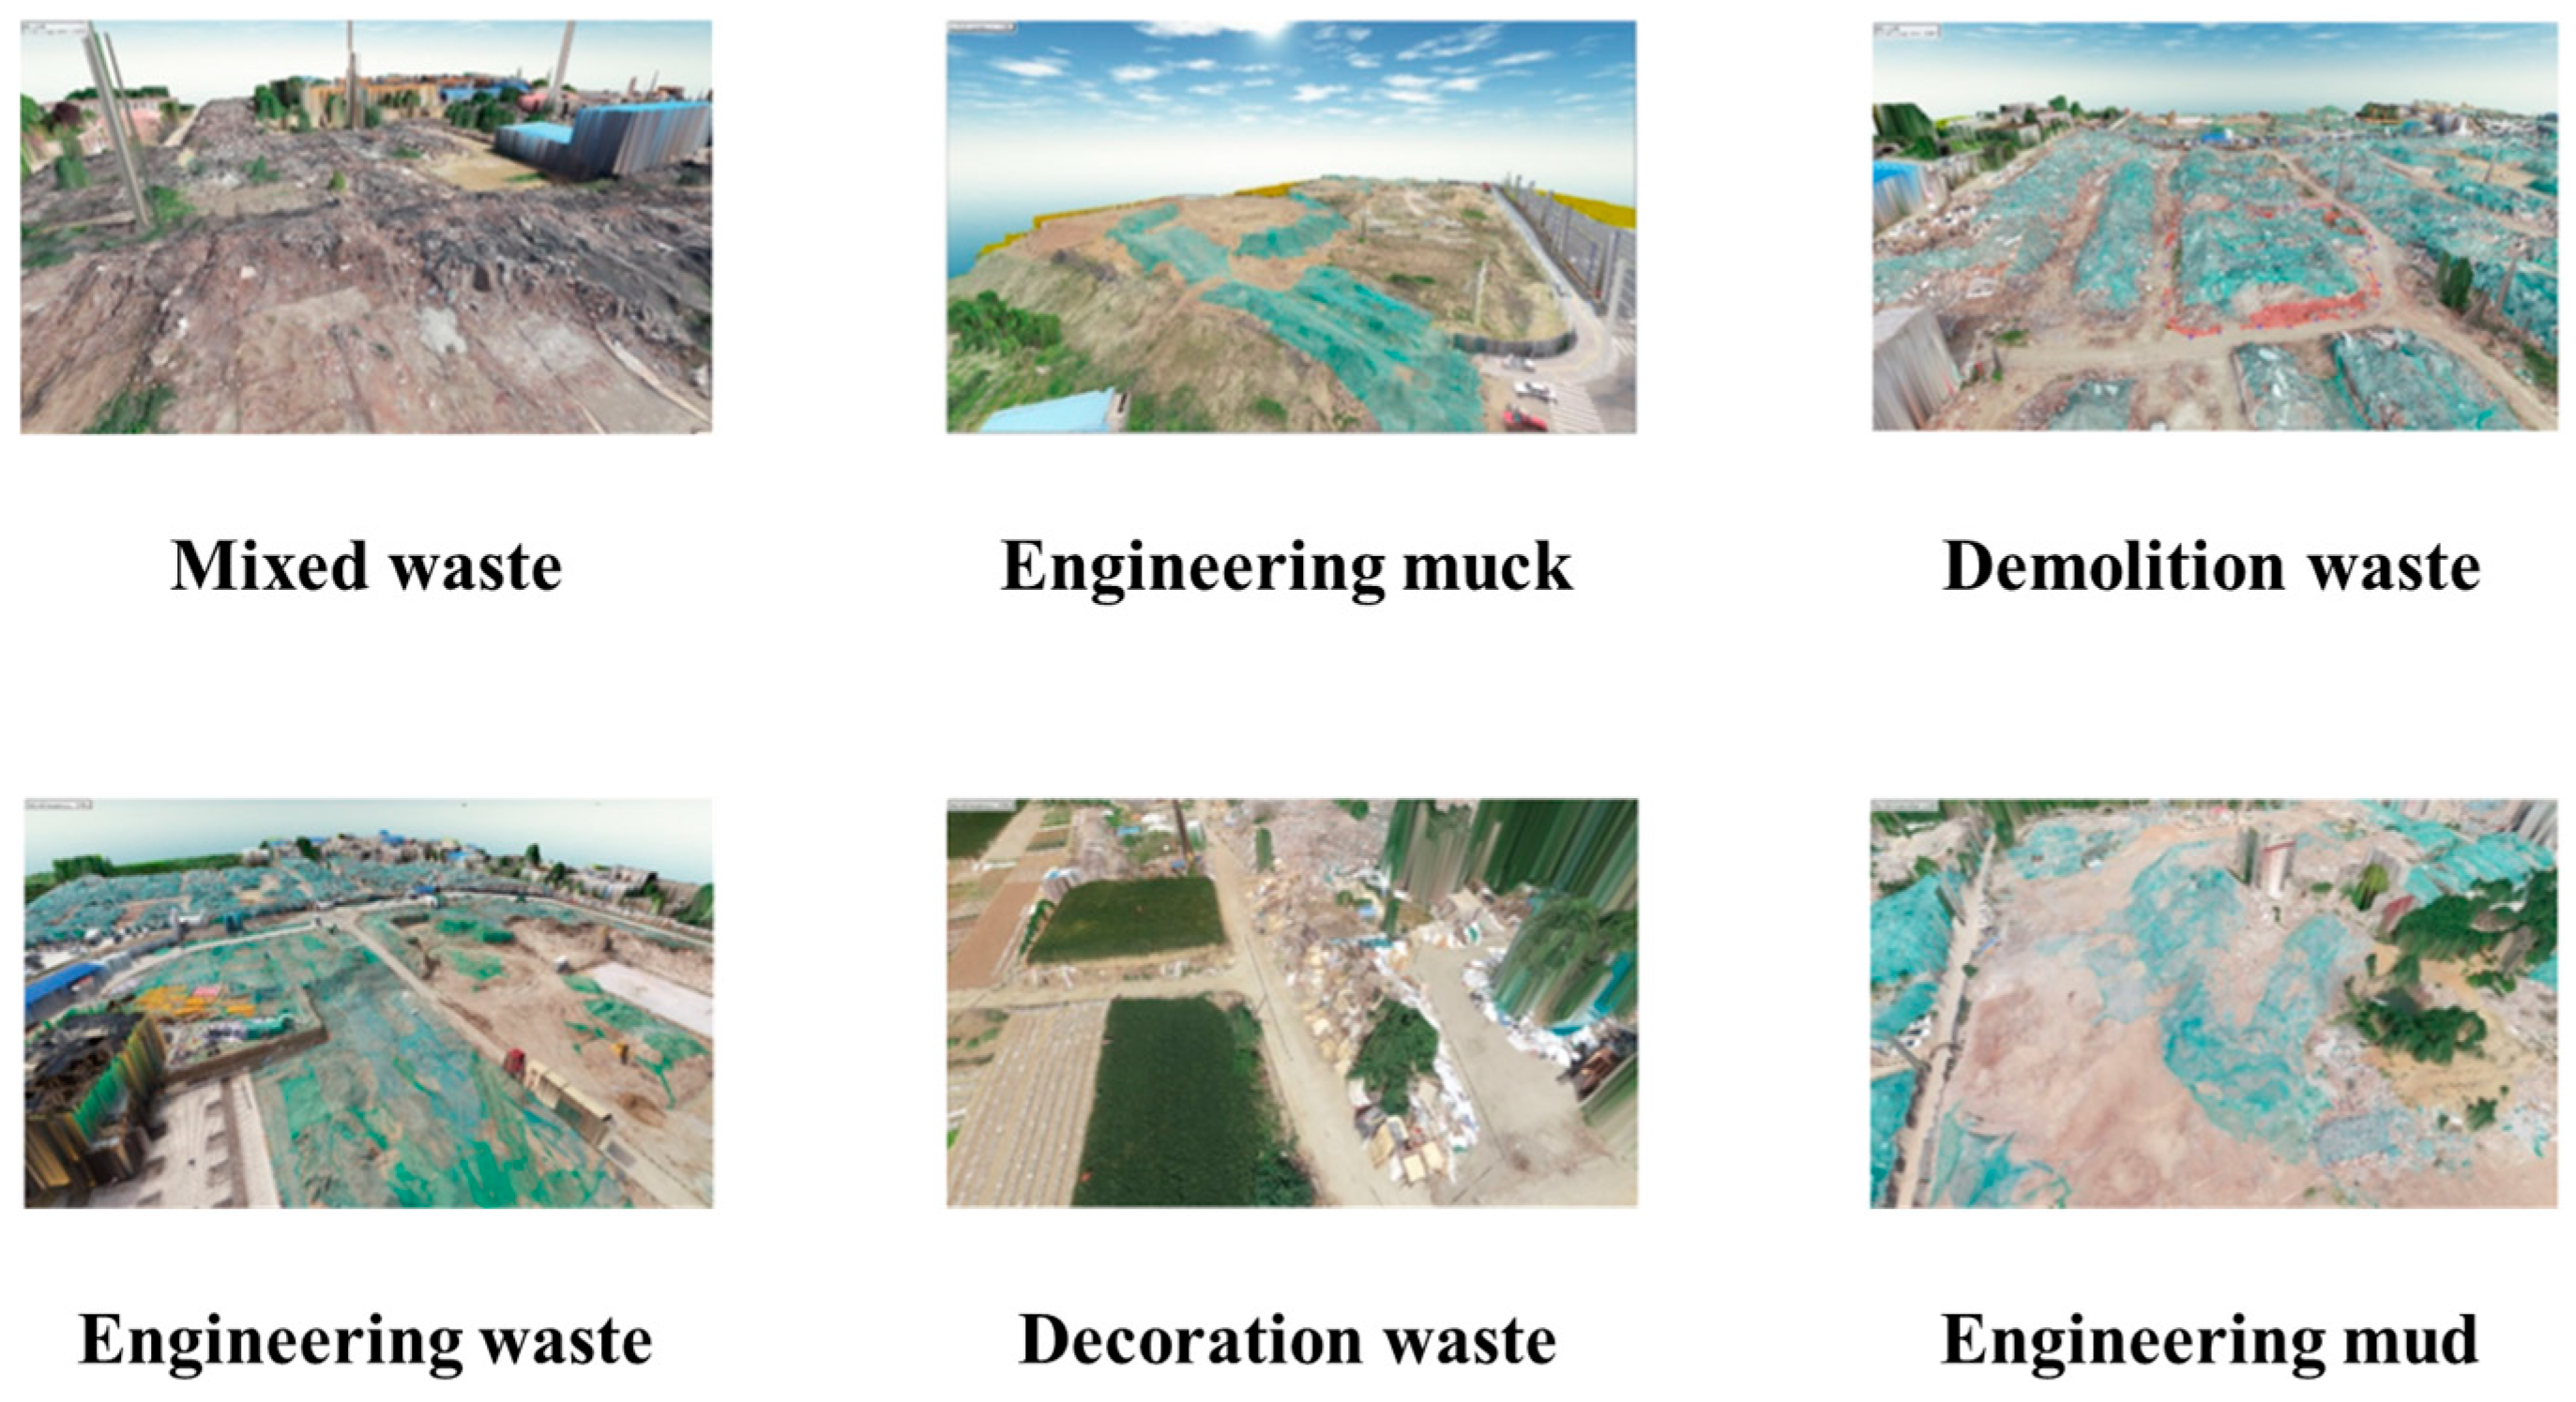
Based on the classification of the Ministry of Housing and Construction and field research, construction waste in the study area was classified as mixed waste, engineering muck, demolition waste, engineering waste, decoration waste, and engineering mud, as shown in Figure 3. Mixed waste exhibits complex spectral responses and coarse textures; construction debris and slurry have uniform reflectance and well-defined boundaries; demolition waste contains fragments of brick/concrete and has a chaotic texture; renovation waste is typically distributed in small, scattered patches and is often covered by dust-proof netting [47].

2.3. BP Neural Network Model

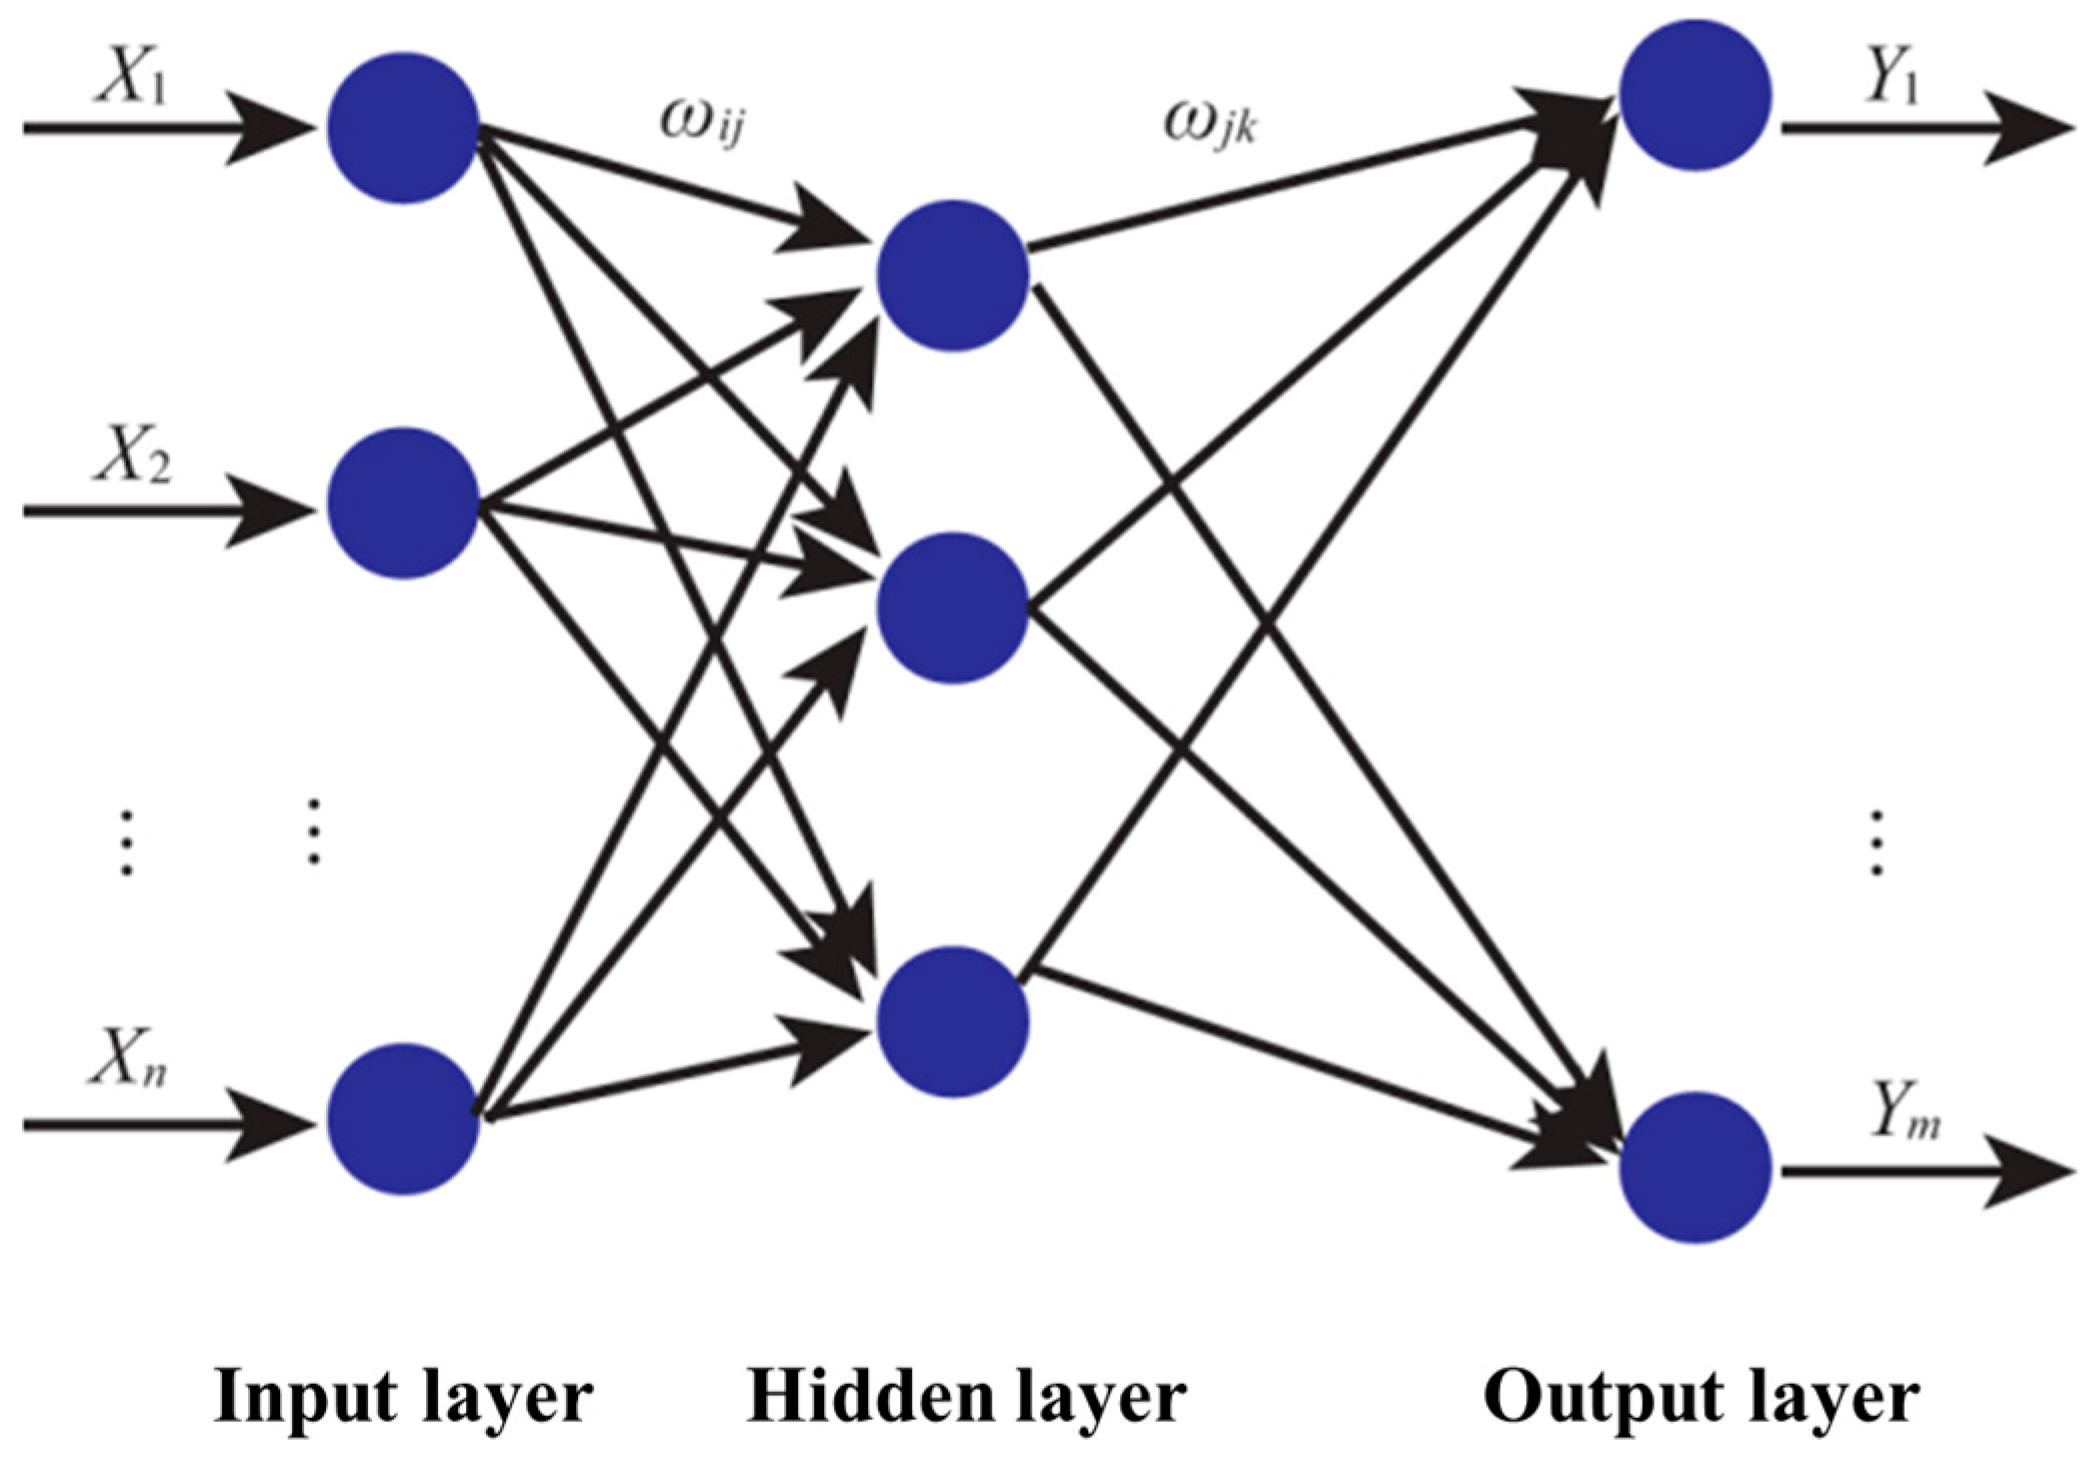
The BP neural network is a multilayer neural network with error back propagation, which consists of an input layer, an implicit layer, and an output layer [48]. The topology of the BP neural network is shown in Figure 4 [49]. The annual generation of decoration waste is usually affected by the cumulative effect of the historical completion area of the house, and there is usually a certain lag. By comparing the root mean square error of BP neural network predictions under different input window lengths, the results show that the minimum test set error is achieved when the window length is 4 years, with an RMSE of 123,400 tons. In summary, this study uses the floor area of completed housing units from the previous four years as the input variable and the volume of renovation waste generated in the fifth year as the output variable, which can be calculated based on the former. That is, we input 2006–2009 data, output 2010 data, then output 2011 data with 2007–2010 data, and so on. Therefore, the number of input layer nodes is 4, and the number of output layer nodes is 1. The selection of the number of neurons in the middle layer is very complex, with no fixed calculation formula, and is generally determined based on experience. If there are too many intermediate points and the learning time is too long, the error may not be the best. If there are too few intermediate points, the learning ability decreases and the fault tolerance is poor. The hidden layer structure was determined through trial-and-error comparison, balancing convergence efficiency and generalization performance, and achieved optimal fitting results on the validation set. Therefore, this model is designed with four hidden layers, with nodes of 4, 5, 5, and 5, respectively, when the training of goodness-of-fit results is the best.
The time series data in this study consists of 16 annual observations from 2006 to 2021, from which 13 input–output pairs were generated using the sliding window method. Given that the generation of construction waste is influenced by the nonlinear lag effects of the historical accumulation of completed floor area, traditional linear regression and ARIMA models struggle to capture its complex temporal dependencies; therefore, a BP neural network, which possesses strong nonlinear mapping capabilities, was selected [50].

2.4. Forecast of Annual Generation of Decoration Waste

The method of generating quantity per unit area is a more commonly used estimation method in the current research on the quantity of construction waste generated, and according to the relevant provisions in the Technical Standard for Construction Waste Disposal (CJJ/T 134-2019 [51]), the quantity of various types of construction waste generated is calculated by the coefficient of waste generation per unit of the building area (CJJ/T 134-2019, 2019). Therefore, in this study, the calculation standard of “Measurement and Accounting Methods of Construction Waste in Henan Province (Provisional)” (Henan Construction Wall [2016] No.) was selected, and the annual generation of decoration waste was calculated according to 0.1 t/m2. In order to ensure the accuracy and authority of the data, the data on the area of completed housing required for the forecast is taken from the Henan Provincial Statistical Yearbook (2006–2021).

3. Results and Discussions

3.1. Interpretation and Analysis of GF-2 Remote Sensing Images

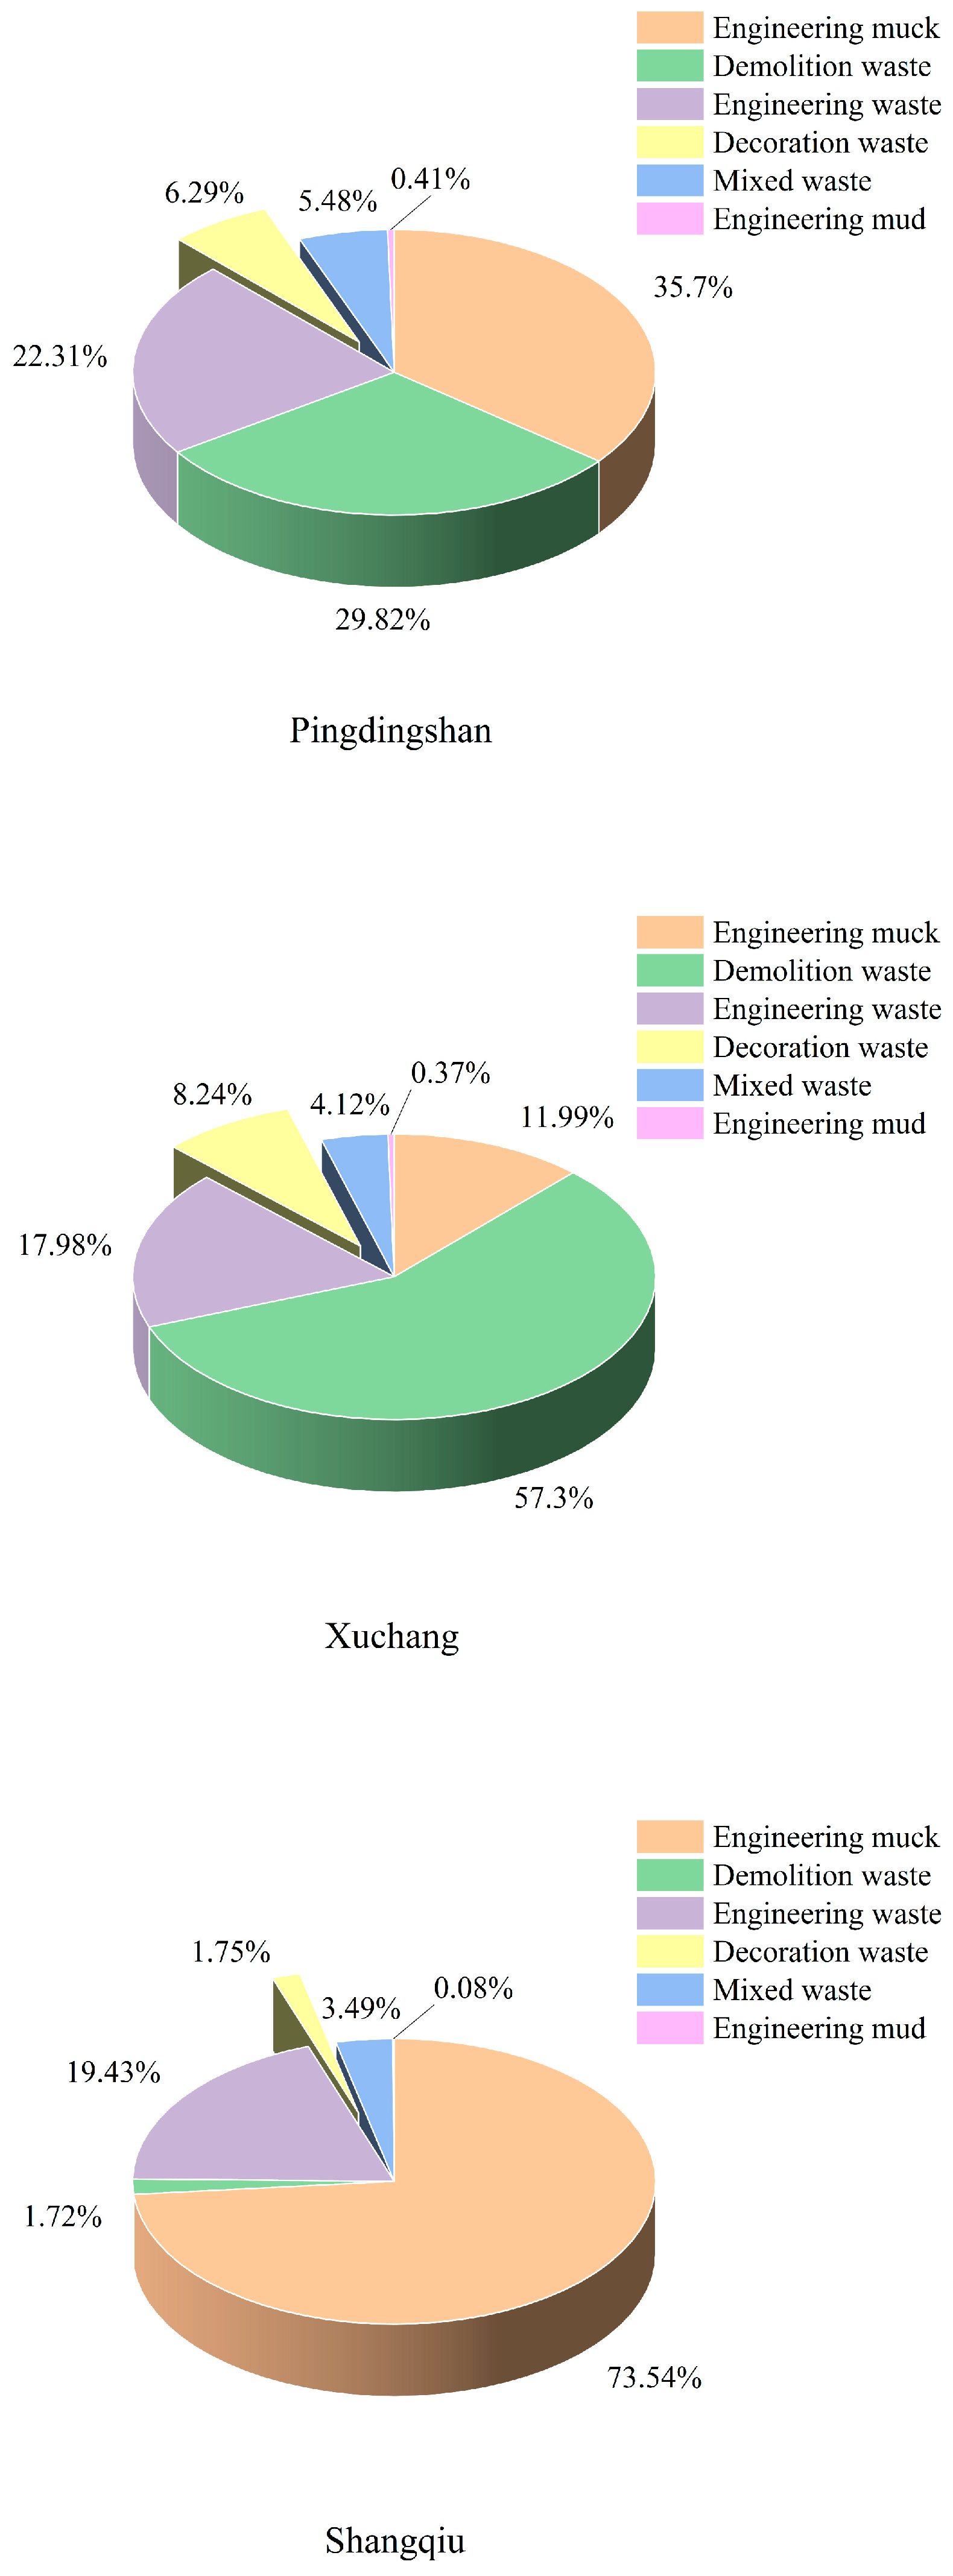
According to the situation of pre-site collection of data, the area of different types of construction waste piles was obtained through ArcGIS calculations, and the area of construction waste types and construction waste in the study area was analyzed [52], and the specific statistical results are shown in Figure 5. The total area of construction waste in the study area of Pingdingshan City is about 4.93 km2, according to the different types of construction waste statistics, of which the decoration waste pile covers an area of about 0.31 km2, accounting for 6.29%. The total area of construction waste in the Xuchang study area is about 2.67 km2, and according to the statistics of different types of construction waste, the decoration waste heap covers an area of about 0.22 km2, which accounts for 8.24% of the total area. The total area of construction waste in the study area of Shangqiu City is about 12.54 km2, according to the different types of construction waste statistics, of which the decoration waste pile covers an area of about 0.22 km2, accounting for 1.75%. In summary, as of 2021, construction waste dumps have a large share of land area and are a non-negligible part of the city’s environmental quality control. Among them, decoration waste accounted for about 10%; people’s daily life is closely related to such arbitrary piles, not only affecting the city’s appearance, such as causing soil infiltration/migration, but also affecting the surrounding surface water, leading to groundwater pollution [53,54]. Therefore, a reasonable forecast of the amount of decoration waste generated can effectively reflect the trend of changes in the next few years, which plays a crucial role in guiding both the precise control of decoration waste and the formulation of scientific management policies by the relevant government departments.

3.2. BP Neural Network Prediction Model

The construction and training of the BP neural network model are based on the MATLAB R2023a platform. In the code design, the raw data must first be normalized using the Min–Max standardization method, mapping the input and output variables linearly to the interval [0, 1]. Subsequently, the newff function is called to create the BP neural network. The maximum number of training sessions is set to 1000, the training target error rate is 0.00001, and the learning rate is 0.1. The train function is called to make a training set for 80% of the data and a test set for 20% of the data. Inverse normalization of the data after reaching the target yields predicted data [55].
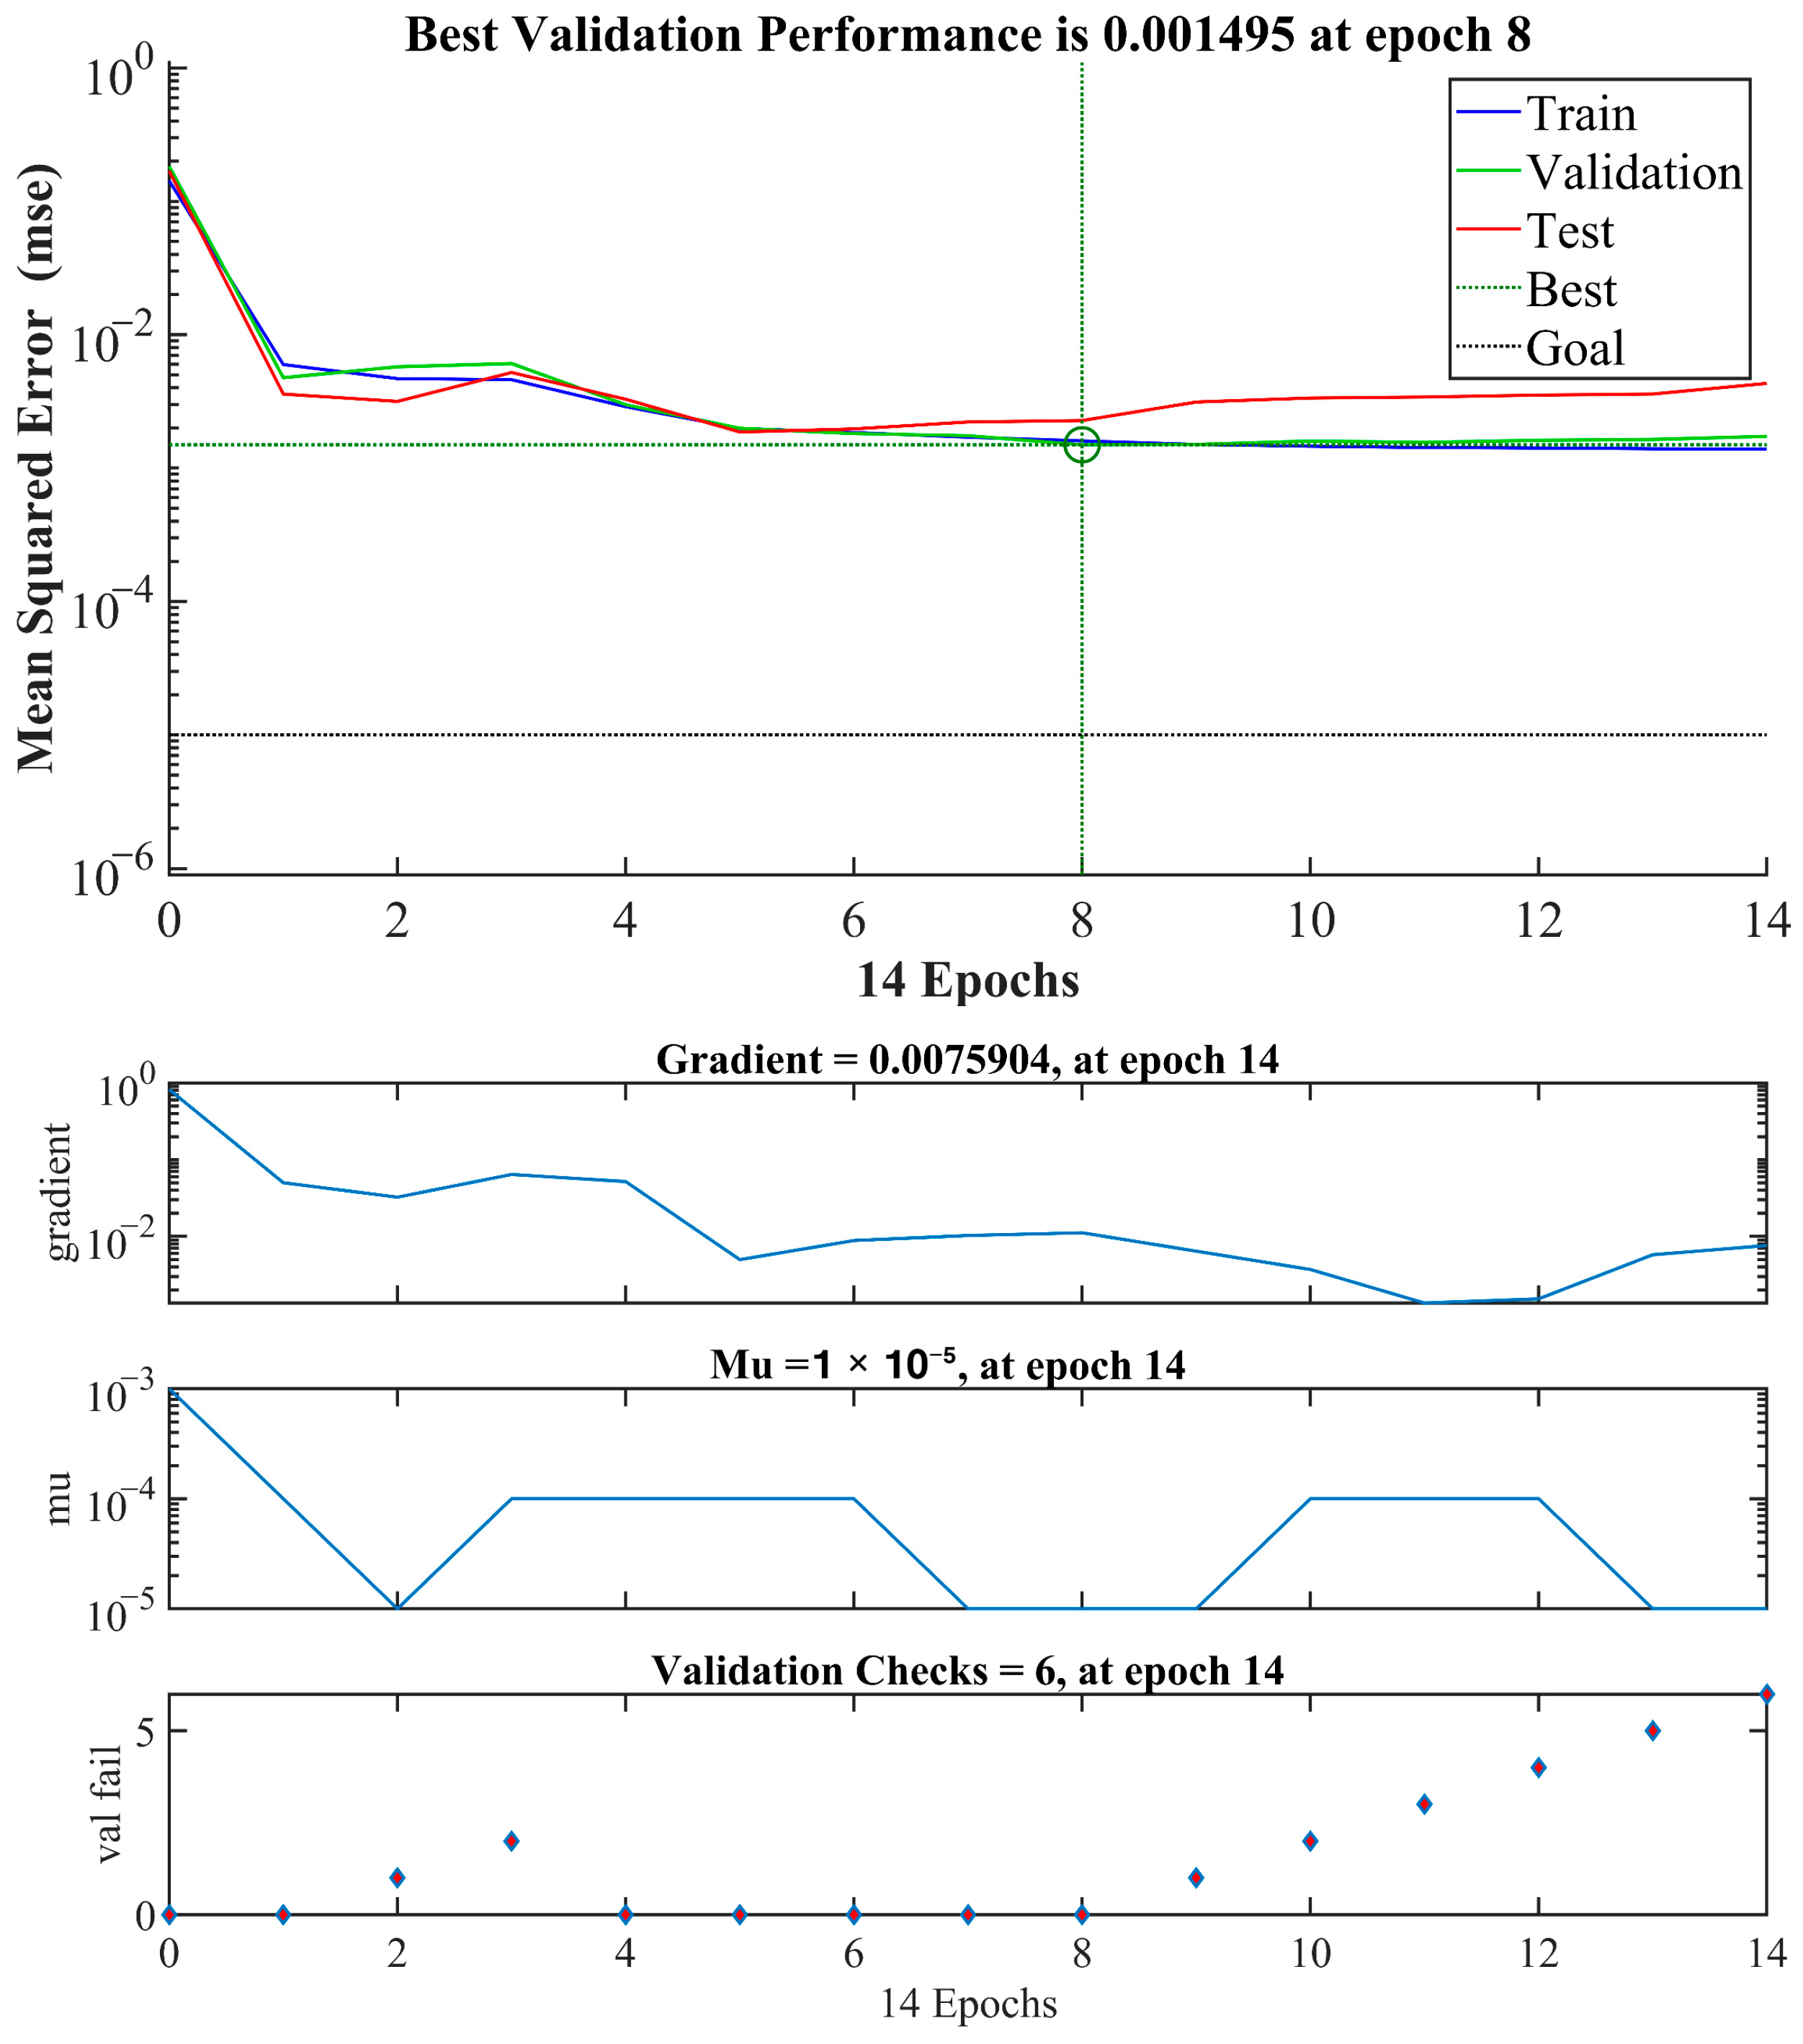
Based on the trained BP neural network, in-sample prediction of decoration waste generation in 18 cities in Henan Province from 2006 to 2021 was conducted to obtain the predicted generation value of each city from 2022 to 2030. The best validation performance of the BP model with the training state is shown in Figure 6. This study employs the gradient descent method as the training algorithm and uses MSE as the performance metric, calculated based on normalized data. The model was trained for a total of 14 rounds and the best validation performance was obtained at round 8, when the MSE was 0.001495.
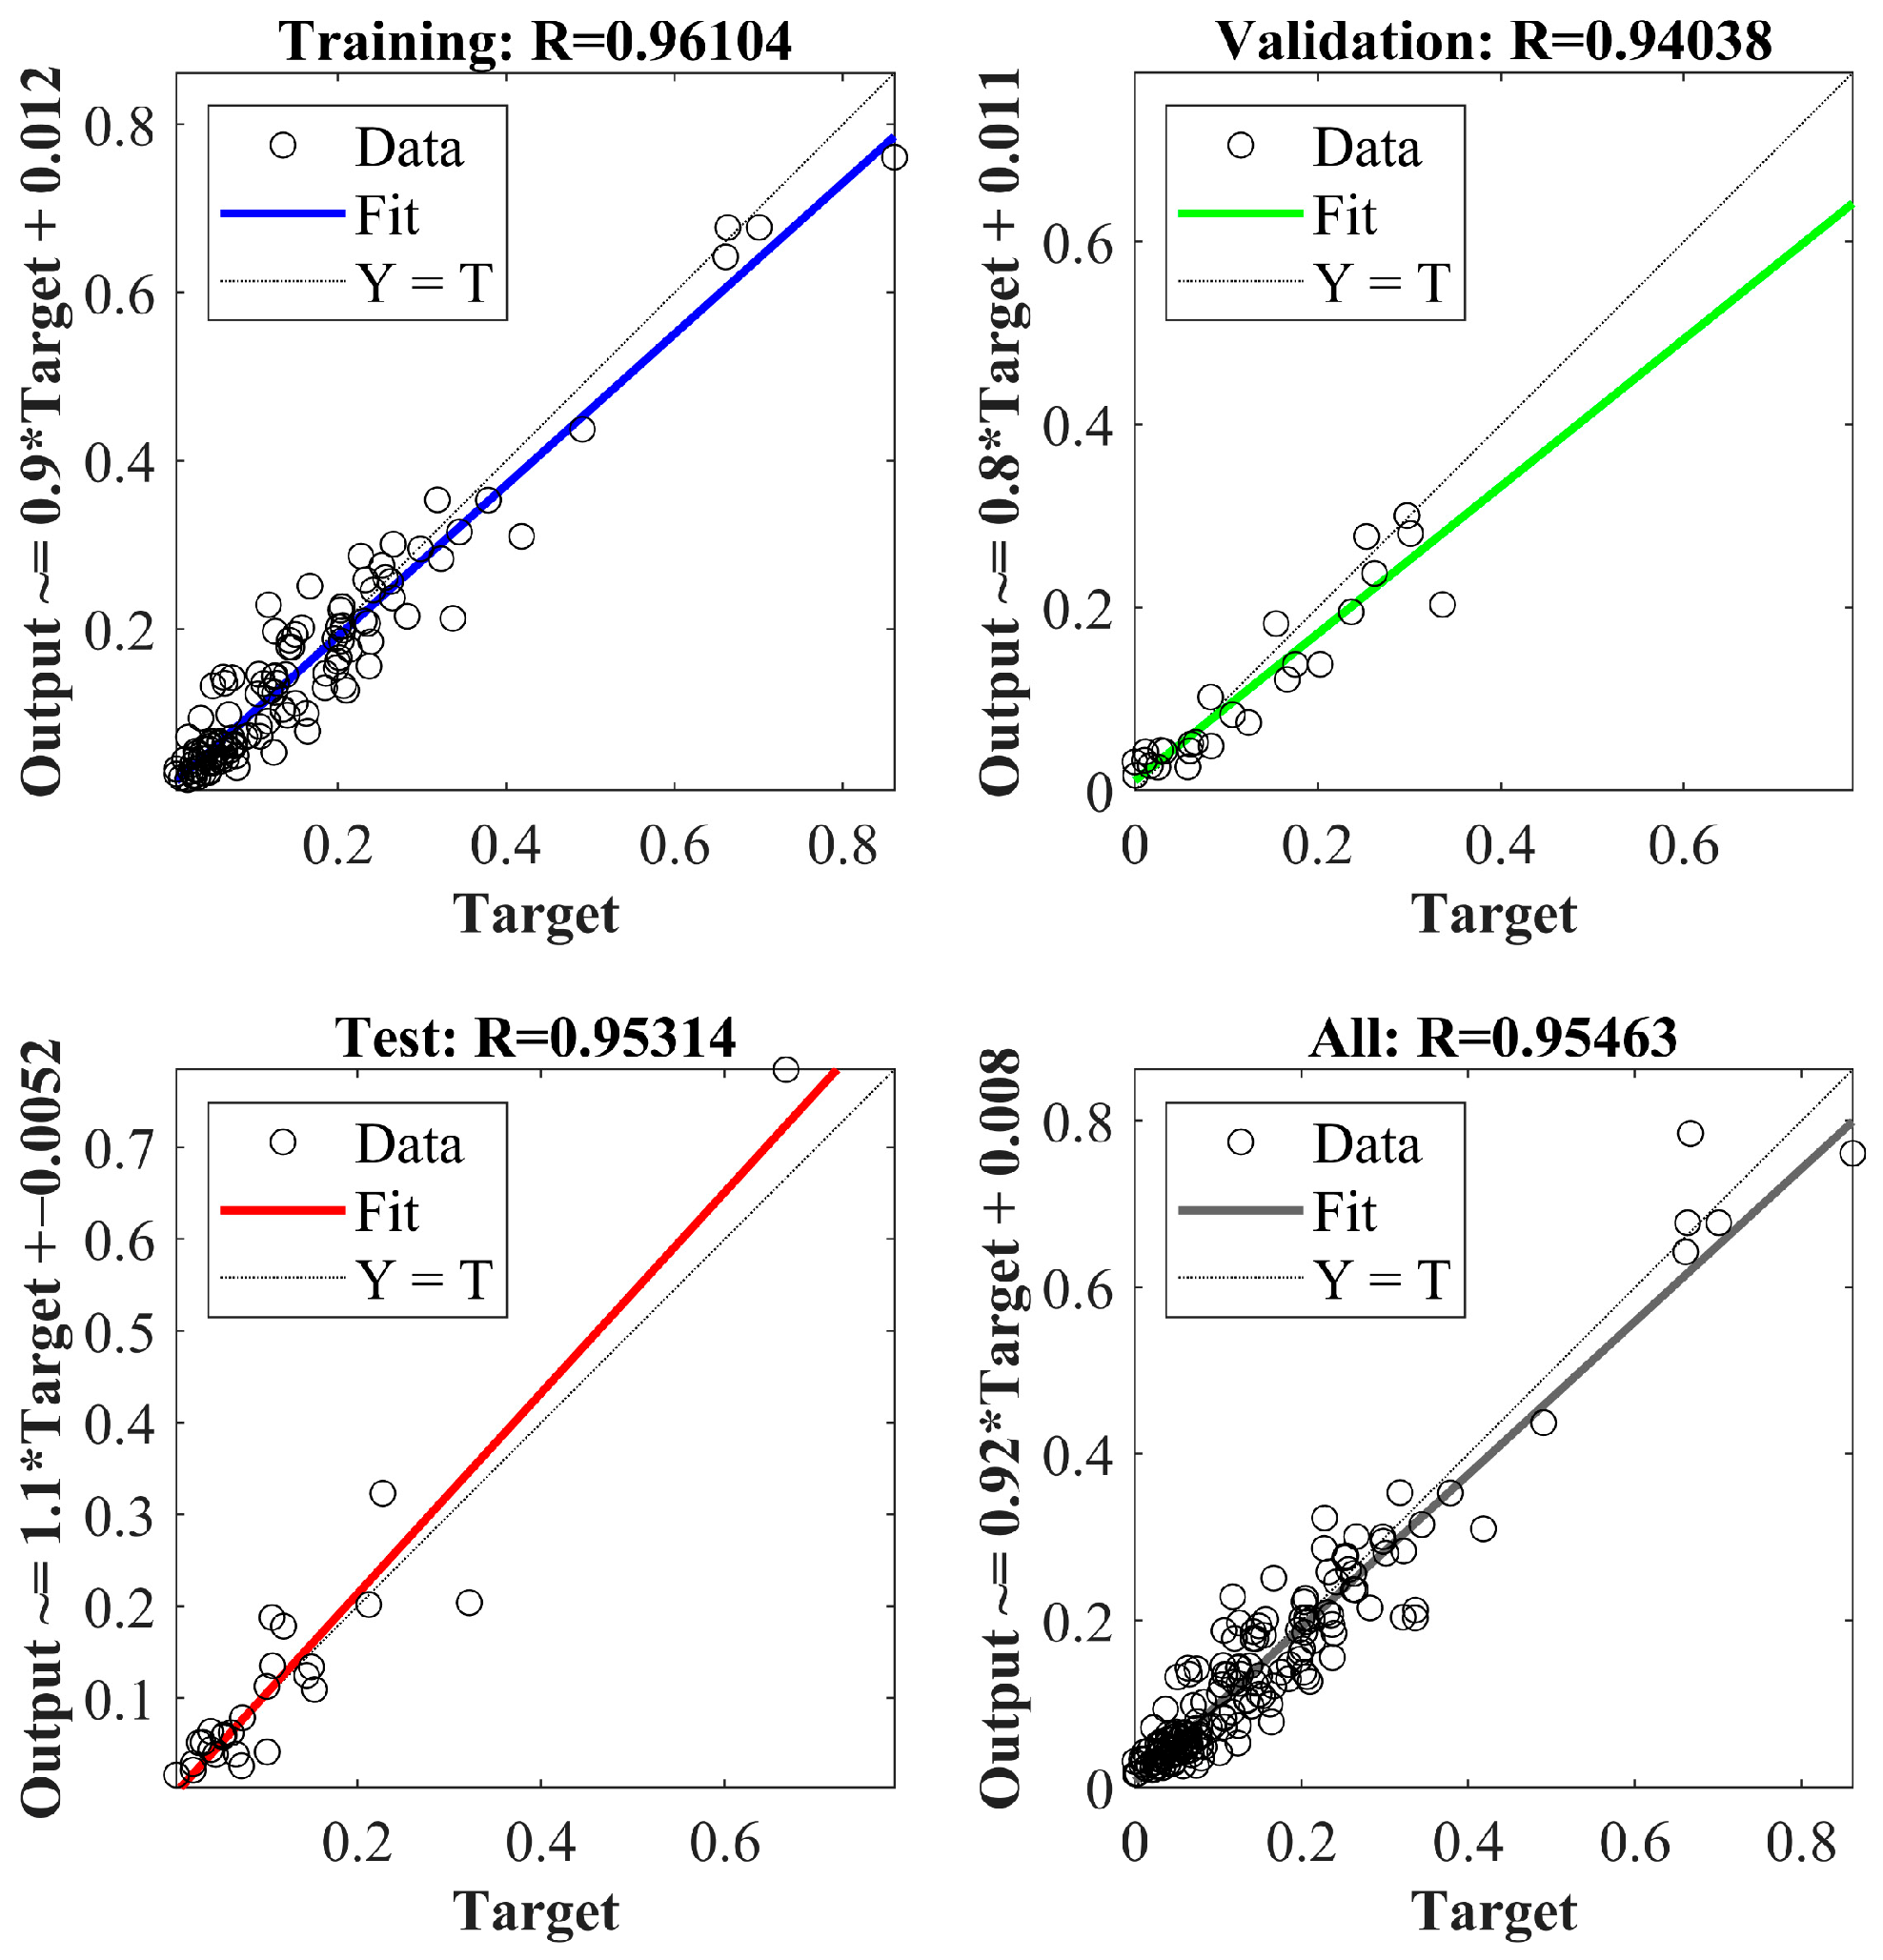
The training goodness-of-fit results are R = 0.96104 for training and R = 0.95463 for all, as shown in Figure 7. The results show that, based on the correlation coefficient R > 0.9, the model is well trained and the prediction results have high accuracy. To assess the model’s robustness, we conducted rolling tests using time-series cross-validation. The results showed that the goodness-of-fit of each validation set was consistent with the results from the full training dataset, with no significant fluctuations, thereby validating the model’s stability under limited-sample conditions.

3.3. Forecast Analysis of Annual Generation of Decoration Waste

3.3.1. Error Comparison Analysis

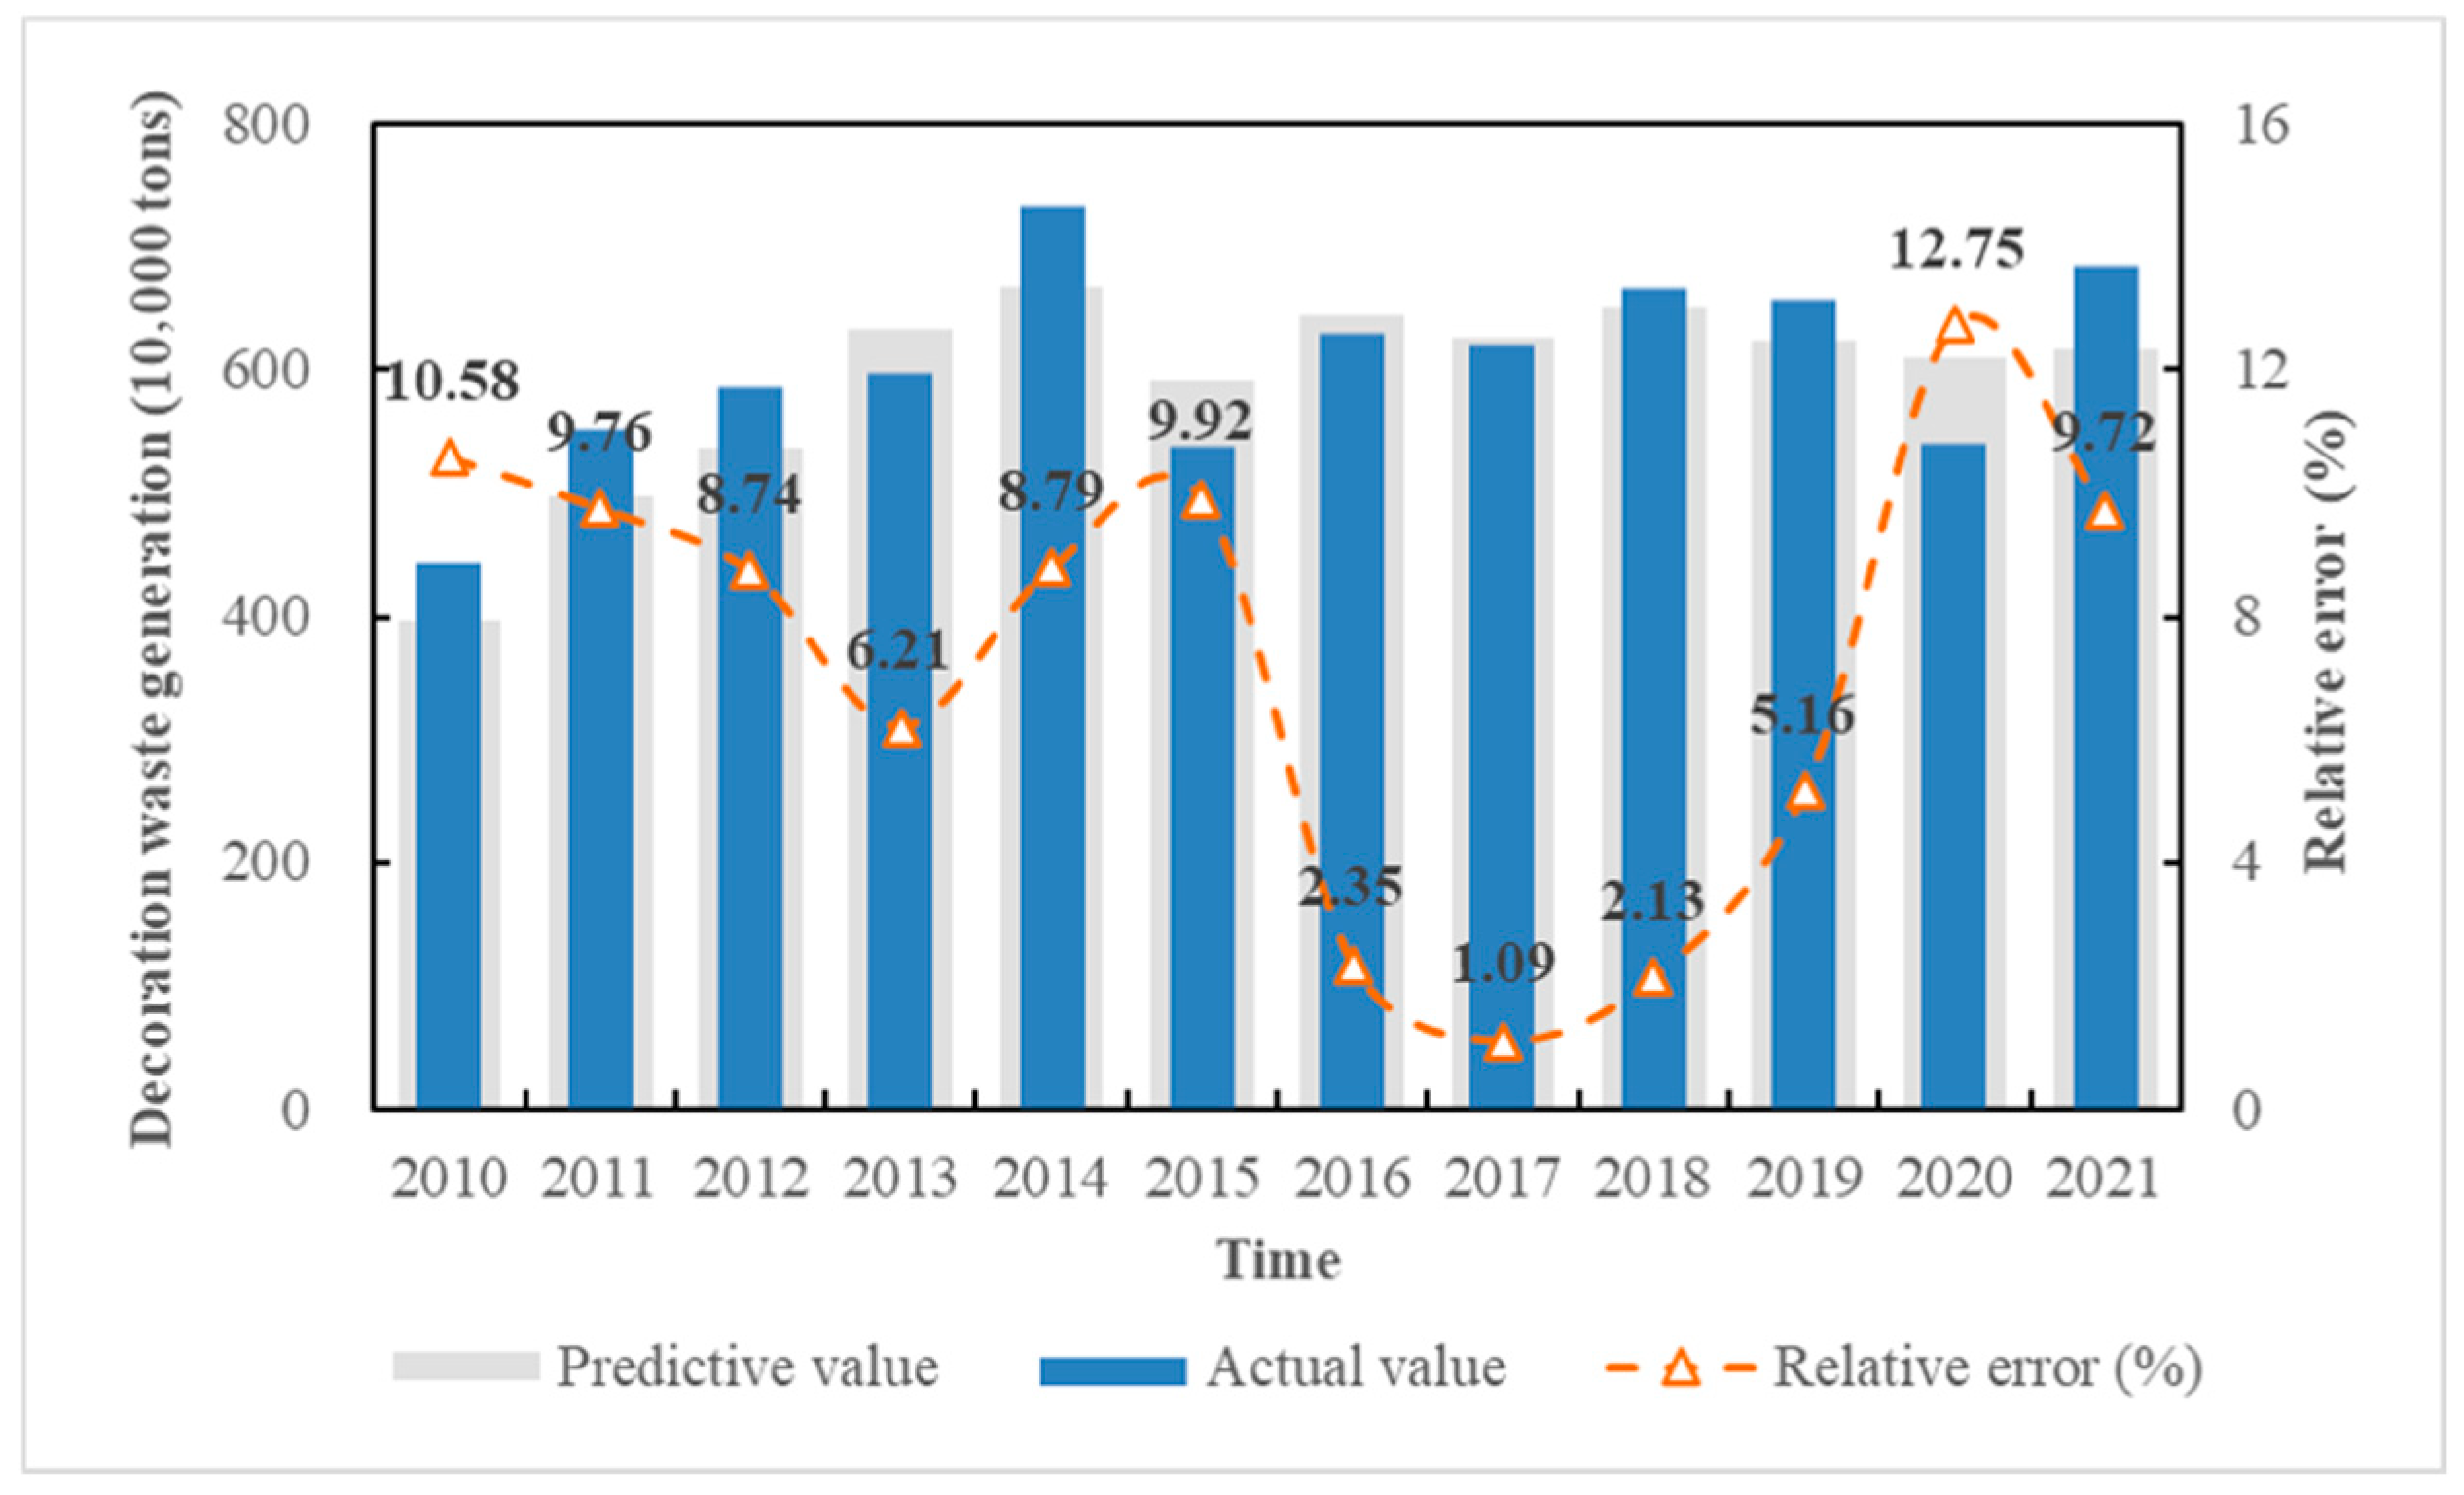
By selecting research data from 2010 to 2021 and comparing the predicted and actual annual production of decoration waste in Henan Province, it can be concluded that the trained BP model has high consistency between the predicted and actual values, with a prediction error of less than 15% and a prediction error range between 1.09% and 12.75%, as shown in Figure 8. The results indicate that this model has high prediction accuracy and can accurately predict the amount of decoration waste generated in Henan Province in the coming years, thus facilitating environmental risk assessment based on trend analysis. The prediction error in 2020 fluctuated significantly, and considering the impact of the epidemic, the development of the national real estate industry was hindered, resulting in a decrease in the completed area of houses and a decrease in the annual generation of decoration waste [56,57]. The impact of the pandemic is reflected only in an amplification of local residuals. By performing an overall fit of the time series rather than overfitting individual data points, the BP neural network avoids structural distortions in medium- to long-term trend forecasts caused by outliers. In addition to the impact of the pandemic, the forecast error is also expected to be influenced by a combination of external factors, including the lag effects of real estate regulation policies, changes in the pace of shantytown and old-neighborhood renovation projects, and adjustments to statistical definitions.

3.3.2. Forecast Trend Analysis

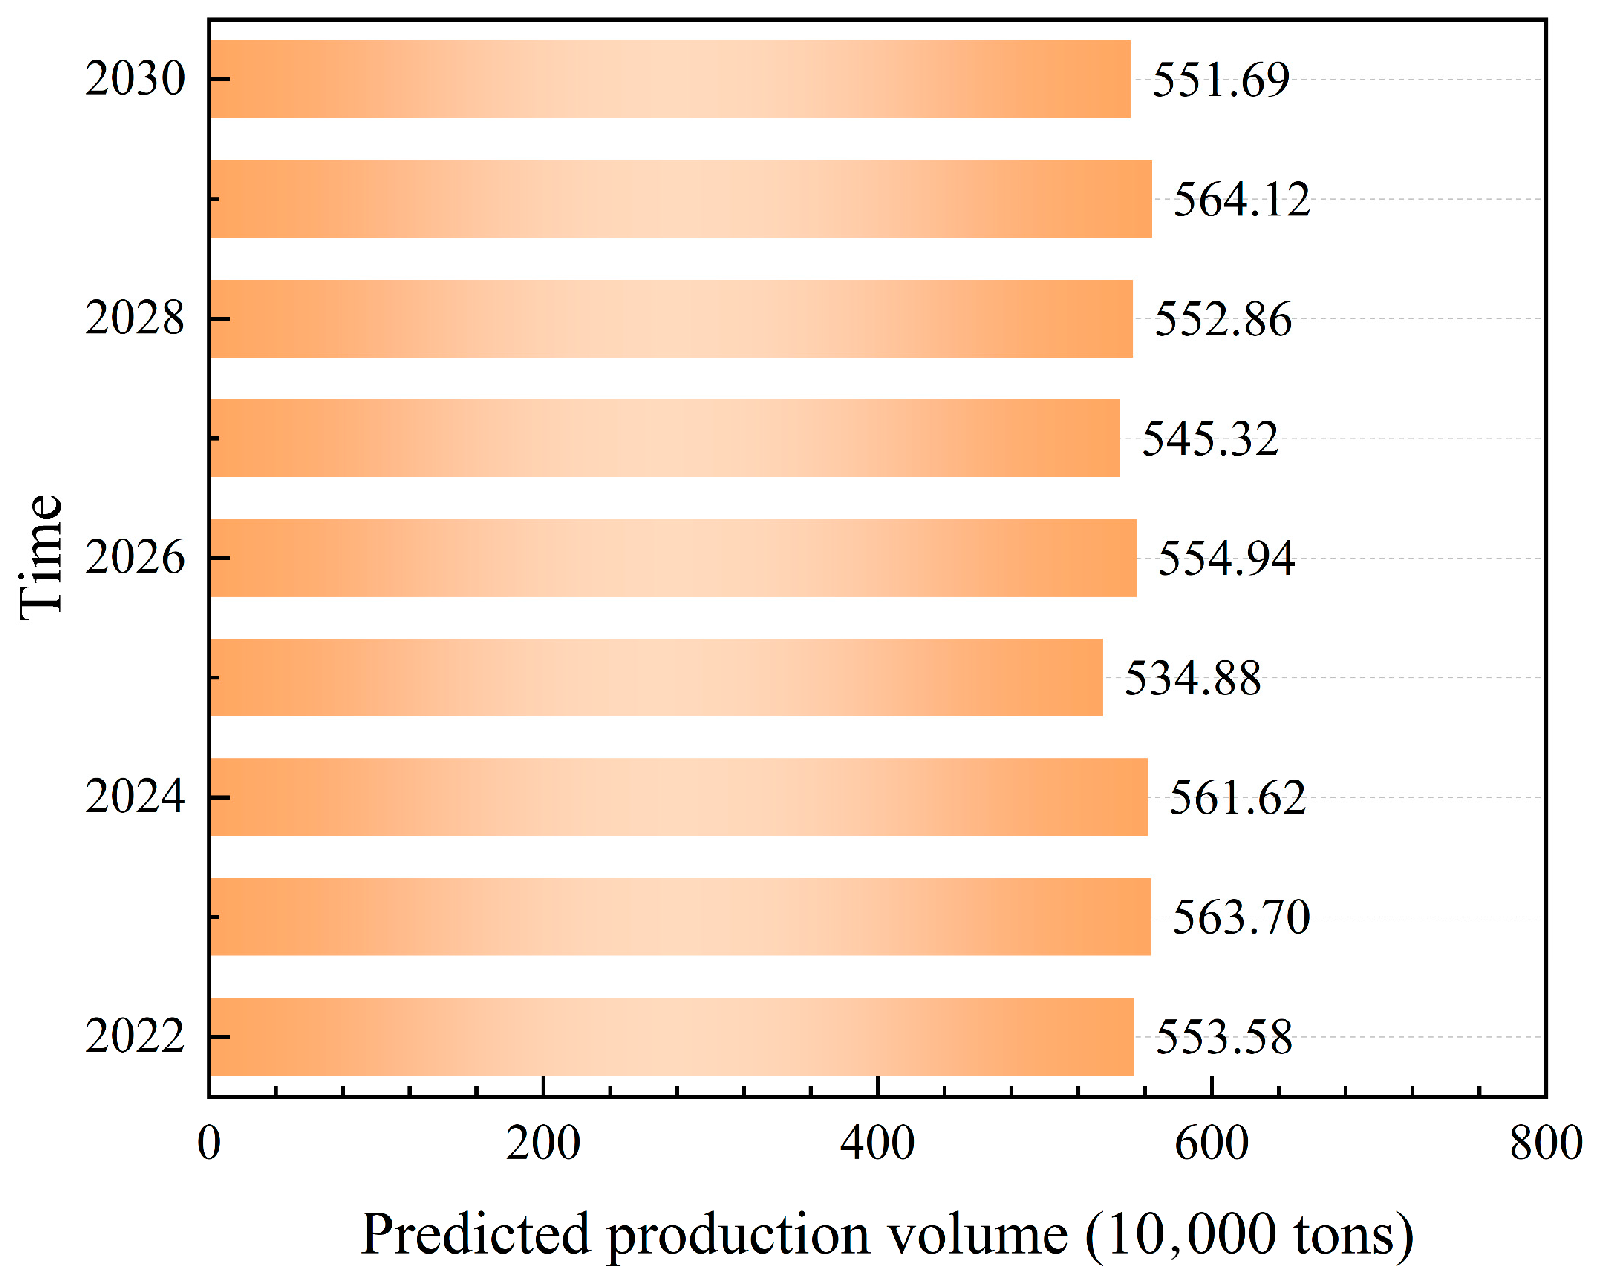
The forecast data from 2022 to 2030 were selected to obtain the forecast trend graph of the annual generation of decoration waste in Henan Province, as shown in Figure 9. Overall, compared to previous data, the annual generation of decoration waste has shown a significant downward trend since 2020, due to the impact of the epidemic. The predicted data shows that the overall production from 2022 to 2030 shows a stable state, reaching a peak in 2029 with an annual production of 5,641,200 tons. Based on the arithmetic sum of the annual generation figures for 2022–2030, it is inferred that up to 2030, the amount of decoration waste generated in Henan Province will reach 49,827,200 tons cumulatively. Therefore, although there are small fluctuations in the annual generation of decoration waste, the annual production is huge, which will undoubtedly adversely affect the daily life of residents and urban control, and the problem of environmental management cannot be ignored.

3.3.3. Characterization of Spatial and Temporal Distribution

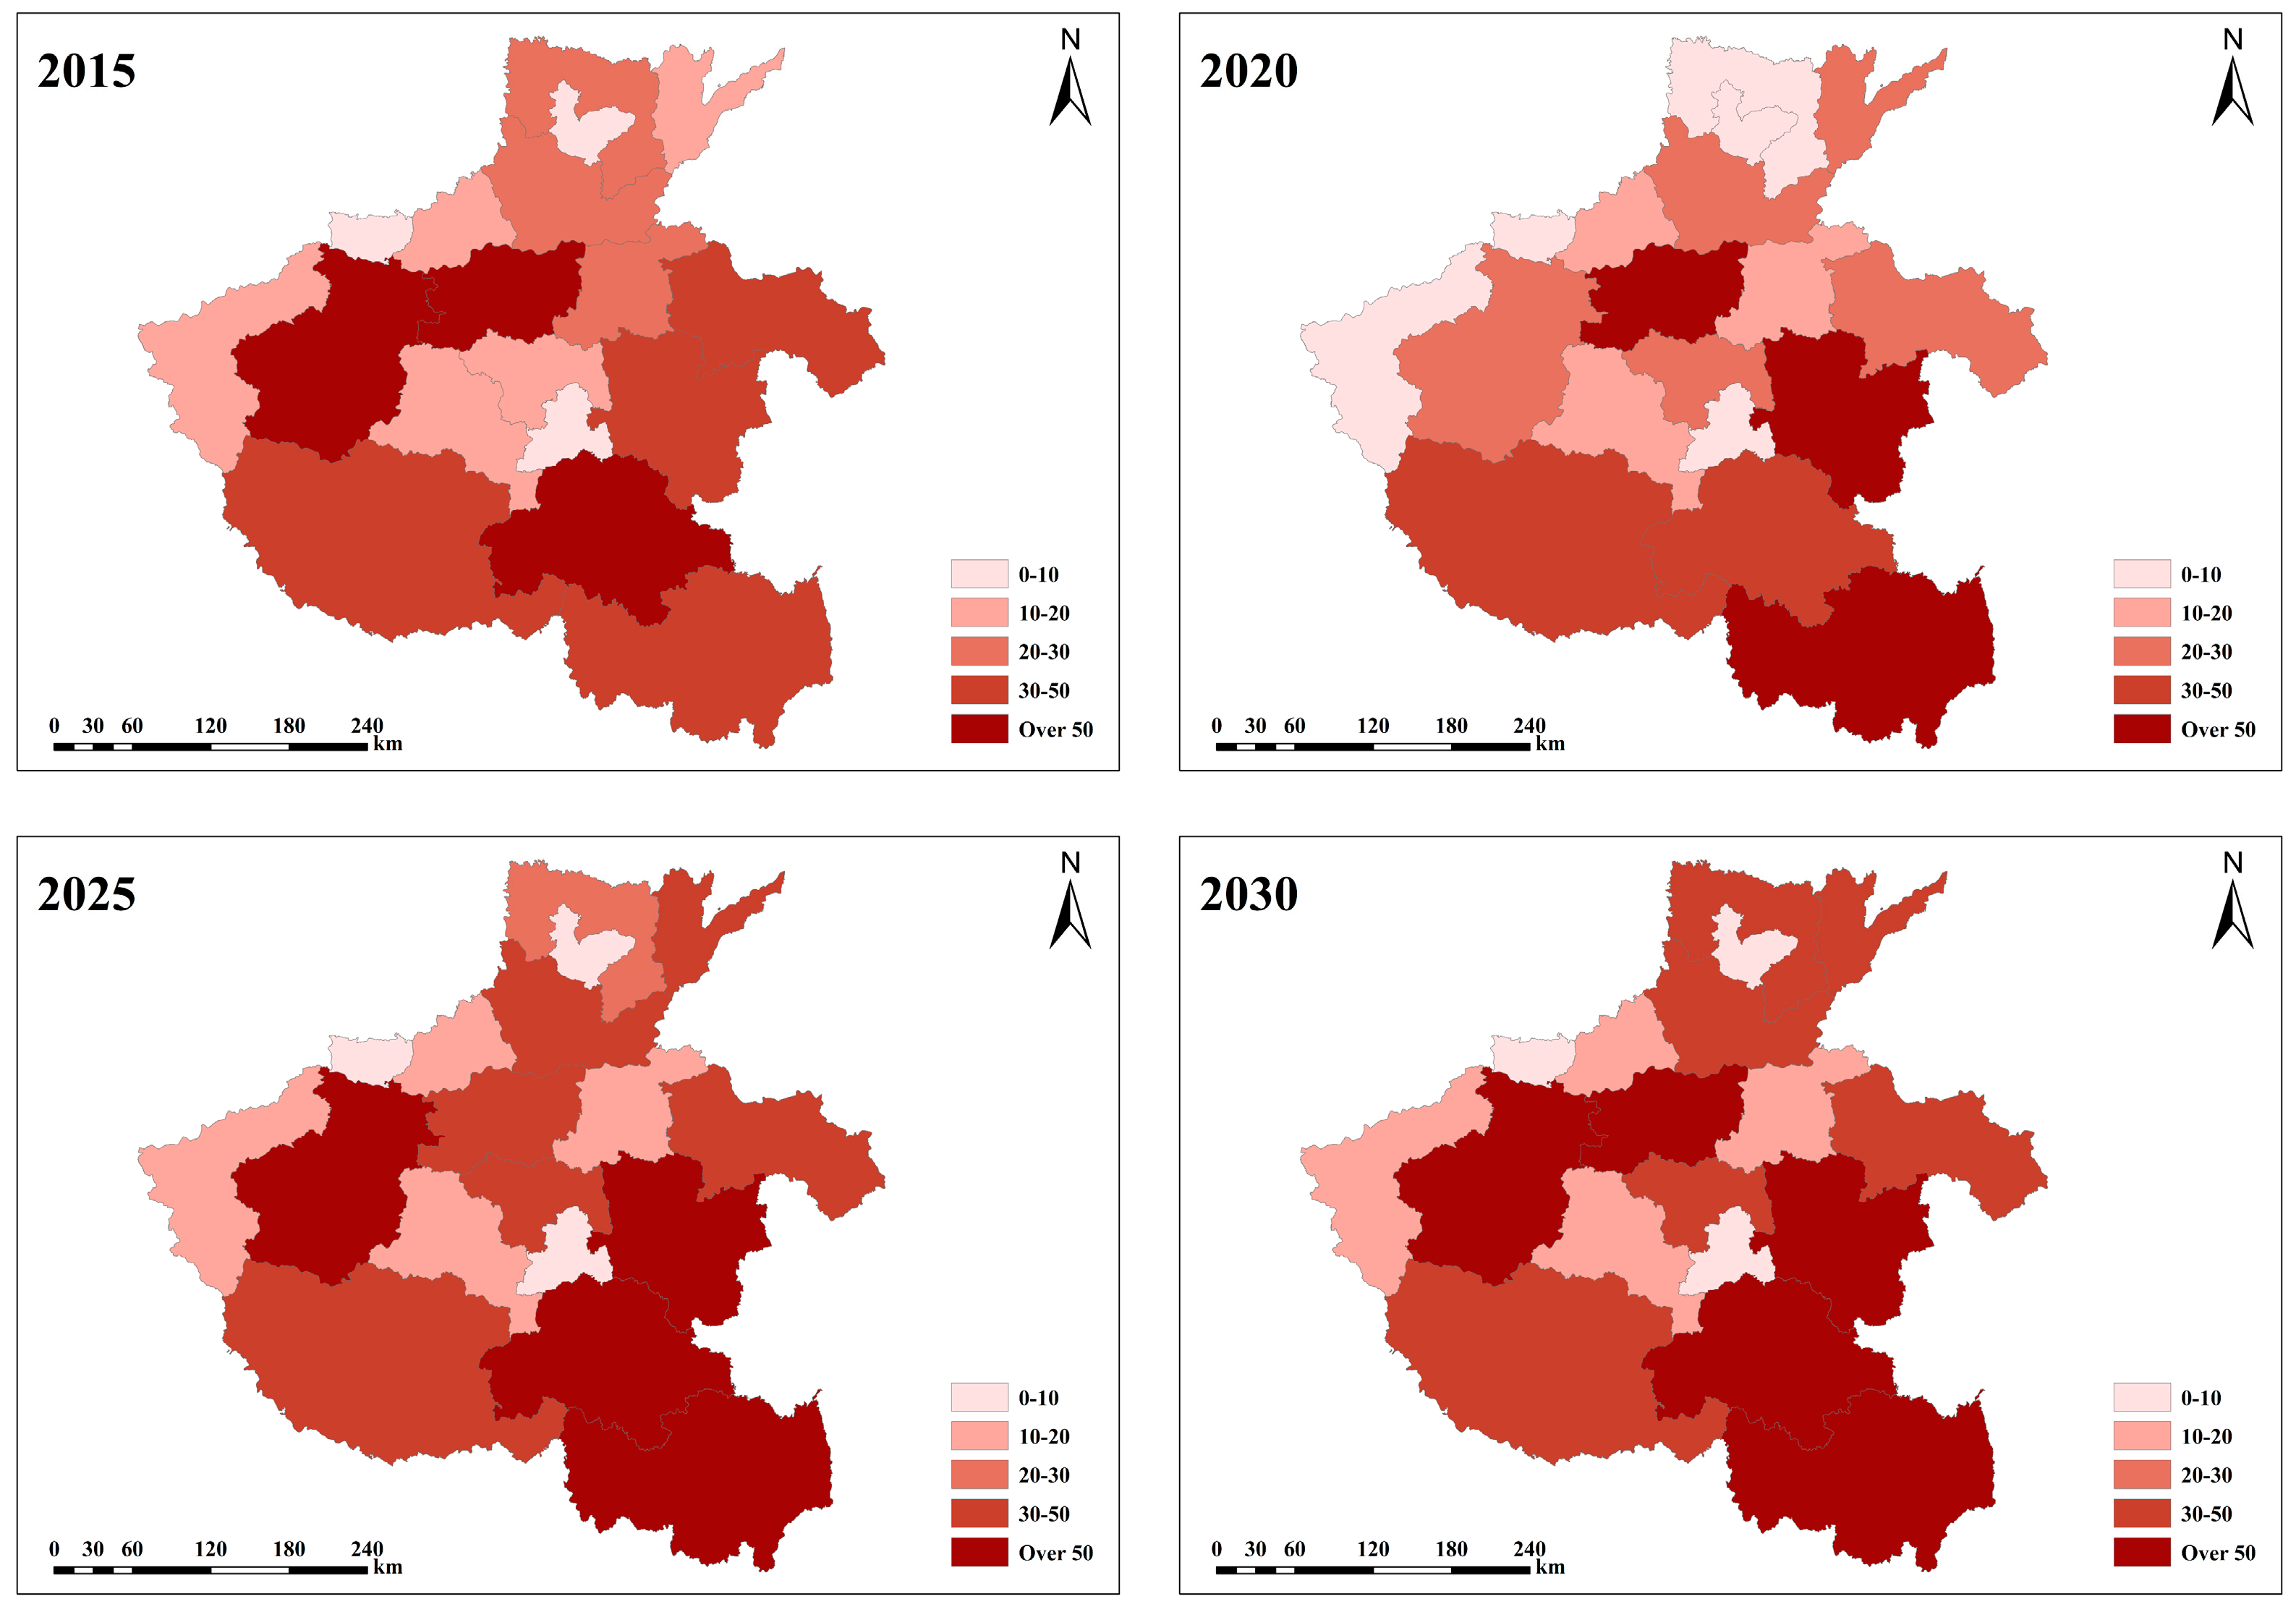
In this study, the actual values of decoration waste generation in 2015 and 2020 and the predicted values of generation in 2025 and 2030 in each city of Henan Province are selected as research objects. Using ArcGIS to visualize the spatial and temporal distribution characteristics [58,59], the spatial distribution of decoration waste generation over time can be analyzed intuitively and accurately, as shown in Figure 10. Using ordinary Kriging interpolation to generate a spatially continuous distribution surface, based on the numerical size of the amount generated, there are five levels, namely 0–100,000 tons, 100,000–200,000 tons, 200,000–300,000 tons, 300,000–500,000 tons, and more than 500,000 tons, which are indicated by using different colors [60]. The results show an overall upward trend in the amount of decoration waste generated in each city over time. High-yield areas increased year by year, from the beginning of the multi-point distribution to the final presentation of the centralized large area distribution characteristics, with obvious regional characteristics. At the same time, the high production of decoration waste is concentrated in the southwestern and southeastern parts of Henan Province, and the amount of decoration waste generated in the northern part of the country will show a significant upward trend in the next ten years. By 2030, the number of cities generating more than 500,000 tons is as high as five, and the problem of decoration waste management is imminent.

3.3.4. Analysis of Urban Generation Share

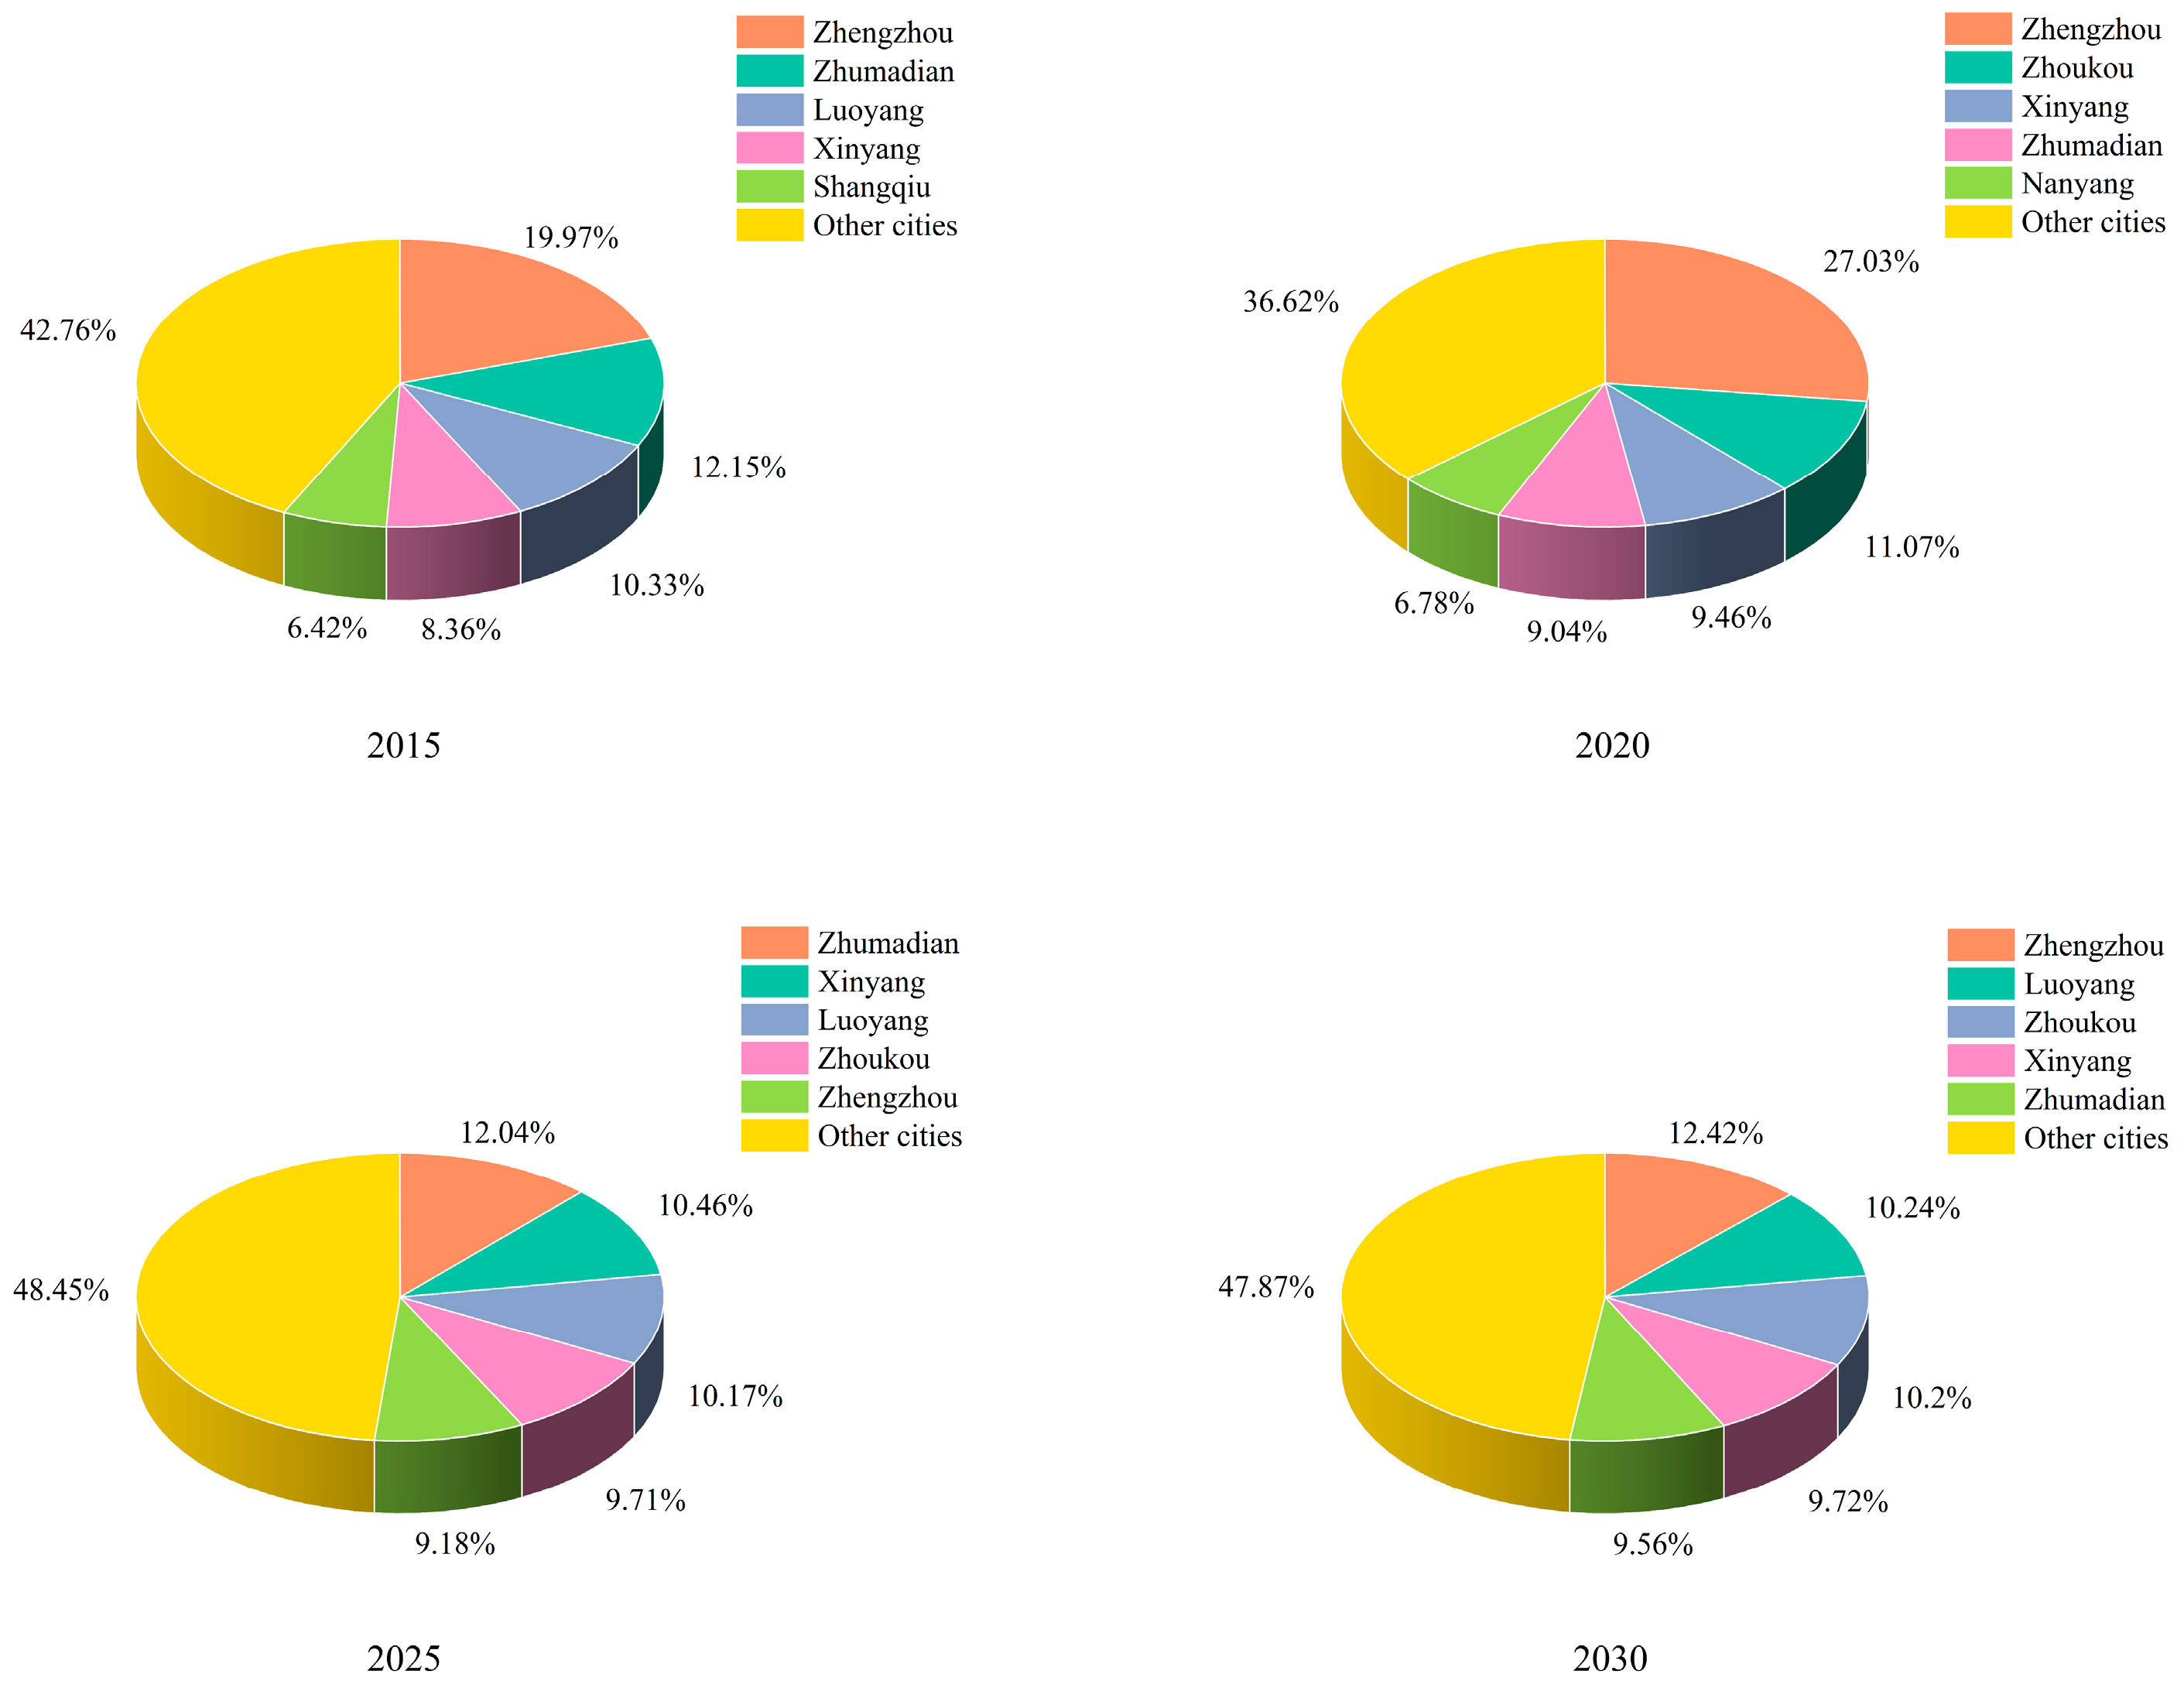
Combined with the spatial and temporal distribution characteristics of the amount of decoration waste generated, in order to focus on the study of cities with a larger amount of generation, the specific percentage is listed in order, as shown in Figure 11. The cities with larger amounts of decoration waste generated in 2015 are Zhengzhou City, Zhumadian City, and Luoyang City, accounting for 19.97%, 12.15%, and 10.33% in that order. The cities with larger amounts of decoration waste generated in 2020 are Zhengzhou City, Zhoukou City, and Xinyang City, accounting for 27.03%, 11.07%, and 9.46% in that order. The cities with larger amounts of decoration waste generated in 2025 are Zhumadian City, Xinyang City, and Luoyang City, accounting for 12.04%, 10.46%, and 10.17% in that order. The cities with larger amounts of decoration waste generated in 2030 are Zhengzhou City, Luoyang City, and Zhoukou City, accounting for 12.42%, 10.24%, and 10.20% in that order. It can be known that the cities in Henan Province with large amounts of decoration waste generation are concentrated in Zhengzhou City, Zhumadian City, Luoyang City, Zhoukou City and Xinyang City. All are cities with large economies and relatively dense population distribution, indicating that the amount of decoration waste generated is closely related to the size of the population and the standard of living of residents [61,62,63]. Among them, Zhengzhou City, as a key city, should be paid attention to in the future decoration waste management and government control. As high-production cities become saturated with housing completions over time [64,65], decoration waste generation is expected to rise in other cities, increasing to 47.87% by 2030. Regional variations in the volume of construction waste are the result of the combined effects of multiple factors, including the stage of urbanization, the structure of the housing stock, and residents’ consumption patterns [66]. Core cities such as Zhengzhou are placing equal emphasis on new development and the renewal of existing stock, while emerging cities in the southeast are experiencing a distinct surge in concentrated project deliveries. Meanwhile, traditional agricultural areas are facing regulatory challenges in urban–rural fringe zones. Therefore, in addition to the cities of focus, the problem of decoration waste management in other cities should also be given early attention and prevention.

3.3.5. Uncertainty Analysis

Although the BP neural network model demonstrates high fitting accuracy, the volume of construction waste is subject to fluctuations caused by multiple random factors, such as real estate market volatility, policy adjustments, and unforeseen events; as a result, point forecasts cannot fully capture the range of risks associated with future changes. To this end, this study uses the distribution of prediction residuals on the test set to estimate confidence intervals for the predicted values using the nonparametric Bootstrap resampling method.
Specifically, the training data from 2006 to 2021 was resampled with replacement 1000 times. After each resampling, the BP neural network was retrained to predict annual production volumes for 2022–2030. The 2.5th and 97.5th percentiles of the 1000 predicted values for each year were used as the lower and upper bounds of the 95% confidence interval. The calculation results are shown in Table 1. As can be seen, the width of the confidence interval tends to widen over time. This phenomenon is consistent with the inherent nature of time series forecasting, namely, that the longer the forecast horizon, the greater the cumulative uncertainty. When planning disposal sites based on annual production forecasts, decision-makers may use the upper confidence limit as the design basis to ensure sufficient flexibility in disposal capacity.

4. Conclusions

In this paper, taking Henan Province as an example, the following conclusions can be drawn through the study of accurate control of decoration waste based on GF-2 remote sensing images and a BP neural network.
(1)
Using multi-temporal GF-2 remote sensing images and the GIS software ArcGIS, the spatial distribution of construction waste in the study area can be extracted and the statistical footprint can be calculated by combining manual visual interpretation and machine learning recognition. The results show that as of 2021, construction waste piles cover a large area, of which decoration waste accounts for about 10%, which is a non-negligible part of urban environmental quality control.
(2)
Based on the trained BP neural network, in-sample prediction of decoration waste generation in 18 cities in Henan Province from 2006 to 2021 was conducted to obtain the predicted generation value of each city from 2022 to 2030. The results show that, based on the training fit goodness-of-fit result R = 0.95463 > 0.9, the model is well trained and the prediction results have high accuracy.
(3)
The results of the error comparison analysis show that the prediction error is less than 15%, and the predicted value has high consistency with the actual value. The results of the forecast trend analysis show that by 2030, the amount of decoration waste generated in Henan Province will reach a cumulative total of 49,827,200 tons. Using ArcGIS to visualize the spatial and temporal distribution characteristics, the high production areas of decoration waste are concentrated in the southwest and southeast of Henan Province. The key cities are Zhengzhou City, Zhumadian City, Luoyang City, Zhoukou City, and Xinyang City, with the range of generation share located between 9.46% and 27.03%. They are all cities with large economic volume and relatively dense population distribution, with obvious regional characteristics, which should be paid attention to in the future decoration waste management and government control. It is recommended that provincial-level competent authorities implement differentiated management measures: core cities should focus on categorized collection, transportation, and resource recovery; emerging cities should strengthen dynamic scheduling of temporary disposal sites; and rural areas should prioritize preventing illegal dumping in regulatory blind spots. This approach will enhance the efficiency of policy implementation and the rationality of resource allocation.
(4)
An uncertainty analysis indicates that forecasts of construction waste generation are influenced by multiple factors, including fluctuations in the real estate market and macroeconomic policies. The 95% confidence intervals constructed using the Bootstrap resampling method indicate that the uncertainty in the long-term forecast values is approximately ±12%, and the width of the interval increases as the forecast horizon extends, highlighting the inherent risks of medium- to long-term forecasting. Accordingly, it is recommended that local governments incorporate the upper limit of the confidence interval into their planning for waste disposal facilities to ensure adequate capacity, and establish a mechanism for dynamically monitoring and forecasting construction and renovation waste generation, with rolling updates, to enhance the robustness and adaptability of management and control decisions.
To summarize, this study took Henan Province as an example, calculated the area occupied by decoration waste piles based on GF-2 remote sensing images, and predicted the trend of decoration waste generation based on a BP neural network model. And through the analysis of spatial and temporal distribution characteristics and the share of urban generation, it shows obvious regional characteristics. Combined with the layout of urban agglomerations, a precise control technology system for decoration waste has been formed, which lays the foundation for the supervision of decoration waste during the development of urban agglomerations across the country and promotes the sustainable development of the green building industry.

Author Contributions

Writing—review and editing, writing—original draft, methodology, data curation, S.H.; writing—review and editing, formal analysis, C.X.; writing—methodology, data curation, G.L.; writing—review and editing, funding acquisition, supervision, F.R. All authors have read and agreed to the published version of the manuscript.

Funding

This study was supported by the Fundamental Research Funds for the Central Universities (No. 2023JBZY011) and National Key Research and Development Program of China (No. 2018YFC0706000).

Institutional Review Board Statement

Not applicable.

Informed Consent Statement

Not applicable.

Data Availability Statement

The original contributions presented in this study are included in the article. Further inquiries can be directed to the corresponding author.

Conflicts of Interest

Author Chenggang Xi is employed by RIOH High Science and Technology Group. The remaining authors declare that the research was conducted in the absence of any commercial or financial relationships that could be construed as a potential conflict of interest.

References

  1. Wang, P.; Xiao, J.; Liu, R.; Qiang, X.; Duan, Z.; Liang, C. A hybrid classification and evaluation method based on deep learning for decoration and renovation waste in view of recycling. Waste Manag. 2025, 191, 1–12. [Google Scholar] [CrossRef]
  2. Tang, Z.; Li, W.; Tam, V.W.Y.; Xue, C. Advanced progress in recycling municipal and construction solid wastes for manufacturing sustainable construction materials. Resour. Conserv. Recycl. X 2020, 6, 100036. [Google Scholar] [CrossRef]
  3. Huang, B.; Wang, X.; Kua, H.; Geng, Y.; Bleischwitz, R.; Ren, J. Construction and demolition waste management in China through the 3R principle. Resour. Conserv. Recycl. 2018, 129, 36–44. [Google Scholar] [CrossRef]
  4. Ding, Z.; Gong, W.; Tam, V.W.Y.; Illankoon, I.M.C.S. Conceptual framework for renovation waste management based on renovation waste generation rates in residential buildings: An empirical study in China. J. Clean. Prod. 2019, 228, 284–293. [Google Scholar] [CrossRef]
  5. Ding, Z.; Wang, X.; Zou, P.X.W. Barriers and countermeasures of construction and demolition waste recycling enterprises under circular economy. J. Clean. Prod. 2023, 420, 138235. [Google Scholar] [CrossRef]
  6. Zhou, A.; Li, K.; Liu, T.; Zou, D.; Peng, X.; Lyu, H.; Xiao, J.; Luan, C. Recycling and optimum utilization of engineering sediment waste into low-carbon geopolymer paste for sustainable infrastructure. J. Clean. Prod. 2023, 383, 135549. [Google Scholar] [CrossRef]
  7. Sun, P.; Zhang, N.; Zuo, J.; Mao, R.; Gao, X.; Duan, H. Characterizing the generation and flows of building interior decoration and renovation waste: A case study in Shenzhen City. J. Clean. Prod. 2020, 260, 121077. [Google Scholar] [CrossRef]
  8. Zeng, Q.; Jike, N.; Xu, C.; Yang, R.; Peng, Y.; Wang, J.; Gong, F.; Zhang, M.; Zhao, Y. Total recycling of low-quality urban-fringe construction and demolition waste towards the development of sustainable cement-free pervious concrete: The proof of concept. J. Clean. Prod. 2022, 352, 131464. [Google Scholar] [CrossRef]
  9. Chen, X.; Zhang, D.; Cheng, S.; Xu, X.; Zhao, C.; Wang, X.; Wu, Q.; Bai, X. Sustainable reuse of ceramic waste powder as a supplementary cementitious material in recycled aggregate concrete: Mechanical properties, durability and microstructure assessment. J. Build. Eng. 2022, 52, 104418. [Google Scholar] [CrossRef]
  10. Ding, Z.; Zhu, M.; Tam, V.W.Y.; Yi, G.; Tran, C.N.N. A system dynamics-based environmental benefit assessment model of construction waste reduction management at the design and construction stages. J. Clean. Prod. 2018, 176, 676–692. [Google Scholar] [CrossRef]
  11. Silvestre, J.D.; de Brito, J.; Pinheiro, M.D. Environmental impacts and benefits of the end-of-life of building materials—Calculation rules, results and contribution to a “cradle to cradle” life cycle. J. Clean. Prod. 2014, 66, 37–45. [Google Scholar] [CrossRef]
  12. Dong, J.; Li, C. Structure characteristics and influencing factors of China’s carbon emission spatial correlation network: A study based on the dimension of urban agglomerations. Sci. Total Environ. 2022, 853, 158613. [Google Scholar] [CrossRef]
  13. Luo, X.; Ren, M.; Zhao, J.; Wang, Z.; Ge, J.; Gao, W. Life cycle assessment for carbon emission impact analysis for the renovation of old residential areas. J. Clean. Prod. 2022, 367, 132930. [Google Scholar] [CrossRef]
  14. Zhang, X.; Nie, S.; He, M.; Wang, J. Energy-saving renovation of old urban buildings: A case study of Beijing. Case Stud. Therm. Eng. 2021, 28, 101632. [Google Scholar] [CrossRef]
  15. Bao, Z.; Lu, W.; Hao, J. Tackling the “last mile” problem in renovation waste management: A case study in China. Sci. Total Environ. 2021, 790, 148261. [Google Scholar] [CrossRef]
  16. Lu, W.; Lou, J.; Webster, C.; Xue, F.; Bao, Z.; Chi, B. Estimating construction waste generation in the Greater Bay Area, China using machine learning. Waste Manag. 2021, 134, 78–88. [Google Scholar] [CrossRef] [PubMed]
  17. Macias, A.; Piniarski, W. Municipal Solid Waste Management Problems on a Local Scale: A Case Study from Rural Poland. Pol. J. Environ. Stud. 2016, 25, 1623–1632. [Google Scholar] [CrossRef] [PubMed]
  18. Leyzerova, A.; Sharovarova, E.; Alekhin, V. Sustainable Strategies of Urban Planning. Procedia Eng. 2016, 150, 2055–2061. [Google Scholar] [CrossRef]
  19. Yu, D.; Duan, H.; Song, Q.; Li, X.; Zhang, H.; Zhang, H.; Liu, Y.; Shen, W.; Wang, J. Characterizing the environmental impact of metals in construction and demolition waste. Environ. Sci. Pollut. Res. 2018, 25, 13823–13832. [Google Scholar] [CrossRef]
  20. Chen, Q.; Cheng, Q.; Wang, J.; Du, M.; Zhou, L.; Liu, Y. Identification and Evaluation of Urban Construction Waste with VHR Remote Sensing Using Multi-Feature Analysis and a Hierarchical Segmentation Method. Remote Sens. 2021, 13, 158. [Google Scholar] [CrossRef]
  21. Liu, Z.; Li, N.; Wang, L.; Zhu, J.; Qin, F. A multi-angle comprehensive solution based on deep learning to extract cultivated land information from high-resolution remote sensing images. Ecol. Indic. 2022, 141, 108961. [Google Scholar] [CrossRef]
  22. Wang, L.; Zhang, G.; Wang, Z.; Liu, J.; Shang, J.; Liang, L. Bibliometric Analysis of Remote Sensing Research Trend in Crop Growth Monitoring: A Case Study in China. Remote Sens. 2019, 11, 809. [Google Scholar] [CrossRef]
  23. Jia, Z.; Chen, Q.; Hong, S.; Cheng, Q. Remote Sensing Recognition of Construction Waste Accumulation Based on Resources satellite three Multi-view Stereoscopic Image. IOP Conf. Ser. Earth Environ. Sci. 2020, 615, 012027. [Google Scholar] [CrossRef]
  24. Zhou, S.; Zhang, X.; Chu, S.; Zhang, T.; Wang, J. Research on remote sensing image carbon emission monitoring based on deep learning. Signal Process. 2023, 207, 108943. [Google Scholar] [CrossRef]
  25. Hu, S.; Xi, C.; Ren, F. Research on decision support methods for precise disposal of construction waste. J. Beijing Univ. Civ. Eng. Archit. 2025, 41, 104–113. (In Chinese) [Google Scholar] [CrossRef]
  26. Rajaratnam, D.; Stewart, R.A.; Liu, T.; Vieira, A.S. Building stock mining for a circular economy: A systematic review on application of GIS and remote sensing. Resour. Conserv. Recycl. Adv. 2023, 18, 200144. [Google Scholar] [CrossRef]
  27. Zhang, C.; Yue, P.; Tapete, D.; Jiang, L.; Shangguan, B.; Huang, L.; Liu, G. A deeply supervised image fusion network for change detection in high resolution bi-temporal remote sensing images. ISPRS J. Photogramm. Remote Sens. 2020, 166, 183–200. [Google Scholar] [CrossRef]
  28. Zhang, X.; Zhang, F.; Qi, Y.; Deng, L.; Wang, X.; Yang, S. New research methods for vegetation information extraction based on visible light remote sensing images from an unmanned aerial vehicle (UAV). Int. J. Appl. Earth Obs. Geoinf. 2019, 78, 215–226. [Google Scholar] [CrossRef]
  29. Aval, J.; Fabre, S.; Zenou, E.; Sheeren, D.; Fauvel, M.; Briottet, X. Object-based fusion for urban tree species classification from hyperspectral, panchromatic and nDSM data. Int. J. Remote Sens. 2019, 40, 5339–5365. [Google Scholar] [CrossRef]
  30. Benz, U.C.; Hofmann, P.; Willhauck, G.; Lingenfelder, I.; Heynen, M. Multi-resolution, object-oriented fuzzy analysis of remote sensing data for GIS-ready information. ISPRS J. Photogramm. Remote Sens. 2004, 58, 239–258. [Google Scholar] [CrossRef]
  31. Kong, L.; Ma, B. Evaluation of environmental impact of construction waste disposal based on fuzzy set analysis. Environ. Technol. Innov. 2020, 19, 100877. [Google Scholar] [CrossRef]
  32. Wu, W.; Xie, L.; Hao, J.L. An integrated trading platform for construction and demolition waste recovery in a circular economy. Sustain. Chem. Pharm. 2022, 25, 100597. [Google Scholar] [CrossRef]
  33. Kijjanapanich, P.; Annachhatre, A.P.; Esposito, G.; Lens, P.N.L. Chemical sulphate removal for treatment of construction and demolition debris leachate. Environ. Technol. 2014, 35, 1989–1996. [Google Scholar] [CrossRef]
  34. Souza, F.d.S.; Mendes, J.C.; Morais, L.J.B.; Silva, J.S.; Peixoto, R.A.F. Mapping and recycling proposal for the construction and demolition waste generated in the Brazilian Amazon. Resour. Conserv. Recycl. 2022, 176, 105896. [Google Scholar] [CrossRef]
  35. Song, X.; Li, Y.; Mao, J.; Zhou, K.; Yang, D.; Deng, Z.; Wang, Q. A study of the thermal performance prediction of embedded pipes in protection engineering based on multiple regression analysis. Geothermics 2023, 112, 102755. [Google Scholar] [CrossRef]
  36. Yuan, A.; Wu, C.; Huang, Z.W. The Prediction of the Output of Municipal Solid Waste (MSW) in Nanchong City. Adv. Mater. Res. 2012, 518–523, 3552–3556. [Google Scholar] [CrossRef]
  37. Duman, G.M.; Kongar, E.; Gupta, S.M. Estimation of electronic waste using optimized multivariate grey models. Waste Manag. 2019, 95, 241–249. [Google Scholar] [CrossRef]
  38. Thanh, N.P.; Matsui, Y.; Fujiwara, T. Household solid waste generation and characteristic in a Mekong Delta city, Vietnam. J. Environ. Manag. 2010, 91, 2307–2321. [Google Scholar] [CrossRef]
  39. Chen, J.; Liu, Z.; Yin, Z.; Liu, X.; Li, X.; Yin, L.; Zheng, W. Predict the effect of meteorological factors on haze using BP neural network. Urban Clim. 2023, 51, 101630. [Google Scholar] [CrossRef]
  40. Chhay, L.; Reyad, M.A.H.; Suy, R.; Islam, M.R.; Mian, M.M. Municipal solid waste generation in China: Influencing factor analysis and multi-model forecasting. J. Mater. Cycles Waste Manag. 2018, 20, 1761–1770. [Google Scholar] [CrossRef]
  41. Liu, G.; Yu, J. Gray correlation analysis and prediction models of living refuse generation in Shanghai city. Waste Manag. 2007, 27, 345–351. [Google Scholar] [CrossRef]
  42. Fatta, D.; Papadopoulos, A.; Avramikos, E.; Sgourou, E.; Moustakas, K.; Kourmoussis, F.; Mentzis, A.; Loizidou, M. Generation and management of construction and demolition waste in Greece—An existing challenge. Resour. Conserv. Recycl. 2003, 40, 81–91. [Google Scholar] [CrossRef]
  43. Lu, W.; Long, W.; Yuan, L. A machine learning regression approach for pre-renovation construction waste auditing. J. Clean. Prod. 2023, 397, 136596. [Google Scholar] [CrossRef]
  44. Shen, G.; Xu, B.; Jin, Y.; Chen, S.; Zhang, W.; Guo, J.; Liu, H.; Zhang, Y.; Yang, X. Monitoring wind farms occupying grasslands based on remote-sensing data from China’s GF-2 HD satellite—A case study of Jiuquan city, Gansu province, China. Resour. Conserv. Recycl. 2017, 121, 128–136. [Google Scholar] [CrossRef]
  45. Wang, Q.; Chen, W.; Tang, H.; Pan, X.; Zhao, H.; Yang, B.; Zhang, H.; Gu, W. Simultaneous extracting area and quantity of agricultural greenhouses in large scale with deep learning method and high-resolution remote sensing images. Sci. Total Environ. 2023, 872, 162229. [Google Scholar] [CrossRef]
  46. Fraternali, P.; Morandini, L.; Herrera González, S.L. Solid waste detection, monitoring and mapping in remote sensing images: A survey. Waste Manag. 2024, 189, 88–102. [Google Scholar] [CrossRef] [PubMed]
  47. HaitherAli, H.; Shakeel SJ, J.M.; Sivagami, M.; Anjali, G. Identification of construction and demolition waste: Leveraging deep learning and open-source imagery for advanced monitoring in developing economies. Results Eng. 2025, 26, 105688. [Google Scholar] [CrossRef]
  48. Feng, W.; Feng, F.; Sun, G. Research on the Multimodal Digital Teaching Quality Data Evaluation Model Based on Fuzzy BP Neural Network. Comput. Intell. Neurosci. 2022, 2022, 7893792. [Google Scholar] [CrossRef]
  49. Wu, F.; Niu, D.; Dai, S.; Wu, B. New insights into regional differences of the predictions of municipal solid waste generation rates using artificial neural networks. Waste Manag. 2020, 107, 182–190. [Google Scholar] [CrossRef] [PubMed]
  50. Awad, R.; Budayan, C.; Gurgun, A.P. Construction and Demolition Waste Generation Prediction by Using Artificial Neural Networks and Metaheuristic Algorithms. Buildings 2024, 14, 3695. [Google Scholar] [CrossRef]
  51. CJJ/T 134-2019; Technical Standards for Construction Waste Management. China Architecture and Building Press: Beijing, China, 2019.
  52. Mostafa, K.; Hegazy, T. Review of image-based analysis and applications in construction. Autom. Constr. 2021, 122, 103516. [Google Scholar] [CrossRef]
  53. Galvín, A.P.; Ayuso, J.; Agrela, F.; Barbudo, A.; Jiménez, J.R. Analysis of leaching procedures for environmental risk assessment of recycled aggregate use in unpaved roads. Constr. Build. Mater. 2013, 40, 1207–1214. [Google Scholar] [CrossRef]
  54. Van Praagh, M.; Modin, H. Leaching of chloride, sulphate, heavy metals, dissolved organic carbon and phenolic organic pesticides from contaminated concrete. Waste Manag. 2016, 56, 352–358. [Google Scholar] [CrossRef]
  55. Abbasi, M.; El Hanandeh, A. Forecasting municipal solid waste generation using artificial intelligence modelling approaches. Waste Manag. 2016, 56, 13–22. [Google Scholar] [CrossRef]
  56. Majumder, S.; Biswas, D. COVID-19: Impact on quality of work life in real estate sector. Qual. Quant. 2021, 56, 413–427. [Google Scholar] [CrossRef]
  57. Zeng, S.; Yi, C. Impact of the COVID-19 pandemic on the housing market at the epicenter of the outbreak in China. SN Bus. Econ. 2022, 2, 53. [Google Scholar] [CrossRef] [PubMed]
  58. Biluca, J.; de Aguiar, C.R.; Trojan, F. Sorting of suitable areas for disposal of construction and demolition waste using GIS and ELECTRE TRI. Waste Manag. 2020, 114, 307–320. [Google Scholar] [CrossRef] [PubMed]
  59. Mama, C.N.; Igwe, O.; Ezugwu, C.K.; Ugwuoke, I.J. Multivariate and Statistical Assessment of Solid Wastes Contamination from Waste Dump Sites on Soil and Perched Aquifers in a Rapidly Developing City. Environ. Forensics 2021, 23, 422–432. [Google Scholar] [CrossRef]
  60. Hu, S.; Ren, F.; Jia, J.; Cui, C.; Guo, C.; Cui, N.; Ma, L.; Si, H.; Lu, T.; Liu, G.; et al. Exploring the environmental properties and resource utilization of construction waste in Beijing-Tianjin-Hebei region. Environ. Sci. Pollut. Res. 2022. [Google Scholar] [CrossRef]
  61. Bao, Z. Developing circularity of construction waste for a sustainable built environment in emerging economies: New insights from China. Dev. Built Environ. 2023, 13, 100107. [Google Scholar] [CrossRef]
  62. Li, Z.; Deng, Q.; Bai, J.; Li, Y.; Wang, Y.; Liu, N.; Gong, Y. Management system for engineering and decoration waste: An exploratory study in Shenzhen. J. Environ. Manag. 2022, 314, 115085. [Google Scholar] [CrossRef] [PubMed]
  63. Wang, J.; Teng, Y.; Chen, Z.; Bai, J.; Niu, Y.; Duan, H. Assessment of carbon emissions of building interior decoration and renovation waste disposal in the fast-growing Greater Bay Area, China. Sci. Total Environ. 2021, 798, 149158. [Google Scholar] [CrossRef]
  64. Cheng, J.C.P.; Ma, L.Y.H. A BIM-based system for demolition and renovation waste estimation and planning. Waste Manag. 2013, 33, 1539–1551. [Google Scholar] [CrossRef]
  65. Wu, Z.; Li, H.; Feng, Y.; Luo, X.; Chen, Q. Developing a green building evaluation standard for interior decoration: A case study of China. Build. Environ. 2019, 152, 50–58. [Google Scholar] [CrossRef]
  66. Wang, Z.; Qin, F.; Liu, J.; Jin, X. Evolution trajectory and driving mechanism of the synergistic effect on construction waste and carbon reduction: Evidence from China. Waste Manag. 2025, 203, 114891. [Google Scholar] [CrossRef] [PubMed]
Figure 1. GF-2 remote sensing image research data points.
Sustainability 18 05342 g001
Figure 2. Multi-temporal remote sensing images of the study area.
Sustainability 18 05342 g002
Figure 3. Classification of construction waste types.
Sustainability 18 05342 g003
Figure 4. Topological structure diagram of BP neural network.
Sustainability 18 05342 g004
Figure 5. The proportion of land occupied by various types of construction waste dumps in 2021.
Sustainability 18 05342 g005
Figure 6. Best validation performance and training status.
Sustainability 18 05342 g006
Figure 7. Training goodness-of-fit results.
Sustainability 18 05342 g007
Figure 8. Comparison chart of prediction errors in Henan Province.
Sustainability 18 05342 g008
Figure 9. The predicted annual amount of decoration waste in Henan Province.
Sustainability 18 05342 g009
Figure 10. The spatiotemporal distribution map of the amount of decoration waste generated.
Sustainability 18 05342 g010
Figure 11. Figure showing the proportion of decoration waste generated in various cities.
Sustainability 18 05342 g011
Table 1. The 95% confidence interval for projected annual construction waste generation (in 10,000 tons).
YearForecast Value95% Lower Confidence Limit95% Upper Confidence LimitInterval Width
2022553.58503.76603.4099.64
2023563.70510.15617.25107.10
2024561.62505.46617.78112.32
2025534.88478.72591.04112.32
2026554.94493.90615.98122.08
2027545.32482.61608.03125.42
2028552.86486.52619.20132.68
2029564.12493.61634.63141.02
2030551.69479.97623.41143.44
Disclaimer/Publisher’s Note: The statements, opinions and data contained in all publications are solely those of the individual author(s) and contributor(s) and not of MDPI and/or the editor(s). MDPI and/or the editor(s) disclaim responsibility for any injury to people or property resulting from any ideas, methods, instructions or products referred to in the content.