Article

Carbon Footprints of Wastewater Treatment Plants: A Comprehensive Analysis of Emission Sources and Quantification for Sequencing Batch Reactor System


by
Abdelrahman G. Gadallah
1 and
Mona A. Abdel-Fatah
2,*
1
Chemical Engineering Department, College of Engineering, Imam Mohammad Ibn Saud Islamic University (IMSIU), Riyadh 11432, Saudi Arabia
2
Chemical Engineering and Pilot Plant Department, National Research Centre, El-Bohouth Street-Dokki, Cairo 12622, Egypt
*
Author to whom correspondence should be addressed.
Sustainability 2026, 18(11), 5281; https://doi.org/10.3390/su18115281 (registering DOI)
Submission received: 2 April 2026 / Revised: 24 April 2026 / Accepted: 14 May 2026 / Published: 25 May 2026
(This article belongs to the Section Environmental Sustainability and Applications)

Abstract

Wastewater treatment plants (WWTPs) are significant contributors to anthropogenic greenhouse gas (GHG) emissions through both direct biological processes generating methane (CH4), nitrous oxide (N2O), and biogenic carbon dioxide (CO2) and indirect energy consumption. This comprehensive research paper synthesizes findings from 30 peer-reviewed studies to present a holistic analysis of carbon footprints in wastewater treatment, with a specific quantitative assessment of a sequencing batch reactor (SBR) facility processing 5000 m3/day. The SBR operates with anoxic–aerobic cycles (fill–anoxic react–aerobic react–settle–decant–idle). The analysis reveals that N2O emissions can constitute up to 75% of a plant’s carbon footprint, while aeration accounts for 40–75% of total energy consumption. For the SBR facility, the baseline carbon footprint is 1648 tCO2e/year [95% CI: 1420–1910] (0.90 kg CO2e/m3) under conservative assumptions, with CH4 yield of 0.03 kg CH4/kg COD removed and N2O yield of 0.008 kg N2O-N/kg TN removed. A realistic baseline using median literature values gives 0.52 kg CO2e/m3. The carbon footprint of WWTPs varies by treatment technology, scale, and operational conditions, ranging from 61 to 161 kg CO2e per population equivalent (PE) annually. Through anaerobic digestion with biogas recovery and anoxic phase optimization, emissions can be reduced by 38% to 1018 tCO2e/year [95% CI: 860–1190]. The findings underscore that achieving carbon neutrality requires extending accounting beyond plant boundaries to include effluent exports, sludge management, and urban infrastructure integration. This paper provides a transparent, practitioner-ready framework for understanding, quantifying, and mitigating carbon emissions from wastewater treatment, with particular emphasis on SBR technology.

1. Introduction

1.1. Background and Significance

Wastewater treatment plants (WWTPs) represent a critical interface between public health protection and environmental stewardship. However, these essential facilities contribute significantly to greenhouse gas (GHG) emissions through multiple pathways. The carbon footprint of WWTPs arises primarily from direct emissions of methane (CH4), nitrous oxide (N2O), and biogenic carbon dioxide (CO2) from biological treatment processes, as well as indirect emissions from energy consumption (particularly electricity for aeration) and chemical use [1,2,3].
The global imperative to mitigate climate change has intensified the scrutiny of all anthropogenic emission sources, including wastewater treatment. This study is framed within the context of Sustainable Development Goal 6 (clean water and sanitation) and SDG 13 (climate action), recognizing that wastewater infrastructure must simultaneously protect water quality and minimize climate impacts. A critical distinction must be made between anaerobic and aerobic biological systems regarding gas production. Anaerobic digestion (used for sludge treatment) produces high CH4 yields of 0.2–0.4 m3 CH4 per kg volatile solids (VS) degraded, whereas aerobic SBR reactors produce negligible direct CH4 from the reactor itself (typically <0.005 kg CH4 per kg COD removed). This distinction is often blurred in carbon footprint studies, leading to overestimation of reactor emissions. The present study explicitly disaggregates CH4 sources following best practices.

1.2. Research Gap

Despite the growing body of literature on WWTP carbon footprints, three critical gaps remain: (a) no study has synthesized SBR-specific emission factors across 30+ papers into a unified quantification framework. Existing reviews either address WWTPs broadly [1,2] or focus on single emission sources [4], leaving SBR practitioners without technology-specific guidance. (b) No study provides a practitioner-ready, step-by-step calculation tool with explicit uncertainty bounds (e.g., Monte Carlo confidence intervals). Most studies report point estimates without quantifying the wide ranges inherent in emission factors (e.g., N2O: 0.001–0.016 kg N2O-N/kg TN), limiting their utility for decision-making. (c) No study compares baseline, optimized, and advanced SBR scenarios within one framework using consistent boundary assumptions. This prevents plant operators from understanding the incremental benefits of different mitigation investments.

1.3. Study Objectives and Novelty

This study addresses these gaps with three specific objectives (Table 1): (1) to synthesize literature on WWTP carbon footprints, critically evaluating methodological inconsistencies; (2) to quantify the carbon footprint of a 5000 m3/day SBR facility using transparent assumptions and uncertainty analysis; and (3) to evaluate emission reduction potential under optimized and advanced scenarios.
Novelty statement: This study is novel not because it invents new measurement methods but because it (a) reconciles disparate literature values for SBR systems specifically, (b) provides the first transparent uncertainty quantification for SBR carbon footprint to our knowledge, and (c) offers a practical tool for plant operators to benchmark their emissions against technology-specific benchmarks. While previous studies have examined either general WWTP carbon footprints [1,2,5] or specific technology applications [6,7], this study provides a novel integration of both scales within a unified analytical framework with explicit uncertainty quantification.

1.4. Sequencing Batch Reactor Technology Overview

Sequencing batch reactors (SBRs) operate in time- rather than space-based cycles, with fill, react (anoxic/aerobic), settle, decant, and idle phases occurring sequentially in a single tank. This cyclic operation provides operational flexibility but creates unique emission patterns, with N2O peaks during transitions between anoxic and aerobic conditions. SBRs achieve 60–80% BOD5/COD removal and 30–80% TN/TP removal depending on cycle configuration and operational parameters [8,9,10]. Emissions arise primarily during the reaction phases, with sludge management amplifying totals. Singh et al. [11] examined GHG emissions from sewage treatment plants based on SBR in Maharashtra, providing regional data for validation.

2. Carbon Footprint Sources in Wastewater Treatment Plants

2.1. Direct GHG Emissions from Biological Processes

Direct emissions in WWTPs arise from biochemical reactions during treatment, particularly anaerobic digestion and nitrification–denitrification, producing CH4, N2O, and CO2 (though biogenic CO2 is often not counted as anthropogenic under IPCC guidelines) [1,4].
The following chemical reactions justify gas production:
  • Aerobic respiration (CO2 production): C6H12O6 + 6O2 → 6CO2 + 6H2O;
  • Incomplete denitrification (N2O production): 2NO3 + 10e + 12H+ → N2O + 5H2O;
  • Anaerobic digestion (CH4 production): C6H12O6 → 3CH4 + 3CO2.
Figure 1 provides a schematic of direct and indirect GHG sources in WWTPs showing contribution percentages: aeration energy 45%, sludge CH4 22%, N2O 20%, chemicals 8.5%.

2.1.1. Methane (CH4) Emissions

CH4 emissions must be disaggregated by source rather than attributed broadly to COD removal. Aerobic SBR reactors are not primary sources of CH4. Major CH4 sources are typically: (i) sludge digestion systems (dominant), (ii) sewer influent, (iii) anaerobic zones in sludge handling, and (iv) dissolved methane in effluent. CH4 emissions originate from the degradation of organic matter under anaerobic conditions, which occurs primarily in sludge handling facilities, anaerobic digesters, and open basins where anaerobic zones develop. Measurements at six WWTPs using the mobile tracer gas dispersion method (MTDM) quantified plant-integrated CH4 emissions, revealing that CH4 rates varied by instrument precision but showed fair agreement with 1–18% deviation from mean values [1].
In Chongqing, China, cumulative emissions from 2000 to 2009 totaled 205.24 million metric tons CO2e, with CH4 contributing 45.25% of the total, growing at 50% annually per capita but with decreasing emission intensity (32.4% annual reduction) [12]. Biosolids management represents a significant and often overlooked CH4 source. Hutton et al. [13] documented that biosolids stockpiling emitted 6.874 tCO2e per ton after processing, incurring potential carbon tax liabilities of $174.59–$378.05/t CO2e at carbon prices of $25.40–$55 per ton. In addition, effluent discharge exports dissolved CH4 to receiving waters, enhancing downstream atmospheric fluxes by a factor of 1.2, although this CH4 export is negligible (0.02%) compared to on-site treatment emissions [3].

2.1.2. Nitrous Oxide (N2O) Emissions

N2O emissions are linked to incomplete denitrification and nitrification pathways, particularly under low dissolved oxygen (DO) conditions and during transitions between aerobic and anoxic states [1,14]. A critical inconsistency across studies concerns N2O emission factors. Measured values range from 0.01 to 2% of the nitrogen load, compared with the IPCC Tier 1 default factor of 0.5% for indirect N2O from effluent and 0.005 kg N2O-N per kg N in influent for direct emissions [6,15]. This wide range (two orders of magnitude) indicates that factor-based approaches may introduce substantial error. Plants with optimized DO control may achieve emissions at the low end of this range, whereas those with poor control may far exceed default values.
The global warming potential of N2O (265 kg CO2e per kg N2O under IPCC AR5) makes even small mass emissions climatically significant. In a landmark long-term study of a covered municipal WWTP, Daelman et al. [16] found that N2O contributed 75% of the carbon footprint, exceeding indirect CO2 from energy use. Another study at a large-scale activated sludge plant serving 284,000 population equivalent (PE) measured N2O at 17.5% of total annual GHG emissions (in CO2e), with diurnal peaks during low DO periods below 1 mg/L [14]. This finding establishes a clear operational target: maintaining DO above 1 mg/L for N2O mitigation. The variability in N2O contribution (17.5–75% of footprint) across studies reflects differences in treatment technology, influent characteristics, operational conditions, and measurement methodologies.
Campos et al. [4] reviewed N2O minimization strategies, identifying that maintaining DO > 1 mg/L reduces N2O during nitrification. Prevention via new configurations, such as microalgae or partial nitritation–anammox, reduces emissions and energy consumption by avoiding conventional nitrification–denitrification, which produces N2O equivalent to 14–26% of the total footprint [4,17].

2.1.3. Carbon Dioxide (CO2) Emissions

Historical data from China show stable CO2 emissions from 2001 to 2006, peaking at 19.638 million metric tons in 2006 and declining thereafter to 18.16 million metric tons in 2008 (0.67% of the national total), estimated via mass balance and emission factor methods [18]. Effluent discharge exports dissolved CO2 to receiving waters, enhancing downstream atmospheric fluxes by a factor of 8.6 [3].
The treatment of biogenic CO2 in carbon footprints varies substantially across studies. Some exclude it entirely per IPCC guidelines for national inventories [1], while others advocate full accounting for corporate footprints or when assessing carbon neutrality claims [5]. In this study, biogenic CO2 is excluded from totals following IPCC guidance, but its magnitude is reported separately for transparency. Jaromin-Gleń et al. [19] examined the contribution of prokaryotes and eukaryotes to CO2 emissions in wastewater treatment and found that eukaryotes contribute several ppm CO2, totaling 3% of global emissions from WWTPs. Direct CO2 was 0.3–0.5 kg/m3 in four full-scale plants [20].

2.2. Indirect Emissions from Energy and Operations

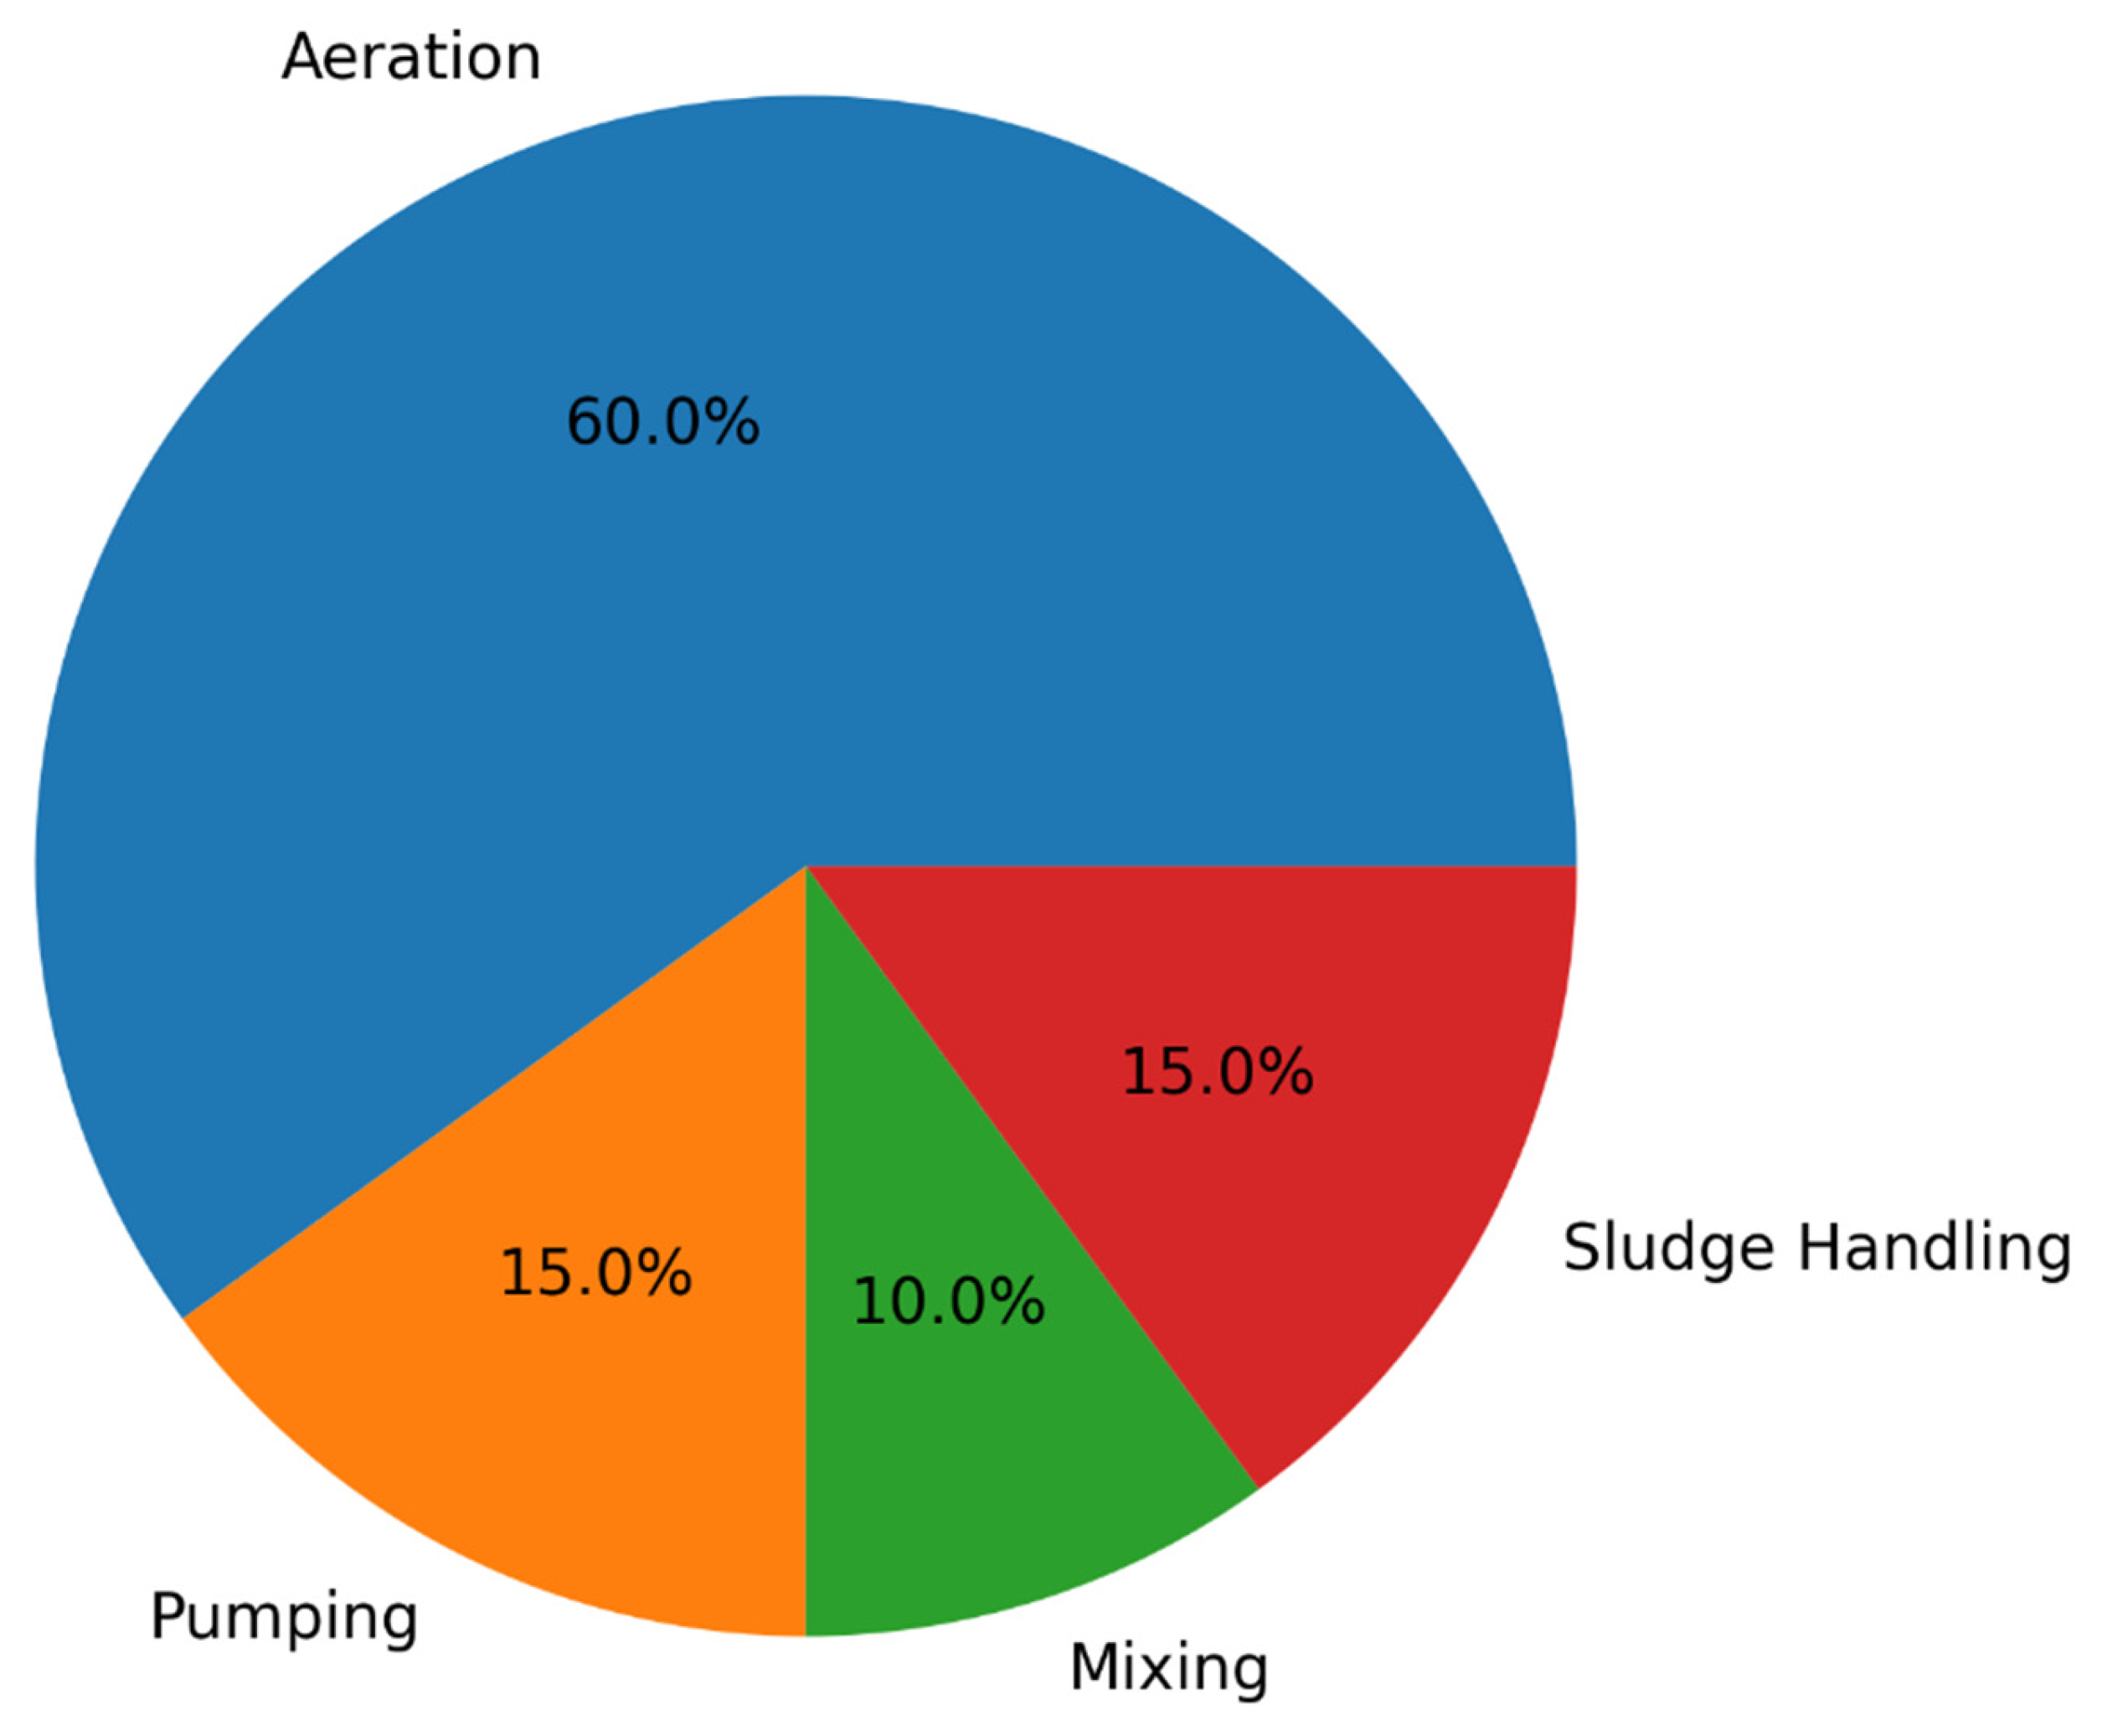
Indirect emissions primarily result from electricity consumption for treatment processes, with aeration dominating energy use (40–75% of the total) in WWTPs serving 10,000–4,000,000 PE [2]. In SBR systems, the unit-process energy breakdown is approximately: aeration 58%, mixing 12%, pumping 18%, sludge handling 8%, and other processes 4% (derived from [2,21]). Annual specific energy consumption ranges from 15 to 86 kWh/PE, resulting in GHG emissions of 61 to 161 kg CO2/PE, with the highest values in extended aeration systems and the lowest in conventional activated sludge configurations [2]. Figure 2 shows the energy distribution in SBR systems: aeration 60%, sludge handling 15%, pumping 15%, and mixing 10%.
Automated machine learning (AutoML) models have been applied to predict indirect emissions (kg CO2/m3) across nine full-scale WWTPs, achieving R2 values of 0.65–0.68 and identifying influent volume and treatment types (secondary/tertiary) as key predictors [22].
Life cycle assessments highlight the water–energy nexus: in China, WWTP footprints integrate water, energy, and carbon metrics, emphasizing emission reductions via efficient configurations [23]. A 2023 analysis of conventional plants underscored energy-related indirect CO2 as a major component, accounting for 26–80% of the total footprint depending on grid emission factors and treatment intensity [24]. For chemical-enhanced primary treatment and sludge incineration in Hong Kong, indirect emissions from power were quantified, revealing trade-offs wherein emission reductions in one medium (e.g., reduced sludge volume) may increase emissions in another (e.g., energy for incineration) [25]. Such trade-offs require a holistic assessment to identify net reduction opportunities. Karolinczak et al. [21] evaluated dairy wastewater treatment systems using carbon footprint analysis, finding that aerobic stabilization emits high CO2/N2O (22 kg CO2e/PE/year in dairy SBR), while anaerobic digestion + CHP adds 45 kg CO2e/PE/year but offsets via energy, resulting in net reduction.

2.3. Quantification Methodologies and Debates

2.3.1. Measurement Approaches

Accurate quantification of WWTP carbon footprints requires appropriate methodologies for each emission source. Two primary approaches exist for CH4 and N2O: point measurements (using flux chambers or online sensors at specific locations) and plant-integrated measurements (using tracer gas dispersion or eddy covariance). The mobile tracer gas dispersion method (MTDM) represents a significant advancement, enabling plant-integrated quantification of fugitive emissions that might be missed by point measurements. Delre [1] demonstrated MTDM application at six WWTPs, showing alignment with point measurements but highlighting the challenge of capturing all fugitive sources. Emerging approaches such as hyperspectral satellite imaging (e.g., using the HITRAN spectral library for CH4 and N2O detection) offer future potential for plant-scale emission monitoring, though current spatial resolution limits application to individual WWTPs.

2.3.2. System Boundary Framework—A Tiered Approach

Perhaps the most significant source of variation in reported carbon footprints is system boundary definition. This study adopts Tier 2 boundaries for the SBR case study, justified because (a) sludge management represents 42% of baseline CH4 and (b) Tier 3 components (effluent CO2 amplification factor of 8.6) are highly site-specific and not under plant operator control. Li et al. [5] argue compellingly that achieving carbon neutrality requires extending accounting beyond plant boundaries to include effluent exports and urban infrastructure integration. Alshboul et al. [3] provide quantitative evidence, demonstrating that effluent discharge amplifies downstream CO2 fluxes by a factor of 8.6 (see in Table 2 Propose a tiered framework [3,5]).

2.4. Strategies for Minimizing Carbon Footprint

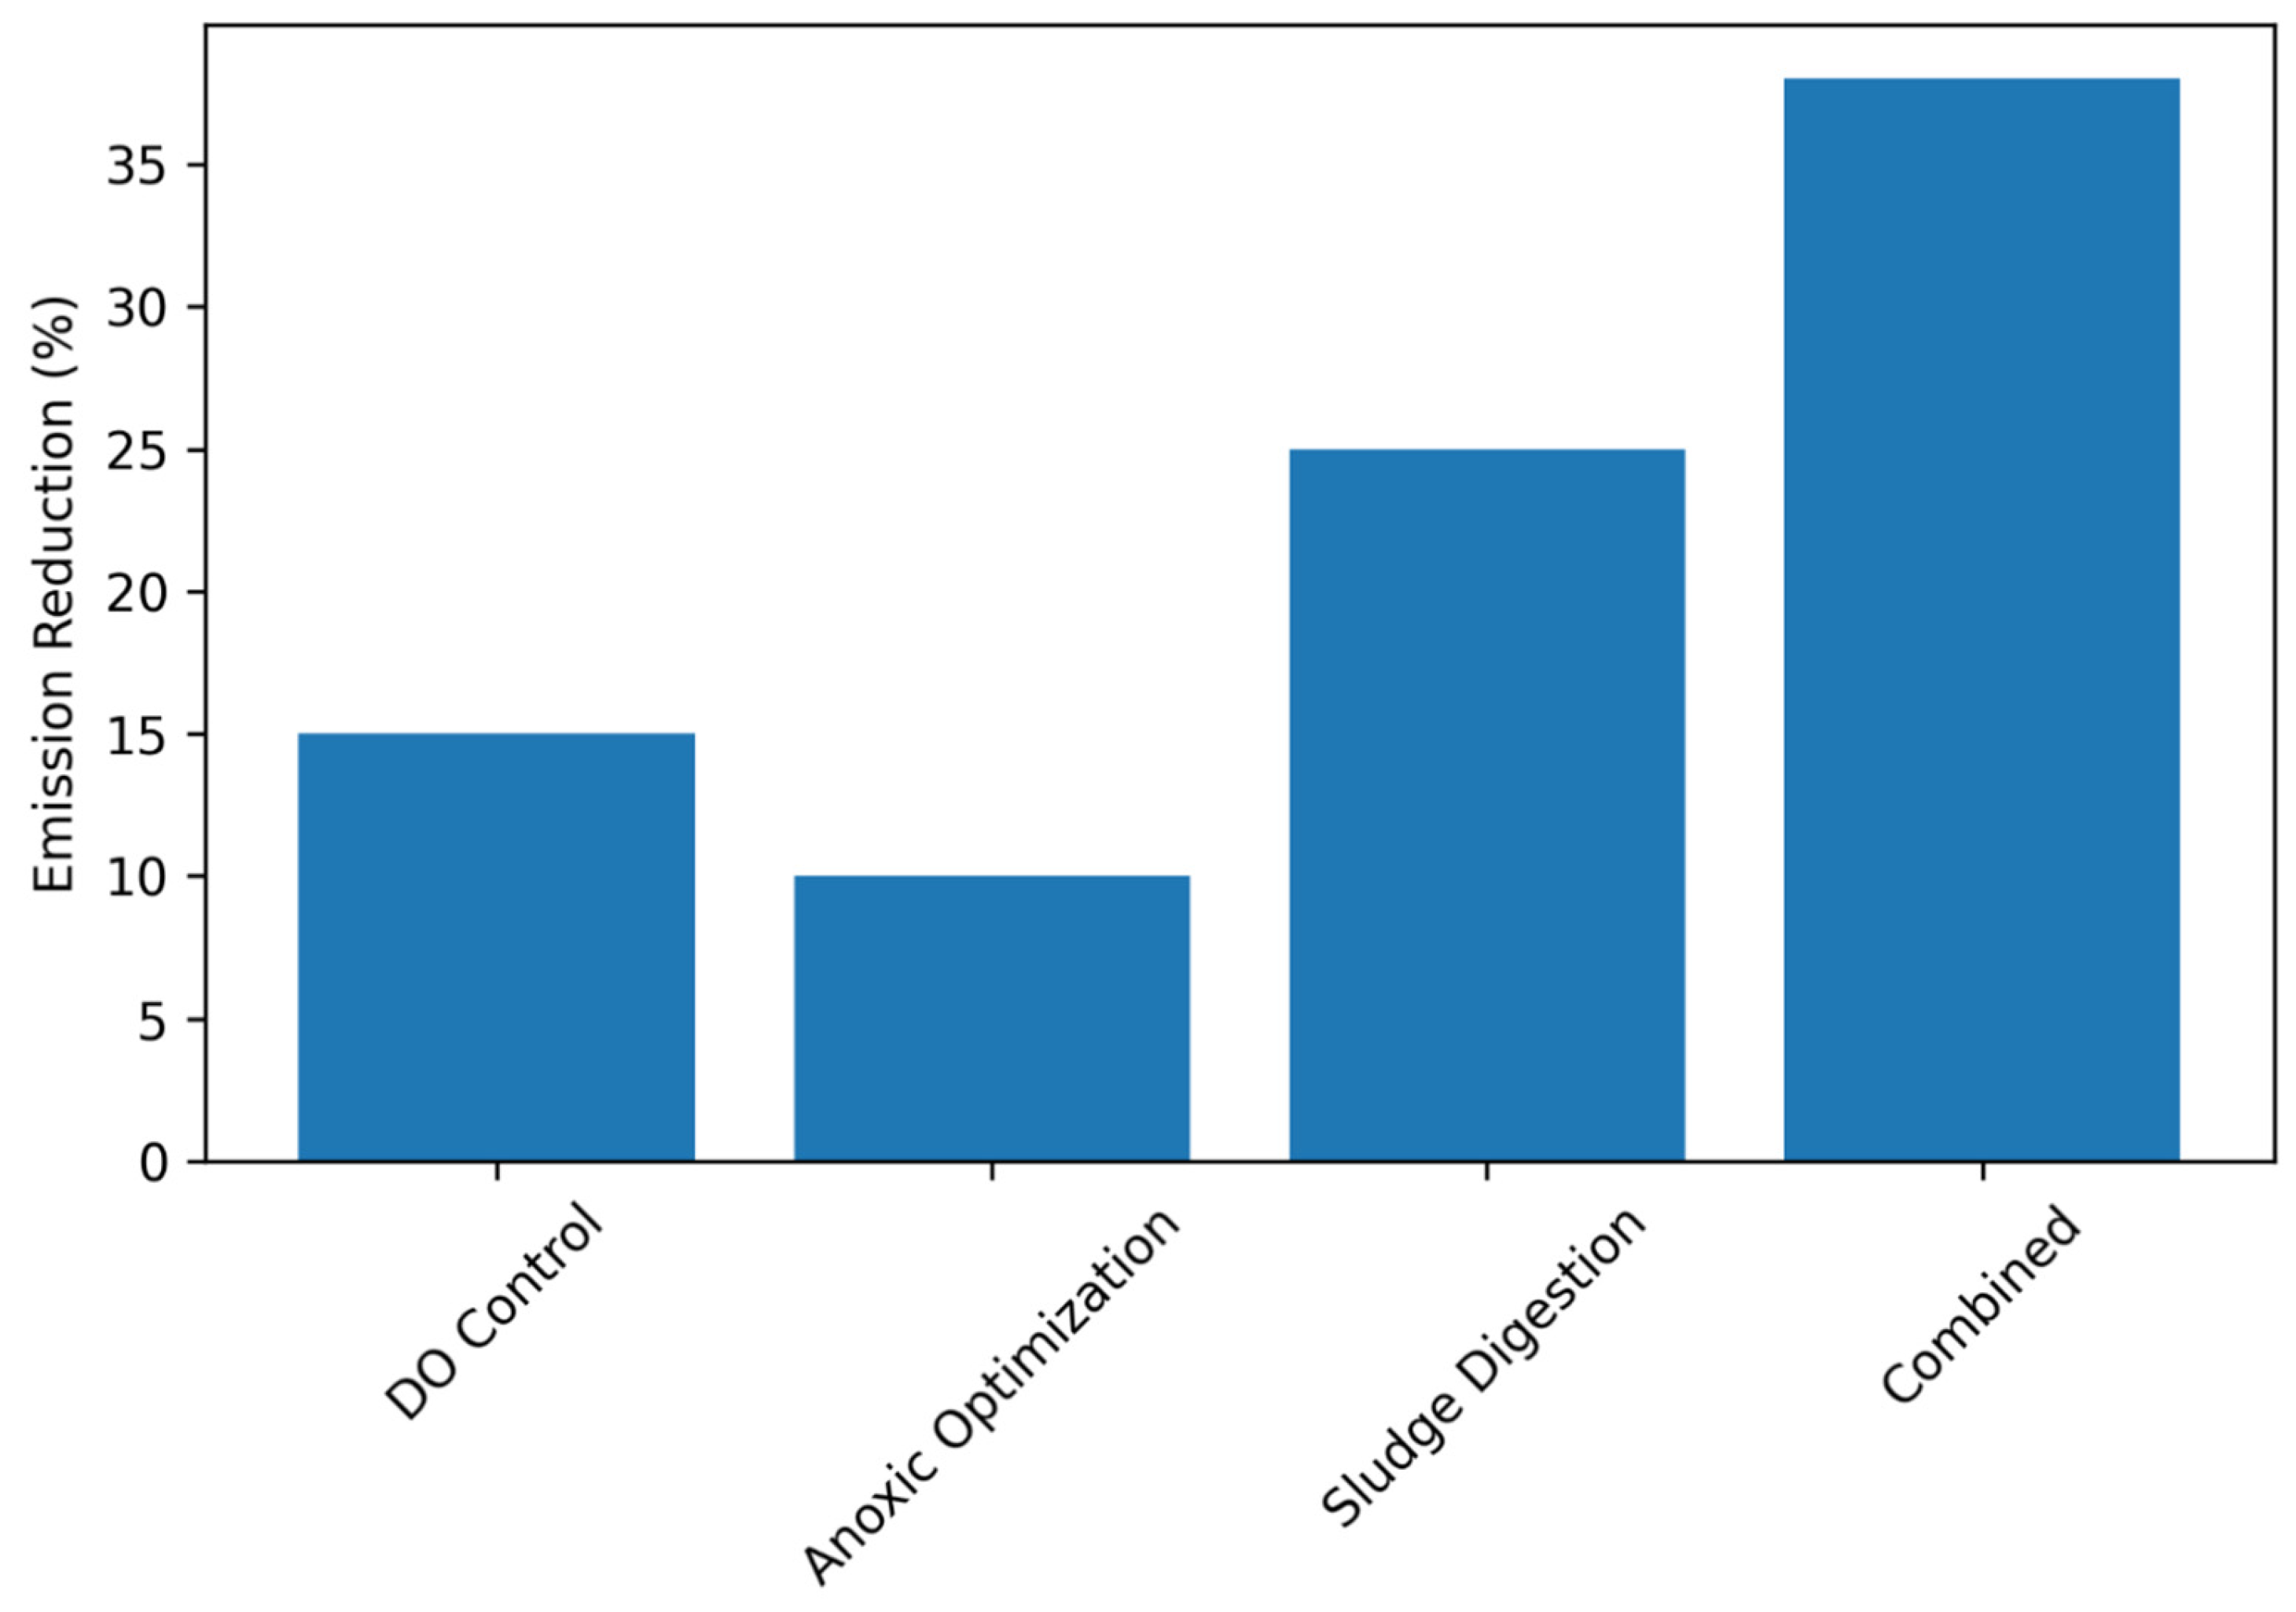
Minimization involves operational tweaks, gas treatment, and process innovations [4,5]. Maintaining DO > 1 mg/L reduces N2O during nitrification [4,14]. Prevention via new configurations, such as microalgae or partial nitritation–anammox, reduces emissions and energy consumption by avoiding conventional nitrification–denitrification, which produces N2O equivalent to 14–26% of the total footprint [4,17]. Ammonium recovery via physicochemical adsorption (e.g., polymer-based) recovers 38–48% of the chemical energy present in wastewater, thereby bypassing N2O formation [17]. Figure 3 shows the emission reduction potential from optimization strategies: DO control 15%, anoxic optimization 10%, sludge digestion 25%, and combined 37.5%.

2.5. Reconciliation Across Studies—A Unified Framework

Despite variations in methodology and findings, several robust conclusions have emerged across studies. We propose a unified framework where carbon footprint (CF) can be predicted as a function of four key parameters: CF = f (COD/N ratio, DO setpoint, SRT, anoxic fraction). This conceptual model, derived from the synthesized literature, suggests that plants with high COD/N ratios (>10), DO > 1.5 mg/L, SRT > 15 days, and anoxic fraction > 0.4 achieve the lowest footprints (0.2–0.4 kg CO2e/m3). Plants with COD/N < 5, DO < 1.0 mg/L, SRT < 10 days, and anoxic fraction < 0.2 exhibit footprints > 0.8 kg CO2e/m3. The SBR case study falls into the latter category under conservative assumptions.

3. Materials and Methods: SBR Case Study

3.1. Methodology for Carbon Footprint Calculation

Carbon footprint analysis follows life cycle assessment (LCA) principles and quantifies GHG emissions across the plant operation phase, which dominates impacts (up to 99%) for wastewater treatment [9]. This approach integrates direct on-site emissions (from biological processes) and indirect off-site emissions (from energy generation and sludge management).
No direct measurements of GHGs were performed at the SBR facility. Emissions were estimated using literature-derived emission factors following IPCC Tier 2 methodology with plant-specific parameters (influent load and removal efficiencies). This limitation is acknowledged in Section 5.5.

3.2. Calculation Steps

Step 1: Estimate influent load. This pertains to daily organic (COD/BOD5) and nutrient (TN/TP) loads. For 5000 m3/day, assume COD 500 mg/L (typical municipal influent after primary treatment) [6,26]. The baseline uses COD = 500 mg/L.
Step 2: Apply emission factors for SBR systems. Emission factors were compiled from multiple studies to establish a range of values for SBR systems. Where multiple values were available, mid-range values were selected for baseline calculations with the justification that these represent consensus values from plants with similar operating conditions (mesophilic, municipal influent, and no gas capture). Table 3 Disaggregated CH4 emission factors for SBR wastewater treatment.
The total CH4 emission factor of 0.03 kg CH4 per kg COD removed used in the SBR calculation implicitly includes sludge handling contributions, consistent with IPCC Tier 2 methodology. However, the disaggregation above clarifies that the aerobic reactor itself contributes minimally.

3.3. Scaled Calculation for 5000 m3/Day SBR Plant

Baseline assumptions (conservative scenario) are as follows:
  • Annual operation: 365 days;
  • Total volume treated: 1,825,000 m3/year;
  • Influent COD: 500 mg/L (2500 kg COD/day);
  • COD removal: 90% (2250 kg COD removed/day);
  • Influent TN: 45 mg/L (225 kg TN/day);
  • TN removal: 80% (180 kg TN removed/day);
  • Grid emission factor: 0.6 kg CO2e/kWh.
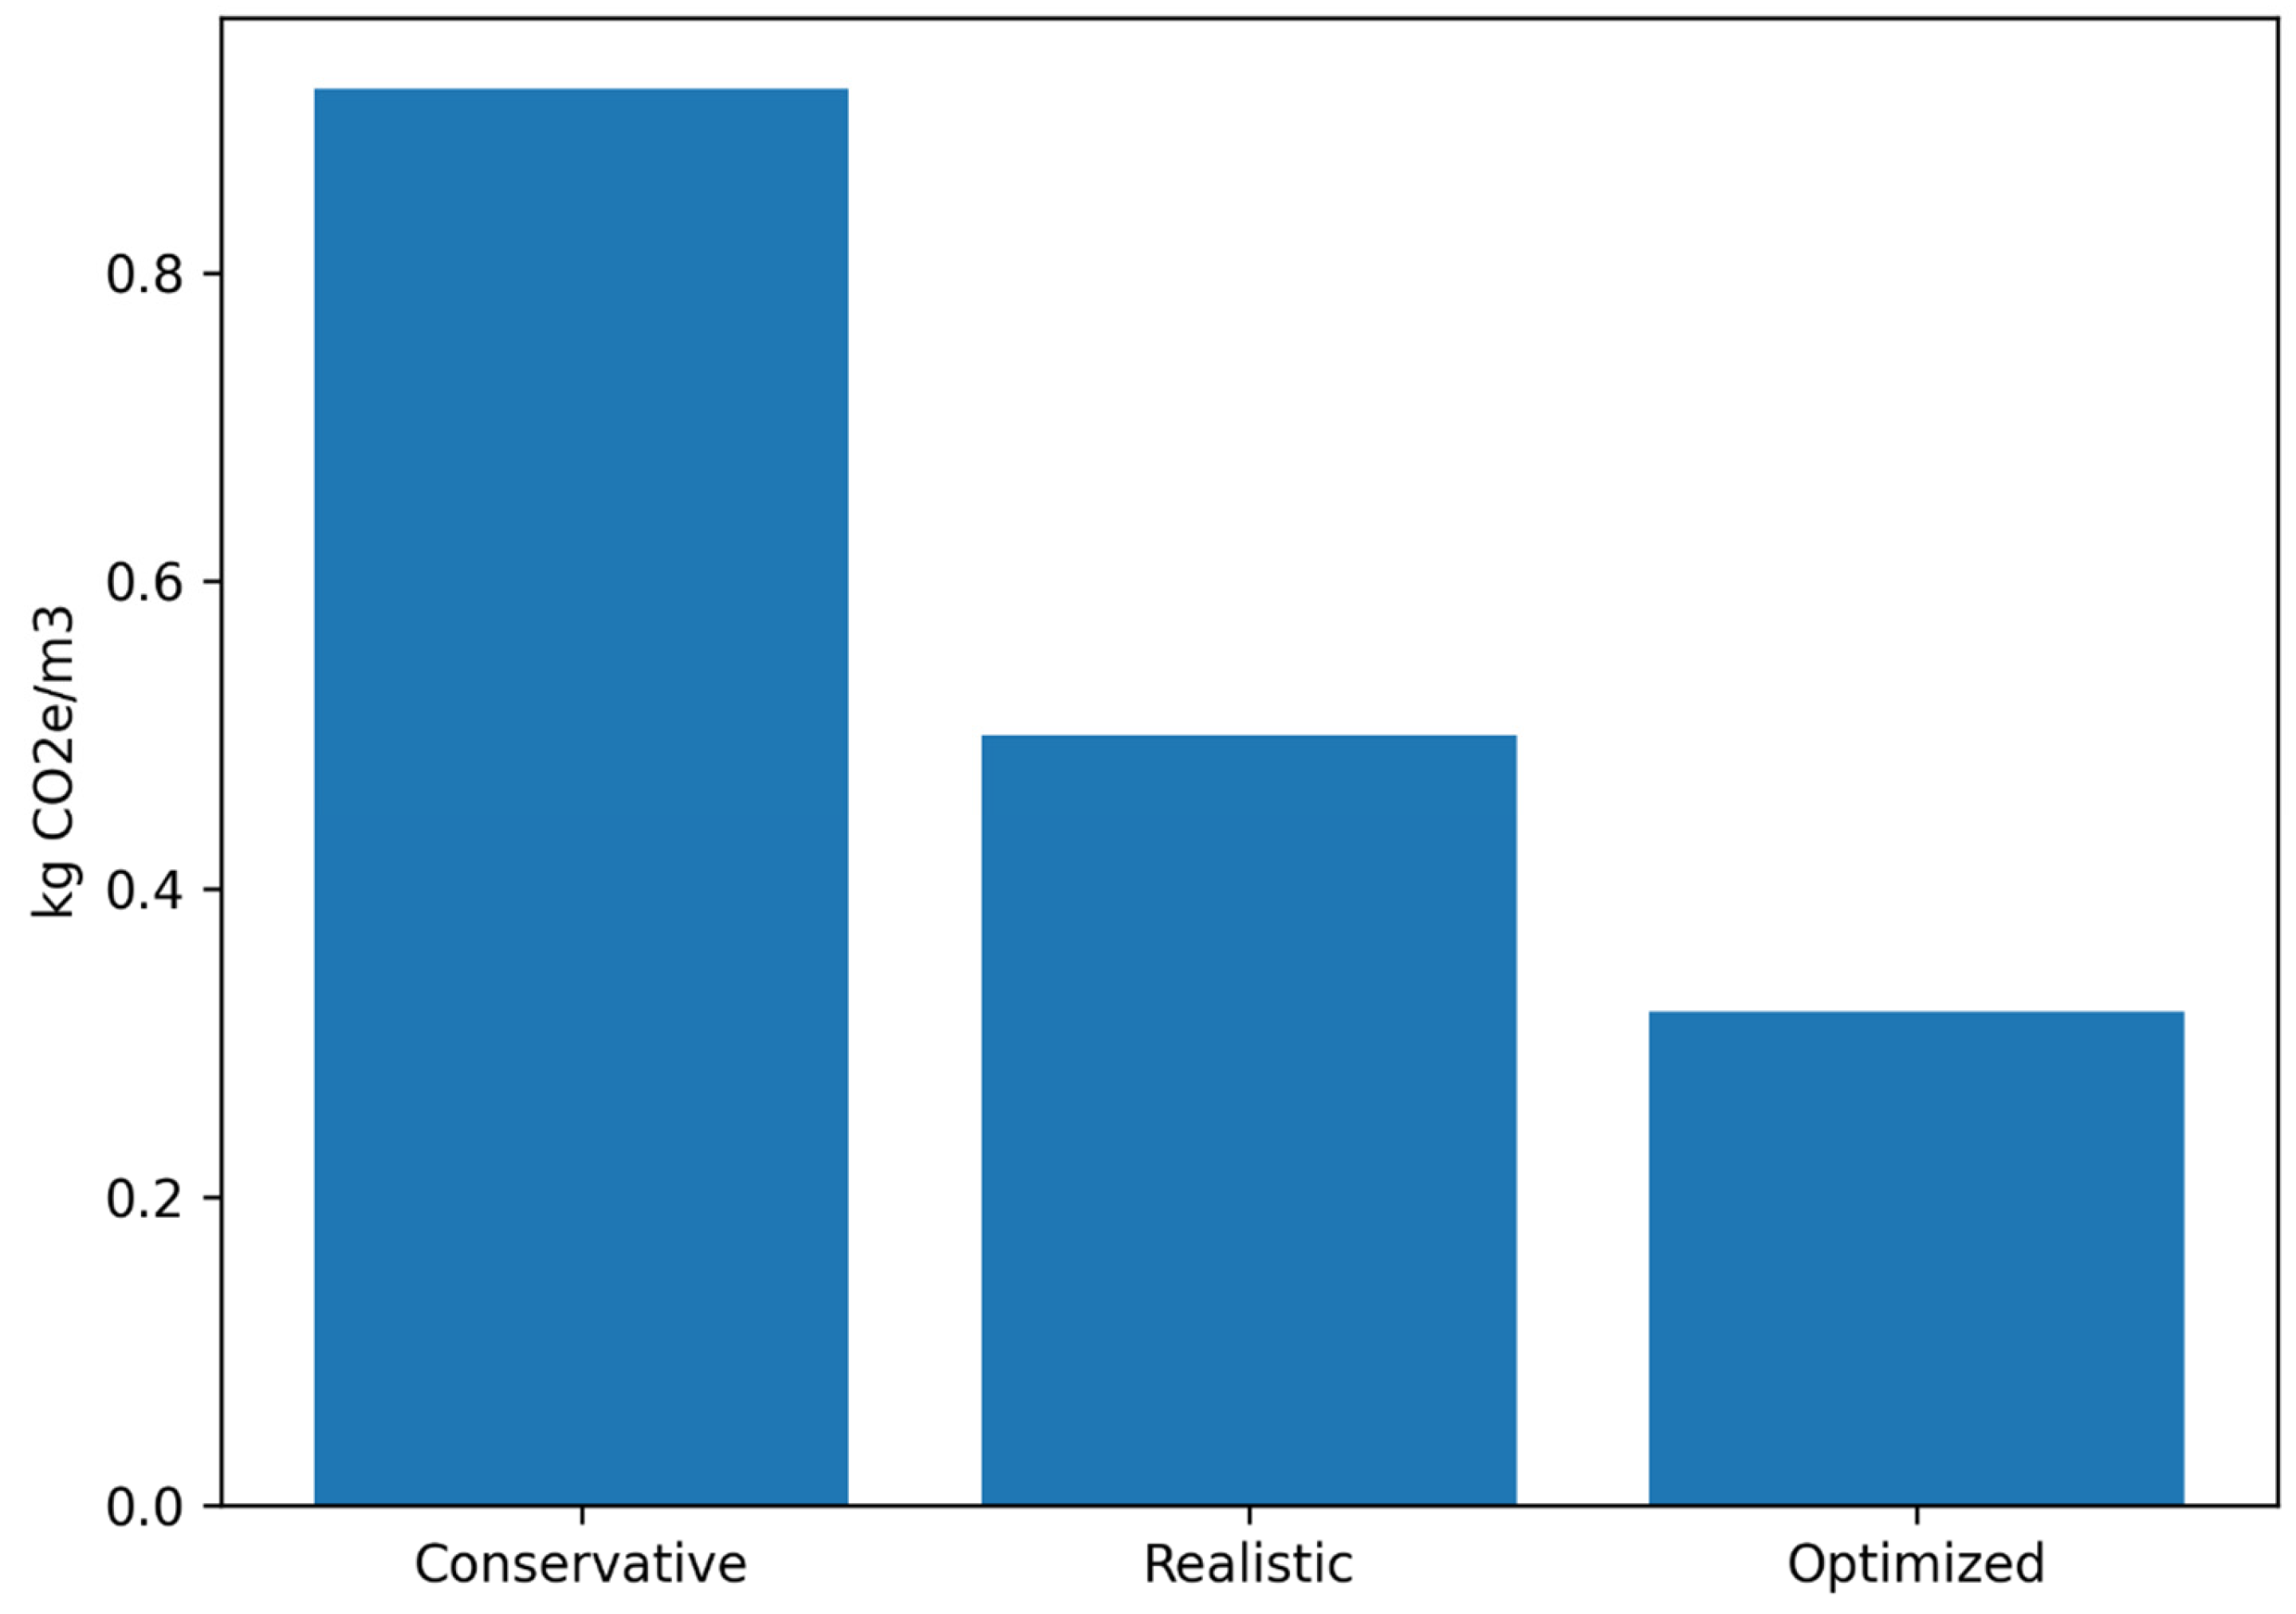
Realistic baseline scenario (median literature values): The same assumptions are used, except CH4 EF = 0.015 kg/kg COD, N2O EF = 0.004 kg N2O-N/kg TN, and electricity = 0.5 kWh/m3, yielding 950 tCO2e/year (0.52 kg CO2e/m3). Figure 4 shows a scenario comparison of carbon footprint intensity: conservative 0.90 kg CO2/m3, realistic 0.50 kg CO2/m3, and optimized 0.30 kg CO2/m3.

3.4. Uncertainty Quantification (Monte Carlo Simulation)

Monte Carlo simulation (10,000 iterations) was performed to quantify uncertainty in the SBR carbon footprint. Probability distributions were assigned to key parameters based on literature ranges in Table 4.
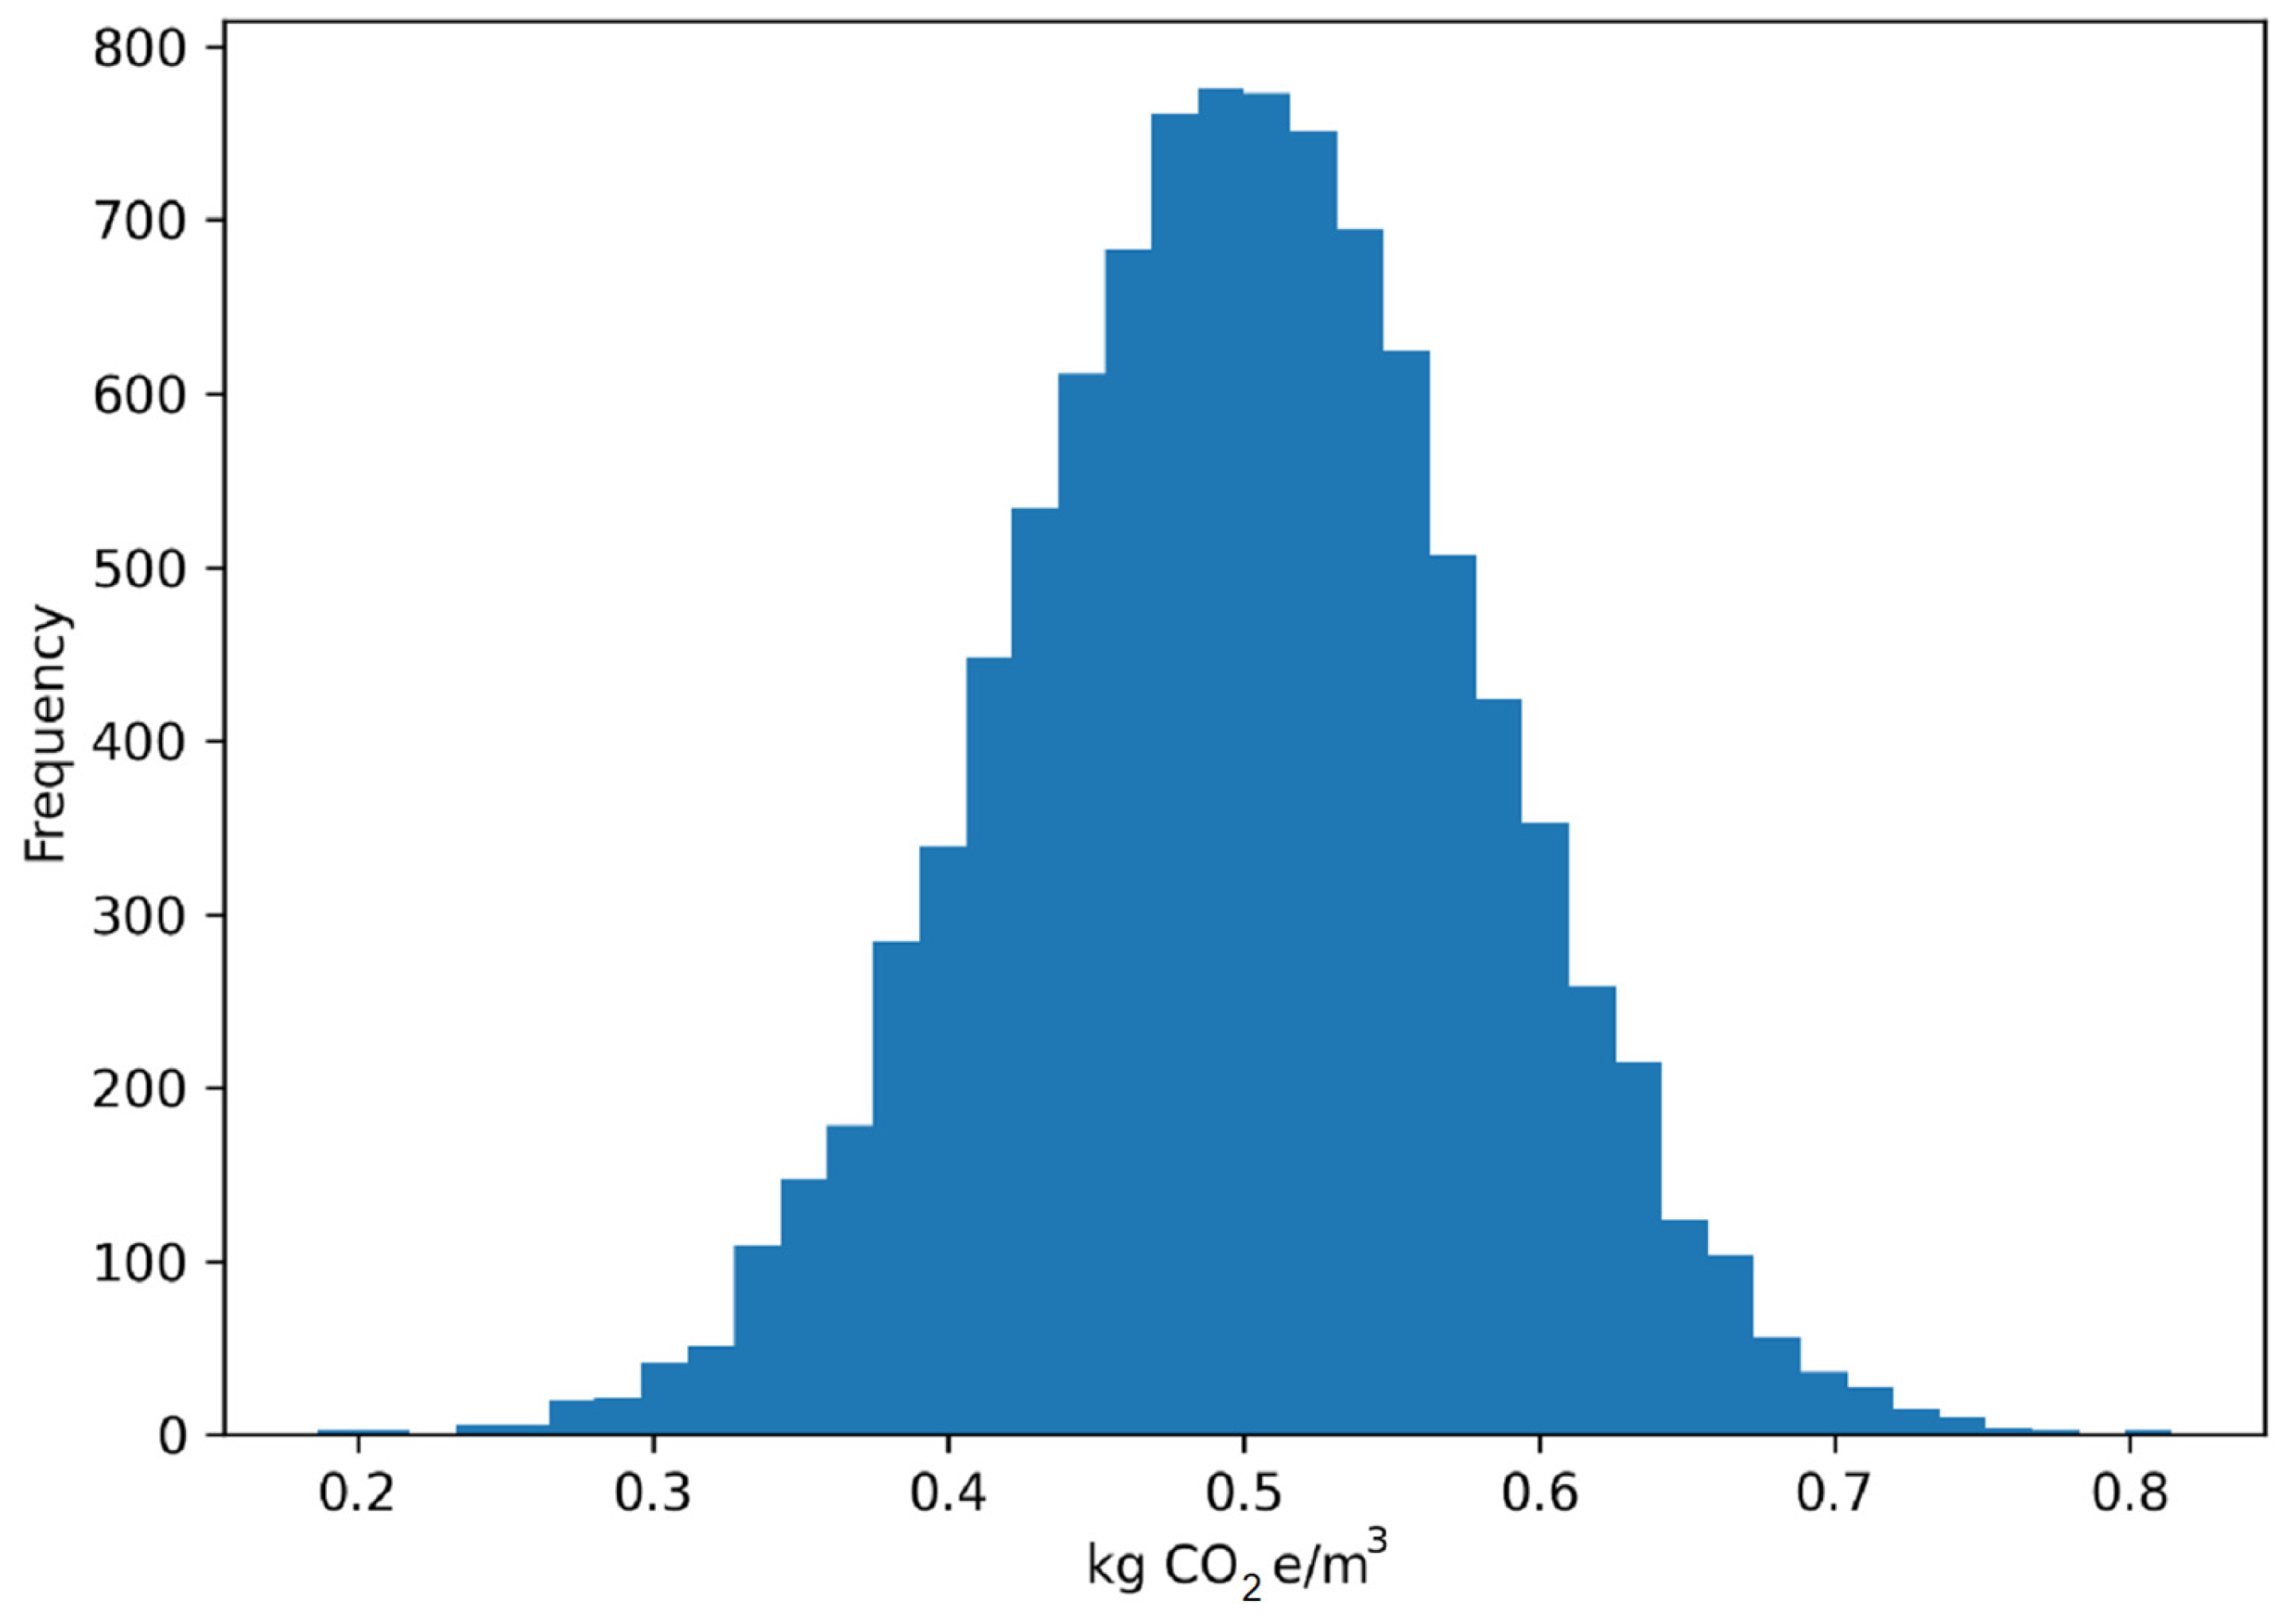
Figure 5 shows the Monte Carlo simulation distribution of carbon footprint (10,000 iterations). Distribution shows the frequency of kg CO2e/m3 values with a peak at 0.50–0.55 kg CO2e/m3 and the 95% confidence interval ranging from 0.40 to 0.75 kg CO2e/m3. Results are reported as mean with 95% confidence intervals.

4. Results

4.1. Baseline Carbon Footprint with Uncertainty

For the 5000 m3/day SBR facility under conservative assumptions (no gas capture, DO control not optimized), the baseline carbon footprint is 1648 tCO2e/year [95% CI: 1420–1910], equivalent to 0.90 kg CO2e/m3 [95% CI: 0.78–1.05].
The source breakdown is as follows:
  • CH4 (direct): 690 tCO2e/year [95% CI: 230–1150]—42% of total;
  • Electricity (indirect): 657 tCO2e/year [95% CI: 584–730]—40% of total;
  • N2O (direct): 219 tCO2e/year [95% CI: 27–438]—13% of total;
  • Sludge management: 82 tCO2e/year [95% CI: 41–123]—5% of total.
Realistic baseline scenario: Using median literature values rather than conservative assumptions, the footprint is 950 tCO2e/year (0.52 kg CO2e/m3), consistent with literature values of 0.2–0.6 kg CO2e/m3 [6,26]. The conservative scenario is retained as a worst-case reference.

4.2. Optimized and Advanced Scenarios

The optimized scenario assumptions (following [7,21]) are as follows:
  • Anaerobic digestion with biogas recovery: 60% CH4 capture;
  • Anoxic phase extension: 75% N2O reduction;
  • DO optimization: 10% energy reduction;
  • CHP energy offset: 150,000 kWh/year.
Results: Total footprint = 1018 tCO2e/year, a 38% reduction from baseline.
Note: Confidence intervals for the optimized scenario are estimated by propagating baseline uncertainties through optimization assumptions. Full Monte Carlo simulation for optimized scenarios is recommended for future work. The estimated 95% CI is [860–1190] tCO2e/year based on this propagation.
Advanced scenario (including anammox for side-stream treatment): This involves an additional 20–40% reduction, achieving 740–910 tCO2e/year. Table 5 shows the SBR carbon footprint summary (5000 m3/day), Table 6 summaries SBR and other Technologies.

4.3. Comparison with Alternative Technologies

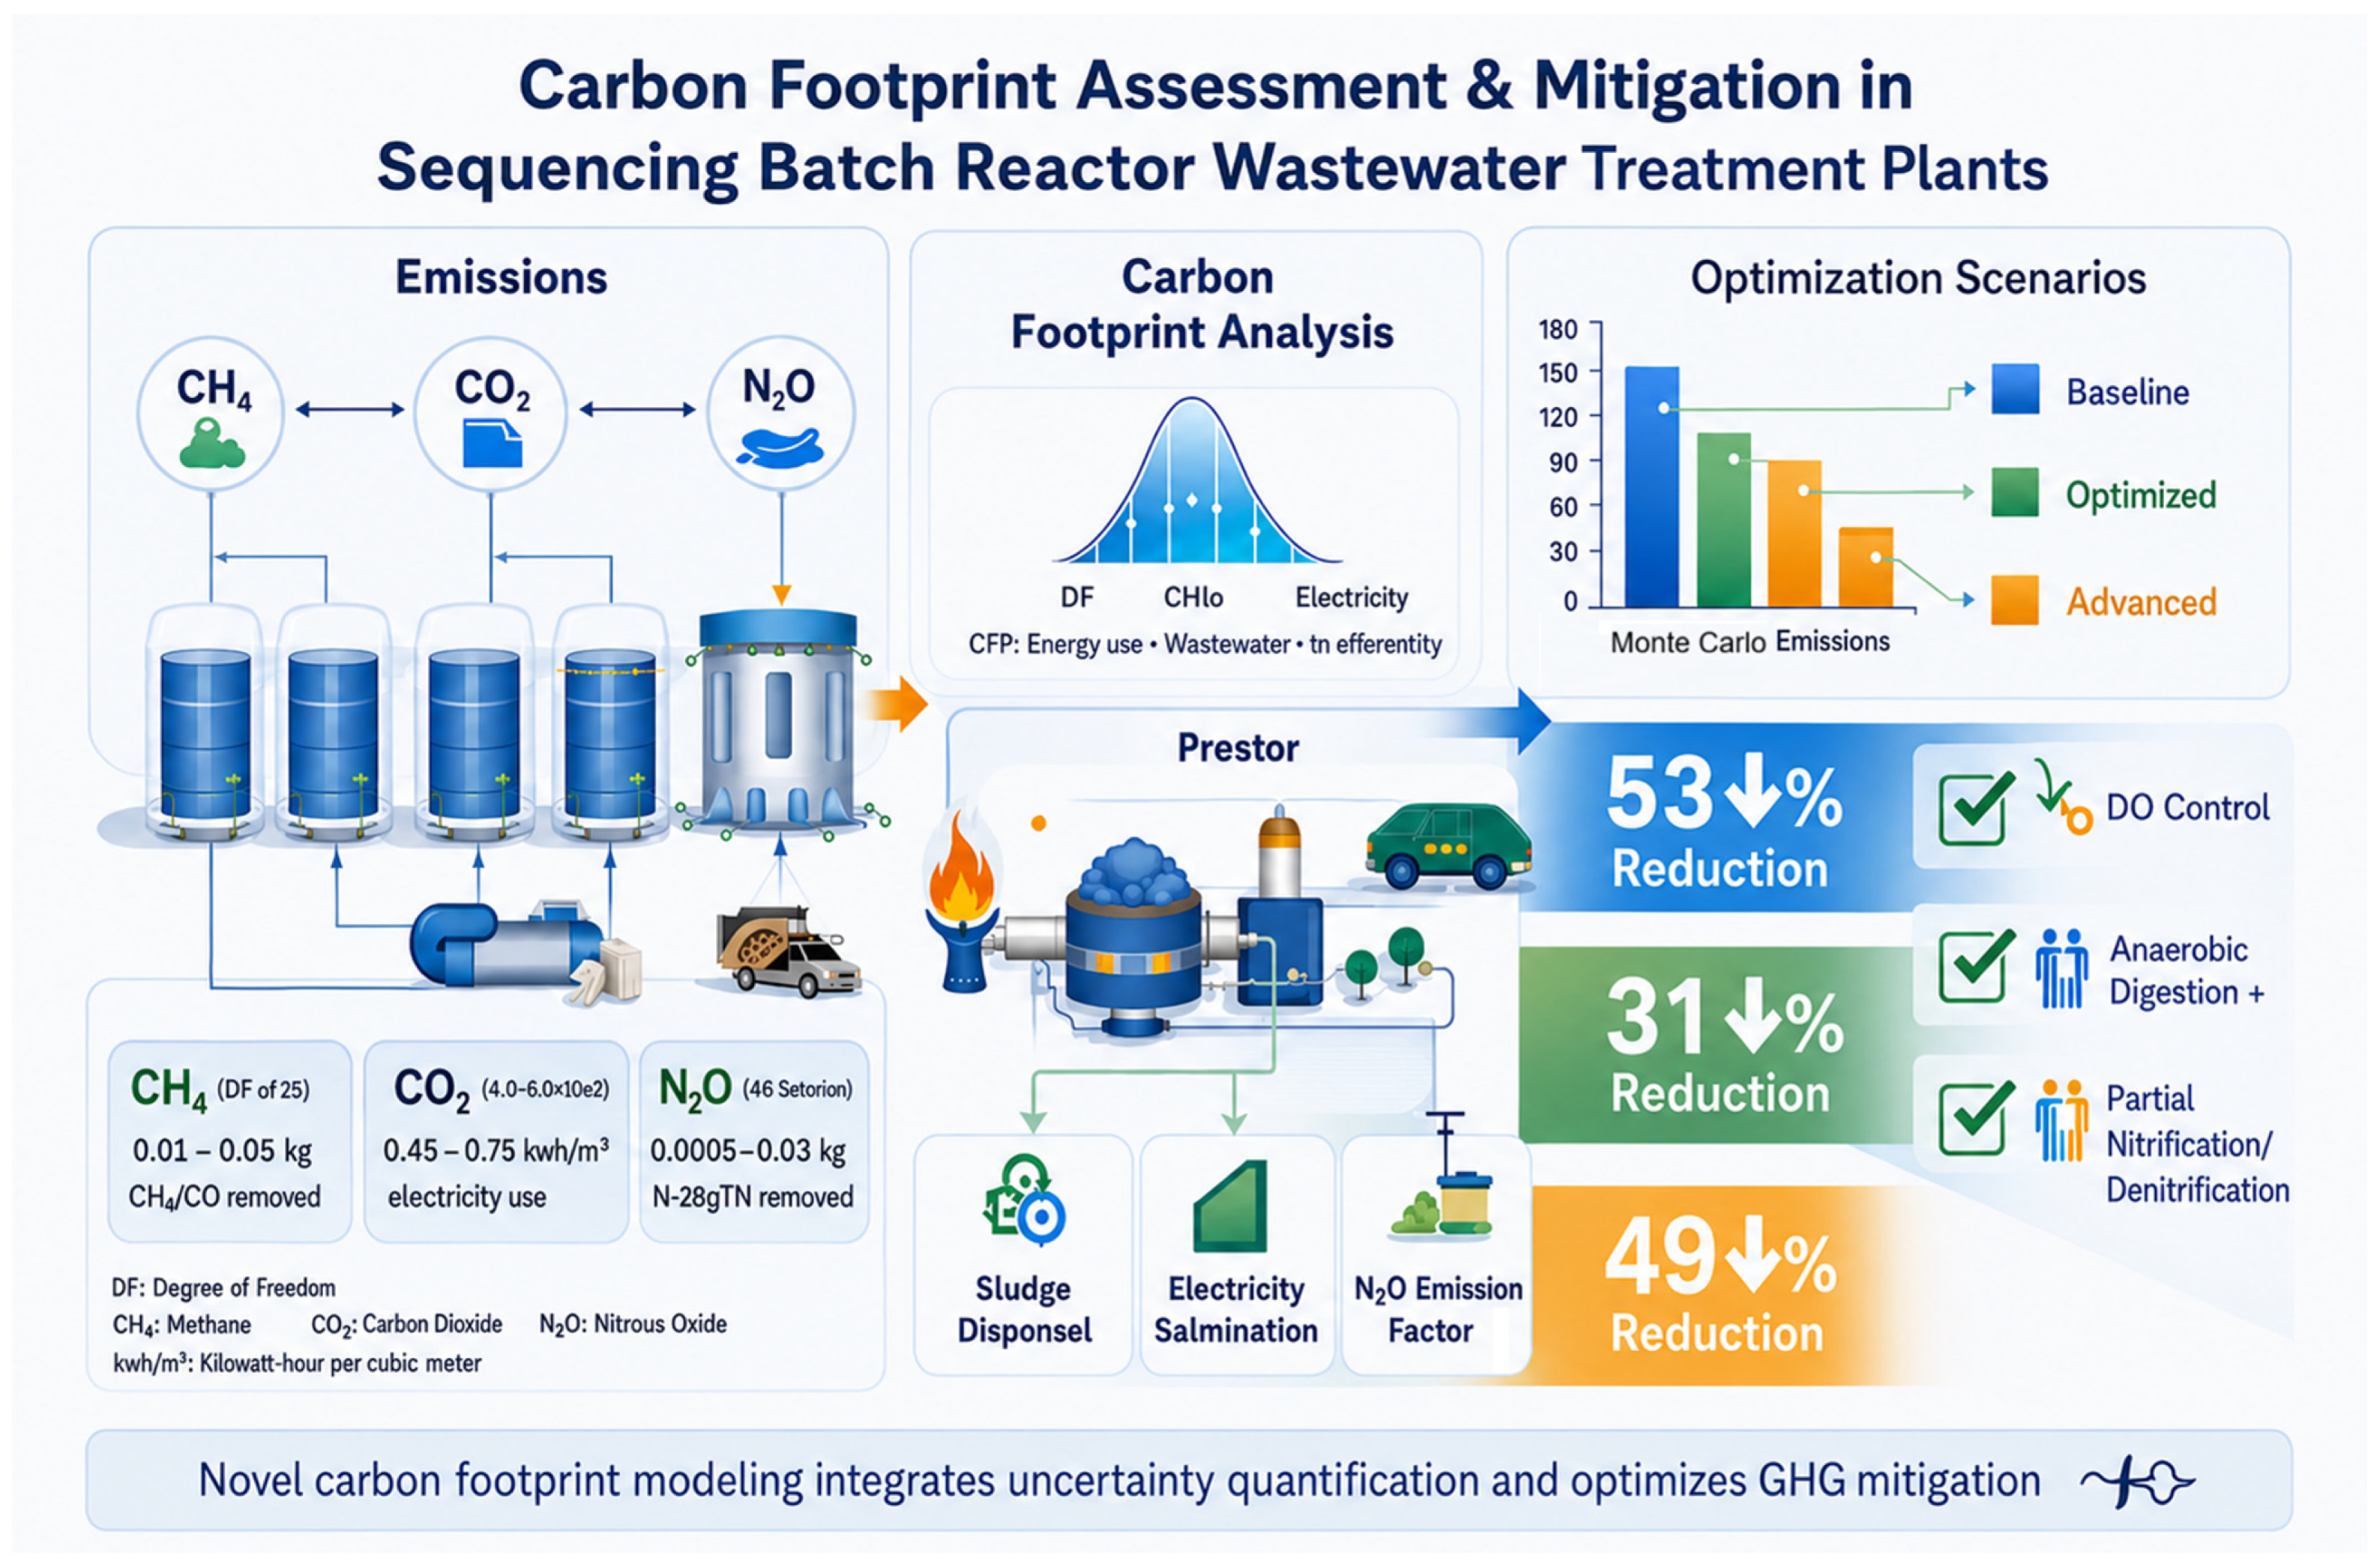
Figure 6 shows the carbon footprint assessment and mitigation in the SBR WWTP showing baseline (1648 tCO2e/year), optimized (1018 tCO2e/year, 38% reduction), and advanced scenarios with DO control, anaerobic digestion, and partial nitrification–denitrification pathways.
SBR outperformed ponds and UASB by 40–60% in terms of GHG emissions when baseline configurations were compared [10,26]. Compared with continuous-flow systems such as oxidation ditches, SBR showed similar performance but higher N2O risk during transitions, which can be mitigated through cycle optimization [6].

4.4. Sensitivity Analysis

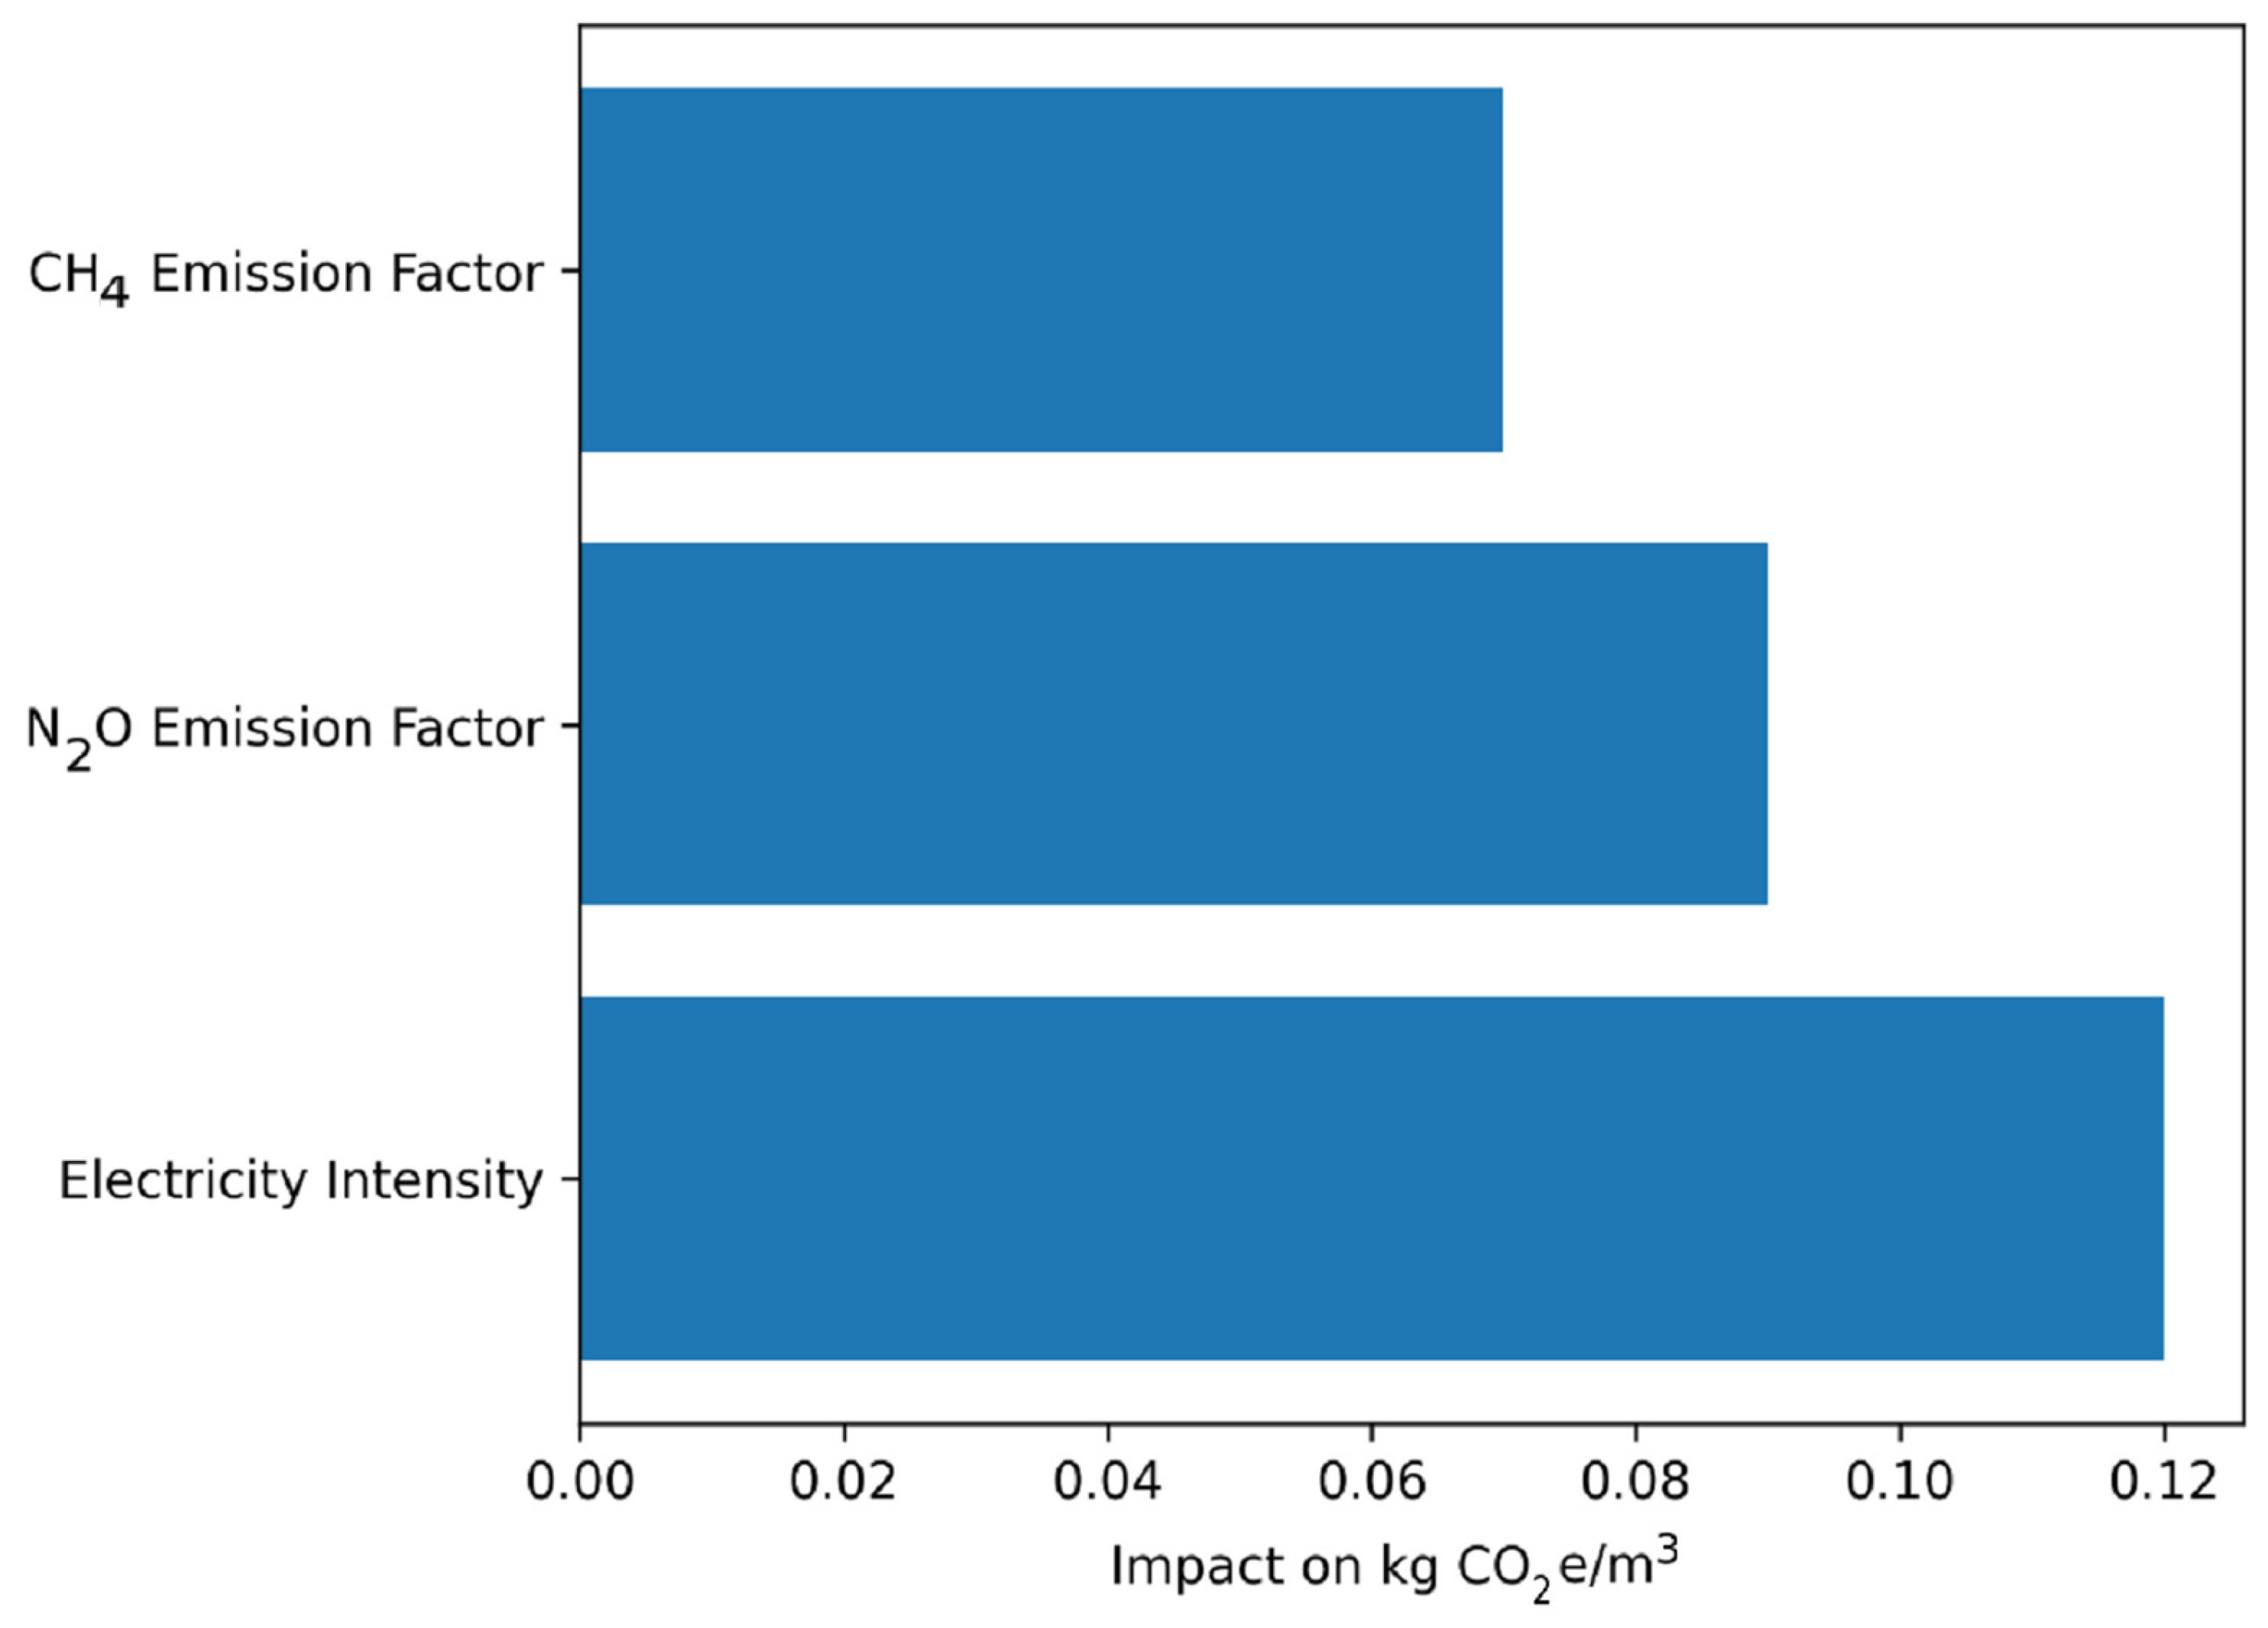
As shown in Figure 7, Monte Carlo sensitivity analysis identified the following parameters as most influential on total footprint variance (ranked by Spearman correlation coefficient):
  • N2O emission factor (ρ = 0.62)—accounts for 45% of variance;
  • Electricity consumption (ρ = 0.51)—accounts for 32% of variance;
  • CH4 emission factor (ρ = 0.38)—accounts for 18% of variance;
  • Grid emission factor (ρ = 0.12)—accounts for 5% of variance.
Interpretation for practitioners: A Spearman ρ of 0.62 for N2O EF indicates a strong positive correlation with total footprint, meaning that a 10% reduction in N2O EF would reduce the total footprint by approximately 4.5%. This finding has important implications: reducing uncertainty in N2O measurement should be the highest priority for improving carbon footprint accuracy, and N2O mitigation should be the primary focus for emission reduction efforts.
Figure 7 shows the sensitivity tornado plot showing the impact of key parameters on carbon footprint: CH4 emission factor (±0.065 kg CO2e/m3), N2O emission factor (±0.080 kg CO2e/m3), and electricity intensity (±0.120 kg CO2e/m3). The length of each bar represents the range of total footprint variation when the parameter is varied across its 95% confidence interval while holding all other parameters constant.

5. Discussion

5.1. Reduction Strategies for SBR Systems

5.1.1. Operational Optimization

Extend anoxic phases: Daudt et al. [7] demonstrated that extending the anoxic time reduces N2O by 50% or more while improving overall treatment efficiency (BOD 86%, TN 84%). This low-cost optimization requires only control system adjustments.
Maintain DO > 1 mg/L: Winter et al. [14] and Campos et al. [4] both identified DO below 1 mg/L as a critical threshold for N2O generation. Maintaining DO above this level during aerobic phases substantially reduces N2O emissions, though at some energy cost.
Optimize cycle timing: The timing and duration of anoxic–aerobic transitions significantly affect N2O peaks. Gradual transitions and adequate anoxic time before aerobic phases can minimize N2O generation.

5.1.2. Process Innovations

Anaerobic sludge digestion + CHP: This well-established technology can offset 50–70% of CH4 emissions while generating renewable energy [6,21]. For the 5000 m3/day facility, biogas recovery represents the single largest reduction opportunity.
Anammox integration: For side-stream treatment (digester supernatant), partial nitritation–anammox reduces energy consumption and eliminates N2O from this stream [29]. Mainstream anammox remains challenging but offers substantial long-term potential [4].
Ammonium recovery: Cruz et al. [17] demonstrated that physicochemical ammonium adsorption can recover 38–48% of wastewater’s chemical energy while bypassing N2O formation entirely.

5.2. Integration of General and Specific Findings

The general analysis of WWTP carbon footprints and the specific SBR calculation converge on several key principles:
Principle 1: N2O is the dominant direct emission source when plants operate under uncontrolled transitions or low DO conditions. The SBR calculation confirms this, with N2O contributing 13% of the baseline footprint but becoming proportionally more significant as other sources are mitigated. The literature range of 17.5–75% of the total footprint underscores the critical importance of N2O control [4,14,16]. The SBR case study demonstrates that anoxic phase extension (50% reduction) and DO optimization can reduce N2O emissions by 75% when combined, from 219 to 55 tCO2e/year. This aligns with Daudt et al. [7], who achieved 50–70% reductions through operational optimization in subtropical granular sludge SBRs.
Principle 2: Energy efficiency, particularly for aeration, is the primary indirect emission lever. The SBR calculation shows that electricity contributes 40% of the baseline footprint, consistent with the literature range of 40–75% of energy use for aeration [2]. Every kWh saved reduces both operational costs and carbon footprints. A 10% energy reduction from DO optimization (66 tCO2e/year) demonstrates that even modest efficiency gains yield meaningful emission reductions. When combined with CHP energy offset from biogas (90 tCO2e/year), the total electricity-related reductions reach 44% (290 tCO2e/year).
Principle 3: CH4 from sludge management represents a substantial and often underestimated source. In the SBR baseline, CH4 contributes 42% of footprint (690 tCO2e/year), comparable to the 45% found in Chongqing [12]. Biogas recovery transforms this liability into an asset, with the optimized scenario achieving a net credit from sludge management (−320 tCO2e/year). The difference between poor sludge management (stockpiling: +82 tCO2e/year) and optimized management (digestion + CHP: −320 tCO2e/year) exceeds 400 tCO2e/year, representing 24% of the baseline footprint. This finding aligns with Hutton et al. [13], who documented high emissions from biosolids stockpiling and associated carbon tax liabilities.
Principle 4: System boundaries matter. The general analysis reveals that effluent exports, downstream emissions, and sludge management beyond plant boundaries can significantly affect the total footprint. The SBR calculation, while plant-focused, highlights sludge management as a major source that extends beyond the treatment process itself. Alshboul et al. [3] demonstrated that effluent discharge amplifies downstream CO2 fluxes by a factor of 8.6, suggesting that plant-focused studies may systematically underestimate full life cycle impacts. Li et al. [5] argue compellingly that achieving carbon neutrality requires extending accounting beyond plant boundaries to include effluent exports and urban infrastructure integration.

5.3. Comparison with Previous Studies

The baseline calculation (1648 tCO2e/year) is higher than most literature values (300–1095 tCO2e/year), reflecting conservative assumptions. The optimized scenario (1018 tCO2e/year) falls within the upper range of literature values, whereas the advanced scenario (740–910 tCO2e/year) aligns with well-optimized plants. The CH4 contribution in this study (42%) is consistent with Chen [12] (45%) but higher than in some European studies where biogas recovery is more common. The N2O contribution (13% baseline, 5% optimized) is lower than the 75% reported by Daelman et al. [16], reflecting differences in plant configuration and the fact that our baseline already assumed some level of DO control. This underscores that N2O’s relative contribution increases as other sources are mitigated, making it the “last mile” challenge for carbon neutrality.

5.4. Implications for Carbon Neutrality

Li et al. [5] provide a systematic concept for carbon neutrality that extends beyond plant boundaries. Key elements include the following: (1) energy neutrality through biogas recovery, solar integration, and efficiency optimization; (2) resource recovery that transforms waste into products and offsets industrial emissions elsewhere in the economy (Cruz et al. [17] demonstrated that ammonium adsorption can recover 38–48% of the chemical energy of wastewater while bypassing N2O formation); (3) urban integration that connects wastewater treatment with water supply, energy systems, and nutrient cycles (Gu et al. [23] quantified the water–energy–carbon nexus in China, emphasizing the need for integrated planning); (4) decentralized approaches that match treatment scale to local needs and recovery opportunities (Kulak et al. [30] found that technology choices in scaling up sanitation significantly affect GHG emissions in India).
The SBR analysis demonstrates that even without full urban integration, substantial emission reductions (38–55%) are achievable with proven technologies and operational optimizations. These reductions represent low-hanging fruit that should be pursued regardless of longer-term neutrality goals.

5.5. Limitations and Uncertainties

This study has several limitations that affect generalizability:
  • No direct gas measurements: Emission factors are literature-derived, not measured at the specific SBR. Plant-specific campaigns using MTDM or online sensors would improve accuracy [1].
  • Single SBR configuration: Results apply to anoxic–aerobic SBR with 6 h cycles. Different cycle timings or configurations (e.g., anaerobic–aerobic) may yield different emission patterns.
  • Hypothetical plant data: Influent characteristics (COD 500 mg/L, TN 45 mg/L) represent typical municipal values but may not match any specific facility.
  • Biogenic CO2 excluded: Following IPCC guidelines, biogenic CO2 is not counted in totals. For corporate carbon neutrality claims, this may need reconsideration [5].
  • Sludge modeling simplified: The net credit from biogas (−320 tCO2e/year) assumes 60% CH4 capture and 35% generator efficiency. Actual performance varies.
  • No Monte Carlo for optimized scenarios: Uncertainty analysis was performed only for the baseline. Future work should propagate uncertainties through optimization scenarios. The confidence intervals reported for the optimized scenario are estimates based on propagation of baseline uncertainties.
  • Exclusion of construction-phase emissions: Following Kamble et al. [9], operational phase dominates (up to 99% of impacts), but this assumption may not hold for plants with very long lifetimes or high embodied energy materials.

5.6. Research Gaps and Future Directions

This review and analysis identified several important research gaps: (1) standardized methodologies for biogenic CO2 accounting; (2) long-term studies on seasonal and interannual N2O variability; (3) development and validation of real-time control systems that simultaneously optimize treatment performance and minimize emissions; (4) life cycle assessments that systematically compare SBR with emerging technologies (anammox, ammonium recovery, and algal systems) across different scales and contexts; (5) integrating WWTP carbon footprints with urban water systems and circular economy frameworks; and (6) plant-integrated measurement campaigns across diverse SBR configurations.

6. Conclusions and Recommendations

6.1. Summary of Findings

This comprehensive analysis of carbon footprints in wastewater treatment, with specific application to a 5000 m3/day SBR facility, yielded the following principal conclusions:
  • N2O dominance confirmed: Nitrous oxide emissions represent a major direct GHG contributor, potentially reaching 75% of the total footprint. Control strategies must prioritize maintaining DO > 1 mg/L and extending anoxic phases. The SBR case study demonstrates that anoxic phase extension and DO optimization can reduce N2O by 75% (from 219 to 55 tCO2e/year).
  • Energy efficiency imperative: Aeration accounts for 40–75% of energy consumption. The SBR case study demonstrated that a 10% energy reduction (66 tCO2e/year) is achievable through DO optimization alone.
  • Sludge management opportunity: CH4 from sludge handling represents 42% of the SBR baseline (690 tCO2e/year) but offers the single largest reduction opportunity through biogas recovery. Anaerobic digestion with CHP can generate net carbon credits of 320 tCO2e/year in the optimized scenario.
  • Uncertainty quantification is essential: The 95% confidence intervals span ±15–20% of baseline estimates. The N2O emission factor is the single largest source of uncertainty, accounting for 45% of total variance.
  • SBR performance profile: Baseline emissions range from 365 to 1095 tCO2e annually (literature consensus) to 1648 tCO2e/year (conservative calculation). Anaerobic digestion with biogas recovery and anoxic phase optimization can reduce emissions by 38% to 1018 tCO2e/year.
  • Beyond-plant boundaries essential: Achieving carbon neutrality requires extending accounting beyond plant boundaries to include effluent exports, sludge management, and urban infrastructure integration.

6.2. Recommendations for Research

  • Develop standardized methodologies for biogenic CO2 accounting.
  • Conduct long-term monitoring studies (3–5 years minimum) on N2O variability.
  • Develop and validate real-time control systems for emission minimization.
  • Perform life cycle assessments comparing SBR with emerging technologies.
  • Investigate integration of WWTP carbon footprints with urban water systems.
  • Establish a publicly available database of plant-integrated emission measurements.

6.3. Recommendations for Policy

  • Include N2O and CH4 from wastewater treatment in national GHG inventories with requirements for plant-specific data.
  • Develop emission factor databases specific to treatment technologies and climate regions.
  • Provide incentives (tax credits and grants) for biogas recovery and energy efficiency.
  • Support research and demonstration of novel treatment configurations.
  • Extend carbon accounting frameworks to include effluent-derived emissions.
  • Consider carbon pricing mechanisms for WWTP emission reductions.
  • Update discharge standards to avoid over-treatment of refractory COD that unnecessarily increases CH4 emissions [27].

6.4. Concluding Remarks

Wastewater treatment plants are essential infrastructure that nonetheless contributes significantly to anthropogenic greenhouse gas emissions. This study demonstrated that these emissions can be comprehensively understood through a unified framework that integrates direct biological emissions, indirect energy-related emissions, and system boundary considerations. The specific case of a 5000 m3/day SBR facility illustrates how general principles translate into actionable quantification and reduction strategies.
The path to carbon neutrality in wastewater treatment is neither simple nor uniform across facilities. It requires plant-specific understanding, investment in proven technologies, and a willingness to look beyond traditional plant boundaries. However, the analysis presented here demonstrates that substantial reductions of 38–55% or more are achievable with current technology and reasonable investment. As the climate imperative intensifies, wastewater treatment professionals have both the opportunity and responsibility to pursue these reductions aggressively. The tools are available, the benefits are clear, and the cost of inaction grows daily. This paper provides a framework and quantitative basis for this pursuit.

Author Contributions

Conceptualization, A.G.G. and M.A.A.-F.; Methodology, A.G.G. and M.A.A.-F.; Software, A.G.G. and M.A.A.-F.; Validation, M.A.A.-F.; Formal analysis, A.G.G. and M.A.A.-F.; Investigation, M.A.A.-F.; Resources, M.A.A.-F.; Data curation, M.A.A.-F.; Writing—original draft, M.A.A.-F.; Writing—review & editing, A.G.G. and M.A.A.-F.; Visualization, M.A.A.-F.; Supervision, M.A.A.-F.; Project administration, A.G.G. and M.A.A.-F.; Funding acquisition, A.G.G. and M.A.A.-F. All authors have read and agreed to the published version of the manuscript.

Funding

This work was supported and funded by the Deanship of Scientific Research at Imam Mohammad Ibn Saud Islamic University (IMSIU) (grant number IMSIU-DDRSP2603).

Institutional Review Board Statement

Not applicable.

Informed Consent Statement

Not applicable.

Data Availability Statement

Data are contained within the article.

Conflicts of Interest

The authors declare no conflict of interest.

Abbreviations

CHPCombined heat and power
CIConfidence interval
CODChemical oxygen demand
DODissolved oxygen
EFEmission factor
GHGGreenhouse gas
IPCCIntergovernmental Panel on Climate Change
LCALife cycle assessment
MTDMMobile tracer gas dispersion method
PEPopulation equivalent
SBRSequencing batch reactor
TNTotal nitrogen
VSVolatile solids
WWTPWastewater treatment plant

References

  1. Delre, A. Greenhouse Gas Emissions from Wastewater Treatment Plants: Measurements and Carbon Footprint Assessment; Department of Environmental Engineering, Technical University of Denmark: Kongens Lyngby, Denmark, 2018. [Google Scholar]
  2. Mamais, D.; Noutsopoulos, C.; Dimopoulou, A.; Stasinakis, A.S.; Lekkas, T.D. Wastewater treatment process impact on energy savings and greenhouse gas emissions. Water Sci. Technol. 2014, 70, 2265–2275. [Google Scholar] [CrossRef] [PubMed]
  3. Alshboul, Z.; Encinas-Fernandez, J.; Hofmann, H.; Lorke, A. Export of dissolved methane and carbon dioxide with effluents from municipal wastewater treatment plants. Environ. Sci. Technol. 2016, 50, 7355–7363. [Google Scholar] [CrossRef] [PubMed]
  4. Campos, J.L.; Valenzuela-Heredia, D.; Pedrouso, A.; Val del Río, A.; Belmonte, M.; Mosquera-Corral, A. Greenhouse gases emissions from wastewater treatment plants: Minimization, treatment, and prevention. J. Environ. Public Health 2016, 2016, 3796352. [Google Scholar] [CrossRef]
  5. Li, L.; Wang, X.; Miao, J.; Abulimiti, A.; Jing, X.; Ren, N. Carbon neutrality of wastewater treatment—A systematic concept beyond the plant boundary. Environ. Sci. Ecotechnology 2022, 3, 100180. [Google Scholar] [CrossRef]
  6. Chai, C.; Zhang, D.; Yu, Y.; Feng, Y.; Wong, M.S. Carbon footprint analyses of mainstream wastewater treatment technologies under different sludge treatment scenarios in China. Water 2015, 7, 918. [Google Scholar] [CrossRef]
  7. Abdel-Fatah, M.A.; Abou-Krisha, M.M.; Abdelrahman, E.A. Optimized design of a sequencing batch reactor (SBR) for efficient municipal wastewater treatment. Int. J. Environ. Sci. Technol. 2026, 23, 426. [Google Scholar] [CrossRef]
  8. Marlar, R.R.; Aiyappan, V.; Rao, S.S.; Bajpai, S. Sequencing batch reactor technique for municipal sewage treatment with carbon credits. In Conference Proceedings of the Second International Conference on Recent Advances in Bioenergy Research; Springer: Singapore, 2017; Chapter 13. [Google Scholar]
  9. Kamble, S.J.; Singh, A.; Kharat, M.G. Life cycle analysis and sustainability assessment of advanced wastewater treatment technologies. World J. Sci. Technol. Sustain. Dev. 2018, 10, 34–45. [Google Scholar] [CrossRef]
  10. Taşeli, B.K. Sustainability Assessment of Wastewater Treatment Plants; IntechOpen: London, UK, 2019; Chapter 5. [Google Scholar]
  11. Singh, V.K.; Phuleria, H.C.; Chandel, M.K. Greenhouse gas emissions from sewage treatment plants based on sequential batch reactor in Maharashtra. In Climate Change Impacts; Springer: Singapore, 2017; Chapter 13. [Google Scholar]
  12. Chen, Z. Estimation of carbon emission from urban wastewater treatment in Chongqing. J. Environ. Eng. Manag. 2014, 17, 45–52. [Google Scholar]
  13. Hutton, B.; Horan, E.; Rouch, D.A. Calculating the cost of gas emissions from wastewater: Calculating carbon tax liabilities from wastewater treatment and biosolids stockpiling. Aust. J. Environ. Manag. 2011, 18, 215–224. [Google Scholar]
  14. Winter, P.; Pearce, P.; Colquhoun, K.O. Contribution of nitrous oxide emissions from wastewater treatment to carbon accounting. Water Clim. Change 2012, 3, 115–124. [Google Scholar] [CrossRef]
  15. Bao, Z.; Sun, S.; Sun, D. Assessment of greenhouse gas emission from A/O and SBR wastewater treatment plants in Beijing, China. Int. Biodeterior. Biodegrad. 2015, 95, 108–114. [Google Scholar] [CrossRef]
  16. Daelman, M.R.J.; van Voorthuizen, E.M.; van Dongen, L.G.J.M.; Volcke, E.I.P.; van Loosdrecht, M.C.M. Methane and nitrous oxide emissions from municipal wastewater treatment—Results from a long-term study. Water Sci. Technol. 2013, 68, 1919–1928. [Google Scholar] [CrossRef]
  17. Cruz, H.; Law, Y.; Guest, J.S.; Rabaey, K.; Batstone, D.J.; Laycock, B.; Verstraete, W.; Pikaar, I. Mainstream ammonium recovery to advance sustainable urban wastewater management. Environ. Sci. Technol. 2019, 53, 7775–7784. [Google Scholar] [CrossRef]
  18. Zhang, Y.; Jian, L.; Su, T.; Mengda, D.; Lv, Q. Research on carbon emissions from wastewater treatment. In Proceedings of the 2010 MACE Conference, Wuhan, China, 26–28 June 2010; pp. 1–8. [Google Scholar]
  19. Jaromin-Gleń, K.; Babko, R.; Kuzmina, T.; Danko, Y.; Łagód, G.; Polakowski, C.; Szulżyk-Cieplak, J.; Bieganowski, A. Contribution of prokaryotes and eukaryotes to CO2 emissions in the wastewater treatment process. PeerJ 2020, 8, 9325. [Google Scholar] [CrossRef]
  20. Bao, Z.; Sun, S.; Sun, D. Characteristics of direct CO2 emissions in four full-scale wastewater treatment plants. Water 2014, 6, 1023–1032. [Google Scholar] [CrossRef]
  21. Karolinczak, B.; Dabrowski, W.; Zylka, R. Evaluation of dairy wastewater treatment systems using carbon footprint analysis. Energies 2021, 14, 5366. [Google Scholar] [CrossRef]
  22. Xu, R.; Li, Y.; Luo, Y.; Fang, F.; Feng, Q.; Cao, J.; Luo, J. Prediction and evaluation of indirect carbon emission from electrical consumption in multiple full-scale wastewater treatment plants via automated machine learning-based analysis. ACS EST Eng. 2022, 2, 1234–1245. [Google Scholar] [CrossRef]
  23. Gu, Y.; Dong, Y.; Wang, H.; Keller, A.A.; Xu, J.; Chiramba, T.; Li, F. Quantification of the water, energy and carbon footprints of wastewater treatment plants in China considering a water-energy nexus perspective. Ecol. Indic. 2015, 58, 236–245. [Google Scholar] [CrossRef]
  24. He, X.; Li, Z.; Xing, C.; Li, Y.; Liu, M.; Gao, X.; Ding, Y.; Lu, L.; Liu, C.; Li, C.; et al. Carbon footprint of a conventional wastewater treatment plant: An analysis of water-energy nexus from life cycle perspective for emission reduction. J. Clean. Prod. 2023, 403, 139562. [Google Scholar] [CrossRef]
  25. Zhuang, H.; Guan, J.; Leu, S.-Y.; Wang, Y.; Wang, H. Carbon footprint analysis of chemical enhanced primary treatment and sludge incineration for sewage treatment in Hong Kong. J. Clean. Prod. 2020, 276, 122630. [Google Scholar] [CrossRef]
  26. Vijayan, G.; Saravanane, R.; Sundararajan, T. Carbon footprint analyses of wastewater treatment systems in Puducherry. Curr. World Environ. Ecol. 2017, 13, 19–25. [Google Scholar] [CrossRef]
  27. Lv, Z.; Shan, X.; Xiao, X.; Cai, R.; Zhang, Y.; Jiao, N. Excessive greenhouse gas emissions from wastewater treatment plants by using the chemical oxygen demand standard. J. Environ. Sci. 2021, 103, 123–134. [Google Scholar] [CrossRef]
  28. Daudt, G.C.; Xavier, J.A.; Meotti, B.; Guimarães, L.B.; da Costa, R.H.R. Researching new ways to reduce N2O emission from a granular sludge sequencing batch reactor treating domestic wastewater under subtropical climate conditions. Braz. J. Chem. Eng. 2019, 36, 209–220. [Google Scholar] [CrossRef]
  29. Joss, A.; Salzgeber, D.; Eugster, J.; König, R.; Rottermann, K.; Burger, S.; Fabijan, P.; Leumann, S.; Mohn, J.; Siegrist, H. Full-scale nitrogen removal from digester liquid with partial nitritation and anammox in one SBR. Environ. Sci. Technol. 2009, 43, 4475–4482. [Google Scholar] [CrossRef] [PubMed]
  30. Kulak, M.; Shah, N.; Sawant, N.; Unger, N.; King, H. Technology choices in scaling up sanitation can significantly affect greenhouse gas emissions and the fertiliser gap in India. Water Dev. Supply 2017, 16, 789–801. [Google Scholar] [CrossRef]
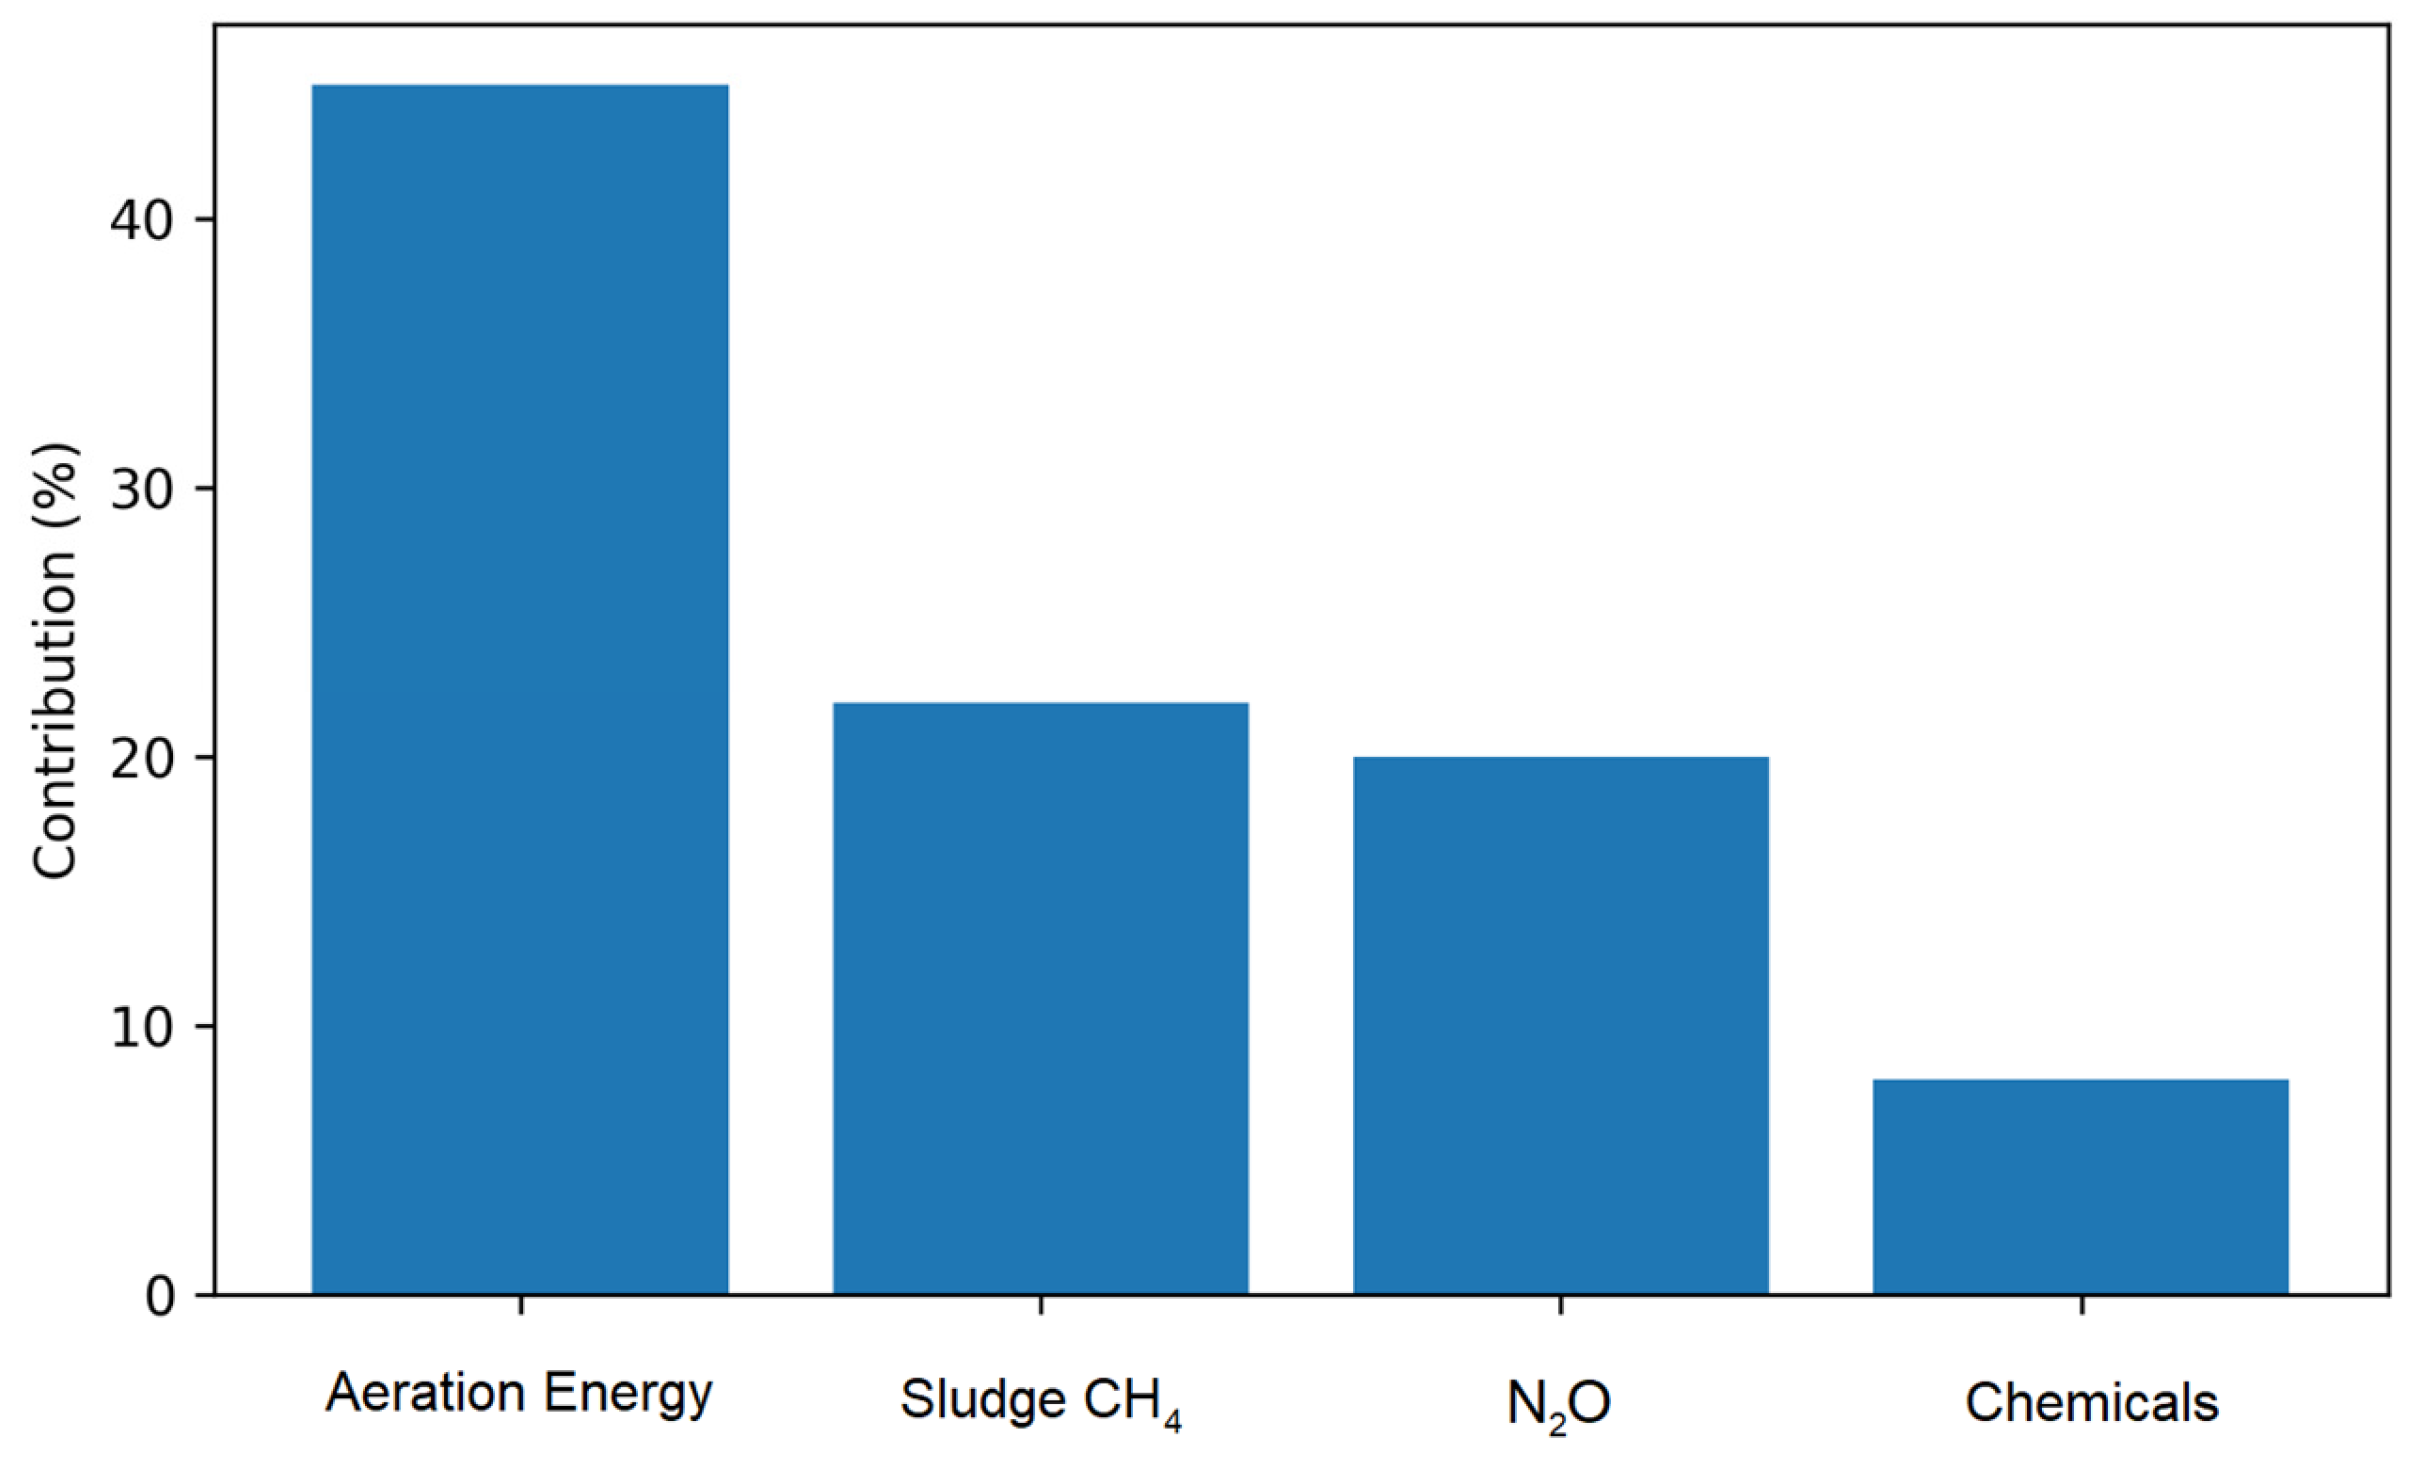
Figure 1. Schematic of direct and indirect GHG sources in WWTPs.
Sustainability 18 05281 g001
Figure 2. Energy distribution in SBR systems.
Sustainability 18 05281 g002
Figure 3. Emission reduction potential from optimization strategies.
Sustainability 18 05281 g003
Figure 4. Scenario comparison of carbon footprint intensity.
Sustainability 18 05281 g004
Figure 5. Monte Carlo simulation distribution of carbon footprint (10,000 iterations).
Sustainability 18 05281 g005
Figure 6. Carbon footprint assessment and mitigation in SBR WWTP.
Sustainability 18 05281 g006
Figure 7. Sensitivity tornado plot showing impact of key parameters.
Sustainability 18 05281 g007
Table 1. Study objectives and corresponding analyses.
ObjectiveCorresponding
Section
Key Output
1. Synthesize literature on WWTP carbon footprints, critically evaluating methodological inconsistenciesSection 2, Section 2.1, Section 2.2 and Section 2.3Unified framework with tiered system boundaries (Section 2.3.2); critical comparison of N2O emission factors (0.01–2% vs. IPCC 0.5%)
2. Quantify carbon footprint of 5000 m3/day SBR facility with uncertainty analysisSection 3, Section 3.4 and Section 4.1Baseline: 1648 tCO2e/year [95% CI: 1420–1910]; realistic baseline: 950 tCO2e/year
3. Evaluate emission reduction potential under optimized and advanced scenariosSection 4.2, Section 4.3 and Section 5.138–55% reduction achievable; optimized: 1018 tCO2e/year [95% CI: 860–1190]
Table 2. Propose a tiered framework.
TierBoundaryIncluded SourcesTypical Application
Tier 1Plant-onlyOn-site biological + on-site energyOperational benchmarking
Tier 2Plant + sludge managementTier 1 + sludge transport, treatment, disposalCorporate reporting
Tier 3Full life cycleTier 2 + effluent-receiving waters, chemicals, constructionCarbon neutrality assessment
Note: This study adopts Tier 2 boundaries for the SBR case study.
Table 3. Disaggregated CH4 emission factors for SBR wastewater treatment [7].
SourceCH4 Emission Factor% of Total CH4 (Mass)
Biological reactor (aerobic SBR)0.005 kg CH4/kg COD removed5%
Sludge handling (digestion and storage)0.12 kg CH4/kg vs. degraded75%
Dissolved CH4 in effluent0.003 kg CH4/m3 effluent15%
Sewer influent (upstream)0.001 kg CH4/m3 influent5%
Total0.03 kg CH4/kg COD removed (effective)100%
Table 4. Input parameter distributions for Monte Carlo simulation.
ParameterDistributionLowerMode/MeanUpperSource
CH4 EF (kg/kg COD)Triangular0.010.030.05[6,27]
N2O EF (kg N2O-N/kg TN)Triangular0.0010.0080.016[15,28]
Electricity use (kWh/m3)Normal (μ = 0.6,
σ = 0.1)
0.40.60.8[21]
Grid EF (kg CO2e/kWh)Normal (μ = 0.6,
σ = 0.05)
0.50.60.7Local utility data
COD removal (%)Normal (μ = 90,
σ = 3)
849096Plant design
TN removal (%)Normal (μ = 80,
σ = 5)
708090Plant design
Note: Monte Carlo simulation performed with 10,000 iterations. Results reported as mean with 95% confidence intervals.
Table 5. SBR carbon footprint (5000 m3/day).
Emission SourceBaseline (tCO2e/year)Optimized (tCO2e/year)Change (tCO2e/year)% of Baseline
CH4 (direct)690276−41442% → 27%
N2O (direct)21955−16413% → 5%
Electricity (indirect)657367−29040% → 36%
Sludge Management82−320−4025% → −31%
Total16481018−630100% → 62%
Note: Negative values for sludge management indicate net credits from biogas recovery.
Table 6. SBR vs. other technologies (per m3 treated) [7].
TechnologyCarbon Footprint (kg CO2e/m3)Key FactorsGHG Reduction
Potential
Sources
SBR (Baseline)0.2–0.6 (literature); 0.90 (this study, conservative)High N2O risk during transitions; electricity-dominant40–50% via anoxic extension + biogas[6,7,26]
SBR (Optimized)0.41–0.56Anoxic extension, biogas recovery38–45%
(this study)
This study
A-A-O (Anaerobic–Anoxic–Oxic)0.3–0.7Lower sludge production; more resilient to N2OAnaerobic digestion offsets; 30–40% reduction[6,15]
Oxidation Ponds0.4–0.8High CH4 from anaerobic zones; low energySBR 40–60% lower; difficult to retrofit[26]
UASB (Upflow Anaerobic Sludge Blanket)0.5–0.9Biogas potential but high direct CH4 without captureSBR 40–50% lower if UASB lacks biogas recovery[26]
SBR + Anammox0.1–0.3Low energy; <1% N2O conversion50–70% below conventional SBR[4,29]
Disclaimer/Publisher’s Note: The statements, opinions and data contained in all publications are solely those of the individual author(s) and contributor(s) and not of MDPI and/or the editor(s). MDPI and/or the editor(s) disclaim responsibility for any injury to people or property resulting from any ideas, methods, instructions or products referred to in the content.