Article

Coupled Trading in the Electricity–Carbon–Certificate Market Under the Carbon Tax Mechanism: Evidence from China


School of Business, Anhui University of Technology, Ma’anshan 243032, China
*
Author to whom correspondence should be addressed.
Sustainability 2026, 18(11), 5241; https://doi.org/10.3390/su18115241
Submission received: 14 April 2026 / Revised: 14 May 2026 / Accepted: 19 May 2026 / Published: 22 May 2026

Abstract

The sustainable transition of power systems is currently hindered by fragmented carbon pricing systems and insufficient cross-market synergies. Considering this, we herein construct a system dynamics model of carbon tax regulation under conditions integrating electricity markets, carbon emission trading (CET) markets, and tradable green certificate (TGC) markets using Vensim PLE 7.3.5 software. We also propose a price-matching mechanism and implementation pathway for carbon taxation and CET to advance low-carbon sustainable development. The simulation results show that the introduction of a carbon tax at an initial rate of 50 CNY per ton significantly improves renewable energy investment returns. Moreover, effective coordination between the carbon tax and CET reduces carbon emissions from the power system, delivering benefits in terms of both environmental and socio-economic sustainability. We further identify a dynamic coordination scheme consisting of a carbon tax with an initial rate of 50 CNY per ton, which is appropriate when the CET prices stabilize at approximately 60 CNY per ton. An initial rate of 30 CNY per ton is more suitable when the CET prices rise above 100 CNY per ton. These findings verify the optimal matching rules for carbon tax intensity under different carbon allowance price levels, and they also provide quantitative policy tools and empirical support for the scenario-based regulation of carbon pricing systems to achieve sustainable energy transition goals.

1. Introduction

To address the challenges posed by global climate change [1], countries have progressively incorporated carbon neutrality goals into their national development strategies [2], thereby accelerating the implementation of carbon emission reduction policies and the transformation and upgrading of energy systems [3]. The Kyoto Protocol, signed by the international community in 1997, first introduced the core concept of regulating carbon emissions through market-oriented instruments, thereby laying an institutional foundation for global carbon emission reduction efforts. From a theoretical perspective, carbon pricing mechanisms can be broadly divided into two primary forms. The first is the carbon trading mechanism derived from property rights theory, which was first established by Coase in the classical theoretical framework of environmental regulation [4]. The practical applicability and relative merits of this mechanism for carbon emission reduction have been systematically expanded and verified in subsequent academic research [5]. The second is the carbon tax mechanism based on Pigouvian tax theory [6], which describes the core logic of internalizing environmental externalities and has been demonstrated to be a useful macroeconomic tool for addressing challenges related to climate change [7]. Both the carbon trading mechanism and carbon tax mechanism constitute core components of the global carbon pricing system. Additionally, their complementary functional relationship in China’s policy practice has been verified through systematically sorting the theory and practice of China’s national carbon emissions trading system [8].
However, in practice, relying solely on a single market mechanism makes it difficult to simultaneously achieve multiple objectives, including reasonable economic costs, improved carbon emission reduction efficiency, and the sustainable development of the renewable energy industry. The core market system in the energy sector comprises the power market, carbon market, and green certificate market, and the coupled trading model formed through the interactions among these three markets has gradually become a central focus of discussion in both academic and practical circles. Existing studies have created a systematic analytical framework around carbon pricing mechanisms and multi-market coupled trading, and this framework can be categorized into three core research streams to clarify the current state of related research.
The first research stream focuses on the design and practical implementation of carbon tax mechanisms. Carbon taxes are theoretically grounded in the internalization of externalities and the polluter pays principle, as they increase the emission cost of market entities by levying taxes on each unit of carbon emissions and further incentivize the adoption of low-carbon technologies and the utilization of clean energy. In [9], the authors compared the implementation effects of a carbon tax and carbon trading from a partial equilibrium perspective. They found that the two instruments had distinct advantages under different market environments. Subsequent empirical research [10] further verified that carbon taxes are associated with lower emission reduction uncertainties due to their price-based nature, while carbon trading enables quantitative binding constraints on total emissions, making it more suitable for scenarios with clear reduction caps. In terms of regulatory scope, carbon taxes are more suitable for dispersed and small-scale emission entities, whereas carbon trading primarily targets large-scale emission enterprises with centralized emission sources [11]. This view has been supported by policy practice research from Chinese academic institutions [12]. Existing studies have widely confirmed that carbon tax and carbon trading are functionally complementary, and appropriately setting carbon tax rates can achieve a win-win outcome for emission reduction and economic growth. Therefore, a combined emission reduction policy framework is widely recommended by researchers in this field [13]. In [14], the authors tackle the systematic design of China’s carbon tax mechanism by analyzing international practices, summarizing global implementation experience and proposing targeted schemes that provide reference for this paper’s parameter setting. Another study reviewed the global development of carbon tax policies, clarifying the core construction principles behind China’s system and putting forward a progressive path for its implementation that further supports our parameter design [15].
Studies based on the Computable General Equilibrium (CGE) model have verified that a low initial carbon tax rate can effectively alleviate the short-term negative impact of the policy on economic growth, laying a theoretical foundation for the scenario design of carbon tax rates in this paper [16]. From the micro-scale perspective of market entities, existing research has also proven that the effects of carbon tax and carbon trading policies are significantly different under different financial conditions and market environments. This further highlights the necessity of exploring the dynamic rules governing matching the two policies to material conditions [17].
The second research stream focuses on the coordination and interactive mechanisms between the power market and the carbon market. As the largest source of carbon emissions in China, the power industry has a complex and close interactive relationship with the carbon market, which has become the core scenario defining the implementation of carbon pricing policies. Existing studies have determined the core interaction mechanism between the two markets and found that intermediate variables, such as installed capacity and carbon allowances, can directly influence the decision-making of power-generation enterprises [18]. The incorporation of carbon prices into power generation costs alters a firm’s bidding and operation strategies. This affects the merit order of power generation dispatch, passes carbon costs through to electricity prices, and further guides long-term power investment decisions [19]. The linkage mechanism between the carbon price and electricity price has been verified using empirical analysis based on system dynamics models, which have shown that a carbon price increase will significantly increase the operating cost of thermal power enterprises; moreover, there is a strong positive correlation between the carbon price and the electricity price in market-oriented power trading [20]. However, Ref. [21] have identified a notable time-varying characteristic effect among the electricity market, carbon market, and green electricity market, meaning that an increasing price in the carbon market does not necessarily drive increasing electricity prices. In terms of optimizing power systems, recent studies have confirmed that grid loss minimization schemes, including demand response strategies, renewable energy consumption optimization, and multi-source collaborative operation, can be directly translated into carbon emission reduction and power supply cost control. Specifically, demand response optimization can reduce daily grid losses up to 15.6% while mitigating voltage deviation, which effectively lowers the additional carbon emissions caused by redundant power generation to compensate for line losses [22]. For distribution networks with high renewable energy penetration, the hierarchical and partitioned loss reduction method can simultaneously improve renewable energy accommodation and reduce grid losses [23]. The lightweight consumption optimization algorithm can also enhance renewable energy accommodation, reduce grid losses, and achieve direct carbon emission reductions at lower economic costs [24]. The loss minimization objective has also been widely incorporated into the optimal recovery and operation model of integrated energy systems, providing a technical foundation for the low-carbon and economic operation of a power system under multi-market coupling [25]. It should be emphasized that ensuring the safe and stable operation of a power system is the primary premise of the low-carbon transformation of the power sector, and the priority of this goal is higher than the large-scale development of renewable energy. Traditional thermal power generation needs to maintain a reasonable installed capacity and generation scale to bear the base load portion of the power load curve and ensure the static and dynamic stability of the power system. In this study, we use this principle as a hard constraint embedded in the system dynamics model, and all scenario simulations are conducted based on the premise of guaranteeing a reliable power supply and stable system. The simulation results further quantify the reasonable range of the installed thermal power capacity under different carbon tax policies.
The third research stream focuses on the green certificate market and its correlation with the power and carbon markets, as well as the mechanisms behind the coupled operations of these three markets. The green certificate market, together with the power market and carbon market, constitutes the core institutional mechanism for the low-carbon development of the power sector. In [26], the authors tackle the core driving factors of green certificate market operations, and according to their findings, renewable portfolio standards can directly adjust the profit margins of power generators and stimulate renewable energy investment. The renewable portfolio standards (RPS) mechanism has been proven to be the core driving force behind the operation of the green certificate market, as it adjusts the profit level of power generators, elicits a surge in renewable energy generation, and optimizes the power generation structure [27]. The reasonable allocation of renewable energy power quotas is the core premise of the effective operation of the RPS mechanism, and optimized quota allocation can effectively improve the proportion of renewable energy power generation in China. This provides a practical basis for the setting of a renewable energy quota ratio in the scenario design of this paper [28]. In addition, existing studies have also verified that carbon trading and green certificate trading can work synergistically to stabilize electricity prices and promote the low-carbon optimization of the energy structure [29]. To systematically consolidate the aforementioned research progress and explicitly identify the critical gaps in the existing literature, we present a comparative analysis of representative studies on the coupling between the electricity, carbon, and green certificate markets in Table 1. This table summarizes the core research focus, key limitations, and corresponding innovations of this study across five highly relevant recent publications, providing a clear visual overview of the unaddressed research needs that motivate the present work.
In summary, although existing studies have established a core analytical framework for carbon pricing mechanisms and multi-market coupled trading, several critical research limitations remain. First, research on the coordination between the power market and the carbon market has not linked key carbon tax parameters with carbon allowance prices, thereby failing to reveal the deep coupling mechanisms among the three markets. Second, studies on three-market coupling provide insufficient analysis of green certificate market stability under the joint influence of carbon taxes and carbon allowances and lack differentiated policy designs under different market scenarios. Third, the corresponding relationship between carbon allowance price ranges and the timing of carbon tax introduction remains unclear. This results in a lack of precise guidance for the implementation of carbon tax policy in China. These research gaps constitute the foundational starting point of this study.
Based on the aforementioned market demands and research gaps, we adopt the carbon tax mechanism as the core analytical perspective in this paper. This mechanism focuses on coupled trading among the electricity, carbon, and green power certificate markets. It also systematically elucidates the theoretical foundations, typical operation modes, and practical effects of the aforementioned trading system. The core contributions of this paper are as follows:
  • First, the initial value and threshold of carbon taxes are incorporated into the three-market coupling framework to clarify the deep linkage mechanisms among the electricity, carbon, and green certificate markets.
  • Second, the boundaries of the effects of the interaction between carbon taxes and carbon allowances on the green certificate market are examined, and differentiated carbon tax introduction strategies for different renewable energy quota scenarios are proposed.
  • Third, empirically clarify the corresponding relationship between carbon allowance price ranges and the optimal timing of carbon tax introduction, providing a quantitative basis for the precise implementation of carbon tax policies in China.
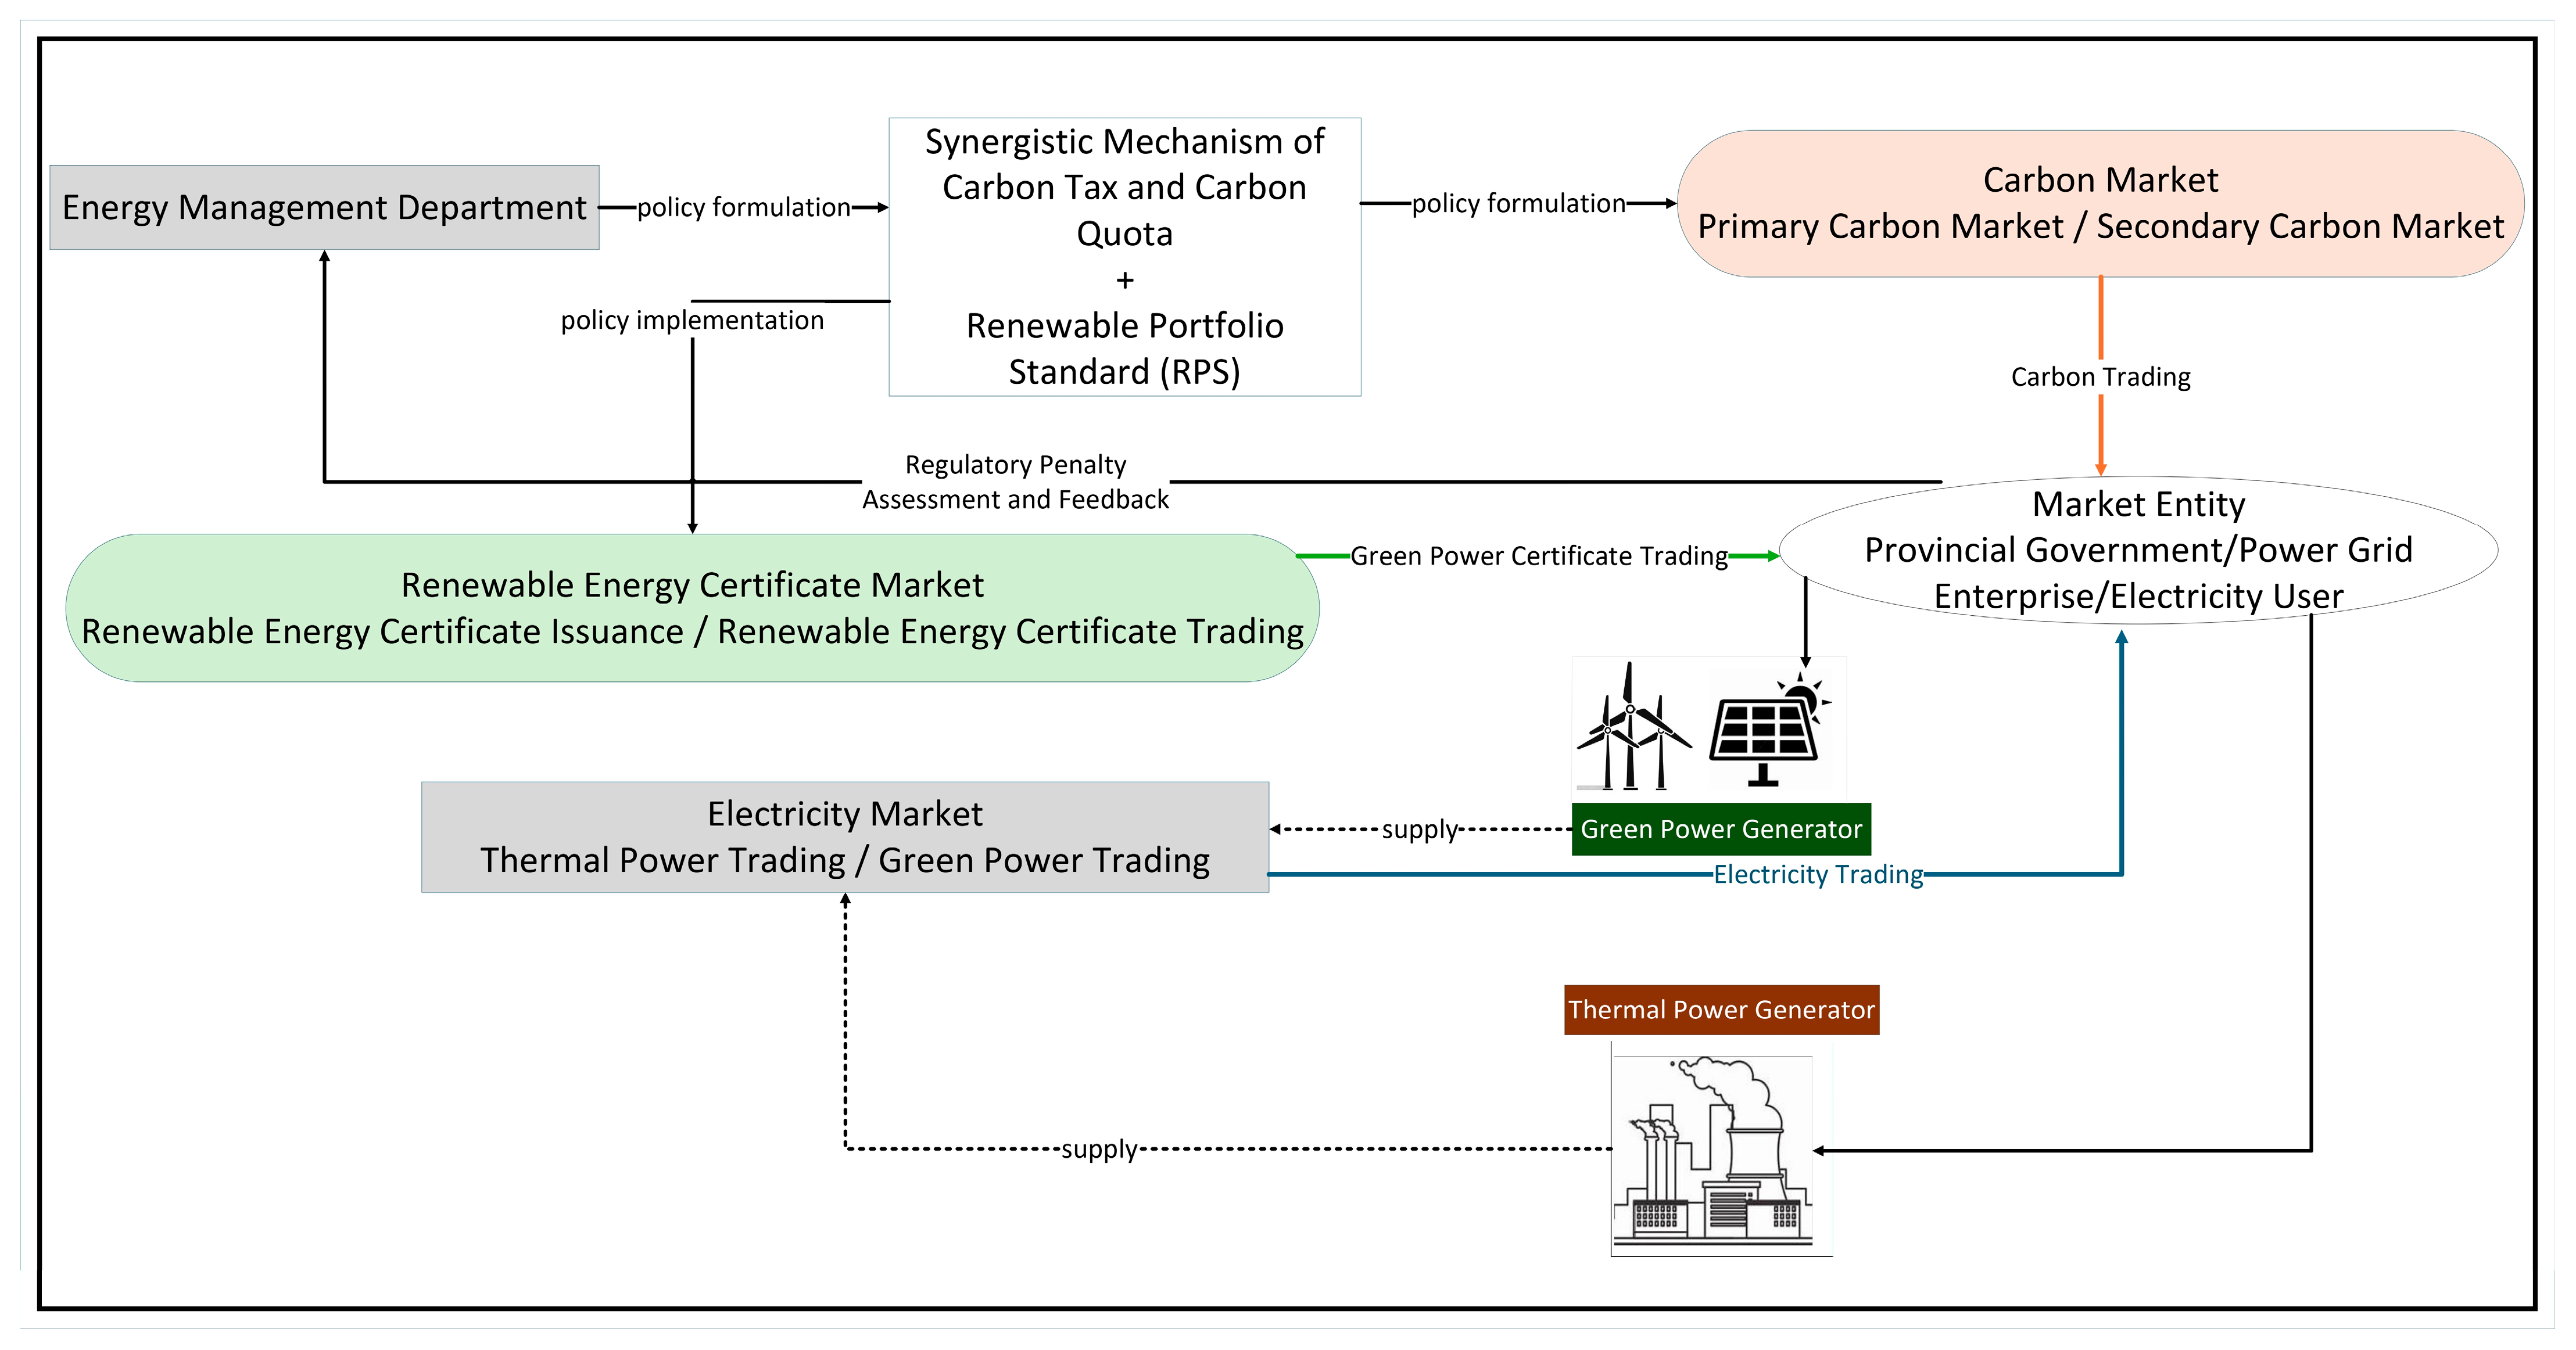
In this study, we construct a system dynamics model based on Vensim PLE software, with 2025 as the base year and a simulation horizon spanning from 2025 to 2040. The remainder of this paper is organized as follows. Section 2 presents the model construction, which includes a causal relationship analysis and core model formulas. Section 3 describes the empirical analysis, including data sources, parameter settings, scenario design, and simulation results. Section 4 summarizes the primary conclusions and proposes targeted policy recommendations. The constructed electricity–carbon–green certificate multi-market coupled trading framework is shown in Figure 1.

2. Model Construction

2.1. Core Model Constraints

To ensure the practical feasibility of the research conclusions, we embedded the following hard constraints, which run through all of the scenario simulations, into the system dynamics model:
  • Power system stability constraint: The model automatically adjusts the installed capacity structure through the power supply–demand balance mechanism to ensure that thermal power generation can always cover the base load portion of the power load curve and maintain sufficient static and dynamic stability margins.
  • Carbon tax revenue neutrality constraint: All carbon tax revenues are used for low-carbon technology research and development and renewable energy subsidies, with no additional fiscal expenditure.
  • Policy continuity constraint: The renewable energy quota ratio and carbon tax rate increase linearly according to the set targets, with no sudden policy changes during the simulation period.
  • Energy storage system operation constraint: The model embeds a 10% energy storage penetration assumption that is based on the national new energy storage installed capacity in 2025. Energy storage systems prioritize absorbing curtailed wind and solar power and discharge during peak load periods. The round-trip efficiency is set at 90%, while the maximum charge/discharge power does not exceed 20% of the installed capacity. The initial state of charge is 50%.

2.2. Causal Relationship Analysis

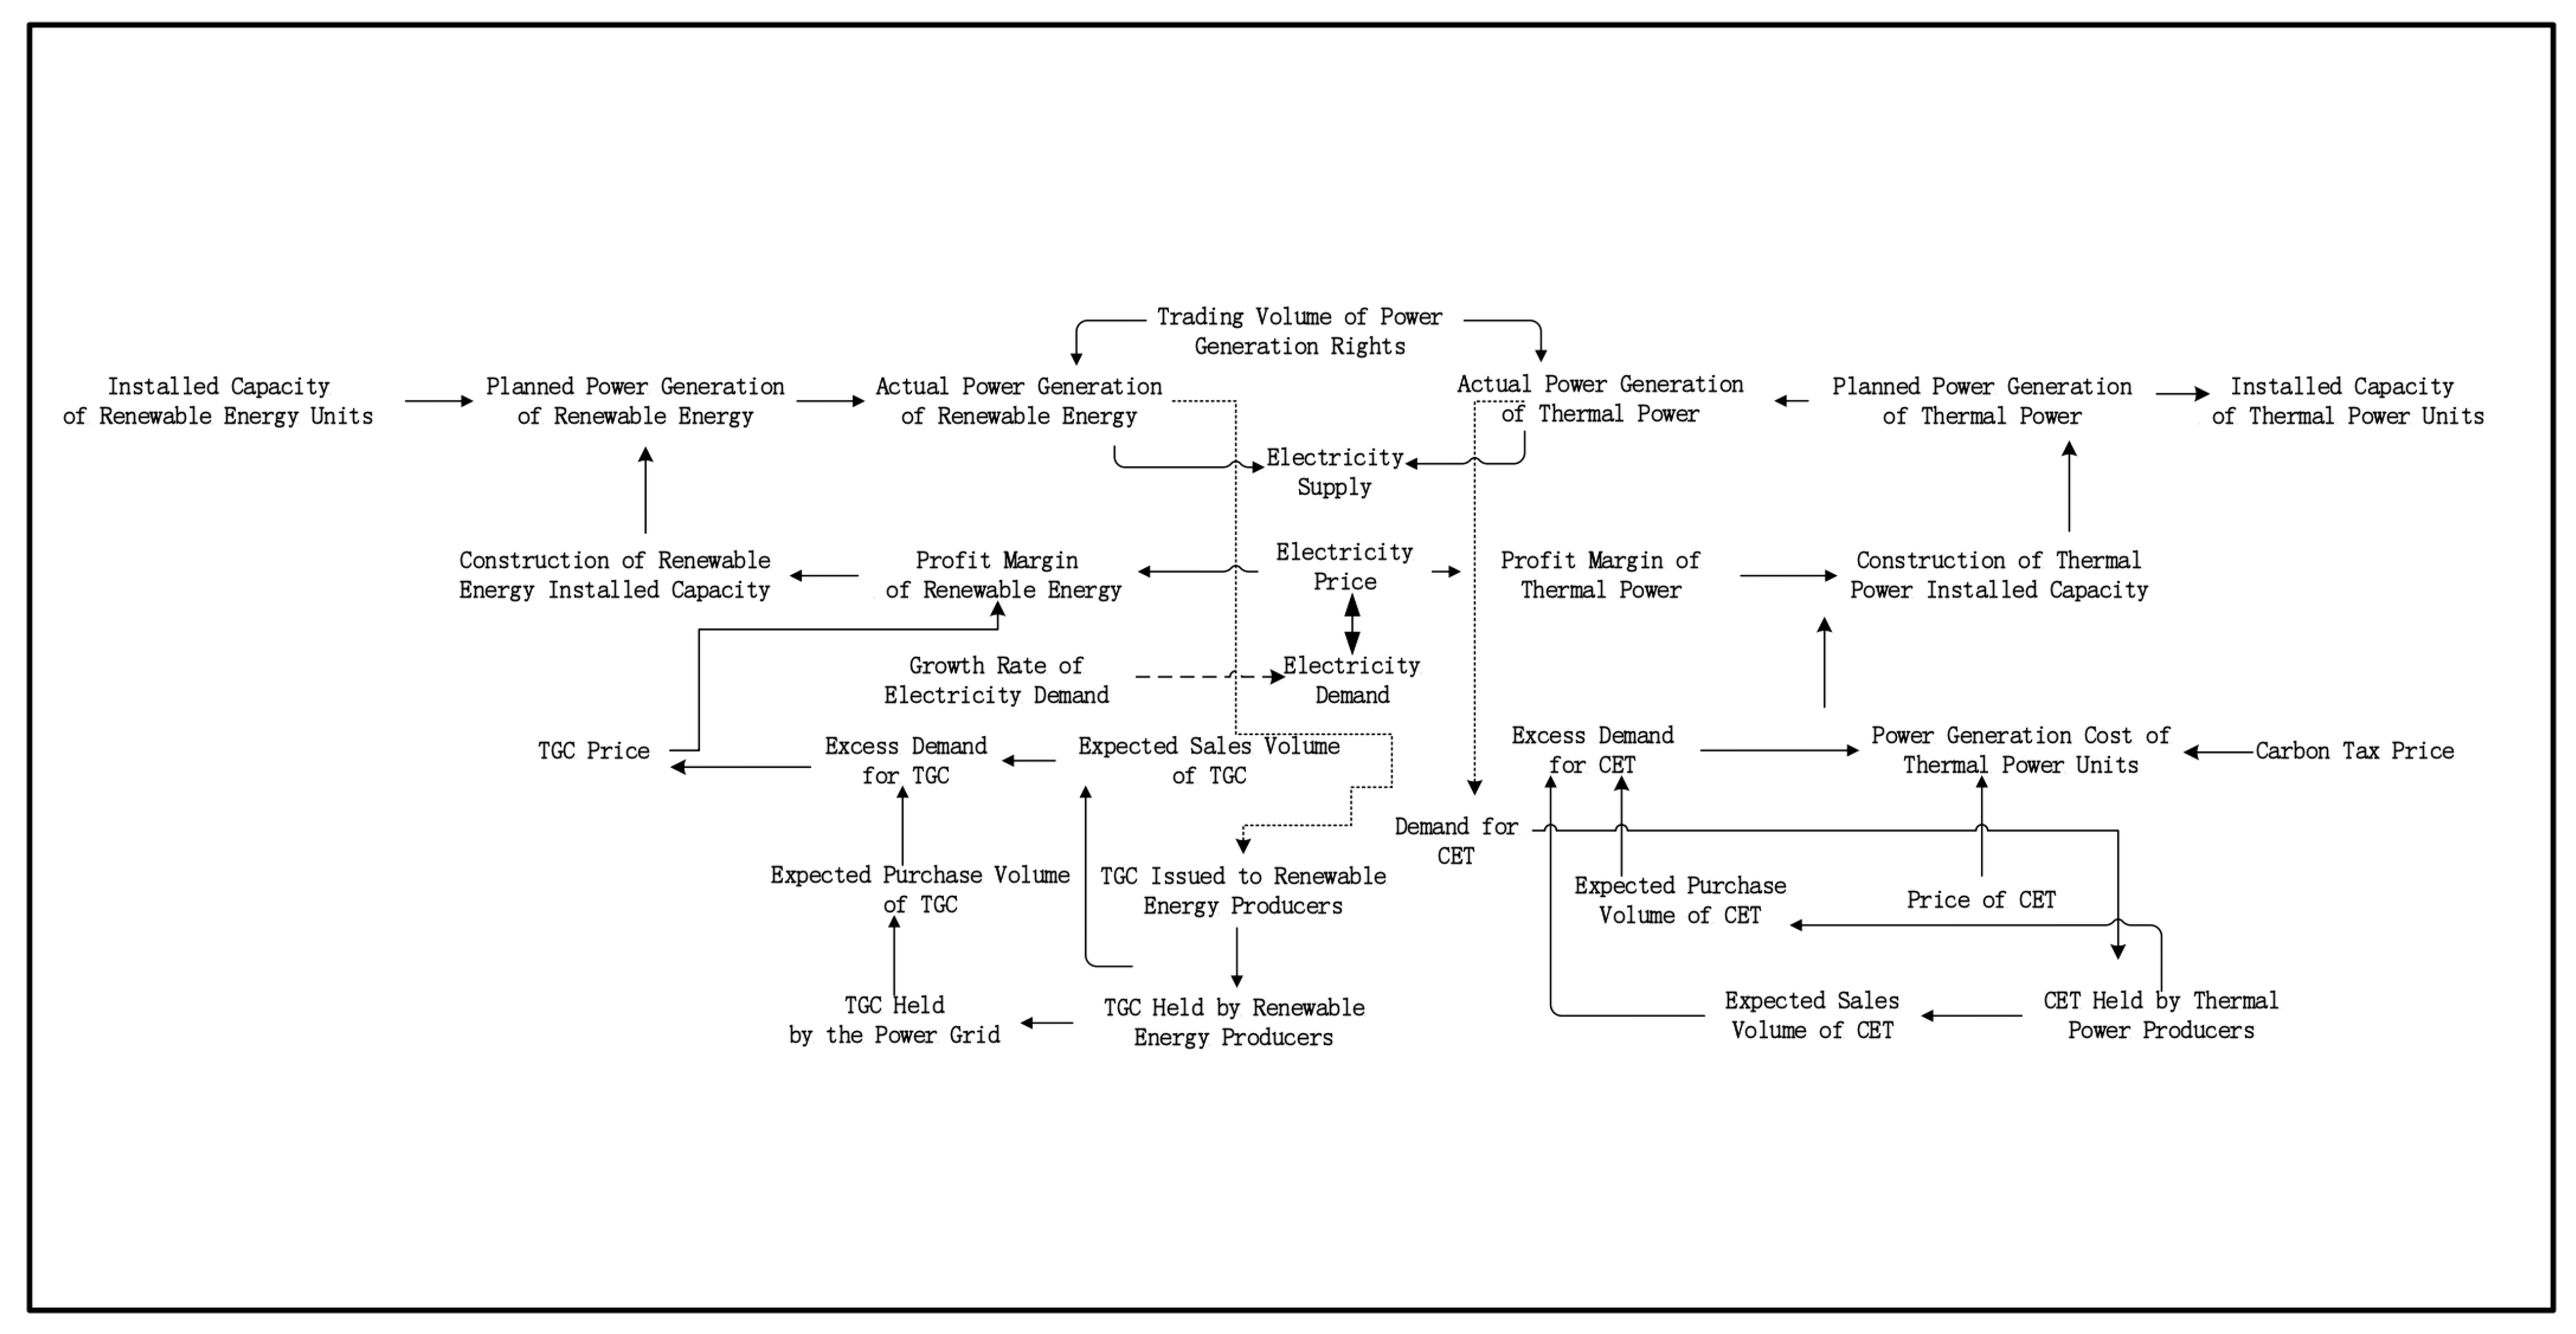
This paper constructs four major subsystems: tradable green certificate (TGC) trading, generation rights trading, carbon emission trading (CET) trading with carbon tax, and power trading. The internal causal relationships within the system are illustrated in Figure 2.

2.3. Model Formulas

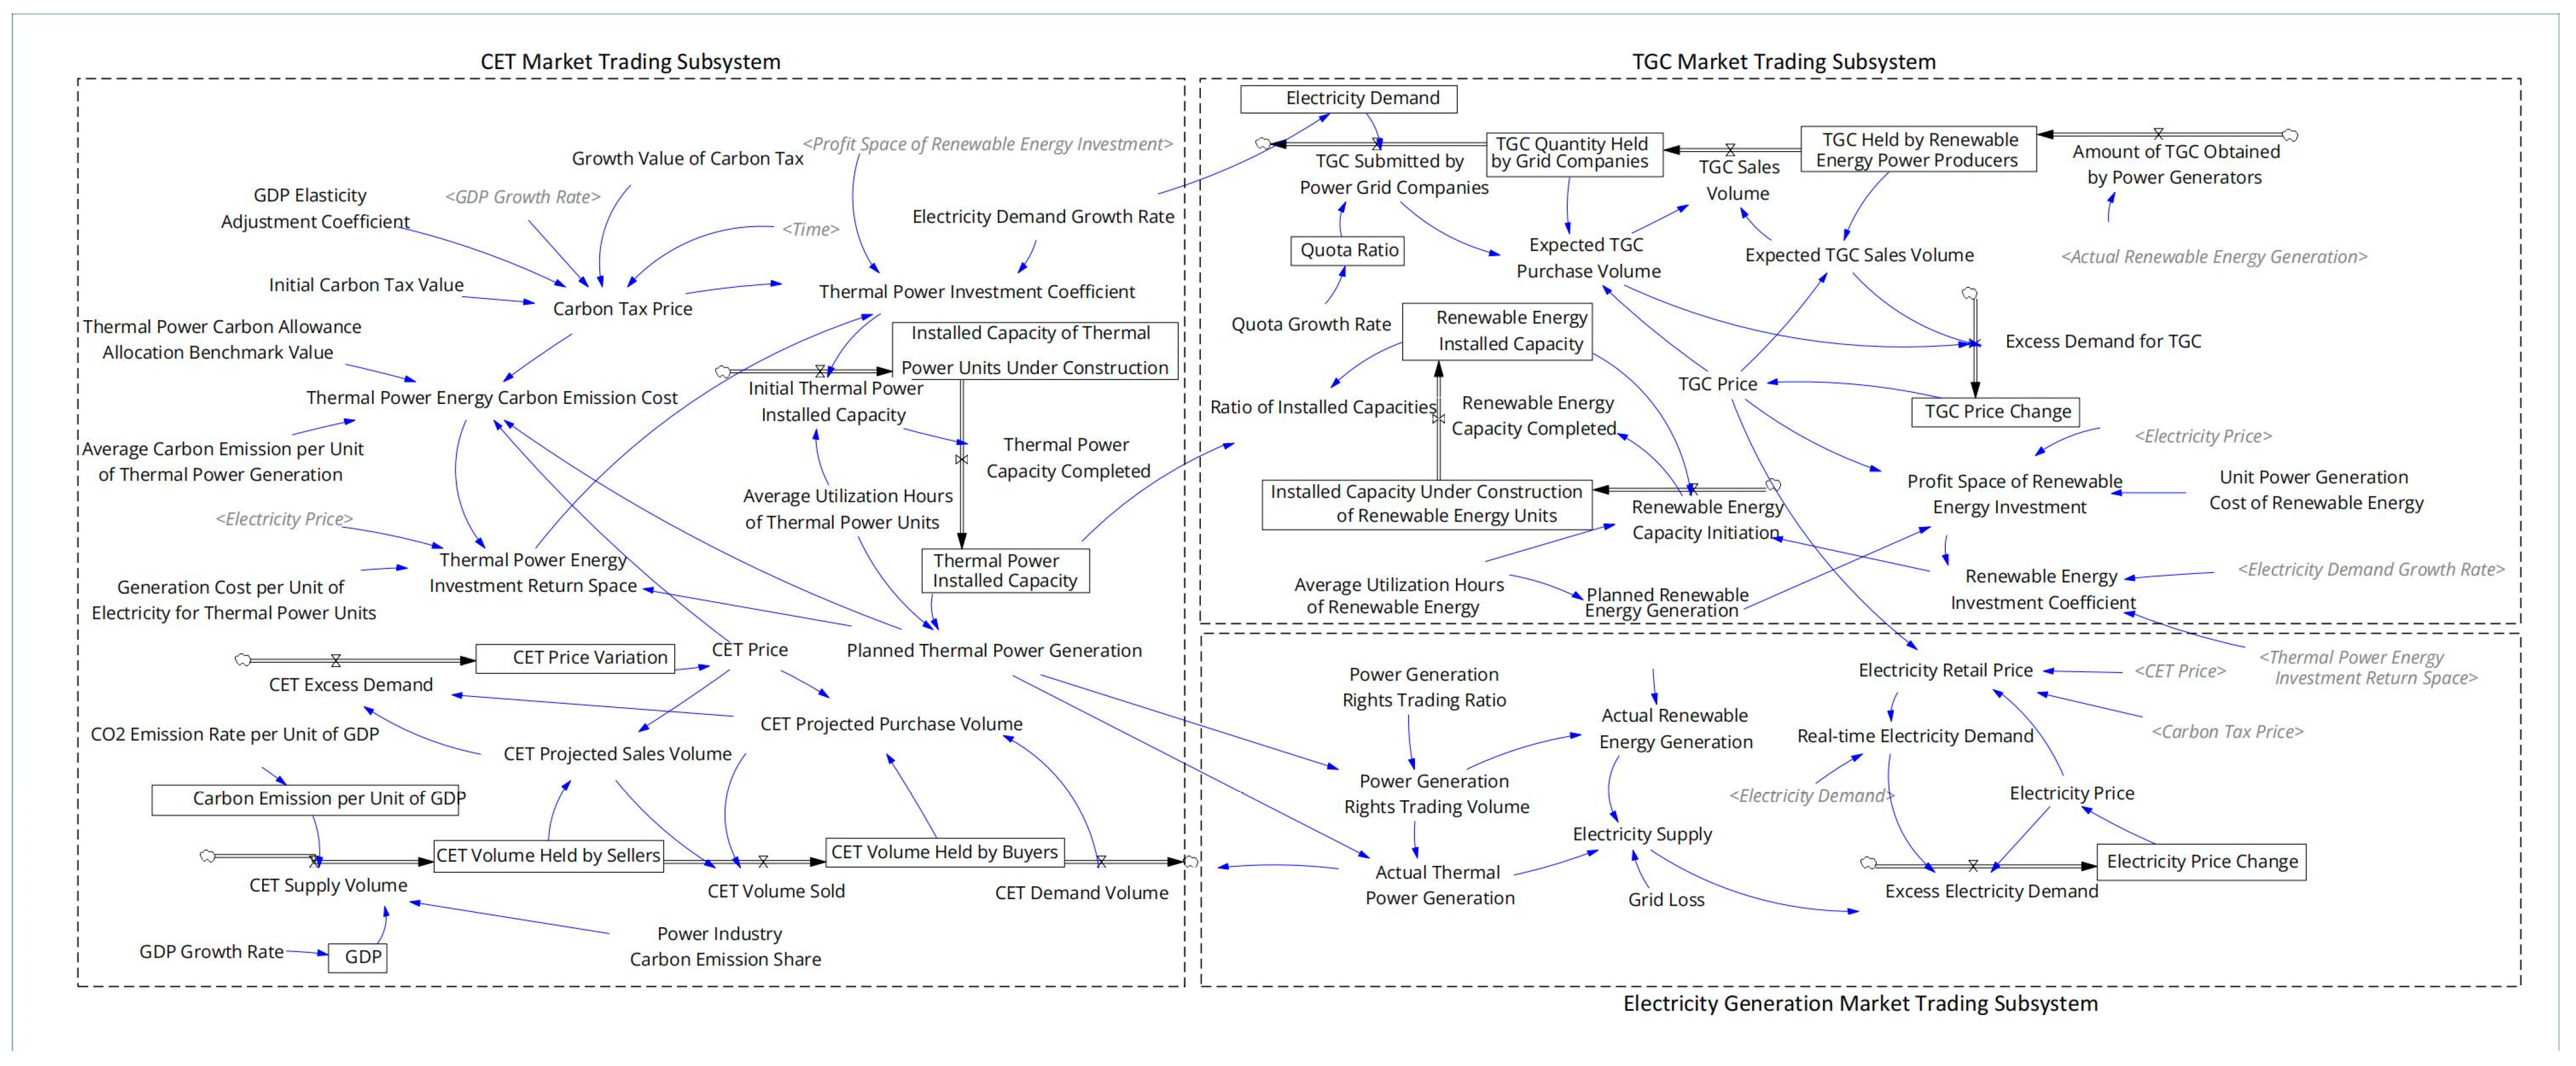
Figure 3 illustrates the interrelationships among the variables. Drawing on previous studies [33,34], a system flow diagram describing the impacts of three market-oriented carbon emission reduction policies on carbon emissions was constructed using Vensim PLE for Windows Version 6.2 (x32) [35,36]. In this model, INTEG, DELAY, and SMOOTH denote the integral, delay, and smooth functions in Vensim PLE, respectively [37,38,39].

2.4. Core Model Equations

All model equations in this paper are derived from the core modeling frameworks and key relationship definitions established in previous studies [33,34,40,41]. They are constructed around the core logic of electricity–carbon–certificate market coupling, focusing on the dynamic interactions of price formation, supply–demand balance, investment returns, and policy transmission. The core equations are presented below.

2.4.1. State Variables

These equations are used to describe the dynamic, cumulative evolution of core market indicators that primarily focus on key dimensions such as certificate holdings, price fluctuations, installed capacity, and electricity demand [42,43]:
T R = T 0 + 0 t T O T S d t
Δ P T = P T 0 + 0 t T E d t
  Δ P C = P C 0 + 0 t C E d t
I R = I R 0 + 0 t I R C d t
I T = I T 0 + 0 t I T C d t
C S H = C S 0 + 0 t ( C S C S D ) d t
D E = D E 0 + 0 t D E 0 × r E 12 d t
where T R is the volume of TGC held by renewable energy power generators; T 0 is the initial holding volume of TGC; T O is the volume of TGC that is acquired; T S is the volume of TGC that is sold; Δ P T represents the variation in TGC price; P T 0 is the initial price of TGC; T E is the excess demand for TGC; Δ P C represents the variation in the carbon allowance price; Δ P C is the initial price of carbon allowances; C E is the excess demand for carbon allowances; I R is the installed capacity of renewable energy; I R 0 is the initial installed capacity of renewable energy; I R C is the completed installed capacity of renewable energy; I R T is the installed capacity of thermal power; I T 0 is the initial installed capacity of thermal power; I T C is the completed installed capacity of thermal power; C S H is the volume of carbon allowances held by sellers; C S 0 is the initial holding volume of carbon allowances; C S is the supply volume of carbon allowances; C S D is the volume of carbon allowances sold; D E is the electricity demand; D E 0 is the initial average monthly electricity demand; and r E is the growth rate of electricity demand.

2.4.2. Rate Variables

These equations are used to quantify the change rates of core indicators, provide support for the dynamic evolution of state variables, and capture key processes, such as quota supply and demand, certificate conversion, and power balance [44,45]:
C E = C B C S C S ,   C S > 0 0 ,   C S 0
E E = P E × D E R S E D E R × 50
T O = G R 10 8
C D = G T × f T P 1000
C S = G D P × e G D P × s E
where C B is the projected purchase volume of carbon allowances; E E is the excess electricity demand (dimensionless); P E is the current electricity price; D E R is the real-time electricity demand; S E is the electricity supply volume; G R is the actual power generation of renewable energy; C D is the demand for carbon allowances; G T is the actual power generation of thermal power;   f T P is the carbon emission factor of thermal power; e G D P is the carbon emission per unit of gross domestic product (GDP); and   s E is the proportion of carbon emissions from the power industry.

2.4.3. Auxiliary Variables

These equations provide intermediate support for core calculations, optimize the logical transmission of the model, and primarily involve auxiliary processes such as certificate purchase, quota estimation, and dynamic adjustments of the carbon tax [46,47]:
  T B = 0 ,   T G > T S P r 0 P r × T S B T G ,   T G T S
C B = P C 0 P C × max ( C D C B H , 0 ) ,   P C 10 0 ,   P C < 10
P T A X = min ( P T A X 0 + T i m e × Δ P T A X 12 × 1 + ε G D P × r G D P ,   400 )
where T G is the volume of TGC held by power grid companies; T S B is the volume of TGC to be submitted; P T is the current TGC price; P C is the current carbon allowance price; C B H is the volume of carbon allowances held by buyers; P T A X is the carbon tax price; P T A X 0 is the initial carbon tax value; Δ P T A X is the annual growth value of carbon tax; ε G D P is the GDP elasticity adjustment coefficient; and r G D P is the GDP growth rate.

3. Empirical Analysis

3.1. Data Sources and Parameter Setting

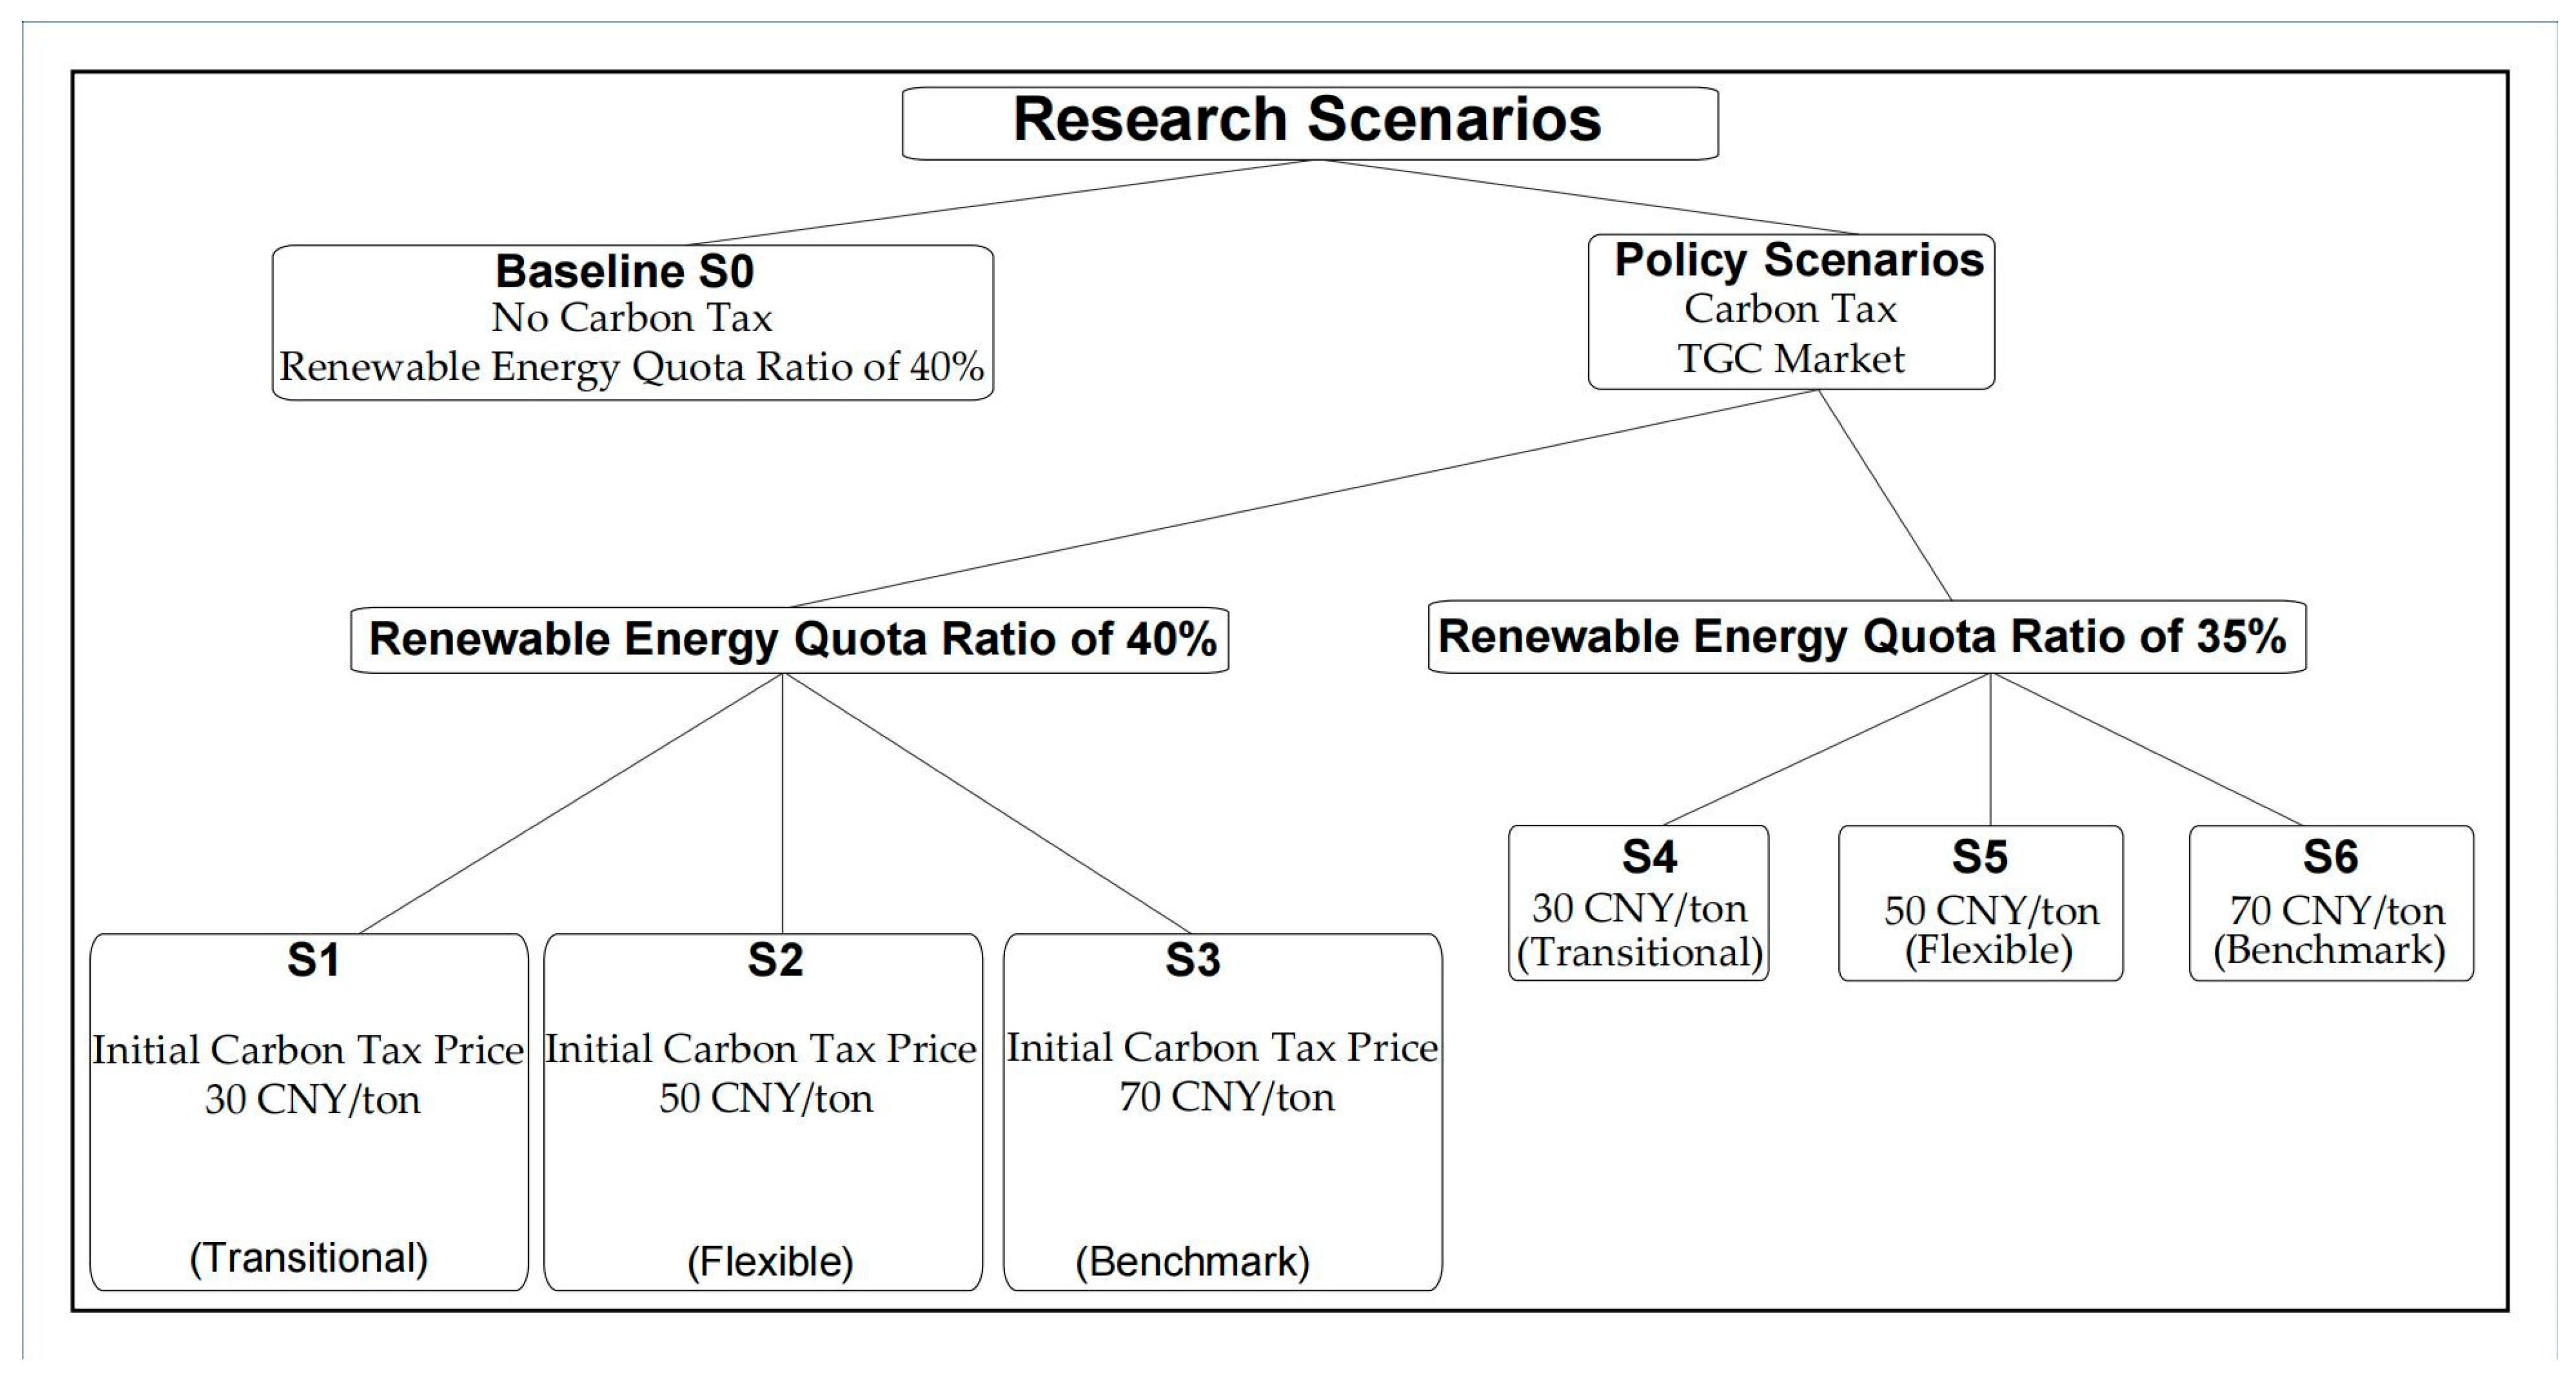
The model uses 2025 as the base year, adopts a time step of 0.5 months, and sets the simulation horizon at 180 months, covering the period from 2025 to 2040. Data are drawn primarily from the China Statistical Yearbook, the China Energy Statistical Yearbook, and other relevant sources. Table 2 reports the fundamental parameter settings of the model, while Table 3 and Figure 4 provide a detailed description of the scenario configurations together with their underlying rationale [48,49].

3.2. Results of the Electricity–Carbon–Certificate Market

3.2.1. Policy Effects of Carbon Market with and Without Carbon Tax Participation

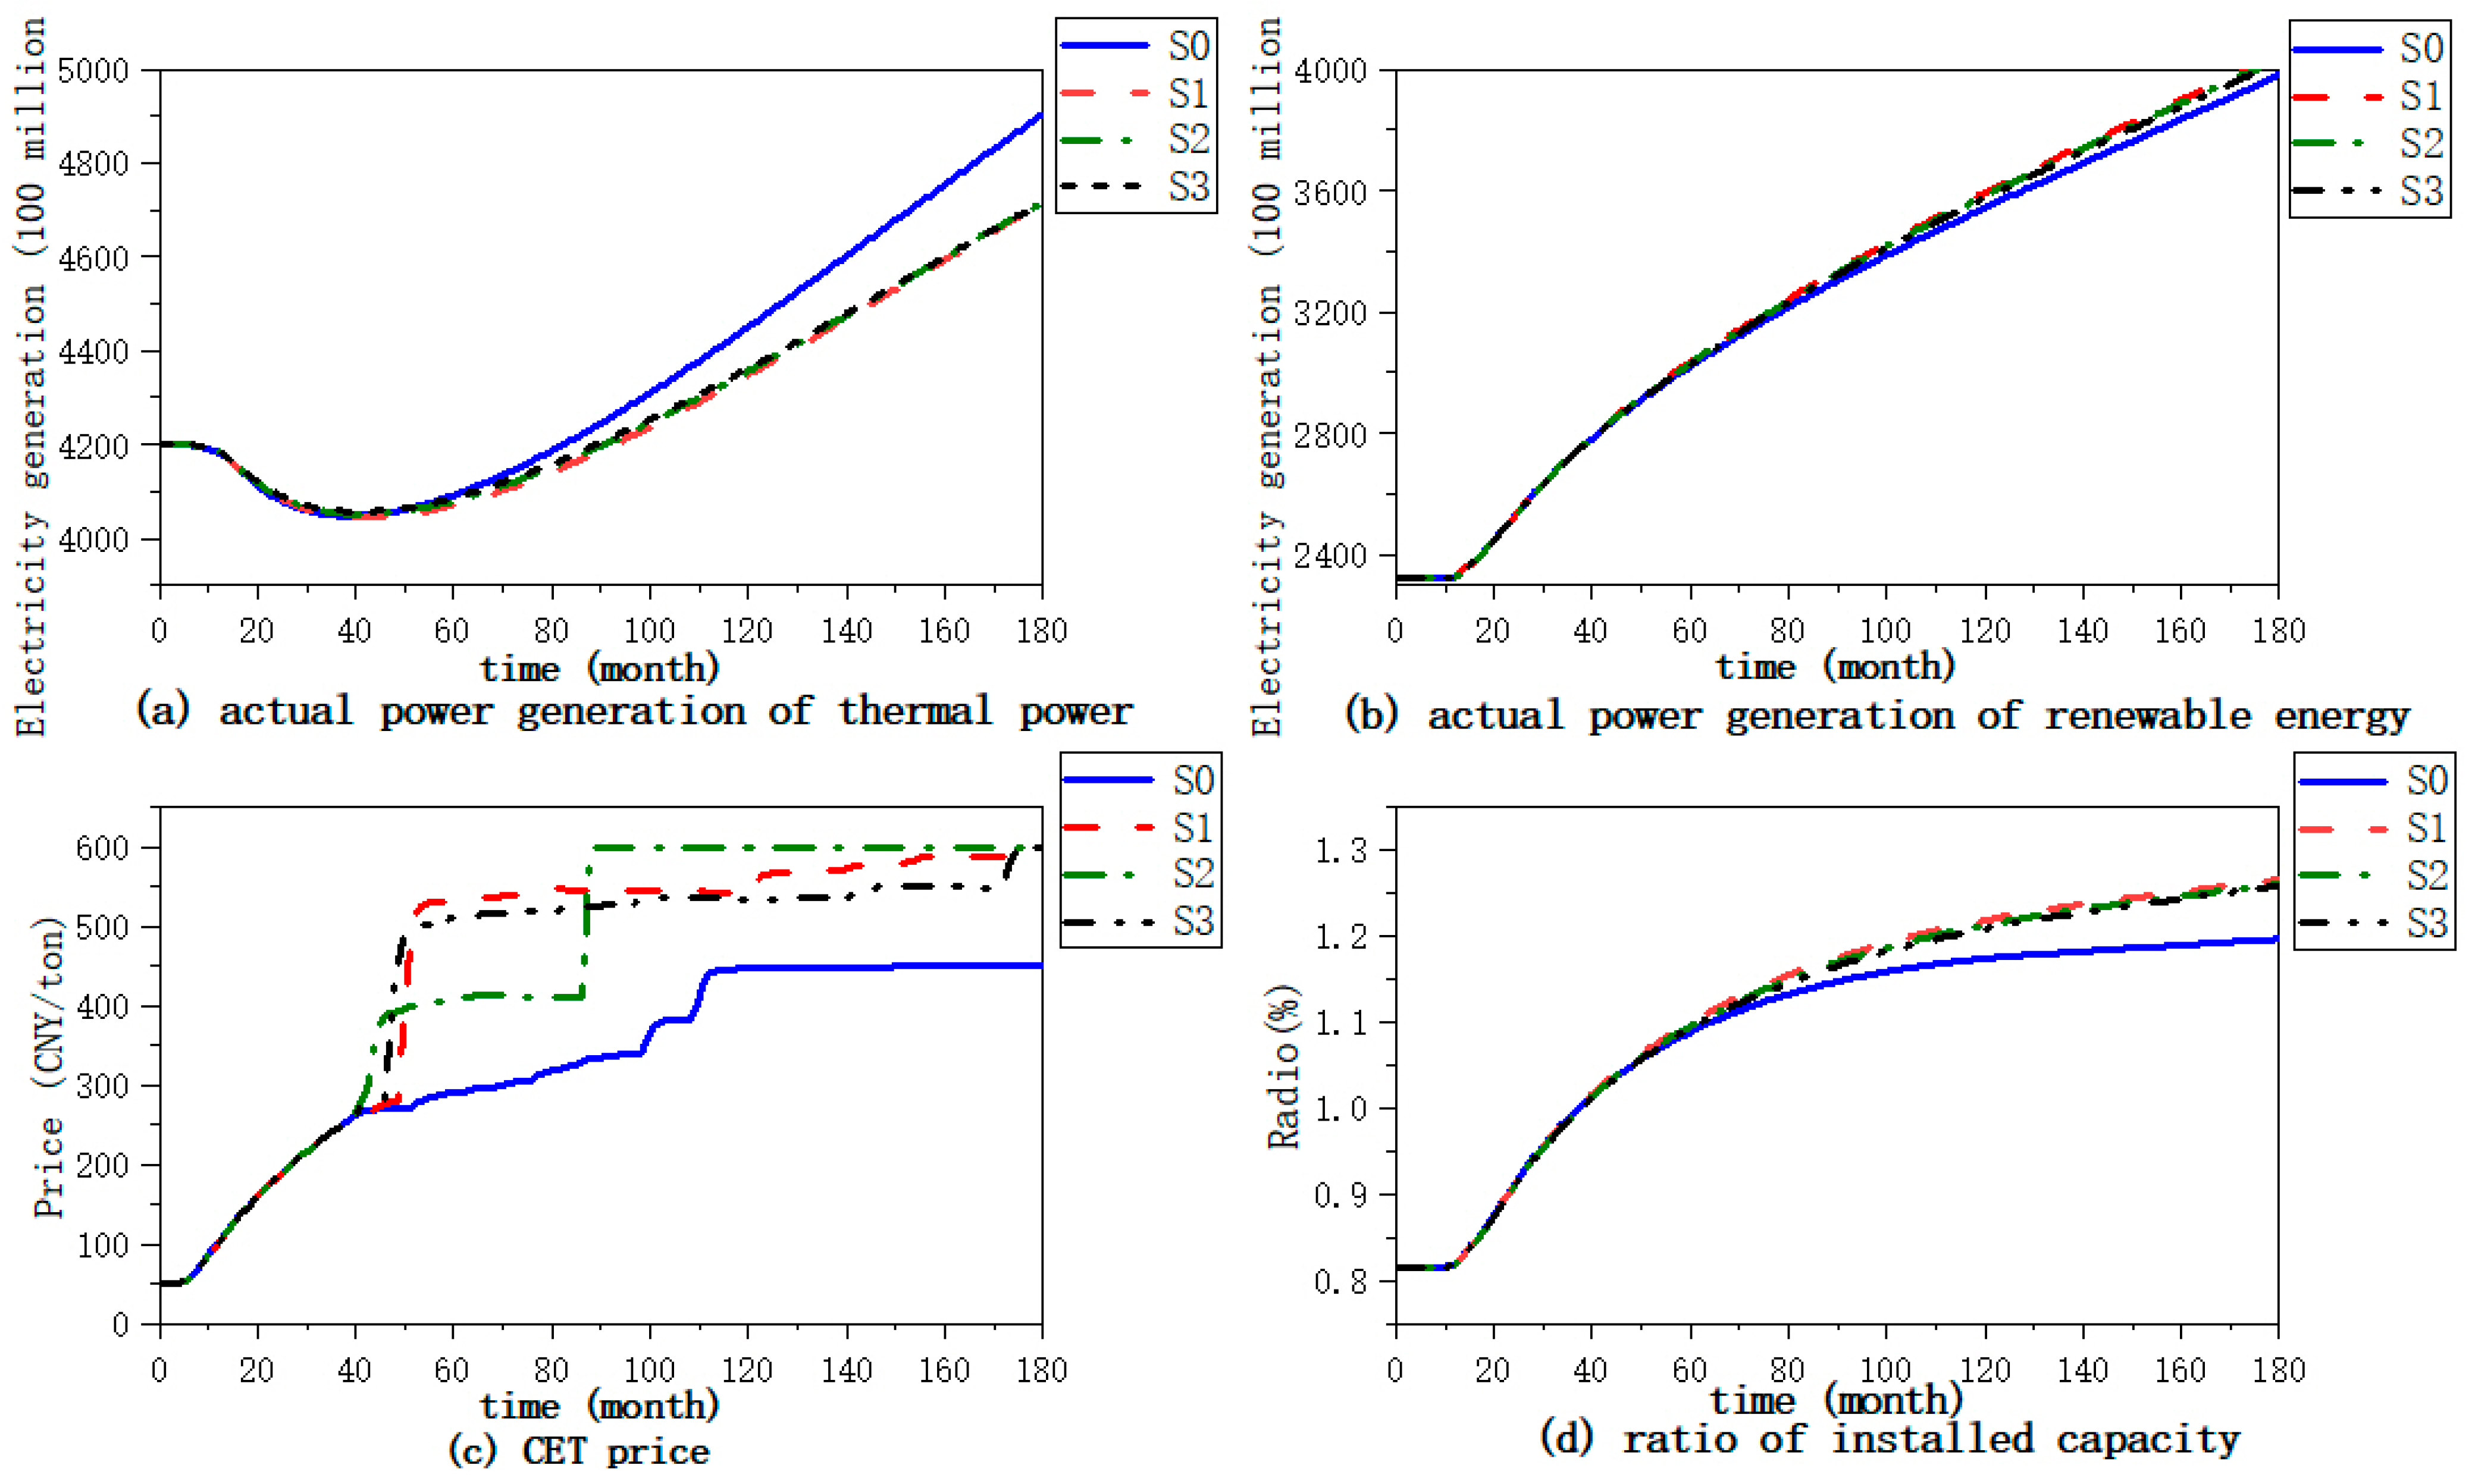
Figure 5 illustrates the continuous dynamic evolution trends of core indicators across different carbon tax scenarios throughout the 180-month simulation period, while Table 4 summarizes the end-of-simulation values of four key indicators after the full simulation cycle, namely actual thermal power generation, actual renewable energy generation, carbon emission trading (CET) price, and the ratio of renewable to thermal power installed capacity, as well as their corresponding percentage changes relative to the baseline scenario S0.
Divergence in actual thermal power generation emerged after month 6. Under the S0 baseline scenario with no carbon tax constraints, the thermal power generation continued to accelerate because there was no carbon cost pressure, reducing the incentive for enterprises to cut output and energy storage. This only played a basic peak-shaving role, with power generation eventually reaching 490.33 billion kWh at the end of the 180-month period; this was the highest value under all scenarios. Under carbon tax scenarios S1 to S3, thermal power growth slowed significantly, and energy storage further amplified the restraining effect by absorbing surplus renewable energy during low-load periods. This reduced the need for thermal power to maintain the base load. The end-of-period thermal power generation values in S1, S2, and S3 were 471.44 billion kWh, 471.69 billion kWh, and 471.52 billion kWh, respectively. These were all markedly lower than that of S0, with decreases ranging from 3.80 to 3.85%. This confirms that carbon taxes effectively restrain thermal power generation, and the restraining effect remains stable under different tax rates when coordinated with energy storage [50].
For actual renewable energy generation, divergence began after month 12. The S0 baseline scenario had the lowest growth rate throughout the period. Although energy storage improved accommodation, the lack of carbon tax incentives led to slow renewable energy investments. This resulted in an end-of-period power generation of only 322.38 billion kWh, the lowest value across all scenarios. In contrast, the S1 to S3 carbon tax scenarios showed significantly higher growth, as carbon taxes increased the cost advantage of renewable energy, and energy storage ensured that newly added output was absorbed. Scenario S1 delivered the most significant boosting effect, with end-of-period generation reaching 352.17 billion kWh, a 9.24% increase over S0 and the highest value under all scenarios. The end-of-period generation values in S2 and S3 were 347.89 billion kWh and 343.51 billion kWh, representing increases of 7.91% and 6.55%, respectively, compared to S0. This confirms that excessively high carbon taxes may increase supporting costs for renewable energy projects and weaken short-term expansion momentum, while a moderate carbon tax combined with energy storage maximizes the incentive for expanding the scale of renewable energy [51].
Divergence in terms of CET prices emerged after month 36. CET prices in the baseline S0 scenario continued to increase with growing energy demand, but the lack of carbon tax constraints led to insufficient regulation of the carbon emission demand. This resulted in an end-of-period price of only 449.34 CNY per ton. Under the S1 to S3 carbon tax scenarios, the CET prices increased significantly as carbon taxes increased demand for carbon quota reductions and energy storage stabilized volatile prices by optimizing the link between power output and carbon emissions. The end-of-period CET price in S1 was 592.39 CNY per ton, a 31.84% increase over S0, while prices in S2 and S3 both reached 600.00 CNY per ton, a 33.53% increase over S0. This shows that a carbon tax of 50 CNY per ton or above can push the CET prices to a stable upper limit. In addition, this can improve the predictability of the carbon market, with energy storage further enhancing price stability.
The ratio of renewable to thermal power installed capacity is affected by the 12-month lag effect of energy facility construction cycles, and this ratio stabilized at approximately 0.4612 under all scenarios from month 0 to 12, with fully overlapping trends. After month 12, the ratio continued to rise as carbon tax incentives and energy storage support took effect, and the scenario divergence gradually widened. The baseline S0 scenario had the slowest growth due to insufficient market incentives and energy storage investment, reaching only 0.8247 at the end of the simulation. In contrast, the S1 to S3 carbon tax scenarios showed significantly higher growth. S1 achieved the highest ratio of 0.9135, a 10.77% increase over S0, followed by S2 at 0.9052 and S3 at 0.8986, representing increases of 9.76% and 8.96%, respectively. This confirms that the synergy between carbon tax and energy storage effectively drives the clean transformation of the energy installation structure, and a 30 CNY per ton carbon tax, balancing investment cost and incentives, will achieve optimal structural optimization.
Based on these ratios, we further calculated the proportion of thermal power in the total installed capacity. The simulation results showed that thermal power accounted for over 52% of the total installed capacity in 2040 under all scenarios, with a minimum of 52.26% in S1 and 52.49% in the optimal policy scenario of S2. This means that even under a carbon tax policy that maximizes emission reductions and renewable energy development, thermal power still maintains a sufficient scale to bear the system base load and ensure safe operation. This result verifies that our policy design balances low-carbon transformation and energy security without compromising the reliability of the power system.

3.2.2. Coupling Analysis of Carbon Tax Policy and Renewable Energy Policy

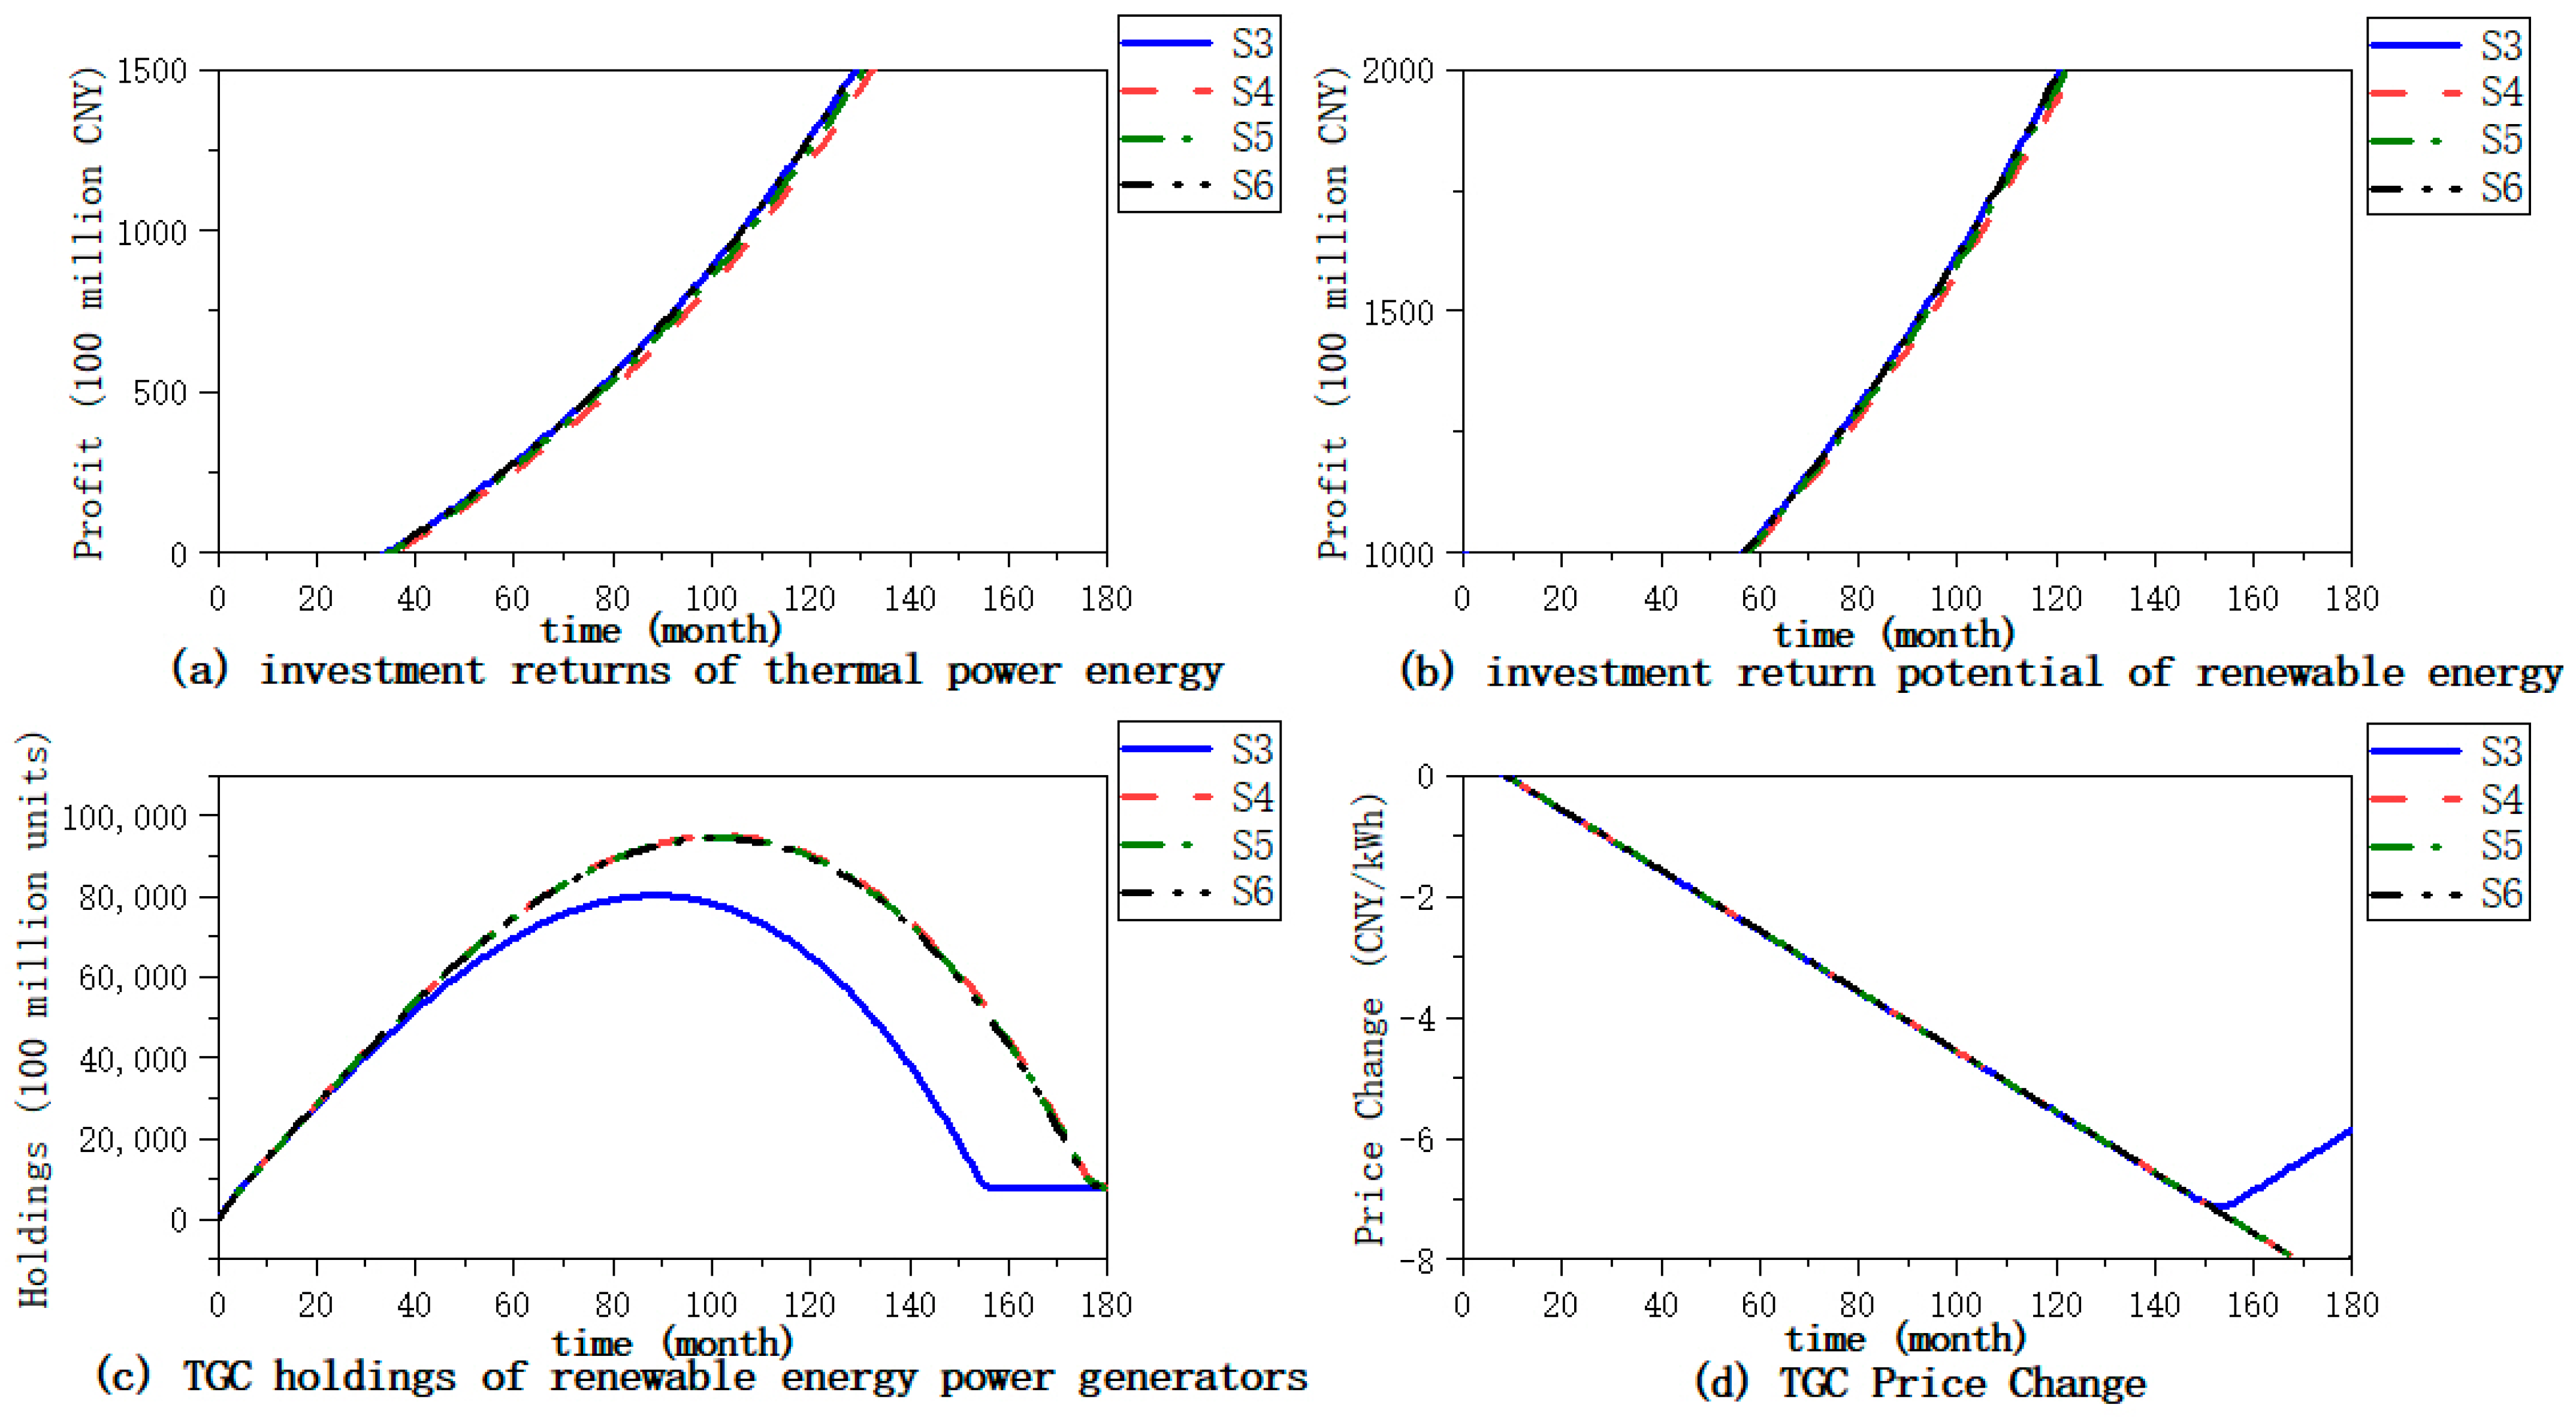
This section focuses on the coupling effect of different initial carbon tax rates and differentiated renewable energy quota policies, with the analysis centered on four key indicators: thermal power investment profit, renewable energy investment profit, TGC holdings of power generators, and TGC price fluctuations. In Figure 6 and Table 5, the initial values of all indicators were consistent under all scenarios, with identical trends observed from month 0 to month 28, as the energy storage system had not yet fully exerted its regulatory effect and market operation was dominated by fixed policy guidance during the early stage. Table 5 further quantifies the end-of-simulation values of four core indicators after the 180-month operation, namely TGC cumulative price change rate, thermal power investment profit, TGC holdings of renewable energy firms and renewable energy investment profit, as well as their corresponding percentage changes relative to the baseline scenario S3.
In terms of thermal power investment profit, all scenarios remained in the loss-making range from month 0 to month 28, after which they turned positive successively from month 29 onward, exhibiting rapid growth. Taking the high-quota benchmark scenario S3 (70 CNY/ton initial carbon tax + 40% renewable energy quota ratio) as the reference group for the 35% low-quota series scenarios, serving as the reference group for 35% quota scenarios), the profit growth rate was the lowest throughout the period, and the energy storage system only played a basic peak-shaving role, eventually reaching 84.82 hundred million CNY at the end of the 180-month period. This was the lowest value of all the scenarios. Under the S4 to S6 carbon tax scenarios (all with 35% renewable energy quota ratio), the profit growth rate was significantly faster than that under baseline scenario S3, and the energy storage system further improved the operational efficiency of thermal power enterprises by optimizing load matching. The end-of-period thermal power investment profit values under S4, S5, and S6 were 127.65 hundred million CNY, 114.93 hundred million CNY, and 101.58 hundred million CNY, respectively. These were all markedly higher than those under S3, with increases ranging from 19.76 to 50.50%.
For the renewable energy investment profit, all scenarios showed a downward trend from month 0 to month 12 and reached a trough prior to slowly rebounding. Under the baseline scenario S3, the profit growth rate remained the highest throughout the period, as the absence of additional carbon cost pressure under the 40% quota and the support of the energy storage system ensured stable profit margins. This resulted in an end-of-period profit of 125.98 hundred million CNY, which was the highest value under all of the scenarios. In contrast, the profit growth rates under the S4 to S6 carbon tax scenarios were all significantly lower than that under S3, as carbon taxes increased the operational costs of renewable energy projects. The end-of-period renewable energy investment profits in S4, S5, and S6 were 97.83 hundred million CNY, 94.51 hundred million CNY, and 87.92 hundred million CNY, respectively, representing decreases in the range of 22.34–30.21%.
Regarding TGC holdings of renewable energy firms, all scenarios showed sustained and rapid growth from month 0 to month 74 and reached their cyclical peak successively. They then entered a downward trend and stabilized after month 130. Under the baseline scenario S3, the TGC holdings were the highest at the end of the period due to insufficient market demand, reaching 1.8495 million certificates. Under the S4 to S6 carbon tax scenarios, the TGC holdings were all lower than those under S3, as carbon taxes stimulated TGC circulation and reduced inventory backlog. The end-of-period TGC holdings under S4, S5, and S6 were 1.5578 million certificates, 1.6782 million certificates, and 1.6165 million certificates, respectively, with decreases ranging from 9.26 to 15.77%.
In terms of TGC cumulative price change rate, all scenarios showed a continuous downward trend during the early stage and turned negative in terms of month-on-month growth rate after month 15. Under the baseline scenario S3, the TGC price remained stable at the initial level of 0.33 CNY/kWh, with a cumulative change rate close to zero at the end of the period. Under the S4 to S6 carbon tax scenarios, the cumulative price change rates dropped sharply to negative values, and S6 rebounded slightly at the end of the period while S4 and S5 continued their downward trend. The end-of-period cumulative TGC price change rates under S4, S5, and S6 were −5.87%, −6.25%, and −7.99%, respectively. Overall, the 35% renewable energy quota ratio is more favorable than the 40% benchmark ratio, as it achieves a balanced outcome across thermal power profitability improvement, TGC market circulation optimization, and reasonable return maintenance for renewable energy enterprises under carbon tax regulations.

3.3. Comparison of the Effects of Carbon Tax Introduction and Optimal Selection Under Different Carbon Allowance Price Levels

3.3.1. Scenario Setting

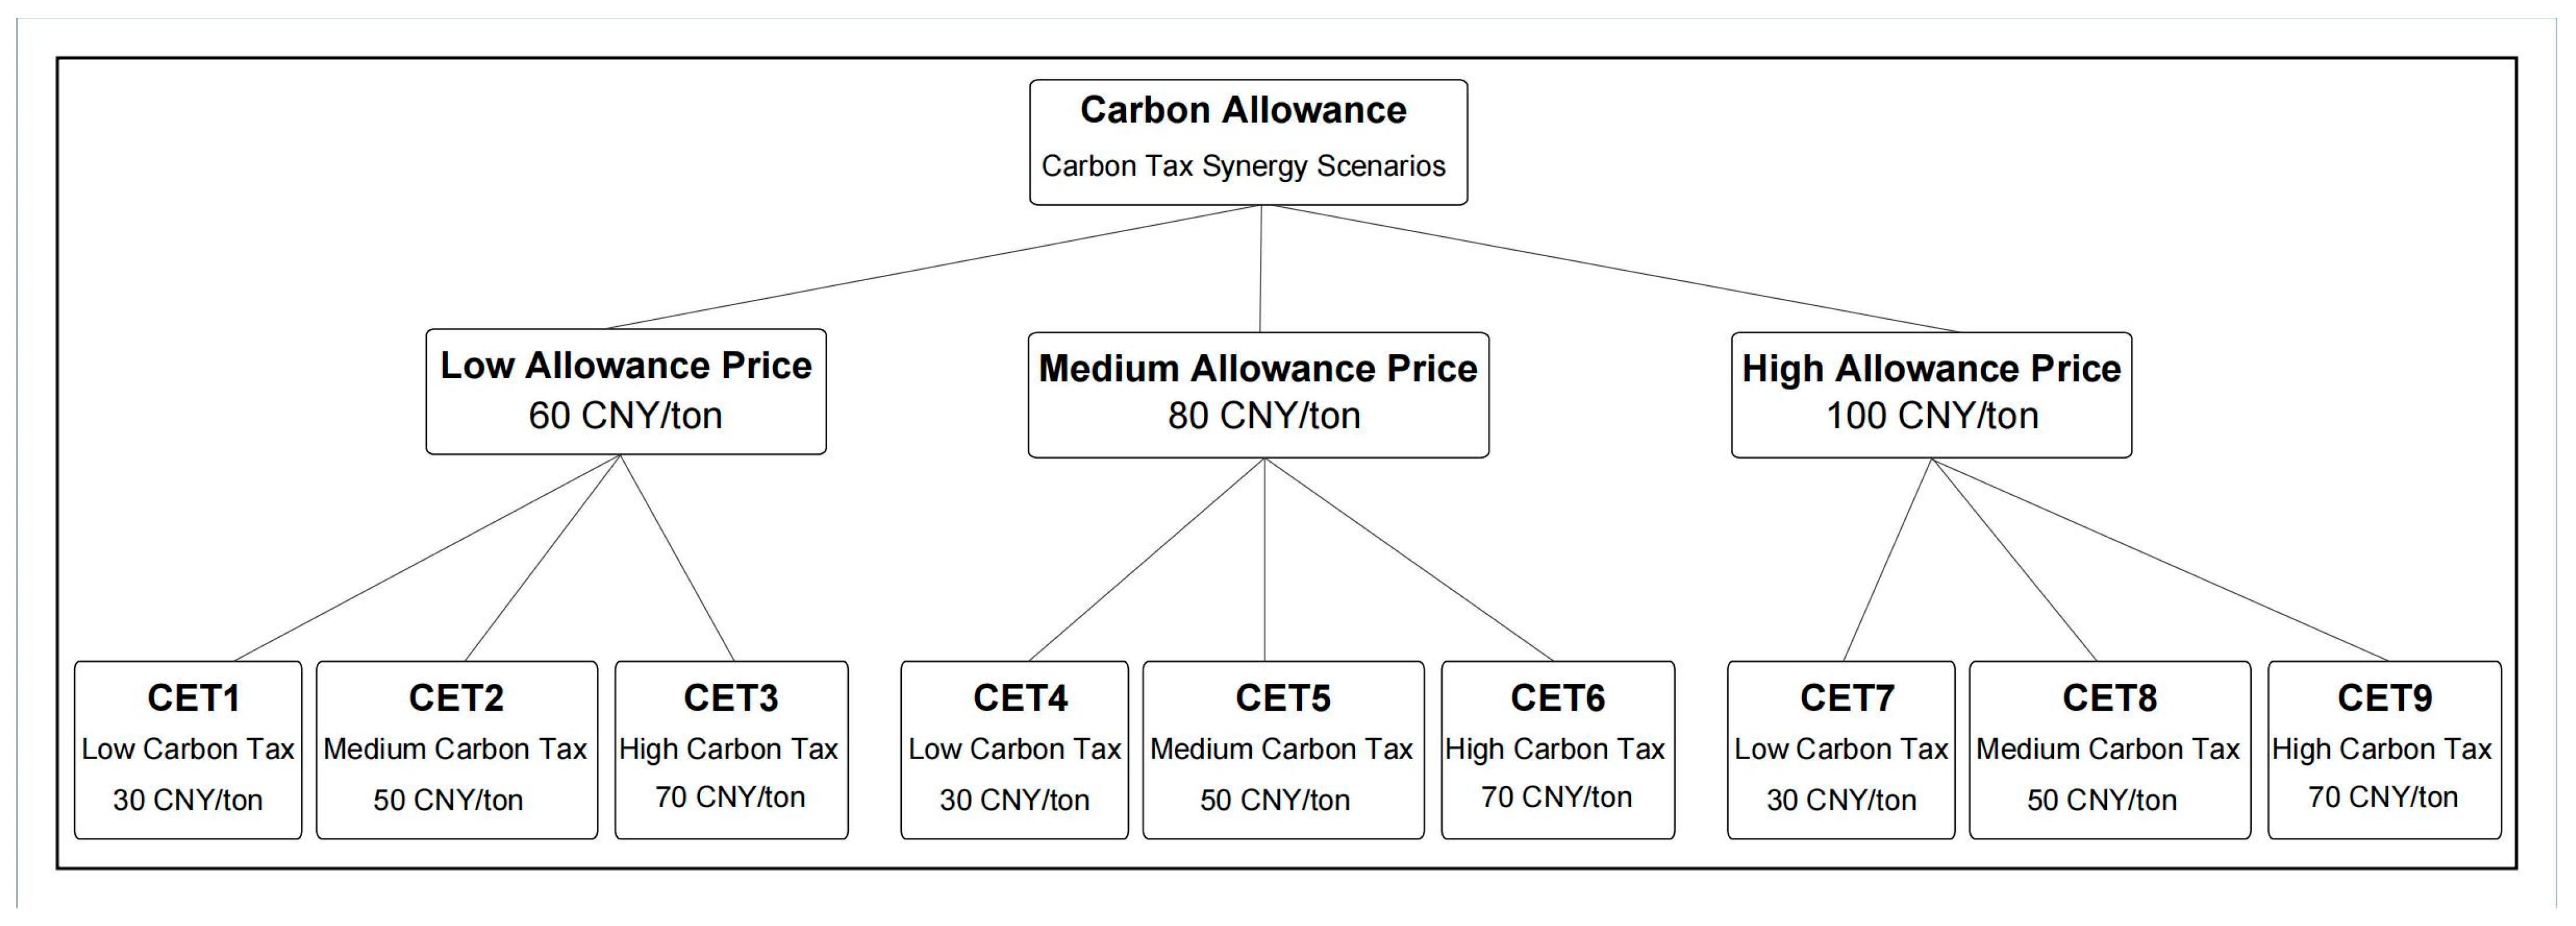
After identifying the optimal carbon tax threshold, it is also necessary to examine the timing of carbon tax introduction. Accordingly, this paper simulates the effects of introducing a carbon tax at different carbon allowance price levels to identify the most appropriate implementation timing. Table 6 and Figure 7 show the scenario settings of the carbon tax introduction under varying carbon allowance price levels.

3.3.2. Simulation Results

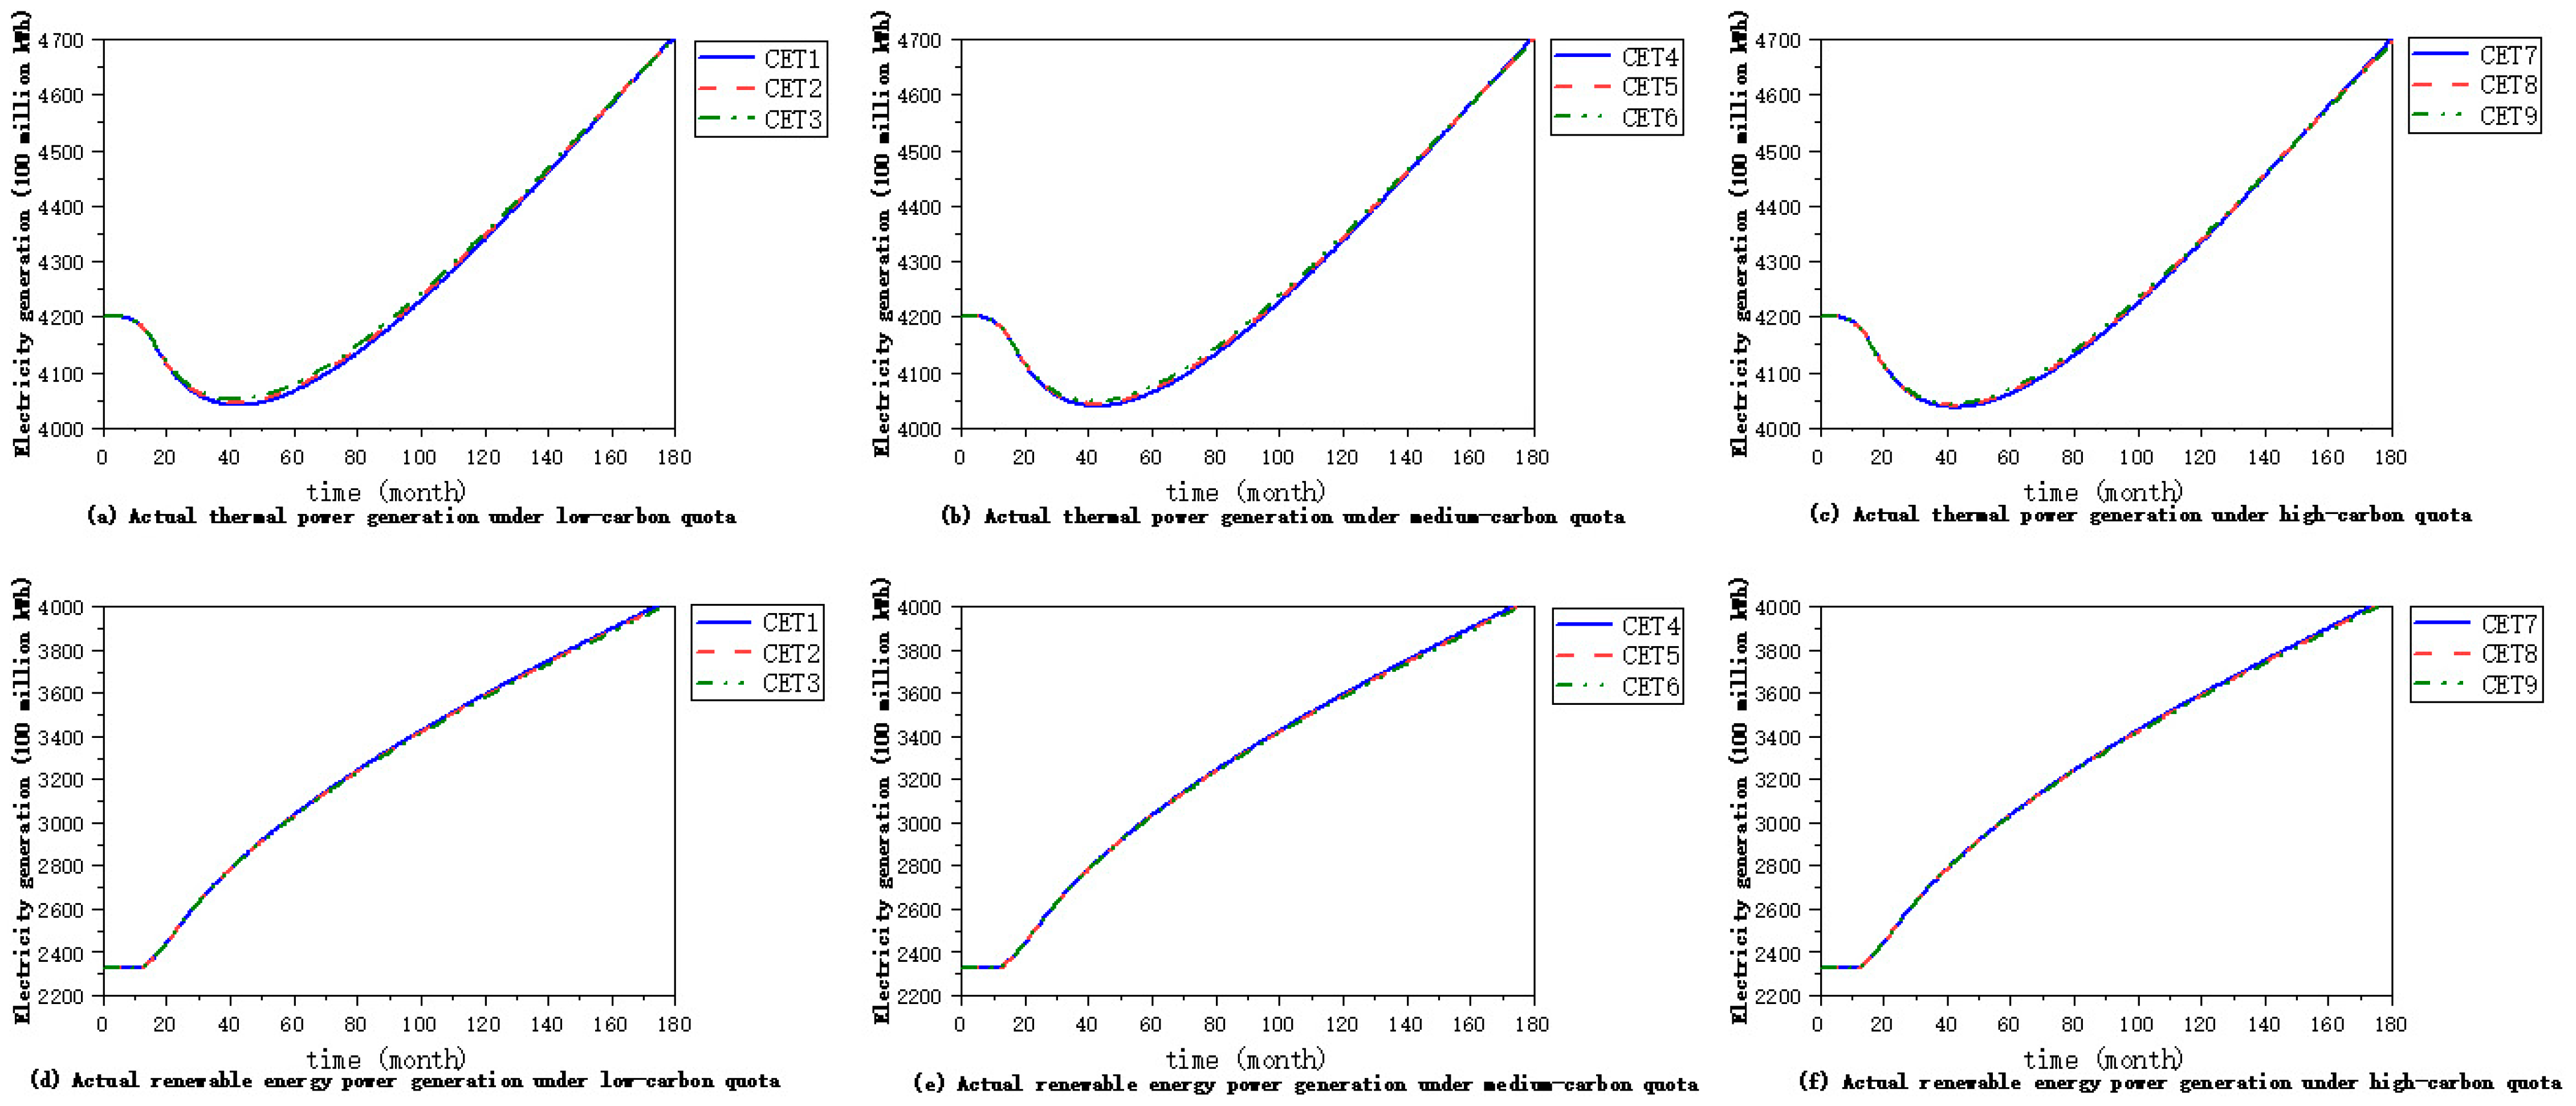
This section focuses on the combined effects of the different carbon allowance price levels and initial carbon tax rates, both of which are stratified into three tiers. For the carbon allowance prices, the tiers are defined as low at 60 CNY/ton, medium at 80 CNY/ton, and high at 100 CNY/ton, while for the initial carbon tax rates, the tiers are set as low at 30 CNY/ton, medium at 50 CNY/ton, and high at 70 CNY/ton. The analysis in this section is centered on two key indicators: the actual thermal power generation and actual renewable energy generation. Based on nine policy combination scenarios that are numbered sequentially from CET1 to CET9, as well as the quantitative data presented in Table 6, we elucidated the dynamic adaptation rules of the power system to dual carbon policies. This was achieved by horizontally comparing the regulatory effects of carbon taxes under the same allowance level and vertically contrasting the constraint intensity of different allowance levels under the same tax rate.
Figure 8 comprises six subplots. It shows the dynamic evolution of the two core indicators under all of the scenarios. To maintain consistency with the previous analytical framework, we still embedded the regulatory role of energy storage into the power balance mechanism. This mechanism fulfills three core functions: it smooths the intermittent output of renewable energy to ensure a stable TGC supply, optimizes thermal power peak-shaving costs to reduce profit losses caused by carbon taxes, and stabilizes the correlation between power generation and carbon emissions. These functions collectively lay the foundation for the reliability of the quantitative results in Table 7.
Under the low carbon allowance scenario, which was set at 60 CNY/ton and covers scenarios CET1 to CET3, relying solely on the allowance mechanism was insufficient to achieve effective emission reduction. As shown in Table 7, the actual thermal power generation in CET1, which adopts the low tax rate, reached 448.6 billion kWh at the end of the simulation period. This value is too high to meet the medium-term carbon reduction target. After the introduction of the medium carbon tax in CET2 and the high carbon tax in CET3, thermal power generation decreased to 425.3 billion kWh and 402.8 billion kWh, respectively, corresponding to reductions of 5.2% and 10.2%, respectively, compared with CET1. In terms of actual renewable energy generation, the growth momentum was weak under a single allowance policy, as CET1 only reached 178.3 billion kWh at the end of the period. With an increase in the carbon tax intensity, generation increased to 192.5 billion kWh under CET2 and 205.8 billion kWh under CET3, confirming that carbon taxes can effectively compensate for an insufficient incentive effect of low allowances.
Under the medium carbon allowance scenario, which was set at 80 CNY/ton and encompasses the CET4 to CET6 scenarios, the most balanced policy coordination effect was observed. This result was consistent with its positioning as a transitional price level. In terms of thermal power generation, CET4, which uses the low tax rate, had an end-of-period value of 432.5 billion kWh. This value was 3.6% lower than that of CET1, which combines low allowance and low tax rates and reflects the basic emission reduction constraint of medium allowances. When matched with the medium carbon tax in CET5, the thermal power generation stabilized at 410.7 billion kWh, a level that ensures both power supply reliability and carbon reduction targets. If the tax was further increased to 70 CNY/ton in CET6, the generation would drop to 395.2 billion kWh, which may excessively compress the profit space of thermal power enterprises. For renewable energy generation, CET5 achieved the optimal growth effect, with the end-of-period generation reaching 212.3 billion kWh, which was 19.1% higher than that under CET1. The growth rate was also more stable than that under the low allowance scenario, a difference that arose because the medium allowance enhanced the market demand for renewable energy, while the medium carbon tax avoided overinvestment risks.
Under the high carbon allowance scenario, which was set at 100 CNY/ton and includes scenarios CET7 to CET9, the allowance mechanism itself formed strong emission reduction constraints. Hence, high-intensity carbon taxes are no longer needed. As shown in Table 7, the actual thermal power generation under CET7, which adopts the low tax rate, was already 418.9 billion kWh, a level equivalent to the constraint effect of CET3 with a high tax rate under the low allowance scenario. If the carbon tax was increased to 50 CNY/ton under CET8 or 70 CNY/ton under CET9, the thermal power generation would further drop to 392.4 billion kWh and 376.5 billion kWh, respectively. This may disrupt the balance of the power supply and demand during peak load periods. For renewable energy generation, CET7, which combines high allowance and low tax rates, already reached 203.5 billion kWh at the end of the period. Although CET8 and CET9 showed continued growth, the marginal growth rate slowed from 7.5% to 5.3% when the tax increased from 30 to 70 CNY/ton. This indicates that high allowances already provide sufficient profit incentives, and excessive carbon taxes may trigger an overconcentration of renewable energy investments and curtailment issues.
In summary, the coordinated regulation of carbon allowances and carbon taxes must follow the core principle of “stage adaptation–intensity matching”. The medium carbon allowance at 80 CNY/ton matched with the medium initial carbon tax at 50 CNY/ton under CET5, and this was the optimal policy combination. It stabilized end-of-period thermal power generation at approximately 410 billion kWh and promoted renewable energy generation to exceed 210 billion kWh, thus balancing the power system reliability and dual carbon goals. Low allowances at 60 CNY/ton should be paired with medium-to-high carbon taxes between 50 and 70 CNY/ton to compensate for an insufficient emission reduction pressure, while high allowances at 100 CNY/ton only need low carbon taxes at 30 CNY/ton for supplementary regulation. The quantitative results shown in Table 7 provide clear empirical support for the phased optimization of China’s carbon pricing system.

4. Conclusions and Policy Recommendations

4.1. Conclusions

In this study, 2025 was used as the base year, and the simulation horizon was set to 2025–2040. We then constructed a system dynamics model that integrated electricity, carbon emission trading, and tradable green certificate subsystems, and systematically simulated the coupling mechanisms and policy effects of the three markets under different carbon tax and renewable energy quota scenarios. The primary conclusions derived directly from the empirical results are as follows:
First, an initial carbon tax rate of 30–50 CNY/ton achieves the optimal comprehensive effect. It reduced thermal power generation by 3.80% compared with the baseline scenario, increased renewable energy generation by 7.91%, and pushed CET prices to a stable upper limit of 600 CNY/ton, balancing emission reduction intensity, renewable energy development momentum, and power system cost controllability. A 30 CNY/ton initial carbon tax achieves comparable emission reduction effects with stronger incentives for renewable energy investment, while excessively high rates (70 CNY/ton) reduce the growth rate of renewable energy power generation, while maintaining relatively high investment returns under the 40% high quota scenario.
Second, the renewable energy quota ratio is the dominant factor driving TGC market operation, while the carbon tax has a limited direct impact on TGC price fluctuations. A 35% quota ratio matched the current stage of China’s energy transition and performed best when paired with a 50 CNY/ton initial carbon tax. A 40% quota ratio was found to be suitable for incremental policy adjustments after 2028 that could further increase the share of non-fossil energy without causing excessive market volatility.
Third, there is a clear dynamic matching rule between carbon allowance prices and optimal carbon tax introduction timing. When the carbon allowance prices stabilized at 60–80 CNY/ton, a 50 CNY/ton initial carbon tax achieved the best synergy. When carbon allowance prices increased above 100 CNY/ton, a 30 CNY/ton low carbon tax was sufficient as a supplementary constraint to avoid policy overlap and excessive enterprise cost burdens.
Fourth, ensuring the safe and stable operation of the power system is the primary premise of all low-carbon policies, and its priority is higher than the large-scale development of renewable energy. Consistent with the core model constraint, traditional thermal power must maintain a sufficient installed capacity and scale of generation to bear the base load part of the power load curve and guarantee the static and dynamic stability of the power system. Our simulation results showed that the proportion of thermal power installed capacity in China should not be less than 52% by 2040, which is an inviolable core boundary condition for carbon tax policy design. In addition, energy storage systems and grid loss minimization schemes can amplify the emission reduction effect of carbon pricing policies by 12–15% while reducing power supply costs, and these are important technical supports for multi-market coupling.
Overall, the coordinated operation of the electricity–carbon–TGC market is the core pathway for China’s power sector to achieve low-carbon transition. The carbon tax, as a supplementary policy tool to the CET market, must be dynamically matched with carbon allowance prices and renewable energy policies to avoid policy conflicts and maximize comprehensive benefits.

4.2. Policy Recommendations

Based on the four core conclusions derived from the empirical simulation results and combined with China’s dual carbon goals and ongoing power market reform progress, we propose several targeted and operable policy recommendations covering the short term from 2025 to 2028 and medium to long term from 2028 to 2040.
Our short-term policy recommendations, spanning 2025 to 2028, focus on precise policy coordination and market stability:
  • Drawing on the dynamic matching rule between carbon allowance prices and optimal carbon tax introduction timing, which represents the third core conclusion of this study, a phased carbon tax introduction strategy linked to carbon emission trading price levels should be implemented. When the national carbon emission trading price stabilizes between 60 and 80 CNY per ton, a carbon tax pilot should be launched in the power industry with an initial rate of 50 CNY per ton. When the price exceeds 100 CNY per ton, a low initial rate of 30 CNY per ton should be adopted to avoid superimposed cost pressures. A temporary short-term carbon tax ceiling of 120 CNY per ton should be set, with a long-term upper limit of 400 CNY per ton as specified in the model.
  • Building on the finding that the renewable portfolio standard ratio is the dominant driver of tradable green certificate market operation, which is the second core conclusion of this study, a differentiated renewable energy quota ratio should be implemented. The national renewable energy power quota ratio should be tentatively set at 35% in 2025, which aligns with the current stage of China’s energy transition. This should be gradually increased to 40% by 2028. A three-year cross-year carry-over mechanism for tradable green certificates should be established, and a mutual recognition rule under which 5–10% of tradable green certificates can be used to offset carbon emissions should be implemented to activate market liquidity.
  • The conclusion that energy storage systems and grid loss optimization schemes can amplify the emission reduction effects of carbon pricing policies by 12% to 15%, which constitutes the fourth core finding of this study, means that the supporting role of technical means should be strengthened. Grid loss minimization indicators should be incorporated into power market operation assessments, and a 20% carbon tax reduction should be granted to enterprises that adopt demand response and renewable energy consumption optimization technologies. The construction of pumped storage and new energy storage projects should be accelerated to achieve 100 gigawatts of new energy storage capacity by 2028.
  • The fourth core conclusion is that the thermal power base load guarantee serves as the core boundary condition for all low-carbon policies; hence, a market-oriented thermal power capacity compensation mechanism should be established. The mechanism should aim to maintain the proportion of thermal power installed capacity above 52% by 2040 and provide reasonable capacity subsidies to units that undertake the base load and peak regulation tasks. This will ensure that thermal power enterprises can recover their fixed costs while maintaining a sufficient power supply capacity and laying a solid foundation for the safe and stable operation of the power system during the low-carbon transition process.
Medium-to-long-term policy recommendations, covering 2028 to 2040, focus on deep emission reductions and system transformation:
  • The first core conclusion is that an initial carbon tax rate of 50 CNY per ton can achieve the optimal comprehensive effect; hence, the carbon tax intensity should be dynamically adjusted and its coverage expanded. When carbon emission trading prices increase to between 120 and 150 CNY per ton, the carbon tax rate should be gradually increased to 80 to 100 CNY per ton. In addition, the long-term carbon tax threshold should be raised to 200 to 300 CNY per ton by 2035. The carbon tax coverage should be expanded from the power industry to high-energy-consuming sectors such as iron and steel, cement, and chemicals by 2032.
  • Integrating the insights from the second and fourth core conclusions, the incentive and constraint mechanism for low-carbon transformation should be improved. A 15% carbon tax reduction should be granted to ultra-low emission thermal power enterprises to encourage their flexibility transformation. The paid allocation ratio of carbon allowances should be gradually increased from 5% to 30% by 2030, and the generated revenue should be used to establish a special fund for research and development of long-duration energy storage and carbon capture, utilization, and storage technologies.
  • The third core conclusion recognizes the dynamic matching of carbon allowance prices and the carbon tax intensity; hence, a unified multi-market joint operation and regulatory system should be constructed. A national unified electricity–carbon–tradable green certificate trading platform should be established to realize real-time data sharing and cross-market settlement. A comprehensive evaluation of carbon pricing policies should be conducted every three years, and relevant parameters should be dynamically adjusted according to market operation conditions.

Author Contributions

Conceptualization, L.C. and Q.S.; methodology, L.C.; software, L.C.; validation, L.C. and Q.S.; formal analysis, L.C.; investigation, Q.S.; resources, L.C.; data curation, L.C.; writing—original draft preparation, Q.S.; writing—review and editing, L.C.; visualization, Q.S.; supervision, L.C.; project administration, Q.S.; funding acquisition, L.C. All authors have read and agreed to the published version of the manuscript.

Funding

This research was funded by the National Social Science Foundation of China under the project “Research on Market Interface Mechanism and Policy Optimization of Renewable Energy Industry Development under the “Double Carbon” Target” (22BJY060).

Institutional Review Board Statement

Not applicable.

Informed Consent Statement

Not applicable.

Data Availability Statement

The original contributions presented in this study are included in the article. Further inquiries can be directed to the corresponding author.

Acknowledgments

We would like to acknowledge the general project of National Social Science Foundation (22BJY060) for supporting this research.

Conflicts of Interest

The authors declare no conflicts of interest.

Nomenclature

SymbolFull Name
TGCTradable green certificate
CETCarbon emission trading
GDPGross domestic product
RPSRenewable portfolio standard
IPCCIntergovernmental Panel on Climate Change
IEAInternational Energy Agency
CGEComputable general equilibrium
CERCertified emission reduction
SymbolDescriptionUnit
T R Volume of TGC held by renewable energy power generatorsMillion units
T 0 Initial TGC holding volume Million units
Δ P T Variation in the TGC priceCNY/kWh
P T 0 Initial TGC price CNY/kWh
Δ P C Variation in the carbon allowance priceCNY/ton
P C 0 Initial price of carbon allowancesCNY/ton
I R Installed capacity of renewable energyGW
I R 0 Initial installed capacity of renewable energyGW
I T Installed capacity of thermal powerGW
I T 0 Initial installed capacity of thermal powerGW
C S H Volume of carbon allowances held by sellersMillion tons
C S 0 Initial holding volume of carbon allowancesMillion tons
D E Electricity demandTWh
D E 0 Initial average monthly electricity demandTWh
C E Excess demand for carbon allowancesDimensionless
E E Excess electricity demandDimensionless
T O Volume of TGC acquired by renewable energy generatorsMillion units/month
T S Volume of TGC sold by renewable energy generatorsMillion units/month
C D Demand for carbon allowancesMillion tons/month
C S Supply volume of carbon allowancesMillion tons/month
C S D Volume of carbon allowances soldMillion tons/month
I R C Completed installed capacity of renewable energyGW/month
I T C Completed installed capacity of thermal powerGW/month
C B Projected purchase volume of carbon allowancesMillion tons
P E Current electricity priceCNY/kWh
D E R Real-time electricity demandTWh/month
S E Electricity supply volumeTWh/month
G R Actual power generation of renewable energyBillion kWh
G T Actual power generation of thermal powerBillion kWh
f T P CO2 emission factor of thermal powerkg/kWh
e G D P Carbon emission per unit of GDPton/10,000 CNY
s E Proportion of carbon emissions from the power industryDimensionless
r E Growth rate of electricity demandDimensionless
T B Volume of TGC purchased by power grid companiesMillion units
T G Volume of TGC held by power grid companiesMillion units
T S B Volume of TGC to be submitted by power grid companiesMillion units
P r Current TGC priceCNY/kWh
P r 0 Baseline TGC priceCNY/kWh
P C Current carbon allowance priceCNY/ton
C B H Volume of carbon allowances held by buyersMillion tons
P T A X Carbon tax priceCNY/ton
P T A X 0 Initial carbon tax priceCNY/ton
Δ P T A X Annual growth value of carbon taxCNY/ton/year
ε G D P GDP elasticity adjustment coefficientDimensionless
r G D P GDP growth rateDimensionless
k T TGC price adjustment coefficientDimensionless
k C Carbon allowance price adjustment coefficientDimensionless

References

  1. Intergovernmental Panel on Climate Change. Climate Change 2022: Mitigation of Climate Change. Available online: https://www.ipcc.ch/report/ar6/wg3/ (accessed on 12 March 2026).
  2. Net Zero Tracker. Net Zero Stocktake 2024: Assessing the Status and Trends of Net Zero Target Setting Across Countries, Subnational Governments, and Companies. Available online: https://ca1-nzt.edcdn.com/Reports/Net_Zero_Stocktake_2024.pdf?v=1732639611 (accessed on 10 April 2026).
  3. International Energy Agency (IEA). World Energy Outlook 2024. Available online: https://www.iea.org/reports/world-energy-outlook-2024 (accessed on 10 April 2026).
  4. Coase, R.H. The Problem of Social Cost. J. Law Econ. 1960, 3, 1–44. [Google Scholar] [CrossRef]
  5. Stavins, R.N. The Relative Merits of Carbon Pricing Instruments: Taxes Versus Trading. Rev. Environ. Econ. Policy 2022, 16, 62–82. [Google Scholar] [CrossRef]
  6. Pigou, A.C. The Economics of Welfare; Macmillan: London, UK, 1920. [Google Scholar]
  7. Nordhaus, W. Climate Change: The Ultimate Challenge for Economics. Am. Econ. Rev. 2019, 109, 1991–2014. [Google Scholar] [CrossRef]
  8. Zhang, X.D.; Zhang, D.; Yu, R.X. Theory and Practice of China’s National Carbon Emissions Trading System. Manag. World 2021, 37, 80–94. [Google Scholar] [CrossRef]
  9. Moledina, A.A.; Coggins, J.S.; Polasky, S.; Costello, C. Dynamic Environmental Policy with Strategic Firms: Prices Versus Quantities. J. Environ. Econ. Manag. 2003, 45, 356–376. [Google Scholar] [CrossRef]
  10. Fischer, C.; Heutel, G. Environmental Macroeconomics: Environmental Policy, Business Cycles, and Directed Technical Change. Annu. Rev. Resour. Econ. 2013, 5, 197–210. [Google Scholar] [CrossRef]
  11. Ni, J. A Study on the Carbon Tax and Carbon Emission Right Trading Mechanism. Tax. Res. 2016, 46–50. [Google Scholar]
  12. Research Group of Chinese Academy of Fiscal Sciences. Selecting Appropriate Opportunities to Levy Carbon Tax While Actively Promoting Carbon Emissions Trading. Public Financ. Res. 2018, 2–19. [Google Scholar]
  13. Eichner, T.; Pethig, R. Harvesting in an Integrated General Equilibrium Model. Environ. Resour. Econ. 2007, 37, 233–252. [Google Scholar] [CrossRef]
  14. Zhang, X.Z.; Sun, Y.Z.; Li, B.S.; Zhou, Y.X.; Guo, S.J. The Progress of Foreign Carbon Tax Mechanism and Its Effect of Carbon Reduction on China. Oil Gas New Energy 2024, 36, 12–18. [Google Scholar] [CrossRef]
  15. Qiao, K.; Feng, Z.Y.; Sun, H.T.; Li, H.W.; Su, P. The development and experience of international carbon tax policy practice: A mini review. Int. J. Low-Carbon Technol. 2024, 19, 2328–2334. [Google Scholar] [CrossRef]
  16. Gao, X.Y.; Zhang, Y.H. Feasibility Study of China’s Carbon Tax System under the Carbon Neutrality Target—Based on the CGE Model. Sustainability 2024, 15, 1026. [Google Scholar] [CrossRef]
  17. Song, D.D.; Shi, Y. Research on investment decision-making of enterprise green transformation projects: From the perspective of carbon trading market and carbon tax policy. Theory Pract. Financ. Econ. 2025, 46, 51–58. [Google Scholar]
  18. Shang, N.; Chen, Z.; Lu, Z.L.; Leng, Y. Interaction Mechanism and Coordination Mechanism of Power Market, Carbon Market and Green Certificate Market. Power Syst. Technol. 2023, 47, 142–154. [Google Scholar]
  19. Tang, B.J.; Li, R.; Wang, X.Y.; Zou, W.J.; Xu, P.Y. Linkage Mechanism and Synergistic Effect of China’s Carbon Market and Electricity Market. J. Beijing Inst. Technol. Soc. Sci. Ed. 2023, 25, 25–33. [Google Scholar] [CrossRef]
  20. Zhang, W.; Ju, R.; Zhang, M.; Huang, R.J. Simulation analysis of the linkage mechanism between carbon price and electricity price. China Mark. 2025, 45–48. [Google Scholar]
  21. Wang, Y.F.; Guo, K. Time-varying characteristic effects from the perspective of the correlation between electricity-carbon-green electricity markets. J. Glob. Energy Interconnect. 2026, 9, 251–261. [Google Scholar]
  22. Fotopoulou, M.; Tsekouras, G.; Rakopoulos, D.; Kontargyri, V. Demand response optimization for the enhancement of the distribution system’s operation. Sustain. Energy Grids Netw. 2025, 44, 102051. [Google Scholar] [CrossRef]
  23. Yang, H.T.; Zhang, Y.F.; Lai, S.D.; Chen, G.Y. Research on Loss Reduction of Distribution Network Containing Renewable Energy under Low Carbon Background. Energy Conserv. Technol. 2022, 40, 25–29. [Google Scholar] [CrossRef]
  24. Cai, J.T.; Li, Y.H.; Chen, A.J.; Zheng, Y.; Wu, X.M.; Bi, K.J. Renewable energy consumption optimization algorithm for distribution network under the new power system. Technol. IoT AI 2026, 58, 51–56. [Google Scholar]
  25. Li, C.C.; Zhang, X.; Hu, H.; Pan, S.; Su, Z.Y.; Zhou, P. Multi-source collaborative fault recovery of electricity-gas integrated energy system considering dynamic line pack effect. Electr. Power Autom. Equip. 2026, 46, 168–176. [Google Scholar] [CrossRef]
  26. Wang, Y.B.; Fan, X. Carbon Reduction Through the Synergy Between Carbon Intensity Quota Trading Market and Renewable Energy Support Policy in Electric Power Industry. J. Arid Land Resour. Environ. 2024, 38, 31–41. [Google Scholar]
  27. Yang, S.N.; Mi, F. Renewable Portfolio Standards, Carbon Emissions Trading and China Certified Emission Reduction: The Role of Market Mechanisms in Optimizing China’s Power Generation Structure. Energies 2025, 18, 894. [Google Scholar] [CrossRef]
  28. Wu, X.W.; Xie, Y.M.; Wu, J.; Chang, S.Q.; Feng, C.P. Research on renewable energy power quota allocation in China’s provincial regions. J. Taiyuan Univ. Technol. 2026, 57, 229–242. [Google Scholar]
  29. Zou, X.; Wei, Y.C. Research on Multi-Scale Market Coupling Trading of Electricity-Carbon-Green Certificate Based on System Dynamics. Electr. Power Sci. Eng. 2023, 39, 32–44. [Google Scholar] [CrossRef]
  30. Fang, D.B.; Yang, P.W.; Wu, F. Research on Equilibrium Strategies of Multiple Electricity Prosumers Under the Coordinated Mechanism of Electricity and Carbon Markets. Syst. Eng. Pract. 2024, 44, 3309–3329. [Google Scholar] [CrossRef]
  31. Zhou, F.H.; Wang, H.; Wang, H.L.; Wang, M.; Jin, Y.J.; Li, Z.C.; Zhang, Z.D.; Wang, P. Multi-Entity Behaviors in Electricity-Carbon-Green Certificate Coupled Markets Based on Multi-Agent Reinforcement Learning. Electr. Power 2025, 58, 44–52. [Google Scholar] [CrossRef]
  32. Zhao, H.R.; Zhao, Y.H.; Wu, Z.Y.; Li, H.S.; Zhang, H.L.; Qi, Z.; Zhang, Y.Y.; Guo, S. Bidding Strategy of Power Generators Under the Coupling of Power Market, Carbon Emission Right Trading Market and Certified Emission Reduction Market. Electr. Power Constr. 2024, 45, 123–135. [Google Scholar] [CrossRef]
  33. Tan, Z.F.; Liu, W.Y.; Liu, P.K. Policy Effects of Green Certificate Trading and Carbon Emission Right Trading on China’s Power Market. J. Technol. Econ. 2014, 33, 74–84. [Google Scholar] [CrossRef]
  34. Feng, T.T. Coupling Induction Analysis Model of Tradable Green Certificates and Carbon Emission Trading Acting on Electricity Market in China. Doctoral Dissertation, North China Electric Power University (Beijing), Beijing, China, 2016. [Google Scholar] [CrossRef]
  35. Chen, W.; Jiang, Y.W. Interactive Optimization of Day-Ahead Market Trading Considering Coupling of Carbon-Green Certificate-Renewable Electricity Consumption Market. Power Syst. Technol. 2024, 48, 1967–1979. [Google Scholar]
  36. Wang, X.; Wang, S.C.; Zhang, S.H. Game Analysis of Coupled Electricity-Carbon-Green Certificate Markets with Strategic Bidding of Renewable Generators. Power Syst. Technol. 2024, 48, 4125–4138. [Google Scholar]
  37. Weitzman, M.L. Prices vs. Quantities. Rev. Econ. Stud. 1974, 41, 477. [Google Scholar] [CrossRef]
  38. Zheng, S.; Dou, Y. Addressing Climate Change by Economic Means—A Comparative Analysis of Carbon Tax and Carbon Trading. Energy China 2013, 35, 11–15. [Google Scholar] [CrossRef]
  39. Zhan, B.C.; Feng, C.S.; Shang, N.; Lu, Z.L.; Liang, Z.Y.; Wen, F.S. Collaborative Optimization Strategy of Generation Alliance Participating in Electricity-Carbon-Green Certificate Market. Proc. CSU-EPSA 2023, 35, 84–94. [Google Scholar]
  40. Liu, Z.M.; Niu, J. Research on the Related and Coordinated Development of Electricity Marketization Reform and National Unified Carbon Market Construction—Based on the Dual Perspective of Cross-Subsidy and Price Transmission. Qilu J. 2024, 124–136. [Google Scholar] [CrossRef]
  41. Lin, B.Q. Coordinated Development of Carbon Market and Electricity Market Under Modern Energy System. Front. J. Women Stud. 2022, 56–65. [Google Scholar]
  42. Yang, X.; Fan, H.; Ye, X. Carbon Tax Revenue Recycling Strategy Choices Under Macroeconomic Uncertainty Based on Low-Carbon Technology Progress. J. Environ. Manag. 2025, 391, 126437. [Google Scholar] [CrossRef]
  43. Zhang, X.D.; Liu, X.Y. Research on Levying Carbon Tax and Developing Renewable Energy—An Analysis of Growth and Welfare Effects Based on the OLG-CGE Model. China Ind. Econ. 2015, 32, 18–30. [Google Scholar]
  44. Chang, X.; Lu, Y.; Tang, O. Strategic Responses to the Carbon Border Adjustment Mechanism: When and How to Implement a Carbon Tax. Omega 2026, 138, 103383. [Google Scholar] [CrossRef]
  45. Li, Z.; Dai, H.; Sun, L.; Xie, Y.; Liu, Z.; Wang, P.; Yabar, H. Exploring the Impacts of Regional Unbalanced Carbon Tax on CO2 Emissions and Industrial Competitiveness in Liaoning Province of China. Energy Policy 2018, 113, 9–18. [Google Scholar] [CrossRef]
  46. World Bank. State and Trends of Carbon Pricing 2024. Available online: https://openknowledge.worldbank.org/handle/10986/39867 (accessed on 10 April 2026).
  47. Zhang, N.; Pang, J.; Wang, Q.Y.; Chen, H. Simulation and Economic Impact of Renewable Energy Green Certificate Trading Mechanism: Based on the CGE Model. China Popul. Resour. Environ. 2023, 33, 51–62. [Google Scholar] [CrossRef]
  48. Xu, M.; Song, W.Q.; Wang, Z.X. Distributionally robust chance-constrained scheduling of new power system considering carbon tax. Electr. Meas. Instrum. 2025, 62, 157–165. [Google Scholar] [CrossRef]
  49. Liang, H.P.; Li, S.H.; Xie, X.; Wang, J.Y.; Su, H.F.; Niu, S.S. Low-carbon optimal scheduling of new power system considering carbon tax and demand response. J. North China Electr. Power Univ. 2025, 52, 42–48. [Google Scholar] [CrossRef]
  50. Dang, W.C.; Li, G.H.; Chen, Z.B. Equilibrium research on pumped storage power supply chain system under carbon tax policy. J. Ind. Technol. Econ. 2025, 6, 90–107. [Google Scholar]
  51. Yang, L.N.; Chen, W.J.; Li, J.C.; Yang, Z.N.; Li, S.W.; Wu, Z.J. Collaborative operation and benefit allocation of multi-microgrid groups under electricity-carbon-green certificate coupled trading. Power Syst. Clean Energy 2026, 42, 1–12. [Google Scholar]
Figure 1. Electricity–carbon–green power certificate multi-market coupled trading framework.
Sustainability 18 05241 g001
Figure 2. Diagram of the coupling relationships among carbon tax, carbon trading, green certificates, and power generation rights trading.
Sustainability 18 05241 g002
Figure 3. Coupling relationship diagram of the power system among renewable energy, thermal power, carbon tax, carbon trading, green certificates, and gross domestic product (GDP) under different power generation rights trading ratios.
Sustainability 18 05241 g003
Figure 4. Three-Market Coupling Scenario Tree Based on Renewable Energy Quota Gradient and Graded Carbon Tax.
Sustainability 18 05241 g004
Figure 5. Policy effects of the carbon market with and without carbon tax participation. (a) Actual power generation of thermal power; (b) Actual power generation of renewable energy; (c) CET price; (d) Ratio of installed capacity.
Sustainability 18 05241 g005
Figure 6. Coupling effects between the carbon tax policy and renewable energy policy. (a) Investment returns of thermal power energy; (b) Investment return potential of renewable energy; (c) TGC holdings of renewable energy power generators; (d) TGC price change.
Sustainability 18 05241 g006
Figure 7. Multi-scenario Tree Structure of Carbon Tax Introduction under Different Carbon Allowance Prices.
Sustainability 18 05241 g007
Figure 8. Comparison of the effects of carbon tax introduction under different carbon allowance price levels. (a) Actual thermal power generation under a low-carbon allowance; (b) Actual thermal power generation under a medium-carbon allowance; (c) Actual thermal power generation under a high-carbon allowance; (d) Actual renewable energy power generation under a low-carbon allowance; (e) Actual renewable energy power generation under a medium-carbon allowance; (f) Actual renewable energy power generation under a high-carbon allowance.
Sustainability 18 05241 g008
Table 1. Comparison of related studies.
StudyCore Research FocusKey LimitationCore Innovation of the Study
Gao et al. (2024) [16]China’s carbon tax feasibilityNo market couplingProposes phased differentiated carbon tax paths
Zou et al. (2023) [29]Carbon trading + TGC synergiesNo carbon tax introducedIncorporate carbon tax into three-market coupling
Fang et al. (2024) [30]Electricity–carbon prosumer equilibriumNo TGC or carbon taxClarifies optimal carbon price–carbon tax timing relationship
Zhou et al. (2025) [31]Three-market multi-entity decision-makingNo carbon tax consideredQuantifies the impact of carbon tax on carbon allowance price dynamics
Zhao et al. (2024) [32]Electricity–carbon–CER biddingNo TGC marketConstructs carbon tax-integrated three-market framework
Table 2. Initial model specifications.
VariableSpecificationVariableSpecification
Initial Carbon Allowance Price50 CNY/tonInitial Installed Capacity of Renewable Energy1100 GW
Carbon Allowance Price Floor10 CNY/tonInitial Installed Capacity of Thermal Power1350 GW
Carbon Allowance Price Ceiling600 CNY/tonInitial Electricity Demand9500 TWh
Initial Volume of TGC Held by Power Generators45.68 million unitsInitial Unit Power Generation Cost of Renewable Energy0.28 CNY/kWh
Initial TGC Price0.33 CNY/kWhInitial Unit Power Generation Cost of Thermal Power0.4 CNY/kWh
TGC Price Floor0.16 CNY/kWhThermal Power CO2 Emission Factor0.98 kg/kWh
TGC Price Ceiling0.62 CNY/kWhAverage Utilization Hours of Renewable Energy Units2700 Hours
Grid Loss6.5%Average Utilization Hours of Thermal Power Units4000 Hours
Initial Energy Storage Installed Capacity30 GWEnergy Storage Round-trip Efficiency90%
Maximum Charge/Discharge Power Ratio20%Initial State of Charge50%
Table 3. Multi-scenario Settings (TGC: tradable green certificate).
Scenario SettingScenario NumberingParameter SettingRationale for Setting
Baseline ScenarioS0No Carbon Tax, and Renewable Energy Quota Ratio of 40%The setting of a 40% renewable energy quota ratio is mainly based on the phased growth trend of national renewable energy power generation accounting for 39.7% in the first half of 2025, which is consistent with the quarterly growth law of renewable energy power generation.
Carbon Market with Carbon Tax Incorporation and Tradable Green Certificate (TGC) Market with High Renewable Energy Quota RatioS1Initial Carbon Tax Price of 30 CNY/ton(Transitional Tax Rate), and Renewable Energy Quota Ratio of 40%The carbon tax of 30 CNY/ton corresponds to the moderate regulatory intensity in the initial stage of the policy, and the renewable energy quota ratio remains consistent with the 40% high quota specified in the baseline scenario.
The carbon tax of 50 CNY/ton aligns with the average transaction price of 59.27 CNY/ton for carbon emission allowances in the national carbon market in 2025, which ensures the coordination between the carbon tax and carbon market prices and avoids the offsetting of policy effects.
The carbon tax of 70 CNY/ton covers the upper limit of recent market prices, reserves room for increasing emission reduction efforts in the medium and long term, and aligns with international carbon pricing goals simultaneously.
S2Initial Carbon Tax Price of 50 CNY/ton(Flexible Tax Rate), and Renewable Energy Quota Ratio of 40%
S3Initial Carbon Tax Price of 70 CNY/ton (Benchmark Tax Rate), and Renewable Energy Quota Ratio of 40%
Carbon Market with Carbon Tax Incorporation and Tradable Green Certificate (TGC) Market with Low Renewable Energy Quota RatioS4Initial Carbon Tax Price of 30 CNY/ton, and Renewable Energy Quota Ratio of 35%The 35% ratio is highly aligned with the top-tier national target of “around 35% share of non-fossil energy in primary energy consumption by 2030”. All scenarios in this category are coupled with graded initial carbon tax rates of 30 CNY/ton, 50 CNY/ton and 70 CNY/ton, thereby forming a regulatory framework of “basic quota plus graded carbon tax”. Meanwhile, it establishes a basic-advanced graded comparison with the 40% advanced quota scenarios.
S5Initial Carbon Tax Price of 50 CNY/ton, and Renewable Energy Quota Ratio of 35%
S6Initial Carbon Tax Price of 70 CNY/ton, and Renewable Energy Quota Ratio of 35%
Table 4. End-of-simulation core indicators of the electricity and carbon markets under different carbon tax scenarios.
IndicatorUnitBaseline Scenario (S0)S1S2S3Percentage Change vs. S0 (S1)Percentage Change vs. S0 (S2)Percentage Change vs. S0 (S3)
Actual Thermal Power GenerationBillion kWh490.33471.44471.69471.52−3.85%−3.80%−3.84%
Actual Renewable Energy GenerationBillion kWh322.38352.17347.89343.51+9.24%+7.91%+6.55%
CET PriceCNY/ton449.34592.39600.00600.00+31.84%+33.53%+33.53%
Ratio of Renewable to Thermal Power Installed Capacity0.82470.91350.90520.8986+10.77%+9.76%+8.96%
Table 5. End-of-simulation core indicators of the TGC market and power generation investment returns under the different carbon tax scenarios.
IndicatorUnitBaseline Scenario
S3
S4S5S6Percentage Change vs. S3 (S4)Percentage Change vs. S3 (S5)Percentage Change vs. S3 (S6)
TGC Price Change CNY/kWh0.33−5.87−6.25−7.99−1878.79%−1993.94%−2521.21%
Thermal Power Investment Profithundred million CNY84.82127.65114.93101.58+50.50%+35.50%+19.76%
TGC Holdings of Renewable Energy Firms10,000 Certificates184.95155.78167.82161.65−15.77%−9.26%−12.59%
Renewable Energy Investment Profithundred million CNY125.9897.8394.5187.92−22.34%−24.98%−30.21%
Table 6. Comparison of the effects of carbon tax introduction under different carbon allowance price levels.
Scenario SettingScenario NumberParameter SettingReason for Setting
Introduction of Carbon Tax under the Condition of Low Carbon Allowance Trading PriceCET1Low Carbon Allowance (60 CNY/ton) + Low Carbon Tax (Initial Value: 30 CNY/ton)The low carbon allowance of 60 CNY/ton is consistent with the average transaction price of 59.27 CNY/ton for carbon emission allowances in the national carbon market in 2025, fully aligning with the current actual market price level. Combined with the gradient initial carbon tax values of 30/50/70 CNY/ton set in this paper, it is used to verify the synergistic emission reduction effect of carbon taxes with different intensities in the low quota price range.
CET2Low Carbon Allowance (60 CNY/ton) + Medium Carbon Tax (Initial Value: 50 CNY/ton)
CET3Low Carbon Allowance (60 CNY/ton) + High Carbon Tax (Initial Value: 70 CNY/ton)
Introduction of Carbon Tax under the Condition of Medium Carbon Allowance Trading PriceCET4Medium Carbon Allowance (80 CNY/ton) + Low Carbon Tax (Initial Value: 30 CNY/ton)The medium carbon allowance of 80 CNY/ton falls within the reasonable price range set in this paper. As a transitional price connecting the current and medium-to-long-term periods, it conforms to the industry rule of “effective total quantity control + gradual price increase”.
CET5Medium Carbon Allowance (80 CNY/ton) + Medium Carbon Tax (Initial Value: 50 CNY/ton)
CET6Medium Carbon Allowance (80 CNY/ton) + High Carbon Tax (Initial Value: 70 CNY/ton)
Introduction of Carbon Tax under the Condition of High Carbon Allowance Trading PriceCET7High Carbon Allowance (100 CNY/ton) + Low Carbon Tax (Initial Value: 30 CNY/ton)The high carbon allowance of 100 CNY/ton falls within the reasonable range set in this paper, reflects the medium and long-term emission reduction pressure, and conforms to the long-term trend of “tighter total quantity control + rising price center”. Combined with the gradient initial carbon tax values of 30/50/70 CNY/ton, it is used to verify the synergistic effect of different carbon tax intensities in the high quota price range, so as to ensure the smooth transition of the market.
CET8High Carbon Allowance (100 CNY/ton) + Medium Carbon Tax (Initial Value: 50 CNY/ton)
CET9High Carbon Allowance (100 CNY/ton) + High Carbon Tax (Initial Value: 70 CNY/ton)
Table 7. End-of-simulation power generation indicators under the combined carbon allowance price and initial carbon tax rate scenarios.
IndicatorUnitLow Carbon AllowanceMedium Carbon AllowanceHigh Carbon Allowance
CET1 CET2 CET3 CET4 CET5 CET6 CET7 CET8 CET9
Actual Thermal Power GenerationBillion kWh448.6425.3402.8432.5410.7395.2418.9392.4376.5
Actual Renewable Energy GenerationBillion kWh178.3192.5205.8190.6212.3226.9203.5218.7230.2
Disclaimer/Publisher’s Note: The statements, opinions and data contained in all publications are solely those of the individual author(s) and contributor(s) and not of MDPI and/or the editor(s). MDPI and/or the editor(s) disclaim responsibility for any injury to people or property resulting from any ideas, methods, instructions or products referred to in the content.