


Abstract
Rural e-commerce is treated as a lever for common prosperity, but its welfare effect turns non-monotonic across digital-development gradients, raising concerns about the widening urban–rural gap in sustainable regional development. We built a county-year panel of 2725 Chinese counties from 2014 to 2022, with Taobao village density as the treatment, land-based agricultural value conversion efficiency as the county-level mediator, and the Peking University digital financial inclusion digitization sub-index as the moderator. The estimations combine two-way fixed-effect regressions, continuous-interaction moderation, Hansen panel-threshold regression, Callaway–Sant’Anna difference-in-differences, Bartik shift-share instrumentation with Rotemberg-weight diagnostics, and multiple imputation by chained equations supplemented by propensity-score sensitivity checks. Taobao village density linearly depresses rural per-capita disposable income and produces a significant U-shape in the nightlight Gini with an in-sample turning point. The marginal effect on Sen welfare moves from approximately log-units at low digitization to approximately at high digitization, with the sign-reversal becoming statistically significant only above the 55th percentile of the moderator (Hansen threshold at the 85th percentile), so the trap is a tail regime rather than a generalized reversal; over the panel window, however, 80.5% of counties cross into the trap zone in at least one year. Approximately 28 percent of the welfare squeeze passes through the land-based ecological efficiency channel, with parallel mediators delivering 19–90 percent. The deepest squeeze appears in cash-crop counties that platform theory predicted to benefit most, where the welfare effect at high digitization is roughly times the staple-grain effect. We label this pattern the Digital Saturation Trap and argue that sustainable urban–rural policy should shift from uniform platform access toward differentiated platform governance in counties beyond the saturation threshold.
1. Introduction
Since the Fifth Plenary Session of the 19th Central Committee established it as a defining objective for 2035, the concept of common prosperity has been a central organizing principle in Chinese economic policy. The framework treats rural revitalization as a critical pillar and e-commerce as the center of rural modernization. The Ministry of Commerce has sponsored the E-commerce in Rural Areas Programme through successive pilot batches, and since 2020, the Cyberspace Administration has designated digital-village pilots in 129 counties for accelerated connectivity. AliResearch counted 7780 Taobao villages at the end of 2022, up from 212 in 2014. These numbers signal both the scale of rural digital penetration and the policy expectation that e-commerce will translate ecological endowments into prosperity through wider market access.
The conventional view holds that better connectivity and more Taobao villages mean richer farmers and a narrower urban–rural gap. The county-level evidence in this study points to an uncomfortable possibility. Once a county crosses a certain digital-development threshold, additional e-commerce expansion stops being a dividend and becomes a drain on rural welfare. This reversal is concentrated in the upper tail of the digitization distribution rather than acting as a generalized pattern at the cross-sectional median; what makes the tail consequential for policy is that the digital capacity of Chinese counties is not stationary, and over our 2014–2022 panel window, roughly four out of five counties cross into the trap zone in at least one year as their digitization rises. The same policy template that lifted rural incomes during diffusion compresses them during saturation. This reversal matters both for interpreting the widening economic and social gaps among Chinese counties and for sequencing sustainable urban, rural, and regional development policy in the next decade. Within the broader sustainability research agenda, the finding speaks to the sustainability-of-strong-form view that economic, ecological, and social pillars must remain jointly viable: a rural digital strategy that delivers short-run scale gains but compresses ecological premia and concentrates rents in a thin platform tail violates the joint-viability requirement that distinguishes sustainable from merely growth-oriented development.
The empirical record has grown substantially over the last decade, yet remains analytically split. The first line documents welfare gains through consumer price reductions and online participation [1,2]. A second shift to income outcomes and identifies heterogeneous effects that depend on household participation and crop category [3,4]. The third qualifies the monotone benefit view, reporting conditional effects shaped by baseline digital capacity, regional institutional heterogeneity, and the joint balance of equity, efficiency, and environmental goals [5,6,7]. Across these literatures, the Chinese county remains an underused unit of analysis despite its theoretical centrality to common prosperity claims. Provincial panels hide substantial within-province dispersion, and household survey samples often cover too few counties for the identification of county fixed effects. Research on ecological product value conversion has produced its own empirical base [8,9,10], but has not been linked to the rural e-commerce question in a single identified design.
Three analytical gaps motivate this research. The first concerns the shape of the e-commerce prosperity relationship. A monotone positive effect implies a uniform policy recipe, whereas non-linearity implies that additional e-commerce expansion changes its welfare consequences past some threshold. Formal direction-of-non-linearity tests are rare in the rural e-commerce literature, yet the direction matters because inverted-U and U-shape carry opposite policy implications. The second gap concerns the mechanisms. Rural e-commerce is not a single treatment but operates through market access, price discovery, and transformation of production decisions. Separating a traceable mechanism from a black-box reduced form requires a county-level mediator with within-county variation, which rules out mediators that are measured at a higher administrative unit. The third is the moderating role of digital development. The dominant framing treats digital capacity as a dividend-generating enabler, so better connectivity amplifies the welfare return. An alternative reading is that at sufficiently high digital capacity, the marginal return turns negative, reversing rather than amplifying the conventional prediction.
We address these three gaps through a consistent empirical framework and propose a concept that organizes our findings. The county-year panel covers 2725 counties across 30 provinces from 2014 to 2022, matched against the full AliResearch Taobao-village roster with a 96.9% identifier-recovery rate. The outcome set combines rural per-capita disposable income, the nightlight-based county Gini coefficient, and the Sen social welfare function [11], so that pie scale and pie distribution enter the model separately and jointly. The mediator is the land-based agricultural value conversion efficiency at the county level, which is constructed from administrative output and land area records. The moderator is the digitization sub-index of the Peking University Digital Financial Inclusion Index [12]. Identification relies on complementary designs. Continuous interaction specifications provide smooth moderation evidence through the delta method inference on conditional marginal effects. Panel threshold estimation with the wild residual bootstrap [13,14] provides formal regime-switch evidence. The Callaway and Sant’Anna staggered difference-in-differences design [15] treats the digital village pilot as an exogenous shock. A Bartik shift-share instrument from historical telephone infrastructure [16] addresses residual endogeneity, and multiple imputation by chained equations [17] bounds mediator missingness.
The findings converge on a coherent pattern that we label as the Digital Saturation Trap. Higher Taobao village density linearly depresses rural per capita disposable income. The impact on county-level inequality exhibits a U-shaped pattern with an in-sample turning point. Initially, inequality decreases with the diffusion of e-commerce, but subsequently increases as density continues to grow. Land-based ecological value conversion efficiency is a statistically traceable mediator that accounts for approximately 28% of the welfare effect; alternative agricultural-productivity mediators raise that share to 19% (grain output per land) and up to 90% (agricultural output per worker), so the land-based estimate is conservative rather than upper-bound. The marginal return from Taobao village density moves from strongly positive at low digitization to strongly negative at high digitization, with a Hansen threshold test and a continuous-interaction test agreeing on the reversal. The reversal becomes statistically distinguishable from zero in the upper-tail region of the moderator (above approximately the 55th percentile in continuous form and the 85th percentile under the Hansen threshold), which makes the trap a tail regime rather than a generalized reversal in cross-section. The corresponding cohort interpretation is sharper: 80.5% of counties cross into the trap zone for at least one year during the 2014–2022 window, so a tail observation in cross-section maps to a near-modal experience over time. The deepest welfare squeeze emerges in cash-crop counties that platform theory predicted to benefit most from product differentiation, reinforcing rather than weakening the saturation reading; the conditional welfare effect at high digitization reaches log-units for cash-crop counties, which is roughly 3.1 times the corresponding effect in staple-grain counties. These results qualify both the conventional view that rural e-commerce mechanically yields common prosperity and the corresponding view that rural digital infrastructure mechanically yields inclusive gain. The implied policy direction is that the marginal welfare return from further Taobao-village expansion in already digitized counties is low or negative and that the ecological product value transfer channel requires institutional protection against platform-driven standardization pressures.
The remainder of this paper is organized as follows. Section 2 synthesizes the rural e-commerce, ecological value conversion, and digital moderation literature and distills four testable hypotheses from their shared blind spots. Section 3 introduces the county-year panel, walks through the construction of the outcome, treatment, mediator, and moderator variables, and lays out the empirical strategy. Section 4 moves step-by-step through the baseline shape tests, ecological mediation decomposition, continuous and threshold moderation evidence, staggered difference-in-differences and shift-share identification, heterogeneity analysis, and robustness battery. Section 5 interprets these findings, positions the Digital Saturation Trap against the prevailing digital-dividend and ecological-endowment narratives, and acknowledges the main limitations of our design. Section 6 concludes by drawing together the policy implications and pointing to data extensions that will sharpen the saturation account in future work.
2. Literature Review and Hypotheses
2.1. Rural E-Commerce and Common Prosperity
Over the past decade, three distinct strands of evidence on rural e-commerce have emerged, each leading to notably different conclusions. The initial strand of research highlights significant welfare improvements at the consumer level. Fan et al. [1] demonstrate that the Alibaba effect resulted in reduced rural prices for tradable goods, leading to quantifiable spatial consumption welfare gains, particularly in smaller, remote counties. Couture et al. [2] further this analysis through a randomized controlled trial of the e-commerce-to-the-countryside program in 100 Chinese villages, revealing positive consumption effects alongside modest changes in household income. Both share the premise that digital infrastructure reduces friction and improves welfare through standard gains-from-trade mechanisms.
The second strand extends from consumption to the production side. Luo and Niu [3] document that Taobao village participation raises household income in treated counties but cautions that spillovers to non-participants are limited. Li and Qin [4] extend the evidence to a panel of Taobao villages, finding positive income effects concentrated in higher-productivity crops. Zhang et al. [18] complement these with positive associations between rural e-commerce development, poverty reduction, and household income growth in rural China. This literature largely treats the e-commerce effect as monotonic and positive once observable county characteristics are controlled.
The third strand qualifies the monotonic view. Wang and Sun [5] ask whether rural e-commerce policy delivers a uniform digital dividend for the Chinese urban–rural income gap and report conditional effects that vary with local pilot status and baseline digital capacity. Zhong et al. [6] exploit China’s common-prosperity demonstration area and show that the digital economy contributes to urban common prosperity with uneven sub-regional intensities, hinting at non-linearity. Wang and Shen [19] use an international sample and show that digital economy development can either improve or worsen income inequality depending on baseline conditions, so the same policy narrows gaps in some settings and widens them in others. Chen et al. [7] argue that digital infrastructure contributes to a common-prosperity development model only when equity, efficiency, and environmental objectives are harmonized rather than pursued in isolation. Most qualifying evidence focuses on household survey outcomes or province-level aggregates, with little work examining the county as the theoretically relevant unit for testing common prosperity claims.
The literature on policy evaluation further supports this interpretation of non-linear effects. Zou et al. [20] examine the role of digital inclusive finance in fostering common prosperity across various Chinese cities, highlighting heterogeneous contributions that diminish as the initial financial depth increases. Similarly, Song and Du [10] demonstrate that the conversion of ecological endowments into economic returns is contingent on the scale and design of the corresponding financial instruments. Both analyses converge on the observation that e-commerce and digital finance channels may not uniformly benefit impoverished populations; however, the underlying mechanisms remain unclear.
2.2. Ecological Value Conversion as a Mediating Channel
The two-mountains doctrine provides the policy backdrop for treating ecological assets as a distinct source of welfare in rural China, and practice-oriented research has begun distilling lessons on how this value is realized [21]. Gross ecosystem product accounting operationalizes this perspective as an established measurement framework [8]. The analytical challenge is that the translation from ecological endowment to household income depends on production decisions that are sensitive to market structure. Standardized high-volume supply on platform markets raises total output but compresses the differentiated premia on which the ecological product value story rests.
The evidence on the production side is mixed. Gao et al. [9] estimate eco-efficiency for three staple food crops across Chinese regions and find spatial dispersion tracking regional ecosystem-service endowments, indicating that aggregate productivity masks regional efficiency heterogeneity. Zhu and Huo [22] show that the link between agricultural production efficiency and agricultural carbon emissions is uneven across Chinese provinces, so efficiency gains do not translate mechanically into proportional emission reductions. Xu et al. [23] connect these patterns to cultivated land transfer, showing that the transition shifts fertilizer and pesticide use in ways that erode ecological protection so output growth can coexist with ecological degradation. Si et al. [24] compare resource- and non-resource-based Chinese cities and find green technology innovation promoting green economic growth with regional heterogeneity, concentrated where institutional environments support the transition. The common thread is that rising output does not mechanically translate into rising ecological value conversion, with conversion efficiency shaped by institutional and market conditions.
Studies directly connecting e-commerce to ecological efficiency remain rare, but adjacent contributions have sketched a theoretical link. Calvano et al. [25] show that algorithmic pricing agents converge on tacit collusion in two-sided markets, compressing seller-side margins once platform concentration rises. Chen et al. [7] emphasize that digital infrastructure underpins a common-prosperity trajectory only when equity, efficiency, and environmental objectives are jointly balanced, so inclusive gains hinge on governance design rather than platform access alone. Geng et al. [26] model two-sided platform competition and show competitive pressure concentrating on a narrowing share of sellers as platforms scale. Platforms favor standardized high-volume suppliers, which accelerates price competition in commoditized categories and erodes the room for differentiated ecological premiums. These contributions imply that the translation from ecological endowment to household income depends on a variable not yet measured at the county level. The quantity of interest is how efficiently a given ecological base is converted into economic value under a specific market structure regime. Our land-based value conversion measure, the agricultural output value per land area, provides a traceable county-year mediator that fills this empirical gap. The variable quantifies the economic value generated per unit of ecological input, serving as the natural measurement counterpart to the two-mountain concept.
2.3. Digital Development from Dividend to Saturation
Digital development has been studied through three successive frames. The oldest framing, the digital divide, was conceptualized by Norris [27] as inequality of physical access to digital infrastructure and has since shifted toward second- and third-level divides relating to skills and outcomes [28]. The second framing, the digital dividend, treats digital penetration as an enabler of financial inclusion and economic participation. The World Bank’s Global Findex quantifies the dividend through account ownership, digital payments, and insurance uptake and finds robust positive correlations with household resilience [29]. In China, Guo [12] developed a widely used county-level digital financial inclusion index underpinning much empirical work on digital dividends. Gao and Gao [30] report that digital financial inclusion strengthens agricultural-value-chain resilience and attenuates supply-side shocks for rural producers, and Zhang and Zhang [31] confirm that digital economy expansion exerts a robust spatial spill-over on regional outcomes in low-carbon industrial development across Chinese cities.
A third framing has emerged recently in which digital expansion shifts from dividend to saturation. Acemoglu and Restrepo [32] document substantial wage displacement from automation in the US labor market, and subsequent work extends the displacement logic to platform economies. Chen and Wu [33] show that intellectual property protection conditions digital economy development, implying heterogeneous returns to digital expansion across jurisdictions with different institutional strengths. Zhao et al. [34] find a conditional carbon-productivity gain from the digital economy at the city level, concentrated in cities below a density threshold. The same inferential lesson, that an apparently monotone relationship can reverse sign once the upper region of the conditioning distribution is isolated, has also been documented in the financial-intermediation literature through a quantile-VAR analysis of stress connectedness across market regimes [35]. These contributions share a growing recognition that additional digital capacity does not mechanically translate into additional welfare and that marginal returns can become negative past certain points.
The empirical detection of nonlinear digital moderation relies on two complementary designs. Threshold regressions [13] provide a formal test for regime switches and have been applied to questions ranging from finance-growth relationships to environmental Kuznets curves. Continuous interaction specifications enable inference of marginal effects across the moderator distribution without committing to a specific threshold location. Both approaches agree that the regularities of interest are most visible in the upper tail of the moderator rather than at the mean level. Our Hansen wild-bootstrap implementation follows the block-resampling guidance of MacKinnon et al. [14], and the interaction specification supplements threshold evidence.
Beyond specifications, a growing body of work identifies concrete channels through which digital saturation operates. Platform concentration raises participation inequality and erodes late-entrant seller margins [26]. Live-streaming and algorithmic recommendations produce winner-take-all dynamics, in which the top one percent of sellers capture a disproportionate share of transactions. These channels are particularly relevant for agricultural products whose value is tied to freshness, geographic indications, or cultural branding rather than volume. According to the saturation hypothesis, the welfare benefits derived from e-commerce diminish as digital capacity increases, rather than continuing to rise once the local market has surpassed the initial phase of diffusion.
2.4. Research Gap and Hypotheses
Although these three bodies of literature have evolved concurrently, they have yet to be integrated into a unified empirical framework. The first establishes that e-commerce affects rural welfare but does not resolve the distributional ambiguity between income levels and inequality. The second establishes ecological value conversion as a meaningful channel for rural prosperity, but has not linked it to platform-driven competition in an identified county-level design. The third proposes that digital development is a moderator rather than a uniform enabler; however, a formal test of the moderation direction within the e-commerce context has not been conducted. Our contribution lies at the intersection of these three research gaps.
We formulated four hypotheses. The initial pair pertains to the fundamental relationship between the density of Taobao villages and the outcomes observed at the county level.
Hypothesis H1a (Scale Decline).
A higher Taobao village density depresses rural per-capita disposable income at the county level. The effect is linear for the treatment variables.
Hypothesis H1b (U-shaped Inequality).
The relationship between Taobao village density and the county Gini coefficient is U-shaped. Inequality first declines with e-commerce expansion and later rises once the density passes an in-sample turning point.
The second hypothesis concerns the ecological mediation channels.
Hypothesis H2 (Ecological Value Squeeze.).
A meaningful share of the welfare effect of Taobao village density on rural welfare operates through the decline in land-based ecological value conversion efficiency. The indirect effect was negative and statistically distinguishable from zero at conventional significance levels.
The third hypothesis concerns digital development’s moderating role. We label the moderation pattern the Digital Saturation Trap to distinguish it from the conventional digital-dividend narrative.
Hypothesis H3 (Digital Saturation Trap).
The marginal impact of Taobao village density on rural welfare consistently decreases with the advancement of digital development at the county level. At low digitization, the marginal effect is positive, and at high digitization, the marginal effect turns negative. The reversal is identified through both continuous interaction and panel threshold specifications.
Hypotheses H1a–H3 are jointly tested in the empirical analysis that follows. The naming convention departs from the earlier draft that posited an inverted-U in the common prosperity outcome because the baseline analysis decisively rejected that shape. The direction of H3 is opposite to that of conventional digital-dividend reasoning. Consistency across the four hypotheses is required for the Digital Saturation Trap interpretation to stand as a coherent account of the rural e-commerce and common prosperity nexus. Figure 1 visualizes the four hypotheses as a single causal architecture, with Taobao village density as the treatment, land-based ecological value conversion as the mediator, the PKU digitization sub-index as the moderator, and three common prosperity outcomes on the receiving side.
Figure 1.
Conceptual framework. Treatment X is Taobao village density, mediator M is land-based ecological value conversion efficiency, moderator Q is the PKU DFIIC digitization sub-index, and outcome set Y comprises rural per-capita income, the nightlight Gini, and Sen welfare. Arrows label the four tested hypotheses H1a, H1b, H2, and H3.
3. Data and Empirical Strategy
3.1. Sample and Data Sources
The empirical base is a county-year panel covering 2725 counties across 30 provincial units in China from 2014 to 2022. County-level indicators come from the consolidated China County Statistical Yearbook compiled through 2022, which provides harmonized measures of agricultural output, population, gross regional product, fixed investment, fiscal revenue, retail sales, and financial depth. The number of Taobao villages was derived from the annual rosters published by the AliResearch Institute from 2014 to 2022. The definition of a Taobao village follows the AliResearch criterion of at least 100 online stores in a village registered on the platform, which has been widely adopted in the literature [3,4]. Each village listing documents the host county and, for 2022, includes a twelve-digit village code, the first six digits of which correspond directly to the national administrative code. We use the 2022 roster as the authoritative dictionary for county identification and fall back on a harmonized super-dictionary built from the PKU Digital Financial Inclusion Index [12], the nightlight-based Gini panel [36], and the digital-village pilot roster for villages from previous years. The cascaded matching procedure recovered county codes for 96.9% of the raw village-year rows.
Inequality measurement uses the nightlight-based county Gini coefficient [36], which is available for essentially every county-year in the sample and avoids the coverage gaps of household survey measures at the county level. The nightlight Gini measures spatial inequality in luminance density at the sub-county pixel level rather than household-level income inequality and tends to be elevated in absolute level (medians around 0.7–0.8 in our sample) compared with household-survey Ginis in the 0.3–0.5 range; we adopt it because no household-survey Gini is available at county-year resolution for the full 2014–2022 window, and because within-county fixed-effect identification absorbs the level shift. Two nightlight-specific concerns are acknowledged: urban-fringe re-classifications and lighting-infrastructure upgrades can move the index without a corresponding income shift (partly addressed through county fixed effects and prefecture-level clustering), and low-light counties with sparse rural populations exhibit elevated measurement noise (addressed through the imputation-sensitivity exercises in Section 4.7). The digital financial inclusion index follows the Peking University compilation from 2014 to 2022 [12]. We focus on the digitization sub-index as the moderator because it captures mobile-payment penetration, e-credit usage, and digital investment services rather than the aggregate index, which reflects a broader set of financial functions. We treat the sub-index as a digital-capacity proxy rather than a direct platform-usage measure: it captures the financial-infrastructure substrate on which platform commerce operates rather than transaction counts, livestream sessions, or short-video penetration, none of which are publicly available at county-year resolution; we return to this construct gap in Section 5.4. The digital village pilot variable was obtained from the Ministry of Agriculture and Rural Affairs roster, which lists the 119 first-batch pilot counties designated in 2020.
Three nested analysis samples serve different identification objectives. The baseline sample retains 9247 county-year observations across 1600 counties after listwise deletion of all primary outcomes, the treatment variable, the moderator, and the control set. The DID sample relaxes the control variable requirement and covers 12,498 observations across 1929 counties, preserving the post-treatment years that would otherwise be lost. The master panel of 24,525 observations was reserved for descriptive statistics and multiple imputations.
3.2. Variable Construction
Four variable blocks anchor the empirical design: outcomes that capture the scale and distribution dimensions of common prosperity; a treatment variable that quantifies e-commerce intensity at the intensive margin; a mediator that traces the land-based ecological value conversion channel and a moderator that indexes county digital capacity.
Common prosperity has a scale and distribution component, and a single indicator rarely captures both. Therefore, we examined three outcome variables that collectively encompass the two dimensions. The first is the natural logarithm of rural per-capita disposable income, denoted , which measures the size of the rural income. The second is the county Gini coefficient from nightlight data, denoted , which measures the degree of within-county inequality. The third combines both through the Sen social welfare function [11], written as
With clipped to the open interval before transformation. Equation (1) places a positive weight on income levels and a negative weight on inequality in a theoretically grounded way, whereas additive composites such as lack a clear welfare-economic interpretation.
The treatment variable is Taobao village density, defined as the number of recognized Taobao villages per ten thousand resident population, written . Density, rather than raw count, is the relevant intensive margin because it absorbs the mechanical correlation between county size and village count. A quadratic term, is constructed to detect non-linearity. Robustness specifications replace the density measure with two alternative intensive-margin measures: the log-count and a within-year decile rank of , which is invariant to the level distribution. The moderation interaction reproduces under all three definitions (Section 4.7). A revenue-weighted definition and a livestream-session intensity proxy would be informative complements but are not available at county-year resolution; we return to this measurement gap in Section 5.4. All regression variables are Winsorized at the one percent level to reduce the influence of extreme values.
Turning from treatment to mechanism, the mediator captures the economic return per unit of ecological input. At the county level, we construct the primary mediator as
where is the gross output value of farming, forestry, animal husbandry, and fishery in ten thousand yuan, and is the administrative land area in square kilometers. This specification produces a stable county-by-year measure with genuine within-county variation and is, therefore, identifiable under county fixed effects. Previous iterations employed the city-level rural revitalization composite index as a mediating variable. However, this approach assigns uniform values to all counties within a prefecture, which are subsequently absorbed by fixed county effects. Three alternative mediators were used for triangulation. Grain productivity per unit land is . Agricultural labor productivity is . Fertilizer-based efficiency, available only through 2019 because of the coverage window of the relevant subject file, is .
Finally, the moderator is the county-level digitization sub-index of the Peking University Digital Financial Inclusion Index [12], denoted . The sub-index aggregates mobile-payment intensity, usage of Internet investment and credit services, and the depth of digital financial infrastructure; therefore, it provides a more precise measure of on-the-ground digital capacity than the aggregate index. The sample distribution of is left-skewed, with a median of 96 and an interquartile range spanning 60 to 112 on the original scale. For threshold estimation, we searched within the 15th to 85th percentile window, where the density exceeds 150 observations per bin and the Hansen regression is well identified.
3.3. Specification and Inference
The control set comprises the share of primary industry in the gross regional product, the natural logarithm of per-capita GDP, the natural logarithm of total retail sales, the natural logarithm of bank loan balances, and the prefecture-level Internet penetration rate. Per-capita GDP is constructed internally as rather than taken from the reported field, because the reported field has much higher missing rates than the other fields. This adjustment extended the baseline sample from 969 to 1600 counties.
All specifications include county and year fixed effects. A stricter variant adds province-by-year fixed effects to the model. Standard errors are clustered at the prefecture (city) level throughout, which is the relevant cluster for e-commerce spillovers, given that Taobao village networks typically extend across county boundaries but are contained within prefectures [3]. We also used prefectures as resampling units in the cluster bootstrap procedures described below. All estimations were implemented in Python 3.11 using the pyfixest 0.18 package, which provides high-dimensional fixed-effect absorption equivalent to the reghdfe routine in Stata 17 [37].
3.4. Baseline Specification and Shape Tests
The baseline specification regresses each outcome on Taobao village density, its quadratic, and the control vector, with county and year fixed effects absorbed two-way; the formal equation is given in Appendix A as Equation (A1). An inverted-U relationship requires the linear coefficient to be positive and the quadratic coefficient to be negative, together with a sample-internal turning point . The inverse indicators illustrated a U-shaped pattern, wherein e-commerce initially declined before subsequently improving the outcome. We follow Lind and Mehlum [38] to test both shapes formally through their joint-sign statistic, which rejects the null of monotonicity only when the slopes at the minimum and maximum of the empirical support of X have the required opposite signs. Because the Lind–Mehlum test is directional, we report the inverted-U p-value and the U-shape p-value separately.
3.5. Mediation Analysis
The mediation analysis decomposed the effect of Taobao village density on county welfare into direct and indirect components that operate through land-based ecological efficiency. Stage 1 regresses the mediator on the treatment and quadratic terms, and Stage 2 regresses the outcome on the treatment, mediator, and quadratic terms. The indirect effect is the product of the Stage 1 slope on the linear treatment and the Stage 2 slope of the mediator. Significance is first assessed through the Sobel first-order approximation, which is robust to model misspecification in the second-stage error term but assumes the normality of the coefficient ratio. We complement the analytical test with a prefecture-level cluster bootstrap over 500 replications, following MacKinnon et al. [14]. In each replication, we resampled prefectures with replacement, refit both stages, and stored the product . The percentile confidence interval from the bootstrap distribution provides asymptotic refinement over the Sobel approximation when the finite sample coefficient distribution is skewed.
3.6. Continuous Moderation and Formal Threshold Test
The moderation hypothesis is tested through a continuous interaction between Taobao density and the digitization moderator, with conditional marginal effects evaluated at the 10th, 25th, 50th, 75th, and 90th percentiles of the moderator and delta-method standard errors constructed from the coefficient covariance matrix. The full specification is given in Appendix A as Equation (A2). To test whether the moderation is better characterized as a discrete regime switch, we perform a panel-threshold regression [13] with a fixed-effect specification. We search over the 15th to 85th percentile grid of Q in one-percent increments and select the threshold that minimizes the sum of squared residuals. The formal likelihood ratio test for the existence of a threshold uses a wild residual bootstrap over 300 replications, with cluster-level Rademacher weights applied to the residuals from the no-threshold null model; the bootstrap procedure is detailed in Appendix A.
3.7. Causal Identification Through Staggered DID and Shift-Share IV
Two complementary designs address the residual endogeneity of the contemporaneous e-commerce intensity. The first exploits the 2020 digital-village pilot as a quasi-experimental policy shock, while the second constructs a Bartik-style shift-share instrument from the historical communication infrastructure.
The digital village pilot, launched in 2020, provides a quasi-experimental source of variation in county-level digital infrastructure. Sixty-eight counties received the first-batch designation in 2020, and two additional counties joined in 2021. The 1376 counties that never received the designation during the sample window serve as the comparison group. We estimate the doubly robust Callaway–Sant’Anna group-time average treatment effect [15] separately for each outcome using the basic control set to balance pre-treatment covariates. The CSDID approach avoids the negative weighting pathologies of conventional two-way fixed-effect estimators under staggered adoption [39,40,41]. We report the overall aggregation and an event-study aggregation with relative time running from to . The short post-window reflects data availability and constrains interpretation to short-run shock effects, not long-run dynamics. Parallel trend validity is examined through the pre-period coefficients of the event-study aggregation.
The second design exploits historical variations in communication infrastructure as predictors of later e-commerce penetration. The county-level share is the mean of fixed-phone subscribers from the 2001–2010 window in the China County Statistical Yearbook, log-transformed as . The national-level shift is the ratio of the national Taobao village count to the national resident population in year t. The Bartik instrument is the product [16]. To address the concern that historical endowments may exhibit heterogeneous long-run trajectories unrelated to the e-commerce channel, we include a pre-trend control constructed as . The two-stage least squares is estimated by the internal fitting of pyfixest, which restricts the specifications with a single endogenous variable. In this analysis, we instrument only and consider the interaction term to be a linear combination of exogenous components. The OLS interaction specification maintains a complete moderation structure.
3.8. Robustness Battery
Five robustness checks reinforce our main estimates. The sub-sample battery excludes the 2020 pandemic year, counties with zero Taobao villages throughout the sample, Tibet and Qinghai provinces, and counties with fewer than five observation years. Multiple imputation with chained equations fills the missing mediator and covariate values through five iterations of a Bayesian ridge learner with posterior sampling [17]. We imputed only covariates and kept the outcome vector unaltered to avoid outcome-dependent bias. Estimates across the five imputations were combined using Rubin’s rule, with the fraction of missing information as a diagnostic for imputation uncertainty. Because the land-based mediator carries a 58% missing rate, we add three diagnostic exercises that go beyond the Rubin-pooled point estimate. Initially, a logistic regression analysis of the missingness indicator was conducted using observable county-year covariates to determine whether the pattern of missingness was systematic in dimensions that may be of concern to the reader. Second, the empirical distribution of the imputed mediator is compared with the raw observed distribution using the Kolmogorov–Smirnov statistic and the first four moments. Third, a propensity-score nearest-neighbor imputation that injects donor noise rather than smooth Bayesian ridge predictions is run as a sensitivity benchmark, and the Sen-welfare mediation is re-estimated under the donor-imputed mediator. The three diagnostics together test whether the 28% indirect-effect share is sensitive to the choice of imputation engine and to the assumed selection mechanism. The remaining checks substitute the robust mediators, replace the treatment variable with its log-count variant and within-year decile rank, and tighten the clustering layer from prefecture to province.
The Bartik shift-share instrument introduced in Section 3.7 is supplemented with two diagnostics that follow the recent recommendations of Goldsmith-Pinkham et al. [16]. The first is the Rotemberg weight decomposition, which expresses the Bartik estimator as a weighted sum of just-identified IV estimates indexed by year and reports the Herfindahl–Hirschman index of the absolute weights. A high HHI signals that one or two years dominate the identification, in which case the validity of the Bartik design hinges on the exclusion restriction holding for those particular shifts. The second is the first-stage robust F statistic with and without the pre-trend control, with as the conventional Stock–Yogo rule-of-thumb for a ten percent maximal bias. We also test whether the historical communication-infrastructure share predicts pre-treatment cross-sectional levels of rural income, the nightlight Gini, log per-capita GDP, and the primary-industry share in 2014, which is the share-validity check that the Bartik framework relies on for identification.
4. Results
4.1. Descriptive Statistics
Table 1 reports the summary statistics for the core regression variables in the baseline sample. The median county hosts zero Taobao villages in a given year, but the upper tail is substantial, with the 99th percentile reaching 0.26 villages per ten thousand residents. The natural logarithm of rural per-capita disposable income averages 9.49, which corresponds to approximately 13,200 yuan on the original scale. The nightlight Gini coefficient has a median of 0.81, consistent with the fact that county-level inequality measured from spatial luminosity is typically concentrated in the upper half of the unit interval. The digital financial inclusion digitization sub-index has a mean of 97.7, with a standard deviation of 27.6.
Table 1.
Summary statistics of core variables.
4.2. Baseline Shape with Linear Decline and U-Shaped Inequality
Table 2 presents the baseline results. Three patterns emerge. Rural per-capita disposable income declines linearly with Taobao village density: the linear term is (), and the quadratic term is insignificant. Sen welfare follows a similar linear shape under county and year fixed effects. County inequality measured by the nightlight Gini exhibits a significant U-shape with a linear coefficient () and a quadratic coefficient (). The turning point at lies inside the empirical support; therefore, a full U is traced within the data rather than extrapolated.
Table 2.
Baseline regressions with quadratic Taobao density.
Figure 2 shows the quadratic fit of the Gini coefficient on Taobao density with a 95% confidence band. Approximately 98% of county-year observations lie at or below the turning point, leaving the rising segment to be identified from a tail of the empirical support, a feature we return to in Section 4.4 and in the qualifications of Section 5.1. County inequality decreases as e-commerce first diffuses and increases once density exceeds the turning value. The inverted-U hypothesis commonly invoked for technology diffusion is rejected by the directional Lind–Mehlum test ( for all three outcomes).
Figure 2.
U-shape between Taobao village density and the county Gini. The curve is a quadratic fit with a 95% confidence band; the turning point is marked. Note: county-year observations; quadratic coefficients and ; Lind–Mehlum directional U-shape .
4.3. Mechanism of the Ecological Value Squeeze
Table 3 reports the mediation analysis. The first-stage coefficient of Taobao density on land-based agricultural efficiency is (). Agricultural land delivers less economic value per square kilometer in counties with higher e-commerce penetration, which is the expected direction of an ecological-value squeeze. The second-stage coefficient of the mediator on Sen welfare was (). Multiplying the two stages yields an indirect effect of on Sen welfare (Sobel ). The prefecture-level cluster bootstrap over 500 replications places the percentile confidence interval at (two-sided ). The indirect effect accounted for 28.2% of the total effect of Taobao density on Sen welfare.
Table 3.
Mediation of Taobao density through land-based agricultural efficiency.
Two details reinforce this interpretation. The city-level mediators used in earlier drafts, namely prefecture green total factor productivity and the prefecture rural revitalization composite, produce insignificant stage-one and stage-two coefficients consistent with the ecological fallacy. Mediators defined at a higher administrative level than the outcome are absorbed by the county fixed effect, and only the county-level mediator delivers a statistically significant mechanism. The proportion mediated for the Gini outcome is 3.6% and statistically insignificant, indicating that the U-shape in inequality is driven by channels other than the ecological squeeze. Platform concentration on top sellers, livestream rent extraction, and local agglomeration are the most plausible candidates, but lie outside our measurement sets.
4.4. Digital Saturation Trap
Table 4 reports the results of continuous moderation. The interaction carries a coefficient of () for Sen welfare and () for rural income, respectively. The moderator does not interact significantly with the treatment for Gini, indicating that the digital-development channel operates chiefly through scale and welfare, rather than inequality. The conditional marginal effect on Sen welfare runs monotonically from at the 10th percentile of the moderator to at the 90th percentile, with the sign flipping near the sample median. Figure 3 displays the smooth profile with five quantile markers and their 95% confidence intervals.
Table 4.
Continuous moderation and conditional marginal effects.
Figure 3.
Conditional marginal effects of Taobao village density along the DFIIC digitization sub-index. Solid lines, point estimates; shaded bands, 95% delta-method confidence intervals; circles, quantile points through color-coded by sign of the marginal effect (teal: positive, observed at the low-Q percentiles; orange: negative, observed at the high-Q percentiles). Interaction for Sen welfare and for rural income.
Formal panel threshold regression provides a complementary perspective. The Hansen grid search locates the threshold at for all three outcomes between the 83rd and 85th percentiles of the moderator. Below this threshold, the coefficient on Taobao density is close to zero, and above it, the coefficient is strongly negative for welfare and income. The wild residual bootstrap with 300 replications rejects the no-threshold null at the one-percent level for all three outcomes, with the observed F statistic between 43 and 114 times the bootstrap mean. The grid-search sum-of-squared-residuals profile shows a single sharp minimum at across the three outcomes rather than a flat surface, indicating that the threshold is well identified rather than an artifact of the grid choice. Table 5 summarizes the test.
Table 5.
Hansen panel-threshold test with wild residual bootstrap.
Taken together, these two complementary identifications converge on the same substantive pattern. The e-commerce effect on rural welfare weakens monotonically as digital capacity rises, and the weakening is substantial enough that the effect flips from positive at low digitization levels to strongly negative at high digitization levels. The prevailing narrative that improved digital infrastructure enhances the welfare benefits of rural e-commerce is not supported. Instead, the evidence is consistent with a saturation regime in which additional Taobao villages in already digitized counties exert downward pressure on welfare, presumably through increased platform competition, rent extraction by top live-streamers, and the standardization of product offerings that suppress differentiated ecological premia.
The continuous-moderation profile in Figure 3 reveals an asymmetry that shapes the policy reading. The marginal effect on Sen welfare is positive and significant at the 5th to 15th percentile of the moderator, statistically indistinguishable from zero between the 20th and the 50th percentile, and negative-significant at the 55th percentile and above; the Hansen threshold corresponds to the 85th percentile of Q, so 84.0% of county-year observations sit below the threshold and 16.0% sit above it. In the cross-section, the trap is, therefore, an upper-tail phenomenon rather than a generalized reversal. The U-shape on inequality is also a tail object in cross-section: only 1.84% of county-year observations and 3.69% of unique counties satisfy during the sample window. The cross-sectional tail observation, however, maps to a panel window cohort experience that is not tail at all: when the conditional marginal effect is traced at the county-year level rather than the percentile level, % of unique counties cross into the trap zone for at least one year during 2014–2022, with a median residence of four years among ever-trapped counties. Consequently, the trap represents an outlier observation in any given year and a near-modal occurrence throughout the panel window because of the upward shift in the moderator distribution over time. Figure 4 consolidates these diagnostics into a 2 × 2 panel.
Figure 4.
Tail-regime diagnostics for the Digital Saturation Trap. Panel (a): Empirical distribution of Taobao village density (log scale) with a U-shaped turning point and X’s 99th percentile marked. Panel (b): conditional marginal effect on Sen welfare at every fifth percentile of Q, color-coded by sign and significance (teal: significantly positive; gray: not significant; orange: significantly negative), with the Hansen threshold near . Panel (c): Two-dimensional histogram of locating the trap region , with darker blue shading indicating higher county-year counts. Panel (d): county cohort breakdown showing never trapped (teal), switching (navy), and always trapped (orange).
4.5. Staggered DID Evidence from the Digital-Village Pilot
The digital village pilot offers an exogenous source of variation complementary to the observational identification above. Table 6 reports the doubly robust overall treatment effect for each outcome, and Figure 5 arranges the Callaway–Sant’Anna event-study coefficients in three side-by-side panels so that the parallel-trends diagnostic can be inspected outcome by outcome. None of the three overall effects were statistically significant. The Sen welfare point estimate is with a 95% confidence interval of . The rural income point estimate is with a confidence interval of . The Gini point estimate is with a confidence interval of . Across the three panels of Figure 5, the pre-period coefficients cluster tightly around zero, which supports the parallel-trends assumption for each outcome separately rather than only for the welfare aggregate. The post-period coefficients remain within the pre-period confidence band in all three panels, with the Sen welfare panel showing a mildly positive lift at , the rural-income panel drifting marginally negative, and the Gini panel remaining essentially flat. The mutual offset across these directions is consistent with the non-significant overall ATTs in Table 6 and indicates that the pilot does not move any individual outcome in a statistically detectable direction within the two-year post-window.
Table 6.
Callaway–Sant’Anna overall ATT on the treated.
Figure 5.
Callaway–Sant’Anna event-study aggregation across Sen welfare (left), ln(rural per-capita income) (middle), and the nightlight Gini (right). Circles, pre-period coefficients; squares, post-period coefficients; shaded bands, 95% pointwise confidence intervals; vertical dashed line, the 2020 pilot launch.
The estimates derived from the policy shock do not demonstrate that the pilot program independently influenced rural welfare in the short term. Combined with the observational results above, this pattern is consistent with an interpretation in which the digital saturation effects documented in Section 4.2, Section 4.3 and Section 4.4 are plausible structural features of the underlying market rather than transient responses to a discrete policy intervention. This reading should be taken as conditional rather than conclusive because the post-treatment window spans only two years and cannot rule out a competing hypothesis under which pilot effects materialize with a delay longer than the observable window. A stricter test of the structural interpretation will become feasible once the 2025 and 2026 data releases extend the post-window to at least four years.
4.6. Heterogeneity
Table 7 presents the subsample estimates along three dimensions of heterogeneity. A county is classified as a staple-grain county if the grain-sown area accounts for at least 60% of the total sown area averaged over the 2014–2019 window. A county is classified as ecologically green if its prefecture-level rural green coverage rate is above the sample median. Industrial dependence on primary production is measured by the share of the primary industry in the gross regional product. The geographic classification follows the standard division of Chinese provinces into the eastern, central, and western belts.
Table 7.
Sub-sample heterogeneity of the moderation model for Sen welfare.
The sharpest contrast was observed along the cropping dimension. Cash-crop counties experience the deepest welfare squeeze under high digitization, with a marginal effect of (interaction ). Counties that primarily produce staple grains exhibited a similar negative trend; however, the interaction term associated with these counties was not statistically significant at conventional thresholds. This contrast is counterintuitive in view of the conventional expectation that cash crops, such as fruits, tea, and geographic-indication produce, should benefit most from e-commerce because they command differentiated premia. The observed pattern suggests that once digital saturation sets in, the forces that compress margins apply most forcefully to the product categories that were meant to benefit from the platform in the first place. A broader tertile categorization of the digitization moderator yields consistent results: the coefficient on Taobao density decreases steadily from in the low-digital tertile to in the high-digital tertile for the Sen welfare. This pattern of sign reversal is similarly observed in rural income and Gini outcomes, indicating that the trap identified in the continuous interaction in Section 4.4 is also evident when employing simple tertile divisions.
The three-way interaction estimates in Table 8 provide a formal Chow-style assessment. The eco-green indicator interacts positively with and the primary-industry indicator interacts negatively with , both at the conventional significance level. Cropping type and regional belt do not deliver statistically significant cross-group differences in the three-way interaction, which means that the cash crop result in the sub-sample table is driven primarily by the intensity of the within-group moderation rather than by a systematic difference in the gradient. The cross-group contrast in sub-sample estimates should, therefore, be interpreted with caution, and the substantive reading placed on the direct cash-crop sub-sample coefficient.
Table 8.
Three-way interaction for Sen welfare.
4.7. Robustness
Five robustness checks reinforce these main findings. Table 9 consolidates the key coefficients. The sub-sample battery retains the negative interaction on Sen welfare () after excluding the 2020 pandemic year, counties that never hosted a Taobao village, counties with zero density in a given year, the Tibet and Qinghai provinces, and all counties with fewer than five observation years. The Bartik shift-share instrument tightens the point estimate toward larger negative values and preserves significance at the one-percent level for the linear form, which indicates that ordinary least squares understates rather than overstates the e-commerce coefficient. The incorporation of the pre-trend control diminishes the magnitude of the IV estimate on Sen welfare and reverses its sign. This outcome is anticipated, as it accounts for the historical endowment trend that contributes to Bartik identification [16].
Table 9.
Consolidated robustness battery (coefficient on for Sen welfare unless stated).
Multiple imputation yields a pooled interaction coefficient of on Sen welfare () after Rubin-rule aggregation across five imputations. The fraction of missing information is approximately four percent for the interaction term and approximately seven percent for the linear term, which indicates that imputation uncertainty makes a modest contribution to the total variance and leaves the sign-flip conclusion intact. The rural income outcome also retains a significant negative interaction at the five-percent level. The Gini outcome loses significance after imputation, which reflects the fact that the U-shaped signal is sensitive to noise introduced through the moderator and mediator, whereas the welfare and scale channels are more robust.
Two diagnostic exercises address the missingness mechanism for the land-based mediator. A logistic regression of the missingness indicator on observable covariates rejects the missing-completely-at-random null (joint , ) but partly redirects rather than confirms the natural worry that missingness concentrates in poorer or less digitized counties: log per-capita GDP enters with a positive coefficient () so missingness is concentrated in wealthier counties, Taobao density enters with a negative coefficient () so high-density counties are better covered, and the digitization moderator Q is not a statistically significant driver of missingness (), which protects the moderation results from selection on the saturation-regime dimension. The observed pattern corresponds to a structural interpretation rather than a random loss: counties with economies primarily driven by services or manufacturing exhibit reduced land-based agricultural data owing to the diminished activity of the underlying ecological value channel in these regions. Figure A1 in Appendix A visualizes the per-covariate logistic coefficients and the raw-versus-imputed distributional overlap.
The Bartik first-stage and Rotemberg-decomposition diagnostics (Table 9 and Figure A2 in Appendix A) allow a direct judgment on whether the shift-share strategy can carry the level-effect inference. The first-stage F on the historical-phone-density share is without the pre-trend control (above the Stock–Yogo rule-of-thumb) and falls to once is included (just below the rule-of-thumb), so the pre-trend-conditioned identification is borderline weak. The Rotemberg HHI of is (well below the single-year-domination benchmark), with the top three years (2018–2020) carrying % of the absolute identification and the four pre-2018 years carrying small negative weights summing to 8%. The share validity check is mixed: the historical phone-density share is uncorrelated with 2014 rural disposable income () and the 2014 primary-industry share (), but correlated with the 2014 nightlight Gini () and 2014 log per-capita GDP (). The Bartik design, therefore, supports the moderation finding more strongly than the level-effect magnitude, which is consistent with the sign reversal observed once the pre-trend control is added in Table 9.
The consolidated evidence supports three points. First, the linear OLS estimate of the e-commerce effect is a lower bound in magnitude because the instrumented version produces larger negative coefficients. Second, the pre-trend control uncovers a meaningful share of the Sen welfare variance attributable to historical communication endowments rather than the contemporaneous e-commerce channels. The reversal of the sign upon incorporating aligns with the Bartik framework, as described by Goldsmith-Pinkham et al. [16]. In this framework, share-induced pre-trends may overshadow the level effect coefficient, particularly when historical endowments influence long-term county trajectories through mechanisms other than the immediate treatment. The moderation finding is not affected by this level-effect sensitivity because the interaction coefficient is identified from within-county, within-year variation that the pre-trend control does not absorb. Therefore, we frame the welfare-squeeze magnitude cautiously on the level side and confidently on the interaction side. Third, threshold evidence is no longer a weak descriptive statement. The wild residual bootstrap rejects the null hypothesis of no threshold at the one-percent significance level for all three outcomes. Consequently, the Digital Saturation Trap is corroborated by both a smooth moderation test and a formal regime-switch test.
5. Discussion
5.1. Hypotheses Revisited
The evidence rejects the inverted-U reading that earlier drafts entertained and confirms a different nonlinear structure. H1a holds clearly. Taobao village density exerts a significant linear decline on rural per-capita disposable income, with the coefficient around across specifications and robust to six subsample restrictions. H1b also holds. The county Gini traces a U-shape in Taobao village density with a turning point of , which falls within the empirical support. The Lind–Mehlum directional test rejects the inverted-U null hypothesis at any conventional significance level, thereby supporting the U-shaped relationship (). The ascending segment is discerned from a minor portion of the empirical evidence, a distinction that we elaborate on in the H1b paragraph below.
H2 is partially supported. Mediation through land-based agricultural value conversion efficiency accounts for approximately 28% of the Sen welfare effect (Sobel ), with the prefecture-level cluster bootstrap percentile interval sitting almost entirely below zero. Mediation is more muted for rural income and undetectable for the Gini index. The two readings were consistent. First, the ecological squeeze operates chiefly on the welfare aggregate by combining scale and distribution because both inputs move in the same direction under an efficiency shock. Second, the distributional U-shape is not driven by the ecological channel but reflects platform-level concentration effects, the measurement of which would require microdata on seller market shares.
The 28% point estimate based on land-based efficiency is conservative rather than upper-bound. When the mediator is substituted with grain output per unit of land area, the mediated proportion decreases to 19.1%, and the indirect effect loses statistical significance. This outcome aligns with the notion that grain serves as a less precise proxy, as non-grain crops are excluded from the numerator. When the mediator is replaced with agricultural output per worker, the proportion mediated rises sharply to 90.5% at the one-percent significance level, with both the first-stage and the second-stage individually significant. We do not interpret the labor productivity result as a structural decomposition because the per-worker mediator is correlated with land-based efficiency at the county level, conflating a labor-shedding interpretation with an output-falling interpretation. However, this suggests that the welfare squeeze traverses multiple agricultural productivity dimensions rather than being confined to a single channel exclusive to land. Therefore, the land-based estimate should be read as the lowest defensible bound on the size of the agricultural productivity channel rather than the channel’s full size. A second sensitivity exercise, in which the missing M values are replaced by propensity-score nearest-neighbor donor draws rather than Bayesian-ridge smoothed predictions, retains the significant negative first stage (, ) but attenuates the second stage to a level at which the indirect effect is no longer statistically distinguishable from zero. The most cautious reading consistent with both sensitivity results is, therefore, that the indirect effect is negative across engines, with its magnitude ranging from near zero under the donor-noise PSM benchmark to about under the labor-productivity mediator, and the primary land-based specification reporting magnitude (Table 3) within this range.
A natural follow-up question is whether the remaining 72% of the welfare squeeze can be attributed to channels identified beyond land-based efficiency. The robust-mediator row in Table 3 tests this bound using the grain output per unit of land. The proportion mediated converges to 19%, close to the primary 28%, supporting the claim that ecological efficiency is a robust channel rather than an artifact of one mediator definition. Consequently, the 72% residual represents an upper limit on unobserved mechanisms, with the most plausible candidates being platform rent extraction by top sellers, livestream-driven winner-take-all dynamics, and local agglomeration effects that concentrate gains within a small fraction of the households. Quantifying their relative weights requires seller-level microdata outside our public data infrastructure, which we mark as future work.
H3 differs from the initial framing of the paper. The original design anticipated a digital-dividend pattern in which higher digitization would amplify welfare returns from e-commerce. The data reject this interpretation. The conditional marginal effect of Taobao village density on Sen welfare exhibited a monotonic transition, ranging from approximately at the tenth percentile of the moderator to approximately at the ninetieth percentile, with a change in sign occurring near the sample median. The interaction coefficient is highly significant (). The formal panel threshold test with wild residual bootstrap over 300 replications rejects the no-threshold null at the one-percent level for all three outcomes and locates the threshold near the eighty-fifth percentile of the moderator. Therefore, the two complementary designs converge on a reversal rather than an amplification. We label this pattern the Digital Saturation Trap to distinguish it from the conventional dividend narrative. The label refers to the empirical observation that additional Taobao-village expansion in already highly digitized counties reduces rather than increases welfare, consistent with platform-concentration and standardization-pressure mechanisms theorized in the two-sided market literature [26].
The reading we put on H3 needs three qualifications that the tail-regime diagnostics in Section 4.4 make explicit. Initially, the sign reversal becomes statistically distinguishable from zero only when the moderator exceeds approximately the 55th percentile in its continuous form and only above the 85th percentile according to the Hansen threshold. Consequently, for approximately 84% of county-year observations, the marginal effect is either positive or statistically insignificant, indicating that the trap is a tail observation in the cross-section rather than a generalized reversal at the median. Second, the U-shape of inequality has its turning point at , and only 1.84% of county-year observations and 3.69% of unique counties satisfy during 2014–2022, so the rising segment is identified from a small empirical mass. Third, the cross-sectional tail maps to a panel-window cohort experience that is not tail at all: 80.5% of unique counties cross into the trap zone for at least one year, with a median residence of four years among ever-trapped counties, because Q is rising over time across the panel. The most accurate description is, therefore, that the trap is a conditional, upper-tail regime in cross-section that becomes the dominant regime over the panel window because digital capacity is not stationary.
5.2. Theoretical Contribution
The results contribute to three areas of literature. In the rural e-commerce literature, the linear-plus-quadratic specification is rarely formally tested, and the U-shape in county inequality has not been documented with Chinese county-level data at this temporal depth. Earlier work hinting at non-linearities [5,6] did not identify a turning point inside the sample or place the pattern within a directional-shape test. In the ecological value conversion literature, our county-level land-based conversion efficiency provides a traceable mediator linkable to market structure shocks without the ecological fallacy that afflicts prefecture-level composites. The 28% mediation share gives a concrete magnitude for how much of the welfare squeeze operates through the two-mountains channel. In the digital moderation literature, the Digital Saturation Trap reorganizes existing observations on platform concentration, livestream rent extraction, and participation inequality into a single testable moderating mechanism. This concept does not replace the digital-dividend framing but delineates the regime in which it fails.
The evidence also speaks to the county-level measurement of common prosperity. Most studies use household survey variables with severe county-level coverage gaps or provincial aggregates that absorb the within-province dispersion central to the common prosperity question. The Sen social welfare function combines rural income and distribution in a form grounded in welfare economics [11] and complements, rather than substitutes, the two underlying outcomes. Reporting the aggregate alongside its components reduces the risk that aggregate patterns are driven by movements in only one underlying dimension.
5.3. Policy Implications
These findings do not imply that rural e-commerce should be discouraged. The evidence supports a more qualified position than the previous studies. In counties at the lower end of the digital development distribution, Taobao village expansion still generates welfare gains. The conditional marginal effect at the tenth percentile of the moderator is around log-units and remains positive at the twenty-fifth percentile. Policy support for additional e-commerce capacity in these counties retains its traditional justification. The analytical point is that the same policy does not deliver the same welfare return in counties that have already crossed the thresholds. Policy templates that uniformly regard rural e-commerce as a beneficial mechanism tend to overlook the variability in outcomes and misallocate resources to counties where further platform expansion may have adverse welfare effects.
Two corollaries follow. The first concerns the protection of differentiated product premiums. The diversity of cash crops indicates that the counties most susceptible to the saturation trap are those with seemingly diverse agricultural production. A plausible mechanism is perishability combined with inventory pressure. Cash crops such as fresh fruit, leafy vegetables, and short-shelf-life tea generate narrow selling windows and leave farmers with limited bargaining room when a platform-wide volume push is set in. Staple-grain producers can store and delay sales when prices weaken, whereas cash-crop producers face spoilage risk if they decline the prevailing platform price. Perishability combined with concentrated platform demand, therefore, transmits margin compression into cash-crop welfare more severely than into staple-grain welfare, consistent with our observed asymmetry. Three descriptive moments support this perishability reading without claiming to test it structurally: cash-crop counties exhibit a lower mean grain-output mediator ( vs. for staple-grain counties), a steeper first-stage slope from Taobao density onto the land-based mediator (, vs. , insignificant), and a -times-deeper conditional marginal effect on Sen welfare at the 90th percentile of the moderator ( vs. ). A structural test of perishability would require crop-specific storage costs, time-to-spoilage data, and platform negotiation records that are not publicly available, so we treat the moments as descriptive consistency and mark the structural test as a future-research priority in Section 5.4. Protecting the price premium of Geographic Indication products, organic certification schemes, and region-branded tea or fruit requires policy instruments operating on platform governance rather than platform access. The current policy mix emphasizes access, consistent with the ecological endowment rationale of the two-mountains doctrine, but does not address the standardization pressure once platforms reach saturation scale. The evidence indicates the presence of a complementary platform-level governance mechanism; however, the specific design of this mechanism is beyond the scope of this study.
The second corollary pertains to the order of implementation of digital infrastructure enhancements and the advancement of e-commerce. Large expansions of either dimension without careful coordination risk pushing additional counties into the high-density, high-digitization region in which the trap may operate. The short-run null results from the digital-village pilot are tentatively consistent with this reading, but the short post-window leaves open the possibility that pilot effects may materialize with a delay. Consequently, the sequencing argument should be interpreted as a hypothesis for future research, rather than as a definitive policy recommendation.
The findings also pertain to sustainable urban, rural, and regional development. The widening economic gaps between the eastern coastal prefectures and inland counties over the past decade coincide with many coastal counties entering the high-digitization saturation regime documented here. Policies transplanting the coastal digitization template to inland counties without attention to platform governance risk, exporting the welfare-squeeze channel along with the digital dividend. A territorial strategy that recognizes the non-monotone welfare returns from e-commerce can help limit rural depopulation and economic migration pressures that follow stalled welfare gains in the digitized tail of the county distribution. Deindustrialization in smaller county economies and the demographic shrinkage of traditional staple-grain belts are partly downstream of the platform-saturation channel, and any policy response aiming to preserve the viability of county-level rural communities will need to treat platform governance as an integral element of regional sustainability rather than a separate domain.
5.4. Limitations
Several limitations should be considered when interpreting the results. The post-treatment window for the Callaway–Sant’Anna design spans at most two years, which limits the inference to short-run shock effects and leaves the long-run dynamic of the digital village pilot open for future work with longer panels. A conclusion that the pilot has no causal effect would require a post-window of at least four years and, therefore, cannot be drawn from the current data. The appropriate interpretation in the short run is that the two-year shock is statistically indistinguishable from zero. However, this does not imply that the long-run effect is null. The Bartik instrument that we constructed from 2001 to 2010 fixed-telephone density loses its significance for Sen welfare once a pre-trend control is included, and this erosion indicates that historical communication endowments contribute a non-trivial share of the level-effect variance through channels other than contemporaneous e-commerce. The shift-share identification, therefore, supports the moderation finding more strongly than it supports the level-effect magnitude. The Rotemberg weight decomposition (HHI of , top-three years 2018–2020 carrying %) and the first-stage robust F (which falls from without the pre-trend control to with it) jointly indicate that the level-effect interpretation should reflect borderline IV strength under the Stock–Yogo rule of thumb, while the moderation finding does not depend on the IV strength because the interaction coefficient is identified from within-county within-year variation that the pre-trend control does not absorb.
The county-level mediator has a 58% missing-value rate, and although multiple imputation with chained equations preserves the interaction signal for Sen welfare and rural income, the U-shaped signal on the Gini outcome becomes insignificant after imputation. A propensity-score nearest-neighbor donor imputation, used as a stress test, retains the significant negative first-stage slope from Taobao density onto the mediator but attenuates the second-stage product to a level at which the indirect effect is no longer statistically distinguishable from zero, so the negative direction of the squeeze is robust under both engines, but the magnitude of the share carried by M is identification-dependent.
The moderator is assessed through a financial inclusion sub-index rather than a direct measure of platform usage. Additionally, a limitation exists in the definition of a Taobao village, which is based on the AliResearch criterion of at least 100 online stores, a threshold determined by count rather than revenue. Three measurement extensions could directly address these construct gaps: livestream session counts at the county level (the rent-extraction channel attributed to top-tier livestream personalities by the saturation account), short-video penetration (the recommendation-system concentration channel that reduces small-seller traffic), and a revenue-weighted definition of a Taobao village (a magnitude-aware measure that better aligns with welfare outcomes, particularly in the upper tail, where standardization pressure is most intense). None of the three is publicly available at the county-year resolution for the 2014–2022 window, and we mark them as the highest-priority data extensions for the follow-up agenda. The perishability mechanism that we offered to interpret the cash-crop result rests on three descriptive moments rather than a structural test, and crop-specific storage costs, time-to-spoilage proxies, and platform-side negotiation records remain the empirical inputs that a future structural test of the perishability channel would require.
6. Conclusions
This study examined rural e-commerce and common prosperity across 2725 Chinese counties from 2014 to 2022, with land-based ecological value conversion efficiency as the mediator and county digital development as the moderator. Three findings are presented in this study. The density of Taobao villages exhibits a linear negative impact on rural per-capita disposable income, with a coefficient of approximately , a finding that remains consistent across the six subsample restrictions. The county Gini traces a U-shape in Taobao village density with an in-sample turning point near . The marginal effect on Sen welfare moves from positive at low digital development to negative at high, with continuous interaction and panel threshold designs agreeing on the sign reversal.
The central contribution is the Digital Saturation Trap, a moderating pattern in which additional e-commerce expansion in already highly digitized counties reduces rather than increases welfare. The pattern inverts the dominant digital-dividend narrative and organizes previously scattered observations on platform concentration and standardization pressure into a single testable mechanism. In the primary specification, land-based ecological value conversion efficiency accounts for approximately 28% of the welfare reduction, thereby supporting the two-mountains conversion channel as a potential mediator that can be estimated using administrative data rather than custom surveys. The deepest welfare squeeze appears in cash-crop counties, which conventional theory predicts will benefit the most from platform differentiation. This heterogeneity serves as a compelling reminder that a policy framework predicated on uniform returns to rural e-commerce is likely to misdirect efforts, particularly in counties that would benefit from differentiated platform governance.
The evidence indicates that policy should prioritize the provision of conditional support for rural e-commerce rather than advocating its indiscriminate promotion. In counties situated at the lower end of the digital development spectrum, Taobao village expansion continues to enhance welfare. In counties that have crossed the saturation threshold, the welfare return is negative, and the appropriate instruments shift from platform access to platform governance. Three governance levers follow from the evidence, ordered by priority: The most pressing is antitrust oversight of top-tier livestream personalities whose traffic concentration pushes smaller rural sellers into a price-taker position, because concentration is the shortest path from saturation to rural welfare losses. An operational form of this lever is a regulator-administered traffic-share ceiling, set so that no individual livestream personality or multi-channel network captures more than a fixed percentage (illustratively, ten percent) of platform-attributed transactions in any one rural-product category over a rolling thirty-day window, with deviations triggering algorithm-level traffic redistribution rather than monetary fines, because traffic redistribution is the instrument that the underlying mechanism most directly responds to. Building on this, platform-side protection for geographic indication products through algorithmic weight that prioritizes verified origin over pure price-volume signals would prevent regional specialty tea, fruit, and grain products from being buried by commodity listings, and would address the differential disadvantage that the cash-crop heterogeneity result documents. The operational version is a minimum recommendation-weight floor for products carrying registered Geographic Indication or organic-certification credentials, set ex ante through a cooperative agreement between platform operators and the agriculture and market-supervision authorities, with a transparent appeals process for sellers whose certification was revoked or withheld. Finally, rural cooperative aggregation rules that allow small producers to negotiate with platforms as a bloc would address the individual bargaining-power asymmetry that underpins the perishability mechanism and would complement the first two levers by shifting the distribution of gains within the high-saturation regime. The operational form is a county-level platform negotiation framework that recognizes village cooperatives as the contracting party with the platform for category-level pricing terms, with the cooperative authorized to set a perishability-weighted minimum price floor below which transactions are blocked at the matching layer rather than litigated after the fact. Protection of differentiated ecological premia is particularly important for cash-crop counties, whose exposure to standardization pressure is most intense precisely where their comparative advantage should be strongest.
The short-run null results from the Callaway and Sant’Anna staggered difference-in-differences design indicate that the digital village pilot on its own does not reverse the pattern within its first two years, and are, therefore, consistent with (though not conclusive proof of) a reading in which the Digital Saturation Trap is a structural feature of the platform economy rather than a transient policy artifact. Within the wider agenda of sustainable urban, rural, and regional development, the findings argue against a one-size template for county-level digitization and advocate for a territorial policy design that differentiates by saturation stage. The contribution to sustainability theory is twofold. The Digital Saturation Trap framework supplies a regime-conditional refinement to the digital-dividend reading of strong-form sustainability, in which economic, ecological, and social pillars must remain jointly viable: a rural digitization strategy that lifts the economic pillar in the diffusion regime can compress the ecological pillar (through standardization pressure on differentiated premia) and tilt the social pillar (through livestream-driven seller concentration) in the saturation regime, and a sustainability-coherent policy design must, therefore, index its instruments to the regime rather than apply uniform promotion across the regime boundary. The county-level evidence also extends the empirical base of territorial sustainability research by showing that the joint-viability requirement can be tested at the sub-prefecture unit at which Chinese rural-revitalization policy actually operates, which is the unit at which the trade-off between scale gains and pillar erosion is decided in practice. This approach connects to the European tradition of territorial cohesion research on uneven regional development and social marginalization, where disparate economic trajectories between peripheral and core areas have long been recognized as a core challenge for sustainable development policy.
Several extensions are available. A longer post-treatment window for the digital village pilot will eventually permit a long-run treatment-effect analysis that separates transitional adjustment from steady-state saturation. A county-level platform usage measure beyond the digital financial inclusion sub-index sharpens the moderating concept and allows tests of whether specific platform designs accelerate or delay the saturation point. A mediator with broader coverage than the land-based efficiency measure will permit a closer examination of the pathways through which the welfare squeeze travels, including livestream concentration and algorithmic recommendation dynamics outside the current measurement set. Comparative work across economies with different platform governance regimes will also test whether the trap is specific to the Chinese institutional configuration or generalizes to other settings in which rural e-commerce has entered a high-density phase.
Author Contributions
Conceptualization, Z.X. and Z.Z.; methodology, Z.X.; software, Z.X.; validation, Z.X. and Z.Z.; formal analysis, Z.X.; investigation, Z.X.; data curation, Z.X.; writing—original draft preparation, Z.X.; writing—review and editing, Z.Z.; visualization, Z.X.; supervision, Z.Z.; funding acquisition, Z.Z. All authors have read and agreed to the published version of the manuscript.
Funding
This research was supported by the 2024 Zhejiang Provincial Philosophy and Social Sciences Planning Project (grant number 24SSHZ182YB).
Institutional Review Board Statement
Not applicable.
Informed Consent Statement
Not applicable.
Data Availability Statement
The cleaned county-year panel, the three nested analytic samples (baseline, DID, master), and all component sub-tables used in this study are openly deposited at Zenodo under the DOI https://doi.org/10.5281/zenodo.19692397 (accessed on 10 April 2026). The deposit includes the quality-control report, the classification labels used in the heterogeneity analysis, and a README documenting variable naming conventions and raw data provenance. Additional materials such as the cleaning pipeline and regression scripts are available from the corresponding author upon reasonable request.
Conflicts of Interest
The authors declare no conflicts of interest.
Appendix A. Estimation Specifications and Diagnostic Figures
The baseline shape test (Section 3.4) estimates
With and the county and year fixed effects and the control vector; an inverted-U requires and with a sample-internal turning point . The continuous moderation specification (Section 3.6) adds the interaction
With conditional marginal effects and delta method standard errors. The Hansen threshold likelihood ratio test uses a wild residual bootstrap over 300 replications with cluster-level Rademacher weights applied to the no-threshold residuals. The mediation decomposition uses Sobel together with a prefecture-level cluster bootstrap of over 500 replications. The Bartik shift-share instrument is , where is the mean fixed-phone subscribers per county in 2001–2010 and is the national Taobao village count divided by the national population in year t; the pre-trend control is .
Figure A1.
Missingness diagnostics for the land-based mediator M. (a) Forest plot of logistic-regression coefficients on the missingness indicator with SE bars; bullet color encodes the sign of each coefficient (teal: positive; orange: negative), and *** denotes . Positive coefficients indicate covariates whose higher values associate with more missingness. (b) Empirical density of raw observed mediator (navy) vs. MICE-imputed values (salmon); Kolmogorov–Smirnov ().
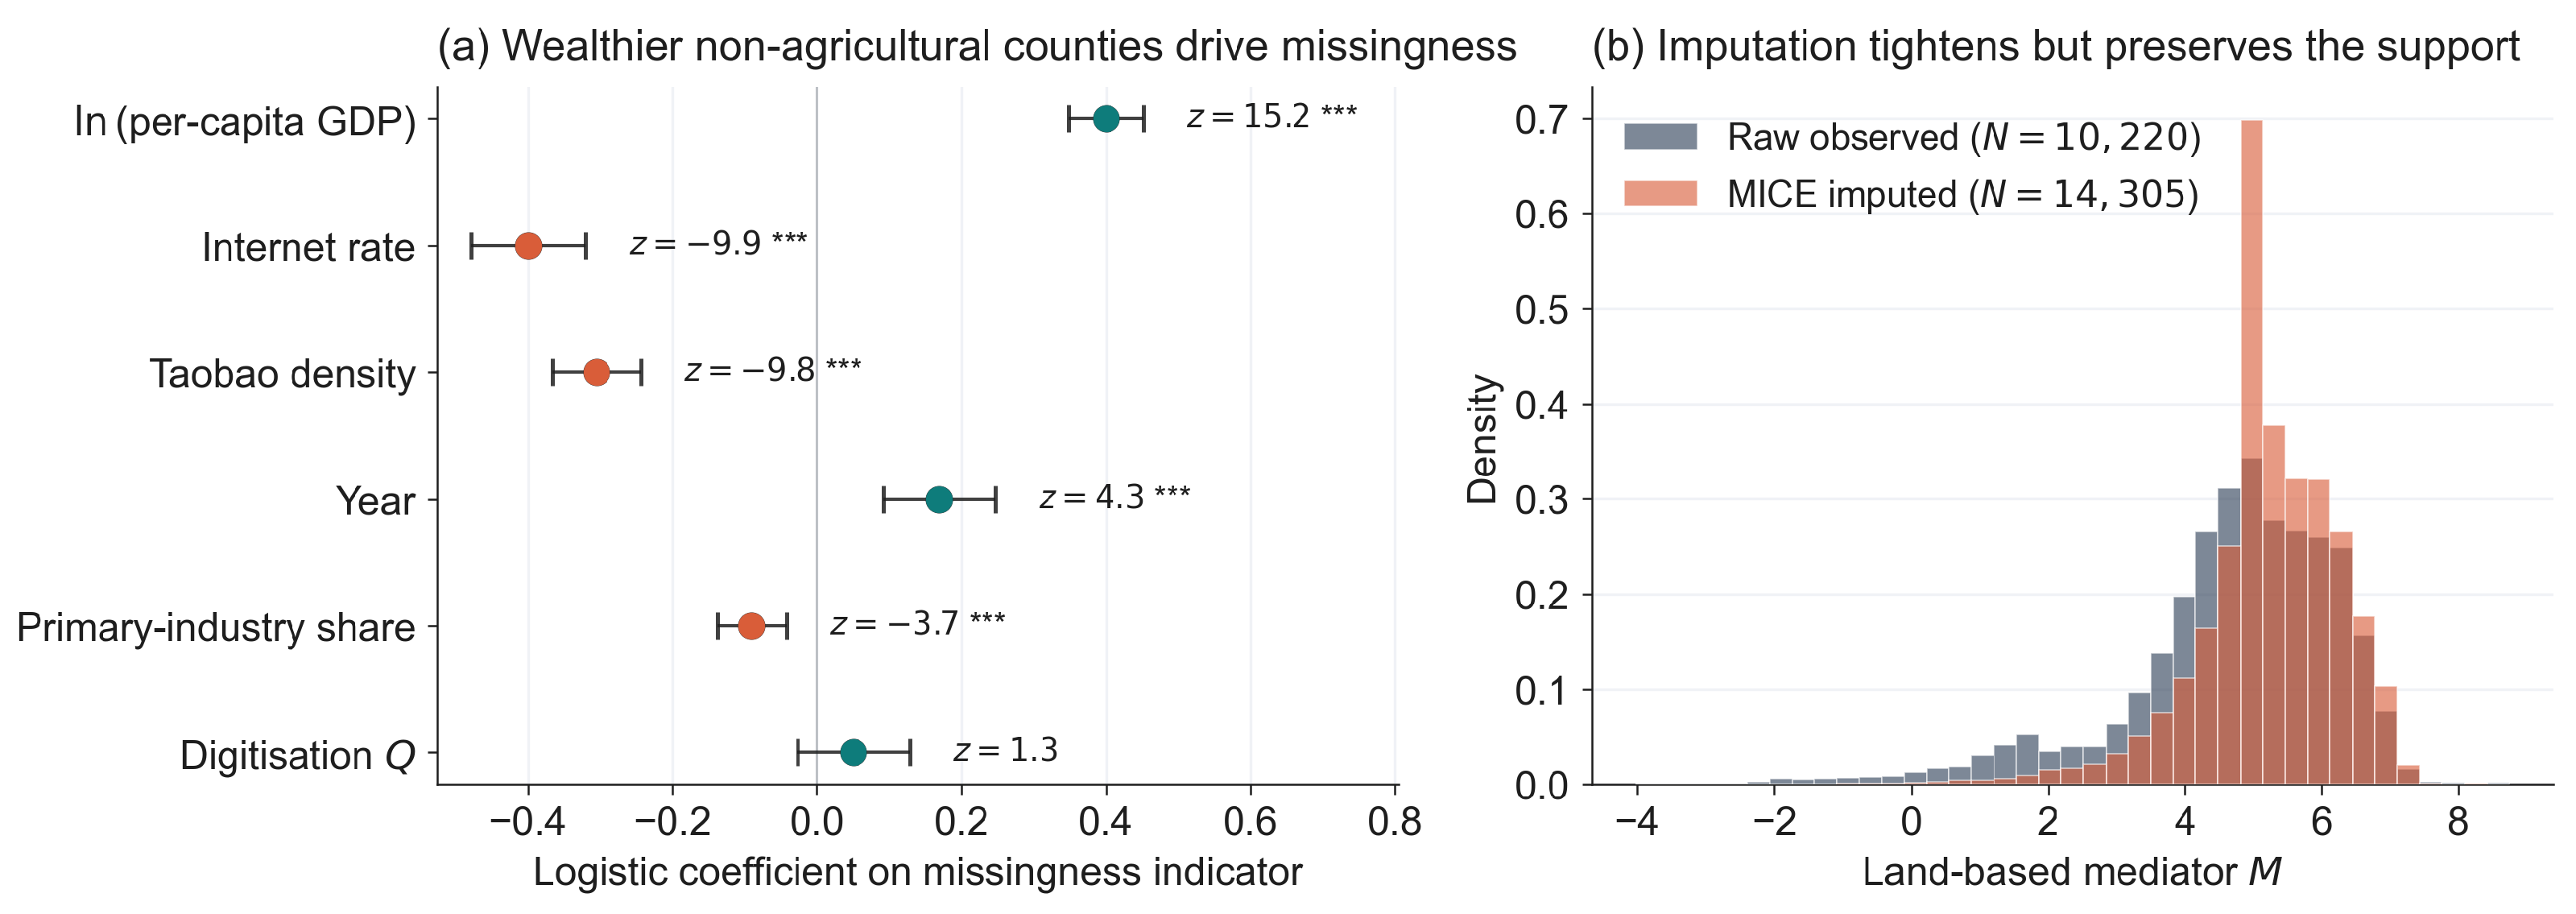
Figure A2.
Bartik shift-share IV diagnostics. (a) Rotemberg weights by year (teal: positive weights; orange: negative weights), HHI of is . (b) First-stage robust F with/without pre-trend control vs. Stock–Yogo and Olea–Pflueger benchmarks; the navy bar denotes the specification without pre-trend control and the orange bar denotes the specification with pre-trend control.
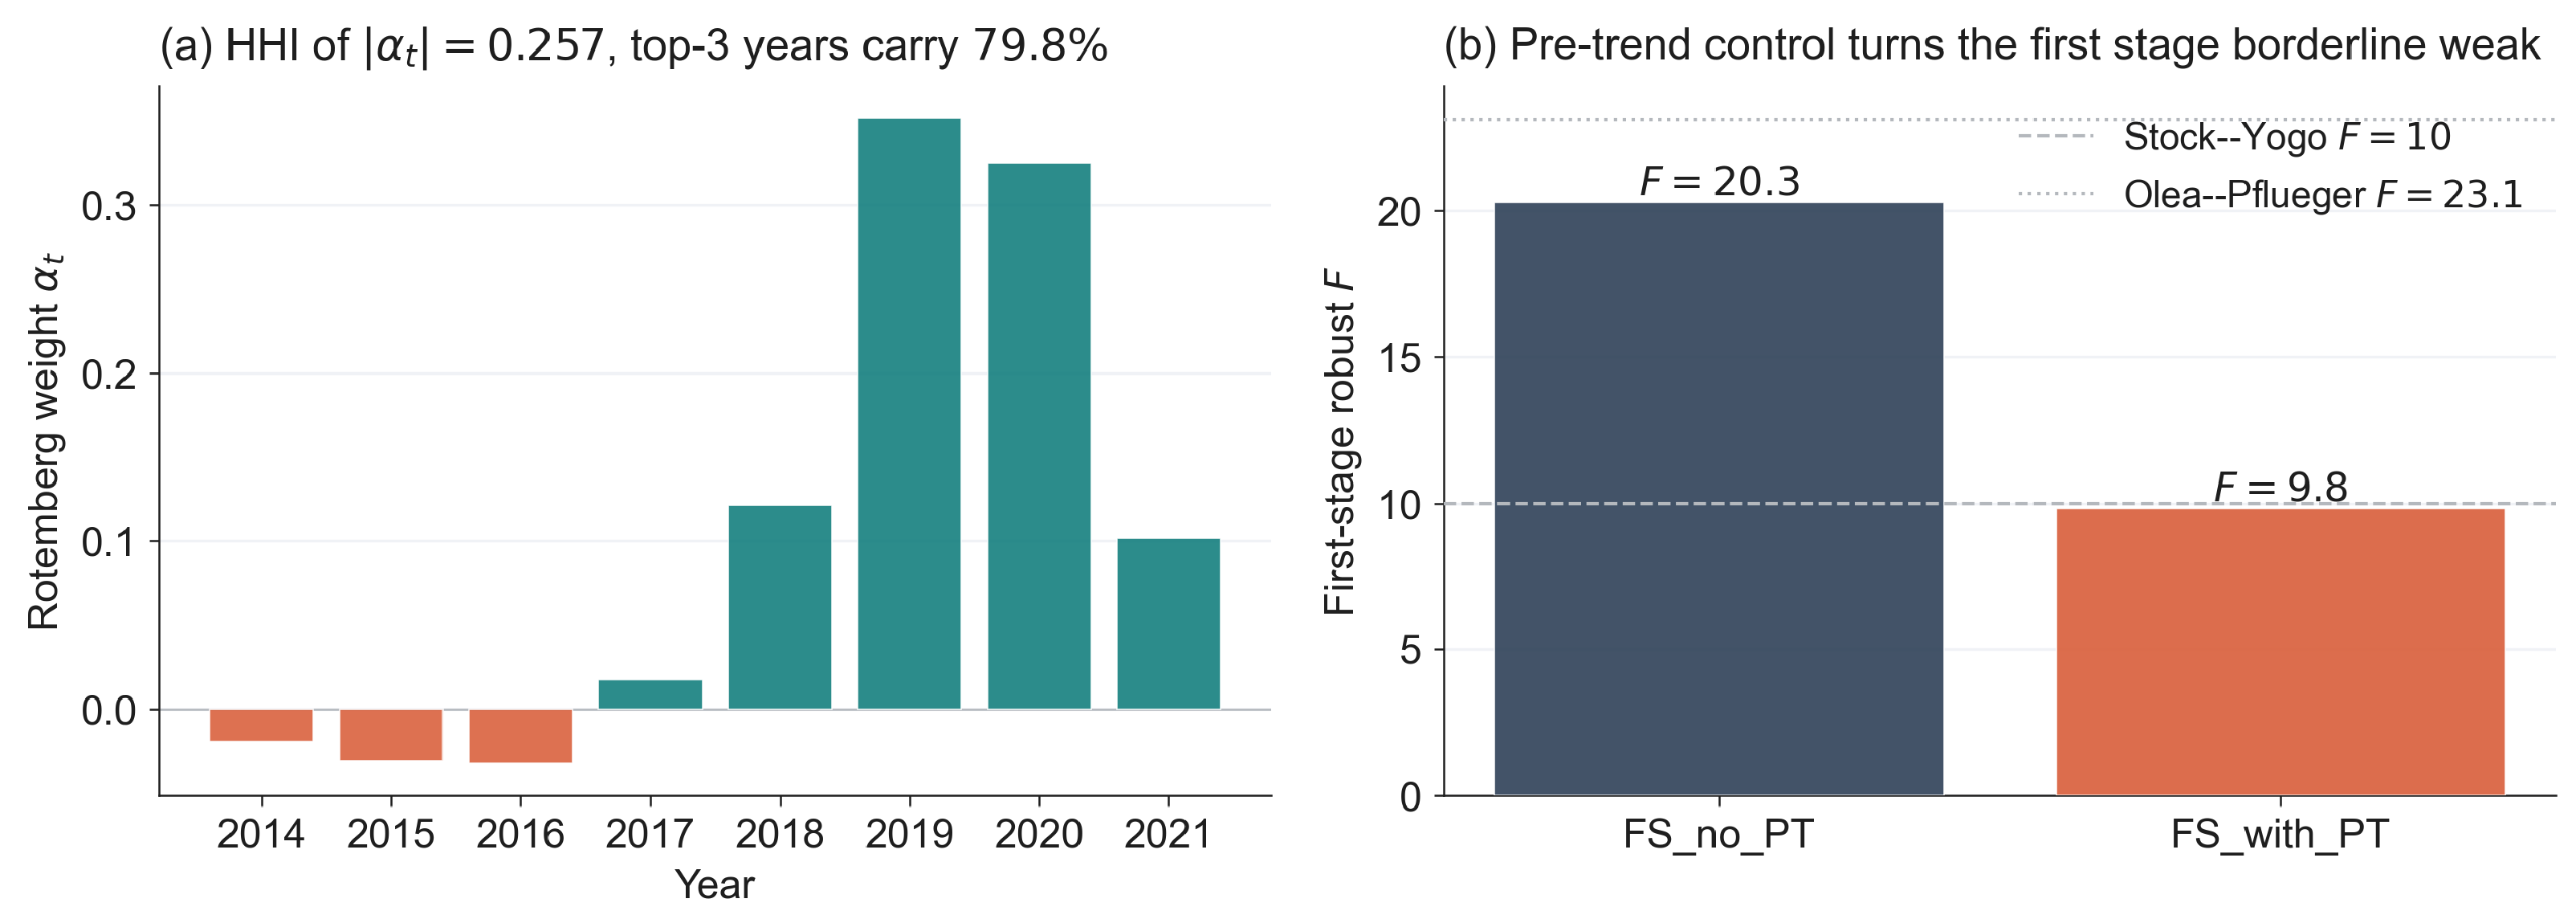
References
- Fan, J.; Tang, L.; Zhu, W.; Zou, B. The Alibaba effect: Spatial consumption inequality and the welfare gains from e-commerce. J. Int. Econ. 2018, 114, 203–220. [Google Scholar] [CrossRef] [Scilit]
- Couture, V.; Faber, B.; Gu, Y.; Liu, L. Connecting the countryside via e-commerce: Evidence from China. Am. Econ. Rev. Insights 2021, 3, 35–50. [Google Scholar] [CrossRef] [Scilit]
- Luo, X.; Niu, C. E-Commerce Participation and Household Income Growth in Taobao Villages. World Bank Policy Research Working Paper No. 8811. 2019. Available online: https://documents1.worldbank.org/curated/en/839451555093213522/pdf/E-Commerce-Participation-and-Household-Income-Growth-in-Taobao-Villages.pdf (accessed on 10 April 2026).
- Li, G.; Qin, J. Income effect of rural e-commerce: Empirical evidence from Taobao villages in China. J. Rural Stud. 2022, 96, 129–140. [Google Scholar] [CrossRef] [Scilit]
- Wang, L.; Sun, Y. Digital dividends? Rural e-commerce policy and urban–rural income disparity in China. Telecommun. Policy 2025, 49, 103058. [Google Scholar] [CrossRef] [Scilit]
- Zhong, S.; Zhang, X.; Zhang, L. How does digital economy influence urban common prosperity? Evidence from China’s demonstration area for common prosperity. Int. Rev. Econ. Financ. 2025, 104, 104629. [Google Scholar] [CrossRef] [Scilit]
- Chen, M.; Wang, Z.; Ji, Y. Can digital infrastructure facilitate a development model of common prosperity? Harmonizing equity, efficiency, and environment. Environ. Dev. Sustain. 2026, 1–23. [Google Scholar] [CrossRef] [Scilit]
- Ouyang, Z.; Song, C.; Zheng, H.; Polasky, S.; Xiao, Y.; Bateman, I.J.; Liu, J.; Ruckelshaus, M.; Shi, F.; Xiao, Y.; et al. Using gross ecosystem product (GEP) to value nature in decision making. Proc. Natl. Acad. Sci. USA 2020, 117, 14593–14601. [Google Scholar] [CrossRef] [Scilit] [PubMed]
- Gao, L.; Zhao, G.; Liang, L. Achieving higher eco-efficiency for three staple food crops with ecosystem services based on regional heterogeneity in China. Sci. Total Environ. 2024, 948, 174942. [Google Scholar] [CrossRef] [Scilit]
- Song, M.; Du, J. Mechanisms for realizing the ecological products value: Green finance intervention and support. Int. J. Prod. Econ. 2024, 271, 109210. [Google Scholar] [CrossRef] [Scilit]
- Sen, A. Real national income. Rev. Econ. Stud. 1976, 43, 19–39. [Google Scholar] [CrossRef] [Scilit]
- Guo, F. Measuring China’s digital financial inclusion: Index compilation and spatial characteristics. China Econ. Quartely 2020, 19, 1401. [Google Scholar]
- Hansen, B.E. Threshold effects in non-dynamic panels: Estimation, testing, and inference. J. Econom. 1999, 93, 345–368. [Google Scholar] [CrossRef] [Scilit]
- MacKinnon, J.G.; Nielsen, M.Ø.; Webb, M.D. Cluster-robust inference: A guide to empirical practice. J. Econom. 2023, 232, 272–299. [Google Scholar] [CrossRef] [Scilit]
- Callaway, B.; Sant’Anna, P.H.C. Difference-in-differences with multiple time periods. J. Econom. 2021, 225, 200–230. [Google Scholar] [CrossRef] [Scilit]
- Goldsmith-Pinkham, P.; Sorkin, I.; Swift, H. Bartik instruments: What, when, why, and how. Am. Econ. Rev. 2020, 110, 2586–2624. [Google Scholar] [CrossRef] [Scilit]
- van Buuren, S.; Groothuis-Oudshoorn, K. mice: Multivariate imputation by chained equations in R. J. Stat. Softw. 2011, 45, 1–67. [Google Scholar] [CrossRef] [Scilit]
- Zhang, H.; Millan, E.; Money, K. E-commerce development, poverty reduction and income growth in rural China. J. Strategy Manag. 2025, 18, 148–176. [Google Scholar] [CrossRef] [Scilit]
- Wang, F.; Shen, S. Does the digital economy development improve or exacerbate income inequality? International evidence. Manag. Decis. Econ. 2024, 45, 4012–4038. [Google Scholar] [CrossRef] [Scilit]
- Zou, J.; Yao, L.; Wang, B. How does digital inclusive finance promote the journey of common prosperity in China? Cities 2024, 150, 105083. [Google Scholar] [CrossRef] [Scilit]
- Ling, J.; Liang, X.; Zhang, J. Ecological product value realization: Lessons learned from practice in China. Sustain. Futur. 2025, 10, 100911. [Google Scholar] [CrossRef] [Scilit]
- Zhu, Y.; Huo, C. The impact of agricultural production efficiency on agricultural carbon emissions in China. Energies 2022, 15, 4464. [Google Scholar] [CrossRef] [Scilit]
- Xu, H.; Fan, Z.; Ahmad, F. Exploring the ecological protection impacts of cultivated land transfer: Explanation based on fertilizers and pesticides. Ecol. Indic. 2023, 154, 110681. [Google Scholar] [CrossRef] [Scilit]
- Si, R.; Wang, Y.; Cao, M. Does green technology innovation promote green economic growth? Examining regional heterogeneity between resource-based and non-resource-based cities. Int. Rev. Econ. Financ. 2024, 94, 103406. [Google Scholar] [CrossRef] [Scilit]
- Calvano, E.; Calzolari, G.; Denicolò, V.; Pastorello, S. Artificial intelligence, algorithmic pricing, and collusion. Am. Econ. Rev. 2020, 110, 3267–3297. [Google Scholar] [CrossRef] [Scilit]
- Geng, Y.; Zhang, Y.; Li, J. Two-sided competition, platform services and online shopping market structure. J. Econ. 2023, 138, 95–127. [Google Scholar] [CrossRef] [Scilit]
- Norris, P. Digital divide: Civic engagement, information poverty, and the Internet worldwide. Can. J. Commun. 2003, 28, 1. [Google Scholar] [CrossRef] [Scilit]
- van Deursen, A.J.A.M.; van Dijk, J.A.G.M. The first-level digital divide shifts from inequalities in physical access to inequalities in material access. New Media Soc. 2019, 21, 354–375. [Google Scholar] [CrossRef] [Scilit] [PubMed]
- Demirgüç-Kunt, A.; Klapper, L.; Singer, D.; Ansar, S. Financial Inclusion, Digital Payments, and Resilience in the Age of COVID-19; World Bank Report: Washington, DC, USA, 2021. [Google Scholar]
- Gao, X.; Gao, R. A study of the impact of digital financial inclusion on the resilience of the agricultural chain. Front. Sustain. Food Syst. 2024, 8, 1448550. [Google Scholar] [CrossRef] [Scilit]
- Zhang, T.; Zhang, R. The spatial effect of low-carbon development of regional industries driven by the digital economy: Evidence from Chinese cities. Humanit. Soc. Sci. Commun. 2024, 11, 706. [Google Scholar] [CrossRef] [Scilit]
- Acemoglu, D.; Restrepo, P. Robots and jobs: Evidence from US labor markets. J. Political Econ. 2020, 128, 2188–2244. [Google Scholar] [CrossRef] [Scilit]
- Chen, W.; Wu, Y. Does intellectual property protection stimulate digital economy development? J. Appl. Econ. 2022, 25, 723–730. [Google Scholar] [CrossRef] [Scilit]
- Zhao, X.; Dong, Y.; Gong, X. The digital economy and carbon productivity: Evidence at China’s city level. Sustainability 2022, 14, 10642. [Google Scholar] [CrossRef] [Scilit]
- Kyriazis, N.A.; Dimitriadis, K.A.; Theodossiou, P. Can Banking Intermediates Crowd Out Their High-Tech Promising Successors? A Financial Stress Perspective. Int. J. Financ. Econ. 2026, early view. [Google Scholar] [CrossRef] [Scilit]
- Wu, R.; Yang, D.; Dong, J. Regional inequality in China based on NPP-VIIRS night-time light imagery. Remote Sens. 2018, 10, 240. [Google Scholar] [CrossRef] [Scilit]
- Correia, S. Linear Models with High-Dimensional Fixed Effects: An Efficient and Feasible Estimator. 2016. Available online: http://scorreia.com/research/hdfe.pdf (accessed on 25 October 2019).
- Lind, J.T.; Mehlum, H. With or without U? The appropriate test for a U-shaped relationship. Oxf. Bull. Econ. Stat. 2010, 72, 109–118. [Google Scholar] [CrossRef] [Scilit]
- de Chaisemartin, C.; D’Haultfœuille, X. Two-way fixed effects estimators with heterogeneous treatment effects. Am. Econ. Rev. 2020, 110, 2964–2996. [Google Scholar] [CrossRef] [Scilit]
- Sun, L.; Abraham, S. Estimating dynamic treatment effects in event studies with heterogeneous treatment effects. J. Econom. 2021, 225, 175–199. [Google Scholar] [CrossRef] [Scilit]
- Borusyak, K.; Jaravel, X.; Spiess, J. Revisiting event-study designs: Robust and efficient estimation. Rev. Econ. Stud. 2024, 91, 3253–3285. [Google Scholar] [CrossRef] [Scilit]
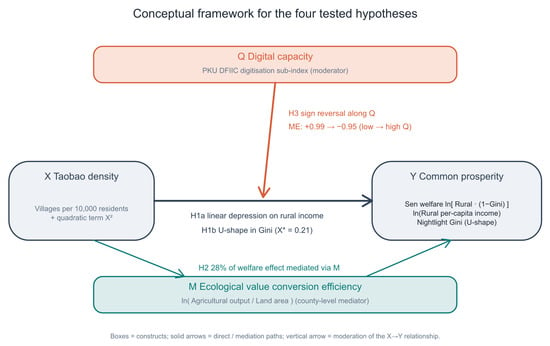
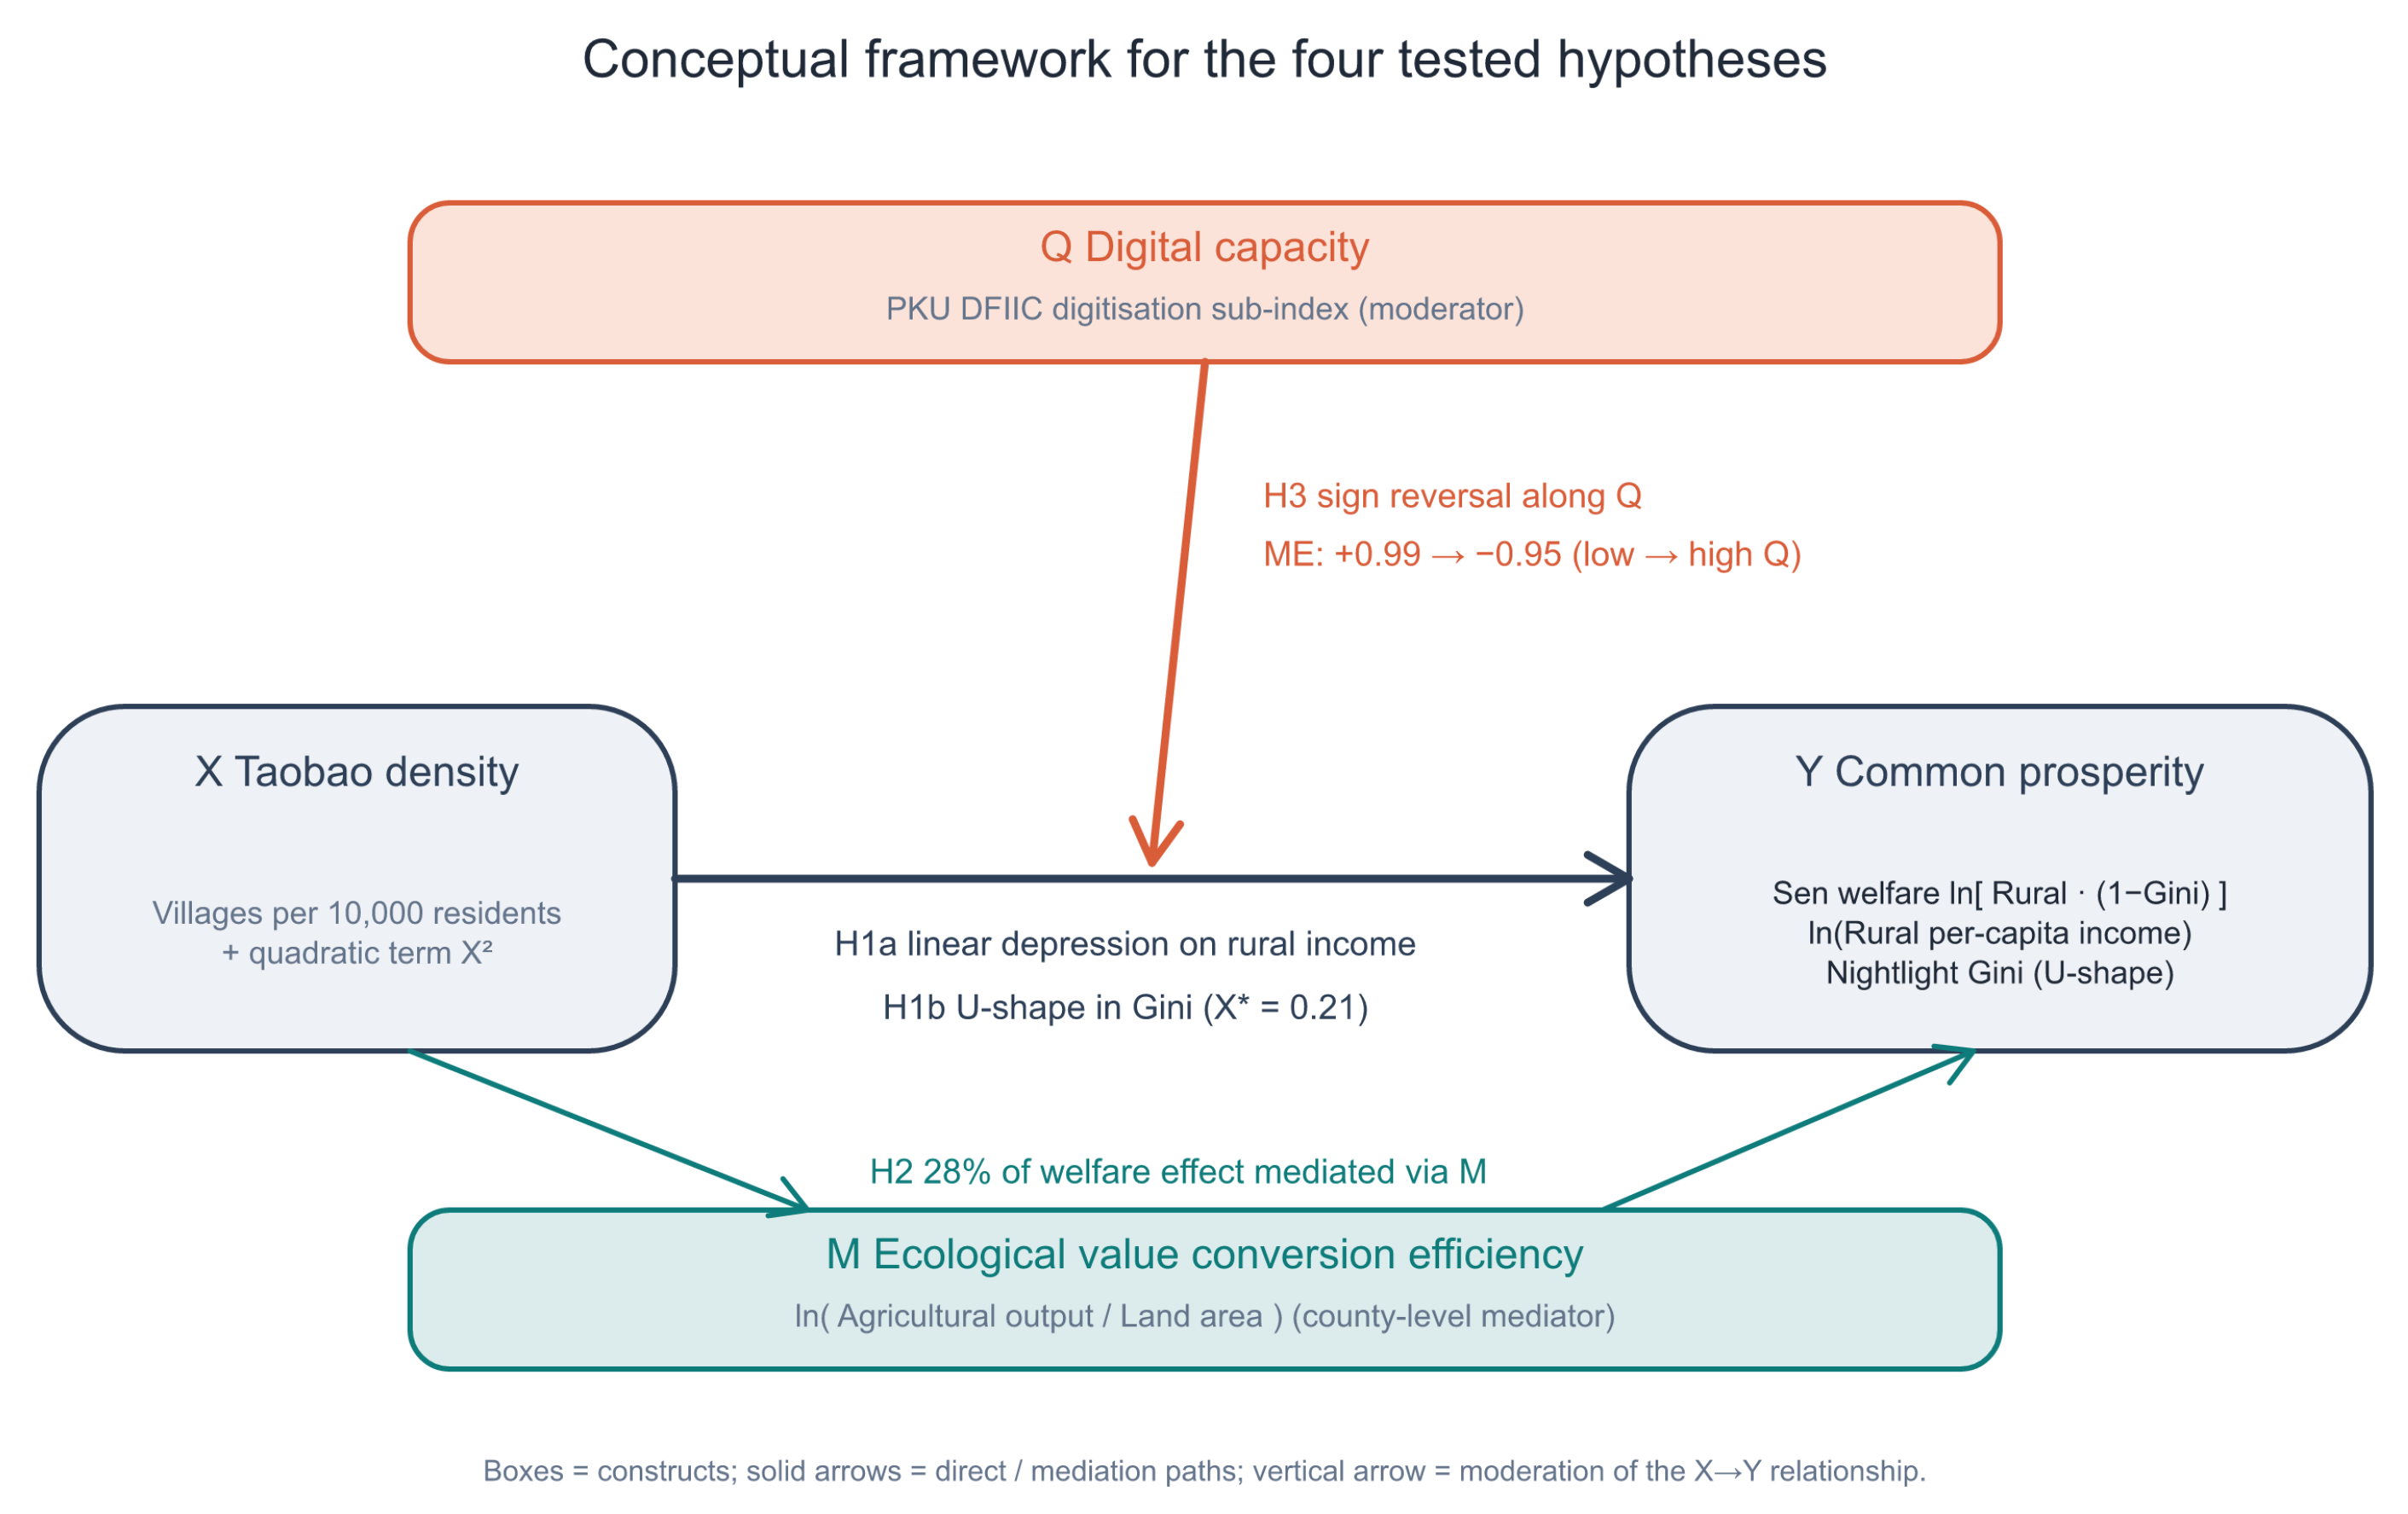
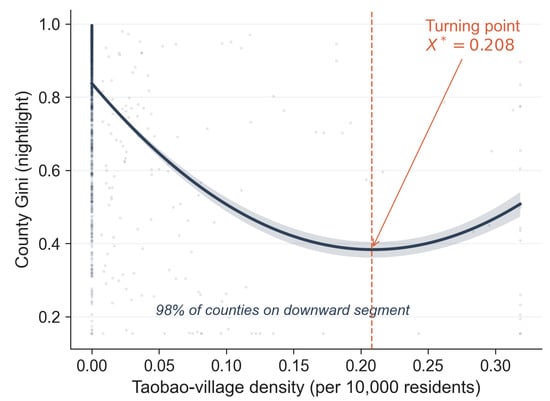
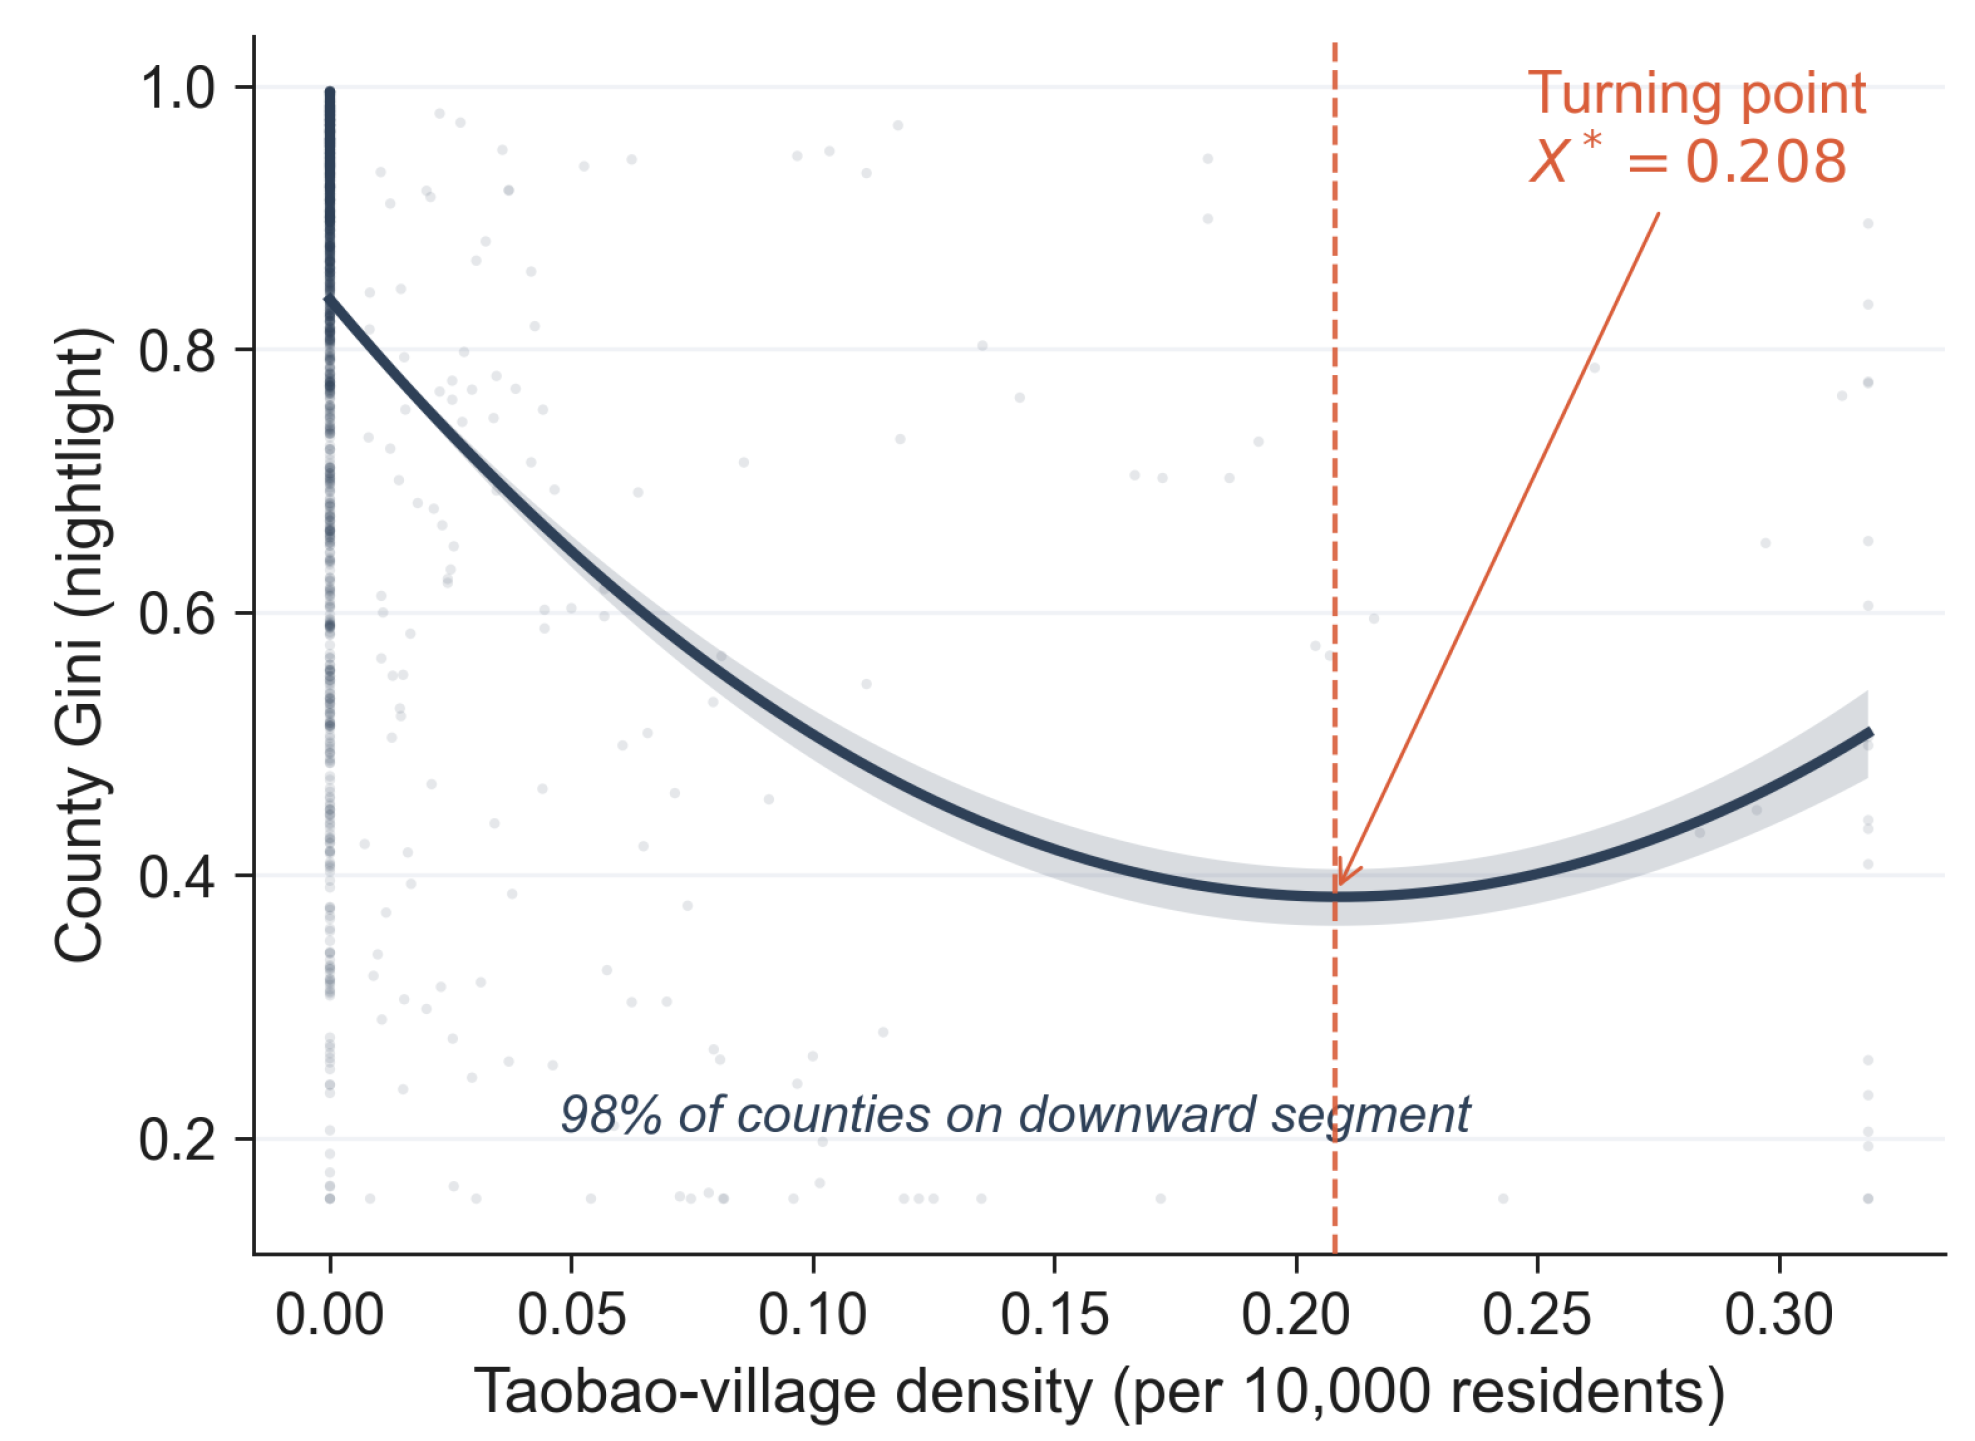
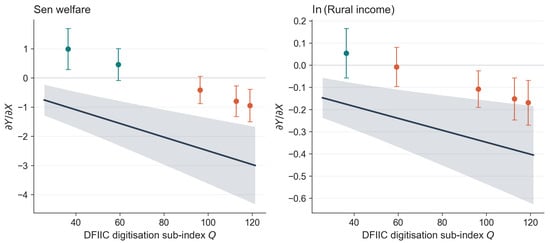
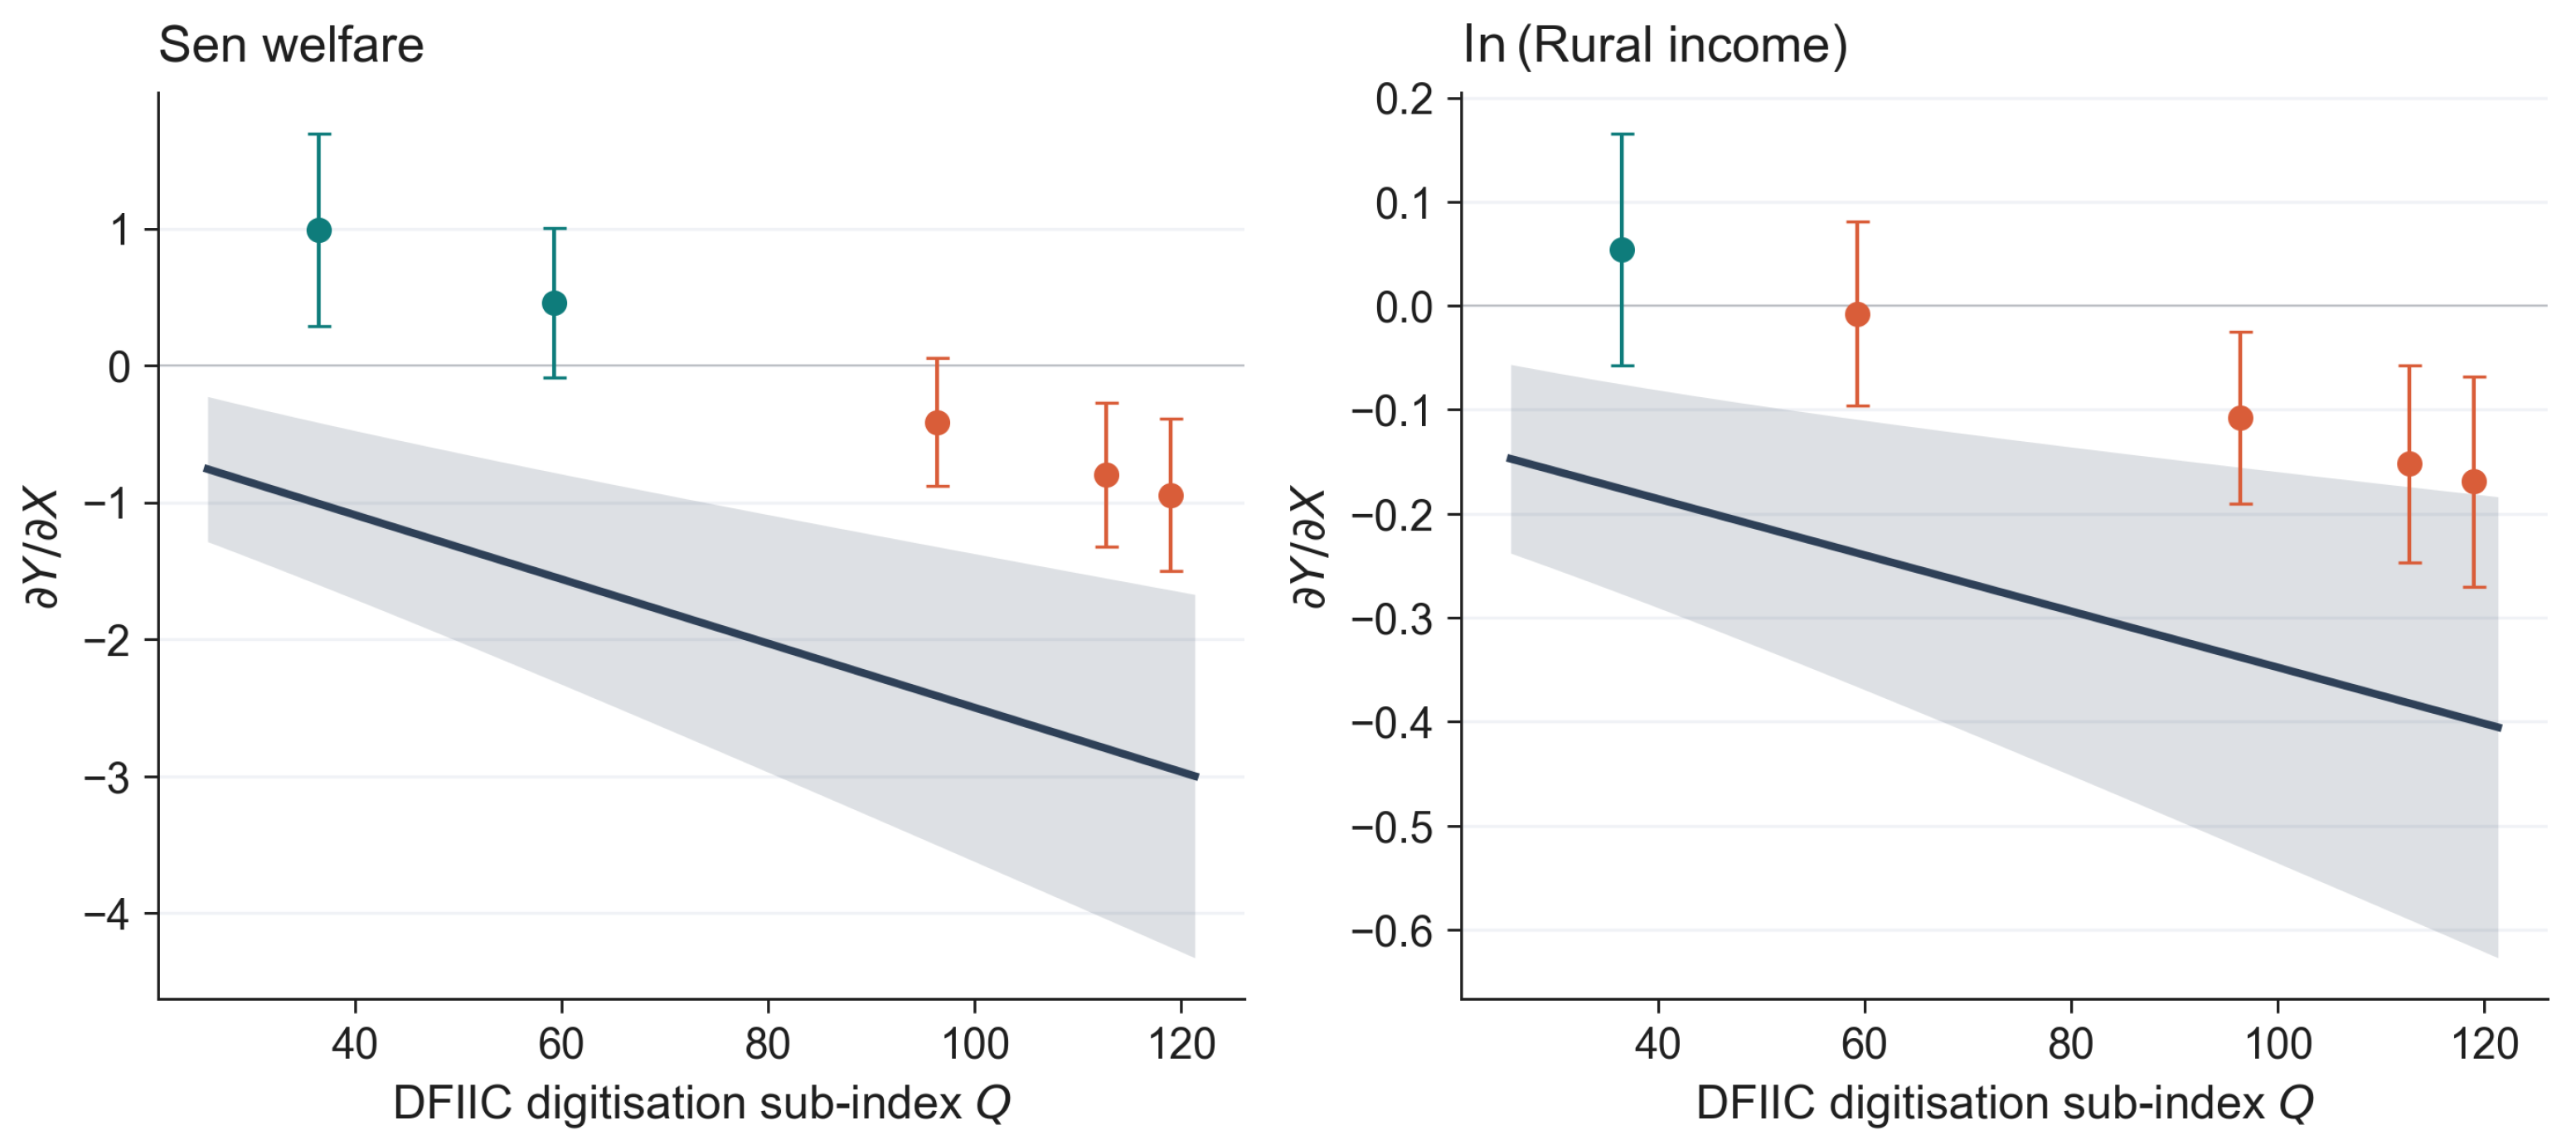
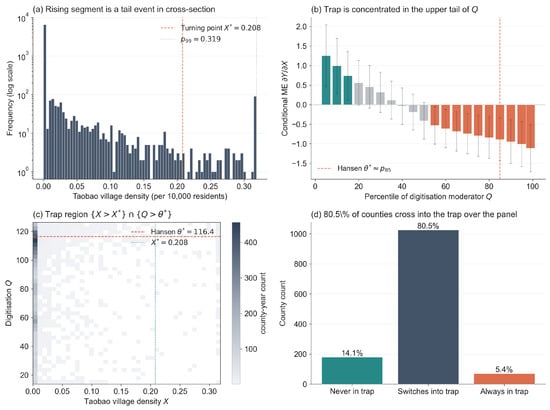
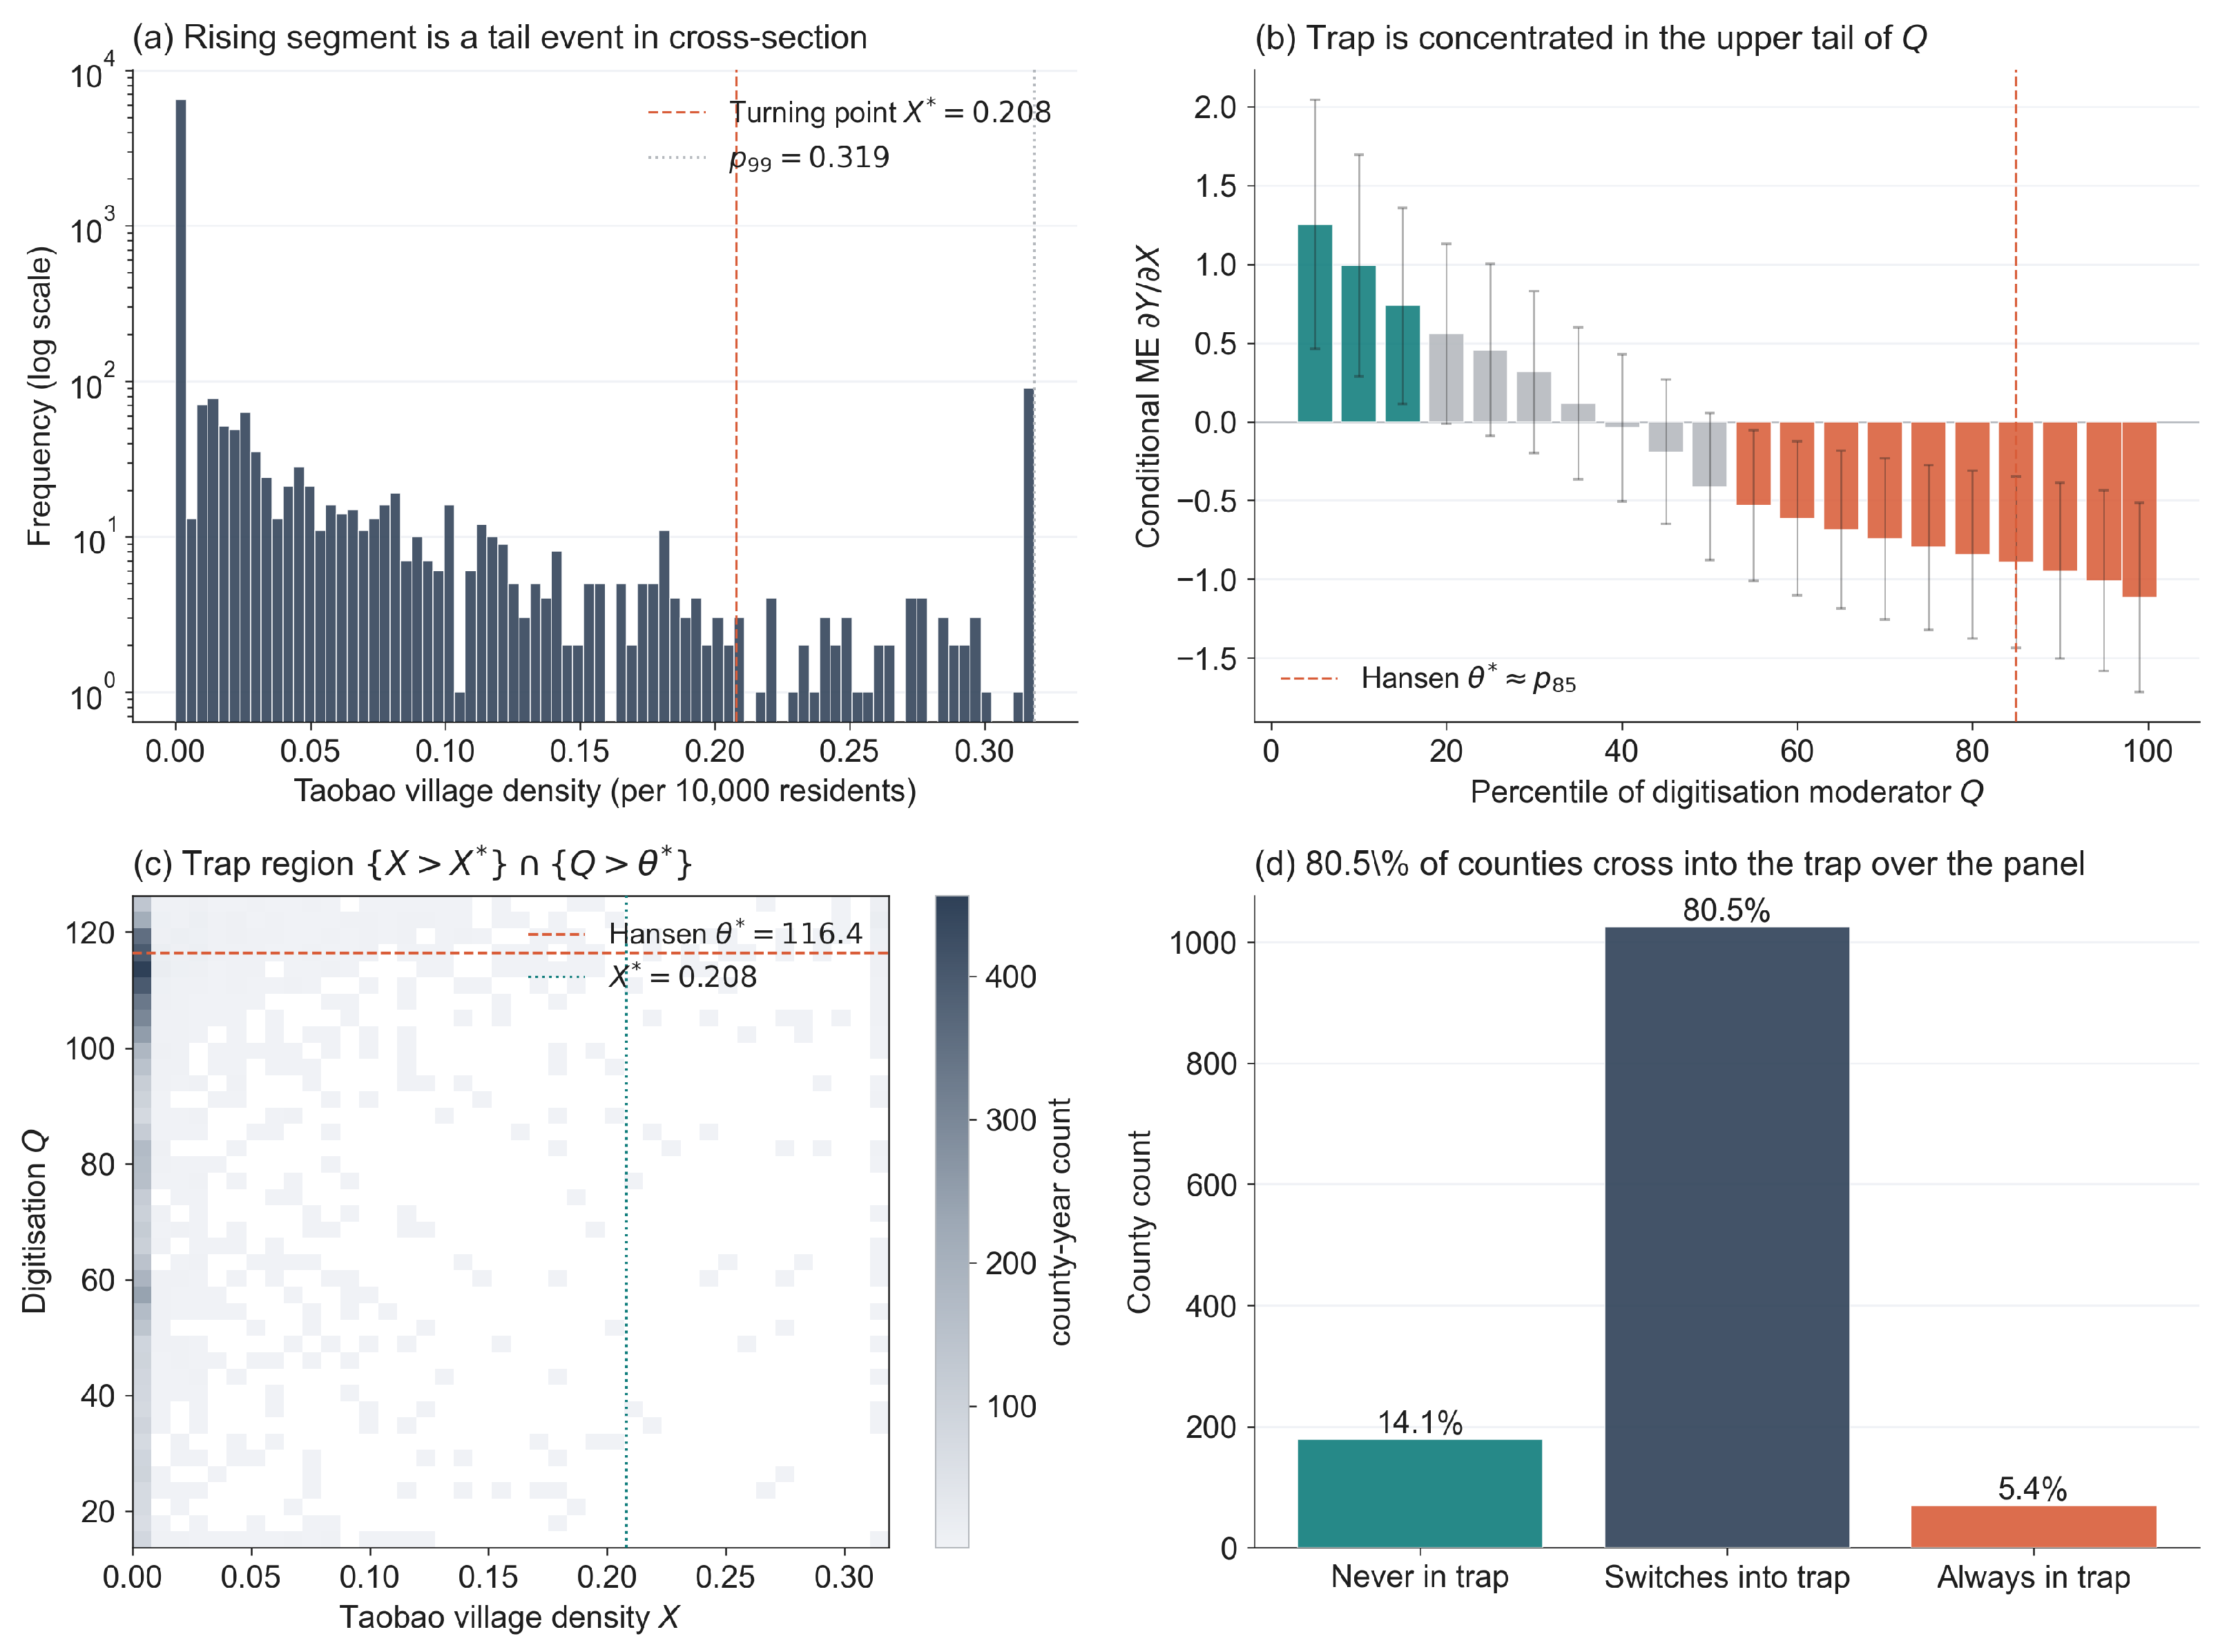
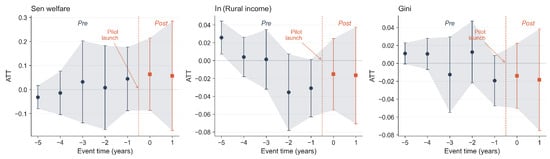
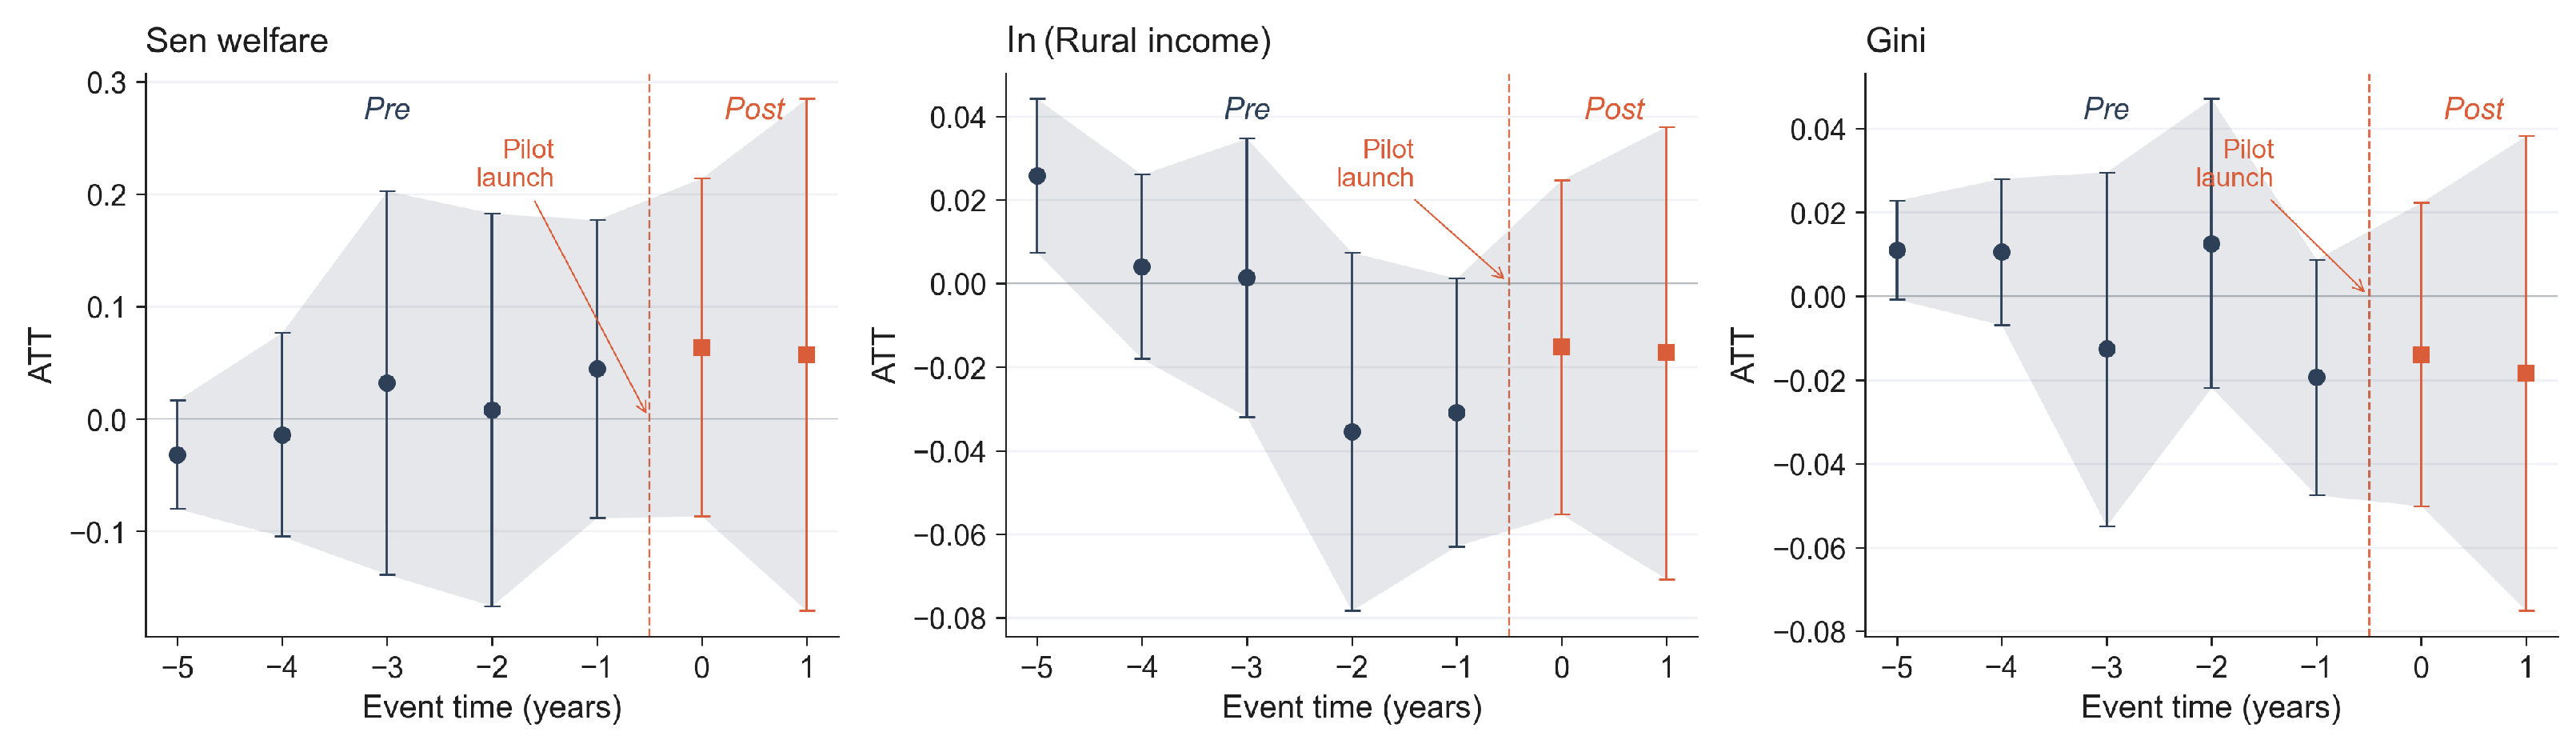

Disclaimer/Publisher’s Note: The statements, opinions and data contained in all publications are solely those of the individual author(s) and contributor(s) and not of MDPI and/or the editor(s). MDPI and/or the editor(s) disclaim responsibility for any injury to people or property resulting from any ideas, methods, instructions or products referred to in the content. |
© 2026 by the authors. Licensee MDPI, Basel, Switzerland. This article is an open access article distributed under the terms and conditions of the Creative Commons Attribution (CC BY) license.