


Abstract
Underground Compressed Air Energy Storage (CAES) is a promising large-scale energy storage technology, yet its long-term operational safety is constrained by progressive tensile damage accumulation in lining structures under cyclic thermo-mechanical loading. Conventional steel-lined caverns are costly, while ordinary reinforced concrete linings require excessive reinforcement due to their limited tensile capacity, compromising the economic viability of CAES. This study proposes a Reinforced-Steel Fibre Concrete (R-SFC) lining as the structural load-bearing layer of CAES caverns, in which the steel fibres provide tensile and crack-propagation resistance and the rebars contribute supplementary tensile capacity. A 2D coupled thermo-mechanical damage-plasticity finite element model was developed in COMSOL Multiphysics and verified using published in situ monitoring data from operating CAES caverns. Parametric analyses of the steel fibre volume fraction, lining thickness, rebar diameter, and cavern diameter were then performed. The results show that the R-SFC lining significantly improves crack propagation resistance, reducing the maximum tensile damage by 41.3% relative to conventional reinforced concrete while lowering steel consumption. Within the lining–rock system, the concrete lining and the surrounding rock jointly resist the radial compressive load, while the steel fibres and rebars bear the hoop tensile stress. A thickness-to-diameter ratio of 1/8 to 1/5 is identified as the recommended geometric design range to balance lining damage against surrounding rock loading. Finally, an MOPSO algorithm coupled with a PSO-BP surrogate model is employed to balance lining tensile damage against cavern dimensions, yielding optimised parameter combinations particularly suitable for cavern diameters around 4 m. The study findings may provide a new lining solution and design reference for cost-effective and high-reliability underground gas storage.
1. Introduction
Since the beginning of the 21st century, environmental and energy issues have been highly prioritised by people, driving nations worldwide to develop alternative renewable energy sources to replace traditional fossil fuels. In 2021, the global renewable energy generation increased by 500 TWh compared to the previous year, exceeding 8000 TWh [1]. It is projected that by 2025, renewable energy generation will surpass coal-fired generation, becoming the largest source of electricity globally. Solar and wind power are expected to account for 20% of total global electricity generation by 2027 [2]. Against the backdrop of global climate change, China has explicitly set the “dual carbon” goals of achieving carbon peak by 2030 and carbon neutrality by 2060 [3], with the transformation of the energy structure as the core pathway. However, renewable energy sources like wind and solar power are characterised by strong volatility and intermittency [4], placing significant pressure on the grid through peak load regulation requirements arising from large-scale integration, necessitating the development of efficient energy storage technologies to balance supply and demand.
Currently, mainstream energy storage technologies include pumped-storage hydropower [5], battery storage [6,7], flywheel storage [8], and compressed air energy storage (CAES) [9,10]. Among these, electrochemical approaches, such as aqueous lithium rechargeable batteries [7], have attracted growing interest for distributed and short-duration applications owing to their low cost and intrinsic safety, while CAES has unique advantages in terms of large storage capacity, long storage duration, environmental friendliness, and long theoretical lifespan [11], and has become one of the most promising storage technologies. A CAES system typically comprises components like compressors, thermal storage devices (for heat recovery), drive motors, generators, air storage caverns (tanks), and turbines [12,13]. Its operation involves compressing air using compressors during periods of excess electricity, storing the compressed air in tanks after heat recovery via thermal storage devices, and subsequently using the stored compressed air to generate electricity by passing it through the thermal storage devices for reheating and driving generators or turbines.
Current mainstream CAES technology can be categorised into two types based on the storage medium: above-ground tank-based [14] and underground cavern-based [15,16]. Above-ground CAES relies on artificially constructed high-pressure tanks, which suffer from high unit capacity costs and limitations in scalability. In contrast, underground CAES utilises natural or artificial underground spaces, such as salt caverns, hard rock cavities, or abandoned mines, to store high-pressure air. This approach offers both cost-effectiveness and scalability potential, making it a core technology for addressing the integration of large-scale renewable energy. However, naturally occurring underground caverns that meet storage conditions are limited [17]. To meet the growing demand for large-scale energy storage, the construction technology for artificial underground storage has become a focal point of research.
To meet the requirements of large-scale CAES for underground gas storage caverns in terms of cost-effectiveness and long-term airtightness, structural designs have been continuously evolving. Research indicates that unlined salt caverns under high-pressure cyclic loading may experience a significant doubling of rock mass deformation due to creep–fatigue coupling effects, posing a threat to structural stability and sealing performance [18]. In response to this challenge, the three-layer composite lining structure comprising a “sealing layer—concrete lining—surrounding rock” has emerged as a widely adopted structural configuration due to its comprehensive advantages [19].
Pressure tests on underground steel-lined gas storage reservoirs in Sweden during the 1990s revealed issues such as stress concentration at the steel–concrete interface and excessively high construction costs when using 6 mm steel plates in concrete linings under 52 MPa internal pressure [20]. To reduce costs and optimise structural mechanical responses, flexible sealing materials, such as butyl rubber, have attracted attention for their excellent instantaneous sealing performance. Studies have shown that such sealing layers can effectively reduce cavern leakage rates [21]; however, concerns remain regarding their sensitivity to gas pressure and the risk of long-term ageing under high temperature and pressure conditions. In recent years, fibre-reinforced polymer (FRP) sealing layers have demonstrated promising prospects. These materials offer a long service life, can be directly applied to the inner surface of concrete linings, and significantly improve stress distribution at the interface while reducing gas leakage rates [22], making them a focal point in current research on high-performance sealing layers.
Compared to sealing layers, concrete linings in gas storage structures primarily serve to seal and withstand internal pressure, undergoing multiple structural optimisations during development. Research on airtight concrete has verified that its low permeability meets the basic requirements of CAES [23], but further validation is needed regarding the long-term airtightness impact of plastic damage accumulation under high-pressure cyclic loading. Traditional reinforced concrete linings, while enhancing the structure’s tensile strength, employ redundant reinforcement designs to prevent concrete cracking and damage, which reduces structural economy and fails to effectively address cracking caused by local stress concentration [24], affecting long-term sealing reliability. Notably, when used as the primary lining material, steel fibre-reinforced concrete (SFRC) develops a dual anti-damage mechanism through stress transfer before cracking and fibre bridging post-cracking. Experimental studies confirm that this mechanism effectively delays structural failure and suppresses multi-scale crack propagation [25,26]. The reinforced-steel fibre concrete (R-SFC) system, which combines both steel rebars and steel fibres, theoretically enhances structural strength and tensile performance while reducing rebar consumption [27]. Its superior crack resistance offers a highly promising solution for controlling damage-plastic zone expansion. Building upon this foundation, this study proposes the application of the R-SFC system to lining structures in gas storage caverns, aiming to explore its mechanical performance and damage control effectiveness within underground gas storage environments.
In addition, research on underground gas storage caverns has shown that experimental methods have higher reliability compared to numerical simulation methods, but the high cost is the biggest obstacle. Numerical simulation methods, after development, have also achieved a certain level of reliability, providing an economical and convenient research solution for the study of underground gas storage caverns [28]. Progress in the numerical simulation of coupled thermal and mechanical fields in underground gas storage caverns indicates that TOUGH-FLAC [29], COMSOL Multiphysics [30], and ANSYS [31] can fully characterise the characteristics of the cavern’s operational cycle. Among these, COMSOL, leveraging its advantages in multi-physics field coupling, demonstrates unique applicability in simulating the evolution of lining damage under gas pressure–temperature cyclic loading [32].
The aforementioned studies provide diverse structural configurations and analytical methods for underground lining design. Among the various lining materials, SFRC has been the most extensively investigated for its fibre-bridging mechanism and crack-control performance. Its post-cracking response has been captured by full-scale segment tests and three-dimensional mesoscale finite element models, and even constitutive models for hybrid fibre systems have been proposed [26,33]. However, these SFRC studies were conducted almost exclusively under quasi-static external loading and isothermal conditions, and their applicability to CAES caverns, where linings are subjected to cyclic internal pressure and coupled thermal transients, has not been examined. In comparison, research on RFC is relatively rare, with the few available studies confined to conventional tunnel engineering. For instance, Meng et al. [27] combined field tests and numerical simulations to investigate reinforcement ratio, lining thickness, and steel fibre volume content on the ultimate bearing capacity of R-SFC secondary linings for mountain tunnels under static surrounding rock pressure, reporting a 63.4% conventional reinforcement saving at equivalent load-bearing capacity. However, the loading conditions of mountain tunnels differ fundamentally from those of CAES underground caverns, where cyclic gas pressure and temperature loading drive the airtightness-critical damage. Whether the R-SFC can also serve as the principal load-bearing layer of a CAES cavern under such loading, therefore, remains to be examined. Furthermore, existing CAES lining modelling has focused on ordinary reinforced concrete under thermo-mechanical coupling [29,30,32], with fibre-reinforced concretes appearing only as low-modulus flexible linings without rebar reinforcement [34].
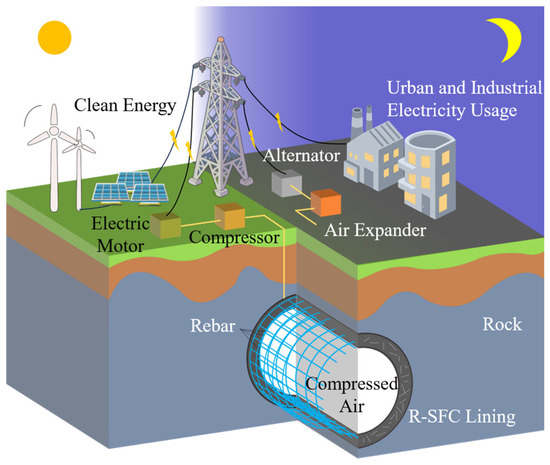
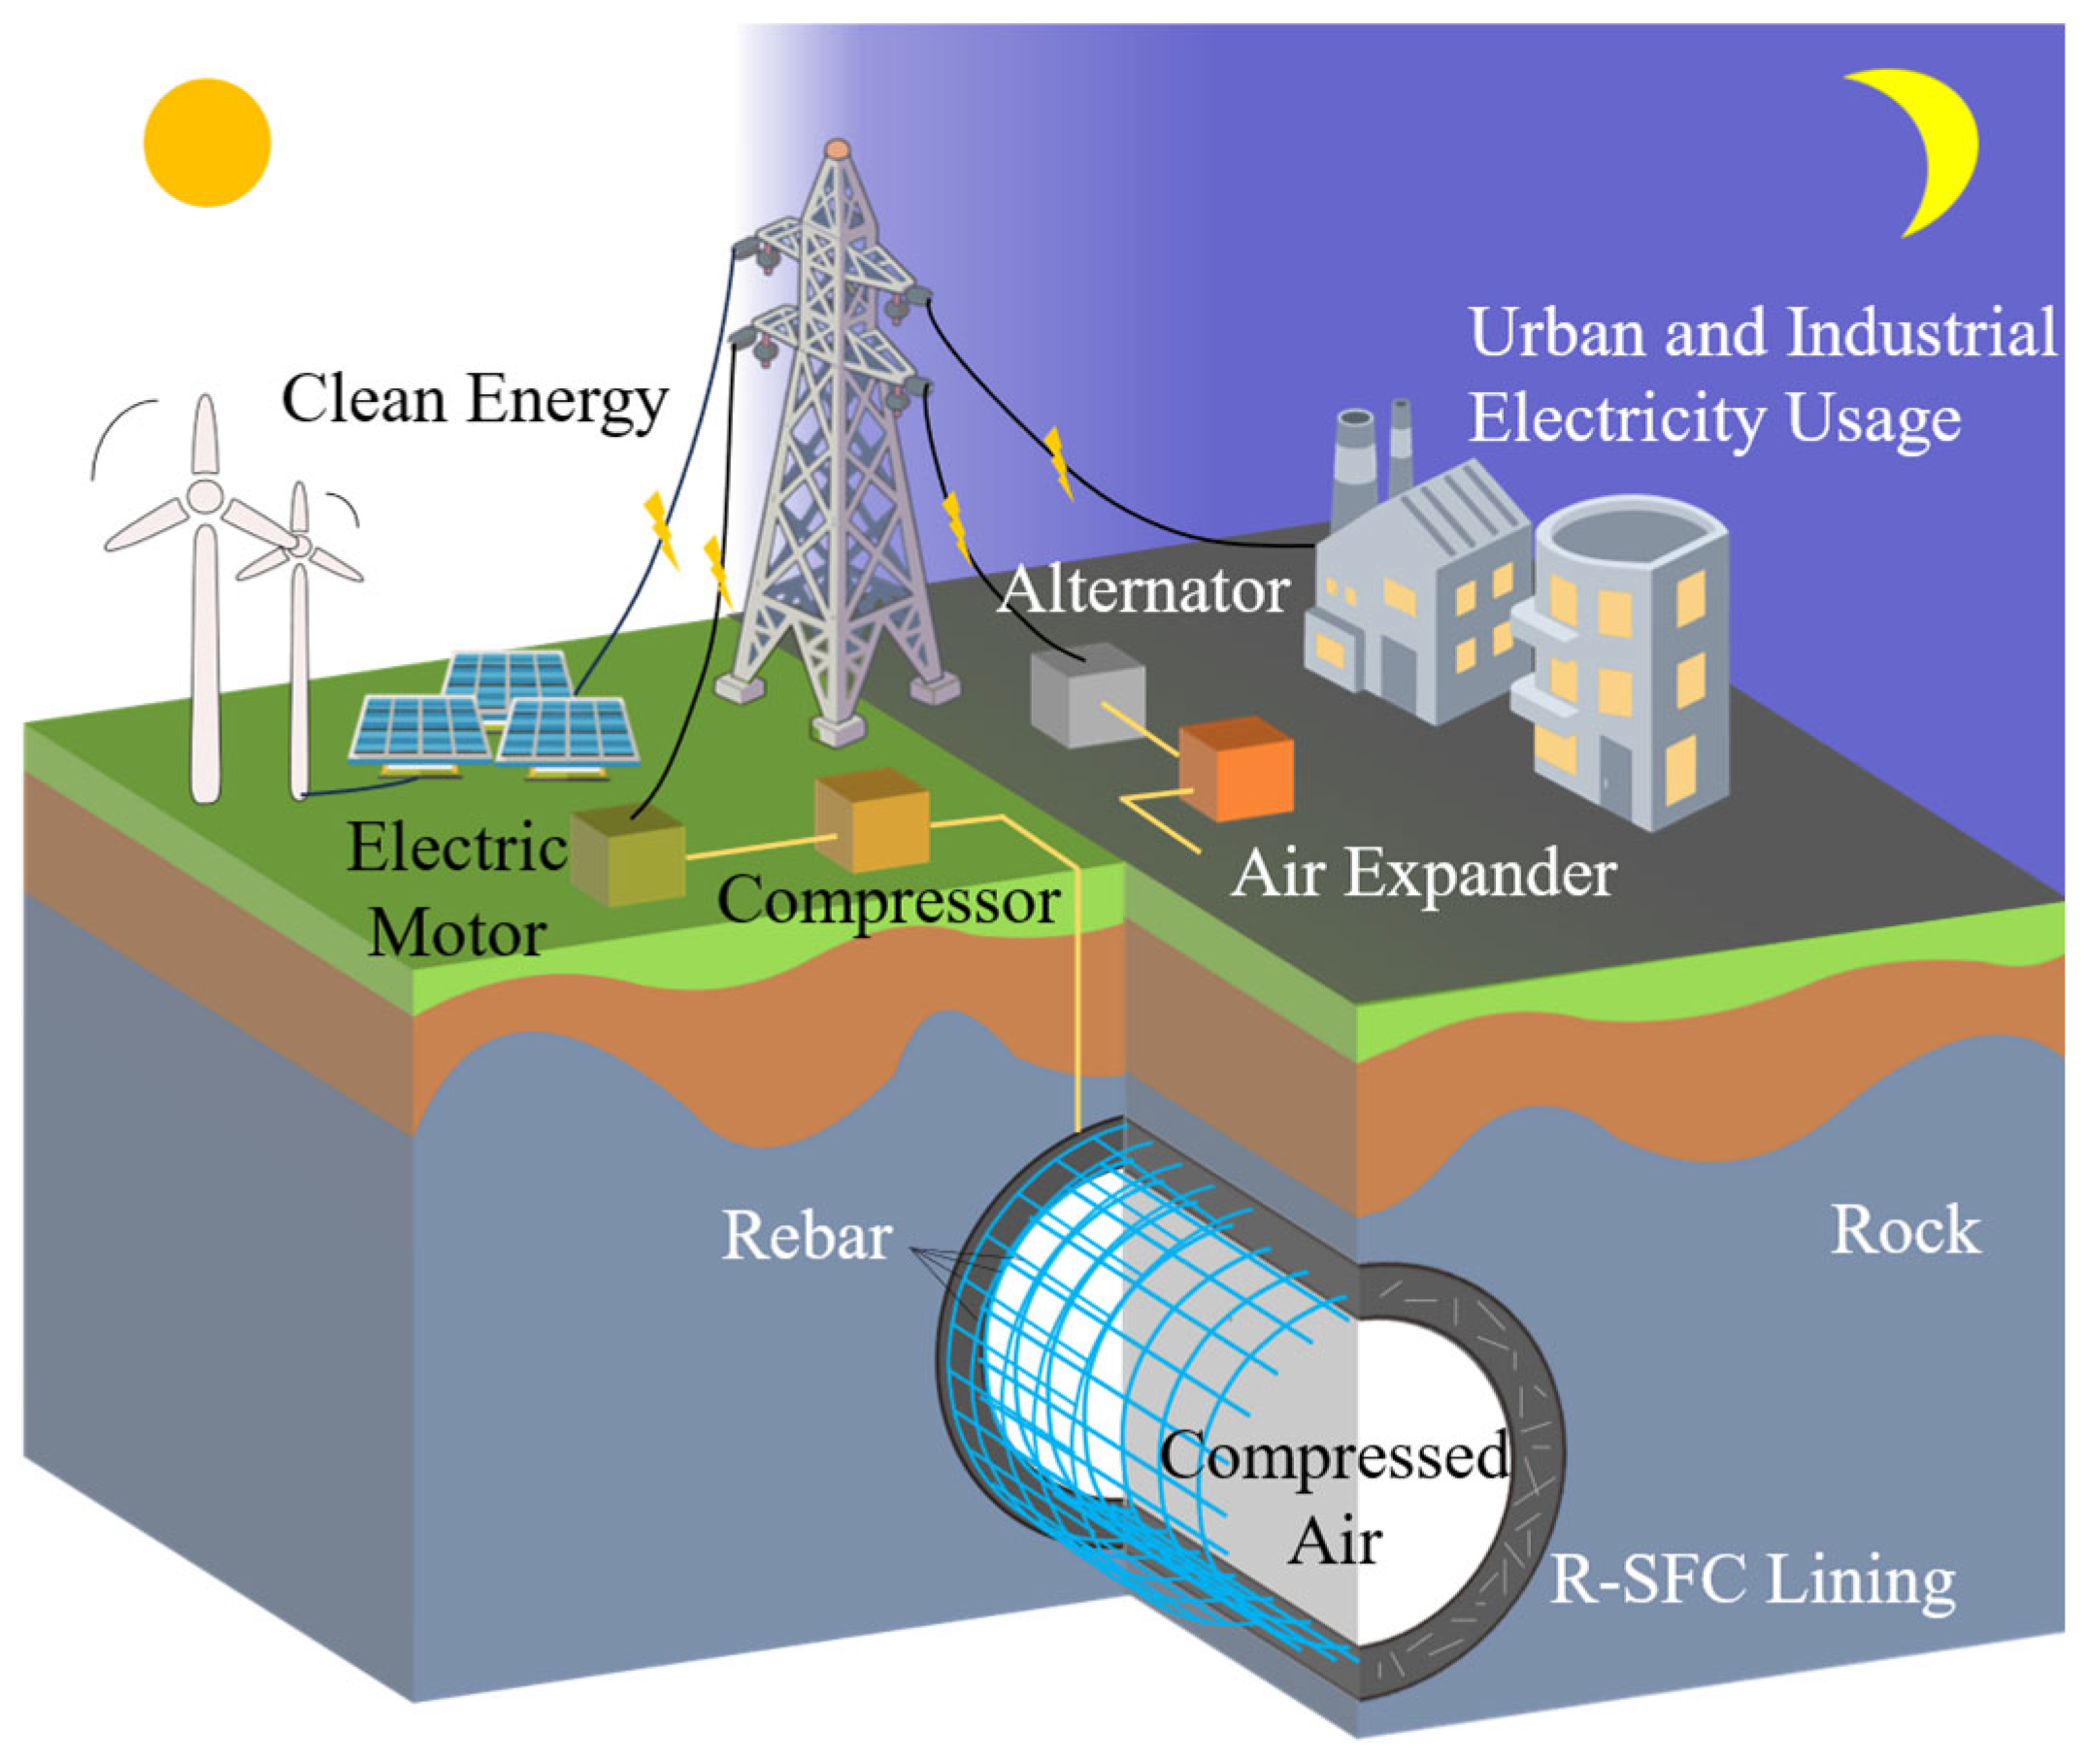
In addition, intelligent optimisation algorithms such as particle swarm optimisation, multi-objective genetic algorithms, and improved ant colony algorithms have been widely applied to structural design problems for balancing safety, economy, and efficiency [35,36,37], but existing CAES lining design optimisation has typically evaluated the influence of a small number of design variables on a single performance indicator, or adopted low-dimensional multi-objective formulations evaluated directly through finite element analysis [38]. An R-SFC lining for CAES caverns involves multiple interrelated fibre, rebar, and geometric parameters and must satisfy structural damage control while also accommodating storage capacity, which requires an efficient multi-parameter optimisation method. To address these gaps, this study introduces an R-SFC lining (as illustrated in Figure 1) for CAES caverns as the structural load-bearing layer, quantifies the influence of key design parameters on its damage evolution under cyclic gas pressure and temperature loading, and performs surrogate-assisted multi-objective optimisation of the lining configuration to balance lining tensile damage against cavern diameter, thereby reducing the dependence of cavern siting on surrounding rock strength.
Figure 1.
Schematic diagram of underground CAES system with R-SFC liner gas storage cavern.
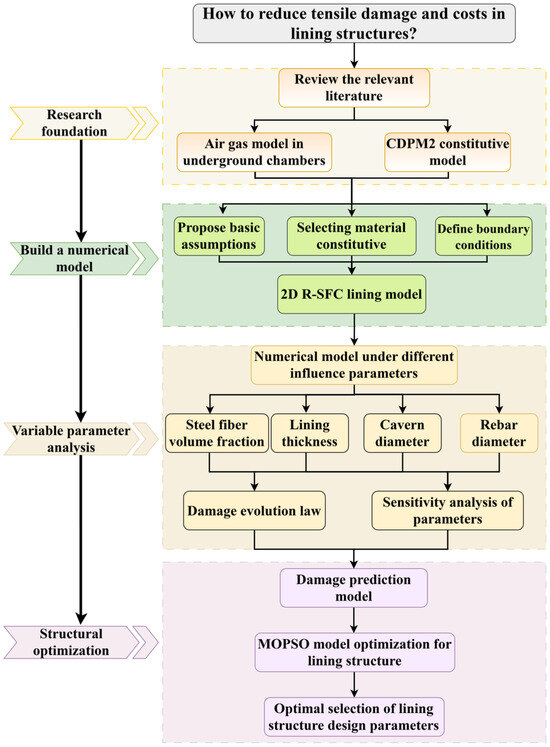
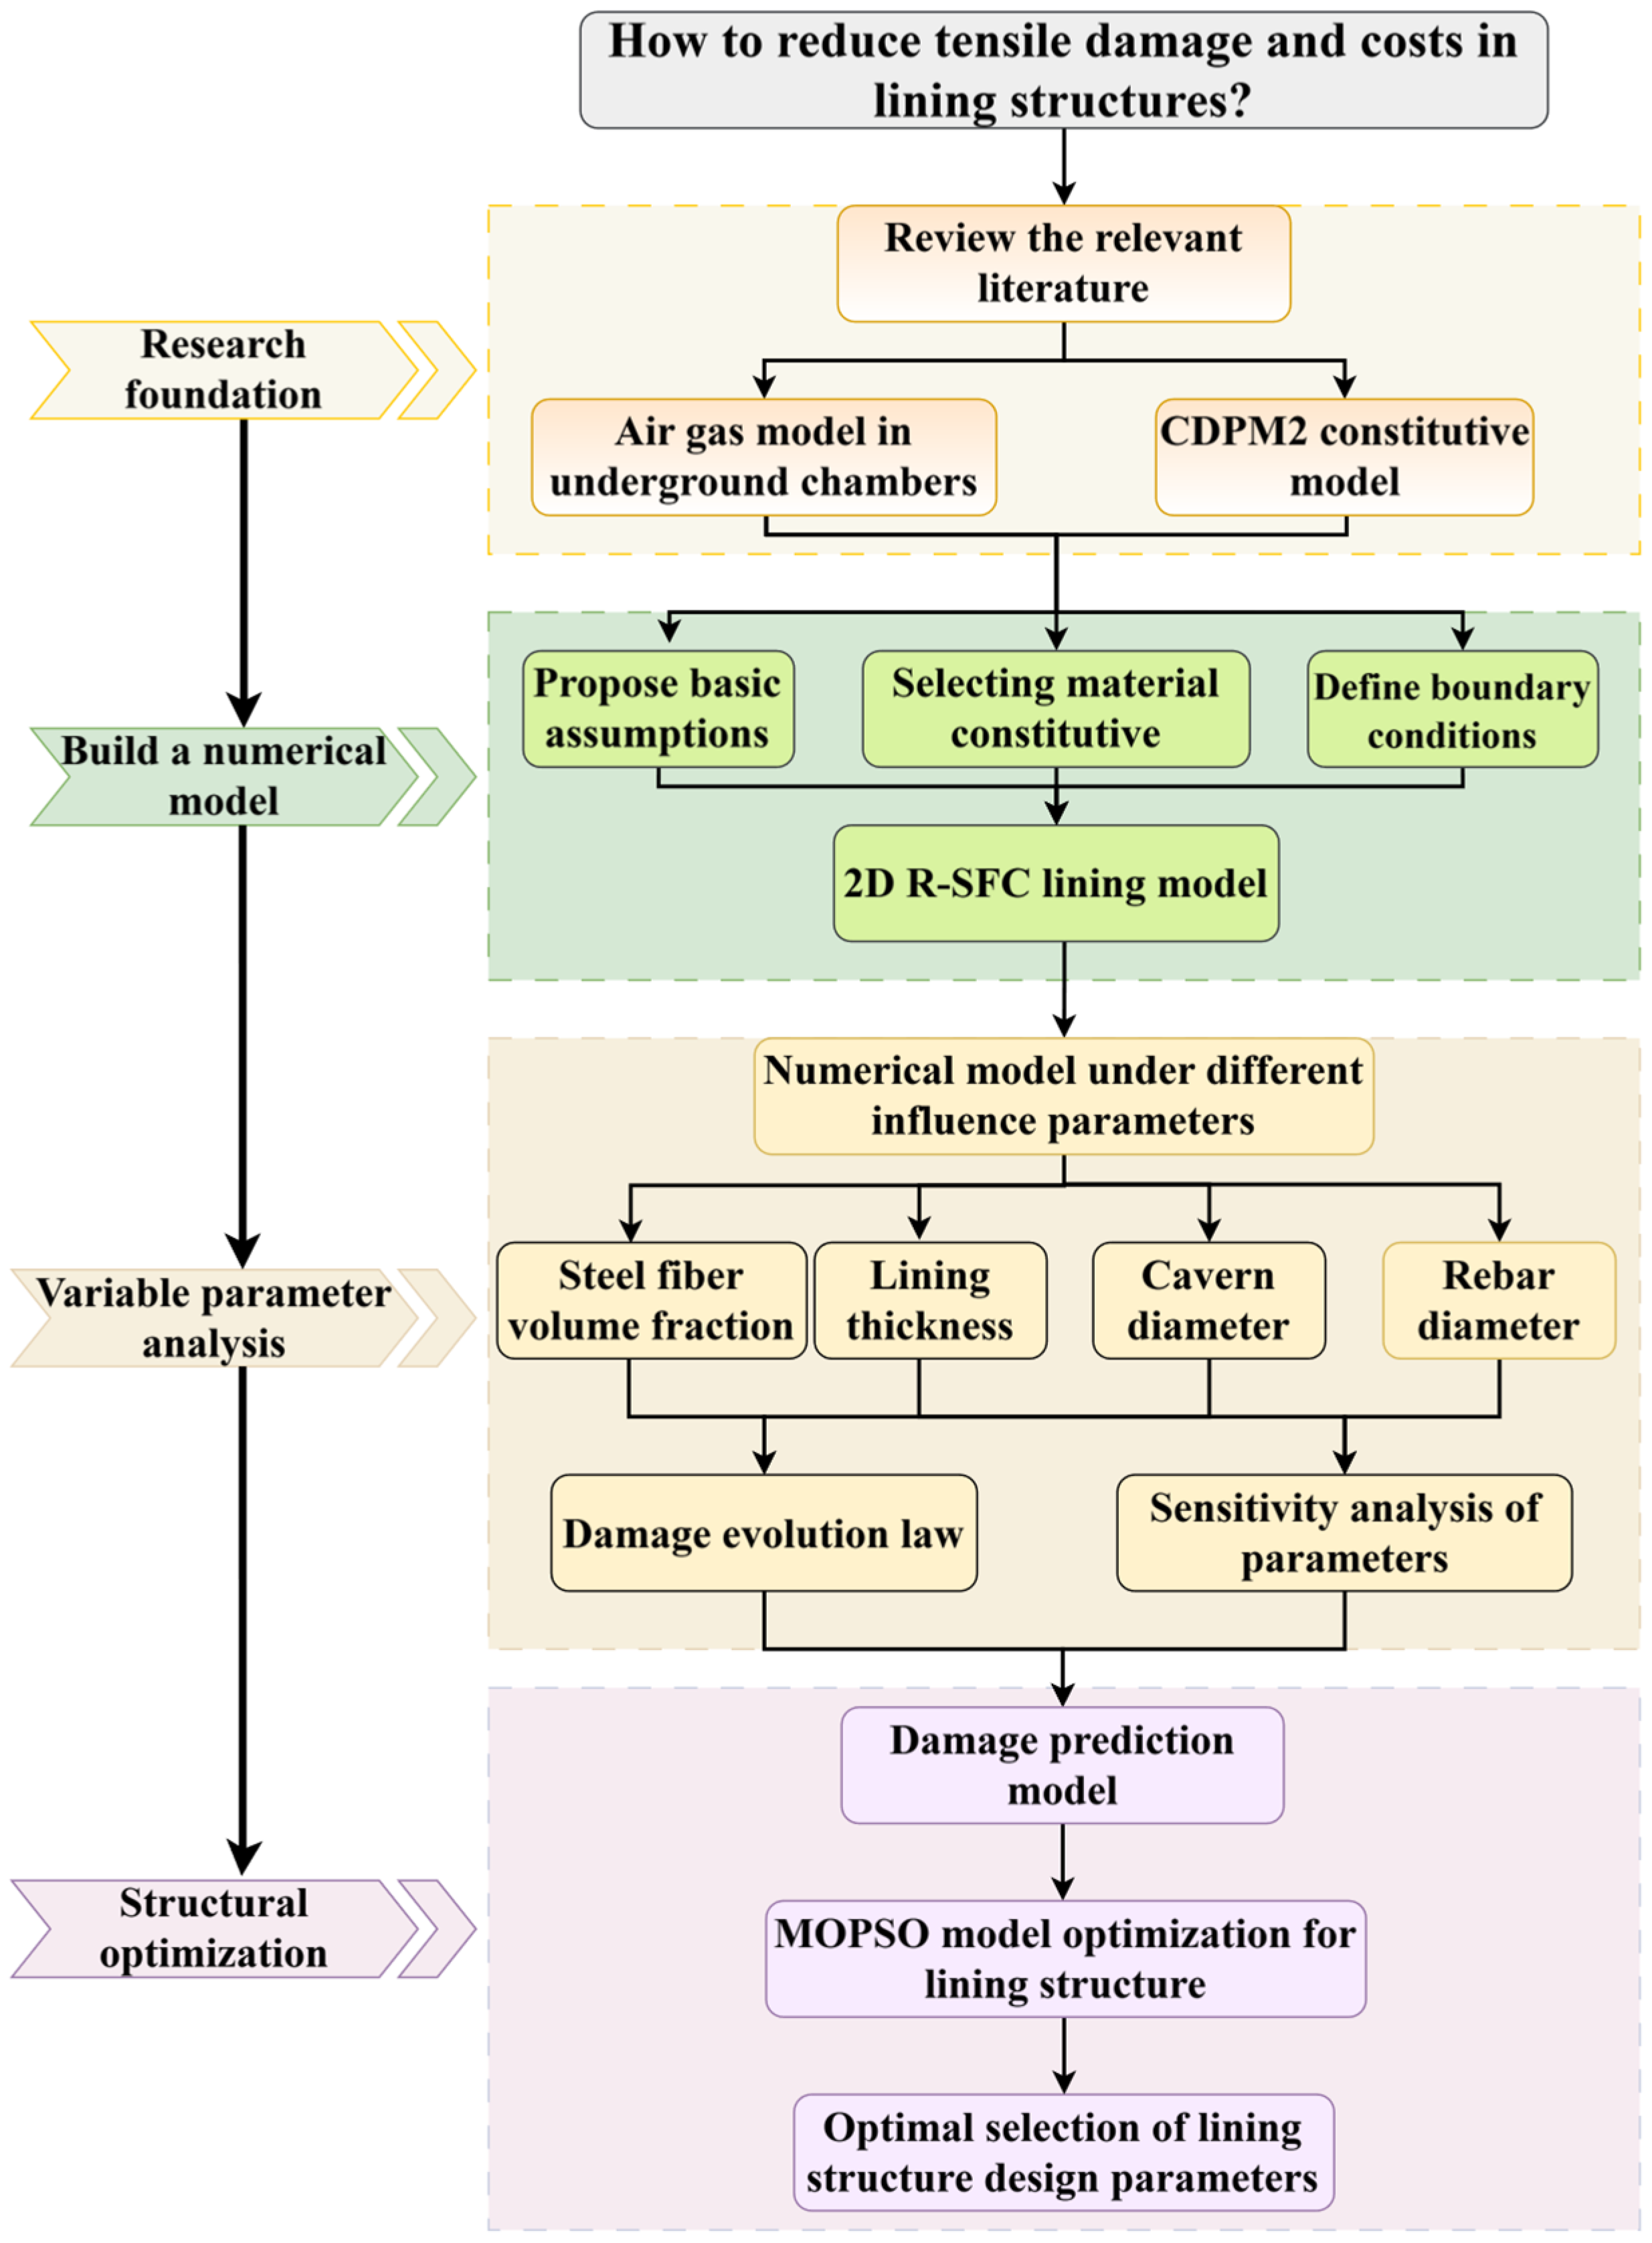
Accordingly, a coupled thermo-mechanical damage-plasticity model was established in COMSOL Multiphysics to simulate the R SFC lining system. The influence of key parameters (including steel fibre volume fraction, lining thickness, rebar diameter, and cavern diameter) on the linings’ mechanical response, tensile damage, and internal stress in the surrounding rock was analysed and compared across alternative design schemes. On this basis, a particle swarm optimisation backpropagation (PSO-BP) surrogate model was integrated with a multi-objective particle swarm optimisation (MOPSO) algorithm to balance lining tensile damage against cavern diameter, yielding a Pareto front that quantifies their trade-off. Figure 2 illustrates the framework of this study.
Figure 2.
Framework of this study.
2. Numerical Model Establishment of R-SFC Lining
2.1. Geometry and Applicability of the 2D Plane Strain Model
2.1.1. Geometry and Basic Assumptions
Underground lined rock caverns are typically constructed in deeper and high-strength rock layers, with shapes mostly being cavern-shaped (i.e., horizontal cylindrical). The structure of the lined rock cavern, from the inside out, consists of three parts: a fibre sealing layer, an R-SFC lining layer, and a surrounding rock layer. Each part is treated with filling or smoothing to ensure full contact between the layers. To establish a computationally efficient yet representative 2D plane strain model based on the vertical cross-section of the lined rock cavern, the following key assumptions are adopted:
- (1)
- The volume of the rock cavern remains constant;
- (2)
- The surrounding rock and steel reinforcement are isotropic materials;
- (3)
- Due to good contact between the surrounding rock and the lining layer, and between the lining layer and the FRP fibre sealing layer, the thermal resistance is zero;
- (4)
- Air leakage is neglected;
- (5)
- The bond slip between the rebar and SFRC is ignored;
- (6)
- The air inside the cavern is uniformly distributed, so the pressure and temperature on the cavern walls are uniform;
- (7)
- Other parameters are simplified based on the equivalent thickness criterion.
2.1.2. Applicable Conditions for the 2D Plane Strain Model
Considering that the axial end zones are normally strengthened with enlarged cross-sections and higher-grade concrete in practical CAES caverns to reduce end zone damage and guarantee airtightness, this study identifies the main cavern segment as the governing region for lining design. The CAES underground cavern is a horizontal cylindrical structure whose axial dimension is much larger than its radial direction, and the loads do not vary axially. Under these conditions, the plane strain assumption (axial strain ε z ≈ 0) can be reasonably adopted. The depth of the cavern is relatively large, and the three-dimensional constraint effect of the surrounding rock is significant. In this main segment, lining damage is governed primarily by circumferential tensile stress, which mainly acts in the radial–circumferential plane and controls crack initiation and propagation. The 2D model effectively captures the dominant thermo-mechanical response within that plane and is therefore suitable for parametric analyses at the preliminary design stage.
Admittedly, the 2D treatment inevitably overlooks several three-dimensional effects, including the stress concentration at the axial ends of the cavern and the three-dimensional stress redistribution of the surrounding rock under cyclic thermal loading. These simplifications and their influence are summarised in Table 1.
Table 1.
Limitations and impacts of the numerical model in this study.
Although the three-dimensional stress redistribution introduces an underestimation of tensile damage, the damage deviation is small in magnitude for caverns with an axial dimension much larger than the radial one. Moreover, the maximum damage in similar lined caverns under normal cyclic operation has been shown to be approximately 20% [39]. Even if this deviation is added to the 2D predictions, the total damage remains well below the level that could cause through-thickness cracking. Therefore, the 2D predictions are conservative and safe for the parametric study. Furthermore, under identical geometric and loading conditions, this underestimation is consistent across different design configurations, which means it does not alter the comparative trends among design alternatives. The high computational efficiency of the 2D model further makes it feasible for the extensive numerical calculations required in this work.
2.2. Thermodynamic Control Equation
Because the mechanical load on the lining originates from the compressed air storage, the first step is to determine the time-varying internal pressure and temperature. Based on the above assumptions, when the initial state of the cave wall is regarded as the constant volume boundary, the thermodynamic state of the air inside the cave can be expressed using the cave thermodynamic control equation proposed by Kushnir et al. [40]. This equation characterises the dynamic relationship between the air mass flow rate and the ratio of inflation to deflation time under constant cave volume conditions:
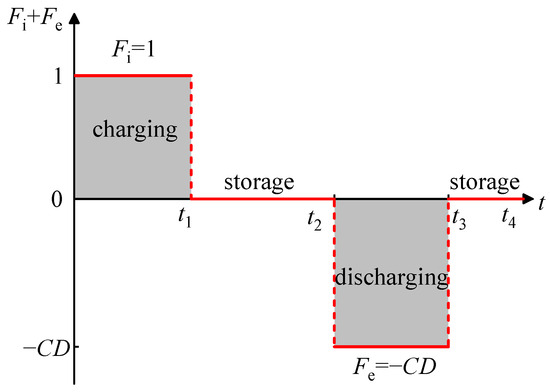
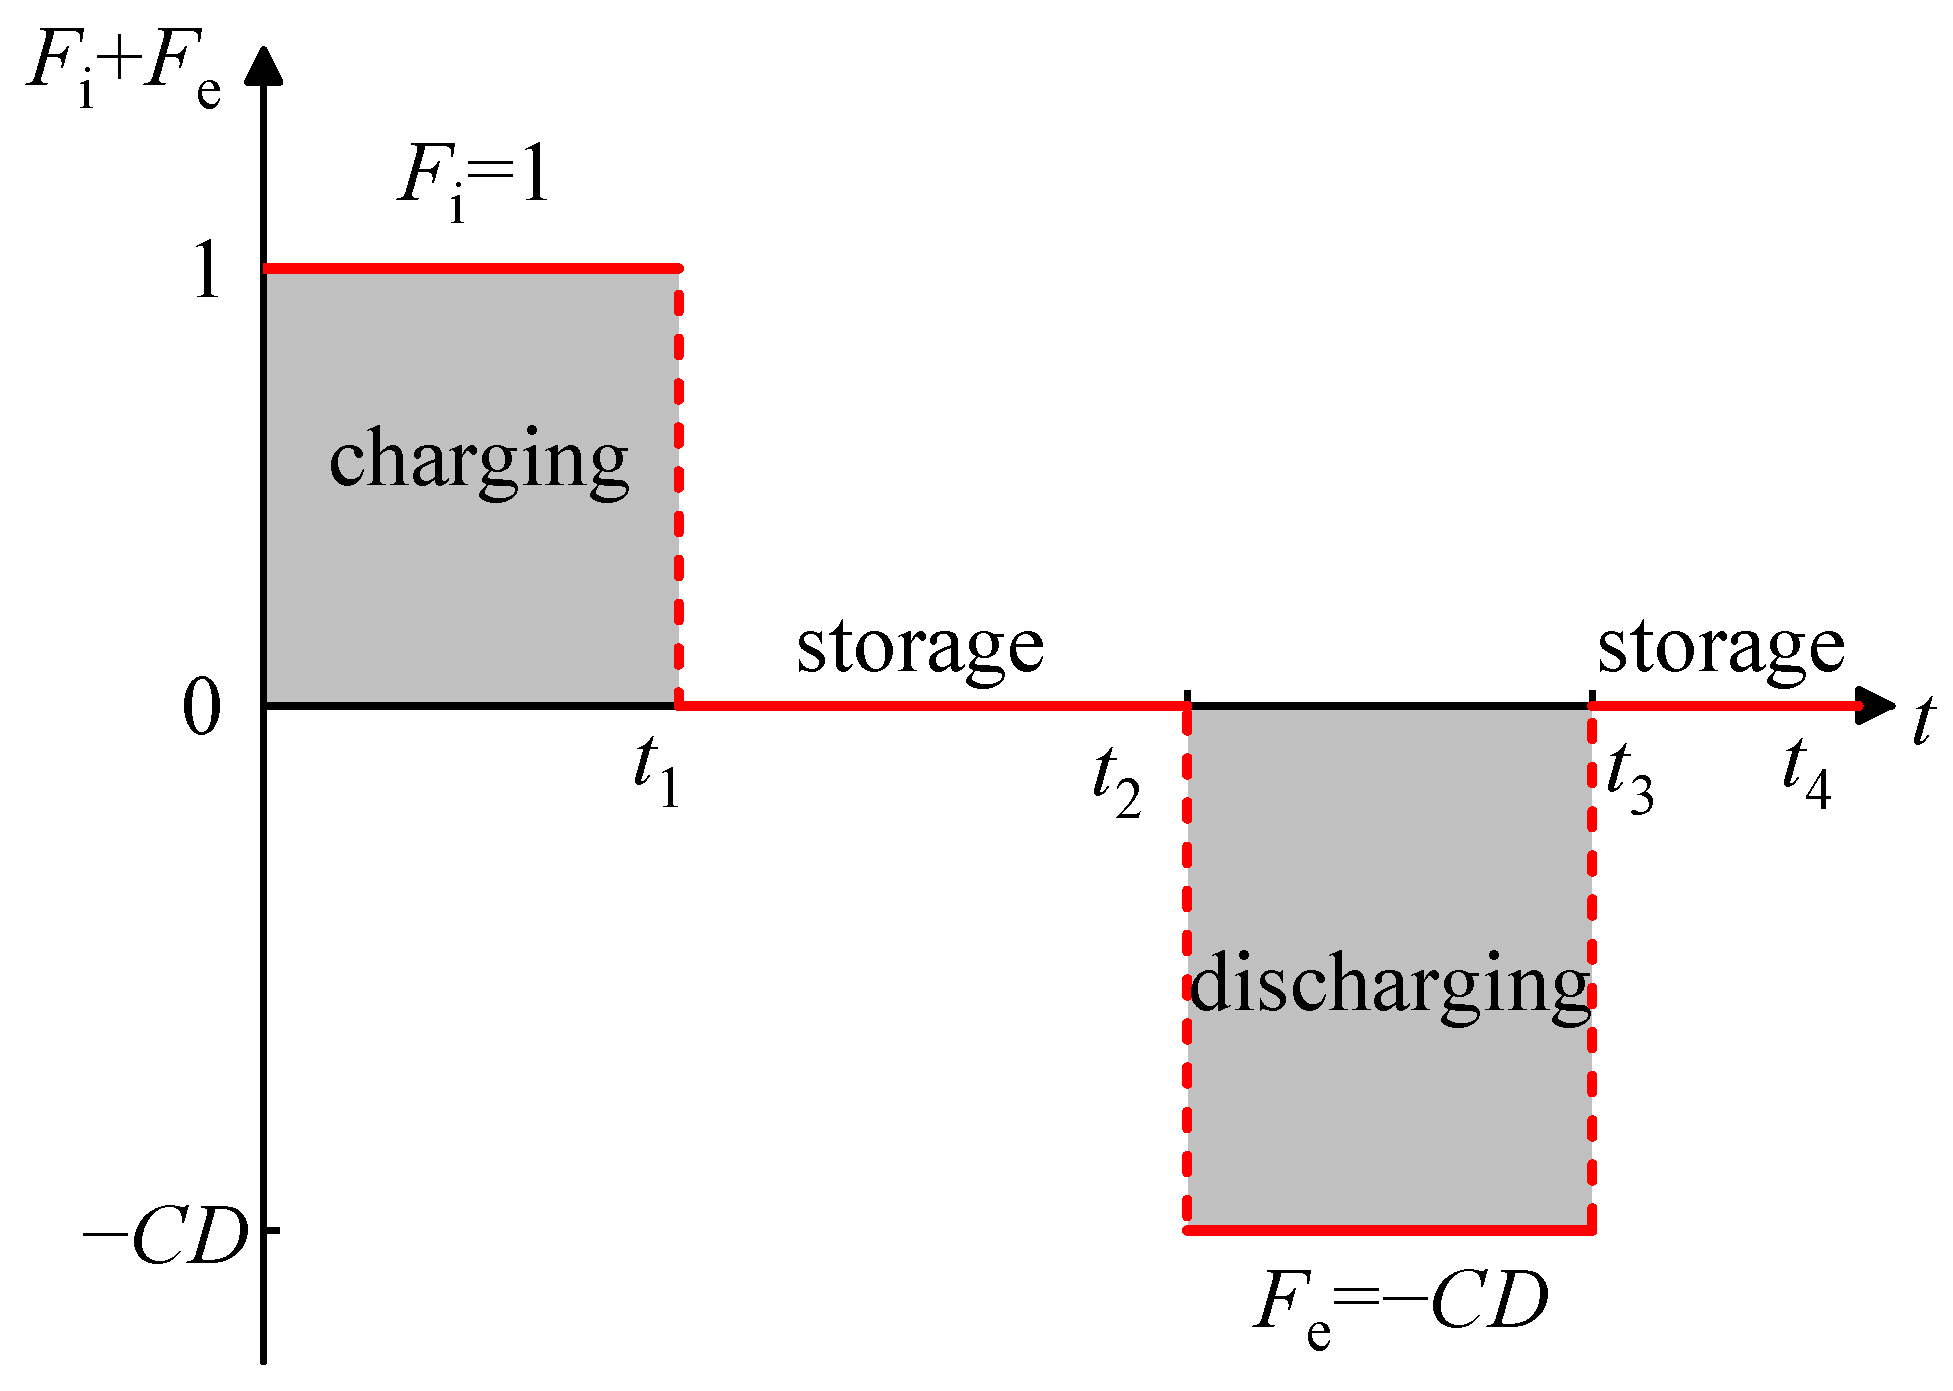
where V is the volume of the cavity; mc is the mass flow rate of air; Fi and Fe are the dimensionless relative mass flow rates during the charging and discharging stages, respectively, and their sum (Fi + Fe) is shown in Figure 3; CD is the charge–discharge time ratio.
Figure 3.
Variation in Fi + Fe during a charge–discharge cycle.
The energy conservation equation considers the enthalpy change in injected air, the internal energy change in air inside the tunnel, and the convective heat transfer on the tunnel wall:
where ; ; is the instantaneous density of air; and are the specific heat capacities of air at constant volume and constant pressure, taken as 718 J·kg−1·K−1 and 1005 J·kg−1·K−1, respectively; is the specific constant of air, taken as 287 J·kg−1·K−1; and are the temperature of injected air and the instantaneous temperature of the air inside the cavern, respectively, with Ti set to 20 °C; is the initial temperature inside the cavern, set to 20 °C; is the initial air density, taken as 1.205 kg·m−3; is the convective heat transfer coefficient, taken as 0.1 W·m−2·K−1; is the surface area of the cavern wall; is the temperature of the cavern wall; is the partial derivative of Z to temperature under the initial state (, ); Z is the air compression coefficient, derived from the Berthelot gas state equation:
where T is the air temperature; p is the air pressure; is the air temperature at the critical state, taken as −140.7 °C; is the air pressure in the critical state, taken as 3.77 MPa.
The pressure inside the cavern is derived from the generalised gas state equation:
The pressure and temperature on the inner surface of the gas storage rock cavity wall at any given time can be calculated using Equations (1)–(4) above, so the fluid calculation of the air inside the cavity can be omitted when constructing a two-dimensional model for simulation.
2.3. Constitutive Model for Materials
To analyse the structural response and damage under the above thermo-mechanical load, the constitutive relationships of all solid components need to be defined. This study’s constitutive model primarily comprises four components: the FRP sealing layer, the SFRC lining layer, rebar within the lining, rock layers, and the excavation-disturbed zone (EDZ), which is the region in the surrounding rock mass where strength and stiffness are reduced due to excavation damage.
2.3.1. FRP Sealing Layer and Steel Rebar
Both the FRP sealing layer and the reinforcing steel rebar are modelled as linear elastic isotropic materials. This simplification is justified because the FRP’s primary function is sealing rather than load-bearing, and the tensile stress on the steel rebar is far below its yield stress.
2.3.2. Concrete and SFRC Lining Layer
The concrete and SFRC lining are the primary load-bearing components whose potential damage and cracking are central to this investigation. Therefore, the concrete damage-plasticity model (CDPM2) proposed by Grassl [41] is employed to capture their complex nonlinear behaviours under multi-axial loading. Specifically, this model utilises two non-independent plastic and damage variables to separately describe the failure characteristics of concrete under tension (cracking) and compression (crushing) actions, respectively, to accurately reflect the enhancement effects of steel fibres on concrete’s various failure modes.
The constitutive model is based on the following stress–strain relationship:
where and represent the positive and negative parts of the effective stress tensor, respectively; and are the tensile and compressive scalar damage variables, respectively, with values ranging from 0 (undamaged) to 1 (fully damaged).
The effective stress tensor is defined as follows:
where is the elastic stiffness tensor based on the elastic modulus and Poisson’s ratio; and are the strain tensor and plastic strain tensor, respectively.
In addition, given that explicit representation of individual steel fibres within steel fibre-reinforced concrete (SFRC) in a two-dimensional model is not feasible, this study adopted a homogenization modelling method. The constitutive parameters of SFRC at fibre volume fractions of 0.5% to 1.5% were obtained as the product of the standard strength values of C40 plain concrete and the strength ratios of SFRC to plain concrete. These standard values, including the axial compressive strength of 26.8 MPa, the axial tensile strength of 2.39 MPa, and the elastic modulus of 32.5 GPa, are taken from GB/T 50010-2010 [42]. Correspondingly, the compressive strength ratio, tensile strength ratio, and elastic modulus ratio of SFRC at the four fibre volume fractions, derived from the cube compressive, splitting tensile, and flexural toughness tests reported by Zhang [43] under GB/T 50081-2002 and CECS 13:2009, are summarised in Table 2. Meanwhile, to capture crack propagation in the lining, the fracture energy must be incorporated into the numerical computation. The plain concrete fracture energy values listed in Table 3 are taken from the data reported in previous research [44]. Correspondingly, the SFRC fracture energy values at fibre volume fractions of 0.5%, 1%, and 1.5% are obtained by multiplying the concrete values by the increase ratios (11, 15, and 21, respectively) determined by Kazemi et al. [45] from the three-point-bend tests on notched cylindrical specimens.
Table 2.
Strength ratios and elastic modulus ratio of concrete with different steel fibre volume fractions.
Table 3.
Fracture energy of concrete and SFRC with different lining thicknesses.
2.3.3. Rock Layer and EDZ
The surrounding rock provides the external boundary constraint for the lining system. Both the rock layer and EDZ use the soil plasticity interface built into the COMSOL Multiphysics 6.2 software. To speed up the computation, the Drucker–Prager criterion is used as the constitutive model for the rock layer, while the Mohr–Coulomb criterion is used to ensure the accuracy of the results. The material properties of the five components in Table 4 are adopted from [24].
Table 4.
Material properties [24].
2.4. Building Numerical Models and Boundary Conditions
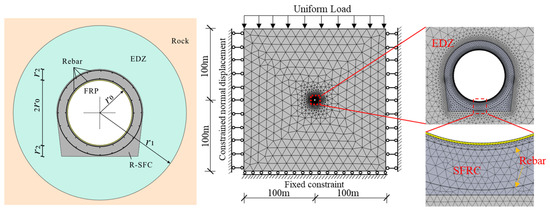
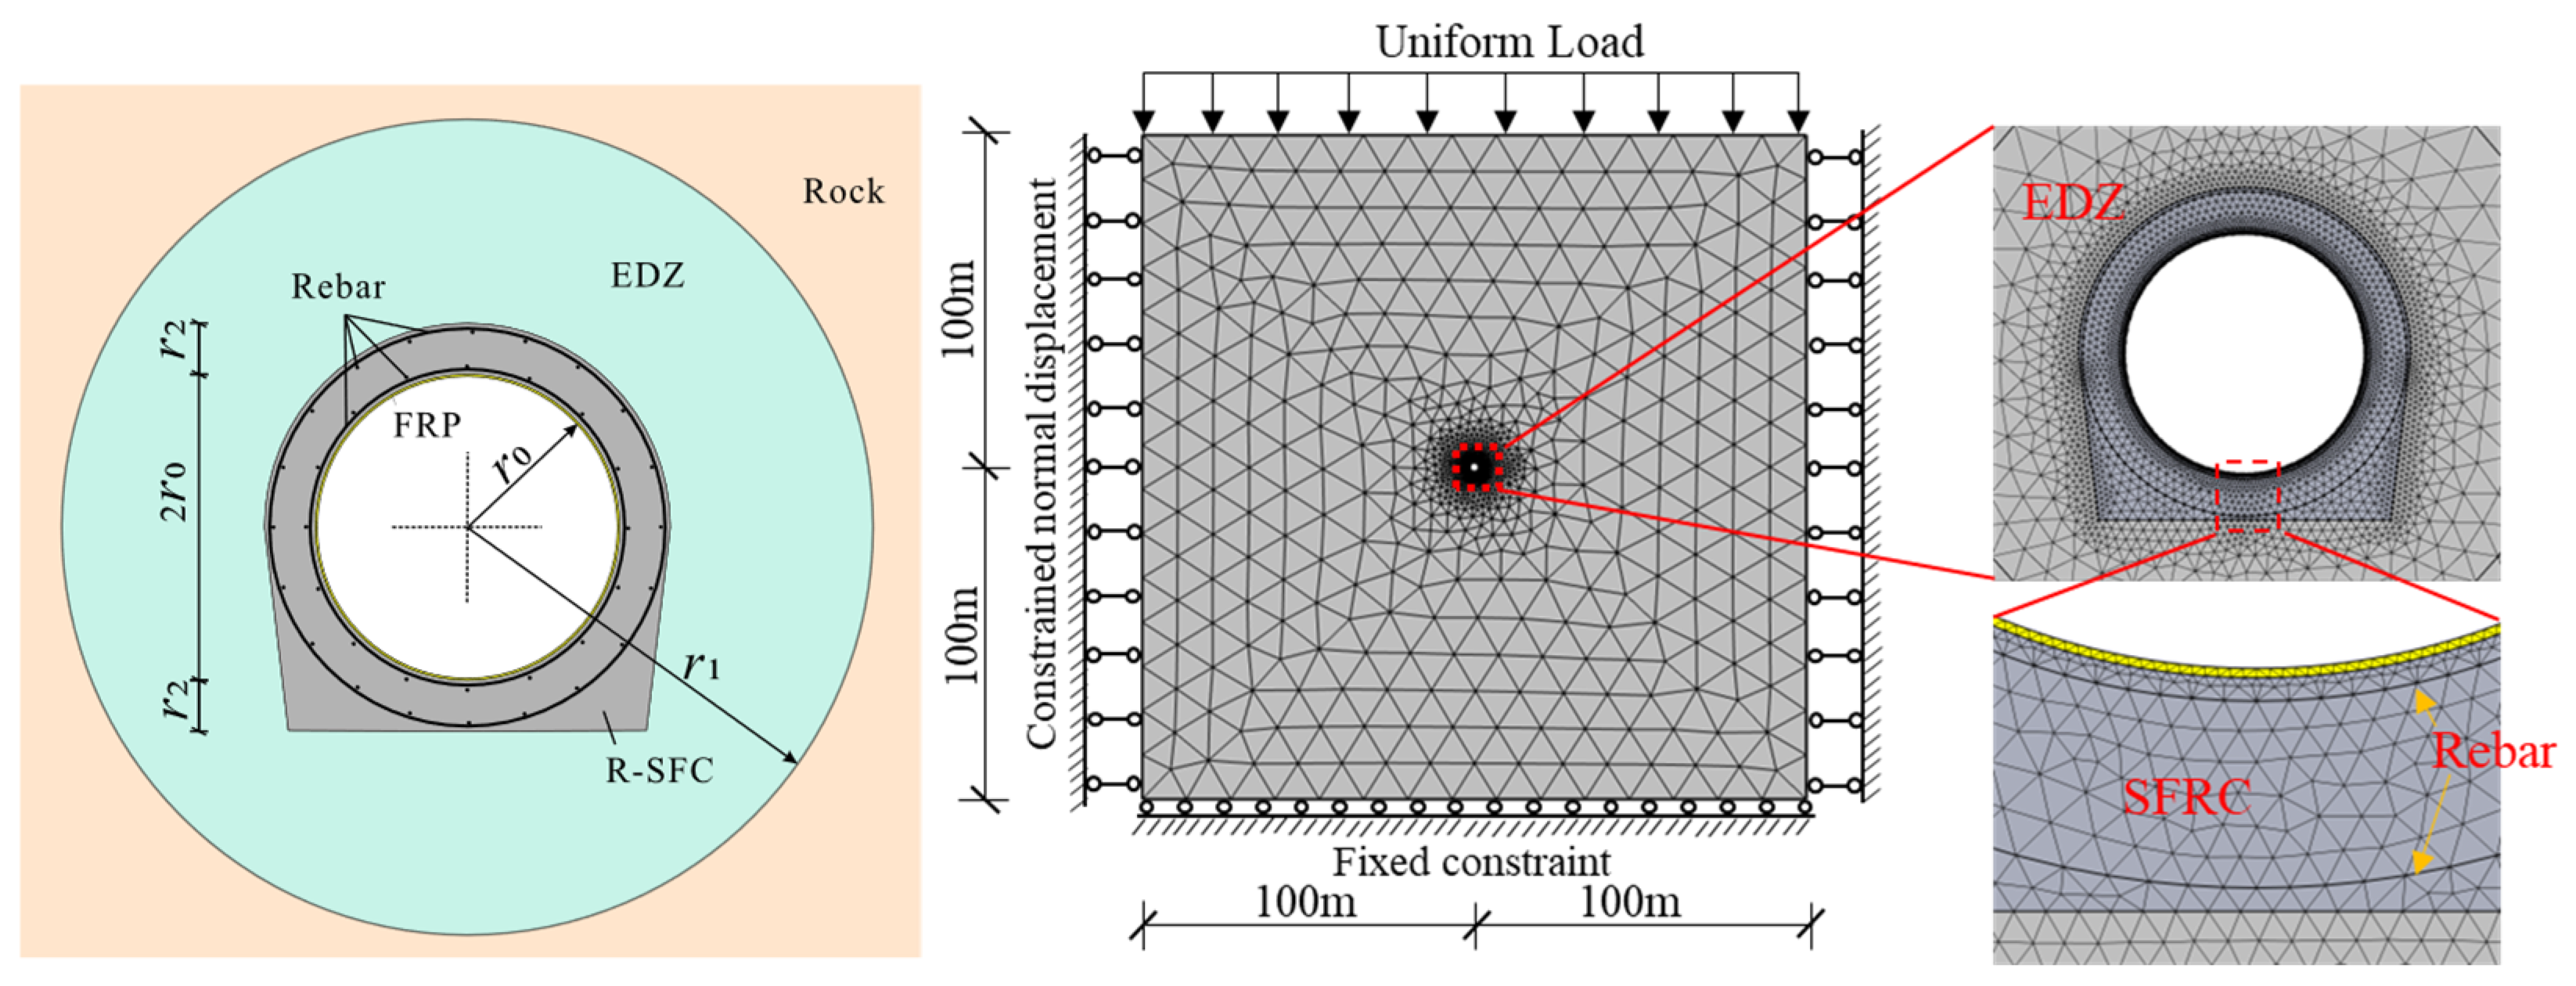
Based on the fundamental assumptions, relevant thermodynamic formulas, and basic properties of various materials, the final 2D finite element model of an underground lined gas storage cavern is conducted in COMSOL software for plane strain analysis, calculating whether the mechanical performance of the R-SFC lining meets the relevant requirements. The model and meshing are shown in Figure 4, where r0, r1, r2 represent the cavern radius, EDZ radius, and lining thickness, respectively. To avoid size effects, the model domain is set as a square with a side length of 200 m, and the gas storage lined cavern is placed at the centre of the model. Mesh refinement is applied to the central lining cavern area, while mesh coarsening is used for the rock layer regions, resulting in a total of 8032 domain elements and 1204 boundary elements.
Figure 4.
Planar model dimensions and boundary conditions diagram.
Solid mechanics boundary condition settings: The initial air pressure in the cave is set to one standard atmospheric pressure. The bottom of the model is fixed with constraints, the top is set as a free boundary, and considering the calculations of in situ stress equilibrium and the deformation and stress caused by the body load of the model, only normal displacement constraints are applied to the sides of the model.
Solid heat transfer boundary conditions set up: the initial temperature of the model is set to 20 °C. Heat flux boundaries are applied to all four sides of the model, with external temperatures uniformly set at 20 °C. The bottom and side boundaries are set to be in contact with external rock layers, with a heat transfer coefficient of 1.75 W·m−2·K−1; the top boundary is set to be in contact with air, with a heat transfer coefficient of 5 W·m−2·K−1.
Dynamic boundary conditions for each charge–discharge cycle: A single cycle spans 16 h and comprises three consecutive periods, namely a charging period from 0 h to 6 h, a storage period from 6 h to 14 h, and a discharging period from 14 h to 16 h. This yields a charge-to-discharge time ratio (CD) of 3 and a cycle frequency of 1.5 cycles per day.
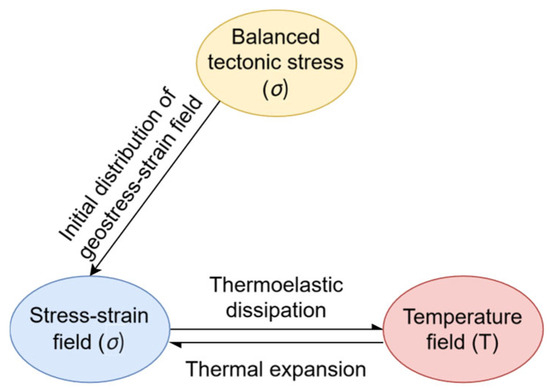
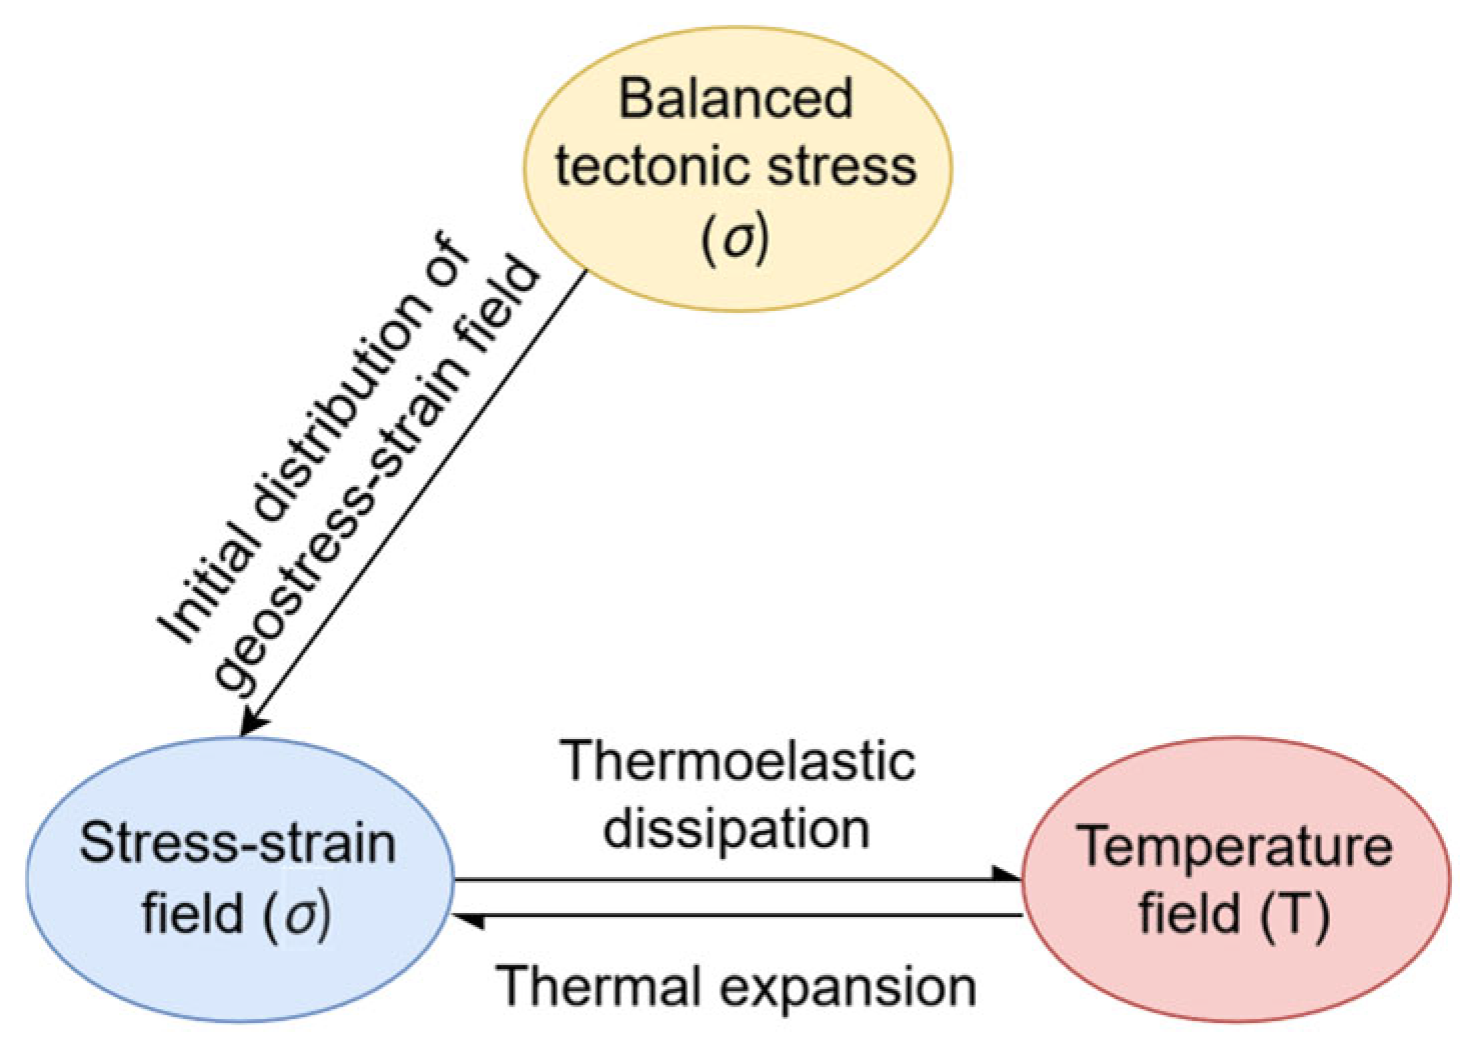
Within each cycle, the transient pressure and temperature on the cavern inner wall are governed by Equations (1)–(3), which together characterise the pressure cycling curve and the temperature fluctuation pattern, respectively. The temperature transmitted to the inner surface of the lining rock cavity is obtained from these equations, and the corresponding internal pressure is then determined by substituting the relevant parameters into Equation (4). The calculated pressure and temperature are imposed as boundary conditions on the inner surface of the FRP sealing layer. Utilising the built-in solid mechanics and heat transfer modules of COMSOL software, the mechanical properties and temperature field of the steel-reinforced R-SFC lining gas storage cavity under thermo-mechanical coupling can be obtained through the multi-physics coupling illustrated in Figure 5.
Figure 5.
The interaction relationship between crustal stress, stress field, and temperature field.
3. Numerical Simulation Results and Analysis
3.1. Temperature and Pressure in the Cavern
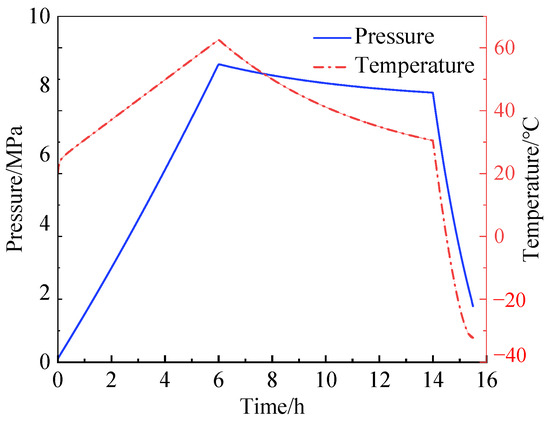
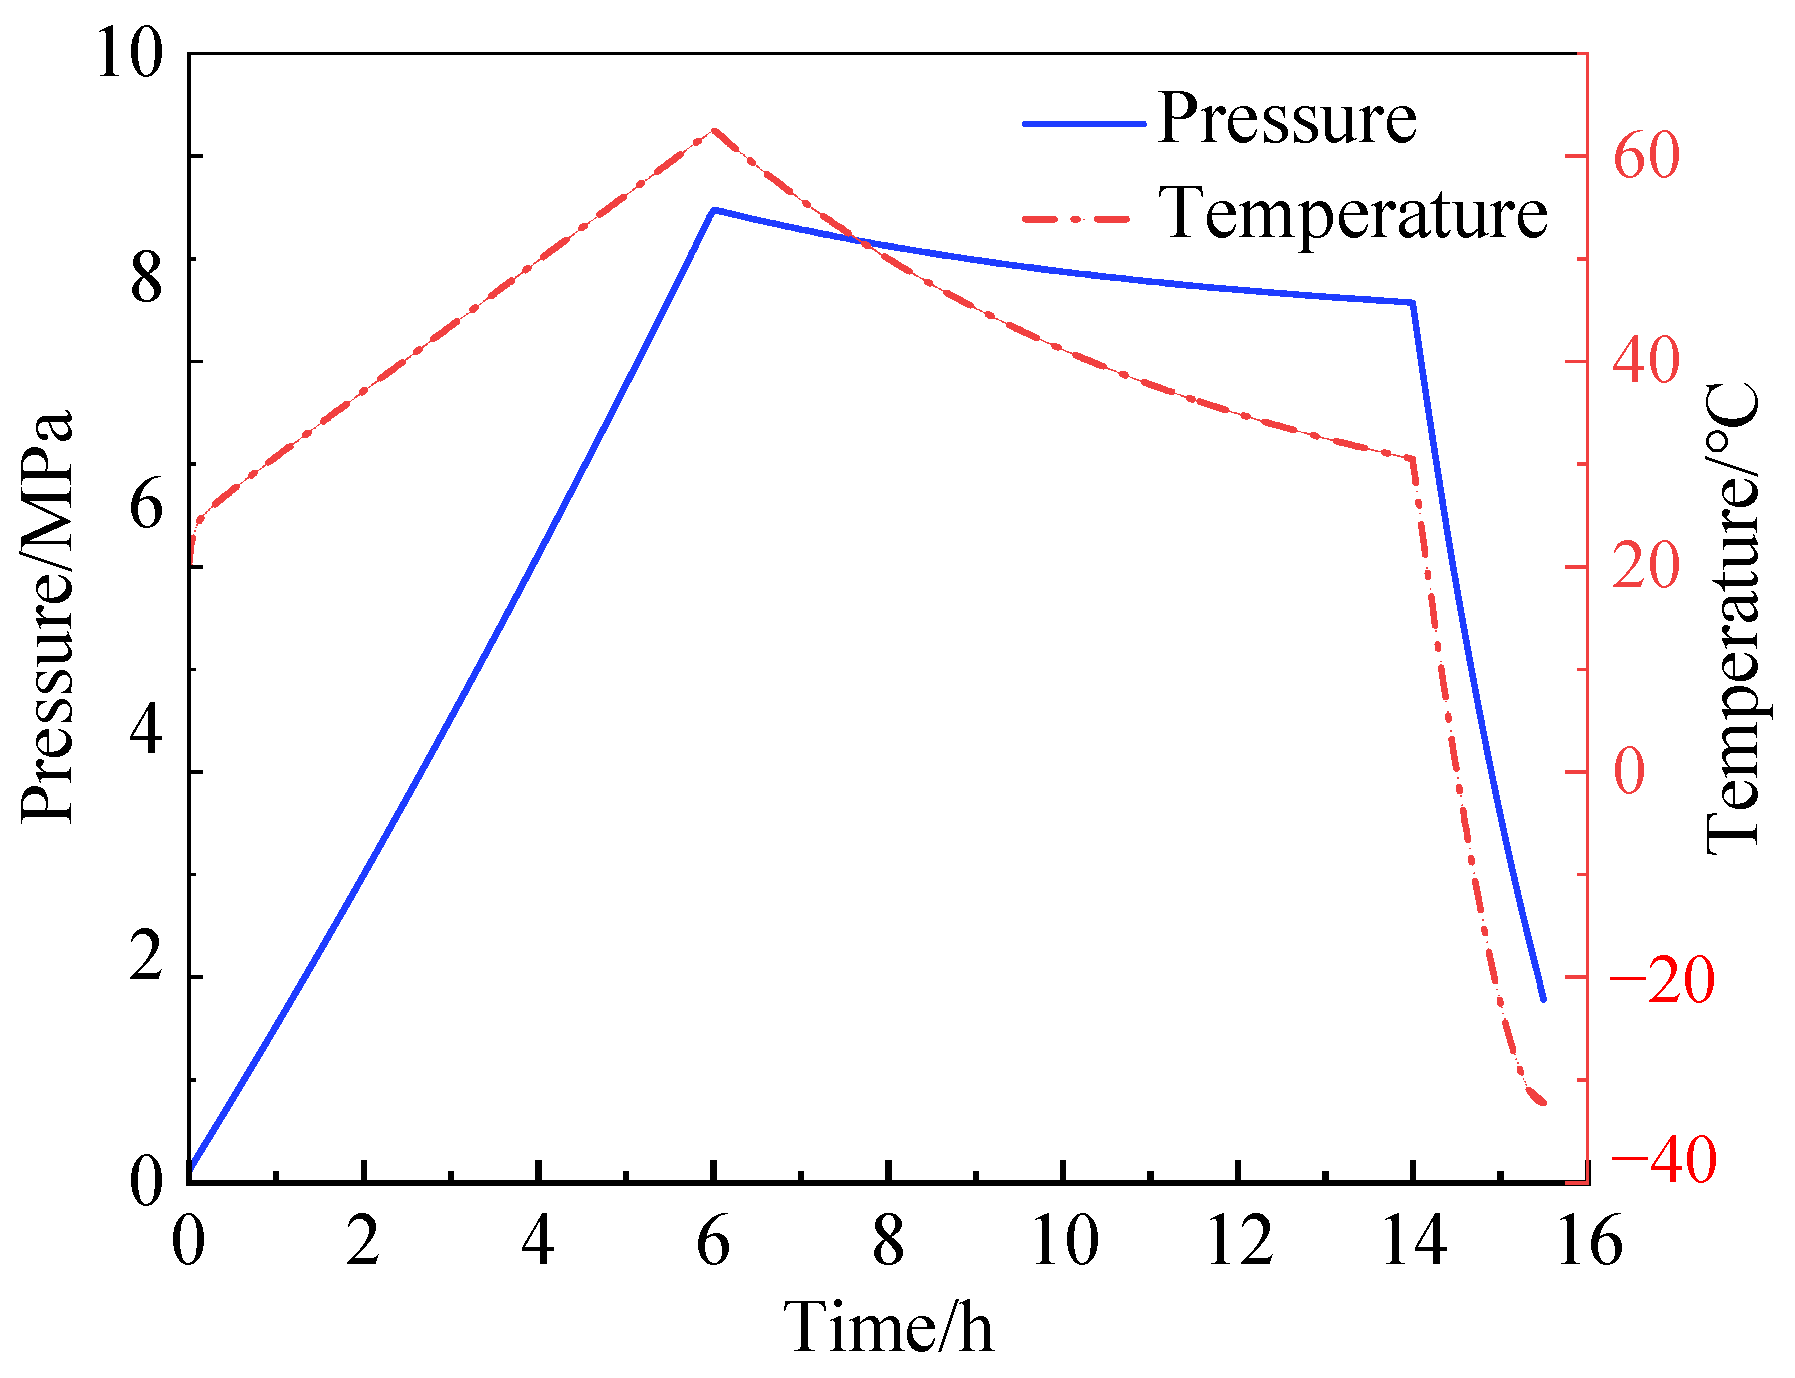
Based on the aforementioned internal wall pressure–temperature formula and the dynamic boundary conditions defined in Section 2.4, the temperature and pressure curves on the cave’s inner surface for one complete charging and discharging cycle are shown in Figure 6.
Figure 6.
Temperature–pressure curve.
The temperature and pressure changes during the first three periods exhibit good correlation, with the highest temperature reaching 62.5 °C and the maximum pressure being 8.73 MPa on the cave’s inner surface. The initial pressure on the cave wall’s inner surface is 1 standard atmosphere, and the temperature shows an initial rapid increase followed by a slower growth due to heat transfer within the lining’s solid material. Quantitatively, the solved cyclic response yields a pressure fluctuation amplitude of 8.63 MPa (from 0.1013 MPa to 8.73 MPa) and a temperature fluctuation amplitude of 42.5 °C (from 20 °C to 62.5 °C) per cycle, providing the dynamic thermo-mechanical loading input for the subsequent analyses.
3.2. Model Validation
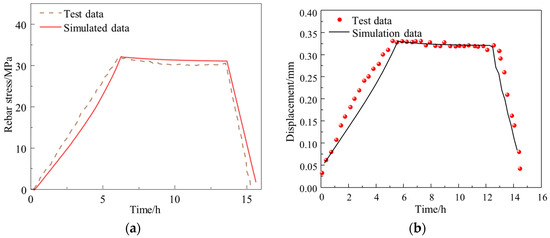
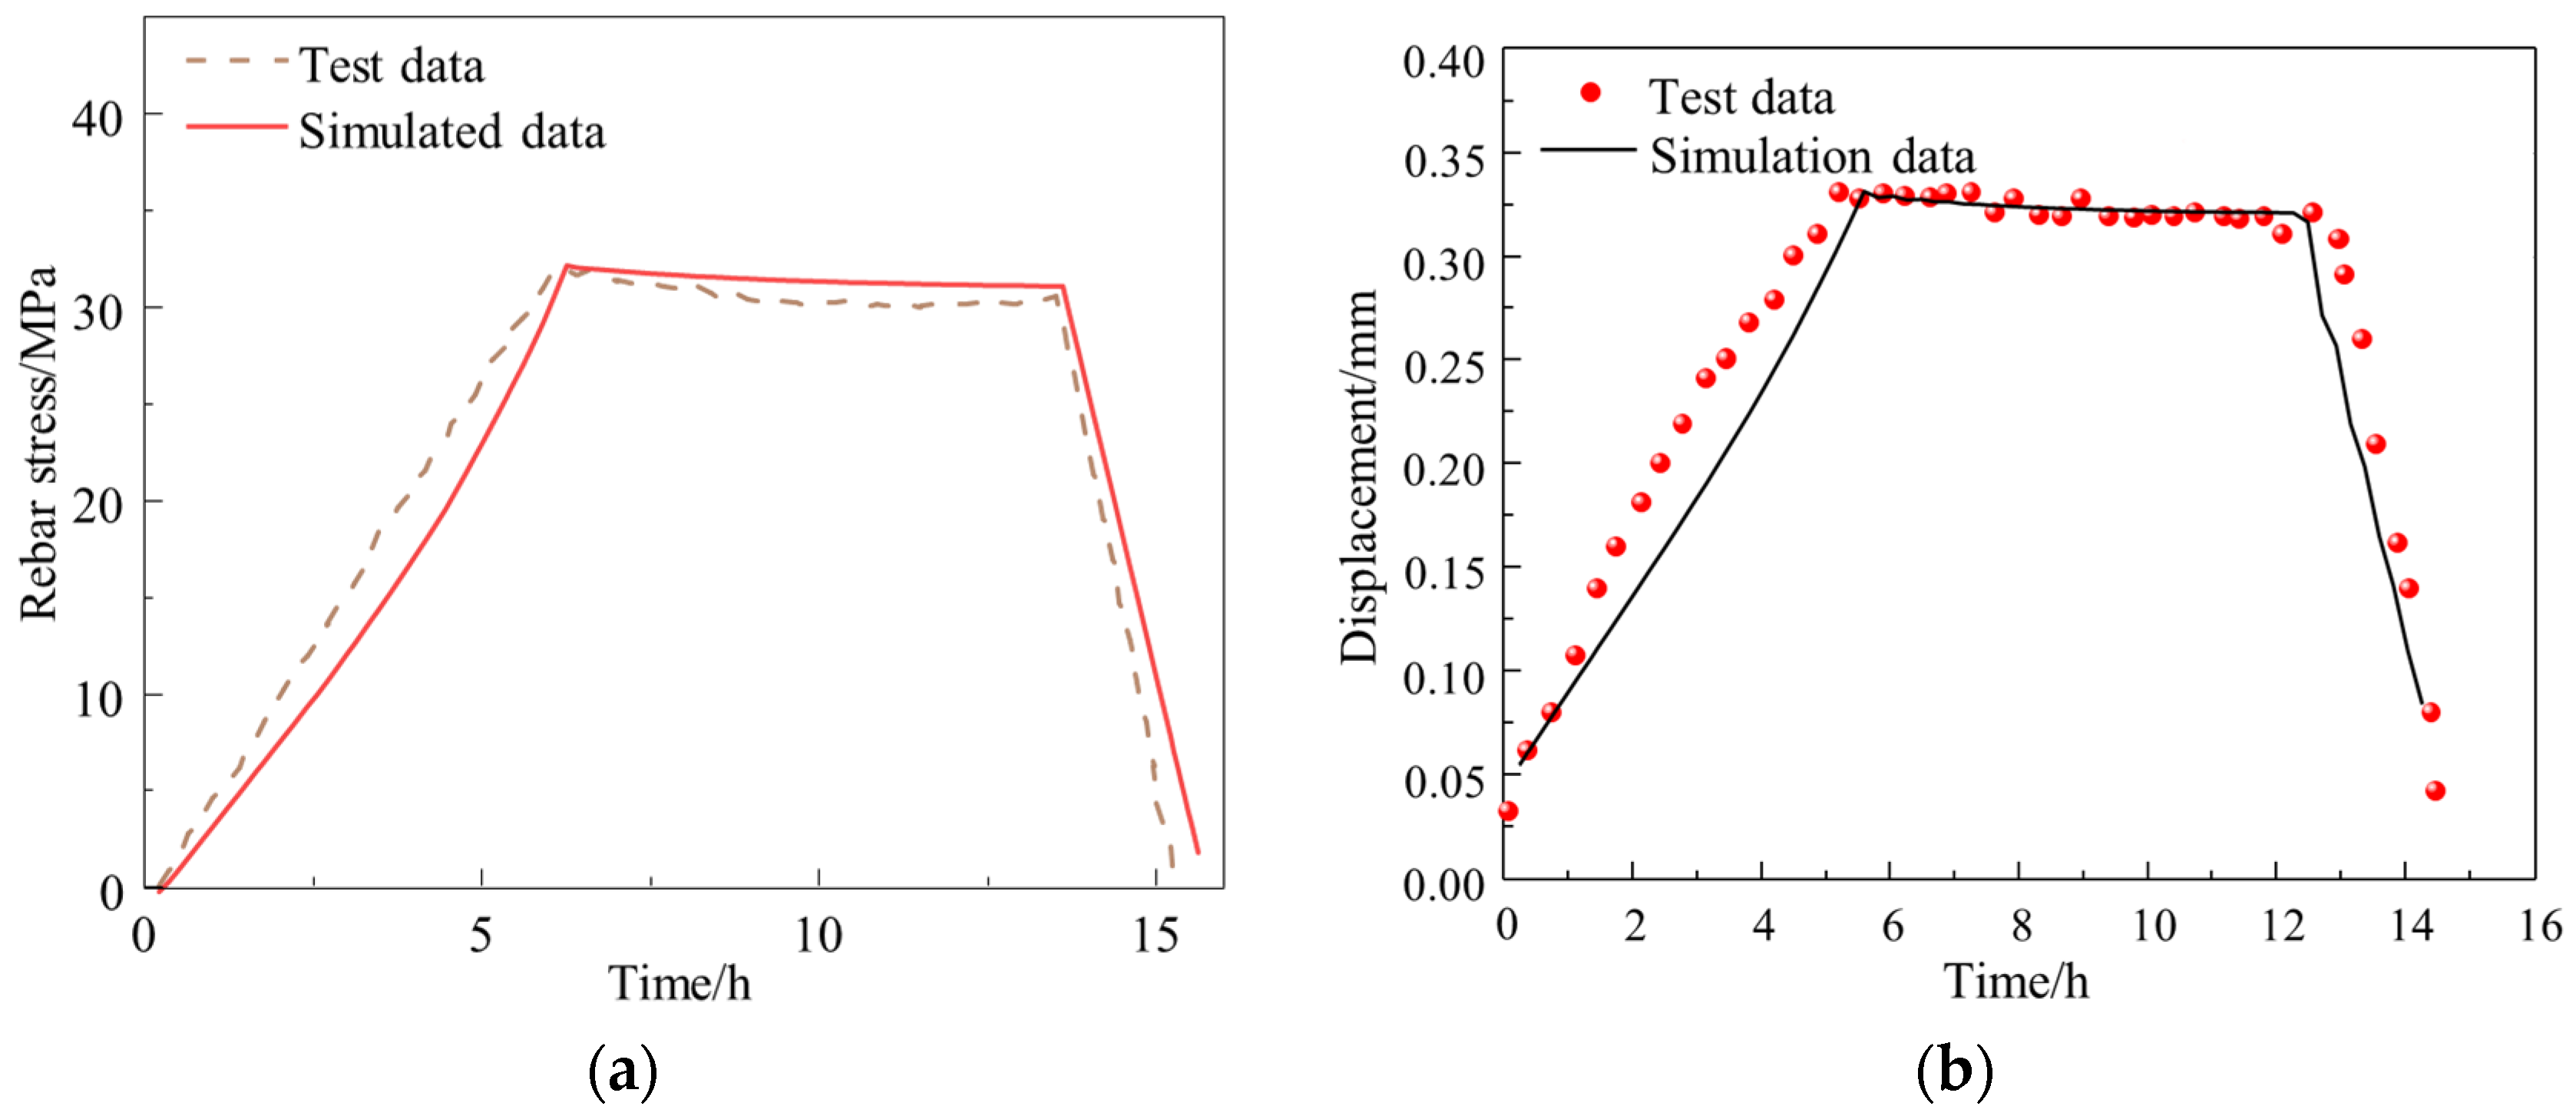
To validate the established 2D coupled thermo-mechanical damage-plasticity model, two previously reported field-monitoring datasets from operating CAES test caverns [22,24] were used. The rebar stress and radial displacement, which reflect the hoop tensile force in the lining and the integrated deformation of the lining–EDZ–rock system, respectively, were selected as the key indicators for comparison.
For the rebar stress, Li et al. [24] carried out in situ monitoring in a 35 m3 horizontal cylindrical reinforced concrete-lined cavern in granite formations, where the rebar stress in the outer rebar layer was recorded by reinforcement metres under a peak inner wall pressure and temperature of 8.71 MPa and 46 °C. The corresponding cavern geometry, material parameters, operating conditions, and the cycle stage durations were adopted as input parameters and boundary conditions in our model for validation simulation. Figure 7a compares the simulated and measured rebar stress. The simulated results agree well with the measurements throughout the cycle, with an RMSE of 0.8 MPa and MAE of 0.115 MPa.
Figure 7.
Comparison between measured and simulated results: (a) rebar stress; and (b) displacement.
For the radial displacement, Jiang et al. [22] monitored a 28.8 m3 horizontal cylindrical reinforced concrete-lined cavern at 110 m depth in a granite stratum in Hunan Province, China, under a peak working pressure of approximately 10 MPa. The multi-point extensometers were installed in the surrounding rock to measure radial displacements at different depths from the cavern wall. The point closest to the lining–rock interface (M3-3-1, 0.53 m from the inner surface) was selected for comparison, as it provides the most representative deformation response of the lining–rock system. The geometrical dimensions, material parameters, and the measured pressure, temperature, and stage durations were adopted as input parameters and boundary conditions for model validation. Figure 7b shows that the simulated radial displacement closely follows the measured trend, with RMSE of 0.12 mm and MAE of 0.10 mm.
These two comparisons confirm that the established 2D model accurately reproduces the response of the lining–rock system under thermo-mechanical CAES loading. It can provide a reliable basis for the parametric and optimisation analyses in the following sections.
3.3. Performance Analysis of R-SFC Lining
As a thin-walled structure subjected to multi-axial external forces, the gas storage cavern lining primarily fails due to hoop tensile stress induced by internal gas pressure exceeding the tensile strength of the lining material, leading to cracking. Therefore, this study selected maximum tensile damage as the core evaluation index for lining performance, as the main failure mode of CAES underground lining is circumferential tensile cracking under cyclic thermal mechanical loads (caused by high-pressure air inside the tunnel). Tensile damage directly characterises the micro-crack evolution and macro-cracking trends in concretes, and its physical meaning is the loss rate of effective bearing area (damage value 0 is no damage, 1 is complete failure). Considering that the 2D model may slightly overestimate lining performance, together with the engineering requirements of CAES linings, the acceptable tensile damage threshold is set at 0.5. Beyond this threshold, cracks in the lining will rapidly propagate due to stress concentration, leading to sealing performance failure.
Uniformly adding steel fibres to concrete can significantly improve the tensile and shear resistance of the concrete material while addressing its inherent cracking tendency, although it does not notably enhance its compressive strength. To further investigate the performance of R-SFC lining and quantitatively analyse the influence of steel fibre volume fraction on lining performance, this section designs four different R-SFC lining structures with varying steel fibre volume fractions for numerical simulation. The dimensions of the R-SFC lining are presented in Table 5.
Table 5.
Lining size of different steel fibre volume fractions.
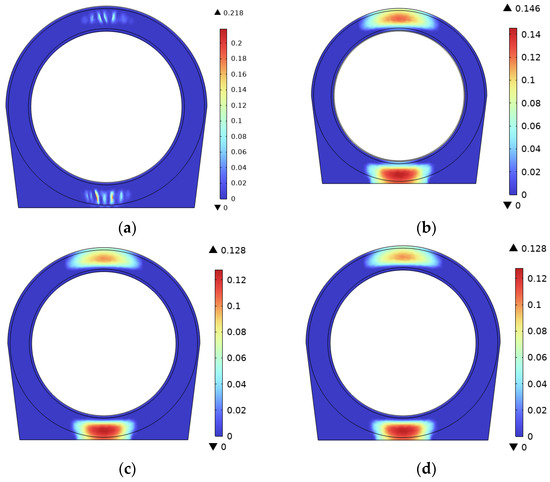
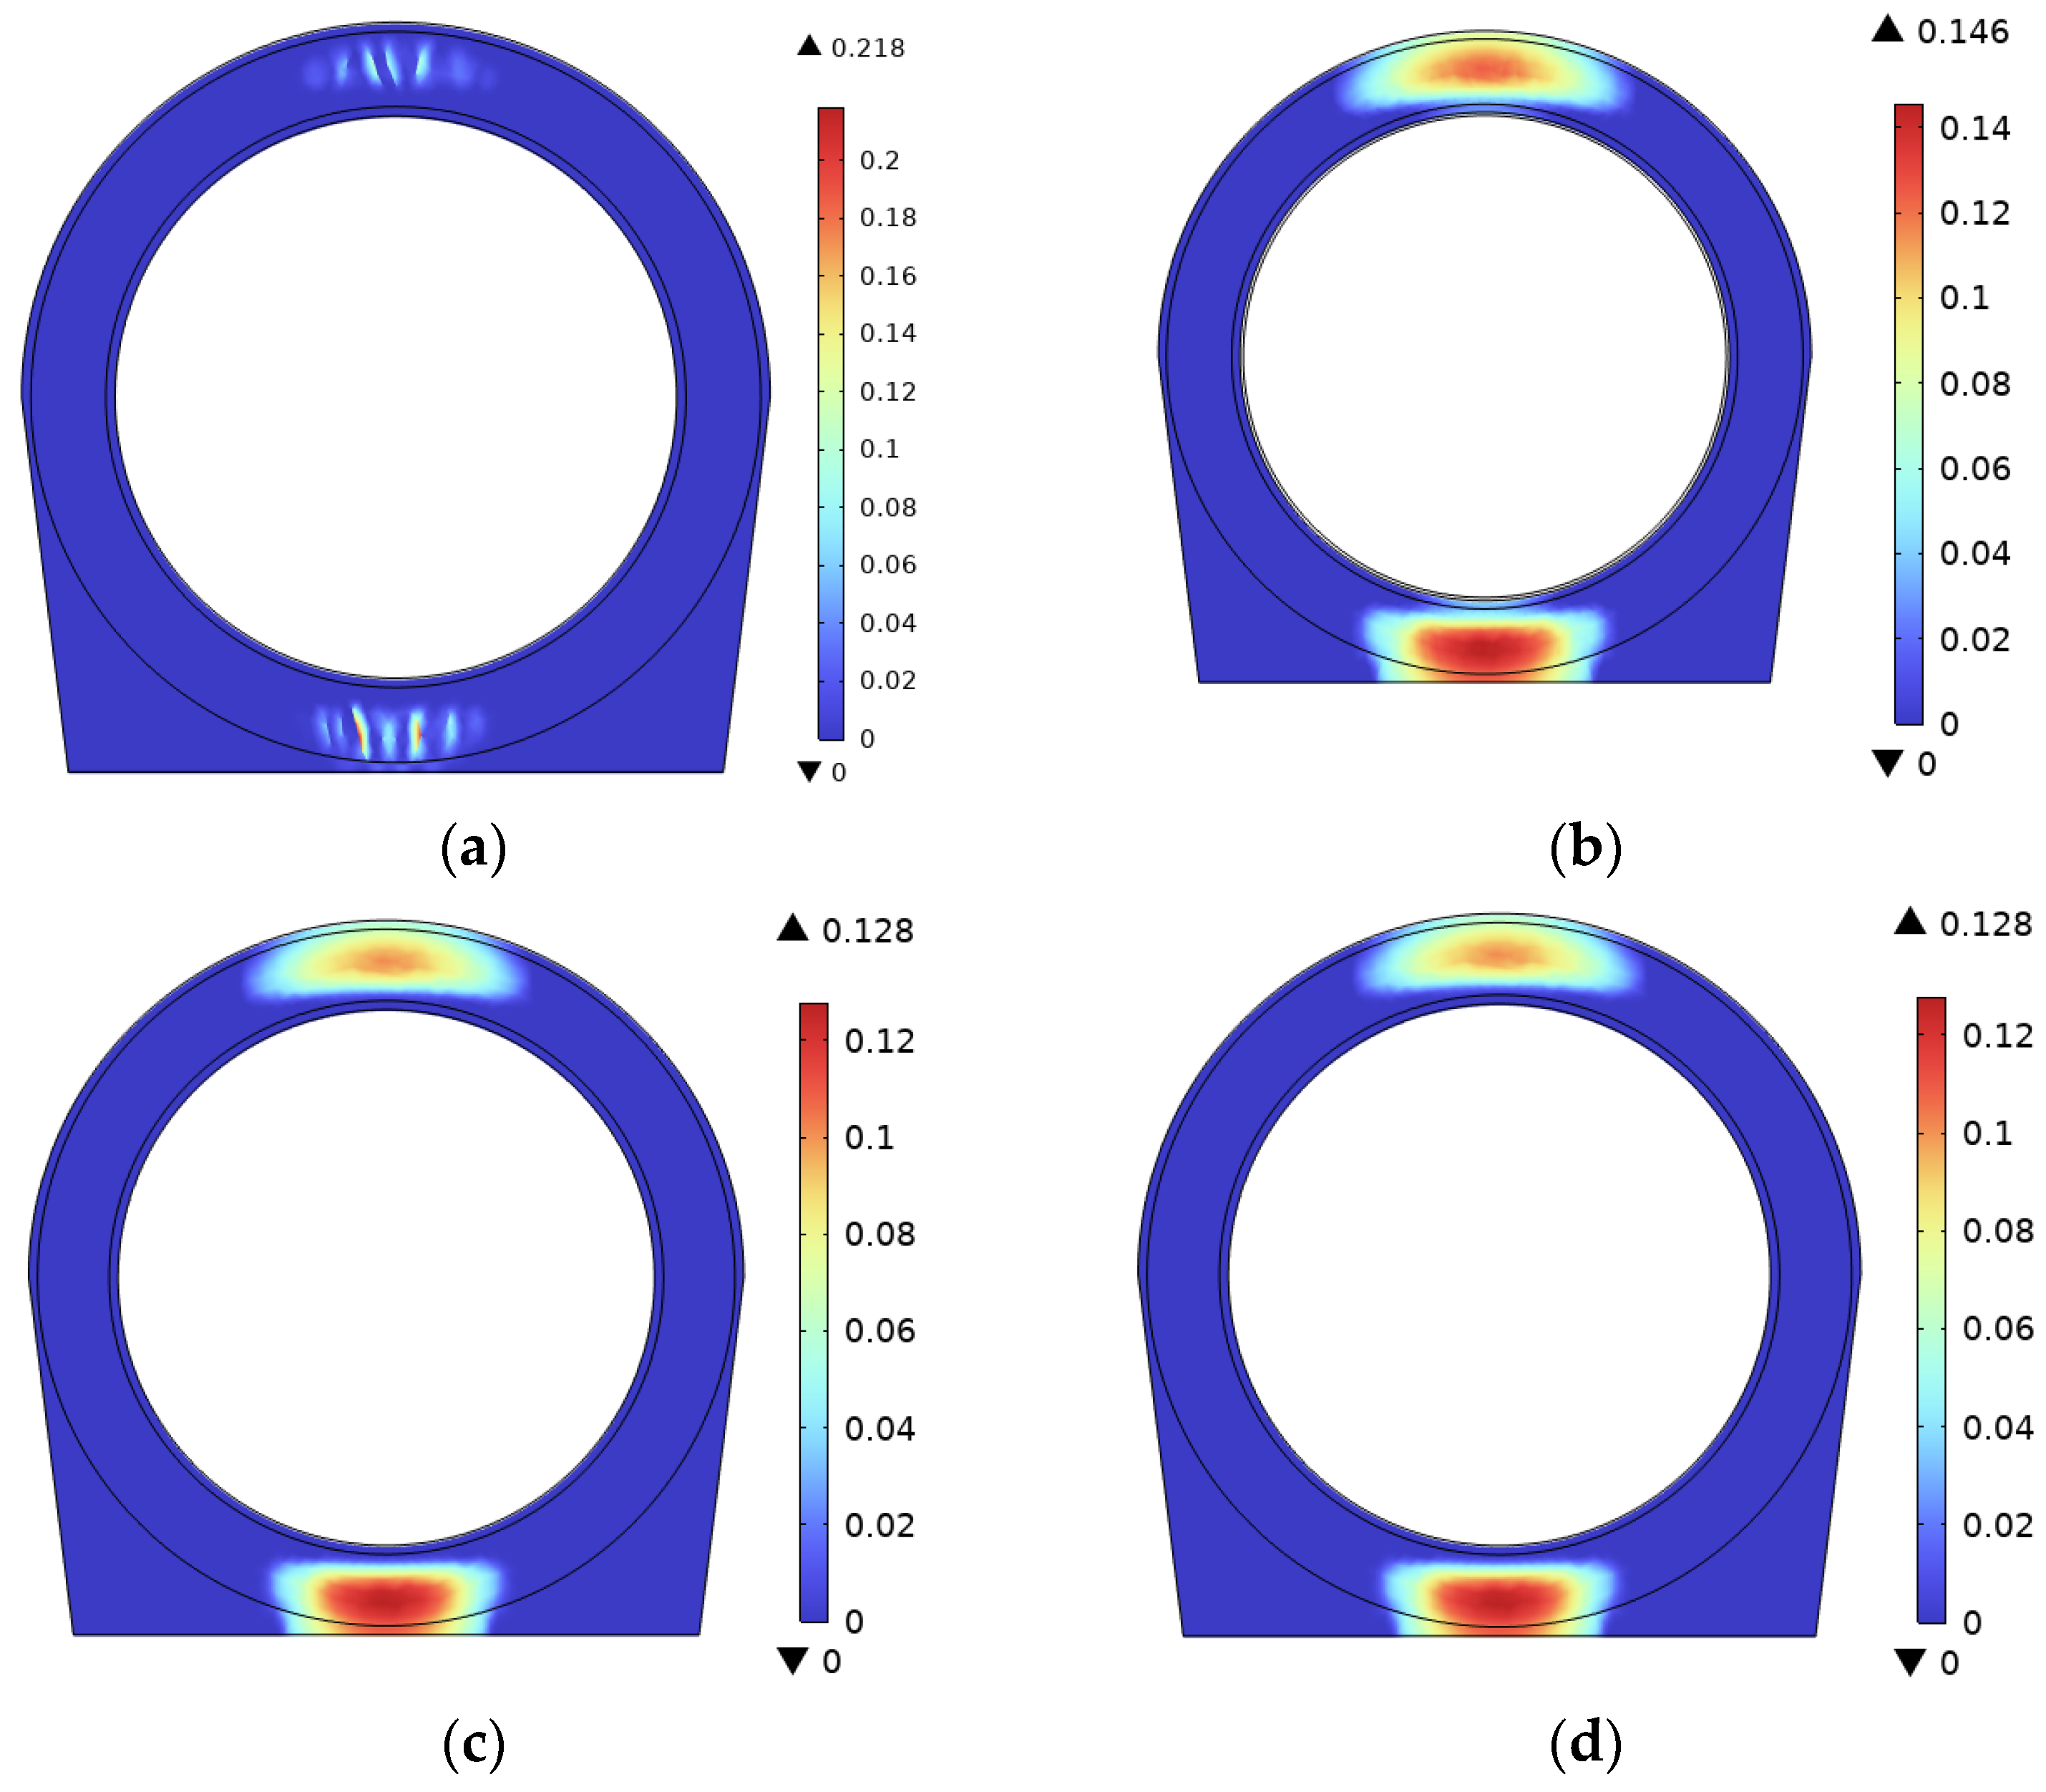
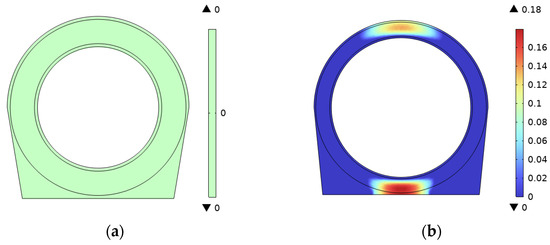
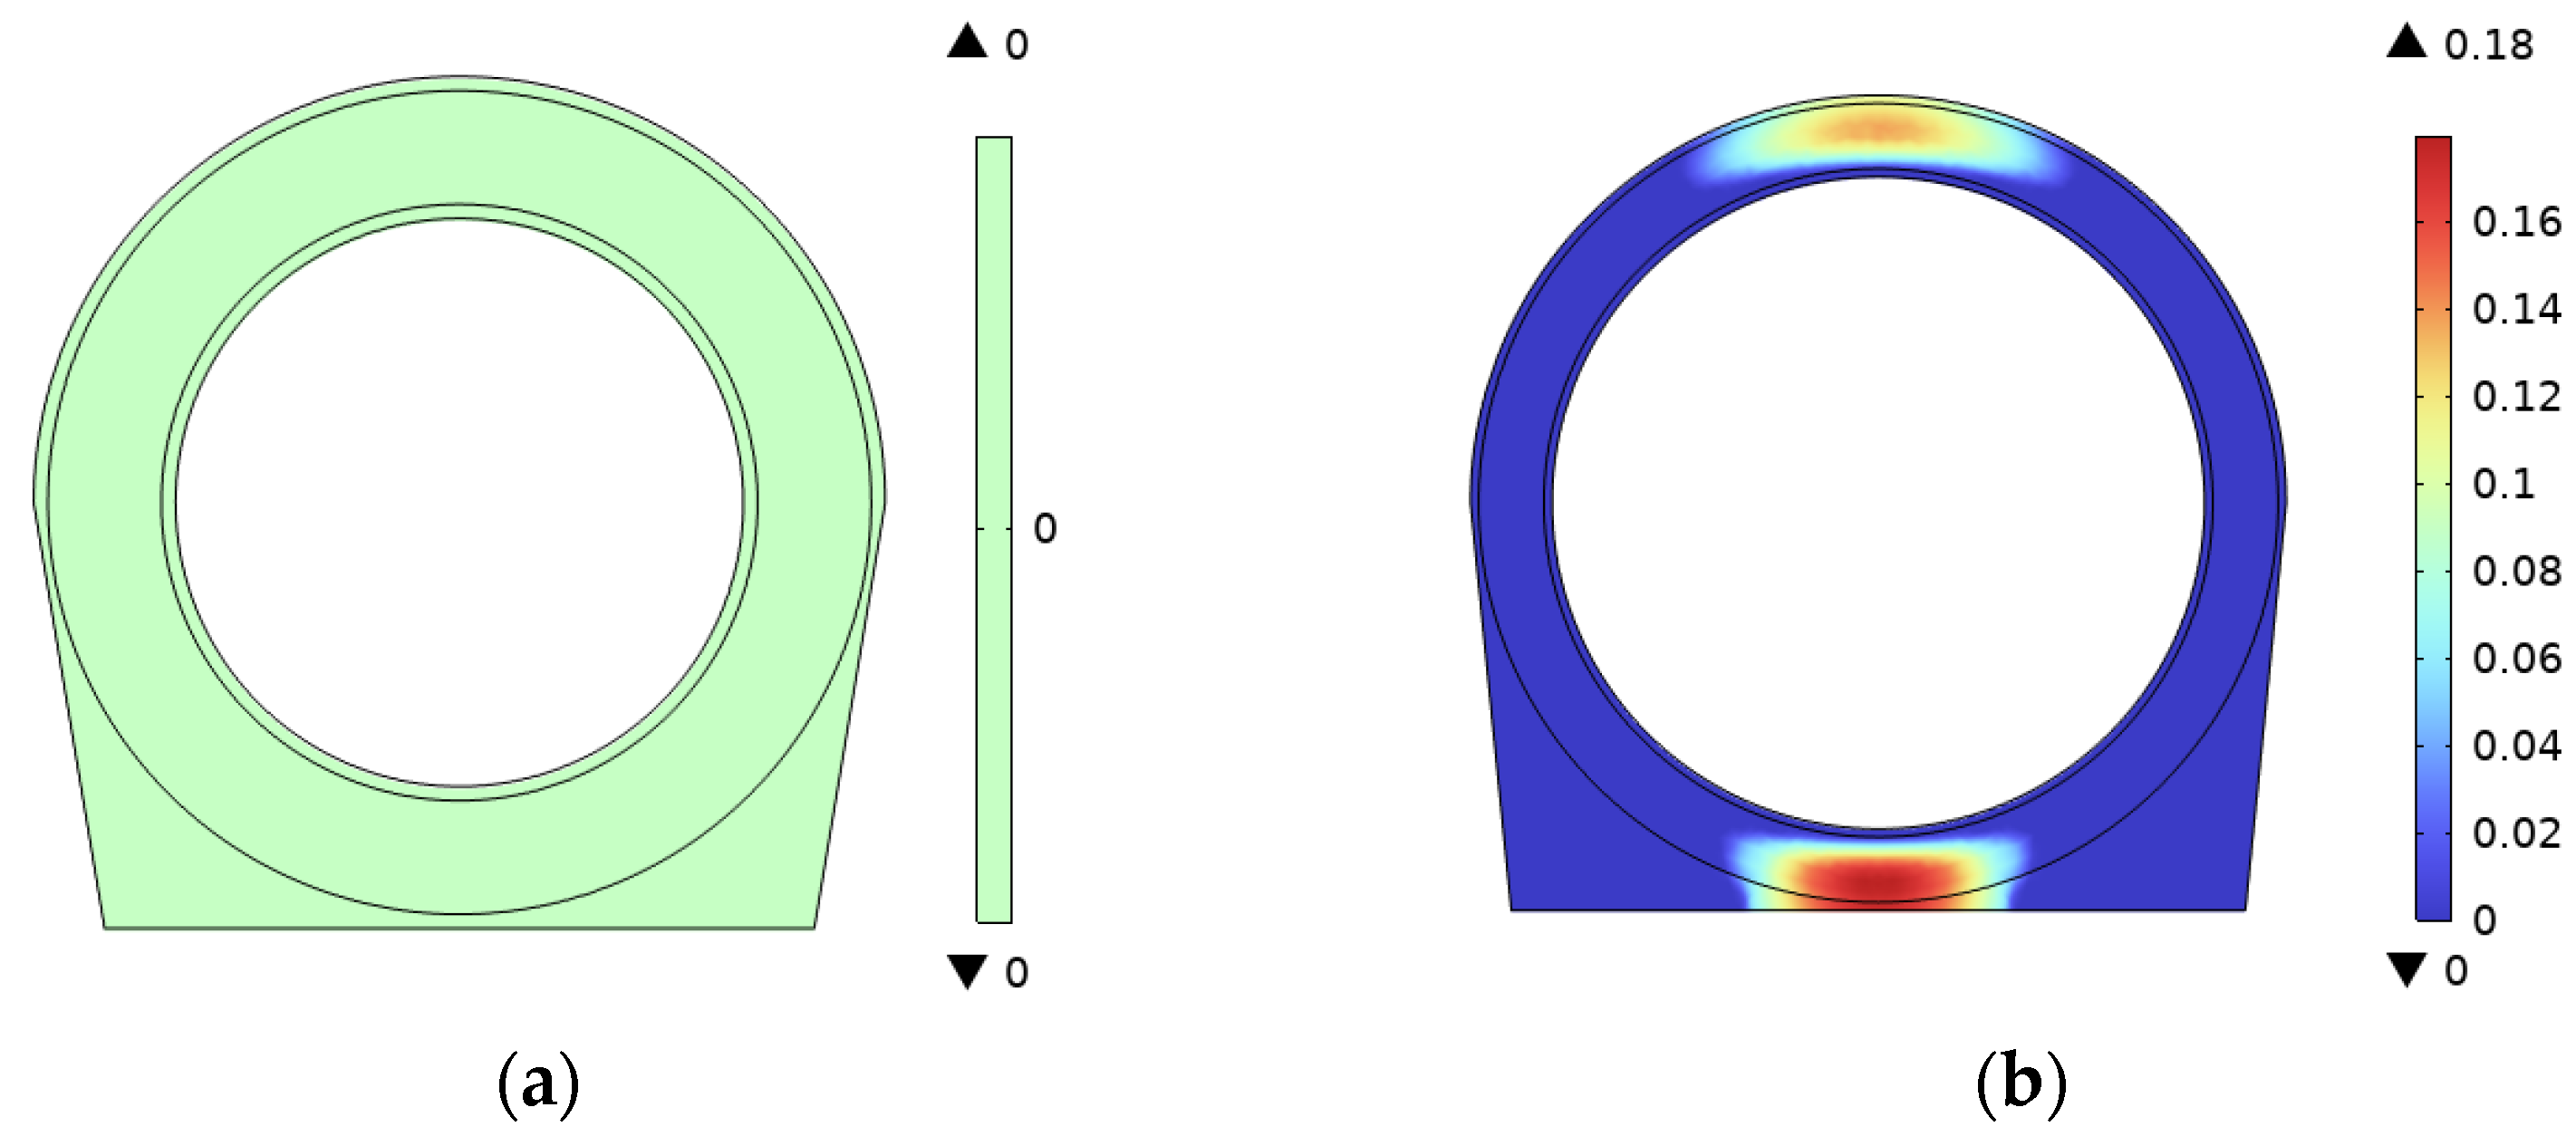
The lining structure exhibits nonlinear eccentric loading characteristics under the coupled field of compressed gas pressure, surrounding rock constraint, and self-weight. Conventional reinforced concrete is prone to forming damage concentration zones due to tensile damage in the concrete. The quantitative simulation results shown in Figure 8 indicate that damage decrement exhibits a nonlinear relationship with fibre volume fraction, with a reduction of 2.4% (compared to 1.7% in the 1.0% to 1.5% range) in the 0.5% to 1.0% range, suggesting a pattern of diminishing marginal returns for fibre dosage. Notably, the configuration combining 1.5% fibre volume fraction with 18 mm double-ring rebar achieves a 68% reduction in steel consumption while maintaining a comparable damage level relative to the conventional 32 mm rebar configuration without fibres, alleviating the excessive rebar redundancy in traditional linings. The proposed rebar configuration achieves a reinforcement ratio of 1.02% for the lining structure, with double rings of 18 mm rebar spaced every 100 mm in the radial direction (perpendicular to the modelling direction), ensuring that the reinforcement ratio complies with the stipulations of the current Chinese code for design of concrete structures concerning the minimum reinforcement ratio for reinforced concrete members [42].
Figure 8.
Distribution diagram of maximum damage inside lining with different volume fractions of steel fibres: (a) C-0; (b) SF-1; (c) SF-2; and (d) SF-3.
Based on this configuration, compared with the traditional reinforced concrete lining (C-0 group, maximum damage of 0.218), the maximum tensile damage of the SF-3 group (steel fibre volume fraction 1.5%) decreased to 0.128, a reduction of 41.3%. The addition of steel fibres resulted in a more uniform damage distribution, avoiding the concentrated damage observed in the traditional lining. This improvement can be attributed to the bridging effect of steel fibres across cracks, which constrains localised crack propagation.
To further assess the engineering feasibility, a preliminary economic comparison is made between the two lining schemes in Figure 8a,b, which represent the conventional and the R-SFC linings, respectively. The conventional C-0 lining has a total steel content of 3.22% by volume, corresponding to 0.253 t·m−3 of rebars. The SF-1 lining has a total steel content of 1.52%, comprising 0.08 t/m3 of rebars and 0.039 t·m−3 of steel fibres. Its total steel mass is 0.119 t·m−3, which is 53% lower than that of the C-0 lining. Given the unit cost of rebars is approximately 70–80% of that of steel fibres at current industry market prices, the material cost of the steel components (ignoring minor concrete volume difference) is reduced by 46–49%.
For SF-2 and SF-3 lining with higher fibre contents, the steel mass becomes 0.158 t·m−3 and 0.197 t·m−3, respectively, corresponding to 38% and 22% savings in steel mass. Under the same price assumption, the material cost savings are estimated at 20–30% and 5–10%. Because auxiliary material and labour costs for R-SFC are generally higher than those for conventional reinforced concrete, the overall construction cost saving is smaller than the primary material saving. Nevertheless, the relevant study [46] reported that a steel fibre-reinforced concrete lining achieved a total cost reduction of about 20% compared to conventional lining, confirming the economic advantage of using steel fibres. Therefore, all R-SFC linings achieve better tensile damage control while also being more economical than the conventional C-0 lining.
3.4. Structural Parameters Influence Analysis on Plastic Damage of R-SFC Lining
To comprehensively study the mechanical properties and damage plasticity influencing parameters of R-SFC lining, and to guide the relevant design of such structures, this paper will conduct model expansion analysis based on parameters such as lining thickness, rebar diameter, and storage cavern inner diameter, with these parameters as control variables, while keeping other influencing parameters of the model constant. Structural dimensions are shown in Table 6.
Table 6.
Structure variable parameter size.
3.4.1. Lining Thickness
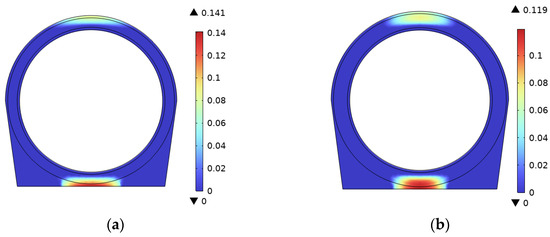
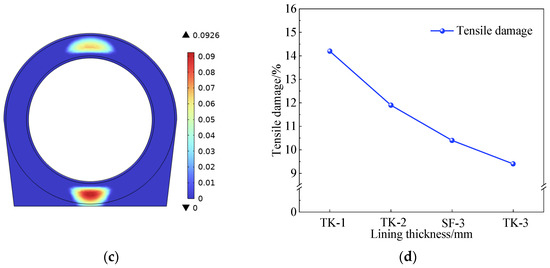
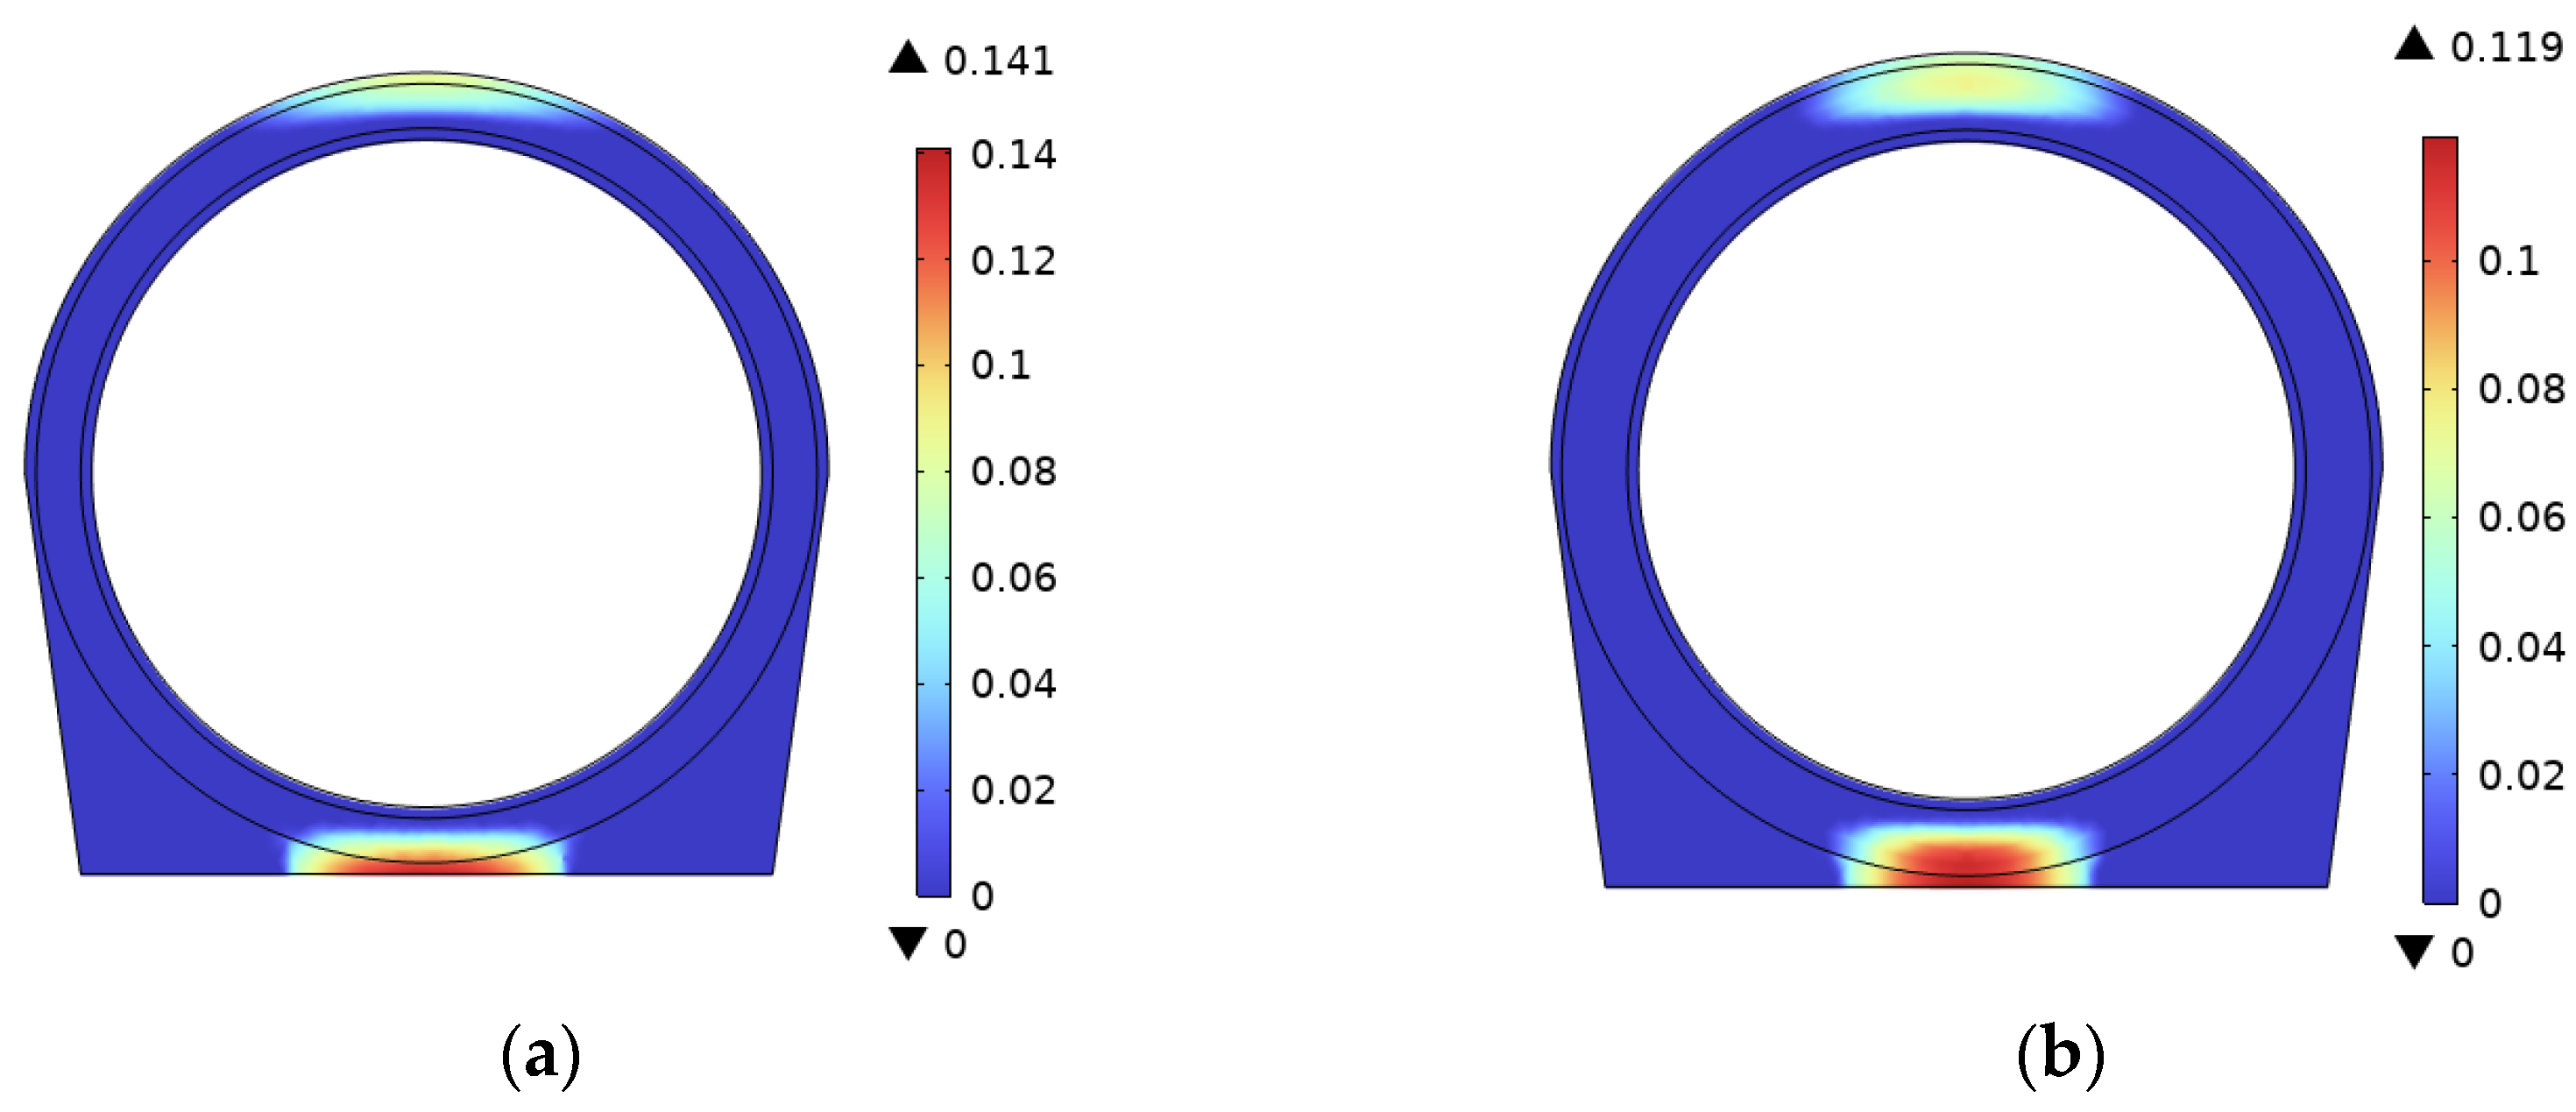
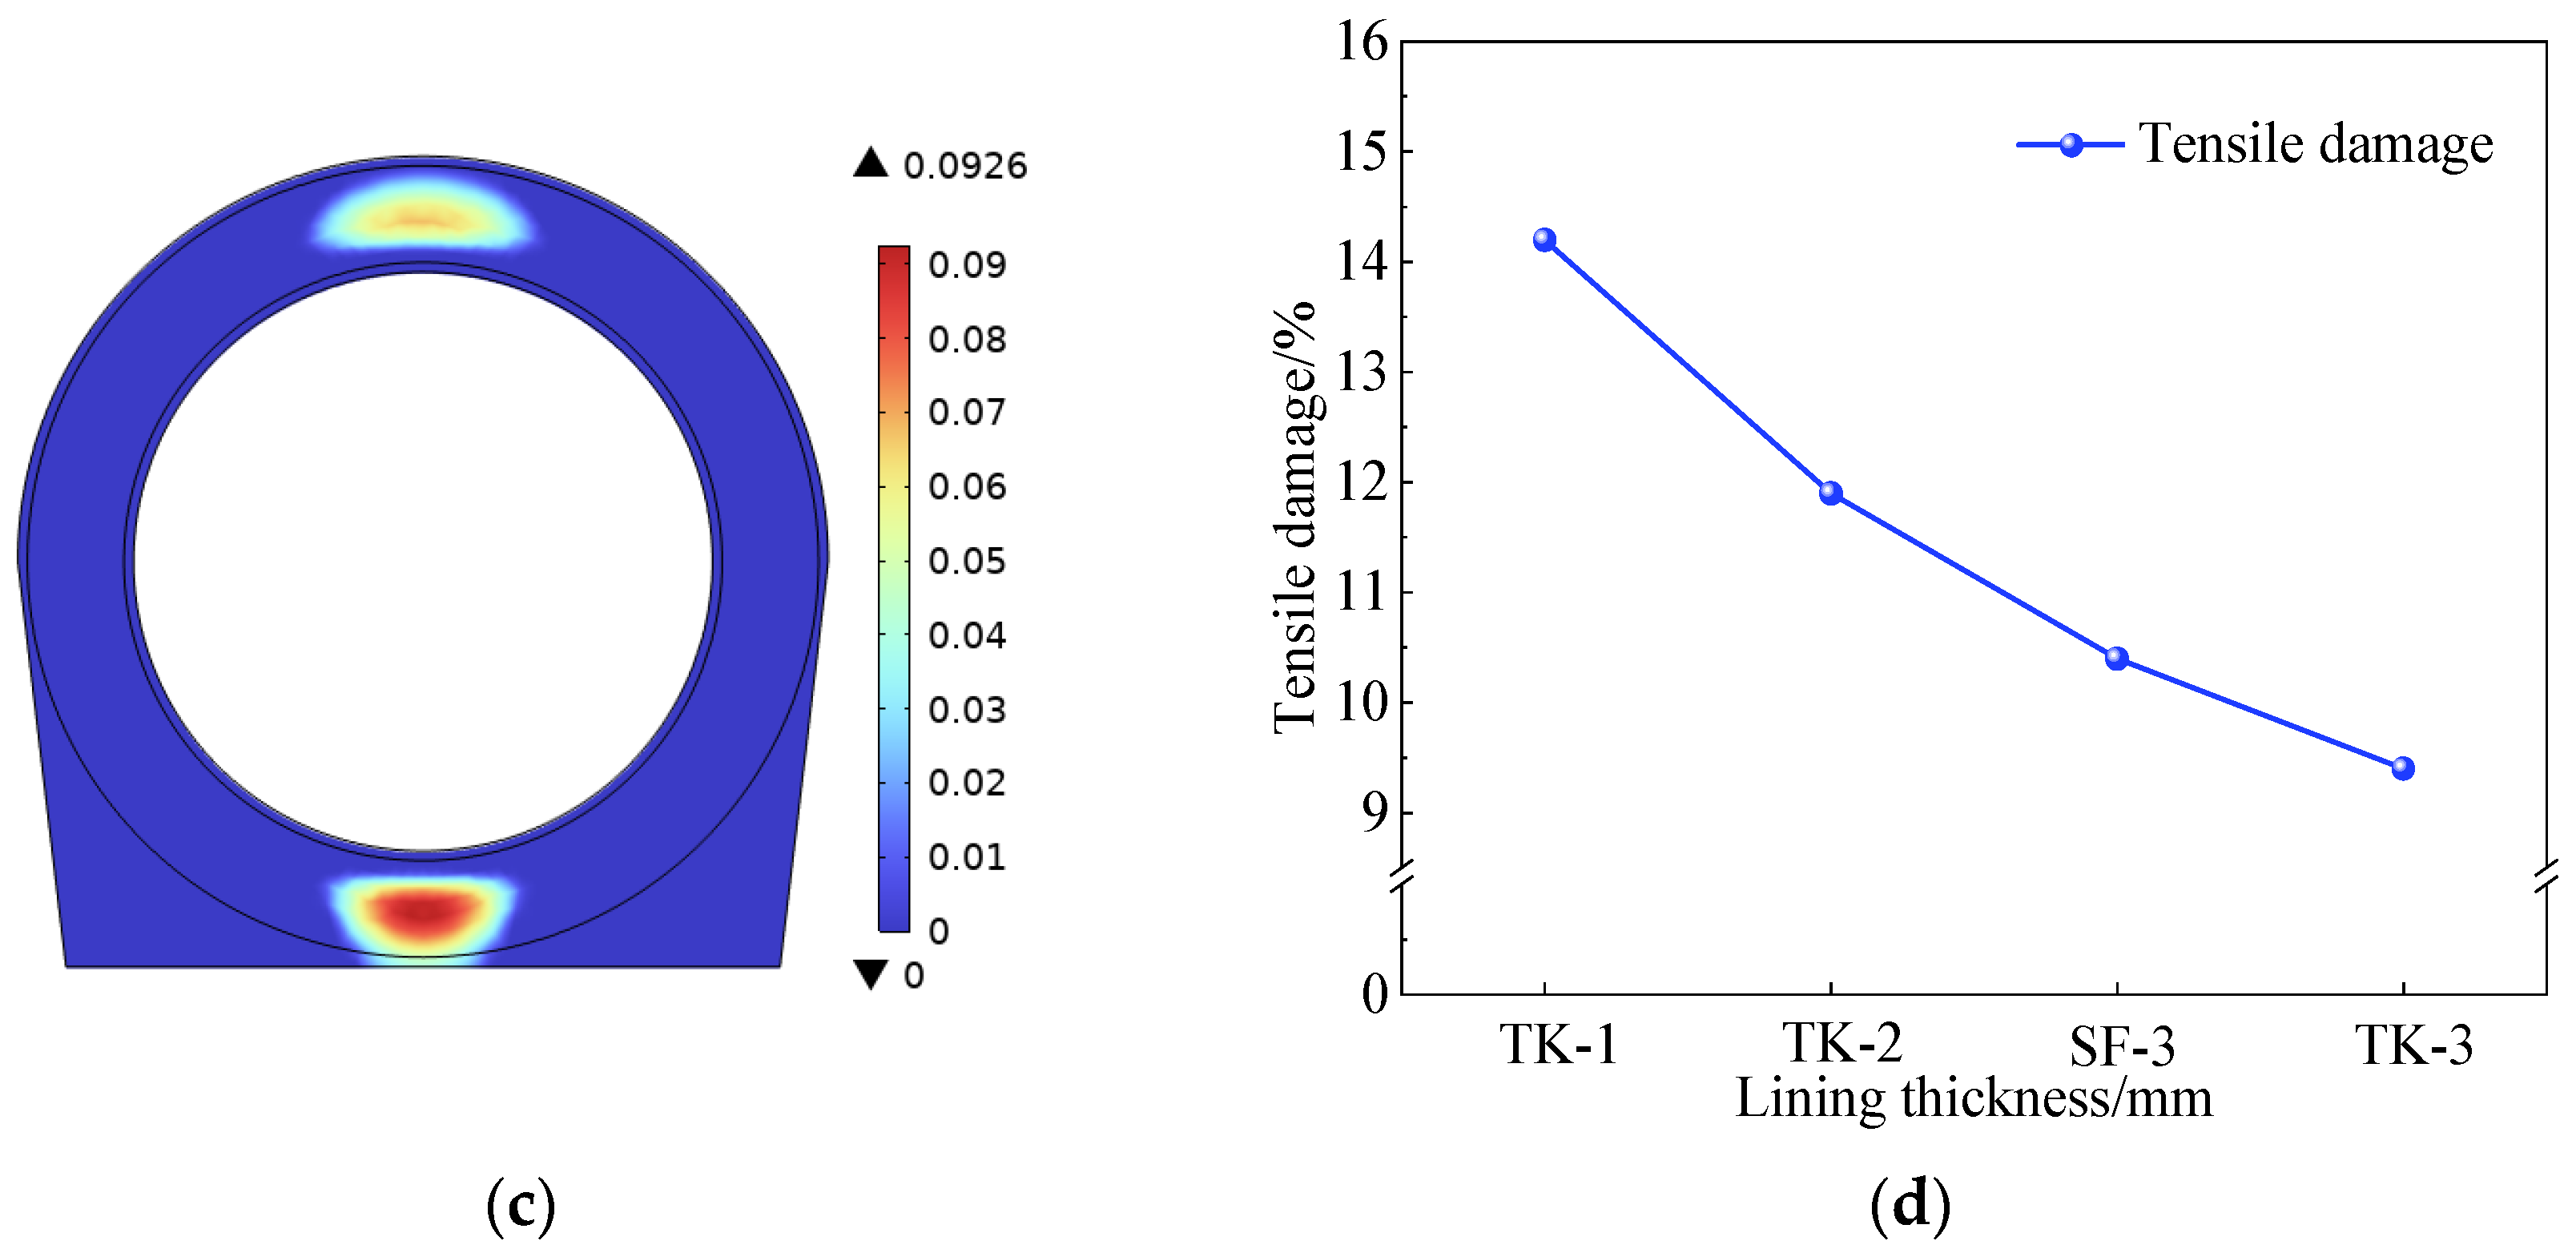
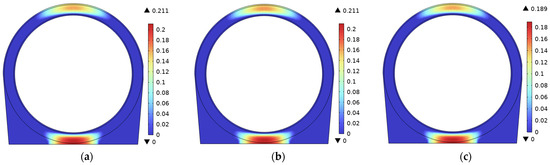
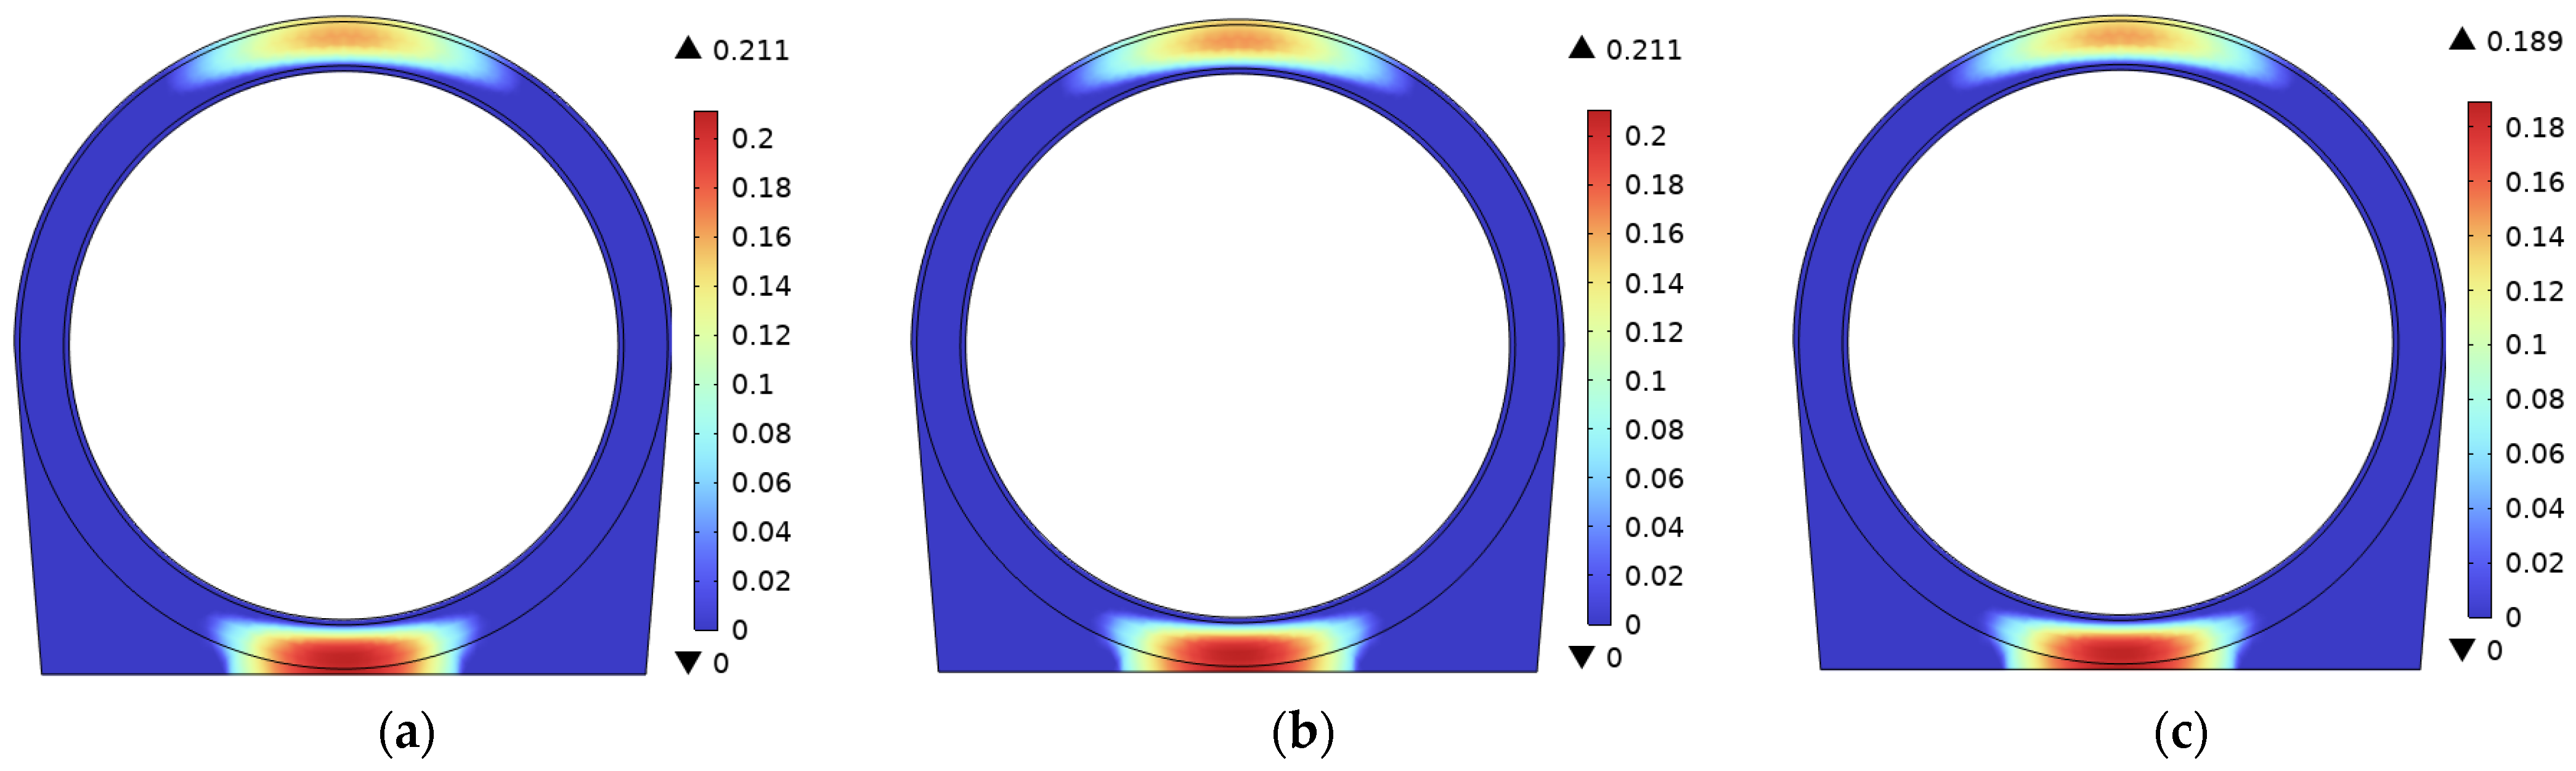
As shown in the comparison between Figure 8c and Figure 9, the thickness of R-SFC lining ranges from 300 mm to 600 mm, and for every additional 100 mm in thickness, the maximum tensile damage decreases by 2.2%, 1.5%, and 1%, respectively. The trend of tensile damage reduction first decreases rapidly and then slows down as the thickness increases. For R-SFC lining with a thickness of 300 mm, the maximum tensile damage occurs at the bottom side of the outer reinforcement. For R-SFC lining with thicknesses between 400 mm and 600 mm, the maximum tensile damage occurs between the inner and outer reinforcements at the bottom. Furthermore, based on the differences in fracture energy of R-SFC lining with different thicknesses as shown in Table 2, it can be concluded that under smaller tensile damage conditions, the influence of lining thickness is greater than the influence of damage fracture energy factors. Compared with traditional reinforced concrete lining (thickness of 500 mm, damage of 0.218), increasing the thickness of R-SFC lining to 600 mm reduces the maximum damage to 0.0926, a reduction of 57.5%. However, the damage suppression effect exhibits diminishing returns with further thickness increases.
Figure 9.
The effect of lining thickness on the tensile damage of lining: (a) TK-1; (b) TK-2; (c) TK-3; and (d) various lining thicknesses.
3.4.2. Cavern Diameter
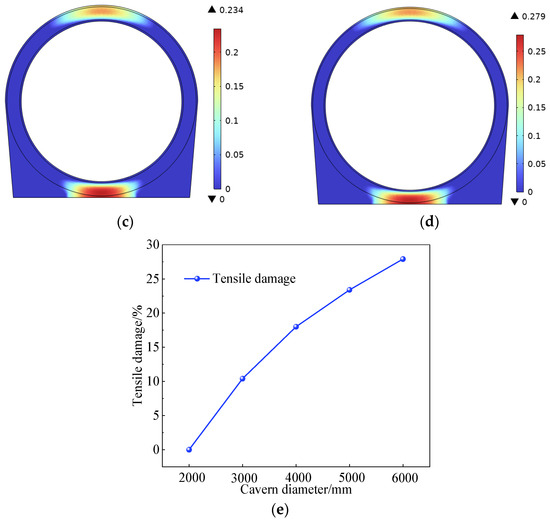
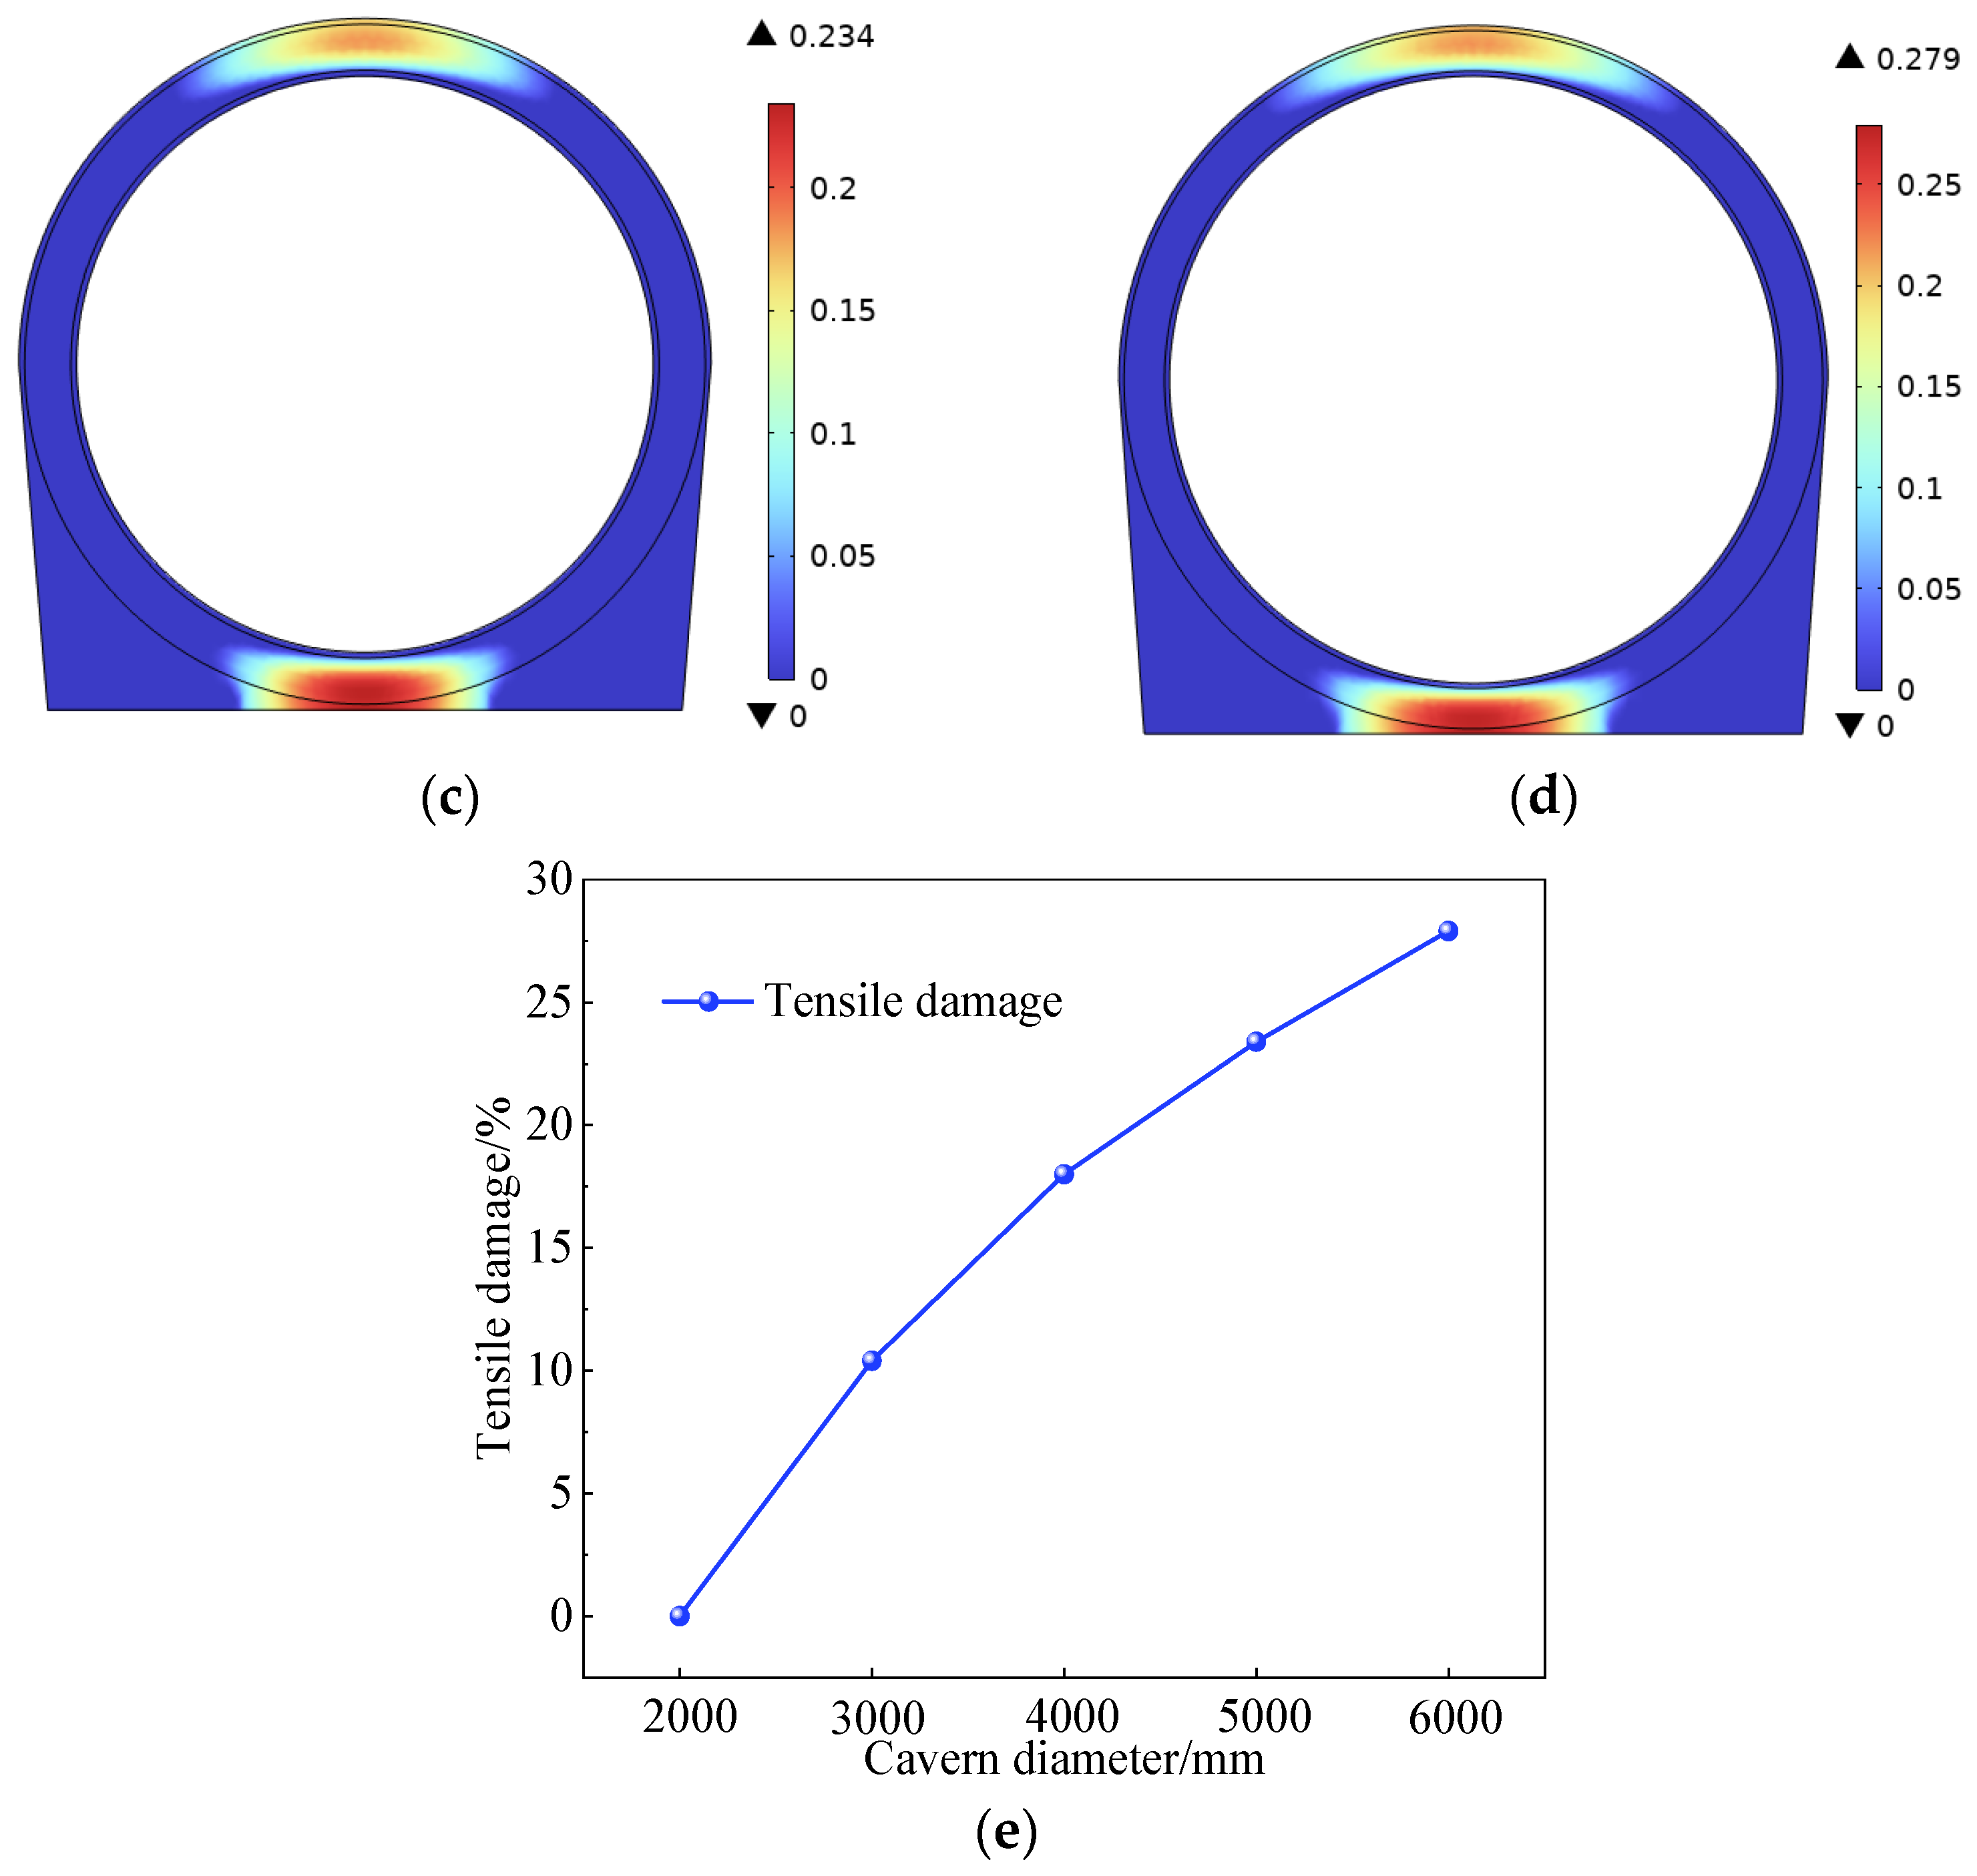
By comparing Figure 8c and Figure 10, it can be observed that the selection of cavern diameter has a significant impact on the control of tensile damage within the lining. As the cavern diameter increases from 2000 mm to 6000 mm, with each increment of 1000 mm, the maximum tensile damage within the lining increases by 10.4%, 7.6%, 5.4%, and 4.5%, respectively. The growth trend of tensile damage is initially rapid and then slows down. With the decrease in the thickness-to-diameter ratio, defined as the ratio of lining thickness to cavern diameter, the lining’s ability to bear internal compressive stress decreases, as radial compressive stress is inversely proportional to the radius. An excessively low thickness-to-diameter ratio reduces the strength of the lining, increases tensile damage within it, and consequently increases the stress that the surrounding rock must bear, implying higher requirements for the strength of the surrounding rock. Therefore, during structural design, it is essential to consider both the strength of the surrounding rock and the performance of the lining itself, selecting an appropriate cavern-thickness ratio to better meet the needs of structural safety and economy. Compared with traditional reinforced concrete lining (bearing a pressure of 2.4 MPa inside the tunnel), the R-SFC lining (steel fibre volume fraction of 1.5%) can bear an internal pressure of 2.58 MPa, representing a 7.5% increase in load-bearing capacity. Consequently, the bearing pressure on the surrounding rock is significantly reduced.
Figure 10.
The influence of cavern diameter on lining tensile damage: (a) DJ-1; (b) DJ-2; (c) DJ-3; (d) DJ-4; and (e) various cavern diameters.
3.4.3. Rebar Diameter
Reinforcing bars in the lining primarily serve to constrain cracking and damage in the lining, enhance its tensile performance, share internal lining pressures, and control lining deformation. By comparing the maximum tensile damage distribution diagrams in Figure 8c and Figure 11, which only alter the diameters of the inner and outer ring reinforcing bars, it can be observed that optimising the diameter of either the inner or outer ring individually reinforcing bars reduces lining tensile damage by 2.3%. Furthermore, a lining with double rings of 25 mm diameter reinforcing bars exhibits a 4.5% reduction in maximum tensile damage compared to 18 mm diameter bars. Because the maximum tensile damage in the lining occurs at its midsection, resulting from the combined effects of internal air pressure and the external rock mass’s circumferential pressure. Both inner and outer ring reinforcing bars demonstrate similar effectiveness in controlling damage. Considering the stress distribution, while the inner ring reinforcing bars experience significantly higher circumferential tensile stresses than the outer ring, the strength redundancy remains ample. Circumferential cracks in the outer ring will directly lead to the degradation of the surrounding rock-lining interface, causing leakage risks and increased maintenance costs. Therefore, it is recommended to adopt a circumferential reinforcement design combining “thick bars in the outer ring and thin bars in the inner ring”.
Figure 11.
The influence of rebar diameter on lining tensile damage: (a) GJ-1; (b) GJ-2; and (c) GJ-3.
3.5. Lining–Rock Internal Pressure Sharing Under Parameter Variations
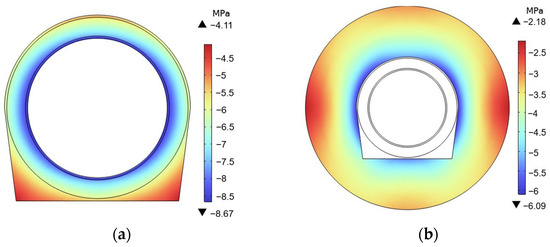
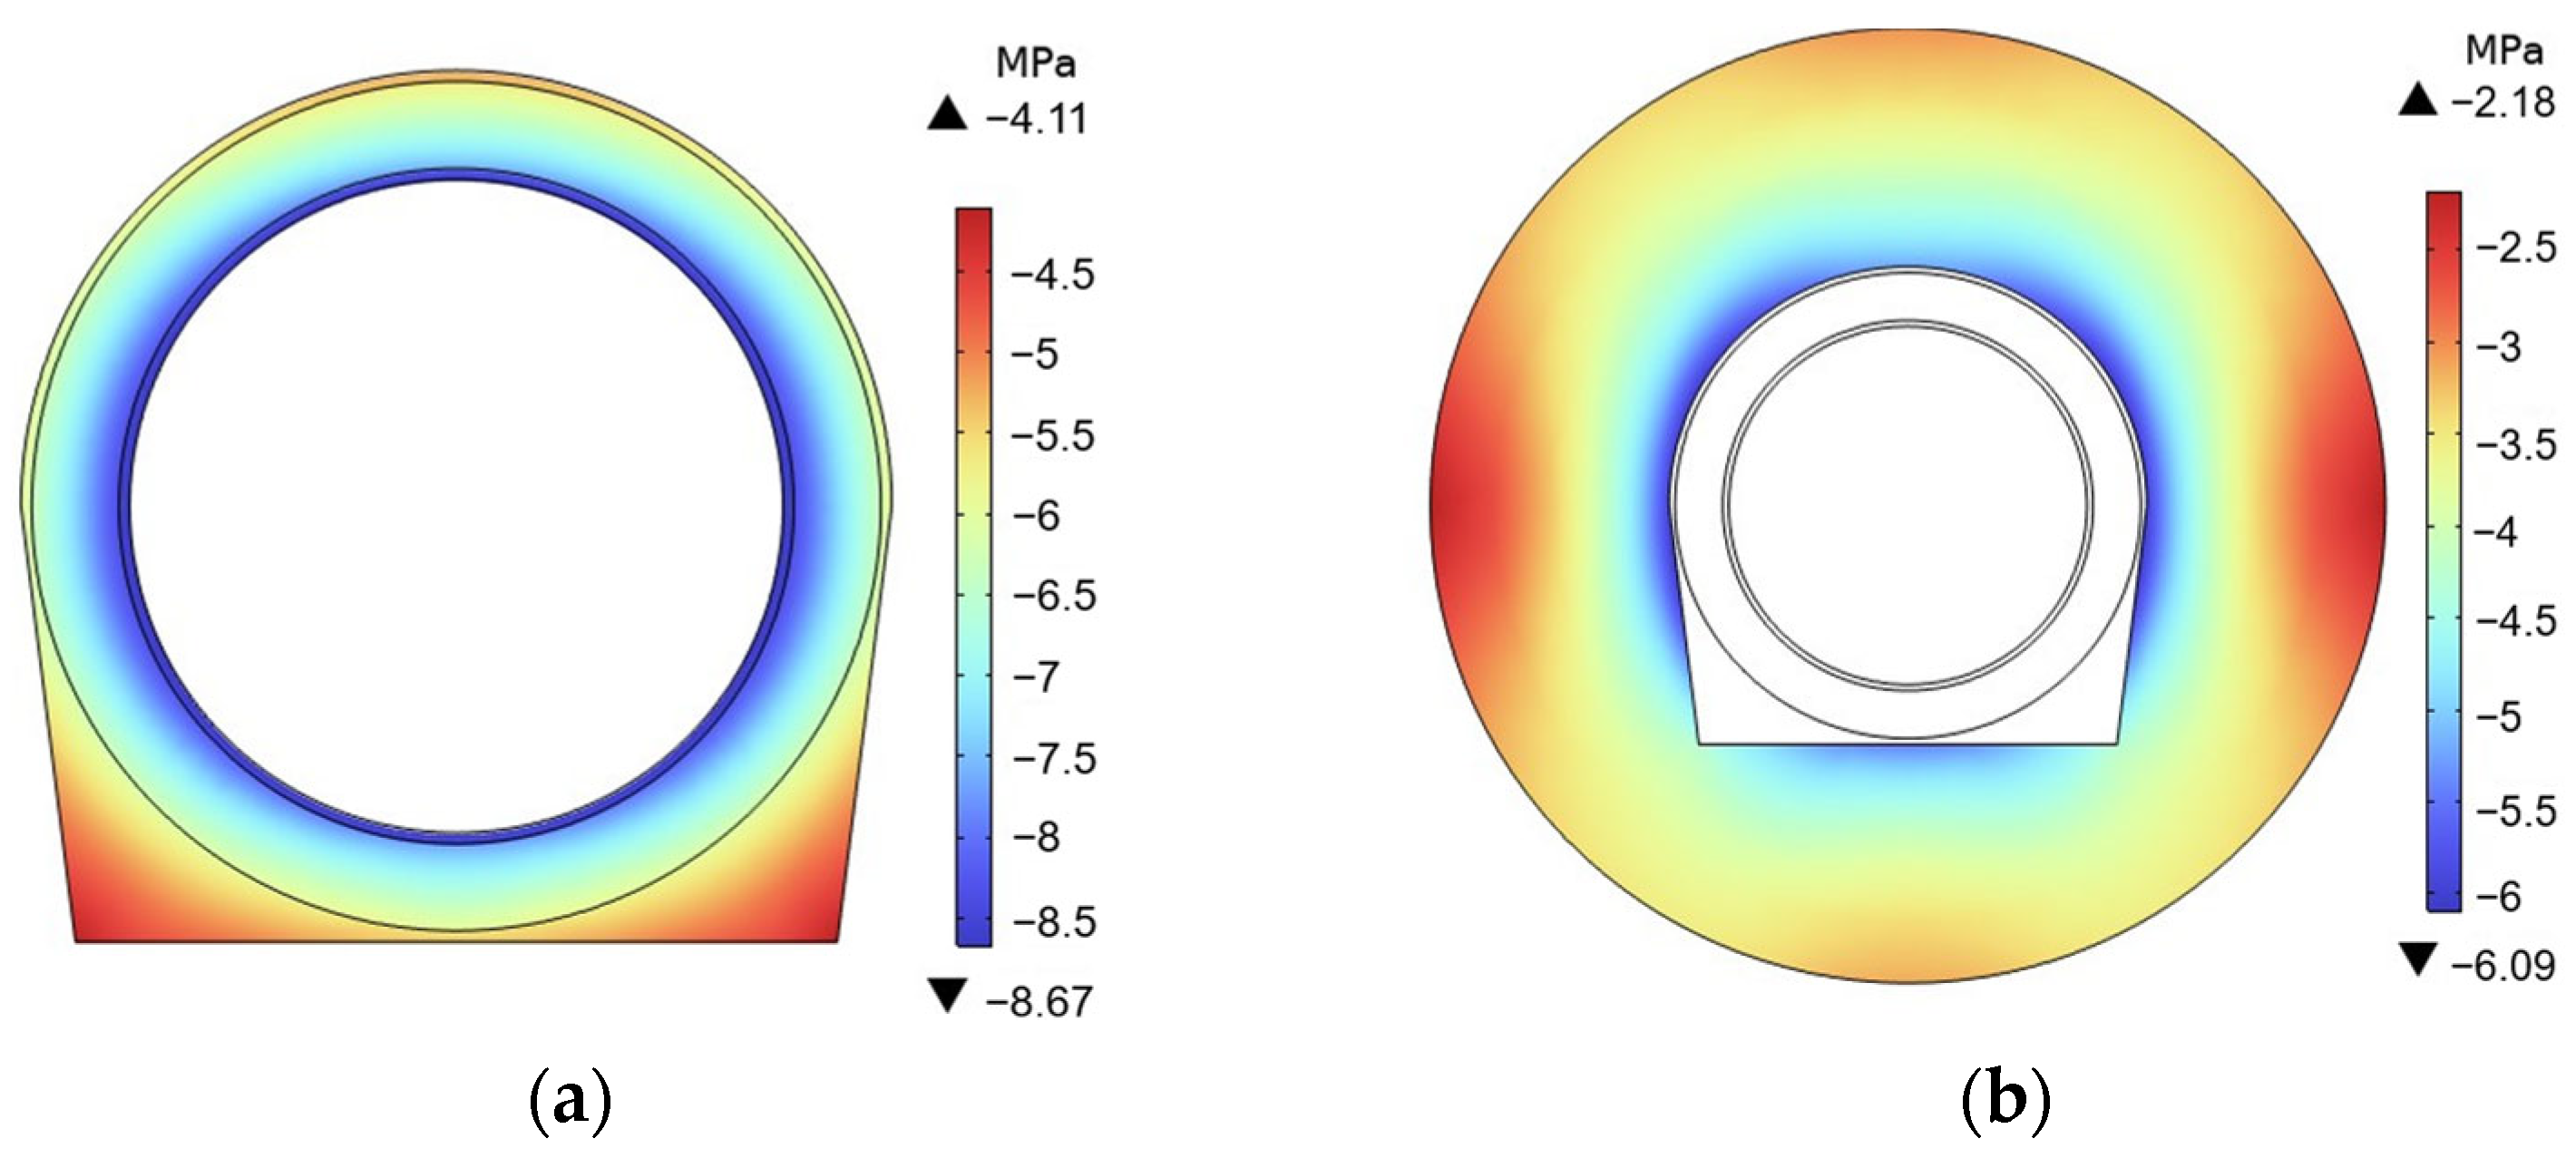
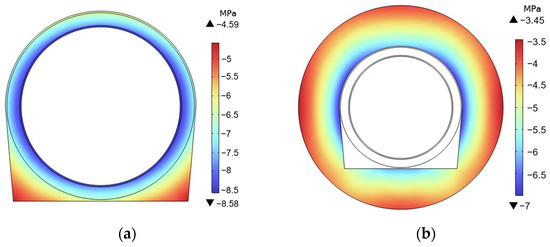
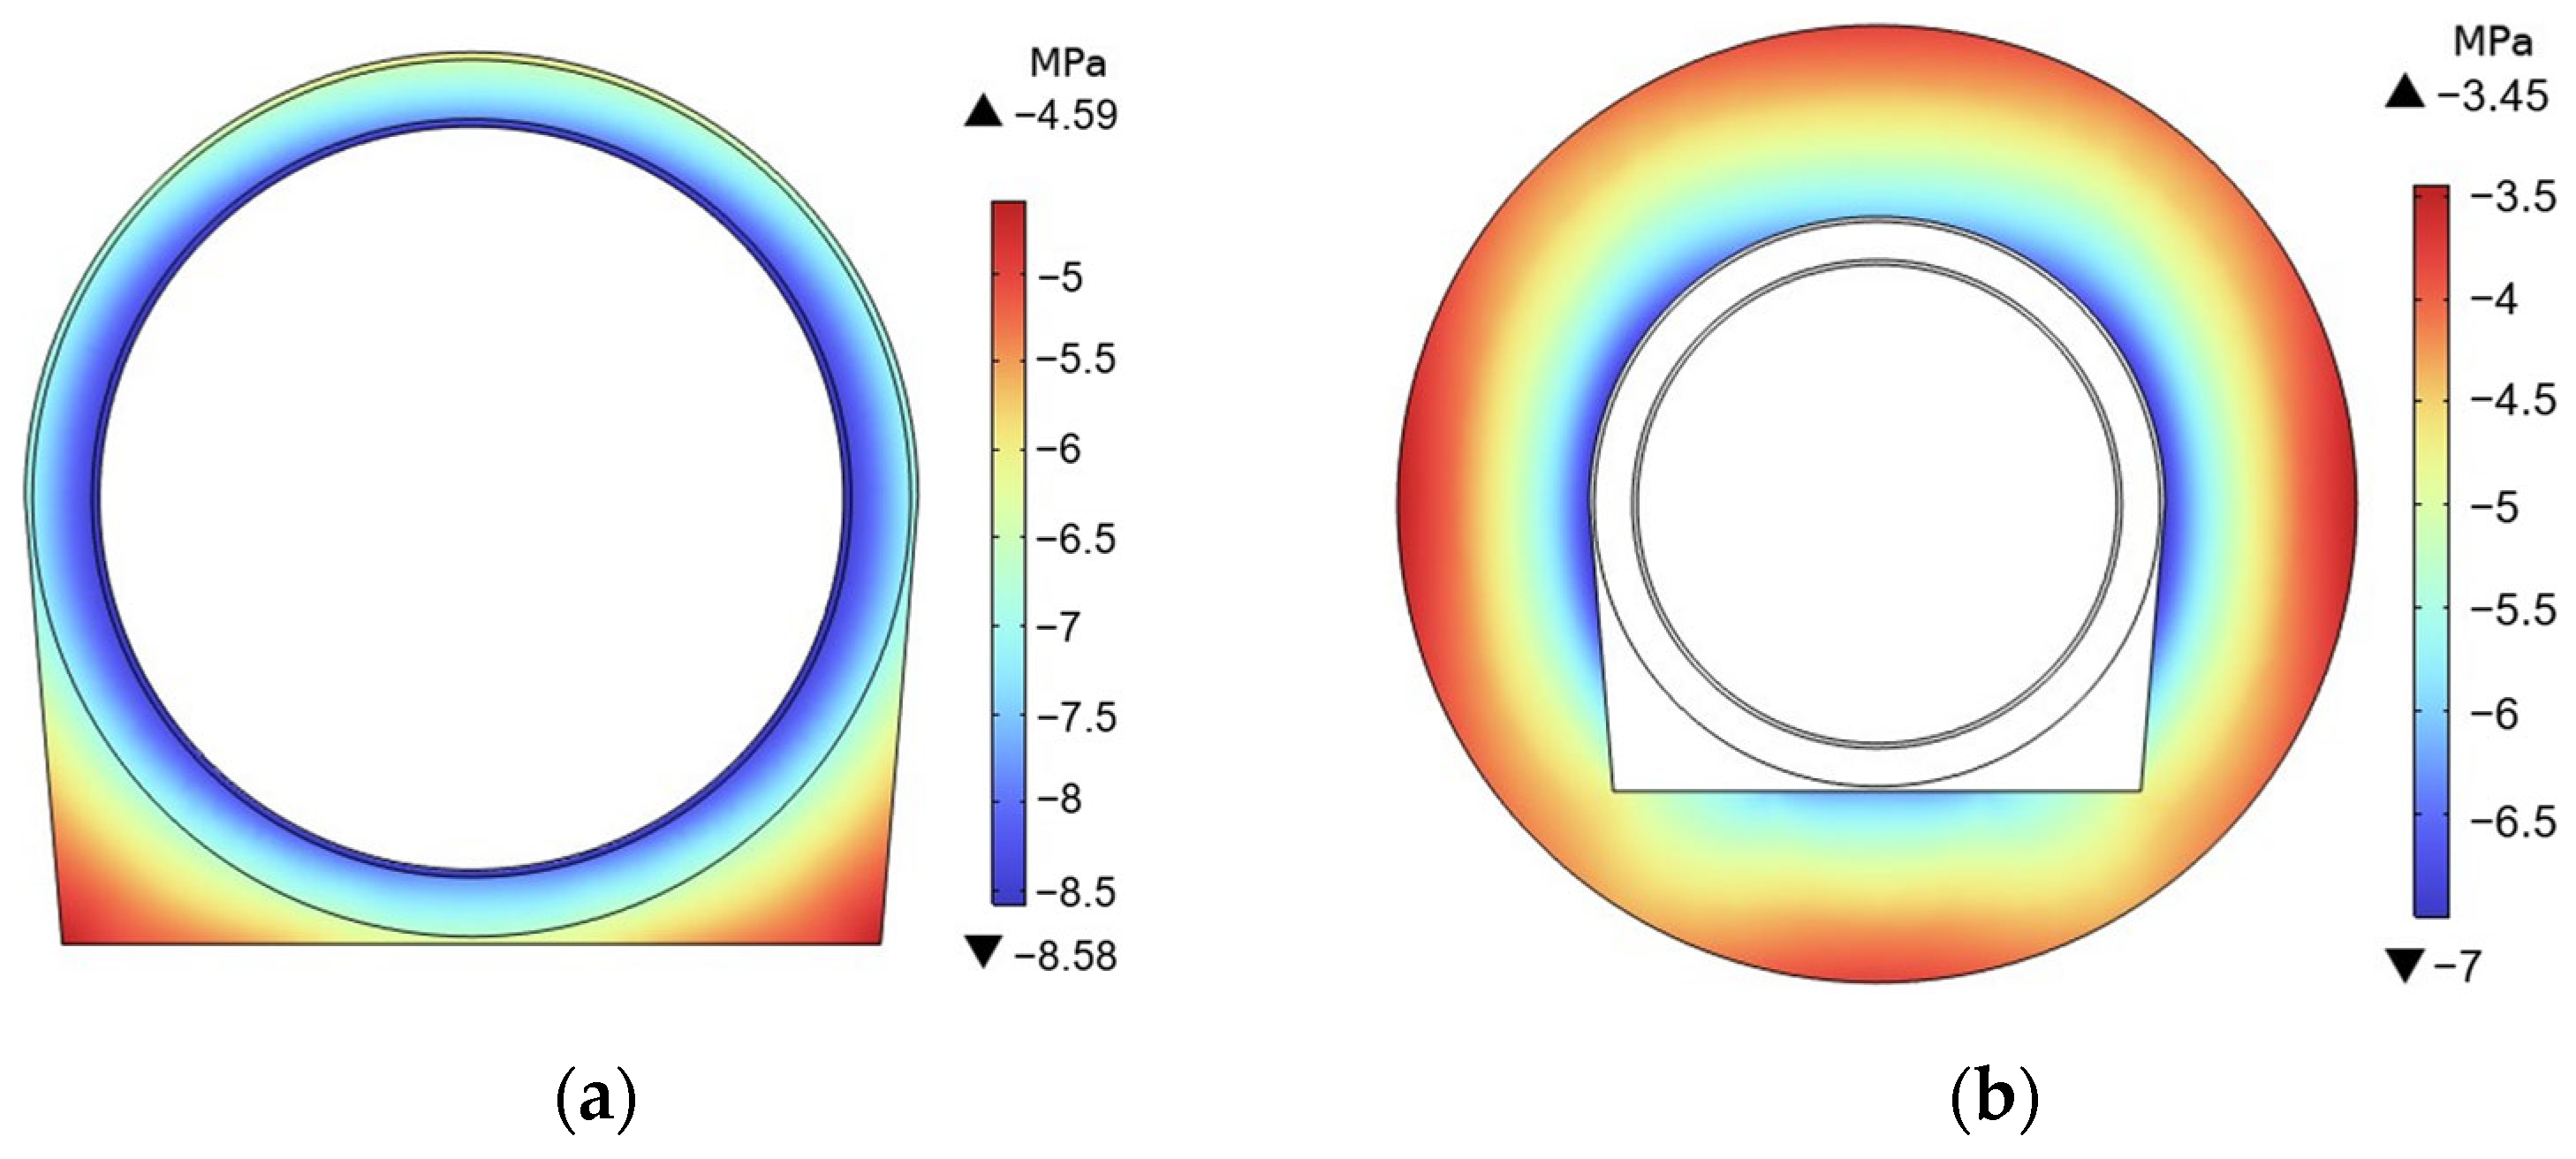
The third principal stress in the lining layer and the excavation damaged zone (EDZ), which is the radial compressive stress, forms a pair of interacting forces that are parallel but opposite in direction to the internal compressive stress within the cavern. The magnitude and distribution of the third principal stress in each structural layer reflect the load-sharing role of each layer in bearing the internal compressive stress of the cavern. Figure 12 and Figure 13 illustrate the distribution of the third principal stress in the lining structure layers and the EDZ for models SF-3 and DJ-3, respectively (with the internal pressure borne by the inner wall of the FRP sealing layer being 8.73 MPa in both cases). In these Figures, the direction of the third principal stress is set as positive when directed from the cavern centre outward.
Figure 12.
SF-3 lining layer and EDZ third principal stress distribution: (a) the third principal stress distribution of the SF-3 lining layer; and (b) SF-3 EDZ third principal stress distribution.
Figure 13.
DJ-3 lining layer and EDZ third principal stress distribution: (a) the third principal stress distribution of the DJ-3 lining layer; and (b) DJ-3 EDZ third principal stress distribution.
At the same moment, the third principal stress in the lining layer and the EDZ exhibits a linear distribution inversely proportional to the radius, meaning that the closer to the inner surface of the cavern, the greater the third principal stress, and the higher the internal pressure it bears. By comparing the results, it can be observed that when only changing the internal diameter of the cavern from 3000 mm to 5000 mm, while keeping the lining thickness and internal pressure constant, the maximum internal pressure borne by the inner wall of the EDZ increases by 0.97 MPa. This indicates that the cavern diameter has a significant influence on the magnitude of internal stress sharing among the structural layers.
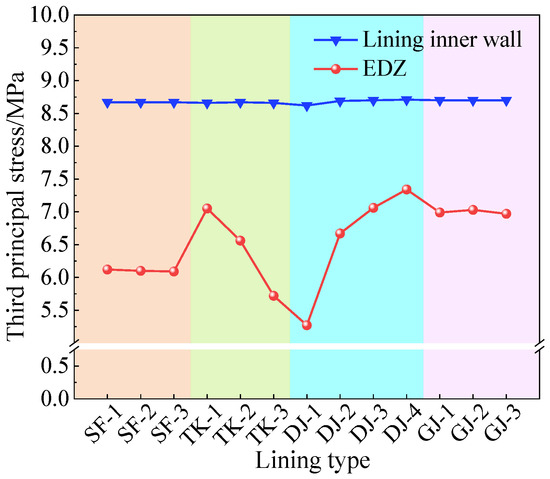
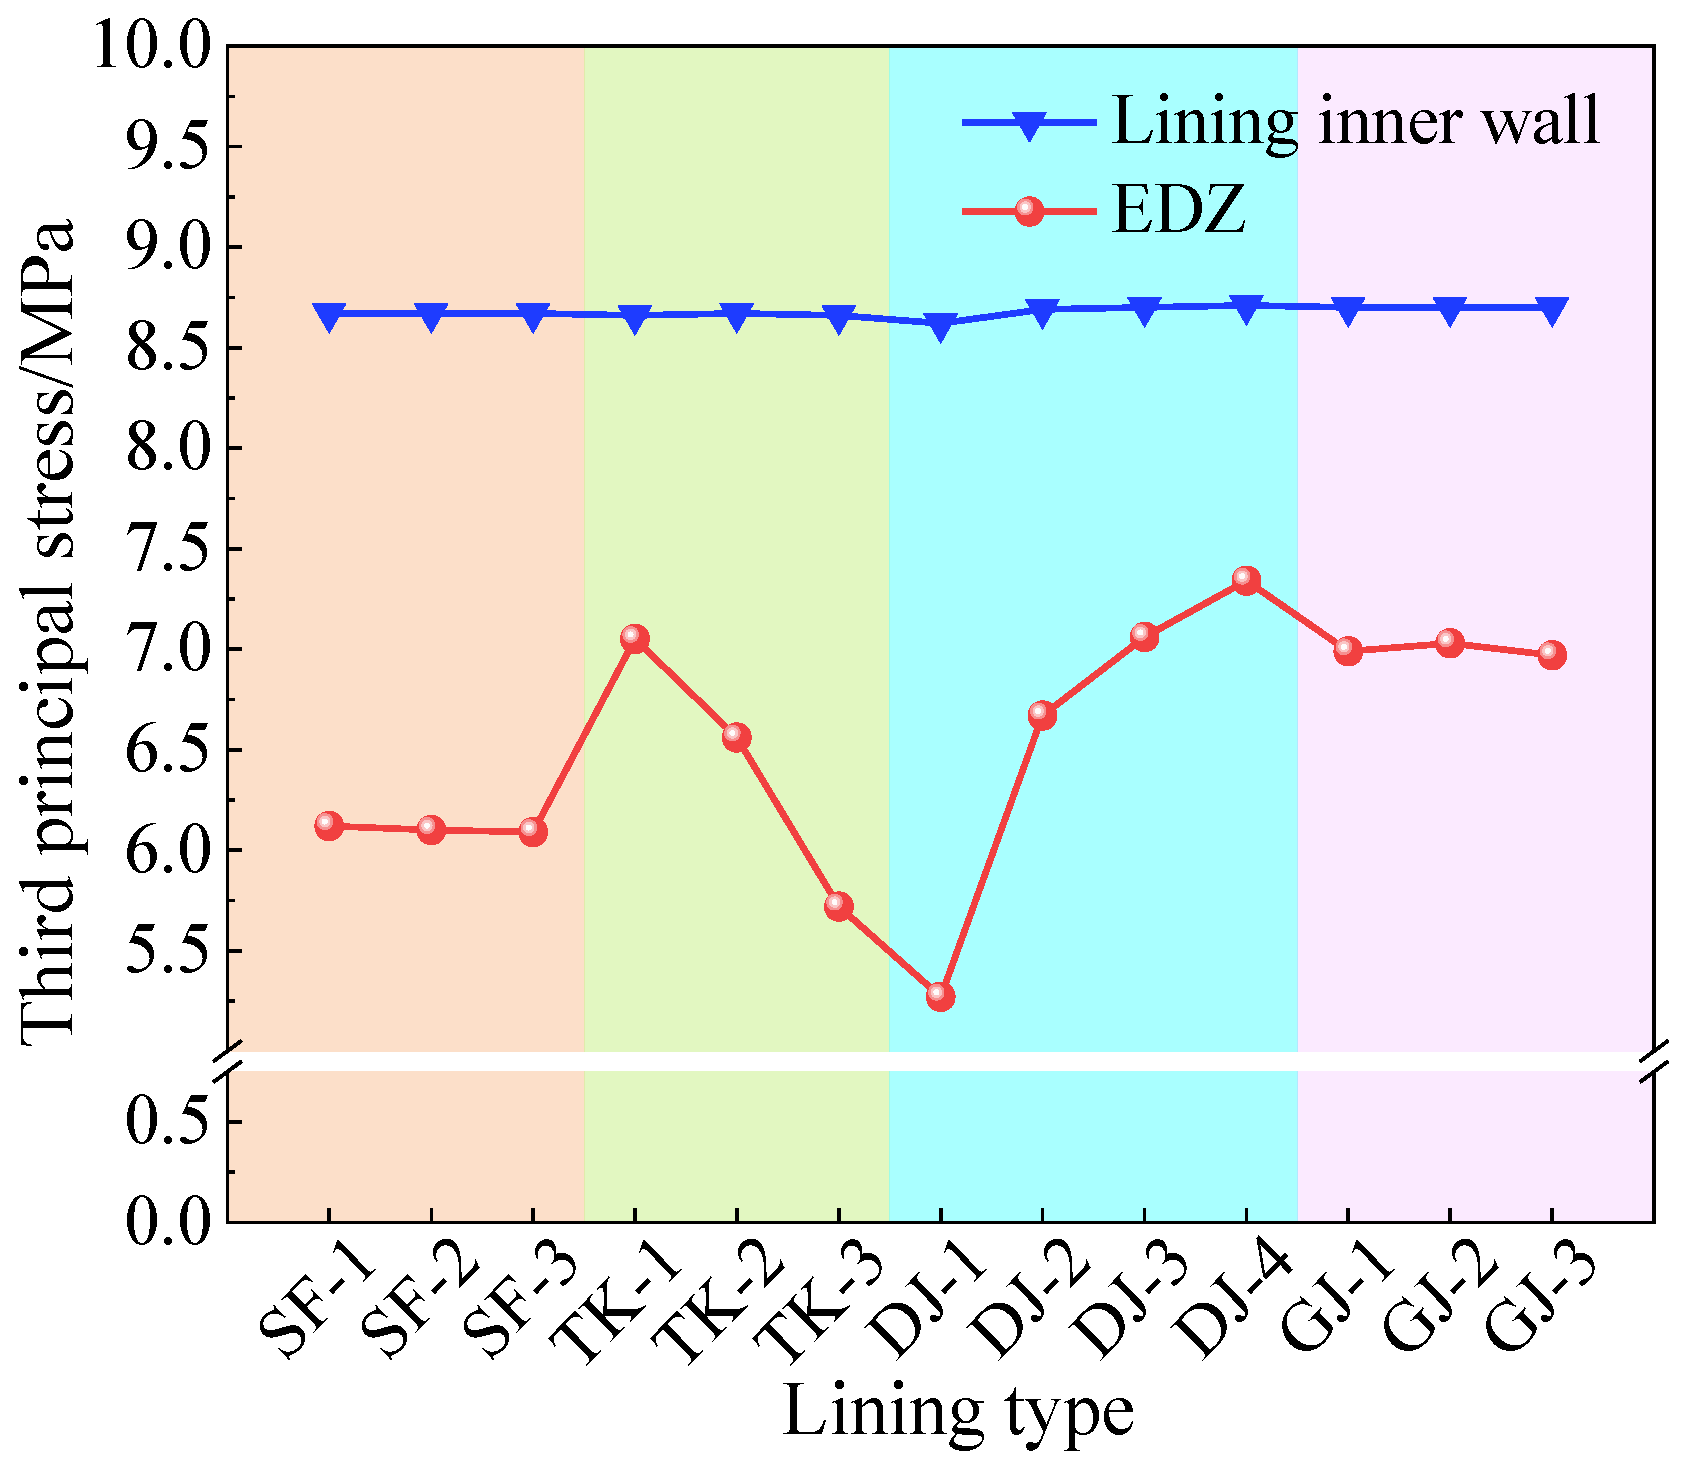
In addition, Figure 14 compares the maximum third principal stress on the lining inner walls and EDZ across different lining gas storage cavern models mentioned earlier (the inner walls of the FRP sealing layer subjected to 8.73 MPa gas pressure).
Figure 14.
Comparison of the maximum third principal stress between various lining inner walls and the inner walls of the EDZ.
The main observations include:
- (1)
- Function of steel fibre volume fraction: The tensile performance is significantly improved through the bridging effect of steel fibres. Within the volume fraction range of 0.5% to 1.5%, the internal pressure borne by the lining increases from 2.55 MPa to 2.58 MPa, which is a 6.2% to 7.5% improvement compared to plain concrete (2.4 MPa). It demonstrates that enhancing lining strength can bear more internal pressure and indirectly reduce the required surrounding rock strength.
- (2)
- Regulation of lining thickness: As the lining thickness increases from 300 mm to 600 mm in 100 mm increments, the maximum internal pressure on the EDZ inner wall decreases successively to 7.05 MPa, 6.56 MPa, 6.09 MPa, and 5.72 MPa, with reductions of 7%, 7.16%, and 6.08% between adjacent values. The increase in thickness enhances the section modulus and leads to stress redistribution, so that the lining itself carries a greater share of the internal pressure. The reduction in EDZ pressure becomes smaller beyond 500 mm, indicating that thicknesses in the 400 to 500 mm range provide a favourable balance between damage control and material economy.
- (3)
- Effect of cavern diameter: When the cavern diameter increases from 2000 mm to 6000 mm in 1000 mm increments, the maximum internal pressure on the EDZ inner wall rises successively to 5.27 MPa, 6.09 MPa, 6.67 MPa, 7.06 MPa, and 7.34 MPa, with increases of 15.6%, 9.5%, 5.8%, and 4.0%. As the cavern diameter increases at fixed lining thickness, the bending stiffness of the lining ring decreases, transferring more internal pressure to the surrounding rock, while the rate of pressure rise gradually slows. To avoid overloading the surrounding rock and ensure a reasonable storage volume, a cavern diameter of 2000–4000 mm is recommended.
- (4)
- Influence boundary of rebar: Adjustments to the diameter of circumferential rebar have less than a 3% impact on the distribution of radial compressive stress, verifying the mechanical division of labour where R-SFC matrix and surrounding rock primarily bear radial loads, while the steel fibres bear the principal hoop tensile stress and the rebars provide supplementary tensile capacity.
Based on the above analysis, the key factor influencing the lining’s ability to share internal pressure is the structural strength of the lining. A higher steel fibre volume fraction, greater lining thickness, and smaller cavern diameter result in better structural strength performance of the lining, allowing it to share more internal pressure with the surrounding rock. Conversely, poorer strength performance means the lining shares less internal pressure.
Among the parameters above, the lining thickness and cavern diameter jointly determine the geometric proportion of the lining–rock system. The thickness-to-diameter ratio is therefore introduced to comprehensively evaluate the influence of these two parameters on the EDZ inner-wall pressure. Within the thickness-to-diameter ratio range of 1/12 to 1/4 considered in this study, a larger ratio increases the pressure borne by the lining, thereby reducing the EDZ pressure. However, when the thickness-to-diameter ratio exceeds 1/5, the further reduction in EDZ pressure becomes increasingly less pronounced, while the lining becomes overly thick, increasing material cost and reducing storage volume. Conversely, when the thickness-to-diameter ratio falls below 1/8, the EDZ inner wall carries an excessive proportion of the total internal pressure (e.g., at a thickness-to-diameter ratio of 1/10, this proportion already reaches 81.4%), raising the demand on the surrounding rock strength and increasing lining damage. Hence, to balance lining structural safety, rock stability, material cost, and storage volume, a thickness-to-diameter ratio of 1/8 to 1/5 is recommended for the design of R-SFC linings.
4. PSO-Based Lining Prediction and Multi-Objective Optimisation
Optimisation research on structures influenced by multiple parameters in synergy requires a large amount of data to support the optimisation process. To meet this requirement, this study is based on MATLAB software (version R2022a), where a PSO-BP neural network model for predicting lining structures is constructed to explore the influence of multiple factors acting together on lining performance. The prediction model is used as a data supplement, and the MOPSO algorithm [47] is adopted to optimise the structure. The optimisation objectives are the cavern diameter parameter, which considers cost, and the lining tensile damage parameter, which measures the performance of the lining structure. As mentioned earlier, compared to other optimisation algorithms, the PSO algorithm has advantages such as ease of implementation, fewer parameters to adjust, fast convergence, strong robustness, and the ability to easily escape local optima. These features make it suitable for training complex models in high-dimensional parameter spaces, which is why PSO is applicable for this study.
4.1. Data Preparation
Orthogonal design tables are a type of experimental design method characterised by the ability to efficiently analyse the effects of multiple factors and their interactions on experiments through minimal trial runs. This method is widely applied in the optimisation of multi-factor, multi-level experiments.
To ensure the accuracy of the prediction results from the PSO-BP neural network prediction model, sufficient data that can evenly reflect the effects of multiple factors on the performance of the lining is required. This study referenced the design principles of orthogonal design tables and, on this basis, added some factor combinations within orthogonal matrices to design the model training data table. Parameters within the table were used to construct the model and calculate the corresponding maximum tensile damage of the lining per cycle. The model training data is presented in Appendix A.
4.2. Construction and Results of the PSO-BP Prediction Model
4.2.1. PSO-BP Parameter Setting
The PSO-BP prediction model requires the construction of both a backpropagation neural network model and a PSO algorithm model. For constructing the backpropagation neural network: import the simulation training data, set the steel fibre volume fraction, lining thickness, cavern diameter, and inner and outer ring reinforcement bar diameters as input parameters, and set the maximum tensile damage parameter as the output parameter. Randomly shuffle the training data and divide it into training and testing sets in an 8:2 ratio. The training set is used to train the neural network to determine the weights and thresholds between inputs and outputs, while the testing set is used to compare expected results with training outcomes to derive the expected error, which also serves as the fitness value for PSO algorithm particles. To eliminate dimensional differences between data, normalise all data. Then, define the neural network parameters: the number of input layer nodes corresponds to the number of independent variables (5-dimensional), the number of output layer nodes corresponds to the number of prediction targets (1-dimensional), and the number of hidden layers is set to 11. Use functions from the MATLAB toolbox to construct the neural network, setting the network training parameters as follows: target error to 1 × 10⁻⁶ and learning rate to 0.01. To construct the PSO algorithm model, first define the PSO parameters by setting both learning factors to 2, the maximum iteration count to 500, the particle swarm size to 50, the initial weight to 0.9, and the final weight to 0.4.
4.2.2. Forecast Results
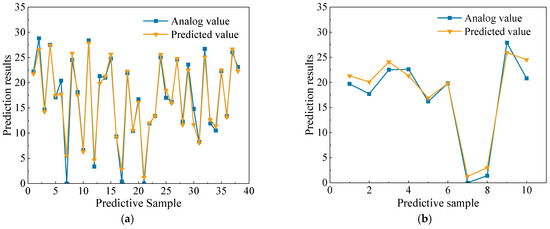
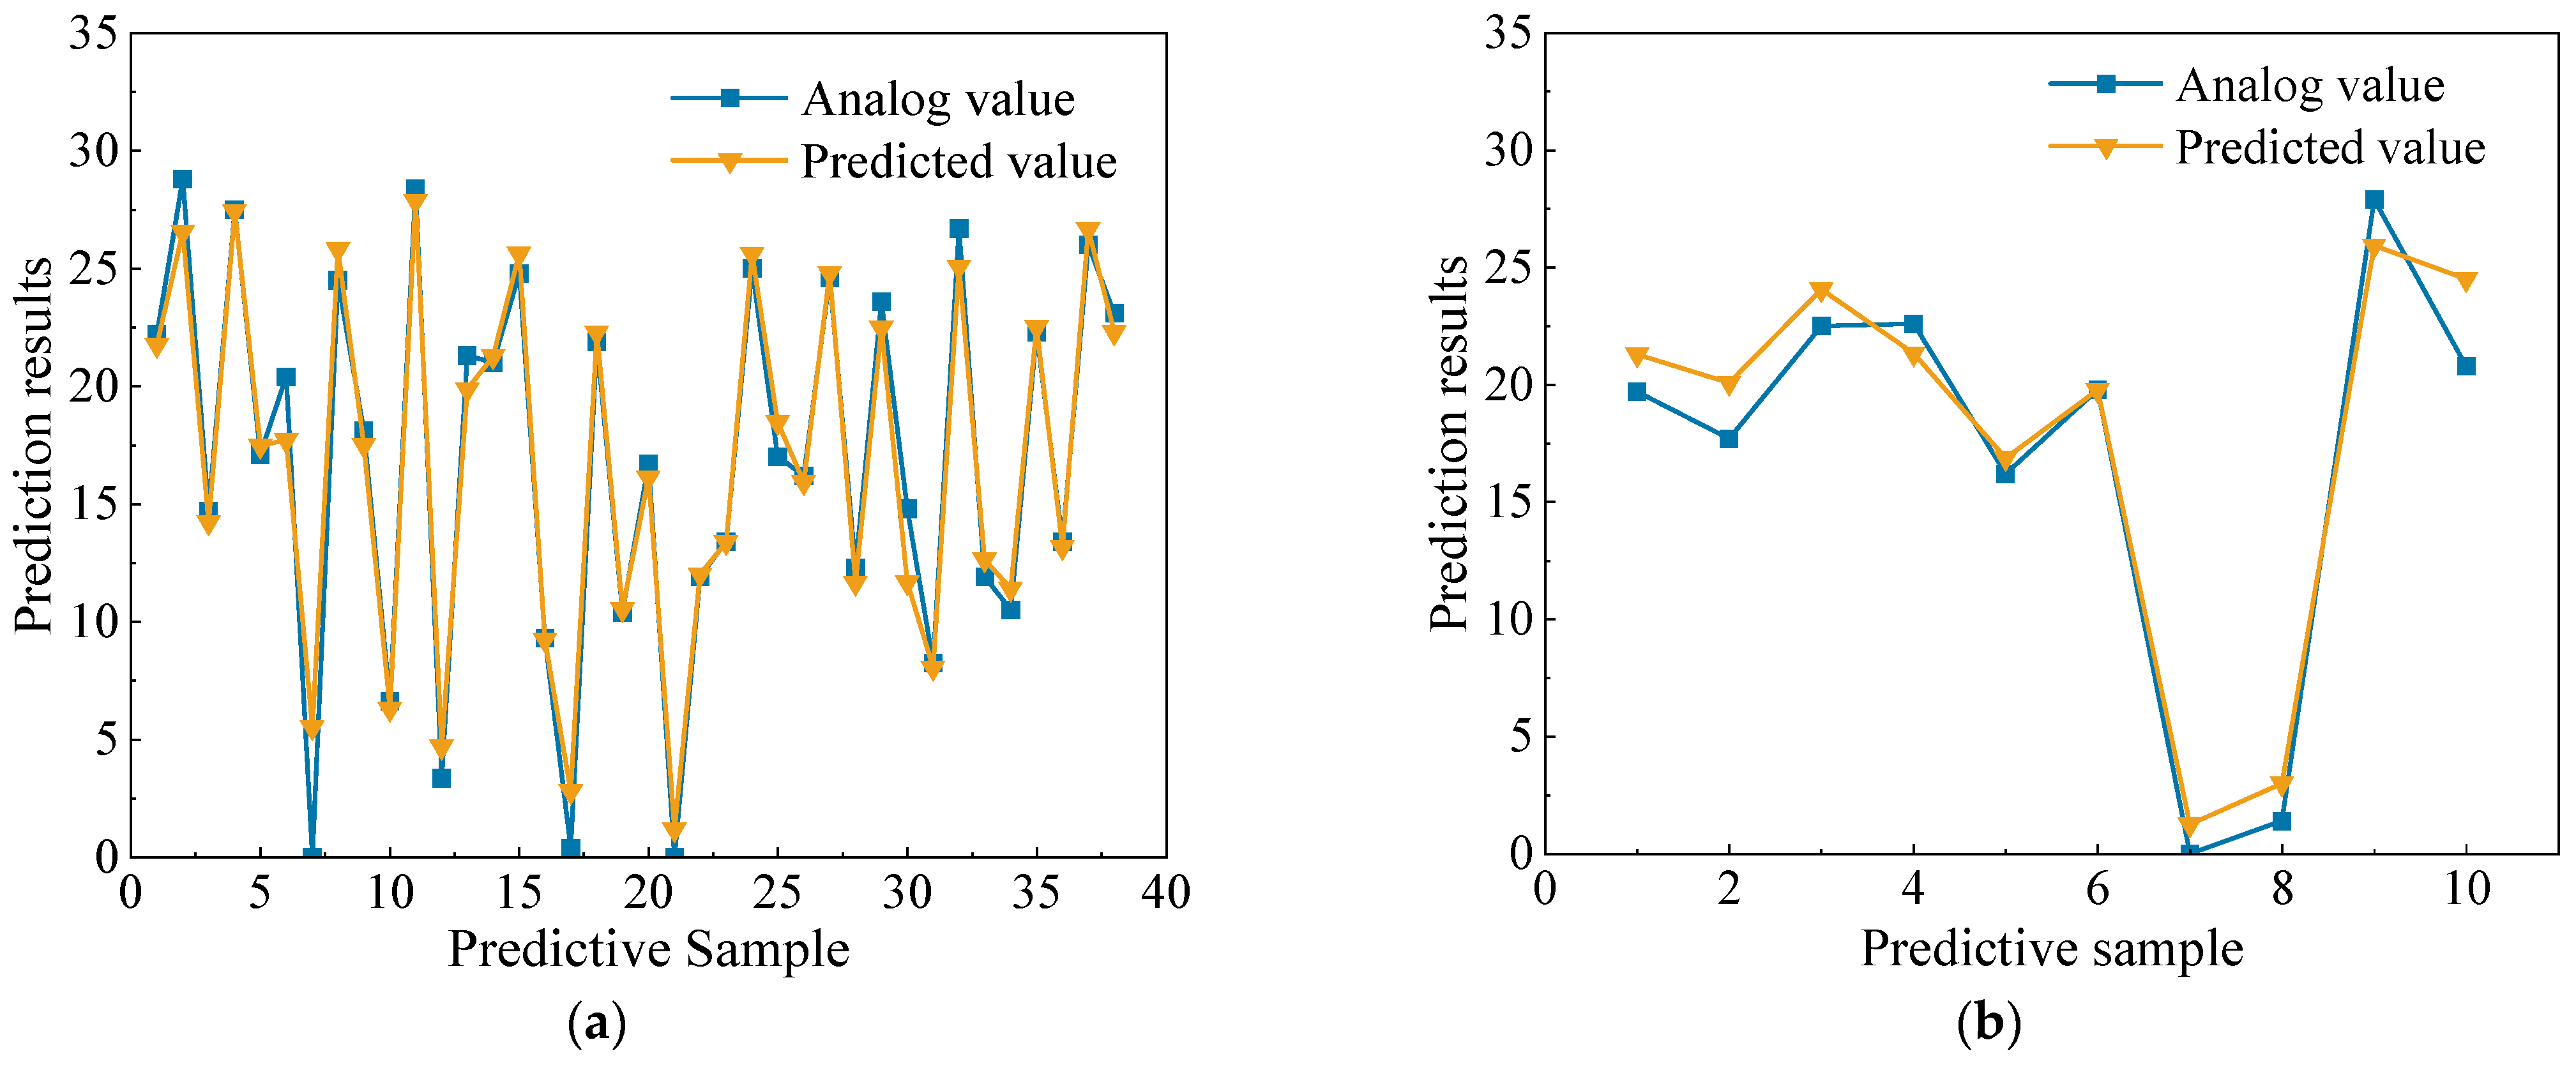
As shown in Figure 15, the training set prediction accuracy and testing set training accuracy of the predicted parameters (lining tensile damage) obtained from the PSO-BP prediction model are both above 95%, indicating good model training accuracy. This can provide reliable data support for subsequent multi-objective structural optimisation work.
Figure 15.
PSO-BP neural network training diagram: (a) lining tensile damage training set data prediction; and (b) lining tensile damage test set data prediction.
4.3. Optimisation of R-SFC Lining by MOPSO Algorithm
In this study, the performance of the lining structure is influenced by multiple factors such as cavern diameter, lining thickness, concrete steel fibre dosage, and reinforcement bar diameter within the lining. Additionally, there is a contradiction between structural performance, safety requirements, and cost control. Therefore, this paper proposes the use of the MOPSO algorithm, which has the advantages of efficient search, simultaneous handling of multiple conflicting objective functions, and achieving a good balance between global search and local optimisation to avoid falling into local optima, to optimise the lining structure and provide high-quality and diversified solutions for practical engineering applications.
To facilitate subsequent verification of the optimisation results, parameters affecting tensile damage in the lining are discretized, as shown in Table 7, where the rebar diameters follow the standard specifications [42]. In the MOPSO model of this study, the parameters are set as follows: maximum iteration count of 200, particle swarm size of 150, external archive size of 200, initial inertia weight of 0.95, final weight of 0.3, and learning factors set to 2.2 and 1.8, respectively. Normalise the input and output data. Use a neural network to predict and obtain the output results. Set the training objective: cavern diameter and lining damage (the algorithm aims to find the minimum value, so the cavern diameter parameter is set to train for the opposite value). After constructing the model, we performed the training, and the corresponding results are shown in Figure 16.
Table 7.
Range of design variables.
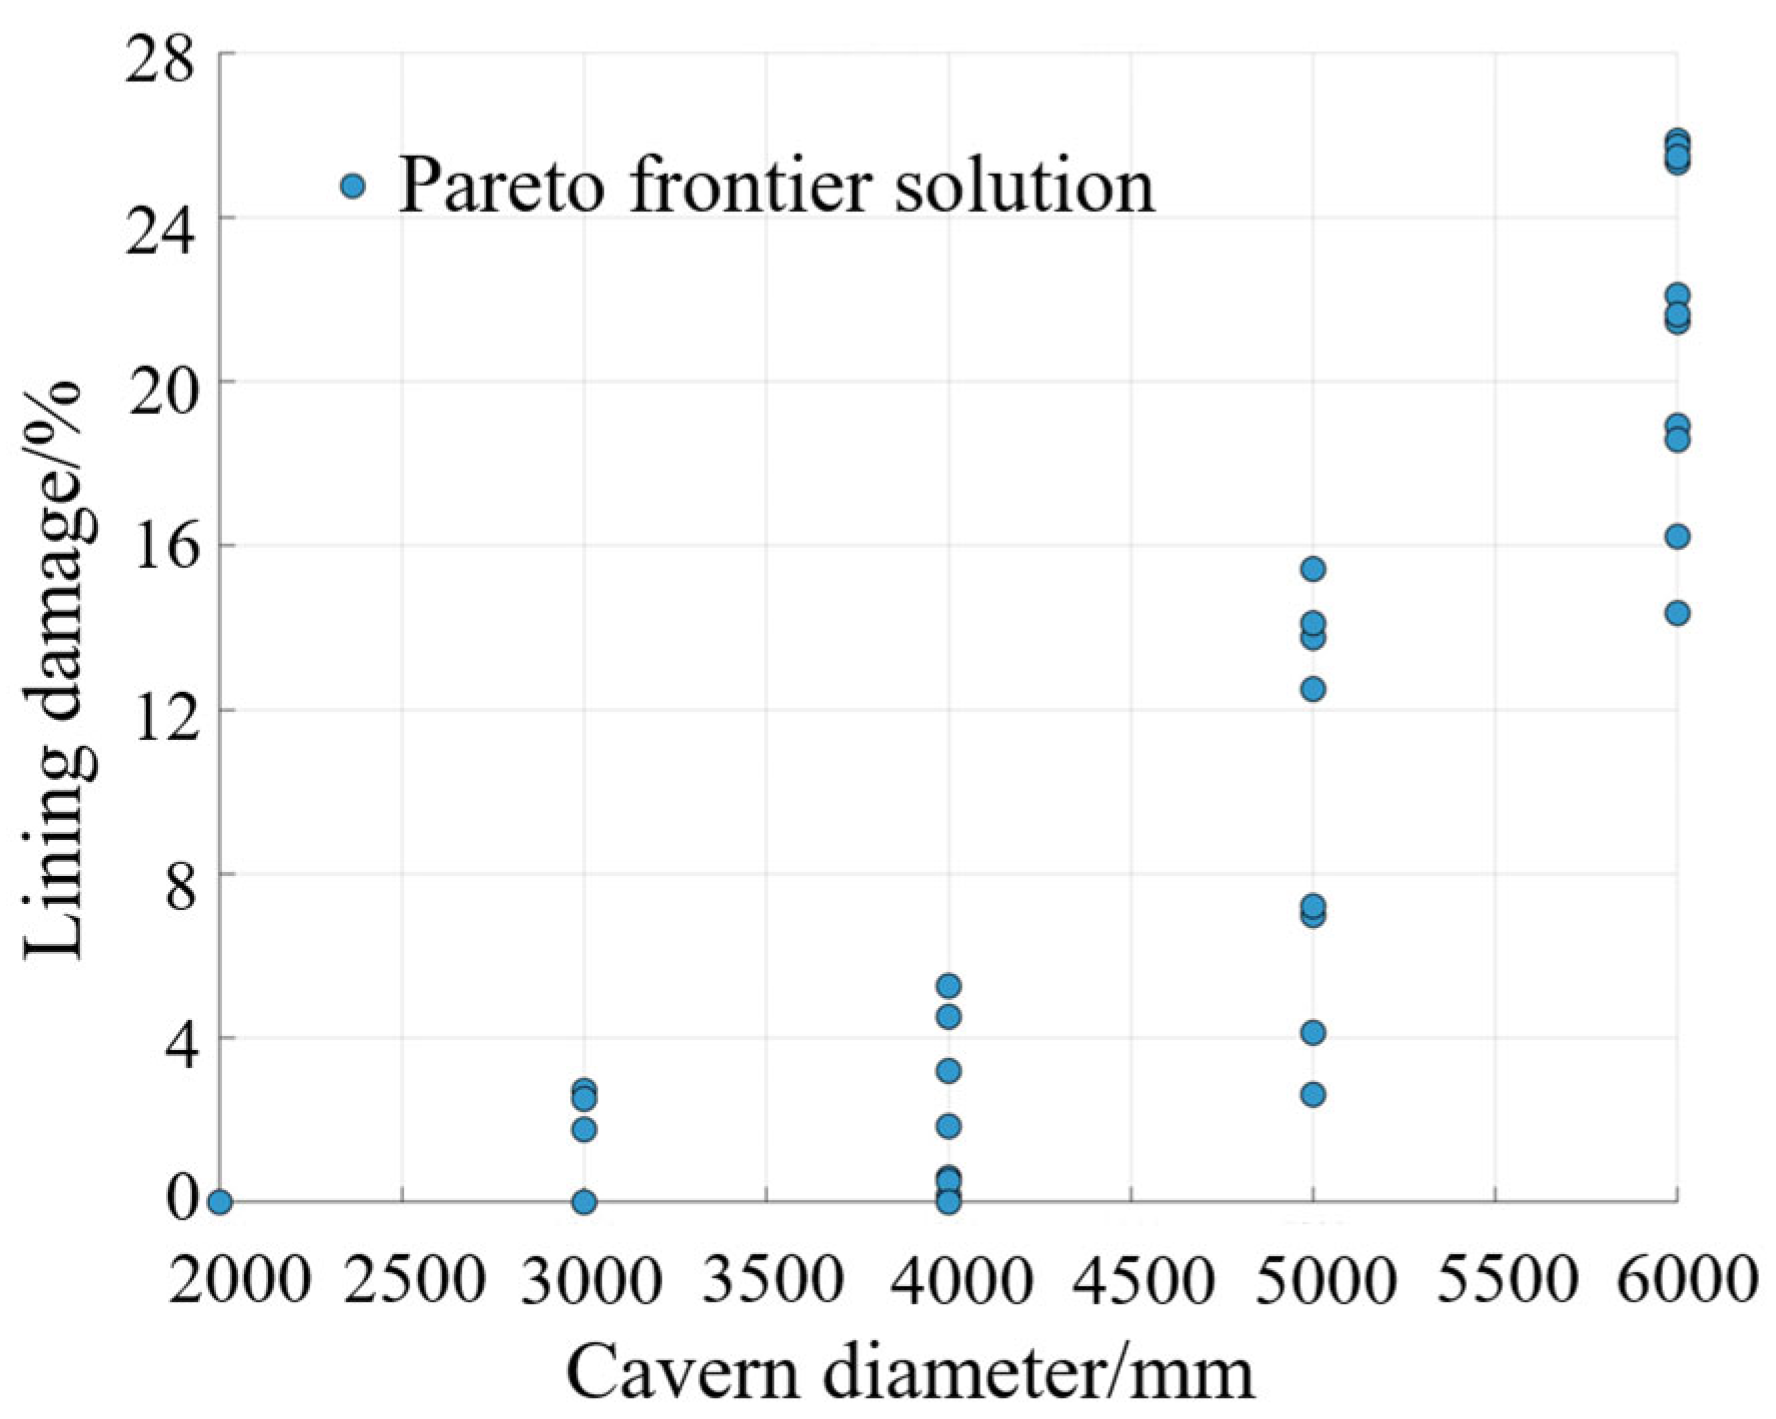
Figure 16.
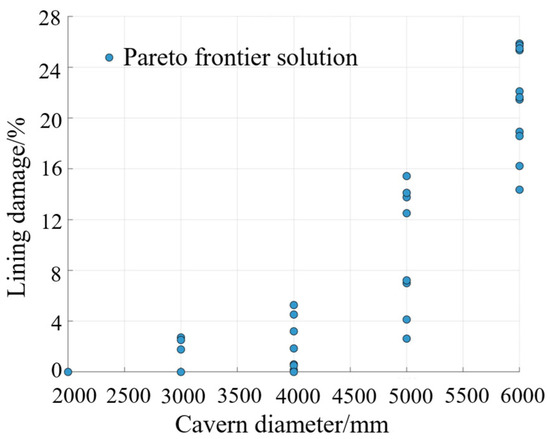
Pareto frontier solution set distribution.
From the Pareto frontier solution set derived from model training, it can be observed that a higher steel fibre volume fraction, a thicker lining thickness, a smaller cavern diameter, and a larger reinforcement bar diameter result in a lower lining damage rate. Conversely, the lining damage rate would be higher. The distribution of Pareto optimal solutions indicates that R-SFC linings are more suitable for cavern diameters of 4000 mm and above.
After excluding unrealistic zero-damage solutions from the Pareto set, eight representative combinations of lining design parameters are presented in Table 8. It can be observed that linings with a cavern diameter of 6000 mm generally exhibit more serious tensile damage, which is consistent with the preceding analysis. The design combinations in Types 5 and 6 (see Table 8) demonstrate the best control over lining tensile damage, and their thickness-to-diameter ratios satisfy the aforementioned recommended range (1/8–1/5). A comparison between Types 7 and 8 shows that the rebar diameter has a relatively small effect on controlling tensile damage when other parameters are fixed.
Table 8.
Eight types of optimal solutions obtained through optimisation.
To provide clearer engineering guidance, two preferred designs are recommended from the trade-off solutions. For minimising tensile damage, Type 5 is selected, with a steel fibre volume fraction of 1.5%, a lining thickness of 500 mm, a cavern diameter of 4000 mm, outer rebar 28 mm, and inner rebar 22 mm, achieving a tensile damage of 4.25%. Meanwhile, for maximising cavern diameter while maintaining a low damage level and satisfying the optimal thickness-to-diameter ratio range, Type 6 is recommended, with a steel fibre volume fraction of 1.5%, a lining thickness of 600 mm, a cavern diameter of 5000 mm, outer rebar 25 mm, and inner rebar 20 mm, achieving a tensile damage of 6.86%.
To further validate the reliability of the MOPSO model optimisation data, three typical types from Table 8 were selected for modelling calculations, and the optimised predicted values were compared with the numerical simulation results, as shown in Table 9. The results show that the lining damage error for each group is less than 5%, which validates the reliability of the optimisation results.
Table 9.
Comparison between optimised prediction and numerical simulation results.
5. Conclusions and Future Work
Focusing on enhancing the tensile resistance and crack propagation resistance of CAES underground lined gas storage caverns, this study proposes a novel R-SFC lining structure. A coupled thermo-mechanical damage-plasticity model is developed to investigate the damage evolution mechanisms and design optimisation strategies for the R-SFC lining structure under multi-parameter coupling effects. The principal conclusions are as follows:
- (1)
- The incorporation of steel fibres significantly enhances the tensile and cracking resistance of concrete linings, with increased fibre volume fraction improving the uniformity of tensile damage distribution. The proposed R-SFC lining is shown to provide a clear structural advantage over the conventional reinforced concrete lining, with simultaneous reductions in maximum tensile damage and steel consumption.
- (2)
- The R-SFC lining shares the internal pressure with the surrounding rock through complementary mechanical roles, in which the concrete lining and the surrounding rock jointly resist the radial compressive load, while the steel fibres bear the principal hoop tensile stress and the rebars provide supplementary hoop tensile capacity. Accordingly, the rebar diameter primarily contributes to hoop tensile reinforcement, with only a limited influence on the radial pressure distribution between the lining and the surrounding rock.
- (3)
- The thickness-to-diameter ratio is identified as the key geometric parameter governing structural response, with larger ratios reducing tensile damage in the lining and decreasing the pressure transmitted to the surrounding rock. Within the parameter range of this study (lining thickness of 300–600 mm, cavern diameter of 2000–6000 mm, steel fibre volume fraction of 0.5–1.5%, and double row steel bar diameter of 18–28 mm), a thickness-to-diameter ratio of 1/8 to 1/5 is recommended for the geometric design of R-SFC lining in horizontal cylindrical CAES caverns at large burial depth, balancing lining damage against surrounding rock loading.
- (4)
- An MOPSO framework based on PSO-BP surrogate model was implemented to balance lining tensile damage against cavern diameter. The Pareto front confirms that the R-SFC lining is advantageous at cavern diameters around 4 m. From this front, two preferred designs within the recommended thickness-to-diameter range are derived for different engineering priorities, one targeting minimum tensile damage and the other targeting a larger cavern diameter for greater storage capacity.
By combining rebar and steel fibres, the R-SFC lining scheme reduces steel consumption while maintaining structural performance, thereby alleviating the redundant rebar configuration commonly seen in traditional linings. This not only lowers material costs but also relaxes the site selection requirements for CAES cavern surrounding rock, thereby enhancing the applicability of the proposed lining system to a broader range of geological conditions, particularly for the large-scale construction of supporting caverns in wind–solar hybrid energy storage power plants. For computational efficiency at the preliminary design stage, the present study adopts a 2D plane strain model, assuming a horizontal cylindrical cavern with axially uniform loading, and focuses on the structural response within a single charge–storage–discharge cycle. However, to capture axial-end effects, three-dimensional stress redistribution of the surrounding rock and long-term cyclic damage accumulation, future work will establish a 3D thermo-mechanical coupling model supported by laboratory cyclic-loading tests on R-SFC specimens and validated against in situ monitoring data from field CAES caverns. In addition, the preliminary cost comparison, currently limited to primary steel materials, will be extended to a full life-cycle cost evaluation incorporating auxiliary materials, labour, and maintenance costs, thereby providing a more comprehensive engineering assessment of the R-SFC lining system.
Author Contributions
Conceptualization, Y.Z. and S.Z.; methodology, S.Z. and F.L.; software, F.L.; validation, S.Z., F.L., and Y.Z.; formal analysis, F.L. and B.W.; investigation, R.Y. and F.L.; resources, Y.S. and Z.L.; data curation, S.Z. and F.L.; writing—original draft preparation, S.Z. and F.L.; writing—review and editing, S.Z., F.L., and Y.Z.; visualisation, F.L. and B.W.; supervision, Y.Z., S.Z., and Z.L.; project administration, S.Z. and R.Y.; funding acquisition, S.Z. All authors have read and agreed to the published version of the manuscript.
Funding
This research was funded by the Xi’an Science and Technology Planning Project (No. 2024JH-ZCLGG-0031), the Key Research and Development Project of Shaanxi Province (No. 2024SF2-GJHX-47), and the Natural Science Basic Research Program of Shaanxi Province (No. 2025JC-YBQN-518).
Institutional Review Board Statement
Not applicable.
Informed Consent Statement
Not applicable.
Data Availability Statement
The datasets used during the current study are available from the corresponding author upon reasonable request.
Conflicts of Interest
Authors Rong Yang and Yang Shao were employed by the China JIKAN Research Institute of Engineering Investigations and Design Co., Ltd. Author Bingyi Wang was employed by the China United Northwest Institute for Engineering Design & Research Co., Ltd. The remaining authors declare that the research was conducted in the absence of any commercial or financial relationships that could be construed as potential conflicts of interest.
Abbreviations
The following abbreviations are used in this manuscript:
| CAES | Compressed air energy storage |
| EDZ | Excavation-disturbed zone |
| FRP | Fibre-reinforced plastic |
| MOPSO | Multi-objective particle swarm optimisation |
| PSO | Particle swarm optimisation |
| PSO-BP | Particle swarm optimisation-backpropagation |
| R-SFC | Reinforced-steel fibre concrete |
| SFRC | Steel fibre-reinforced concrete |
Appendix A
Table A1.
Model training data.
References
- IEA. World Energy Outlook 2022; International Energy Agency (IEA): Paris, France, 2022. [Google Scholar]
- IEA. Renewables 2022; International Energy Agency (IEA): Paris, France, 2022. [Google Scholar]
- Wei, X.X.; Ban, S.N.; Shi, X.L.; Li, P.; Li, Y.P.; Zhu, S.J.; Yang, K.; Bai, W.Z.; Yang, C.H. Carbon and energy storage in salt caverns under the background of carbon neutralization in China. Energy 2023, 272, 127120. [Google Scholar] [CrossRef] [Scilit]
- Denholm, P.; Kulcinski, G.L. Life cycle energy requirements and greenhouse gas emissions from large scale energy storage systems. Energy Convers. Manag. 2004, 45, 2153–2172. [Google Scholar] [CrossRef] [Scilit]
- Chen, Y.Z.; Hill, D.; Billings, B.; Hedengren, J.; Powell, K. Hydrogen underground storage for grid electricity storage: An optimization study on techno-economic analysis. Energy Convers. Manag. 2024, 322, 119115. [Google Scholar] [CrossRef] [Scilit]
- Killer, M.; Farrokhseresht, M.; Paterakis, N.G. Implementation of large-scale Li-ion battery energy storage systems within the EMEA region. Appl. Energy 2020, 260, 114166. [Google Scholar] [CrossRef] [Scilit]
- Minakshi, M.; Nallathamby, K.; Mitchell, D.R.G. Electrochemical characterization of an aqueous lithium rechargeable battery: The effect of CeO2 additions to the MnO2 cathode. J. Alloys Compd. 2009, 479, 87–90. [Google Scholar] [CrossRef] [Scilit]
- Zhao, H.R.; Wu, Q.W.; Hu, S.J.; Xu, H.H.; Rasmussen, C.N. Review of energy storage system for wind power integration support. Appl. Energy 2015, 137, 545–553. [Google Scholar] [CrossRef] [Scilit]
- Fan, C.H.; Li, M.J.; Li, M.J.; Chen, L.J.; Liu, Z.B. Performance analysis and optimization of an adiabatic compressed air energy storage system coupled with the packed-bed thermal energy storage device. Energy 2025, 324, 135939. [Google Scholar] [CrossRef] [Scilit]
- Qiao, M.M.; Hao, R.J.; Zhang, H.S.; Li, H.L.; Zhang, Y.P.; Liu, H.Y.; Duan, C.H.; Qin, J.Y. Energy, exergy, economic and environmental (4E) evaluation of an improved cogeneration system based on compressed air energy storage and absorption heat pump. Energy 2025, 331, 136797. [Google Scholar] [CrossRef] [Scilit]
- Ge, G.Q.; Cai, X.C.; Sun, H.; Zhang, Y.F.; Wang, H.R.; Li, R.X. Optimization design of an adiabatic compressed air energy storage system with sliding pressure operation and packed bed thermal energy storage based on a one-dimensional loss model. Energy Convers. Manag. 2025, 328, 119626. [Google Scholar] [CrossRef] [Scilit]
- Shi, W.J.; Liang, Y.R.; Ding, R.C.; Su, W.; Lin, X.X.; Wang, J.Q. Thermal-economic performance analysis of AA-CAES system with multi-objective optimization. J. Energy Storage 2025, 117, 116177. [Google Scholar] [CrossRef] [Scilit]
- Cheayb, M.; Gallego, M.M.; Tazerout, M.; Poncet, S. A techno-economic analysis of small-scale trigenerative compressed air energy storage system. Energy 2022, 239, 121842. [Google Scholar] [CrossRef] [Scilit]
- Zhang, Y.; Liu, J.X.; Yin, S.Z.; Su, C.Q.; Liu, Z. Design and performance analysis of a novel compressed air–liquid CO2 energy storage. Energy Convers. Manag. 2024, 301, 118068. [Google Scholar] [CrossRef] [Scilit]
- Wallace, L.R.; Cai, Z.; Zhang, H.; Guo, C.B. Numerical investigations into the comparison of hydrogen and gas mixtures storage within salt caverns. Energy 2024, 311, 133369. [Google Scholar] [CrossRef] [Scilit]
- Han, Y.; Ma, H.; Yang, C.; Li, H.; Yang, J. The mechanical behavior of rock salt under different confining pressure unloading rates during compressed air energy storage (CAES). J. Pet. Sci. Eng. 2021, 196, 107676. [Google Scholar] [CrossRef] [Scilit]
- Liu, W.; Jiang, D.Y.; Chen, J.; Daemen, J.J.K.; Tang, K.; Wu, F. Comprehensive feasibility study of two-well-horizontal caverns for natural gas storage in thinly-bedded salt rocks in China. Energy 2018, 143, 1006–1019. [Google Scholar] [CrossRef] [Scilit]
- Wang, X.P.; Wang, J.B.; Zhang, Q.; Song, Z.P.; Liu, X.R.; Feng, S.J. Long-term stability analysis and evaluation of salt cavern compressed air energy storage power plant under creep-fatigue interaction. J. Energy Storage 2022, 55, 105843. [Google Scholar] [CrossRef] [Scilit]
- Ma, Y.; Rao, Q.H.; Huang, D.Y.; Li, P.; Yi, W.; Sun, D.L. A new theoretical model of thermo-gas-mechanical (TGM) coupling field for underground multi-layered cavern of compressed air energy storage. Energy 2022, 257, 124646. [Google Scholar] [CrossRef] [Scilit]
- Lu, M. Finite element analysis of a pilot gas storage in rock cavern under high pressure. Eng. Geol. 1998, 49, 353–361. [Google Scholar] [CrossRef] [Scilit]
- Qin, S.; Xia, C.; Zhou, S. Air tightness of compressed air storage energy caverns with polymer sealing layer subjected to various air pressures. J. Rock Mech. Geotech. Eng. 2023, 15, 2105–2116. [Google Scholar] [CrossRef] [Scilit]
- Jiang, Z.M.; Li, P.; Tang, D.; Zhao, H.B.; Li, Y. Experimental and Numerical Investigations of Small-Scale Lined Rock Cavern at Shallow Depth for Compressed Air Energy Storage. Rock Mech. Rock Eng. 2020, 53, 2671–2683. [Google Scholar] [CrossRef] [Scilit]
- Kim, H.M.; Rutqvist, J.; Ryu, D.W.; Choi, B.H.; Sunwoo, C.; Song, W.K. Exploring the concept of compressed air energy storage (CAES) in lined rock caverns at shallow depth: A modeling study of air tightness and energy balance. Appl. Energy 2012, 92, 653–667. [Google Scholar] [CrossRef] [Scilit]
- Li, P.; Kang, H.; Zhu, Q.; Wu, Y.; Zhang, J.; Fan, L.Y.; Wang, Z. Numerical and experimental investigations of concrete lined compressed air energy storage system. J. Clean. Prod. 2023, 390, 136153. [Google Scholar] [CrossRef] [Scilit]
- Fischer, G.; Li, V.C. Effect of fiber reinforcement on the response of structural members. Eng. Fract. Mech. 2007, 74, 258–272. [Google Scholar] [CrossRef] [Scilit]
- Khan, M.; Cao, M.; Ali, M. Cracking behaviour and constitutive modelling of hybrid fibre reinforced concrete. J. Build. Eng. 2020, 30, 101272. [Google Scholar] [CrossRef] [Scilit]
- Meng, G.; Liu, G.; Su, S.; Li, H.T.; Liang, J.Y.; Zhu, X.; Cai, M.L. Optimization of reinforced-steel fiber concrete secondary lining design for mountain caverns: Field tests and numerical simulations. Constr. Build. Mater. 2025, 477, 141301. [Google Scholar] [CrossRef] [Scilit]
- Geng, X.; Sun, G.H.; Wu, K.; Yao, Y.F.; Ji, W.D.; Yu, X.Y.; Wang, J. Thermodynamic analysis of lined rock caverns for initial inflation and cyclic operational conditions in compressed air energy storage. J. Energy Storage 2024, 99, 113253. [Google Scholar] [CrossRef] [Scilit]
- Rutqvist, J.; Kim, H.M.; Ryu, D.W.; Synn, J.H.; Song, W.K. Modeling of coupled thermodynamic and geomechanical performance of underground compressed air energy storage in lined rock caverns. Int. J. Rock Mech. Min. Sci. 2012, 52, 71–81. [Google Scholar] [CrossRef] [Scilit]
- Wan, F.; Jiang, Z.; Tian, X.; Konietzky, H.; Xiao, Z.Z. A thermo-hydro-mechanical damage model for lined rock cavern for compressed air energy storage. J. Energy Storage 2024, 78, 110186. [Google Scholar] [CrossRef] [Scilit]
- Zhang, X.; Liu, W.; Jiang, D.Y.; Qiao, W.B.; Liu, W.B.; Zhang, N.; Fan, J.Y. Investigation on the influences of interlayer contents on stability and usability of energy storage caverns in bedded rock salt. Energy 2021, 231, 120968. [Google Scholar] [CrossRef] [Scilit]
- Xia, C.; Xu, Y.; Zhou, S.; Qin, S.K.; He, X.H. Fracture initiation and propagation in the lined underground caverns for compressed air energy storage: Coupled thermo-mechanical phase-field modeling. Comput. Geotech. 2023, 157, 105329. [Google Scholar] [CrossRef] [Scilit]
- Liu, X.; Sun, Q.H.; Song, W.; Bao, Y.H. Numerical modeling and parametric study of hybrid fiber-rebar reinforced concrete tunnel linings. Eng. Struct. 2022, 251, 113565. [Google Scholar] [CrossRef] [Scilit]
- Lu, Q.; Xu, Y.; Xia, C.; Liu, S. Mechanical response of fiber reinforced flexible concrete for compressed air energy storage underground caverns. Rock Soil Mech. 2024, 45, 3566–3575. [Google Scholar] [CrossRef] [Scilit]
- Shao, J.; Fan, Z.; Huang, Y.Y.; Zhan, Y.L.; Cai, Q.H. Multi-objective optimization of double-walled steel cofferdams based on response surface methodology and particle swarm optimization algorithm. Structures 2023, 49, 256–266. [Google Scholar] [CrossRef] [Scilit]
- Hu, J.H.; Zhou, X.H.; Liu, J.P.; Shan, W.C.; Qi, H.T.; Chen, W.; Zhang, Y.J. Intelligent design of shear wall structures based on BIM and multi-objective genetic algorithm. J. Build. Eng. 2025, 104, 112284. [Google Scholar] [CrossRef] [Scilit]
- Liu, C.; Sun, Z. Green flexible production and intelligent factory building structure design based on improved ant colony algorithm. Therm. Sci. Eng. Prog. 2024, 53, 102753. [Google Scholar] [CrossRef] [Scilit]
- Huang, D.Y.; Ma, Y.; Rao, Q.H.; Yi, W.; Yang, W.T.; Li, P. A new multi-objective optimization model of multi-layer prestressed lining cavern for compressed air energy storage. J. Cent. South Univ. 2023, 30, 3855–3866. [Google Scholar] [CrossRef] [Scilit]
- Liu, X.Y.; Yang, J.P.; Yang, C.H.; Zhang, Z.Y.; Chen, W.Z. Numerical simulation on cavern support of compressed air energy storage (CAES)considering thermo-mechanical coupling effect. Energy 2023, 282, 128916. [Google Scholar] [CrossRef] [Scilit]
- Kushnir, R.; Dayan, A.; Ullmann, A. Temperature and pressure variations within compressed air energy storage caverns. Int. J. Heat Mass Transf. 2012, 55, 5616–5630. [Google Scholar] [CrossRef] [Scilit]
- Grassl, P.; Xenos, D.; Nyström, U.; Rempling, R.; Gylltoft, K. CDPM2: A damage-plasticity approach to modelling the failure of concrete. Int. J. Solids Struct. 2013, 50, 3805–3816. [Google Scholar] [CrossRef] [Scilit]
- GB/T 50010-2010; Code for Design of Concrete Structures. China Architecture & Building Press: Beijing, China, 2024.
- Zhang, H. Study on Strength and Flexural Toughness of Steel Fiber Reinforced Concrete. Master’s Thesis, Zhengzhou University, Zhengzhou, China, 2011. [Google Scholar]
- Li, F.C. Numerical Simulation and Structural Optimization of Steel Fiber-Reinforced Concrete Lining Structures in Underground Gas Storage Caverns. Master’s Thesis, Xi’an University of Technology, Xi’an, China, 2025. [Google Scholar]
- Kazemi, M.T.; Fazileh, F.; Ebranhiminezhad, M.A. Cohesive crack model and fracture energy of steel-fiber-reinforced-concrete notched cylindrical specimens. J. Mater. Civ. Eng. 2007, 19, 884–890. [Google Scholar] [CrossRef] [Scilit]
- Ren, Z.J.; Wang, T.C.; Wu, S.C.; Cheng, H.Y.; Geng, X.J.; Pu, S.J.; Wang, T. Economic and environmental evaluation of the effectiveness of steel fiber–reinforced concrete lining: A case study. J. Mater. Civ. Eng. 2025, 37, 05025009. [Google Scholar] [CrossRef] [Scilit]
- Cao, J.Z.; Zhang, Y.; Yuan, H.; Mei, N. A Sustainable Approach to Vehicle LNG Tank Design Using MOPSO and 3D Modeling. Sustainability 2025, 17, 9834. [Google Scholar] [CrossRef] [Scilit]

Disclaimer/Publisher’s Note: The statements, opinions and data contained in all publications are solely those of the individual author(s) and contributor(s) and not of MDPI and/or the editor(s). MDPI and/or the editor(s) disclaim responsibility for any injury to people or property resulting from any ideas, methods, instructions or products referred to in the content. |
© 2026 by the authors. Licensee MDPI, Basel, Switzerland. This article is an open access article distributed under the terms and conditions of the Creative Commons Attribution (CC BY) license.