1. Introduction
Against the backdrop of intensifying global climate change and rising frequency of extreme weather events, ports—as critical nodes in global trade and supply chain networks—face mounting challenges to operational safety and resilience [
1,
2]. Port sustainable development is a core priority in the contemporary maritime sector [
3]. A sustainable port requires not only efficient operations and green technologies but also resilience to maintain functional continuity during extreme climate events [
4,
5]. However, frequent typhoon strikes severely test this resilience [
6]. As the final refuge for vessels during typhoons, anchorages directly determine ports’ ability to maintain basic functions during disasters, thereby affecting supply chain stability [
7]. Integrating anchorage typhoon safety capacity into port sustainable development frameworks thus holds significant theoretical and practical implications. Frequent landfalls of severe typhoons damage port infrastructure through extreme winds, waves, and storm surges, triggering cascading disruptions including operational suspensions, vessel congestion, and deteriorated emergency response—all of which undermine port continuity and regional economic stability [
8]. Historical events highlight these risks: Typhoon Hato (2017) sank over 10 merchant vessels in the Pearl River Estuary, causing 16 fatalities and missing persons [
9]; Super Typhoon Mangkhut (2018), with maximum sustained winds of Beaufort force 14–17, forced major Pearl River Estuary ports to close completely for over 48 h and shelter hundreds of vessels [
10]. These events have caused substantial casualties, infrastructure damage, economic losses, and global supply chain disruptions. Accordingly, enhancing anchorage safety during typhoons by transitioning from reactive response to proactive risk governance is imperative for sustainable port development.
Anchorage safety during typhoons is a systemic issue encompassing engineering, management, and operational dimensions, and related research has evolved substantially. A literature review identifies two primary paradigms:
The first focuses on scenario-specific practical countermeasures. For example, Hu et al. verified strong wind defense effectiveness using the single-point mooring practice of the Hui Xiang Hai at Taihu Port during Typhoon Muifa [
11]; Zhu et al. quantified mooring forces for Qiongzhou Strait ro-ro passenger ships and proposed a route-specific typhoon prevention guide [
12]; Dong Baojian and Wang Dechun specialized in typhoon prevention measures for non-self-propelled engineering vessels such as barges, floating cranes, and drilling platforms [
13]; Li Meiyun extended the research to the local government level, optimizing the typhoon emergency response process in District Y of Shenzhen [
14]. These practical studies involve various technical factors (e.g., mooring equipment: chain length/scope, breaking strength, anchor types; ship dynamics: drift force, yawing motion, cable tension, windage area) as well as management and human factors (e.g., real-time monitoring, alert thresholds, emergency protocols). These regional and scenario-specific studies provide operational management solutions and empirical evidence, highlighting the urgency and complexity of anchorage scheduling and typhoon preparedness for vessels. However, they mostly rely on qualitative analysis and case-based induction, making it difficult to quantify the impact of factors, generalize conclusions, or support the formulation of dynamic strategies.
The second paradigm focuses on macro-scale modeling and assessment frameworks to enhance theoretical generalizability and interpretability, falling into three subcategories: First, high-precision hazard driver simulation—e.g., Xiong et al.’s high-resolution typhoon wind field model incorporating complex surface features for improved catastrophe risk inputs [
15]. Second, systematic assessment of impacts and cascading risks—e.g., Wang Wenjing’s enhanced DSAEEF-LTD model (via new hazard parameters and algorithm optimization) for more physically sound and efficient coastal typhoon pre-assessment [
16]; Tan Xinru et al.’s typhoon–storm surge–exposure network model, which quantifies propagation pathways and vulnerabilities in socio-economic systems and reveals cascading amplification of secondary/derivative disasters [
17]; and Liu Hongguang et al.’s coupled wind–rain–landslide model identifying critical thresholds and spatial patterns for co-triggered collapses [
18]. Together, these advance macro-level understanding of multi-hazard coupling and risk transmission. Third, port resilience quantification—e.g., Hui Tianyong et al.’s Bayesian-network-based probabilistic model covering absorption, adaptation, and recovery [
19]. These macro-scale hazard models primarily focus on external stressors, including typhoon parameters (wind speed/direction, wave height, tidal current) and anchorage conditions (water depth, seabed sediment type, shelter geometry). However, their macro-outputs rarely translate into operational decisions like anchorage scheduling, and linear/independence-assumption models cannot capture nonlinear configurational causal mechanisms—a core limitation in identifying “multiple equivalent paths” or “necessary conditions”.
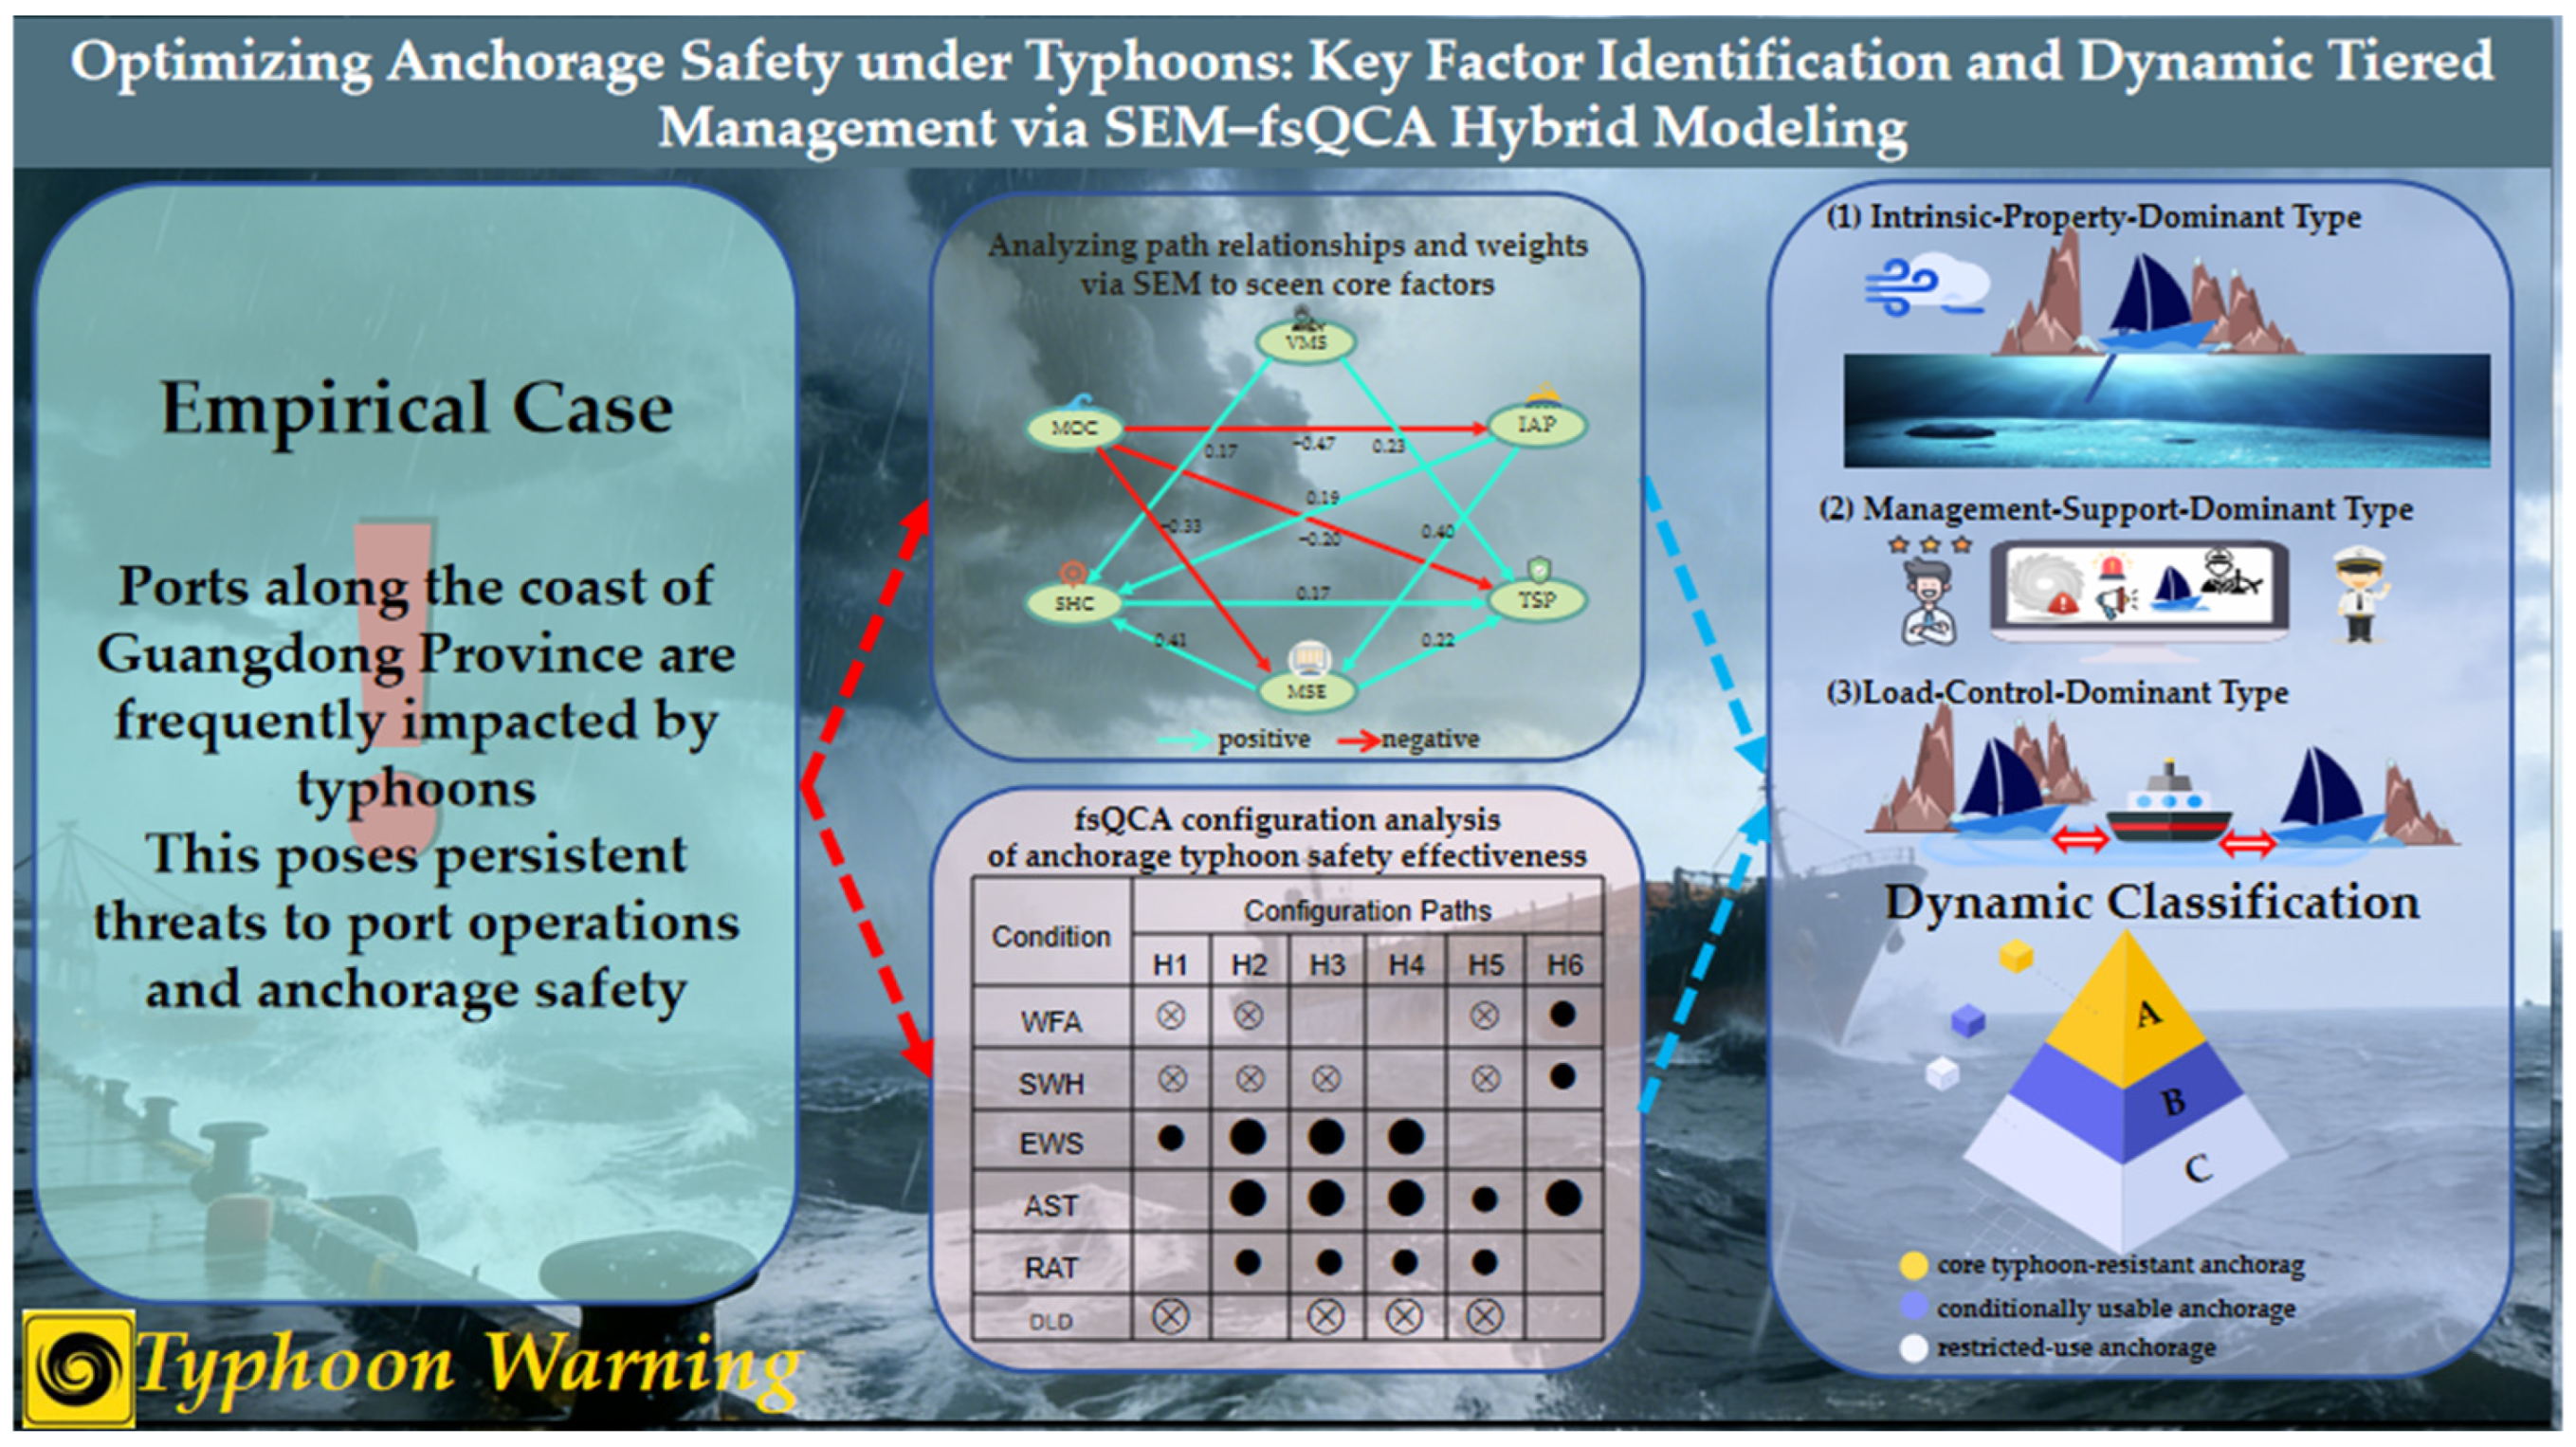
In summary, extant research has two critical research gaps: (1) micro-scale response measures lack systematic modeling support, limiting precise decision-making; (2) macro-scale models fail to adequately capture concurrent, nonlinear, and configurational causal mechanisms. To address these gaps, this study constructs a hybrid analytical framework combining structural equation modeling (SEM) and fuzzy-set qualitative comparative analysis (fsQCA), as shown in
Figure 1. SEM quantifies factor effects and structural relationships, while fsQCA identifies multiple sufficient condition configurations for high safety performance. The findings are translated into a three-tier (A/B/C) dynamic anchorage management framework tailored to three typical typhoon scenarios: heavy-rainfall, strong-wind, and complex-track events. This work advances theoretical understanding of safety effectiveness generation in complex port systems, and provides an operational tool to transition anchorage management from static assessment to dynamic adaptive response.
Empirically, this study focuses on Huizhou Port, a core hub in the Guangdong–Hong Kong–Macao Greater Bay Area [
20]. Located on the Pearl River Estuary’s east bank, it is among China’s most typhoon-prone ports (4–6 direct/major impacts annually) [
21]. A total of 36 anchorage–typhoon coupled configurations are established by pairing its 12 planned anchorages with the three aforementioned typhoon scenarios. Key outputs include an optimized anchorage carrying capacity inventory and an fsQCA-derived three-tier dynamic classification system, providing a scientific, actionable decision basis for typhoon-period anchorage safety management. The remainder of the paper is organized as follows:
Section 2 will elaborate on the specific steps of the hybrid SEM–fsQCA methodology, including questionnaire design, SEM path analysis, anchorage capacity optimization, and fsQCA calibration and analysis;
Section 3 presents the empirical results: SEM weights, optimized capacities, and fsQCA configurational paths;
Section 4 conducts a typological interpretation of the six configurational paths, constructs a dynamic tiered anchorage management framework applied to Huizhou Port, and discusses the limitations and generalizability of this framework;
Section 5 concludes with research findings and managerial implications.
2. A Hybrid SEM–fsQCA Methodology for Port Anchorage Safety Under Typhoon Scenarios
This study adopts a hybrid SEM–fsQCA methodology underpinned by sequential synergistic logic [
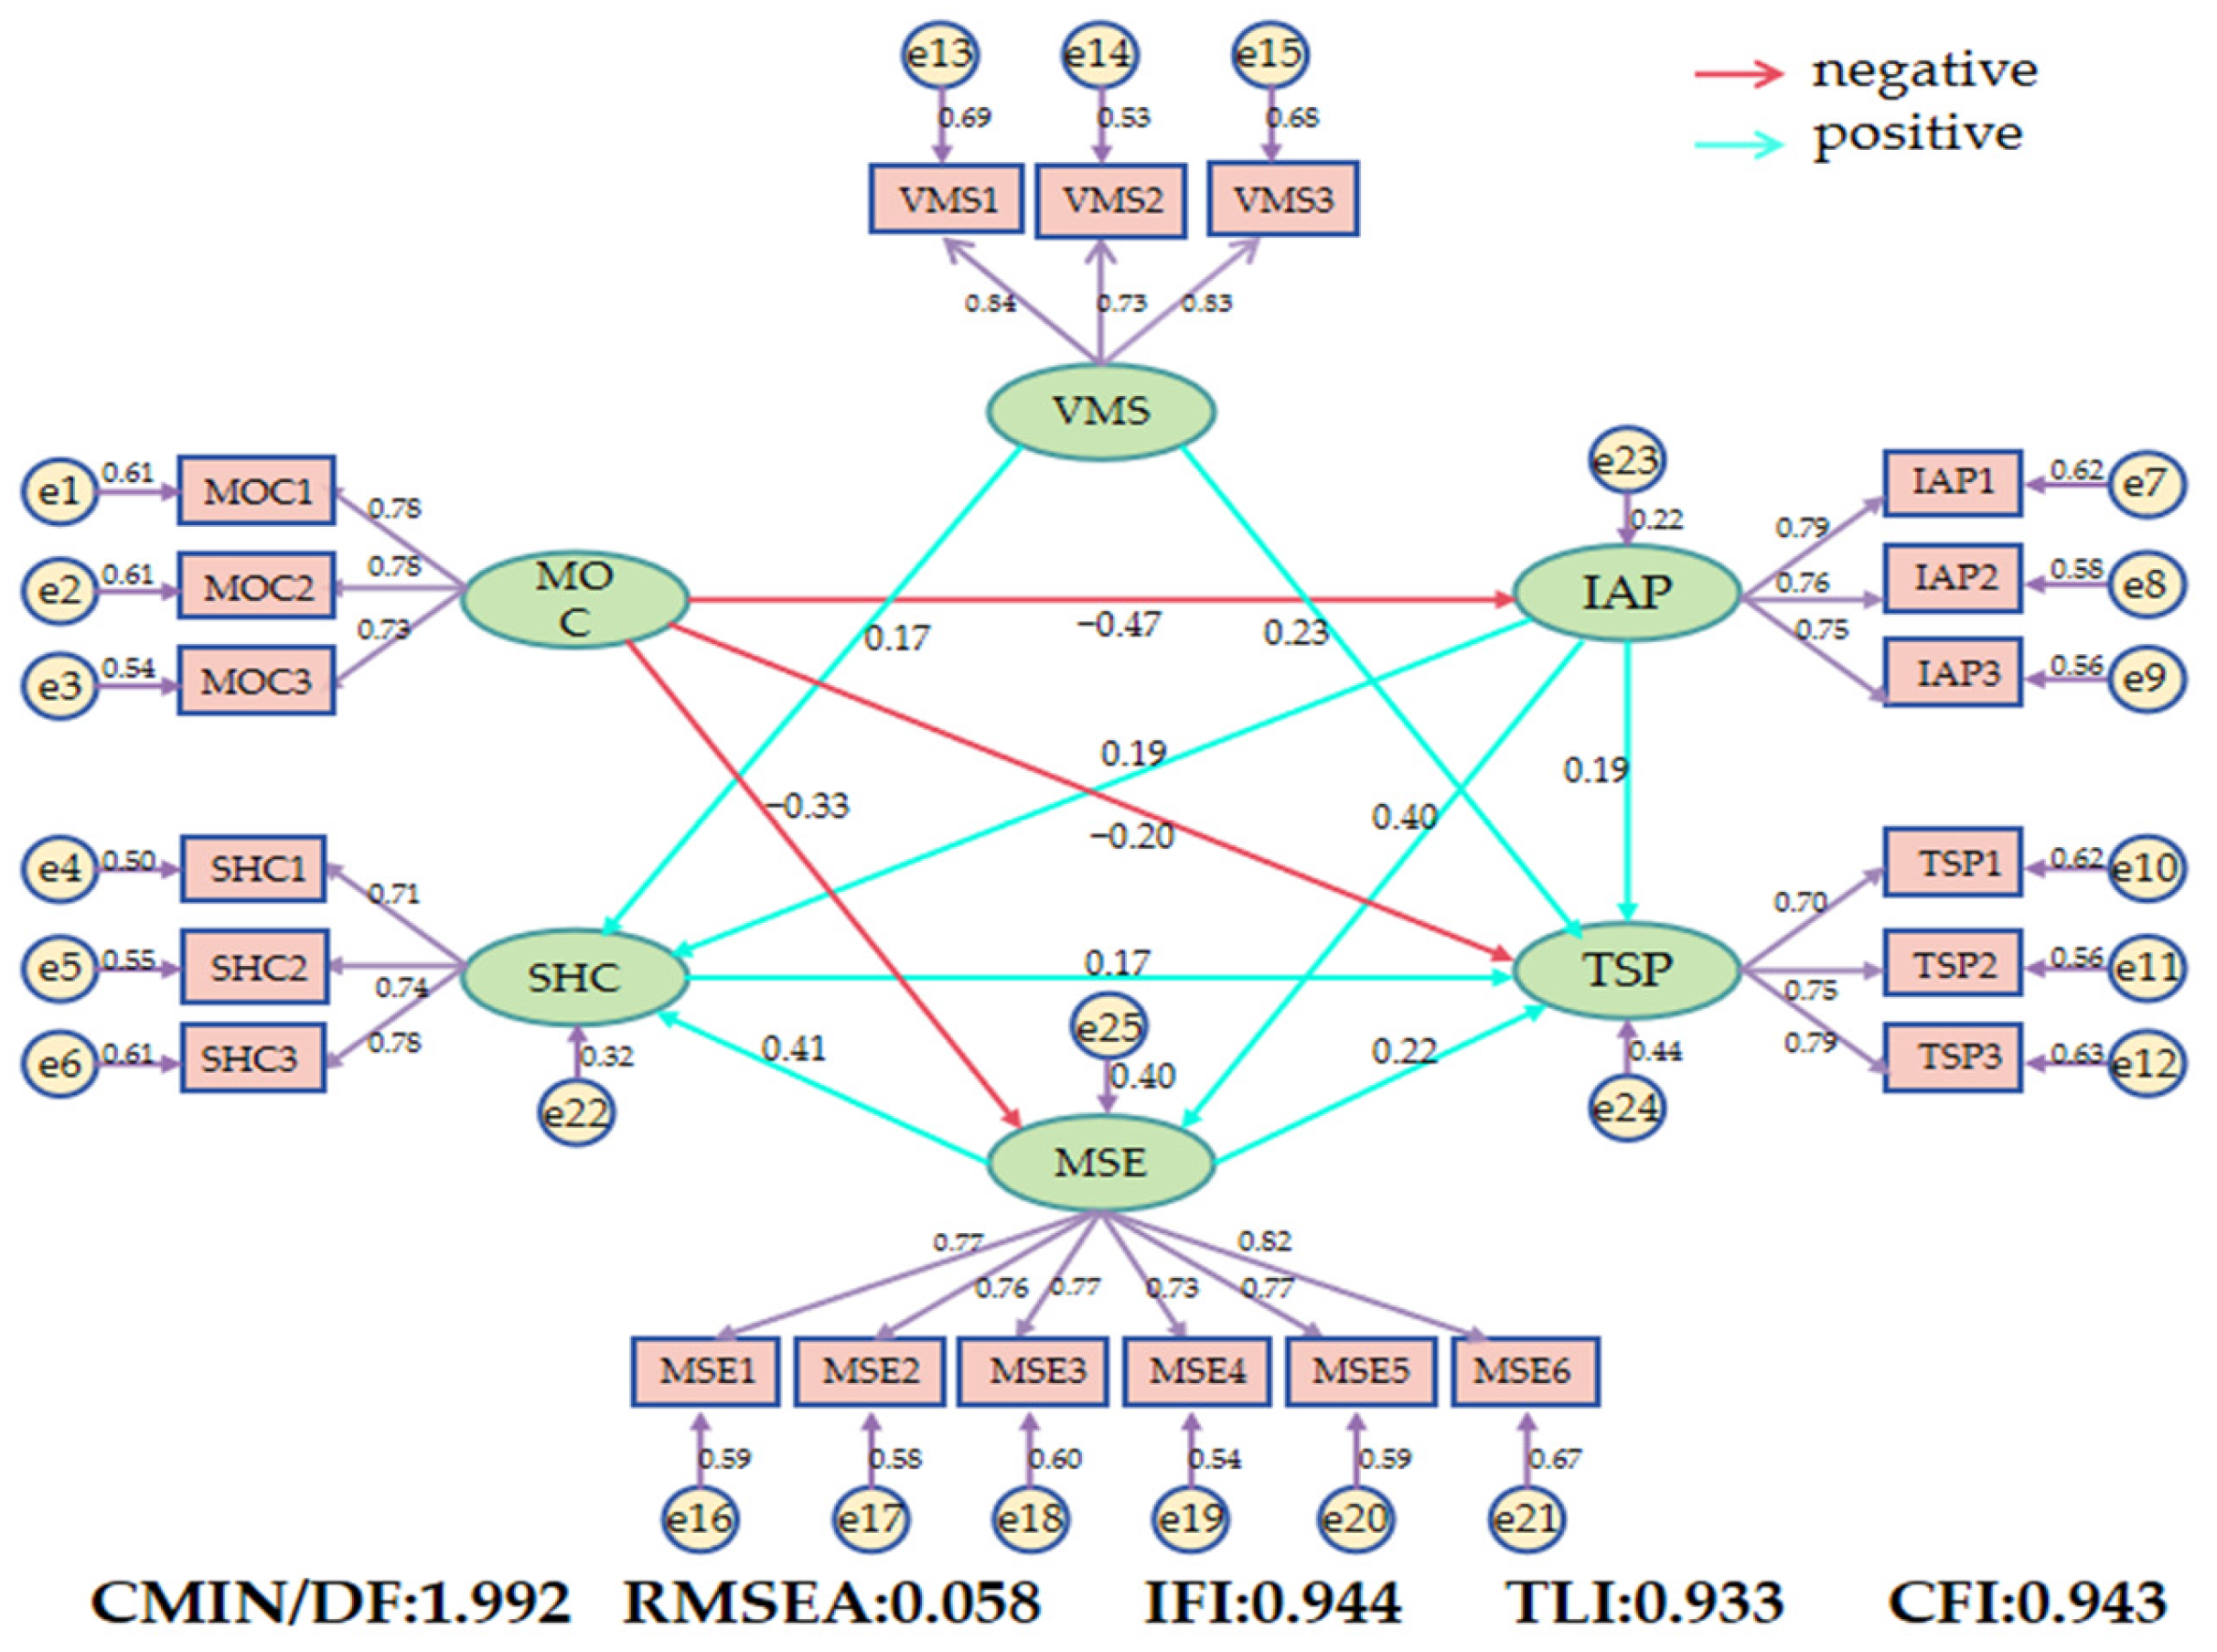
22,
23]. Specifically, confirmatory factor analysis (CFA) is first applied within the SEM framework to estimate factor loadings of each observed indicator on the corresponding latent constructs. The structural model then estimates the standardized influence weights of each latent variable on anchorage typhoon safety performance (TSP). Based on these results, the three latent variables with the strongest total effects—meteorological and oceanographic conditions (MOC), inherent anchorage properties (IAP), and management support effectiveness (MSE)—are selected as the theoretical basis for fsQCA condition selection. For each latent variable, the two observed indicators with the highest factor loadings (six in total) are extracted as fsQCA conditions to ensure empirical validity and representativeness. Subsequently, fsQCA identifies multiple equivalent sufficient configurational pathways leading to high safety effectiveness. In this integrated framework, SEM addresses how much each factor independently affects the outcome, whereas fsQCA clarifies how factor combinations generate equivalent high safety outcomes across distinct configurations [
24]. Together, these complementary approaches reveal the nonlinear, conjunctural causal mechanisms governing anchorage typhoon safety.
2.1. Structural Equation Modeling (SEM)
To quantify the correlations, relative weights, and structural relationships among key factors influencing anchorage typhoon safety effectiveness [
25], and to correct the expert-assessed anchorage capacity, a structural equation model (SEM) was employed for empirical analysis using AMOS 24.0.
2.1.1. Questionnaire Design and Data Collection
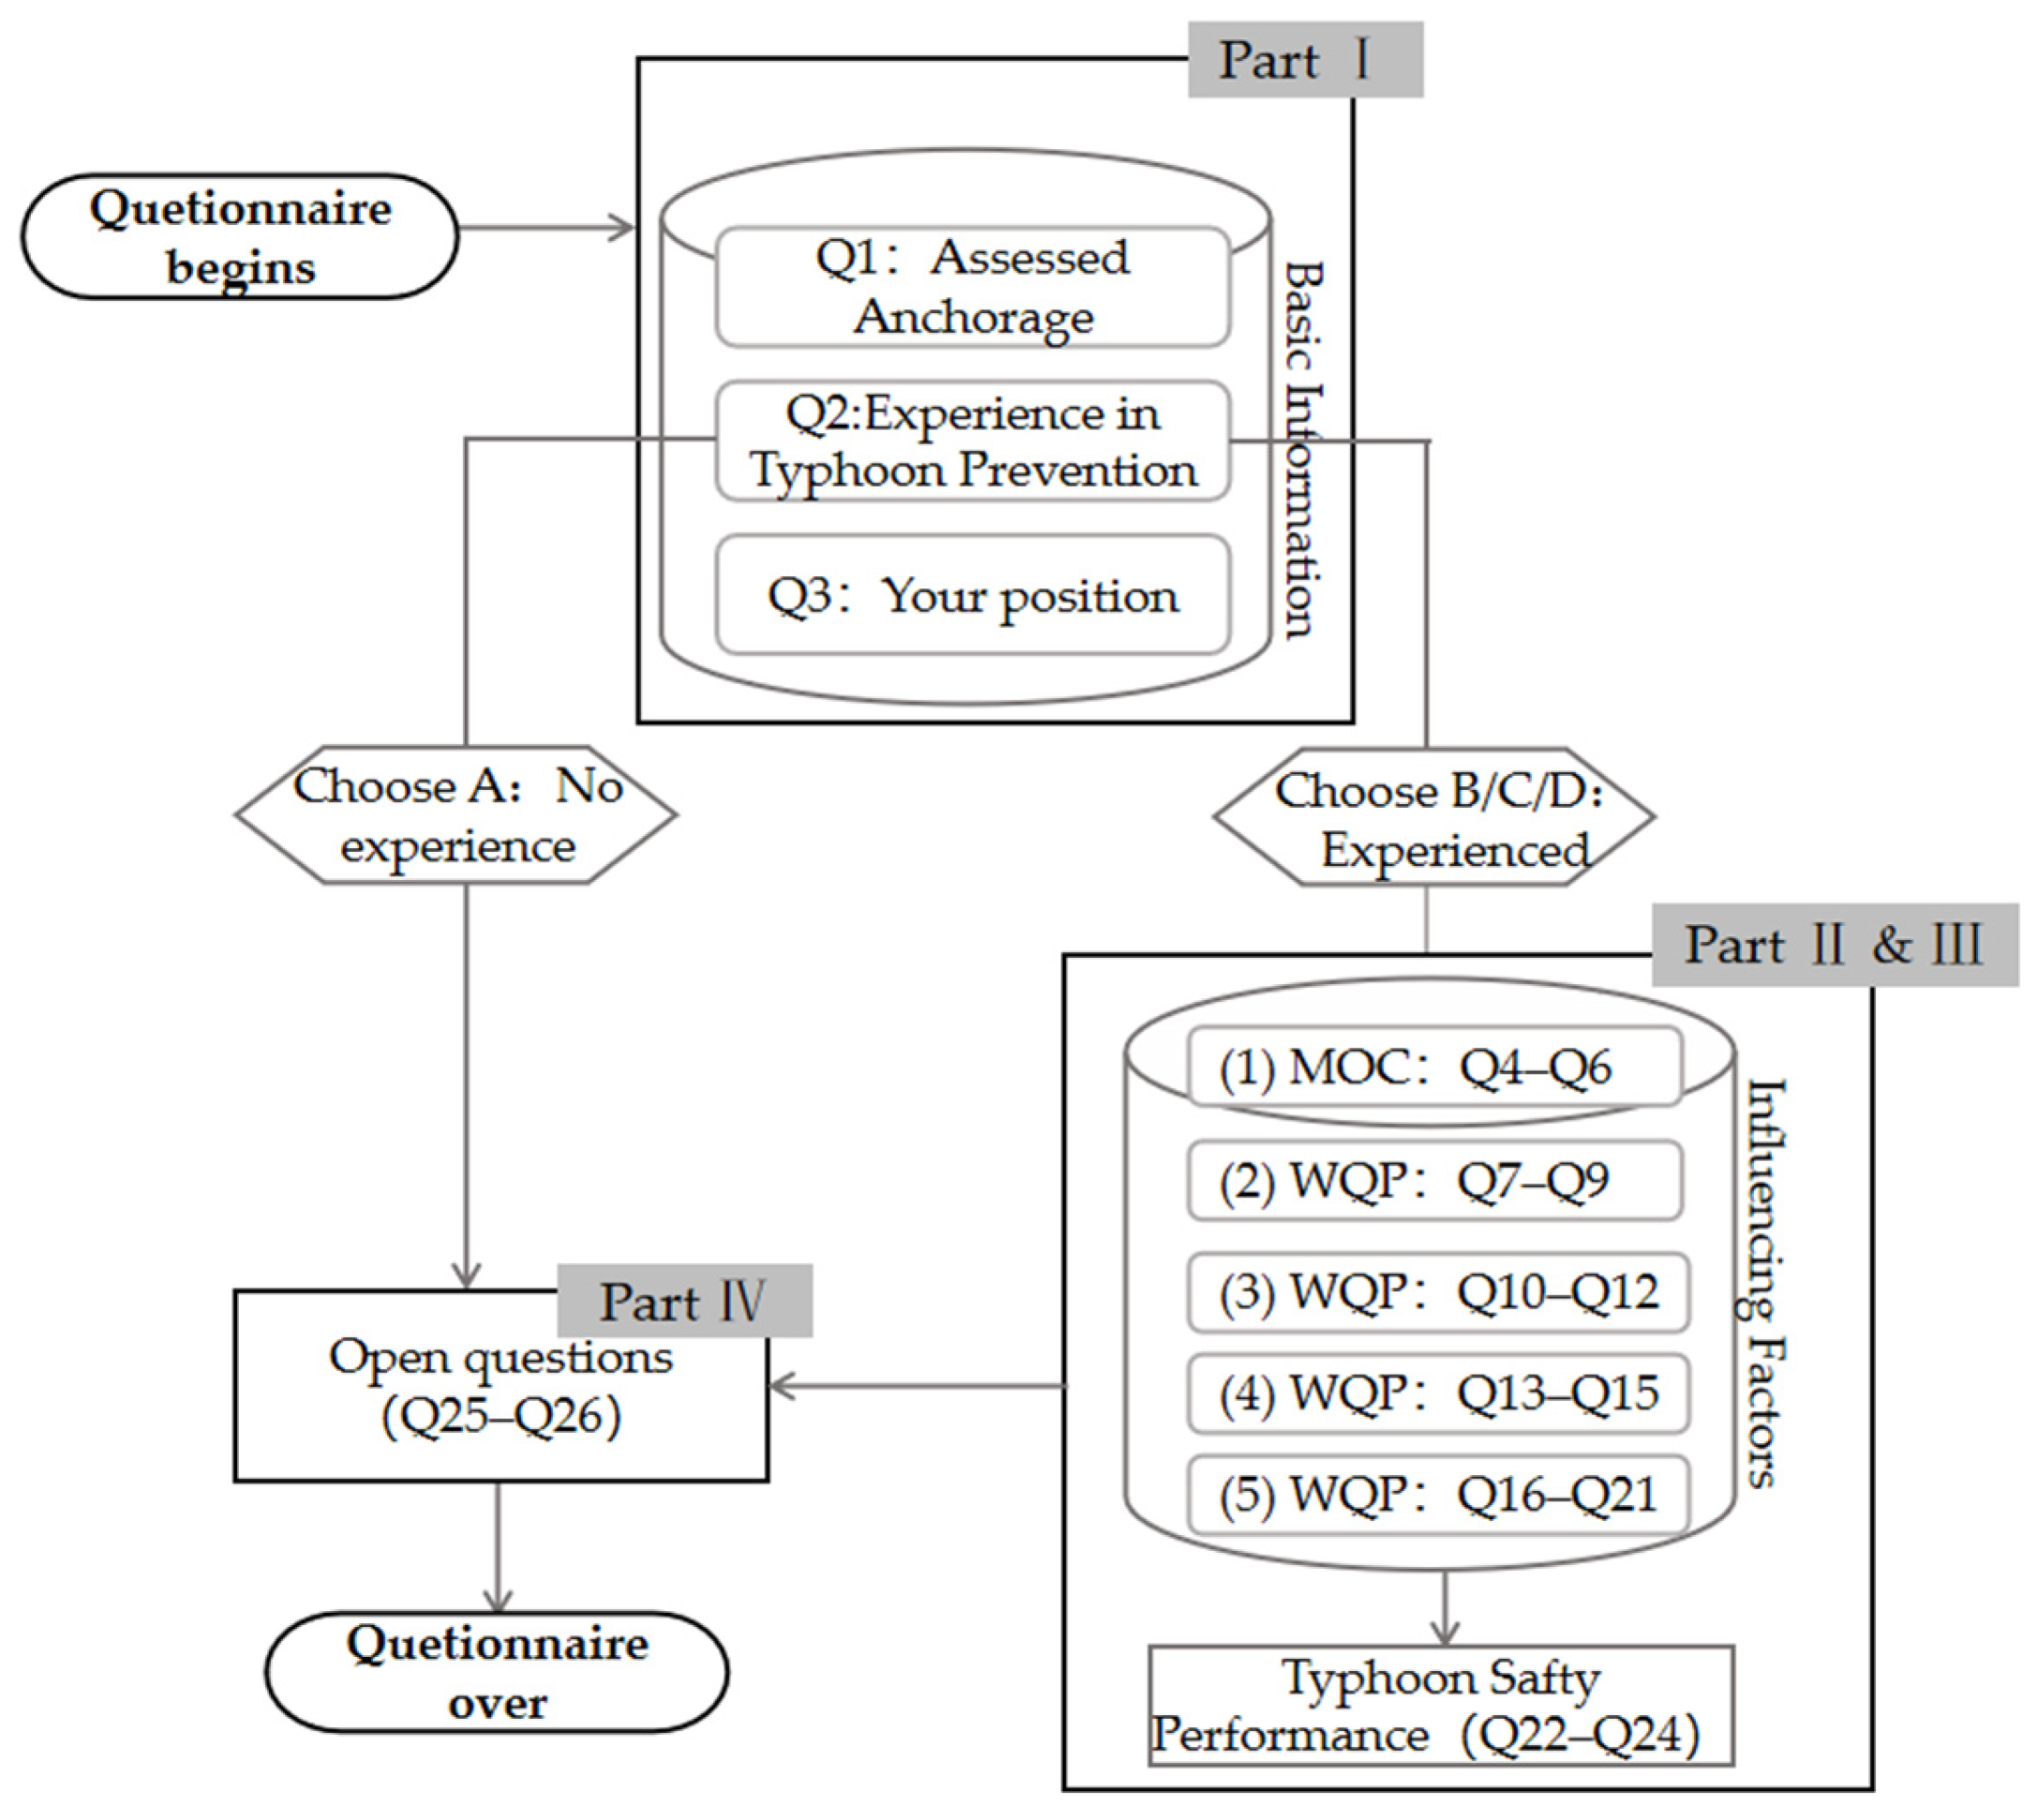
Based on relevant port regulations, the current typhoon preparedness status at target port anchorages and related academic research, a questionnaire was designed to assess factors influencing safety effectiveness at target port anchorages (design process shown in
Figure 2) The questionnaire consisted of 26 items: 2 demographic variables, 21 core scale items, and 3 multiple-choice open-ended questions. Core scale items employed a five-point Likert format [
26], a simplified version of classic scale designs, where respondents selected options ranging from “strongly agree” to “strongly disagree”. The respondents of the questionnaire are the personnel working on the ship during the typhoon preparedness of the target port, the port management and supervision personnel and other relevant personnel [
27]. We distributed 400 questionnaires and obtained 301 valid responses. Among the respondents, 15.28% were captains, 47.51% were crew members, 16.94% were port management personnel, 9.63% were maritime supervisors, and the remainder were relevant personnel (pilots, mooring teams, etc.). The sample coverage is accurate, and the sample size is sufficient.
2.1.2. Reliability Analysis
Reliability of the measurement model was evaluated using Cronbach’s α, with values ranging from 0 to 1 and higher values indicating better internal consistency. The reliability results (
Table 1) indicate that all dimensions had Cronbach’s α values greater than 0.8, and the overall scale α was 0.908, indicating excellent internal consistency and reliability.
2.1.3. Validity Analysis
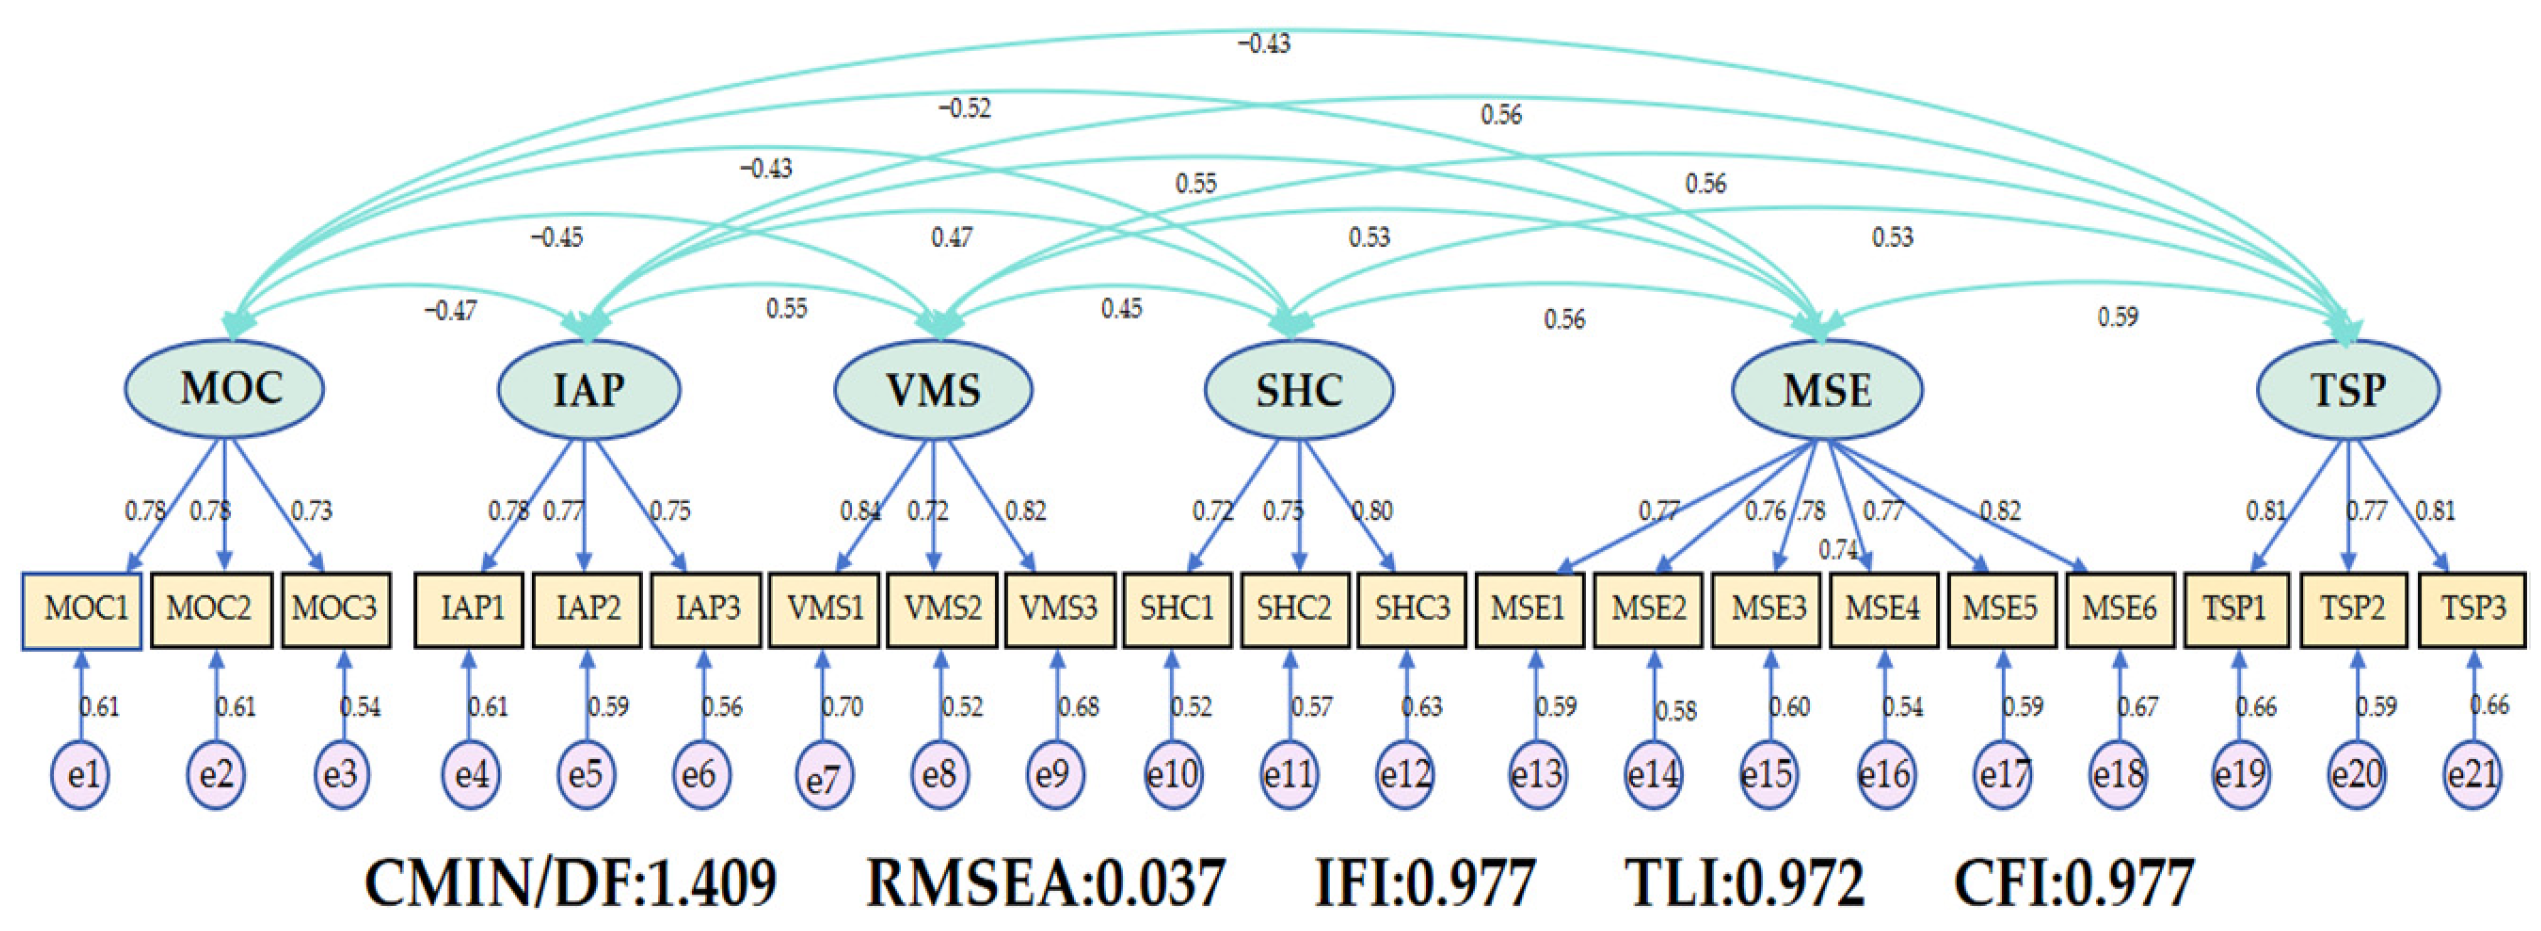
① Confirmatory Factor Analysis (CFA)—CFA is a core statistical method within the Structural Equation Modeling (SEM) framework, primarily used to test the validity of the measurement model. Through CFA, we verify whether the theoretical factor structure of the measurement scale is supported by the data in the specific context and sample of this study. As illustrated in
Figure 3, which presents CFA model fit results,
falls within the excellent range (1–3), while
remains below the critical threshold of 0.05. Additionally, IFI, TLI, and CFI all exceeded 0.90, indicating excellent fit.
② Convergent Validity—Convergent validity is assessed by calculating the Average Variance Extracted (AVE) and Composite Reliability (CR) to evaluate whether there are significant distinctions between different dimensions and whether the observed variables measuring the same dimension exhibit high inter-variable correlation. As presented in
Table 2, all dimensions had AVE values > 0.5 and CR values > 0.7, confirming sufficient convergent validity for each latent construct.
③ Discriminant Validity Test—Discriminant validity is used to verify whether different latent variables in the measurement model are statistically distinct, ensuring that the items measuring different constructs can be differentiated from one another and capture different dimensions. This study employs the Fornell–Larcker criterion for testing [
28]. This criterion requires that the square root of the Average Variance Extracted (AVE) for any latent variable must be greater than the absolute value of the correlation coefficient between that latent variable and all other latent variables. Results in
Table 2 show that the square root of AVE for each dimension exceeded the absolute value of its standardized correlation with all other latent variables, verifying adequate discriminant validity across all constructs.
2.2. Methodology for Anchorage Capacity Optimization Based on SEM Weights
To scientifically determine ultimate typhoon carrying capacity for each Huizhou Port anchorage, this study builds upon expert judgment, further optimizing and calibrating initial recommended capacity (IRC) using objective standardized weights derived from SEM analysis. The aim is to generate more precise and theoretically grounded capacity estimates.
2.2.1. Data Integration and Preprocessing
Basic capacity data for each anchorage were sourced from the official report titled Research Report on Planning of Typhoon Shelter Waters for Huizhou Port (details in Appendix
Table A1). These data are defined in this study as the initial recommended capacity (IRC), which serves as the foundational input for subsequent optimization and calibration using SEM-derived weights.
Core independent variable data were sourced from the SEM questionnaire dataset. For each anchorage, the average score of all sample items under each latent variable was calculated to obtain dimension-specific factor scores. Negatively scaled factors were reverse-coded using Formula (1) to ensure calculation consistency:
Theoretical capacity scores (TCS) comprehensively reflect objective safety potential of anchorages. Calculation is based on scores of five factors (after normalization) for each anchorage and corresponding standardized weights determined through SEM analysis, derived using weighted summation:
where
represents theoretical capacity score for anchorage
;
is the score for anchorage
on factor
; and
is the SEM standardized weight for the corresponding factor, satisfying
. Calculation results are presented in
Section 3 (Results Analysis).
2.2.2. Processing by Logarithmic Transformation
To address the significant order-of-magnitude variation (1 to 155) in capacity recommendations provided by experts, this study employs a decimal logarithmic transformation to convert exponential differences into linear variation [
29]. This enables the construction of a stable, sensitive computational framework preserving inherent capacity differentials between anchorages. The calculation procedure is as follows:
To convert vast absolute differences in expert capacities into relative differences, base-10 logarithmic transformation is applied.
where
represents the expert-recommended capacity for the i-th anchorage. This reflects the order of magnitude of anchorage capacity.
Selection of the benchmark anchorage determines the reliability of model output. In safety-critical domains, slightly conservative yet credible results hold far greater value than potentially overestimated risk outcomes. Adhering to the principle of safety conservatism, this study establishes the highest-scoring Anchorage 1 as benchmark, setting a high-standard excellence benchmark. Calculation formula:
where
is the score of the benchmark anchorage (No. 1). This coefficient reflects relative performance of the i-th anchorage compared with the benchmark across multiple factors.
The logarithmic benchmark capacity is multiplied by the adjustment coefficient to achieve micro-level correction of macro-level capacity.
Adjusted logarithmic capacity is converted back to linear space of vessel quantities via the inverse logarithmic function, yielding optimized maximum carrying capacity.
2.3. Fuzzy-Set Qualitative Comparative Analysis (fsQCA)
Anchorage typhoon safety is not the result of a single linear factor but rather a product of complex, multidimensional interplay, which exhibits equifinality and conjunctural causation [
30]. While previous structural equation modeling effectively identified key influencing factors, it struggled to reveal how these factors interact and substitute one for another. This study applies fsQCA to transcend the examination of single-factor effects and delve deeper into the diverse pathways underlying typhoon resilience at Huizhou Port anchorages [
31]. This provides direct scientific foundations for formulating differentiated and refined safety management strategies [
32].
2.3.1. Selection of Typical Cases
fsQCA has no strict sample size requirements and is applicable to 15–80 cases [
32]. To ensure the reliability and practicality of fsQCA in this study, this study follows the principles of theoretical relevance and purposive sampling. Based on key influencing factors identified through prior SEM analysis, we constructed typical cases centered on the extreme weather event “typhoon” as the core dimension [
33]. This approach focuses the analysis on how anchorage attributes [
34] and management conditions combine under different typhoon scenarios to jointly affect anchorage typhoon safety effectiveness [
35]. The case set includes 12 anchorages in Huizhou Port and three representative 2023 typhoons (Doksuri, Saola, Haikui) that affected the port, which are classified into three types based on core disaster-inducing factors [
36]: heavy-rainfall type, strong-wind type, and complex-track type (
Table 3). These three types cover the primary physical stress spectrum of typhoon hazards to anchorage safety, ensuring the representativeness and diversity of the case set.
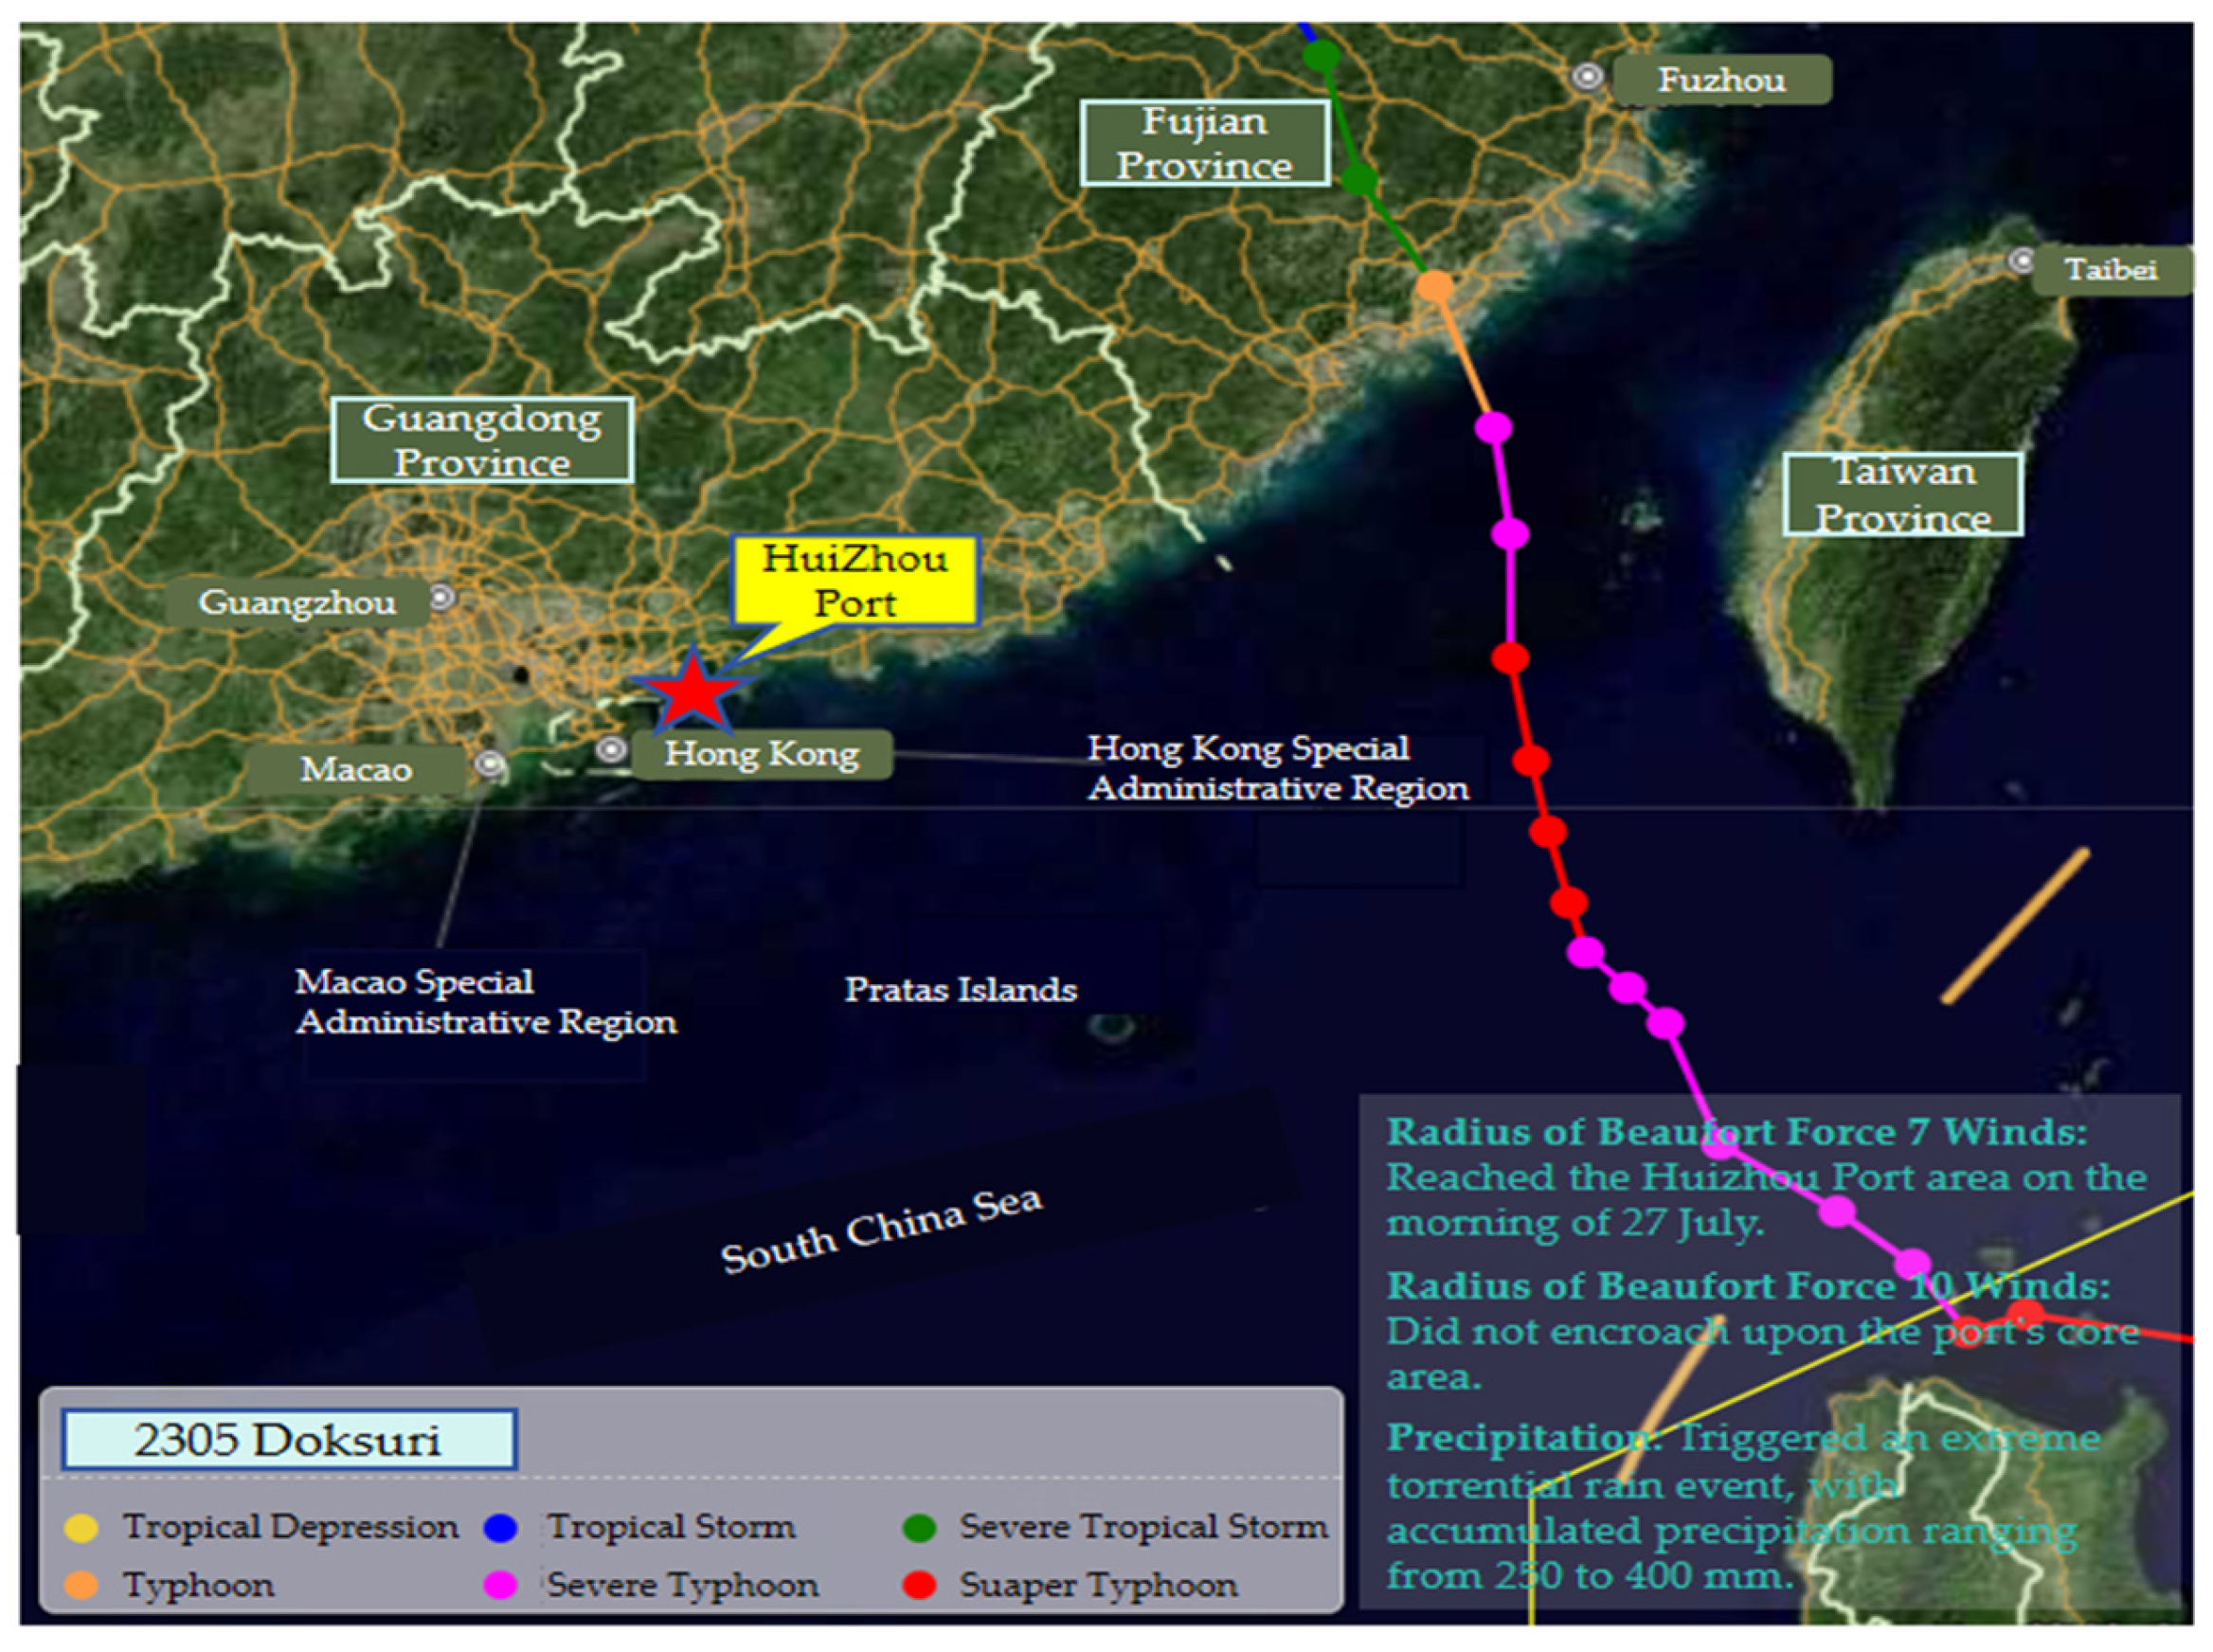
The heavy-rainfall type is defined by extreme precipitation and associated secondary hydrometeorological effects as primary hazard drivers, with objective criteria of extreme cumulative or short-term rainfall intensity triggering severe flooding, landslides, or hydrological anomalies in port waters. Typhoon Doksuri (
Figure 4) [
37] is a representative case: despite concurrent strong winds, its impacts were dominated by torrential rainfall and subsequent waterlogging, which drastically reduced visibility and impaired vessel navigation and port traffic management. This type primarily tests port systems’ monitoring, early warning, navigation management, and disturbance resistance under coupled hydrometeorological effects in non-peak wind pressure environments.
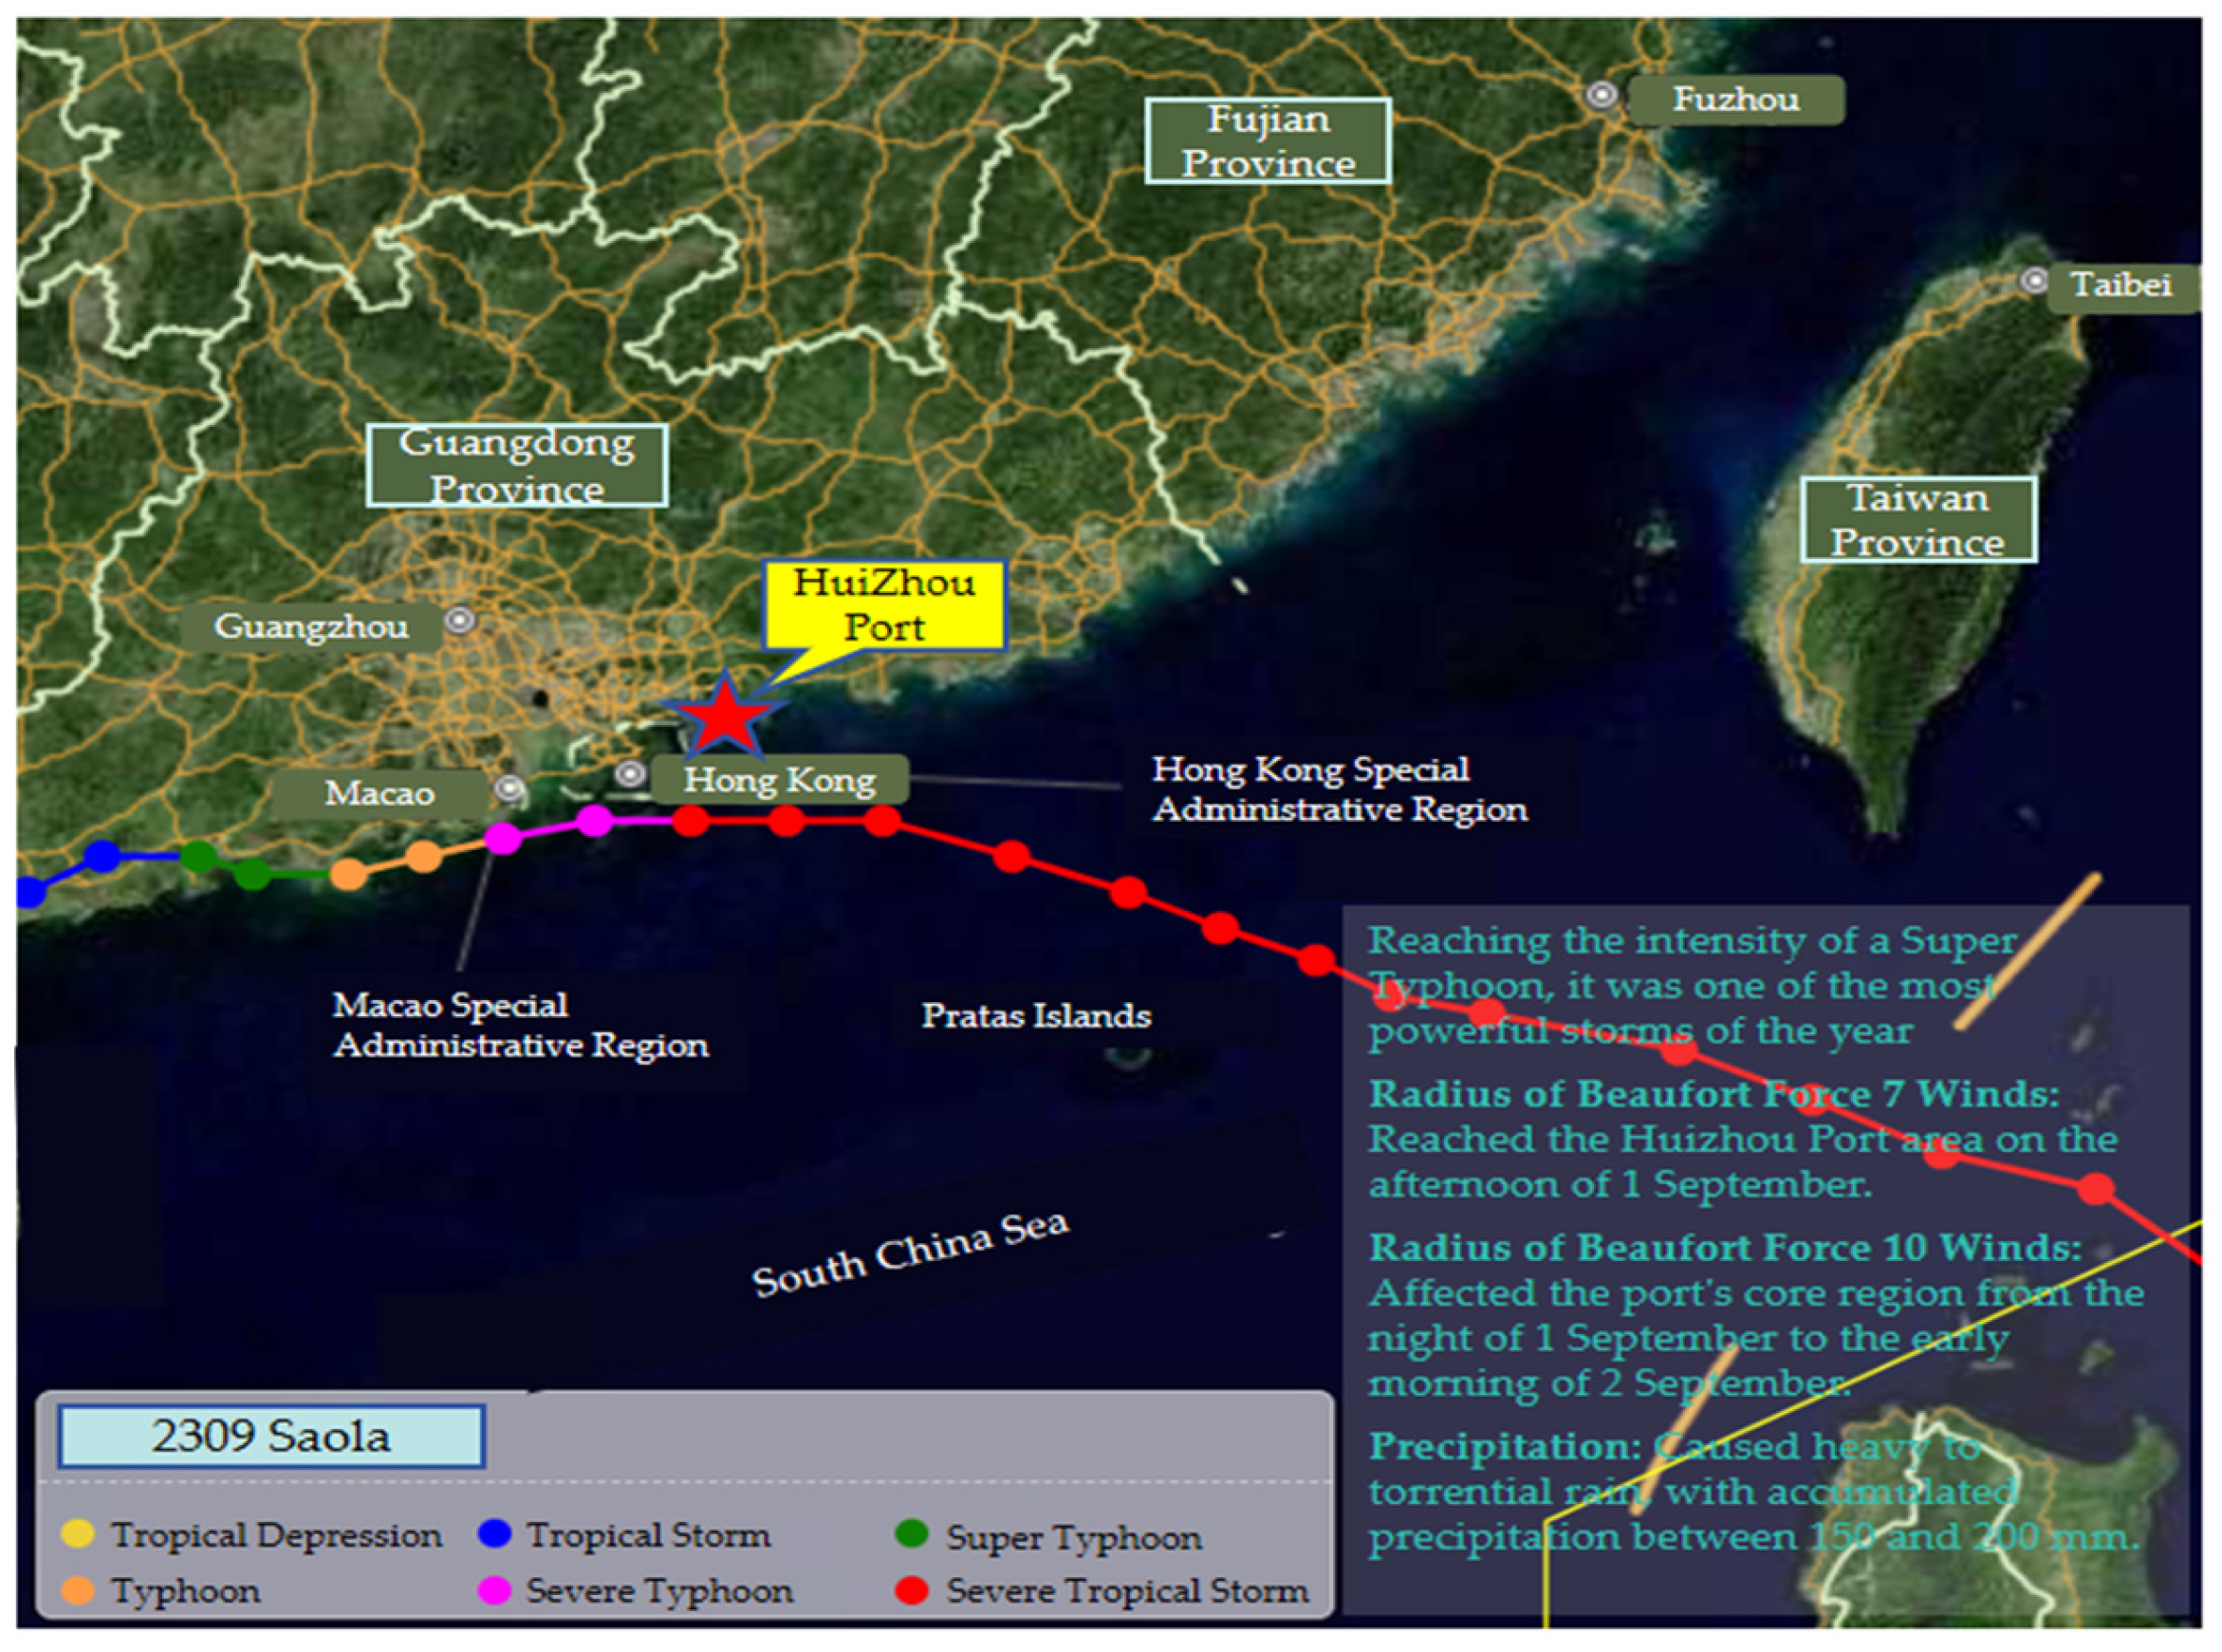
The strong-wind type is defined by extreme wind stress as the key disaster-inducing factor, characterized by the typhoon’s maximum sustained wind speed near its center or persistent winds in its outer circulation reaching destructive levels, with wind load constituting the dominant contributor to total disaster losses. Typhoon Saola (
Figure 5) [
38] exemplifies this category, featuring a compact circulation and rapid intensification in a high-intensity, rapid-impact pattern. Huizhou Port experienced an abrupt 180° wind direction shift and a wind force surge from Beaufort 6 to 12 within 6 h; this drastic wind load vector change critically tested the anchorages’ effective shelter capacity, while the sharply compressed time window between early warning response and vessel evacuation directly examined the decision-making precision and execution agility of the emergency management system under extreme conditions.
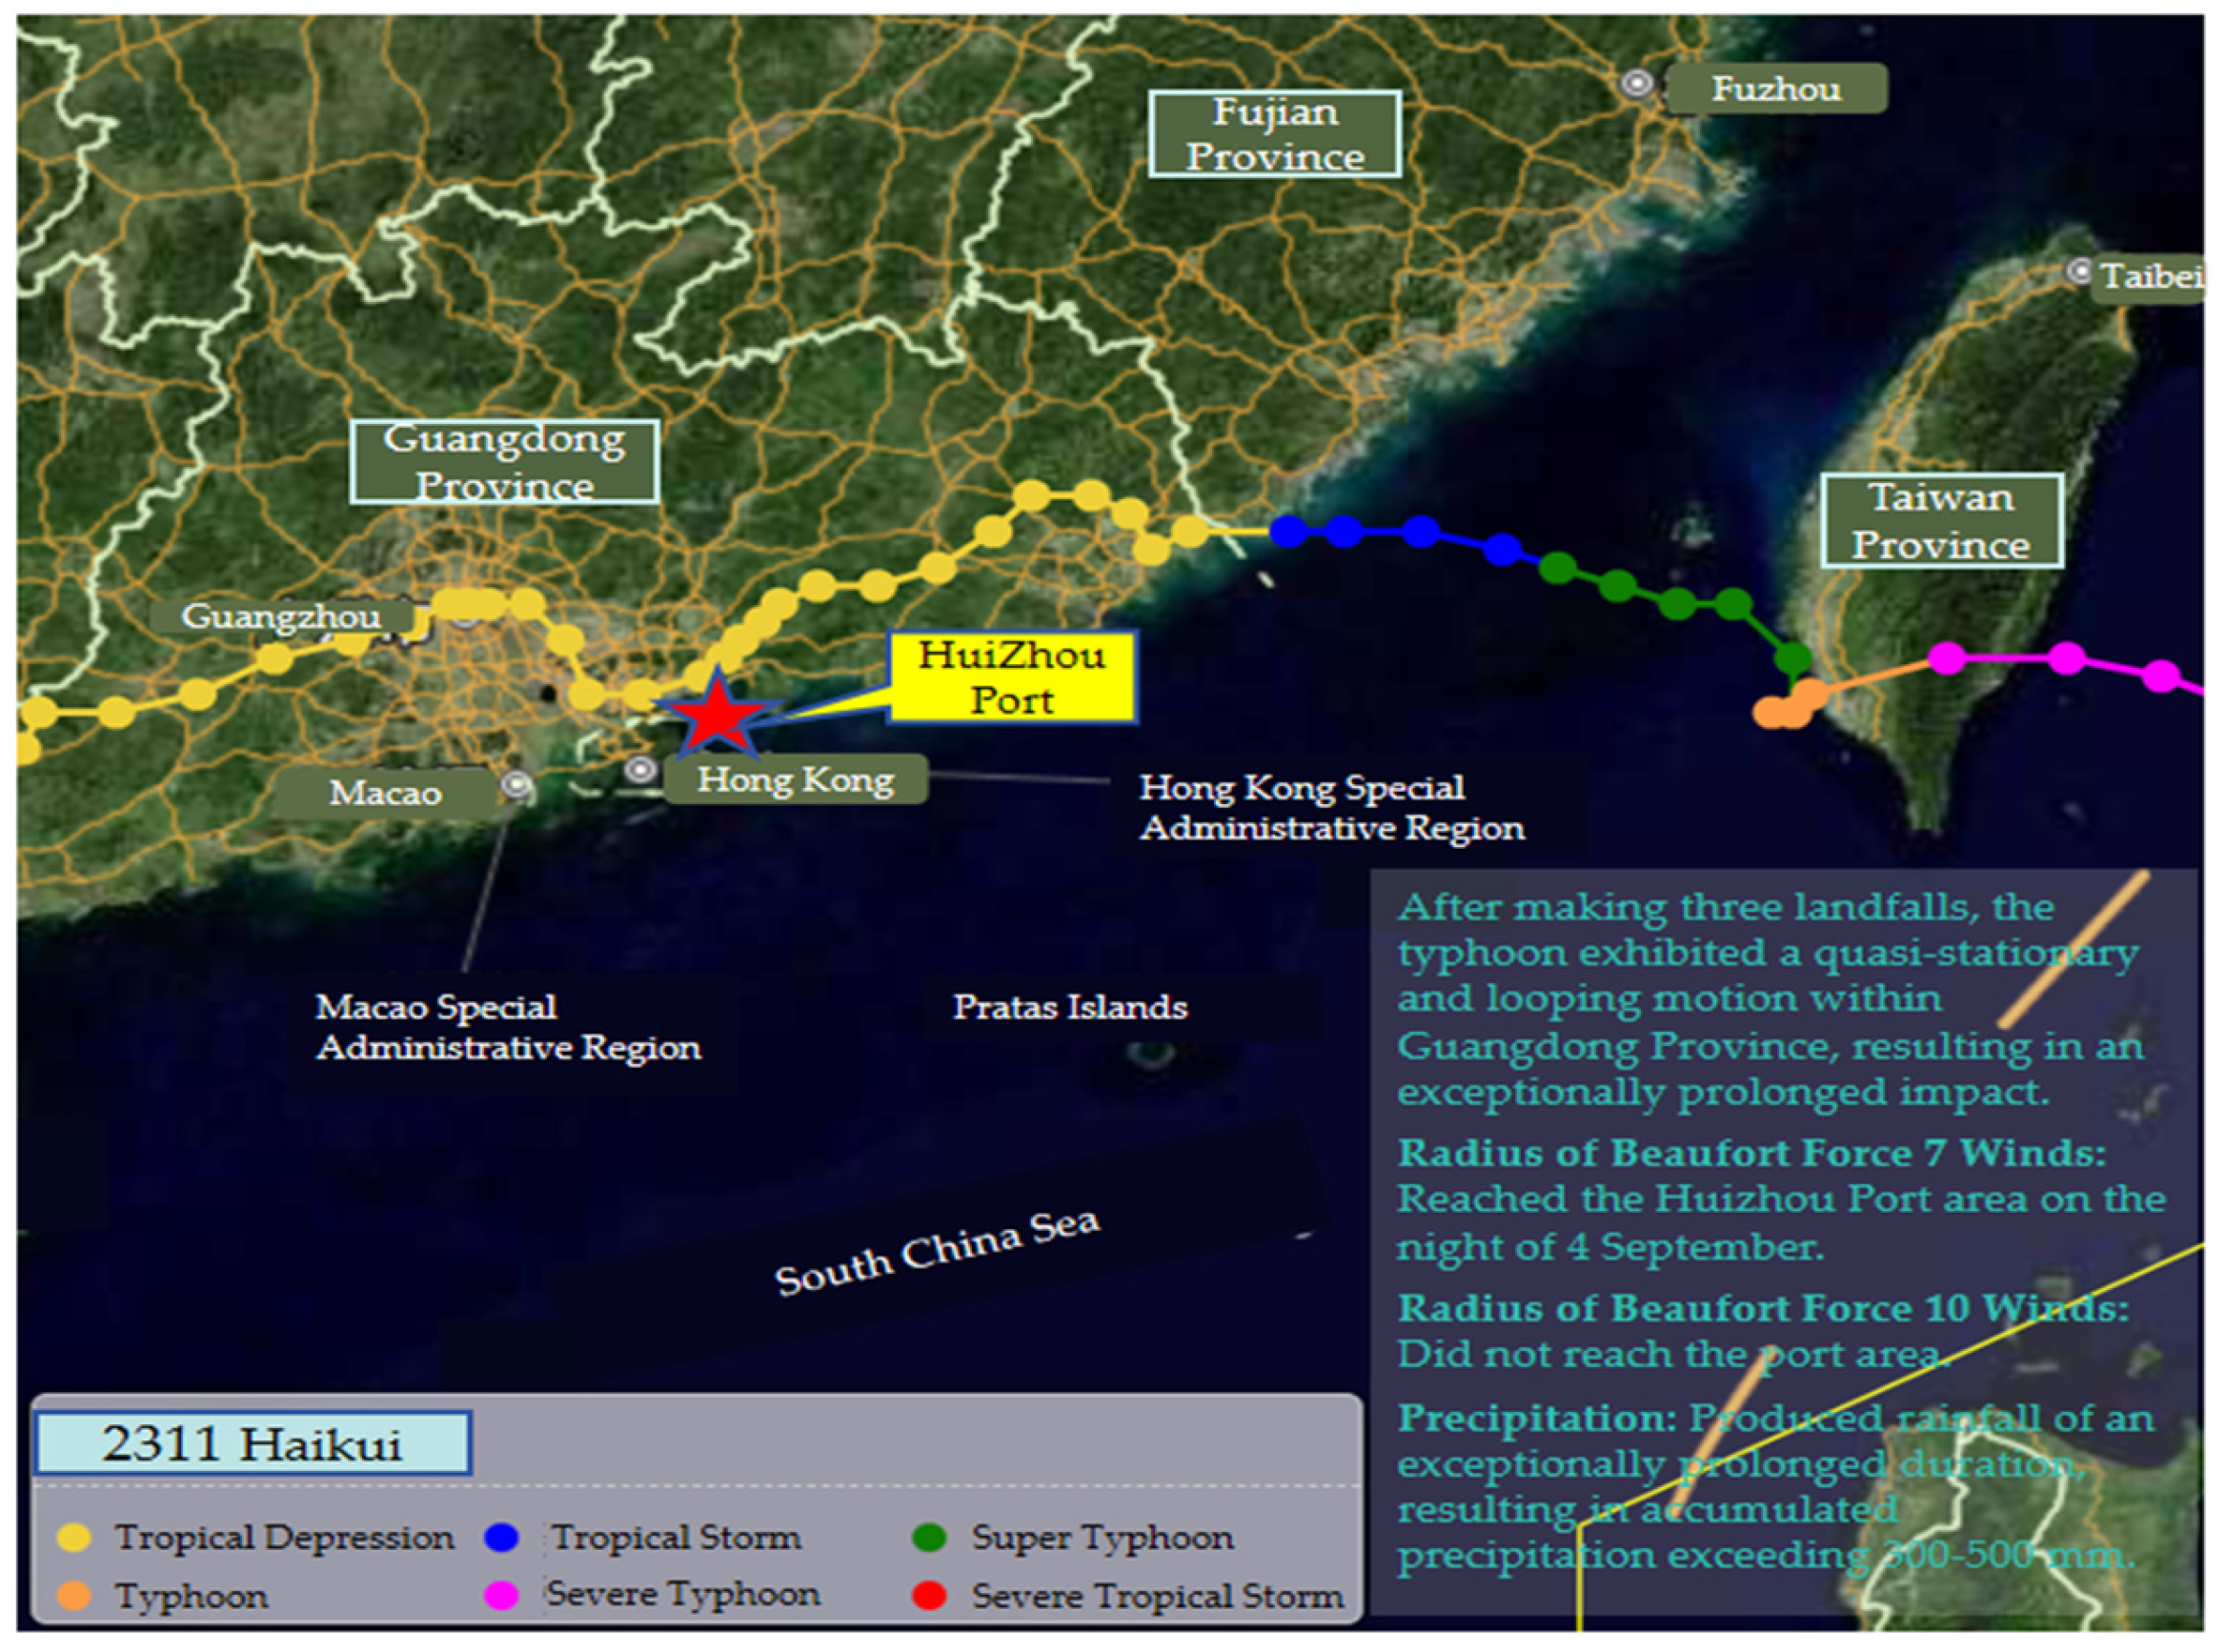
The complex-track type is defined by prolonged, multi-directional and uncertain impacts from anomalous track characteristics, with key discriminant criteria including looping, stagnation, meandering, or multiple abnormal directional changes. Typhoon Haikui (
Figure 6) [
39] typifies this pattern: its highly sinuous track and extremely long lifespan subjected Huizhou Port to a dynamic compound hazard mode, with repeated multi-phase impacts of wind, rainfall and storm surge from varying directions and fluctuating intensities over several days, rather than a single peak event. Repeated wind direction shifts imposed stringent requirements on the multi-directional adaptability of anchorage sheltering, while the extended emergency period severely tested the sustained resilience of the port management system.
In summary, the selected typhoon events systematically cover the primary physical stress spectrum of typhoon hazards to port anchorage safety and fully reflect the performance characteristics of Huizhou Port’s anchorage typhoon preparedness system across different spatiotemporal scales and disaster mechanisms, ensuring the representativeness and diversity of the case set.
We constructed the analysis dataset by individually pairing each anchorage with each of the three typical typhoons, forming distinct “anchorage–typhoon” pairs as the unit of analysis. This resulted in a final dataset comprising 36 anchorage–typhoon preparedness cases, as presented in Appendix
Table A2.
2.3.2. Condition Specification and Model Construction
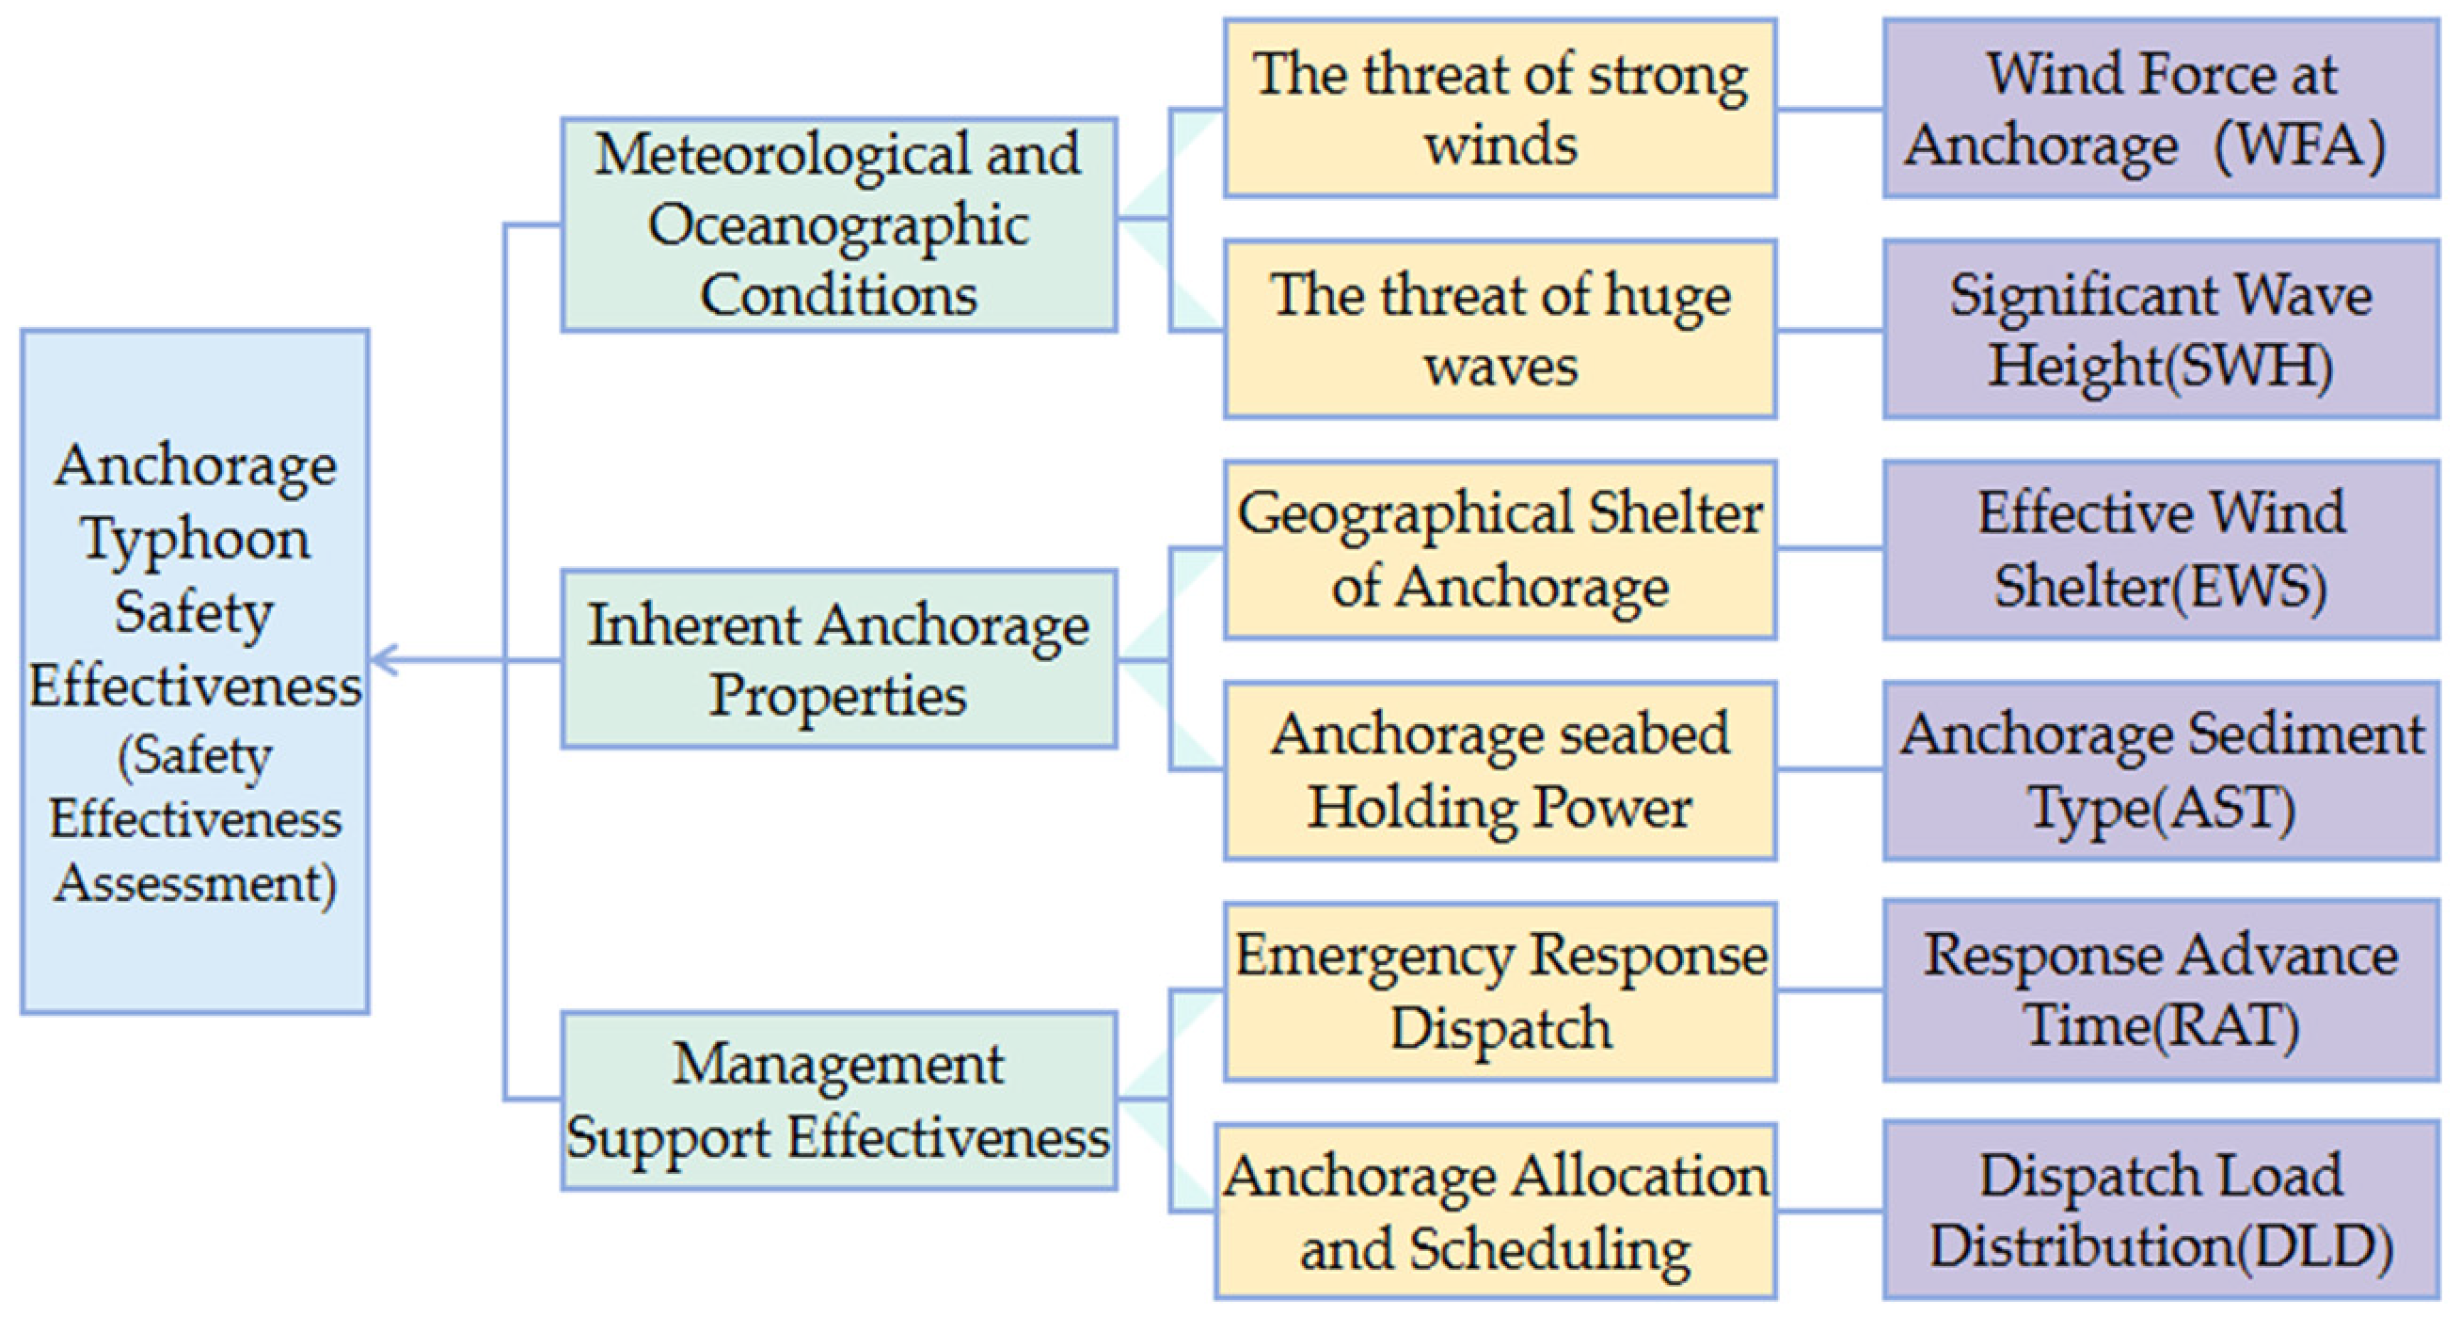
This study strictly adheres to the principle of integrating theoretical guidance and empirical support for condition specification and research model construction. Causal conditions were derived directly from SEM results, which both identified key latent variables affecting anchorage safety and quantified the contribution of each observed indicator to its corresponding latent construct via factor loadings. First, we identified the three core latent variables with the strongest explanatory power for the outcome: MOC, IAP, and MSE. Subsequently, to ensure fsQCA conditions were operational, measurable, and representative of core latent constructs, the two observed indicators with the highest factor loadings were extracted from each core latent variable (higher loadings indicate stronger indicator representativeness and reliability). As shown in
Figure 2, the selected indicators with the highest standardized factor loadings are MOC1 (strong wind threat), MOC2 (high wave threat), IAP1 (anchorage geographic shelter), IAP2 (anchorage seabed holding power), MSE6 (emergency response dispatch), and MSE3 (anchorage allocation and scheduling). Given data availability, their strong representativeness, and relevance to each typhoon event, we quantified the six observed indicators.
- (1)
The threat of strong winds: Quantified by the actual wind force at the anchorage during each typhoon impact period to reflect its effect on anchorage safety effectiveness [
40].
- (2)
The threat of huge waves: Quantified by the significant wave height at the anchorage during each typhoon impact period to reflect its hazard level to anchorage typhoon safety.
- (3)
Geographical shelter of anchorage: To capture dynamic cross-case differences under risk scenarios, effective wind shelter for a specific typhoon was adopted as the measurement indicator. The prevailing wind direction of each typhoon was obtained from meteorological data, and a 180° sector centered on the anchorage and facing the typhoon’s approach direction was defined. Effective wind shelter was calculated as the sum of azimuth angles occupied by all sheltering objects within this sector (detailed results in Appendix
Table A2).
- (4)
Anchorage seabed holding power: A static inherent attribute of an anchorage with a constant value across typhoon cases for a given anchorage. It was quantified by anchorage sediment type, with ordinal values assigned to three substrate types: 0.8 for fluid mud–fine sand–silt composites, 0.5 for fluid mud–silt–silty sand composites, and 0.3 for silt-dominated substrates (detailed sediment types in Appendix
Table A1).
- (5)
Emergency response dispatch: This refers to the system that organizes stakeholders to complete risk avoidance and emergency response tasks via unified command, resource allocation, and process coordination within limited timeframes [
41]. Sufficient lead time is the core premise of effective emergency dispatch; thus this indicator was quantified by response advance time, defined as Formula (7):
where
denotes the start time of significant typhoon impact,
denotes time of first emergency response activation.
The results are provided in Appendix
Table A2.
- (6)
The most direct observable outcome of this dimension is vessel number and concentration in each anchorage within a specific time window. Considering the order-of-magnitude differences in Huizhou Port’s anchorage areas, dispatch load distribution during each typhoon impact period was adopted to quantify individual anchorage operational load pressure. For anchorages with non-zero recommended capacity, it was calculated as Formula (8):
where
denotes dispatch load distribution for the i-th anchorage;
denotes the peak number of vessels within the anchorage during the typhoon event; and
FRCi is optimized recommended capacity for the i-th anchorage.
For anchorages with zero recommended capacity (typically indicating major safety deficiencies such as extremely poor sheltering or inadequate management), a value of 1 was directly assigned regardless of actual vessel number, representing full membership in the high-load set (calculated results in Appendix
Table A2).
- (7)
Anchorage typhoon safety effectiveness: To ensure reliable, comparable measurement, this outcome variable was comprehensively assessed across wind/wave resistance, inherent waterway properties, and emergency support capability to evaluate overall vessel safeguarding performance under different typhoon scenarios. It was quantified via a 1–10 expert scoring scale, where 1 indicates extremely poor effectiveness and 10 indicates optimal effectiveness. Experts assigned a safety effectiveness score to each anchorage under each typhoon based on actual conditions and observed safety performance.
In summary, the fsQCA research model is established as shown in
Figure 7.
2.3.3. Data Processing and Calibration
Wind force at anchorage is denoted as “WFA” (~WFA for negation); significant wave height as “SWH” (~SWH); effective wind shelter as “EWS” (~EWS); anchorage sediment type as “AST” (~AST); response advance time as “RAT” (~RAT); dispatch load distribution as “DLD” (~DLD); and the outcome variable safety effectiveness assessment as “SEA” (~SEA).
The core principle of fsQCA is to convert raw data into set-theoretic concepts via calibration—a process that transforms measured variables into continuous fuzzy-set membership scores (0–1) to assign interpretable set membership to the original data. Calibration is standardly performed using three sequential qualitative anchors: full membership, crossover point, and full non-membership. For variables without well-established theoretical or empirical calibration standards, the 90th, 50th, and 10th percentiles of the data distribution were adopted as the thresholds for the three corresponding anchors to minimize subjective bias (the calibration anchors and descriptive statistics for all conditions and the outcome variable are presented in
Table 4). This approach transformed all condition and outcome variables into fuzzy sets with 0–1 bounded membership scores, where the score magnitude represents the degree of a case’s membership in the target set. To avoid logical contradictions (cases with an exact membership score of 0.5 are automatically excluded by fsQCA software), a trivial constant (±0.001) [
42] was added to the raw values of relevant conditions as needed to eliminate this exact value. All calibrations were performed using fsQCA 4.1 software, and resulting membership scores (rounded to two decimal places) were used as the input for subsequent fsQCA calculations.
2.3.4. fsQCA Analysis and Robustness Check
Necessity analysis was conducted to identify whether any single condition constitutes a necessary condition for the outcome. In standard QCA procedures, the necessity of a single variable is determined by its consistency score [
43], calculated as Formula (9):
For a condition X (single or combinatorial) to be sufficient for the outcome Y, its fuzzy-set membership score must be less than or equal to that of Y, with a consistency threshold set at 0.8. For necessity, the threshold is set at 0.9: conditions with consistency exceeding 0.9 are identified as necessary conditions for the outcome. Following necessity and sufficiency assessment, the explanatory power of X for Y is quantified by coverage, calculated as Formula (10):
Coverage indicates the empirical explanatory scope of condition X for the outcome, with higher values indicating stronger explanatory power.
From a configurational perspective, a truth table was constructed to analyze the combined effects of causal conditions. Consistent with well-established QCA methodological guidelines [
44], the raw consistency threshold was set at 0.8, and the proportional reduction in inconsistency (PRI) consistency threshold at 0.65. Given that there were only 36 valid cases, the case frequency threshold was set at 1. Configuration analysis was conducted using fsQCA 4.1 software, with SEA as the outcome variable. To obtain theoretically meaningful and parsimonious solutions, this study primarily reports the intermediate solution (Appendix
Table A3), which is derived based on theoretical assumptions for counterfactual cases [
45]. Based on theoretical logic, practical feasibility, and the expected impact of each condition on the outcome, counterfactual assumptions were set as follows: conditions with a clear positive effect on anchorage safety (EWS, AST, RAT) were assumed present; conditions with a clear negative effect (DLD) were assumed absent; typhoon-induced hazard conditions (WFA, SWH) were set as present or absent with no prior assumptions, to fully explore safety configurations under diverse meteorological and oceanographic scenarios.
Given the case-oriented nature of QCA and the limited sample size, two robustness checks were performed following well-established methodological protocols [
46]:
- (1)
The raw consistency threshold was increased from 0.8 to 0.85.
- (2)
One case (Anchorage 8) was randomly removed from the sample.
Both checks yielded conditional configurations substantially consistent with the original results, confirming the reliability of the findings for subsequent analysis. Detailed robustness check results are presented in Appendix
Table A4.
2.4. Ethics Statement
This study involved no human participants, clinical interventions, or vulnerable populations. The questionnaire-based surveys were conducted as part of routine port and maritime industry safety and operational assessments—specifically examining anchorage safety under typhoon conditions, current operational practices, and management effectiveness. No experimental manipulations were performed; no sensitive personal information, biological samples, or personally identifiable data were collected. All data were anonymized and used exclusively for academic research and statistical analysis, in full compliance with international academic integrity standards and institutional research ethics guidelines. Accordingly, formal ethical review approval and written informed consent were not required for this study.
5. Conclusions and Managerial Insights
This study establishes a hybrid SEM–fsQCA framework to address typhoon-period anchorage safety challenges in Guangdong Province, validated using 36 anchorage–typhoon coupled cases from typhoon-prone Huizhou Port. We find that anchorage safety effectiveness stems from synergistic multi-factor interactions with conjunctural causation and equifinality, rather than single-factor linear effects. SEM identifies meteorological and oceanographic conditions, inherent anchorage properties, and management support as the three core safety drivers, with the resultant weights subsequently employed to optimize anchorage capacity estimates. fsQCA further reveals three dominant configurational paths to high safety performance: intrinsic-property-dominant, management-support-dominant, and load-control-dominant types. High safety can be achieved via either superior infrastructure or robust operational management, while rational load control is a mandatory prerequisite for all safety pathways.
Grounded in these mechanistic insights, this study proposes a dynamic tiered anchorage management paradigm applicable to all coastal ports in Guangdong Province. Based on configurational pathway analysis, the paradigm dynamically classifies anchorages into three tiers according to their performance across different typhoon scenarios (A: core typhoon-resistant, B: conditionally usable, C: restricted-use). This enables a transition from static one-size-fits-all management to dynamic precision governance. A phased implementation roadmap is provided for Guangdong port management authorities: In the short-term (within 1 year), prioritize rational anchorage scheduling and strict load control via real-time vessel monitoring and dynamic capacity management systems, with mandatory enforcement of typhoon type-specific maximum capacity thresholds. In the medium term (1–3 years), enhance management support systems by developing an intelligent dispatch decision-support platform, which enables automated matching and simulation of typhoon warning information and anchorage allocation plans, to improve the precision of early warning-dispatch closed-loop management. In the long term (beyond three years), upgrade anchorage inherent properties through comprehensive structural safety assessments, engineering retrofits, and functional repositioning of anchorages with inadequate shelter or suboptimal seabed conditions, to fundamentally improve the overall typhoon resilience of Guangdong’s port anchorage systems.
This dynamic tiered anchorage management model enhances typhoon resilience at the operational level while also aligning with the strategic goals of port sustainable development. Specifically, through rational scheduling and load control, it reduces unnecessary vessel shifting and congestion, thereby lowering fuel consumption and greenhouse gas emissions (environmental sustainability); by improving anchorage safety effectiveness, it minimizes the risks of collisions, anchor dragging, and other accidents, safeguarding the lives of crew members and port communities (social sustainability); by avoiding anchorage overload and forced port closures, it reduces direct and indirect economic losses from supply chain disruptions (economic sustainability). These insights provide a reference for coastal ports seeking to coordinate safe operations with sustainable development goals in the context of climate change.