1. Introduction
Natural disasters are inherently uncertain events, yet their impacts pose persistent challenges to the long-term sustainability and resilience of urban and transportation infrastructure. Floods and earthquakes, in particular, remain among the most frequent and destructive hazards worldwide, often disrupting essential services and causing long-lasting social and economic consequences. For example, according to Japan’s Ministry of Land, Infrastructure, Transport, and Tourism, flood-related disasters in 2019 resulted in economic losses exceeding two trillion Japanese yen and more than 87 fatalities [
1]. Similarly, major earthquakes, such as the 2023 Turkey–Syria earthquakes [
2] and the 2015 Nepal earthquake [
3], have highlighted the vulnerability of critical infrastructure systems and the urgent need for sustainable risk mitigation strategies.
Early warning systems play a pivotal role in disaster risk reduction by providing timely information that enables protective actions, minimizes damage, and supports sustainable recovery. Over the past decades, a variety of advanced technologies have been developed to monitor water levels, seismic activity, and structural vibrations, including real-time flood monitoring platforms [
4,
5] and bridge vibration monitoring systems employing accelerometers, strain gauges, and distributed sensing techniques [
6,
7]. While these systems demonstrate high accuracy and reliability, their widespread implementation remains limited. In practice, they are typically installed only at high-priority sites such as major bridges, dams, and critical public infrastructure due to high installation and maintenance costs (commonly
$5000+ for conventional piezoelectric or strain-gauge-based systems), complex calibration requirements, and the need for specialized expertise [
8].
From a sustainability perspective, this limited coverage poses a significant challenge. Many small- to medium-scale infrastructures, particularly in resource-constrained regions (e.g., rural bridges or rapidly urbanizing areas with limited maintenance budgets), remain unmonitored, increasing long-term vulnerability and maintenance costs. Specifically, the proposed low-cost IoT systems can be deployed for approximately
$200–
$300, highlighting a substantial cost gap compared with conventional professional monitoring systems (commonly >
$5000 per unit). This cost advantage, combined with lower installation complexity and reduced power requirements, enables equitable monitoring for small- to medium-scale infrastructures that are often ignored by conventional solutions.
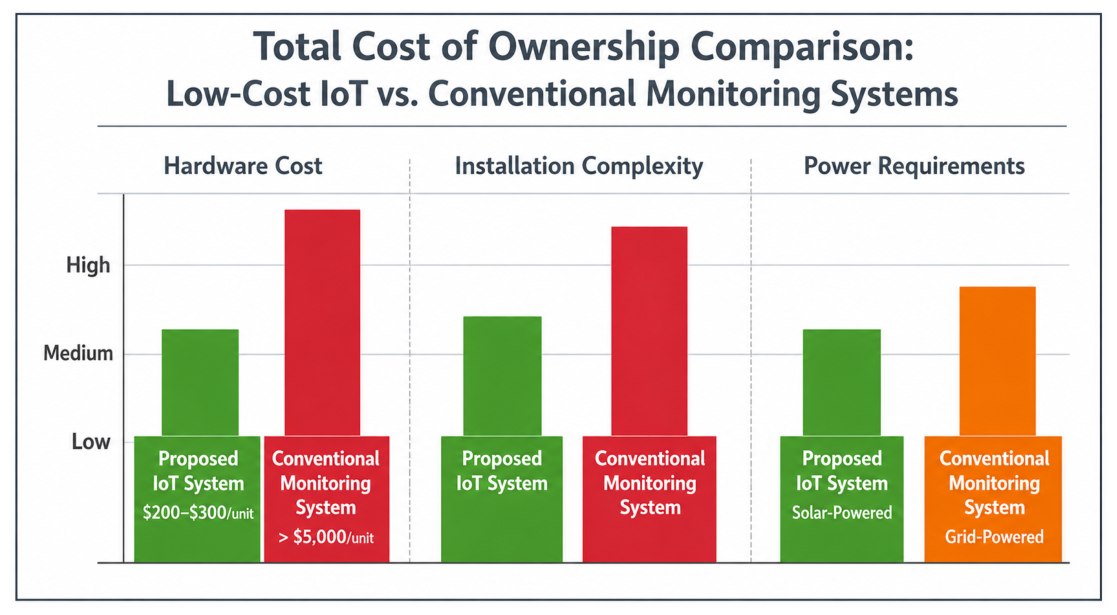
Figure 1 illustrates a conceptual comparison of total cost of ownership (TCO) between the proposed IoT system and a conventional professional system, emphasizing the economic sustainability and broader accessibility of low-cost monitoring approaches. This cost advantage not only improves accessibility but also enables the integration of multiple sensing modalities within a single platform, allowing simultaneous monitoring of hydrological and structural parameters that are typically measured separately in conventional systems. Affordable, scalable, and energy-efficient monitoring solutions are therefore essential to support sustainable infrastructure management, enhance resilience, and promote broader access to early warning technologies.
To further illustrate the sustainability and cost-effectiveness of the proposed IoT system,
Table 1 provides a consolidated cost breakdown of the prototype, including all major hardware and power components. The total prototype cost (~
$300) is substantially lower than conventional industrial monitoring systems (typically >
$5000) [
8], while offering multi-sensor capability, modular deployment, and solar-powered operation. This consolidated cost-to-performance view reinforces the system’s contribution to equitable infrastructure monitoring and its potential for broader adoption in resource-constrained contexts.
While the IoT is not new, the integration of multimodal data—vibration, distance, and visual—into a single low-cost, solar-powered unit for bridge-specific hydrology represents the primary novelty of this work. Unlike many existing low-cost Raspberry Pi–based monitoring studies, which typically focus on individual sensors or isolated measurements, the proposed system integrates multiple data streams and enables their combined interpretation within a unified early warning framework. To address this research gap, two prototype IoT configurations are presented: (1) a system comprising a Raspberry Pi, an ADXL355 accelerometer, a Lidar Lite V3 sensor, and a Pi Camera Module for monitoring water levels and structural vibrations; and (2) a system integrating a Raspberry Pi, an HX711 amplifier, and a CDP25 displacement transducer for measuring bridge-bearing displacements. Both systems are validated through laboratory testing, sensor repeatability and uncertainty analyses, and preliminary field deployment.
Unlike most previously published IoT-based structural and flood monitoring studies, which focus on individual sensors or conceptual system architectures, this work presents a fully integrated, low-cost, multi-sensor early warning framework. The system combines Lidar-based water-level monitoring, accelerometer-based structural response measurement, and image-based flood assessment within a single IoT platform. Quantitative validation includes repeatability and uncertainty analysis of the Lidar Lite V3, laboratory and field testing of the ADXL355, and algorithmic fusion of multi-source data. Furthermore, the early warning logic is formalized using mathematical threshold models and algorithmic flowcharts, moving beyond descriptive monitoring toward actionable decision support. These contributions distinguish the proposed approach from existing IoT-based monitoring systems and demonstrate its potential for scalable, sustainable, and practical early warning applications.
The remainder of the paper is organized as follows:
Section 2 details the system design, sensors, laboratory validation and application of first set of IoT devices;
Section 3 presnets the design, sensors, laboratory validation and application of second set of IoT devices;
Section 4 provides the summary of the key findings and discusses future research directions.
2. First Set of IoT Devices
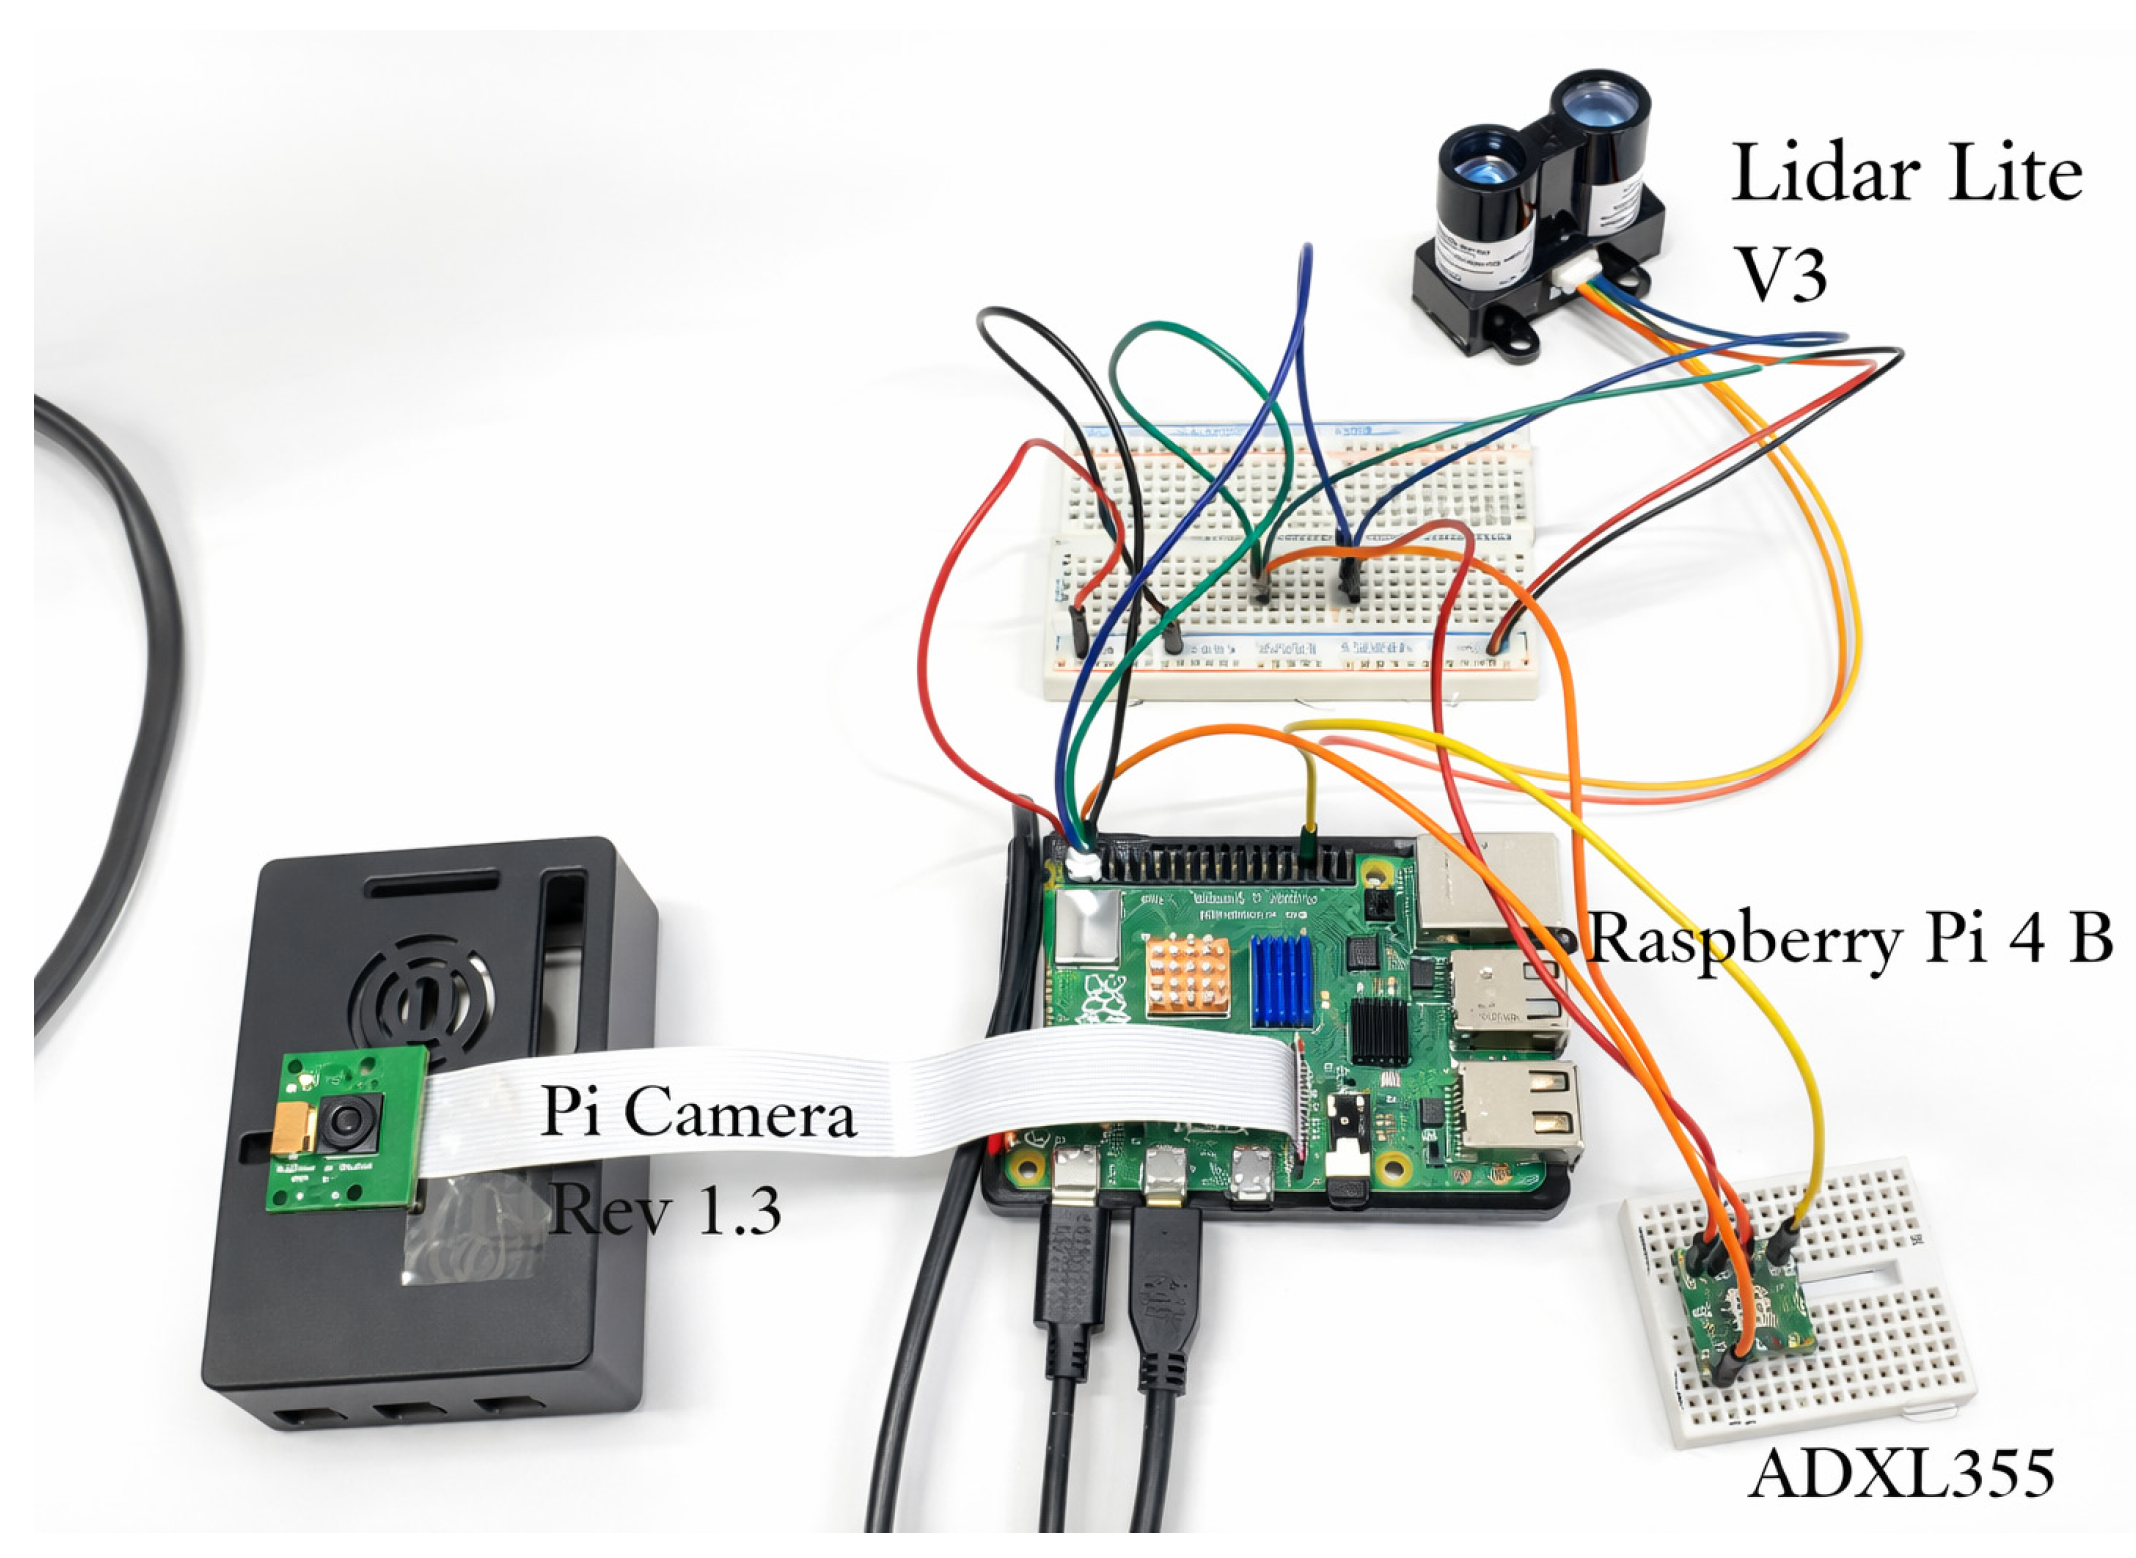
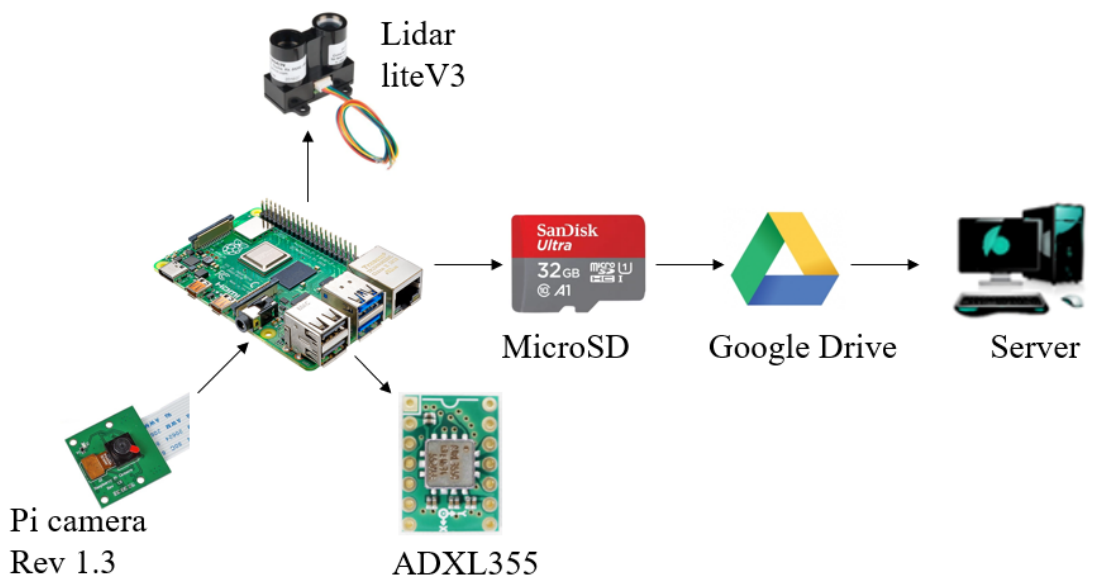
The first configuration of IoT devices proposed in this study consists of a Raspberry Pi Camera Module, a Lidar Lite V3 sensor, and an ADXL355 accelerometer, all integrated through a Raspberry Pi microcontroller. Each device is designed to monitor a specific aspect of flood and structural conditions: the Pi Camera captures periodic images of the water level; the Lidar Lite V3 measures the distance between the bridge deck and the water surface to detect rising flood levels; and the ADXL355 accelerometer records structural vibrations to assess the bridge’s dynamic response. The combined functionality enables a multi-dimensional monitoring system capable of simultaneously tracking hydrological and structural parameters (
Figure 2).
This integrated setup provides a cost-effective alternative to conventional monitoring systems, which are often limited to high-cost, single-purpose sensors. The modular design also ensures flexibility, allowing the devices to operate independently or in combination depending on monitoring needs. A detailed description of each component and its role in the system is presented in the following subsections.
2.1. Raspberry Pi 4 Model B
The microcomputer adopted in this study is the Raspberry Pi 4 Model B. It has the capability of on-board computation and a credit-card-sized motherboard.
Table 2 shows the properties of Raspberry Pi 4 Model B [
9], which shows comprehensive and compatible functions. The processor is Broadcom BCM2711 (Broadcom Inc., San Jose, CA, USA), Quad-core Cortex-A72 (ARM v8) 64-bit SoC @ 1.5 GHz which makes it faster computation than other models. Its compact size, low power consumption, and low cost make it widely used. The 40 general-purpose input or output (GPIO) pins are programmable for several communication protocols for data acquisition.
2.2. Pi Camera V1.3
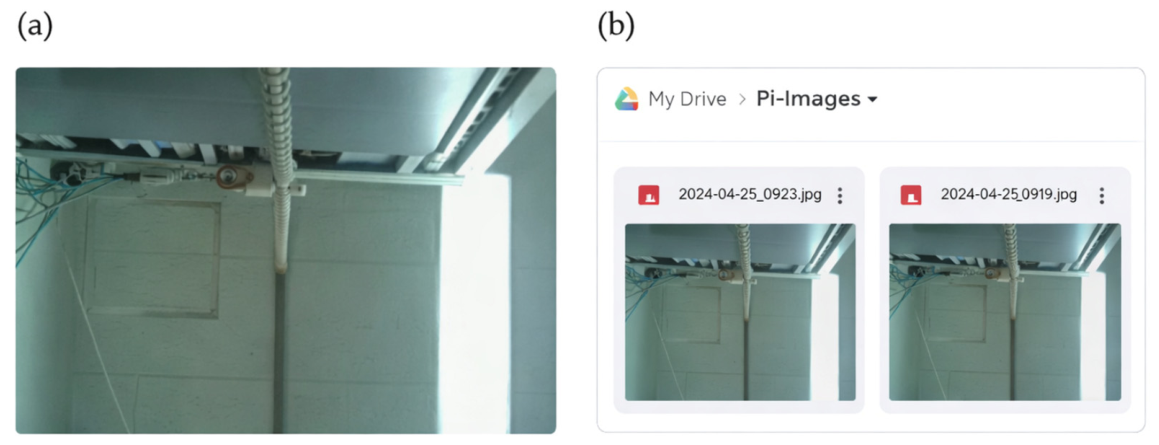
The Raspberry Pi Camera Board connects to the Raspberry Pi through the CSI connection. It can deliver a 5 MP resolution image, or 1080 p HD video recording at 30 fps. It has a light weight of about 3 g [
10]. The feasibility check is carried out by recording the picture taken using a Pi camera in the user-defined interval and saving it in the Google drive as shown in
Figure 3.
2.3. Lidar Lite V3
Lidar Lite V3 is a light-ranging module whose range is 0–40 m and measures with an accuracy of ±2.5 cm at distances greater than 1m. It runs at a 4.75–5 V DC power supply with a current consumption rate of <100 mA at continuous operation. It can connect with Raspberry Pi through an I2C interface [
11].
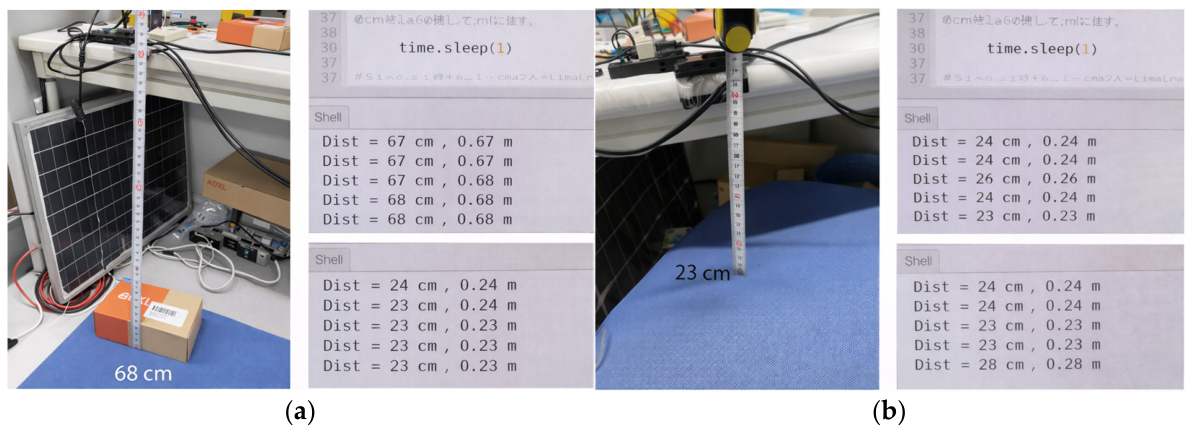
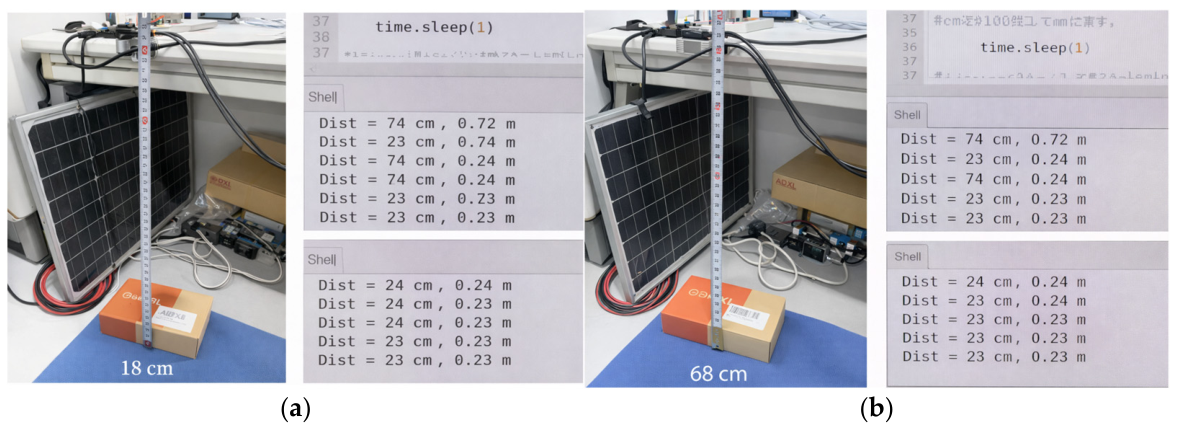
In this study, the Lidar Lite V3 was connected to the Raspberry Pi to measure water-level distances, and manual tape measurements were used as references. Initial readings showed fluctuations of approximately 4–6 cm, as illustrated in
Figure 4. To improve measurement accuracy, scaling was applied using known reference distances, resulting in corrected measurements as shown in
Figure 5.
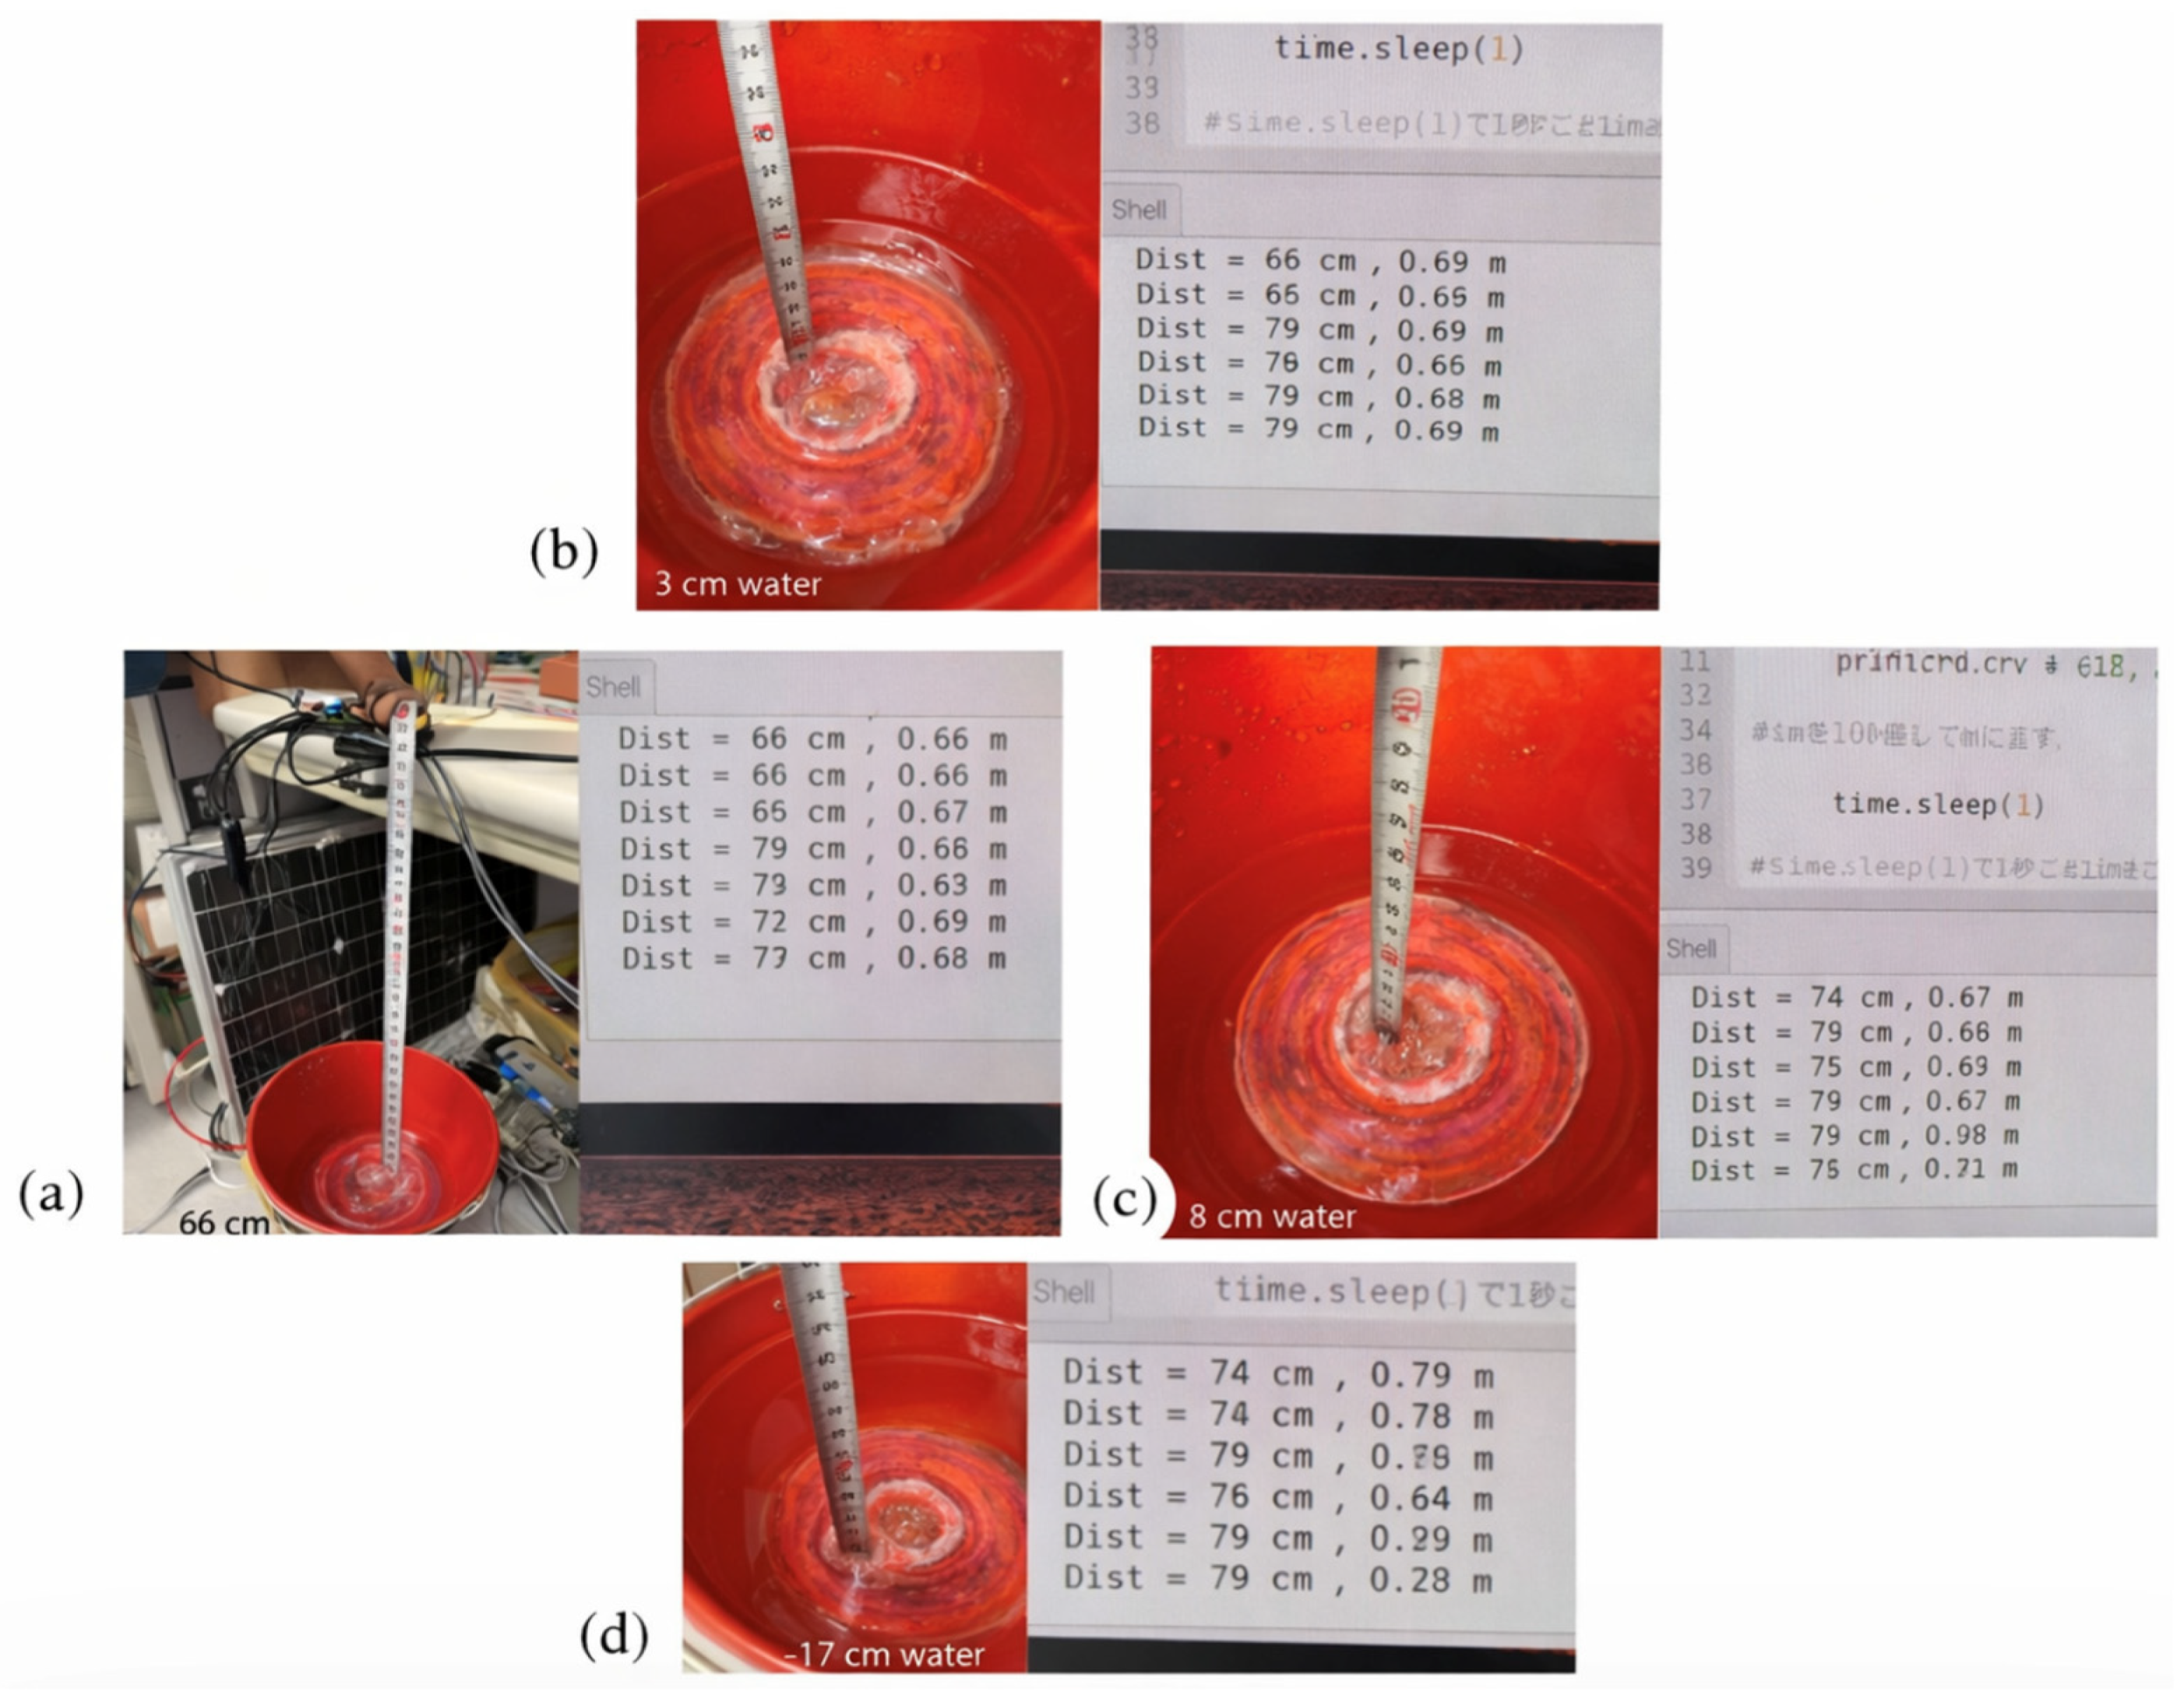
The sensor’s feasibility to measure water-level heights was further evaluated using controlled water volumes in a bucket, as shown in
Figure 6. For small water levels (3 cm and 7 cm), the readings closely matched the actual levels, while higher water levels (~17 cm) exhibited larger fluctuations (up to 4–6 cm). These fluctuations are within the sensor’s expected variability and can be used to detect rising water levels and trigger early warning signals. Although a fluctuation of approximately 4–6 cm is observed, this variability does not significantly affect the reliability of the early warning system, as threshold levels are defined with sufficient margins and the system primarily relies on continuous monitoring and trend detection of rising water levels rather than individual measurements. In addition, potential effects of measurement noise under practical conditions, such as increased distance or environmental disturbances, are mitigated through continuous data acquisition, threshold-based filtering, and the integration of complementary sensing modalities, including image-based monitoring for visual verification.
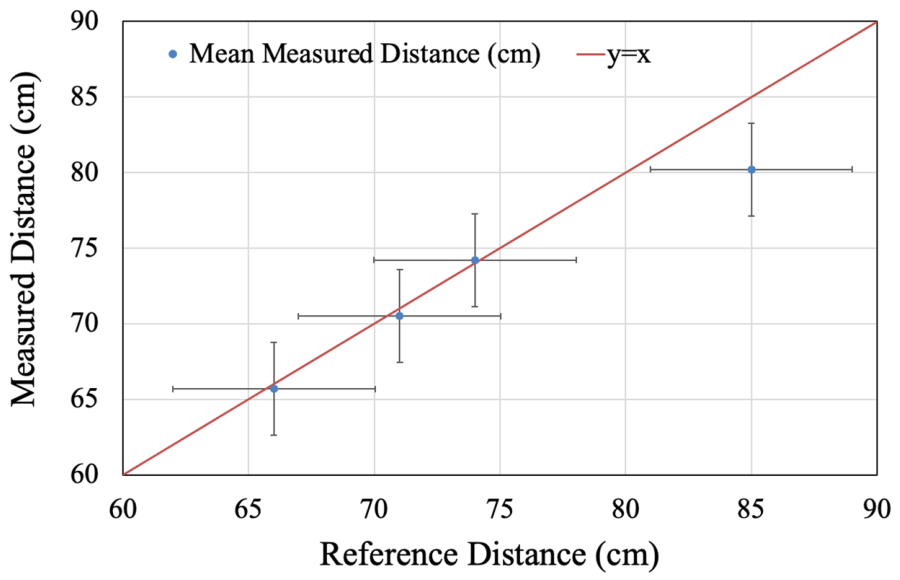
To quantify sensor performance, repeatability tests were conducted with 10 measurements per reference distance. The mean measured distance, standard deviation (SD), and root mean square error (RMSE) were calculated. The results are presented in
Figure 7, which shows the mean measured distance with error bars (±1 SD) and an ideal measurement line (y = x) for comparison. Across all conditions, the overall RMSE was 2.42 cm, and SD increased with higher water levels (up to 2.66 cm), indicating higher variability under such conditions.
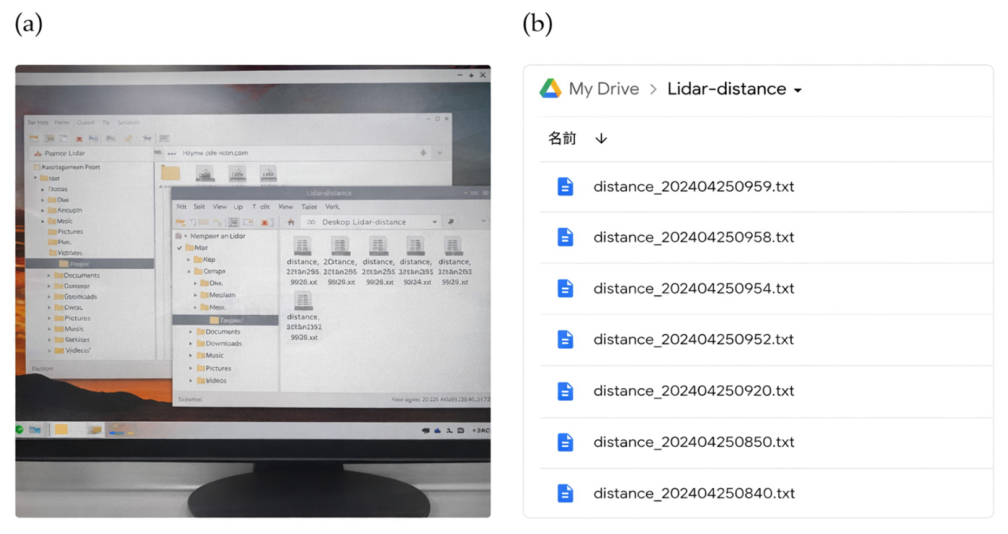
All sensor readings were recorded at user-defined intervals and stored locally on the Raspberry Pi, then uploaded to Google Drive when internet access was available, as shown in
Figure 8 for reference. This dataset provides both real-time monitoring capability and a basis for quantitative performance evaluation.
It should be noted that the reported RMSE represents sensor performance under controlled short-range laboratory conditions. In practical field applications, the sensor is expected to operate within its specified accuracy range (±2.5 cm for distances greater than 1 m), and the system relies on relative water-level changes and threshold-based detection rather than relying solely on absolute distance measurements.
2.4. ADXL355 Accelerometer
Selecting an appropriate accelerometer is necessary to meet accuracy and reliability requirements. Quality sensors offer superior results since they are resistant to noise. However, their high cost makes them unsuitable for wide use. Therefore, there should be a balance between affordability and quality.
Table 3 compares the specifications of various accelerometers, namely, ADXL355 [
12], MPU6050 (TDK InvenSense, San Jose, CA, USA) [
13], LIS3DHH (STMicroelectronics, Geneva, Switzerland) [
14], MPU9250 (TDK InvenSense, San Jose, CA, USA) [
15], and MMA8452 (NXP Semiconductors, Eindhoven, The Netherlands) [
16]. It is observed that the ADXL355 has low noise and higher sensitivity. Although lower-cost accelerometers are available, the ADXL355 was selected due to its significantly lower noise density and higher sensitivity, which are essential for accurately capturing low-amplitude, low-frequency vibrations typical of bridge structures. Accelerometers capture motions more accurately with minimal noise and high sensitivity. Thus, the ADXL355 accelerometer developed by Analog Devices, Inc. in 2016 is selected in this study. It is a 3-axis accelerometer that has low noise, low drift, low power, and an operating temperature range of −40 °C to +125 °C. The digital output features of the ADXL355 accelerometer facilitate reading the data directly by the Raspberry Pi.
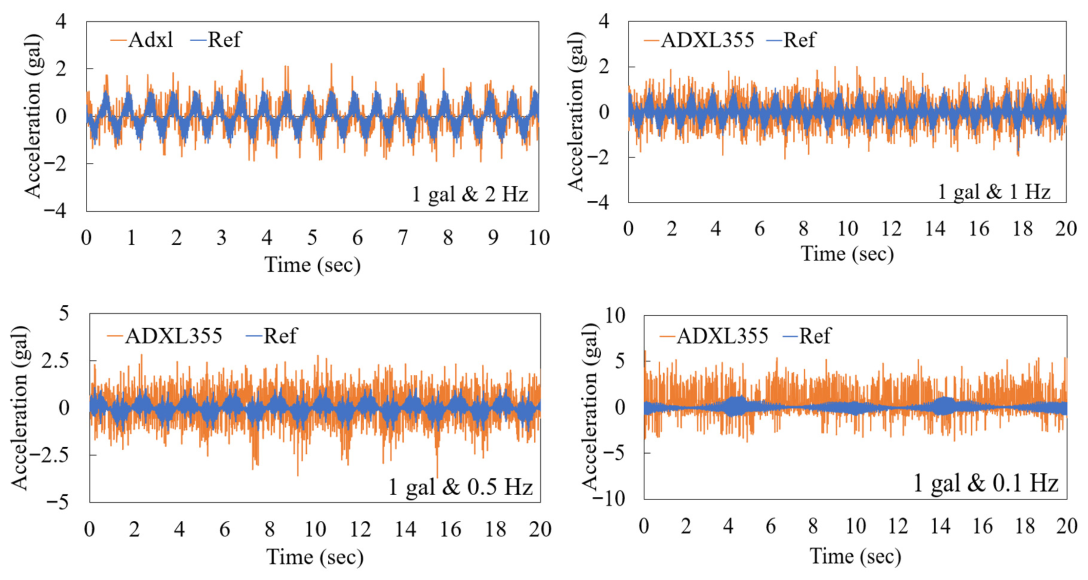
The performance of the ADXL355 accelerometer was validated using a uniaxial harmonic excitation shaking table driven by a smooth 5-phase stepping motor (Tamagawa Seiki Co., Ltd., Iida City, Nagano Prefecture, Japan). A high-sensitivity reference sensor (ARS-10A, Tokyo Measuring Instruments Laboratory Co., Ltd., Tokyo, Japan) was used to benchmark the measurements. Excitation frequencies of 0.1, 0.5, 1, and 2 Hz with 1 gal amplitude were applied. The time-domain results of the IoT sensor were compared with the reference sensor, as shown in
Figure 9. It was observed that noise is more prominent at lower frequencies, while sensor performance improves at higher frequencies. This behavior is attributed to the signal-to-noise characteristics of the sensor, where low-frequency, low-amplitude signals are more susceptible to environmental disturbances and electronic noise, resulting in relatively higher noise levels compared to higher-frequency responses.
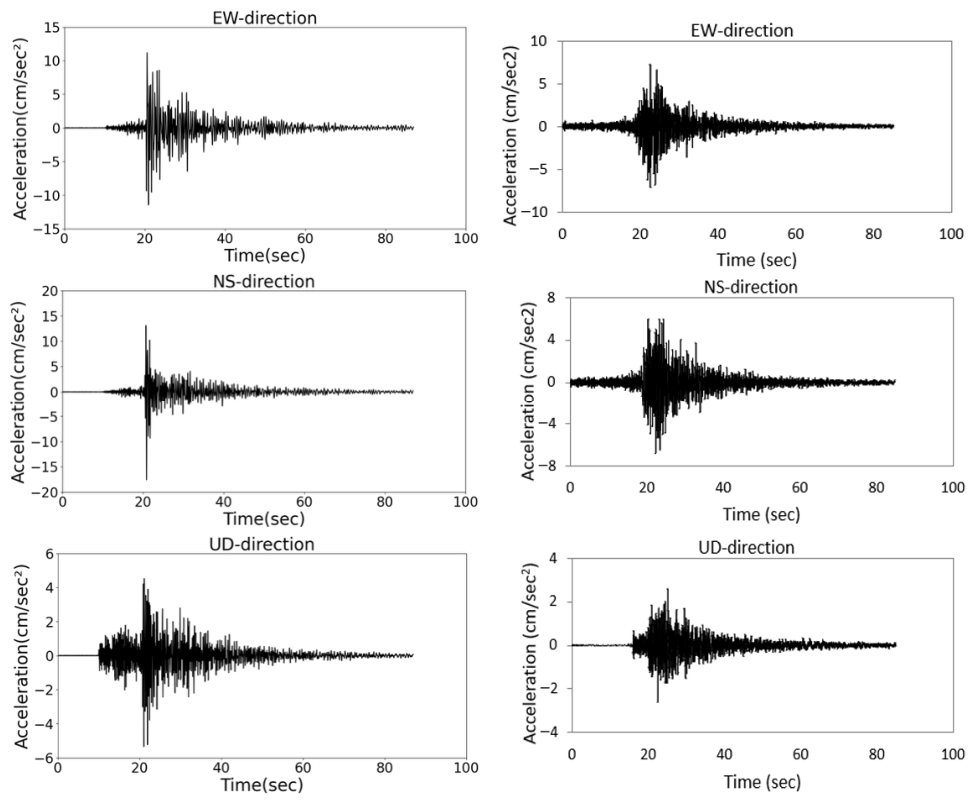
In addition, a set of IoT devices was installed on the 8th floor of Research Building-1 at Saitama University to capture real earthquake events. Multiple recordings were made using the ADXL355 accelerometer.
Figure 10 shows a comparison between the waveform recorded on 31 March 2022 at Omiya Station and the corresponding measurement from the ADXL355 sensor, demonstrating the feasibility of using this sensor for field monitoring. The comparison presented is qualitative in nature and is intended to demonstrate the feasibility of the sensor; detailed quantitative validation using metrics such as correlation coefficients will be considered in future studies.
2.5. Monitoring System
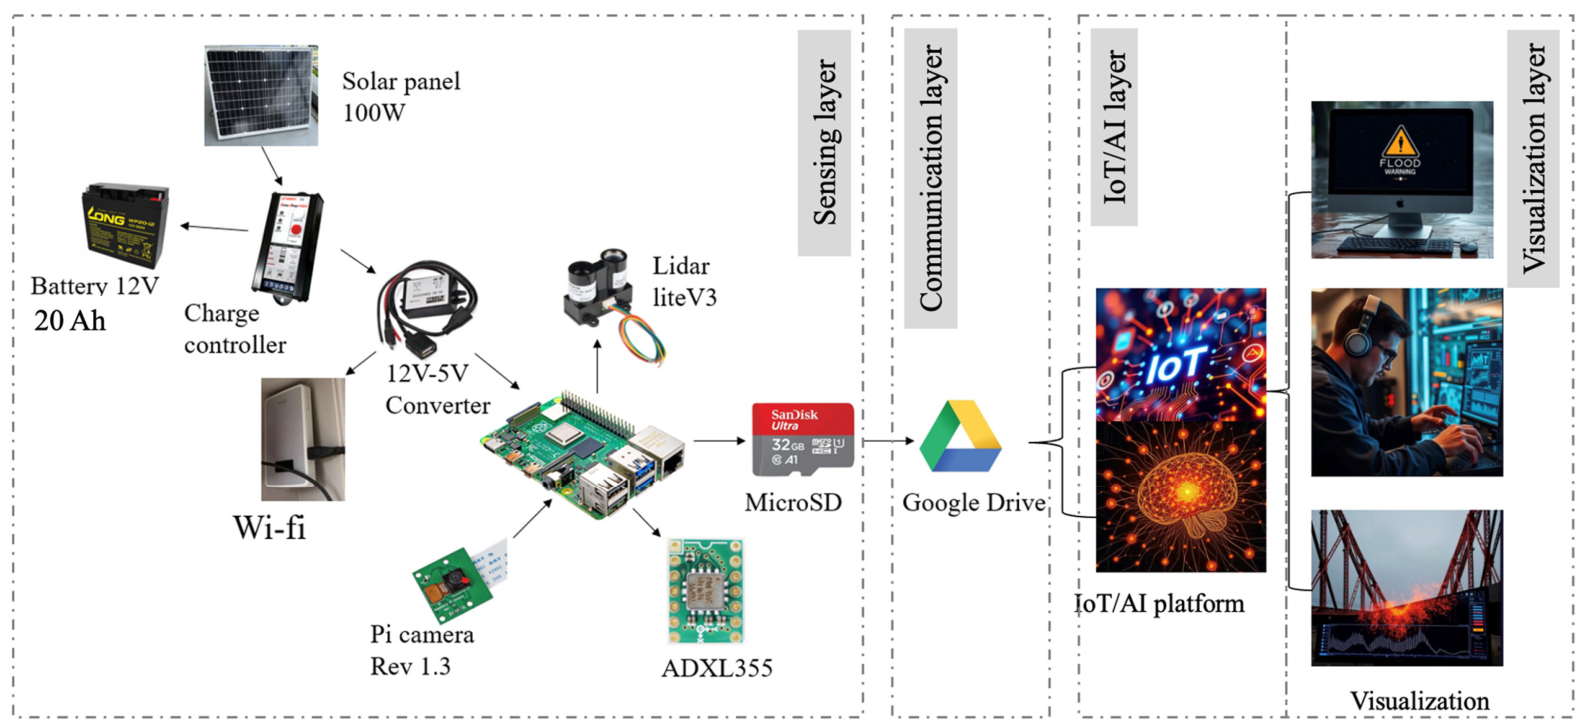
The system was created in an open-source Python v3.10 environment to manage real-time data collection, storage, and transfer. The monitoring system comprises data recording, transferring to the cloud server, and data analysis. Sensors sense the physical environment, and the microcontroller acquires the data from the sensors and processes it. Initially, the data is saved on the local microSD card, so the data is saved even with the malfunctioning Wi-Fi connection. The data is sent to Google Drive and the server for analysis, as shown in
Figure 11. Serial protocol Inter-Integrated Circuit (I2C) allows for communication between the accelerometer and Lidar with the microcomputer. After installation, the monitoring process is automatic, and as long as the system has an internet connection, it is possible to access the program maintenance remotely.
Sensor data are recorded at user-defined intervals, typically around 1 Hz for water-level measurements and up to 100 Hz for vibration data. The processed data, including images, water level, and vibration information, are uploaded to the cloud at regular intervals of one minute. This enables near-real-time monitoring, with latency primarily influenced by Wi-Fi connectivity and data upload frequency.
2.6. Data Streams and System Integration
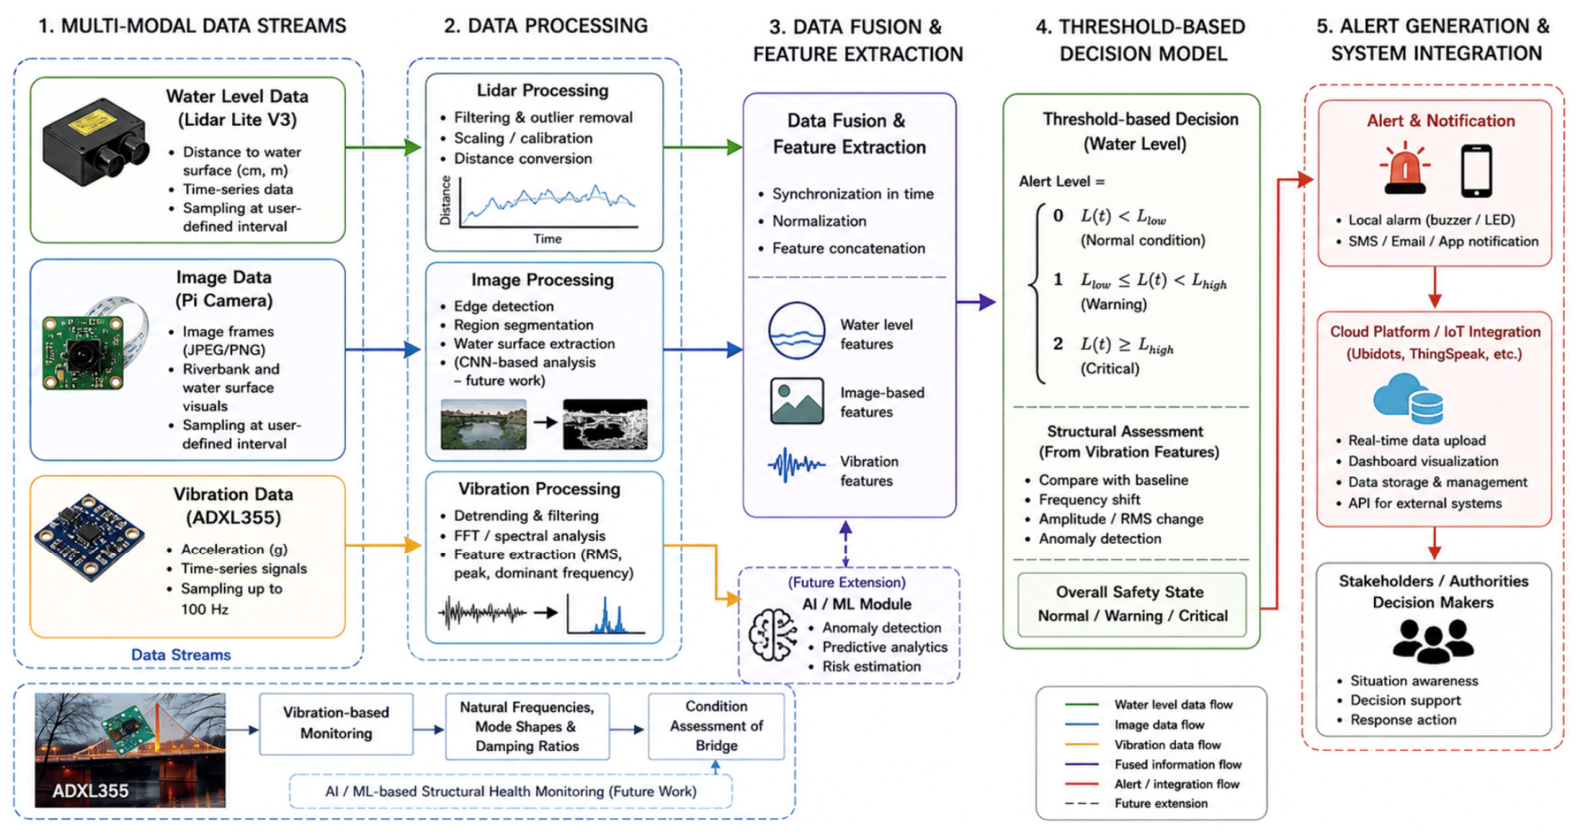
The proposed IoT-based monitoring system generates multiple heterogeneous data streams that enable real-time flood detection and structural health assessment. These data streams originate from different sensing modalities integrated within the system. The Lidar Lite V3 produces numerical time-series data representing the distance between the sensor and the water surface, recorded at user-defined intervals for continuous monitoring of water-level variations. The Raspberry Pi Camera generates periodic image data capturing riverbank and water surface conditions, providing visual confirmation of flood severity and enabling further analysis through image processing or deep learning techniques. In addition, the ADXL355 accelerometer produces high-resolution vibration data in the form of acceleration time histories sampled at frequencies up to 100 Hz, which are used to extract structural response characteristics such as peak acceleration, dominant frequency, and damping behavior.
All collected data streams are initially stored locally on the Raspberry Pi microSD card to ensure data integrity in the event of network interruptions or power fluctuations. When internet connectivity is available, the data are transmitted via Wi-Fi to cloud-based storage platforms such as Google Drive, (cloud-hosted web browser version) allowing remote access, visualization, and long-term data archiving. This dual storage approach enhances system reliability and ensures continuous data availability under field conditions.
The generated data streams are designed to be compatible with existing and emerging early warning systems. Real-time water-level and vibration data can be evaluated against predefined threshold values to trigger warning states, forming the basis of automated alert systems. Furthermore, the use of cloud platforms enables integration with remote monitoring dashboards and facilitates data sharing with external systems through standard web-based interfaces. The modular architecture of the system supports interoperability with broader smart infrastructure and disaster management frameworks. In addition, the collected datasets provide a foundation for future data-driven approaches, including machine learning-based prediction and anomaly detection, thereby enabling scalable and intelligent early warning applications.
2.7. Installation of IoT Devices
The feasibility of the proposed IoT-based monitoring system was first examined within the Structural and Dynamics Laboratory at Saitama University. The system was assembled and tested under controlled conditions to ensure that each component—namely the Raspberry Pi, Pi Camera, Lidar Lite V3, and ADXL355 accelerometer—operates reliably and can collect, store, and transfer data as intended.
To ensure uninterrupted operation in real-world conditions, a sustainable power supply strategy was designed. A 100 W solar panel charges a 12 V battery through a charge controller, which regulates energy flow and prevents overcharging. A DC-to-DC converter steps down the 12 V output to the stable 5 V supply required for the Raspberry Pi and peripheral sensors, ensuring energy efficiency and long-term autonomy in the field (
Figure 12).
The IoT devices are housed in an IP65-rated waterproof enclosure (plastic, dustproof, with hinged shell and mounting plates), which protects the electronics from humidity, rain, river spray, and temperature fluctuations. To prevent overheating of the Raspberry Pi 4, a 5 V fan is installed inside the enclosure, providing active thermal management while maintaining a sealed, weatherproof environment.
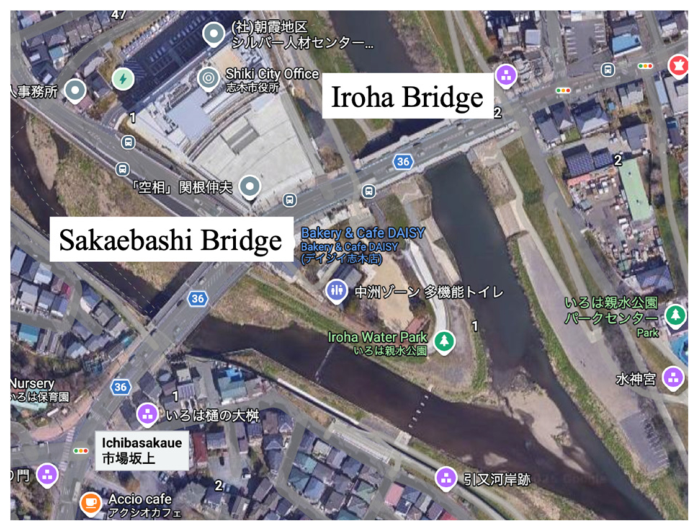
Building upon the laboratory validation, the first set of IoT devices is planned for installation on two bridges in Shiki, Saitama, Japan: the Iroha Bridge and the Sakaebashi Bridge (
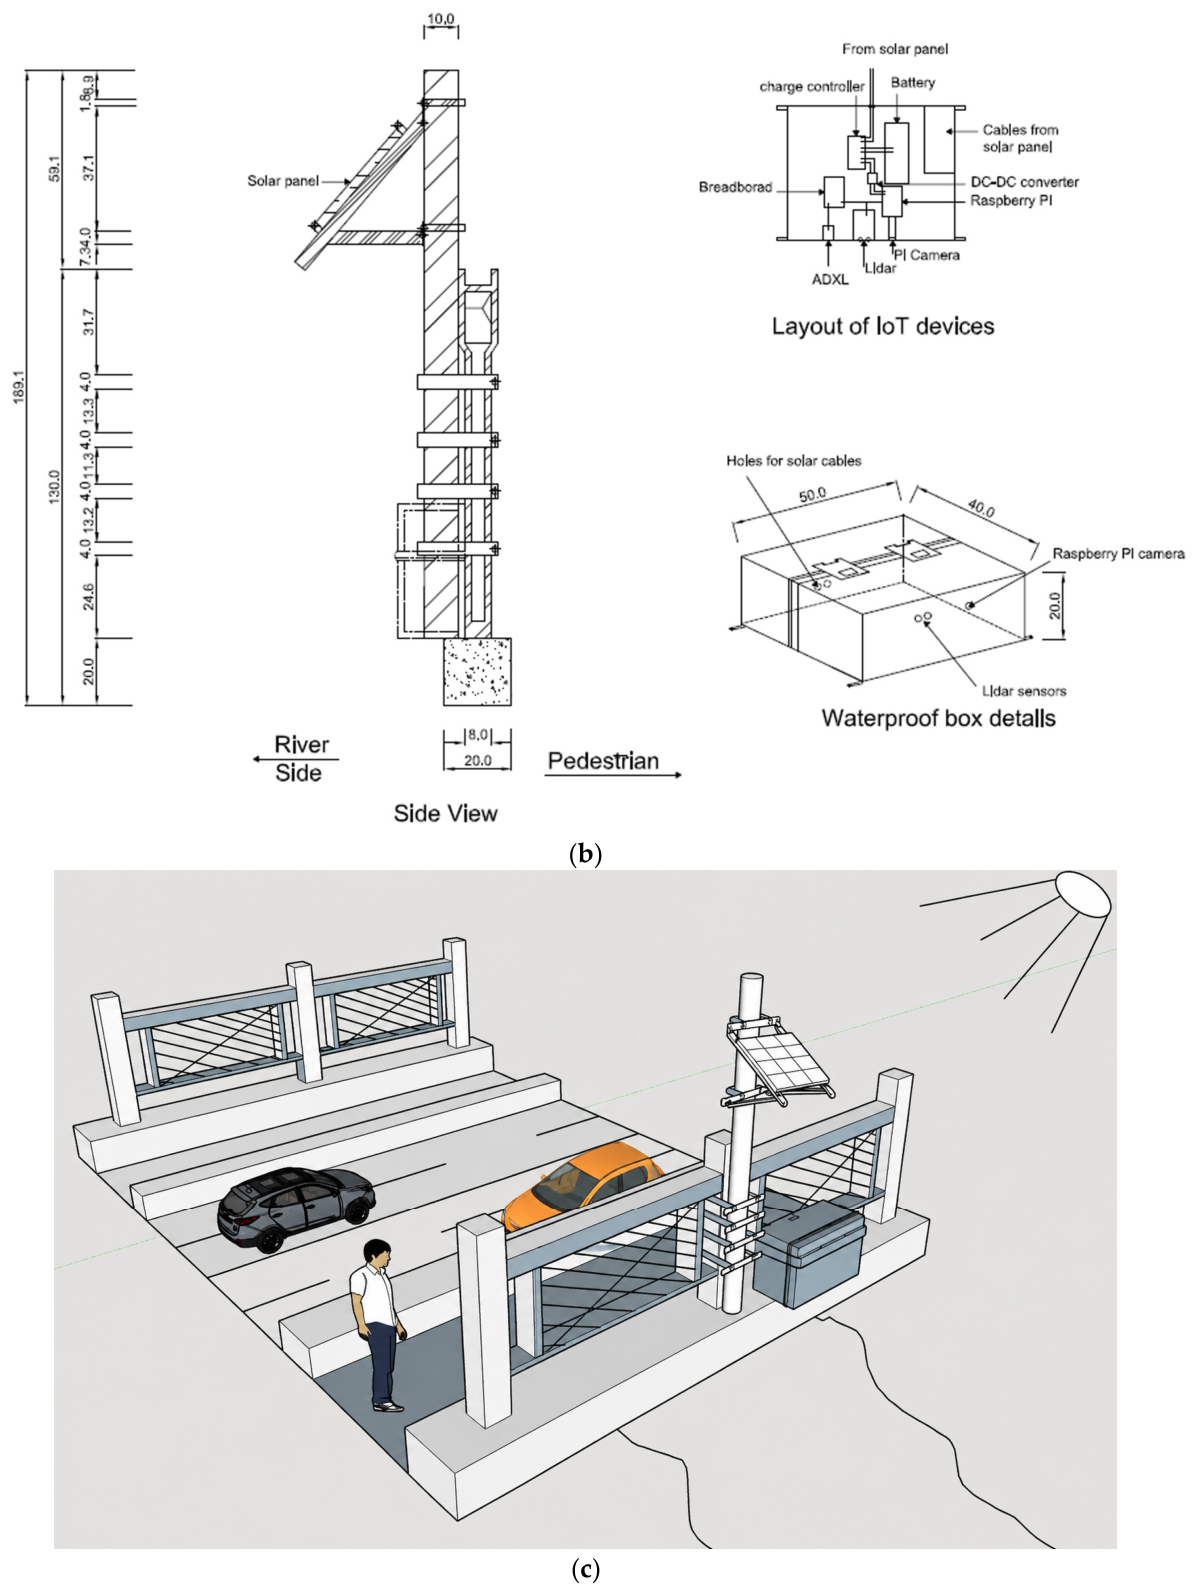
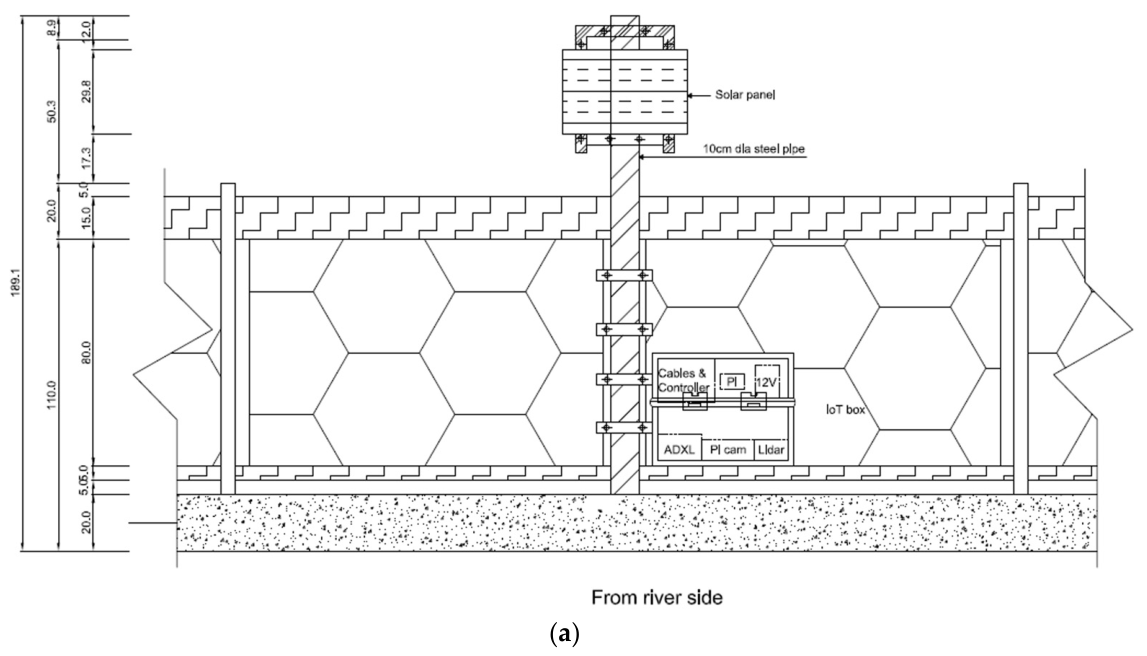
Figure 13). These sites were selected due to their susceptibility to flooding and the need to monitor both water levels and structural vibrations. Multiple installation techniques are under consideration to adapt the system to site-specific conditions, including unobstructed mounting of the Lidar sensor and secure placement of the accelerometer on structural elements for accurate vibration measurement. A representative installation configuration is illustrated in
Figure 14, with adjustments to be made during field deployment to optimize performance, durability, and protection against environmental hazards. This installation will enable long-term monitoring under natural environmental and loading conditions and provide a foundation for scaling the system to other vulnerable infrastructures in the future.
2.8. Early Warning
The data collected from the IoT devices, as described in
Section 2.6, are transmitted to a remote server for automated processing and decision-making. The system integrates multiple data streams, including water-level measurements, vibration data, and image data, to enable robust early warning of flood and structural conditions.
Water-level measurements obtained from the Lidar Lite V3 are continuously compared with predefined threshold levels derived from sensor calibration and bridge design criteria to identify potential flooding conditions, as illustrated in
Figure 15. A threshold-based decision model is used to classify the warning state as
where
L(
t) is the measured water-level at time
t, and
and
represent predefined warning thresholds. The threshold values
and
are determined based on sensor calibration, site-specific conditions such as bridge clearance and expected water level variations, and predefined safety margins to ensure reliable early warning performance. This formulation enables the real-time classification of flood severity into normal, caution, and high-alert states, forming the basis for automated warning generation.
Simultaneously, vibration data recorded by the ADXL355 accelerometer are analyzed to monitor the structural response characteristics of the bridge. Time-domain acceleration signals are processed to extract key features such as peak amplitude, root mean square (RMS) acceleration, and dominant frequency content obtained through spectral analysis. These parameters are evaluated relative to baseline conditions established during normal operational states, where vibration data are collected under typical environmental and loading conditions without significant disturbances such as flooding or seismic events. These baseline measurements serve as reference data for identifying deviations in structural response. By evaluating vibration features relative to baseline conditions, the system reduces the influence of normal environmental variations such as wind and traffic, allowing for the identification of significant deviations associated with potential structural anomalies. Significant deviations in frequency or amplitude from these baseline conditions may indicate abnormal structural behavior caused by extreme loading conditions, such as flooding or seismic excitation.
In addition, acceleration time histories obtained from the ADXL355 can be used as inputs to artificial intelligence (AI) or machine learning (ML) models for automated structural condition assessment. In such a framework, extracted vibration features (e.g., dominant frequency shifts, spectral energy distribution, and statistical descriptors) serve as model inputs, while structural condition states (e.g., normal, warning, or critical) are treated as outputs. This enables data-driven classification or anomaly detection of structural performance, as demonstrated in prior vibration-based bridge monitoring studies [
17]. In the present study, the focus is placed on sensor performance validation and feature-level monitoring using threshold-based logic. The system architecture is designed to support future integration of machine learning (ML)-based decision models, enabling advanced classification and anomaly detection in subsequent work.
Furthermore, images captured by the Raspberry Pi Camera provide visual confirmation of flood severity through qualitative assessment of water surface elevation and threshold exceedance. These images can be further processed using image processing techniques such as edge detection, region segmentation, or intensity thresholding to estimate water level relative to reference markers. The integration of image data with sensor-based measurements enhances the reliability of the early warning system by enabling cross-validation of detected events. The proposed framework can be extended to incorporate deep learning-based image analysis pipelines, where convolutional neural networks (CNNs) are trained to automatically detect water surfaces and quantify flood levels from image sequences. This extension would allow fully automated, multi-modal early warning by combining distance measurements, vibration features, and image-based flood indicators within a unified ML-enabled decision framework.
3. Second Set of IoT Devices
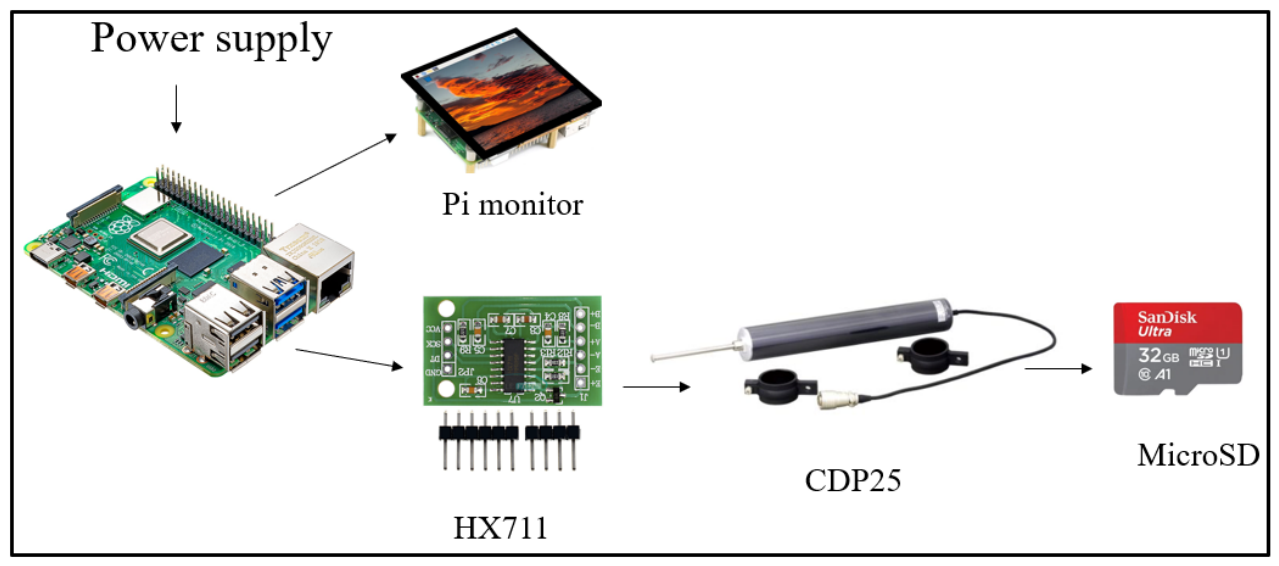
The second configuration of IoT devices developed in this study comprises a Raspberry Pi microcontroller, an HX711 load cell amplifier, and a CDP25 displacement transducer. This system is specifically designed to monitor the displacement of bridge bearings, which can provide valuable insights into the structural performance and long-term durability of bridges under varying loads and environmental conditions. The Raspberry Pi serves as the central processing unit, performing data acquisition, storage, and transfer functions similar to those described in
Section 2.1. The HX711 module acts as an interface between the displacement transducer and the Raspberry Pi, amplifying and digitizing the analog signals for further processing. The CDP25 transducer is responsible for capturing displacement data with high precision, making it suitable for both static and dynamic measurements.
Together, these components form a low-cost yet effective monitoring system capable of recording bearing movements, storing data locally, and transmitting it to the cloud when internet access is available. This setup provides an opportunity to continuously monitor structural responses in real-time, enabling early detection of anomalies or excessive displacements that may compromise structural safety. A detailed description of the CDP25 and HX711 devices, along with their specifications and roles within the system, is presented in the following subsections.
3.1. CDP25
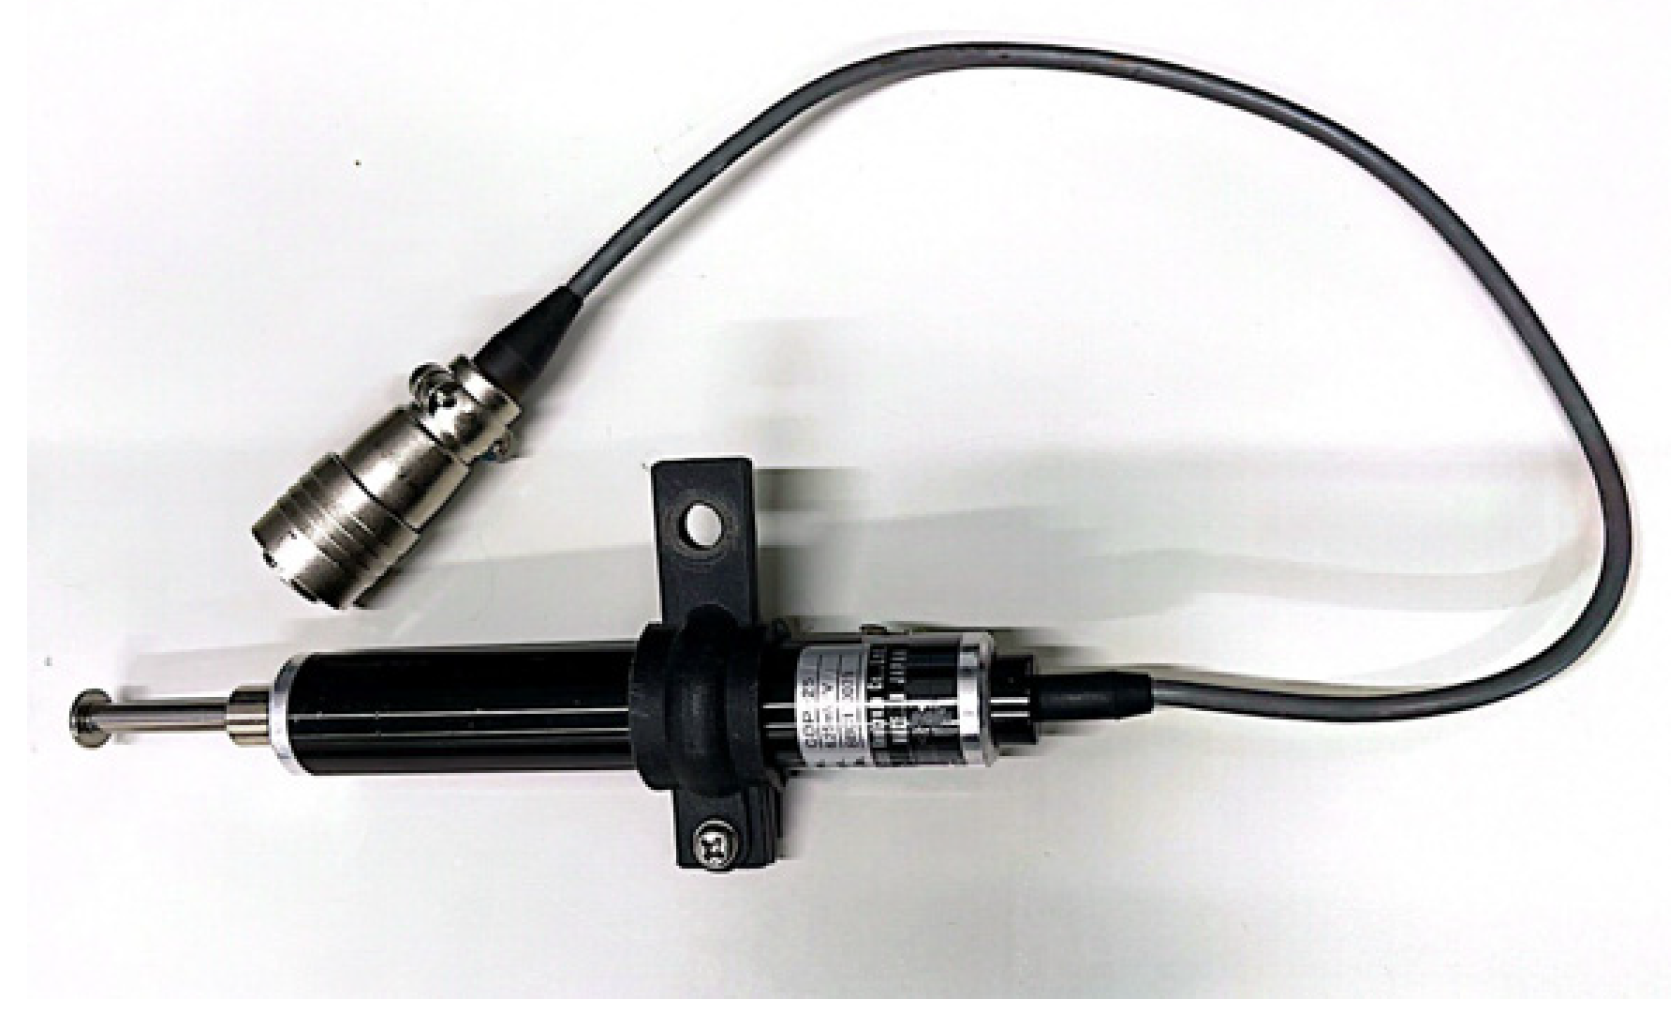
The CDP25 is a displacement transducer developed by Tokyo Sokki Kenkyujo Co., Ltd., Tokyo, Japan, designed for precise measurement of linear displacements in structural components (
Figure 16). Compact, lightweight, and easy to install, the device is suitable for both laboratory and field applications. Its versatility allows it to be employed for both static measurements, such as long-term monitoring of gradual bearing movements, and dynamic measurements, such as vibration-induced displacements under traffic loading or seismic activity. The sensor provides stable and reliable output, making it particularly useful in structural health monitoring systems where continuous and accurate displacement data are required.
The key specifications of the CDP25, including its measurement capacity, rated output, sensitivity, nonlinearity, and allowable temperature range, are summarized in
Table 4. These properties highlight its potential for integration into low-cost IoT-based monitoring systems for bridge bearings and other displacement-sensitive components.
3.2. HX711
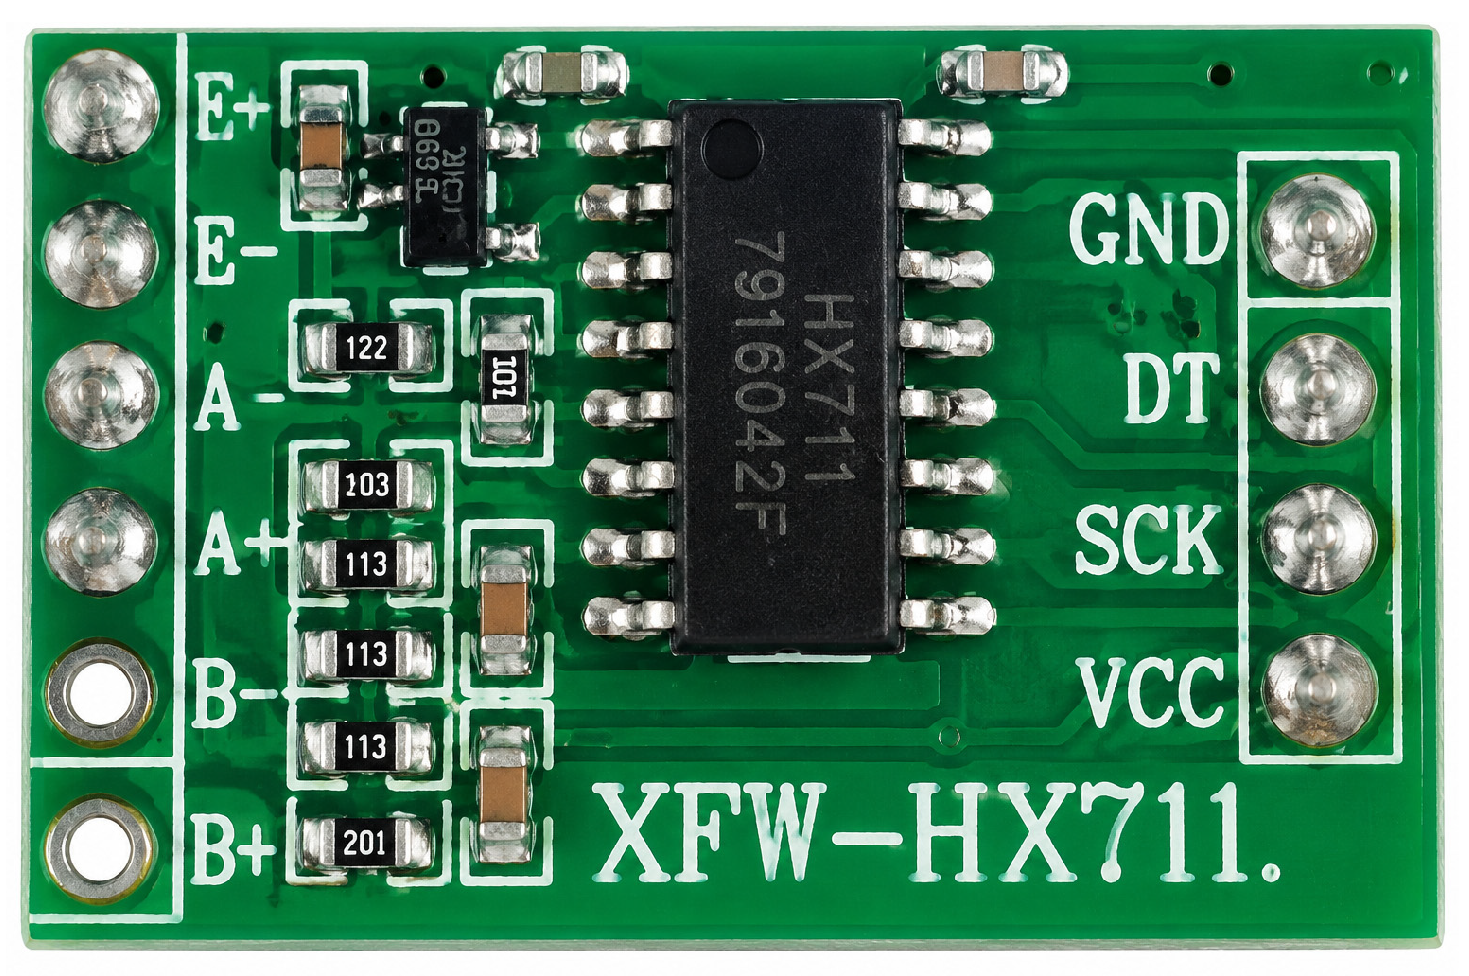
The HX711 is a compact breakout board designed as a load cell amplifier, capable of precisely reading weight or force measurements from connected load cells (
Figure 17). When interfaced with a microcontroller, the HX711 converts the small changes in resistance from the load cell into digital signals that can be processed, recorded, and analyzed. With minimal calibration, the module provides accurate and reliable measurements, making it suitable for a variety of applications, including structural monitoring, process control, and experimental setups that require force or displacement quantification.
In the context of this study, the HX711 serves as the interface between the CDP25 displacement transducer and the Raspberry Pi, enabling digital acquisition of displacement data from the transducer. Its ease of integration, low cost, and high resolution make it particularly advantageous for developing IoT-based structural health monitoring systems for bridges.
3.3. Connection and System Integration
The overall wiring and integration of the second set of IoT devices are illustrated in
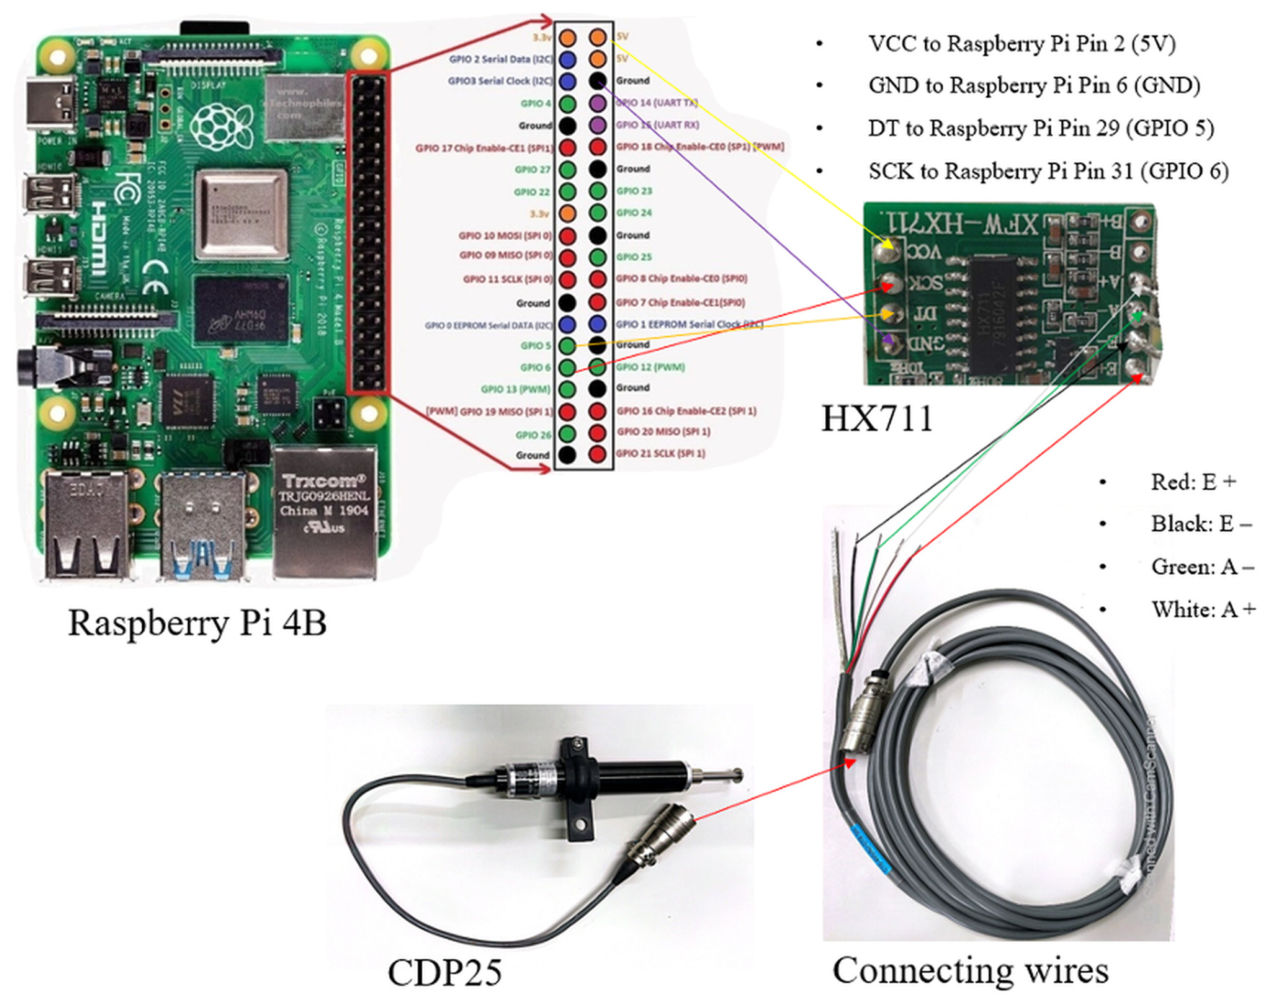
Figure 18. On the right side, the HX711 load cell amplifier is interfaced with a Raspberry Pi 4B using four signal and power cables: VCC is connected to a 5-volt pin, SCK to GPIO 6, DT to GPIO 29, and GND to the ground pin. The left side of the HX711 connects to the CDP25 displacement transducer via four color-coded wires: red to E+, black to E−, green to A−, and white to A+.
In operation, the HX711 digitizes the analog displacement signals from the CDP25 and transmits the data to the Raspberry Pi, where it is initially recorded on the local memory card. Once an internet connection is available, the stored data can be uploaded to a cloud server for remote access and analysis. Real-time visualization of the displacement measurements is facilitated through a portable Raspberry Pi monitor, enabling on-site monitoring and verification. The overall data flow and system operation are summarized in
Figure 19, demonstrating the integration of sensing, processing, storage, and visualization components within a compact, low-cost IoT monitoring system.
3.4. Application
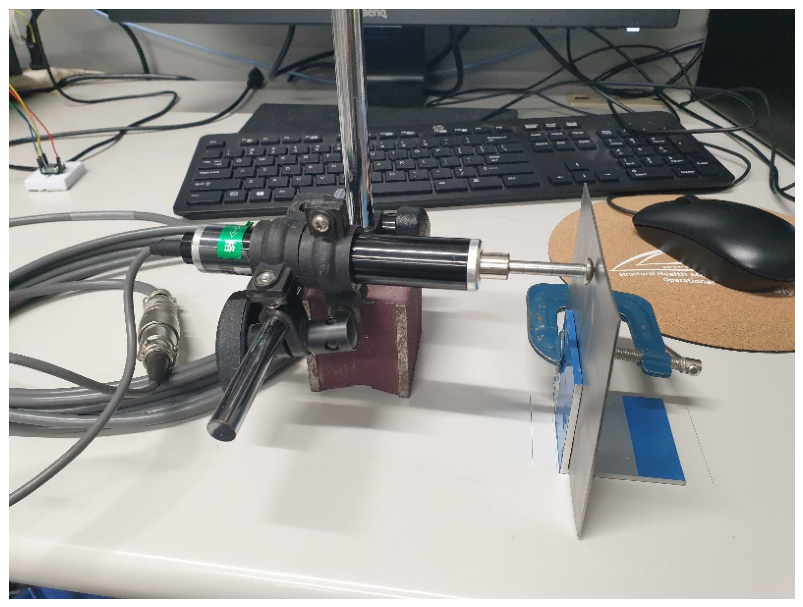
The feasibility of the second IoT device configuration was evaluated in the laboratory. After establishing all electrical and data connections, the CDP25 displacement transducer was mounted on a test plate (
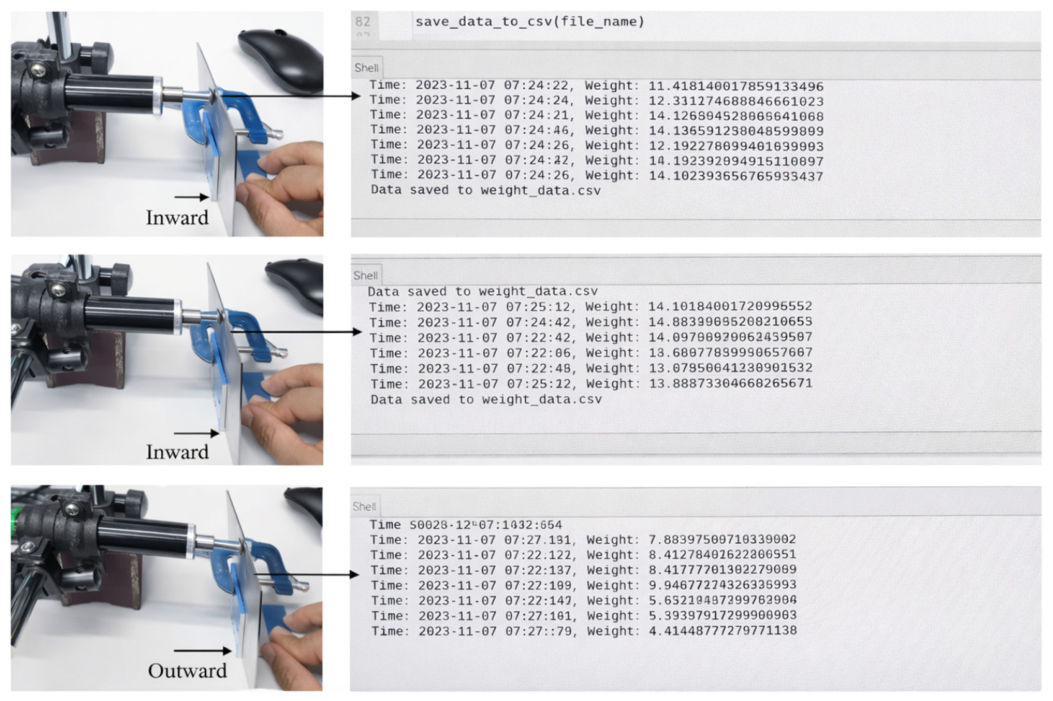
Figure 20), which was then moved in both inward and outward directions to assess the sensor’s response and verify measurement accuracy (
Figure 21). The system allows adjustment of the sampling frequency, supporting automated recording and storage of data at user-defined intervals, enabling both short-term and long-term monitoring applications. The Raspberry Pi, interfaced with the HX711 amplifier, reliably captures displacement changes at up to 80 Hz, sufficient for typical bridge-bearing dynamics. Based on the Nyquist sampling criterion, this allows accurate representation of signals up to 40 Hz, exceeding the dominant frequency range associated with traffic-induced and thermal loading effects.
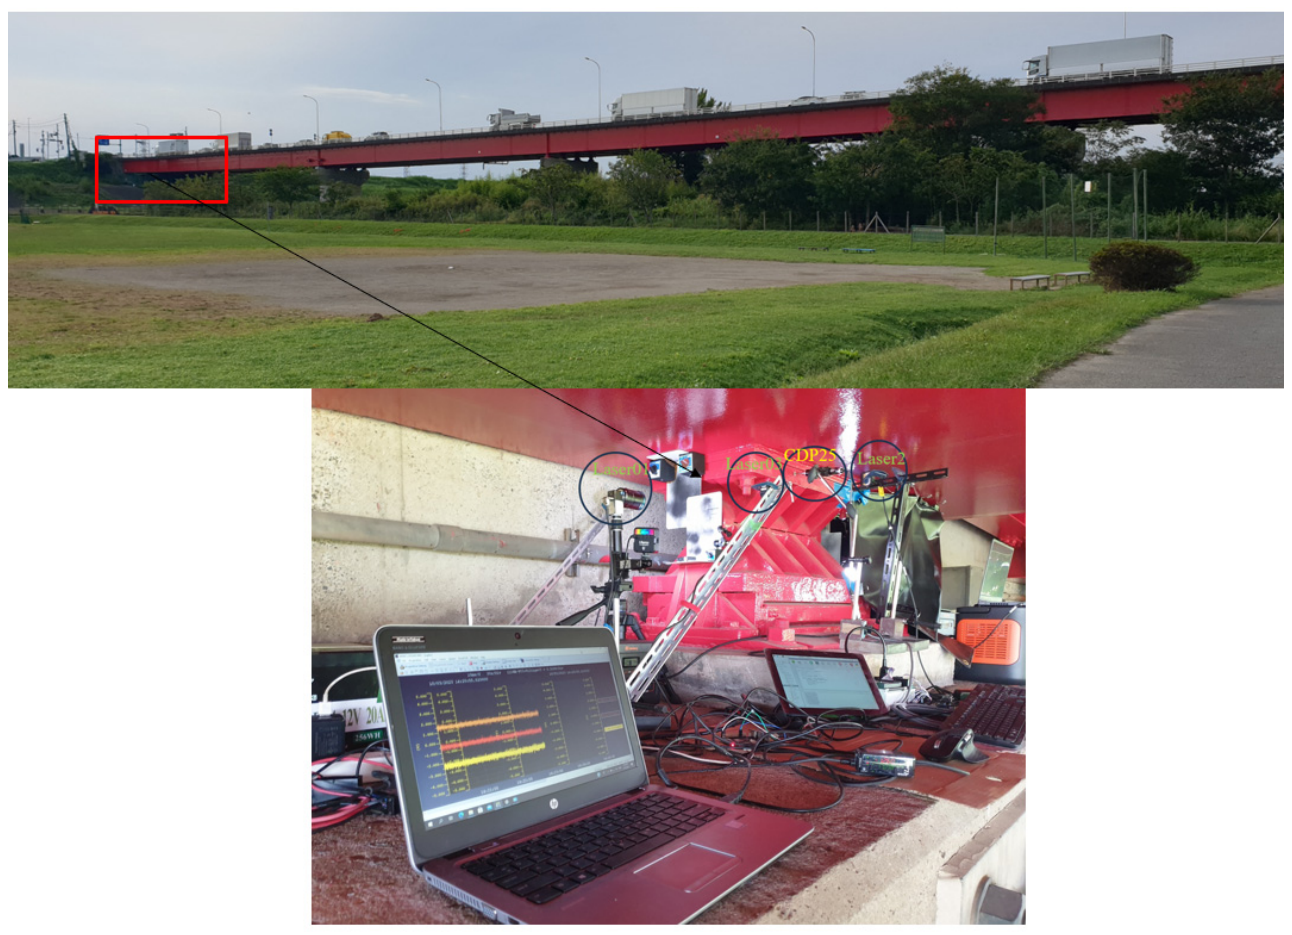
This setup demonstrates the potential utility of the system for monitoring bridge-bearings, as schematically represented in
Figure 22. A preliminary field measurement was conducted on a bearing at one side of the Akigase Bridge in Saitama, Japan. The CDP25 successfully recorded displacement data; however, comparison with the reference laser device was not possible due to calibration issues encountered during the trial, primarily related to the lack of consistent in situ reference alignment between the CDP25 sensor and the laser device. To address this limitation, an automated in situ calibration procedure using fixed reference markers on the bridge deck is planned for the next phase, enabling the system to correct measurement offsets and maintain accuracy under varying environmental conditions. This next phase will provide comprehensive validation of the IoT-based system, ensuring reliable and scalable bridge-bearing performance monitoring under real-world conditions.
Although the calibration issue limited direct quantitative comparison with the reference device during field testing, it does not affect the main conclusions of this study, which are based on laboratory validation and system feasibility. The field measurements are therefore considered preliminary, and comprehensive calibrated validation will be conducted in future work.
4. Summary and Future Work
This paper presents the development of two sets of low-cost IoT devices designed for early warning and structural monitoring of bridges. The first set, comprising a Raspberry Pi, a Pi Camera, a Lidar Lite V3, and an ADXL355 accelerometer, is intended to capture images of water levels, measure floodwater distance, and monitor bridge vibrations. The system integrates data acquisition, local storage, cloud transfer, and remote analysis, providing a foundation for automated early warning. The proposed installation on the Iroha and Sakaebashi bridges in Shiki, Saitama, Japan, is planned following approval of the installation methods by the concerned authorities. The effectiveness of this monitoring system will be evaluated after field deployment to confirm its feasibility and reliability under real environmental conditions.
The second set of devices, consisting of a Raspberry Pi, HX711 amplifier, and CDP25 displacement transducer, is designed to measure bridge-bearing displacements. Laboratory testing demonstrated the system’s ability to record displacement data; however, comparison with laser device measurements was not successful due to calibration issues. To address these challenges, the system is planned for reinstallation at the bridge site with proper calibration and setup adjustments, allowing for comprehensive field validation. Future work will focus on developing an in situ auto-calibration protocol using fixed reference markers and known geometric characteristics of the bridge structure, enabling the system to automatically correct measurement offsets and ensure reliable long-term performance under field conditions.
This study demonstrates the feasibility of low-cost, multi-sensor IoT systems for real-time monitoring of flood levels and bridge structural responses based on laboratory validation and initial system testing. While the current results confirm the performance and reliability of the proposed system under controlled conditions, field deployment and long-term monitoring under real environmental conditions remain part of ongoing and future work. The current work focuses on prototype development and laboratory validation, providing a foundation for scalable, sustainable, and practical early warning applications.
The proposed system also incorporates several fault-tolerant features that enhance its reliability under field conditions. These include local data storage to prevent data loss during network interruptions, solar-powered operation with battery backup for continuous functionality, and modular sensor integration that allows independent operation of sensing components.
Future work will explore edge computing, enabling on-device data processing on the Raspberry Pi to reduce cloud bandwidth and improve response times. Additionally, the system’s energy sustainability will be further evaluated, including analysis of how the 100 W solar panel performs during extended cloudy periods, particularly in Japanese winters, to ensure uninterrupted operation. Finally, the integration of these low-cost IoT devices supports a sustainable maintenance paradigm, shifting infrastructure management from reactive repairs toward proactive, data-driven decision-making applicable to all infrastructure tiers, regardless of geographic or economic constraints. Furthermore, the proposed IoT framework can be extended toward a Digital Twin approach, where real-time sensor data are integrated with structural models to enable predictive maintenance and the estimation of remaining service life. These developments will enhance system resilience, long-term usability, and support broader adoption of affordable early warning technologies for multi-hazard monitoring.