Article

Hydrochemical Characteristics, Controlling Factors and Water Quality Assessment of Shallow Groundwater in Typical Small Watersheds of the Northern Hebei Hilly Area, China


1
Langfang Natural Resources Comprehensive Survey Center, China Geological Survey, Langfang 065000, China
2
College of Earth and Planetary Sciences, Chinese Academy of Geological Sciences, Beijing 100037, China
*
Authors to whom correspondence should be addressed.
Sustainability 2026, 18(10), 5048; https://doi.org/10.3390/su18105048
Submission received: 4 March 2026 / Revised: 29 April 2026 / Accepted: 14 May 2026 / Published: 17 May 2026

Abstract

The evolution of groundwater in the Puhe River Basin is closely related to the ecological security of the Beijing–Tianjin–Hebei water source conservation zone. Based on 122 groundwater samples, this study systematically investigated the hydrochemical characteristics, evolution mechanisms, and water quality of shallow groundwater using mathematical statistics, Piper diagrams, ionic ratio analysis, and a variable fuzzy pattern recognition model. The results showed that shallow groundwater in the middle and upper reaches is generally weakly alkaline, fresh to hard water, with HCO3–Ca and HCO3·SO4–Ca as the dominant hydrochemical facies. Groundwater hydrochemistry is primarily controlled by rock weathering, and the dissolution of silicate and carbonate rocks is the main source of major ions. Calcite and dolomite are in dynamic equilibrium between dissolution and precipitation, whereas gypsum and halite remain undersaturated. Overall, groundwater quality is generally good; however, anthropogenic activities in cultivated and construction lands have altered local hydrochemical composition and caused water quality deterioration in some areas. These findings improved the understanding of groundwater hydrochemical evolution in typical small watersheds of the northern Hebei hilly region and provided a scientific basis for the sustainable management and protection of groundwater resources in the Beijing–Tianjin–Hebei water source conservation area.

1. Introduction

Groundwater represents an indispensable constituent of global water resources and plays a critical role in socio-economic development and ecological sustainability [1,2]. It is widely distributed beneath the Earth’s surface and is characterized by abundant reserves, relatively stable availability, and generally good quality, thus serving as a key water supply for drinking, industrial production and agricultural irrigation [3,4]. In recent years, however, accelerated urbanization and industrialization, together with irrational exploitation and utilization by human activities, have triggered a range of ecological and environmental issues, including declining groundwater quantity and deteriorating water quality [5]. As a complex environmental system, groundwater is strongly defined by its chemical characteristics, which constitute a key aspect of its formation and evolution. Therefore, in-depth investigation of groundwater chemistry and the mechanisms controlling its formation and evolution is of great importance for understanding groundwater environmental processes [6,7]. The chemical characteristics of groundwater are mainly influenced by geological background, structural setting, hydrogeological conditions, and human activities, including land use, industrial production, and agricultural practices [8]. Accordingly, identifying the key factors controlling groundwater formation and conducting comprehensive groundwater quality assessments are essential for the rational development and utilization of water resources, as well as for ecological and environmental protection [9].
Water quality is fundamentally determined by its chemical composition, which is jointly controlled by natural geological settings and anthropogenic activities. In particular, the composition of major ions provides valuable information for identifying the controlling factors of groundwater chemistry and tracing the sources of dissolved substances. Previous studies have employed multivariate statistical analysis, hydrochemical diagrams, and isotope tracers to investigate the hydrogeochemical characteristics of groundwater in different geological settings [10,11,12,13,14]. For instance, Yu et al. reconstructed regional hydrogeochemical evolution trajectories and quantified shallow groundwater quality drivers by combining ionic ratio calculations, correlation statistics, Gibbs and Gaillardet end-member diagrams with the APCS–MLR modeling strategy [15]. In the Huixi karst wetland, Ba et al. integrated mathematical statistical analysis with classic hydrochemical techniques—including Durov diagrams, ion ratios, Gibbs plots, and stable hydrogen and oxygen isotopes—to identify the hydrochemical characteristics of groundwater systems [16]. Furthermore, Gao et al. combined conventional hydrochemical graphical methods, stable isotope tracing, and multivariate statistical approaches to investigate the hydrochemical properties and dominant controlling factors for both shallow and deep groundwater in the Heilongdong Spring Basin [17]. However, the small watersheds in the northern Hebei hilly region are characterized by complex hydrogeological conditions and high ecological sensitivity. Groundwater evolution in these areas is more strongly affected by the coupling of natural background conditions and human activities, such as land-use change, while the underlying mechanisms remain insufficiently understood. Therefore, a systematic analysis of groundwater hydrochemical characteristics in typical small watersheds within the core water conservation area is necessary to better reveal their evolution patterns and driving factors to further clarify their evolutionary patterns and dominant driving forces. Such work will provide important theoretical support for groundwater development, utilization, and management in the water conservation zones of the Beijing–Tianjin–Hebei region.
The Puhe River Basin, located within the Beijing–Tianjin–Hebei (BTH) water conservation zone, is a typical small watershed in the northern hilly area and is well known for its ecological barrier function and water supply capacity. As a critical component of the ecological security framework of the BTH region, the groundwater status in this basin is directly related to regional ecological security [18]. This study focuses on the middle and upper reaches of the Puhe River Basin. First, the hydrochemical composition and hydrochemical types of shallow groundwater were systematically interpreted to reveal the evolutionary patterns of groundwater chemical composition. Subsequently, a combined framework of statistical analysis, ion ratio calculations, hydrogeochemical plots, and the variable fuzzy pattern recognition (VFPR) model was utilized [19]. The respective contributions of natural processes and human activities to groundwater solutes were quantitatively assessed, and groundwater quality was comprehensively evaluated. This approach helps clarify the driving mechanisms of groundwater hydrochemical evolution and provides a scientific basis for groundwater management and ecological restoration in the region. The specific objectives of this study were as follows: (1) to characterize the hydrochemical features and spatial distribution patterns of shallow groundwater in the study area; (2) to qualitatively identify the effects of natural processes, such as rock weathering, and human activities on groundwater chemical composition using hydrogeochemical diagrams; and (3) to comprehensively assess groundwater quality using the variable fuzzy pattern recognition model.

2. Materials and Methods

2.1. Study Area Overview

The study area lies within the Yanshan mountainous area of northern Hebei Province and functions as an important water source conservation area for the Beijing–Tianjin–Hebei region. It underpins the preservation and improvement of regional water conservation capacity [18]. The terrain is highly complex, characterized by an alternating network of mountains and rivers, and is mainly characterized by low-to-medium mountains and rolling hills. The topography generally slopes from the northwest to the southeast, with major mountain ranges extending in an east–west direction. Elevations range from 459 to 1554 m above sea level, presenting significant relative relief.
The dominant land-use types in the study area include agricultural land (dryland farming), forest land (woodland and shrubland), and construction land (residential areas and public facilities). The study area is dominated by a temperate continental monsoon climate with pronounced seasonal variability. The average annual temperature is 6–9 °C, and the mean annual precipitation varies from 300 to 800 mm. The Puhe River, a primary tributary of the Luan River, has a total basin area of 1990 km2 and a main stream length of 170 km, with an average channel gradient of 7.87‰. The elevation of the basin ranges from 350 to 1800 m [20,21,22].
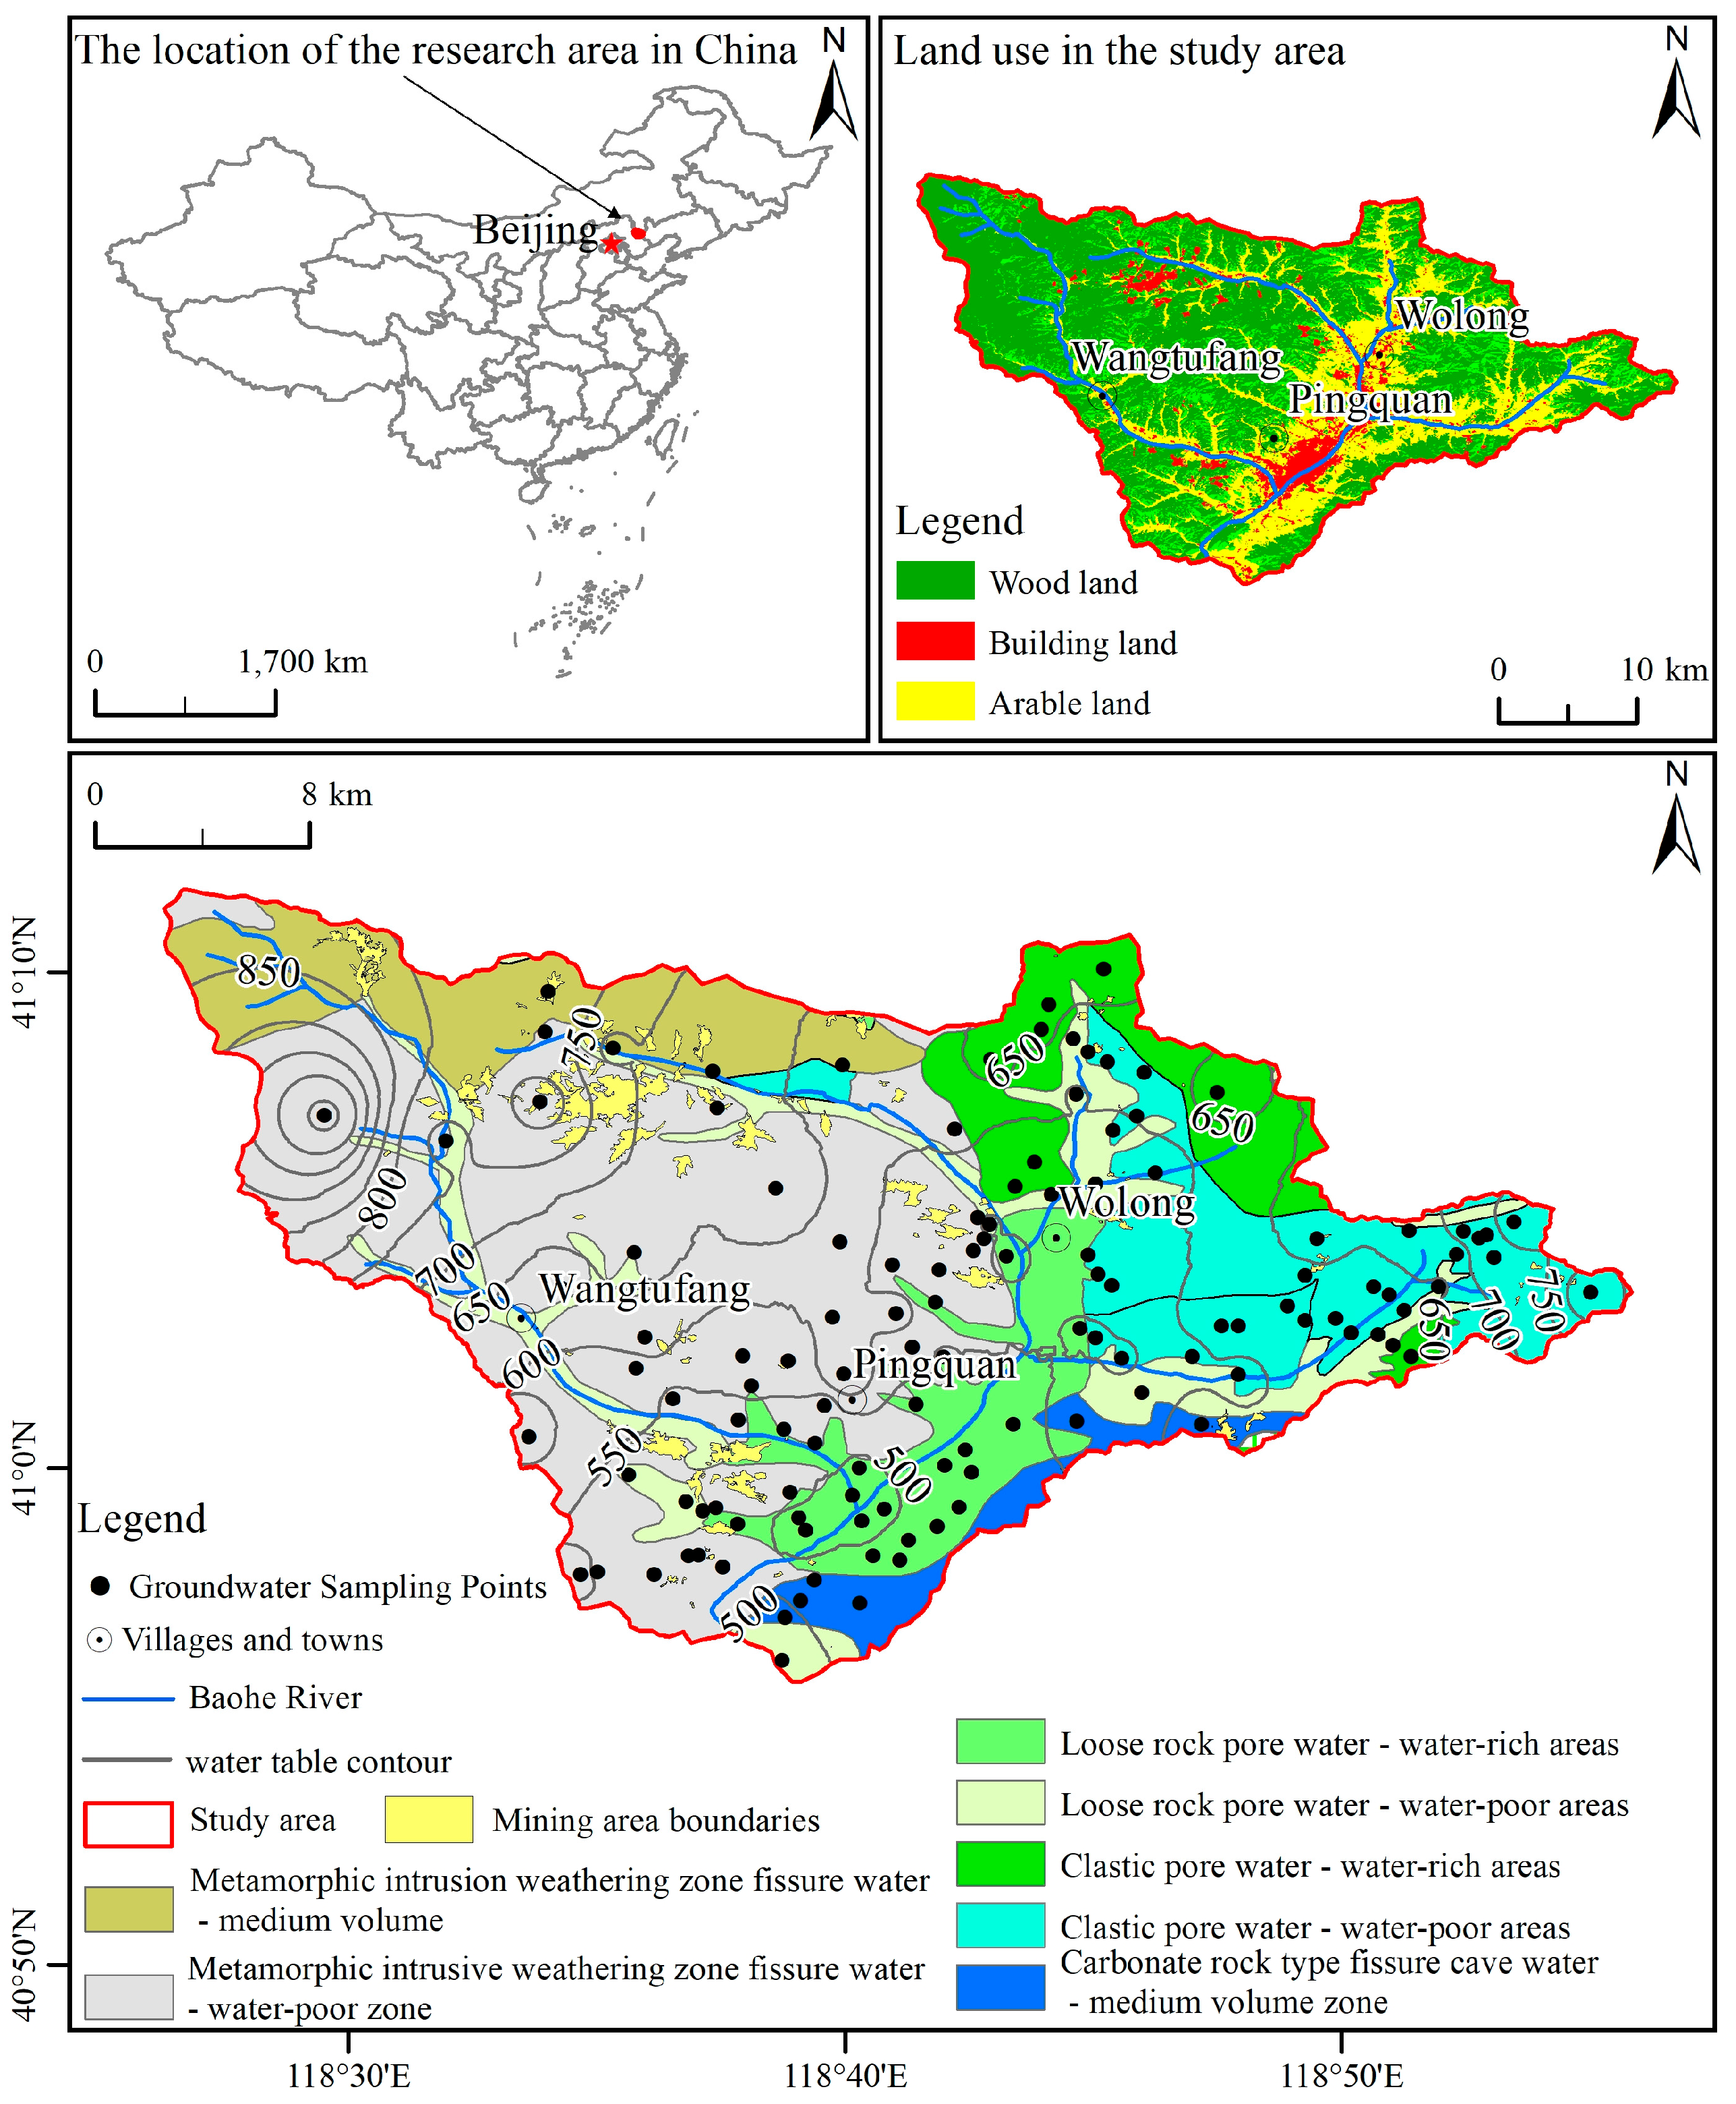
Tectonically, the study area is located at the intersection of the Yanshan Orogenic Belt and the Inner Mongolia Tectonic Zone on the northern margin of the North China Platform, having experienced multiple episodes of tectonic deformation and superimposition. The region exhibits diverse lithology and relatively continuous stratigraphic sequences, primarily comprising Paleoproterozoic metamorphic rocks, Paleozoic carbonates, Mesozoic intrusive and clastic rocks, and Quaternary alluvial–proluvial sediments, along with minor evaporite deposits. Given its mountainous setting, the region is characterized by well-developed rock fractures and strong fluvial incision, providing favorable conditions for groundwater discharge. Groundwater mainly occurs in the bedrock fractures of metamorphic, intrusive, and clastic rocks, as well as in the pores of unconsolidated Quaternary sediments. However, aquifers within the fractured metamorphic and intrusive rocks generally exhibit low water yield (Figure 1). Groundwater is predominantly recharged by the infiltration of atmospheric precipitation. It subsequently flows downstream along the river valleys and eventually discharges into the Luan River system via the Puhe River. Additional pathways for groundwater discharge include evapotranspiration and artificial extraction.

2.2. Sampling and Testing

Groundwater samples were collected in July 2022, during the wet season. Sampling sites were primarily selected from rural shallow domestic wells. A total of 122 valid groundwater samples were obtained, comprising 58 from arable land, 50 from construction land, and 14 from forested land. Prior to sampling, each well was purged using a portable pump until the water temperature, pH, and electrical conductivity (EC) stabilized. In situ determinations of pH, electrical conductivity (EC), and total dissolved solids (TDS) were performed using a portable multi-parameter water quality analyzer (Hach HQd series, Hach Company, Loveland, CO, USA).
The collected water samples were passed through 0.45-μm filter membranes on-site and then divided into separate aliquots for cation and anion analyses. Samples intended for cation analysis were acidified with ultrapure nitric acid (HNO3) to a pH of <2, whereas those for anion analysis were left unacidified. All samples were preserved in darkness at 4 °C and delivered to the Laboratory of the Fourth Geological Brigade, Hebei Bureau of Geology and Mineral Exploration and Development. Major cations (K+, Na+, Ca2+, and Mg2+) were determined using an inductively coupled plasma optical emission spectrometer (ICP-OES, iCAP 6300, Thermo Fisher Scientific, Waltham, MA, USA), and major anions (SO42−, NO3, and Cl) were measured using an ion chromatograph (Inuvion, Thermo Fisher Scientific, Waltham, MA, USA). Bicarbonate (HCO3) and total hardness (TH) were analyzed via titration methods.
All analytical procedures strictly followed the Chinese Standard for Groundwater Quality (GB/T 14848-2017) [23]. The accuracy of the analytical data was verified using the charge balance error (CBE). All tested samples exhibited a CBE within the acceptable limit of ±5%, and the relative standard deviations (RSD) of parallel duplicate samples were less than 5%, ensuring high reliability of the experimental data.

2.3. Data Analysis Methods

2.3.1. Data Processing and Figure Preparation

IBM SPSS Statistics 26.0 was used for all basic statistical analyses, including descriptive statistics, coefficient of variation (CV) calculation (classification criteria: CV < 0.5 for weak variation, 0.5–1.0 for moderate variation, and ≥1.0 for strong variation), Correlation analysis (Pearson) and principal component analysis (PCA, performed with varimax rotation and retaining components with eigenvalues greater than 1). Origin 2021 was employed for plotting and data visualization, including generating ion correlation heatmaps based on the SPSS correlation matrix, constructing Piper trilinear diagrams to identify hydrochemical types, plotting ion scatter diagrams to interpret geochemical processes, and producing boxplots of water quality indicators for different land-use types to compare intergroup differences.
PHREEQC 3.6, a hydrogeochemical modeling software using the phreeqc.dat database, was utilized to calculate saturation indices (SI) of major minerals, with field and laboratory data as inputs to evaluate mineral dissolution and precipitation tendencies. ArcGIS 10.8 was used for spatial visualization analysis. Spatial interpolation was performed using the inverse distance weighting (IDW) method in the geostatistical module, with a power parameter of 2 and variable search radius. The resulting interpolated surfaces were overlaid with land-use vector data to generate spatial distribution maps of individual ion concentrations, revealing the spatial heterogeneity of groundwater chemical parameters.

2.3.2. Evaluation Method of Variable Fuzzy Pattern Recognition Model

The VFPR model derives evaluation results by calculating the membership function. Based on the established index system Xm×n and evaluation standard system Ym×c, the indices and evaluation system are firstly standardized using Equations (1) and (2) [18].
r i j = 0 , x i j y i c ( inverse index ) or x i j y i c ( positive index ) x i j y i c y i 1 y i c , y i 1 < x i j < y i c ( inverse index ) or y i 1 > x i j > y i c ( positive index ) 1 , x i j y i 1 ( inverse index ) or x i j y i 1 ( positive index )
s i h = 0 , y i h = y i c ( positive index or inverse index ) y i h y i c y i 1 y i c , y i 1 < y i h < y i c ( positive index ) or y i 1 > y i h > y i c ( inverse index ) 1 , y i h = y i 1 ( positive index or inverse index )
where rij is the relative affiliation of water quality sample j indicator i to the evaluation grade; sih is the specification result of the standardized eigenvalue of grade h for indicator i.
After obtaining the standardized index system and evaluation system, the generalized indicator weight distance dhj is adopted to characterize the difference and distance between water quality samples and the corresponding standards at each grade.
d h j = i = 1 m w i r i j s i h p 1 p
where wi is the weight of indicator i; p is a model parameter, which can be taken as 1 or 2, denoting the Hemming distance and the Euclidean distance, respectively; and the rest of the notation is the same as before.
Once the dhj is obtained, the combined relative affiliation uhj of the water quality sample j to the water quality standard grade h can be solved.
u h j = 0 h < a j or h > b j 1 k = a j b j i = 1 m w i j r i j s i h i = 1 m w i j r i j s i k p p a p a j h b j 1 h = a j = b j
where h is the water quality standard grade (h = 1, 2, …, c); aj and bj are the lower limit value and upper limit value of water quality sample grade j, respectively; wij is the weight of the water quality sample j indicator i; and a is the optimization criterion parameter, which can be taken as 1 or 2, and it represents the least square criterion and the least squares criterion, respectively. By transforming the model parameters a and p can simulate different relationships between indicators and standards.
After calculating the uhj, the integrated evaluation grade of water quality sample j can be solved by substituting into the grade eigenvalue Equation (5).
H = h = 1 c u h j h
where H is the water quality sample grade eigenvalue, i.e., integrated water quality status grade; the rest of the symbols are the same as before.

3. Results and Discussion

3.1. Characterization of Major Ionic Components

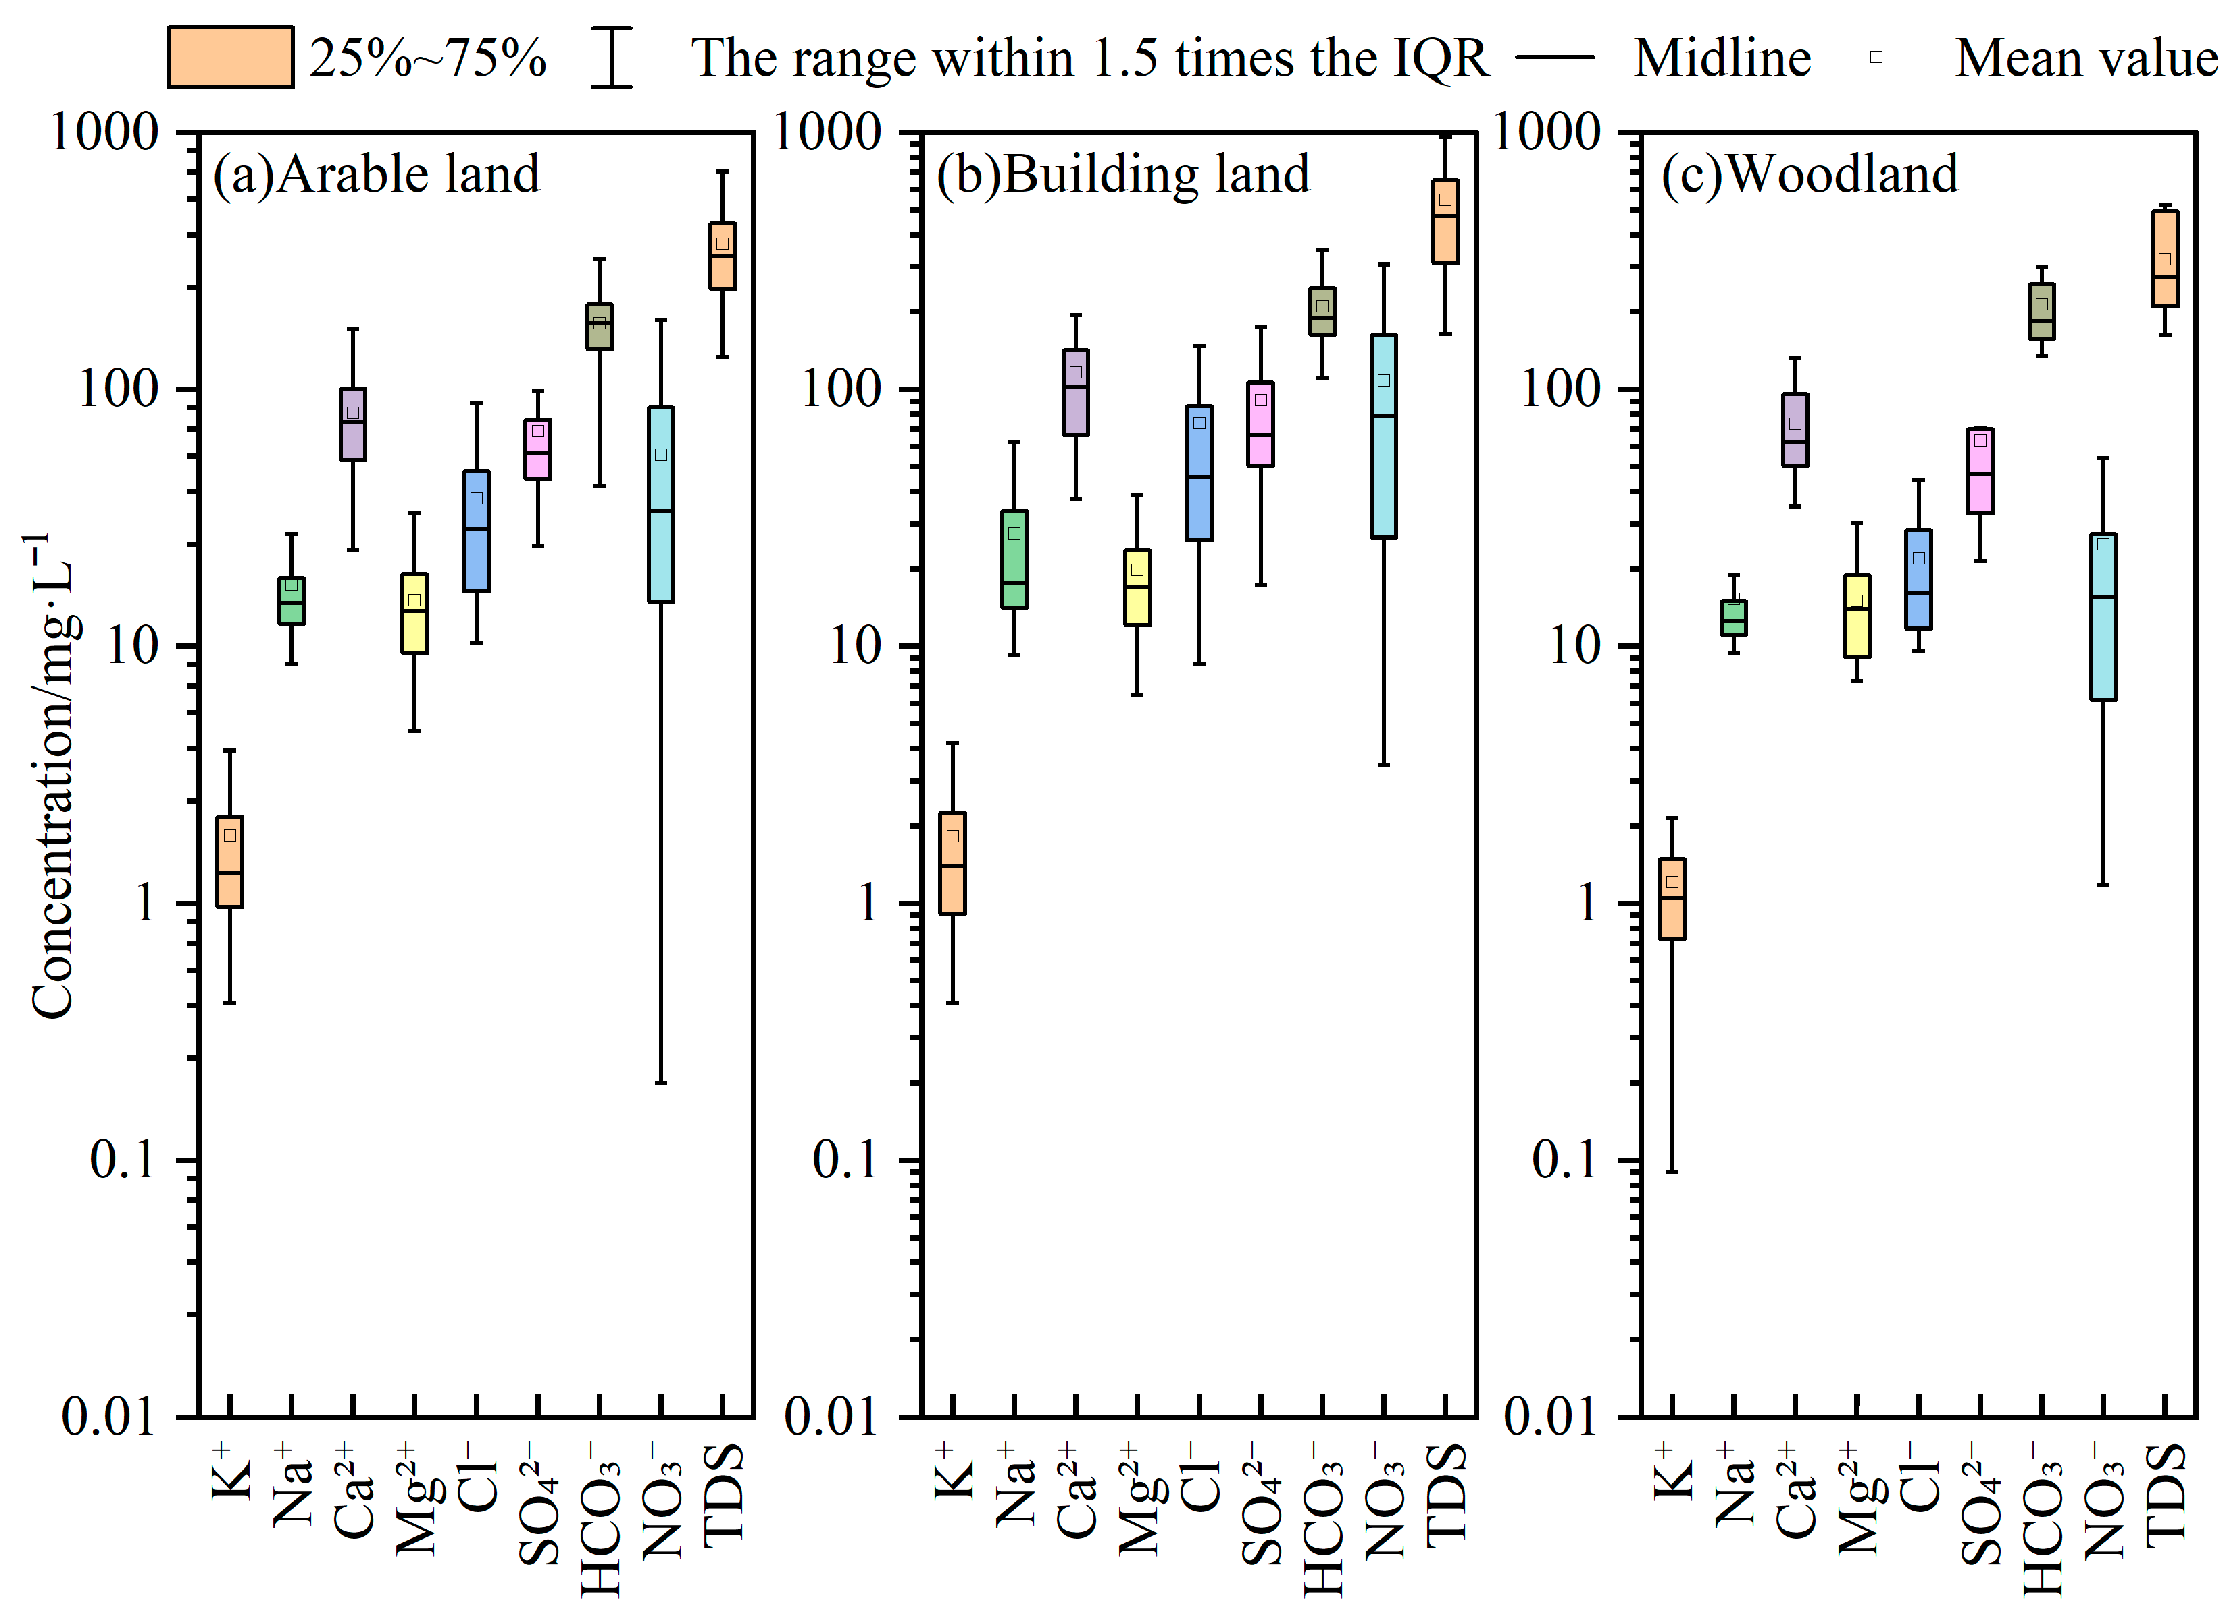
Statistical outcomes of the primary hydrochemical indicators for the 122 shallow groundwater samples from the study area are summarized in Table 1, and the corresponding box plots are illustrated in Figure 2. Overall, the shallow groundwater is primarily characterized as weakly alkaline, fresh, and hard.
Specifically, the pH values in arable, construction, and forest lands ranged from 7.00 to 8.10 (mean: 7.62), 6.90 to 8.00 (mean: 7.53), and 7.30 to 8.20 (mean: 7.71), respectively. These results confirm a generally weakly alkaline condition across all land-use types. Regarding total dissolved solids (TDS), the concentrations in arable, construction, and forest lands varied from 134.00 to 1034.00 mg/L, 164.00 to 1956.00 mg/L, and 162.00 to 522.00 mg/L, respectively. The mean TDS concentrations followed a descending order of construction land (545.40 mg/L) > arable land (370.07 mg/L) > forest land (320.50 mg/L). As most TDS values are below 1000 mg/L, the groundwater is generally classified as fresh water. Similarly, the average total hardness (TH) exhibited the same spatial pattern: construction land (372.72 mg/L) > arable land (264.62 mg/L) > forest land (245.11 mg/L), indicating that the groundwater across the region is predominantly hard water (Table 1).
The major ion concentrations in the groundwater of the study area are generally consistent across the different land-use types, with only slight variations. The order of relative dominance for cations follows the identical sequence of Ca2+ > Na+ > Mg2+ > K+ in all three land-use types. For anions, the sequence in both arable and forest lands is HCO3 > SO42− > NO3 > Cl, whereas in construction land, it shifts slightly to HCO3 > NO3 > SO42− > Cl.
To systematically evaluate the spatial heterogeneity of hydrochemical parameters, the coefficient of variation (CV) was utilized, and the classification criteria were adaptively defined as follows: CV < 0.5 indicates weak variability, suggesting that the parameter is primarily controlled by the natural geochemical background and maintains a stable spatial distribution; 0.5 ≤ CV < 1.0 represents moderate variability, reflecting the combined effects of natural factors and general human activities (e.g., non-point source fertilization); and CV ≥ 1.0 indicates strong variability, where the standard deviation exceeds the mean. Strong variability typically reflects the presence of extreme values or a bimodal distribution, which is predominantly driven by intensive human activities, such as point-source pollution or excessive fertilization [4].
The CV values of major groundwater ions in the study area range from 0.39 to 1.38, exhibiting noticeable differences among the three land-use types. In arable land, NO3 and K+ show moderate variability with CV values of 0.94 and 0.89, respectively. Given the intensive agricultural activities in the region, particularly maize cultivation, the elevated variability of NO3 and K+ is likely associated with agricultural fertilizer application. In construction land, NO3 and Cl exhibit strong variability, with CV values of 1.06 and 1.14, respectively. Generally, when groundwater is influenced by anthropogenic inputs, ions such as NO3, K+, Cl, and SO42− display considerable fluctuation and spatial heterogeneity. These results indicate that anthropogenic impacts are significant within the construction areas of the study region. Interestingly, in forest land, NO3 shows strong variability (CV = 1.38), and SO42− exhibits moderate variability (CV = 0.88). Based on field surveys, most of the forest lands in the area are artificial plantations; therefore, the observed variations in NO3 and SO42− are likely attributable to forestry fertilization practices.
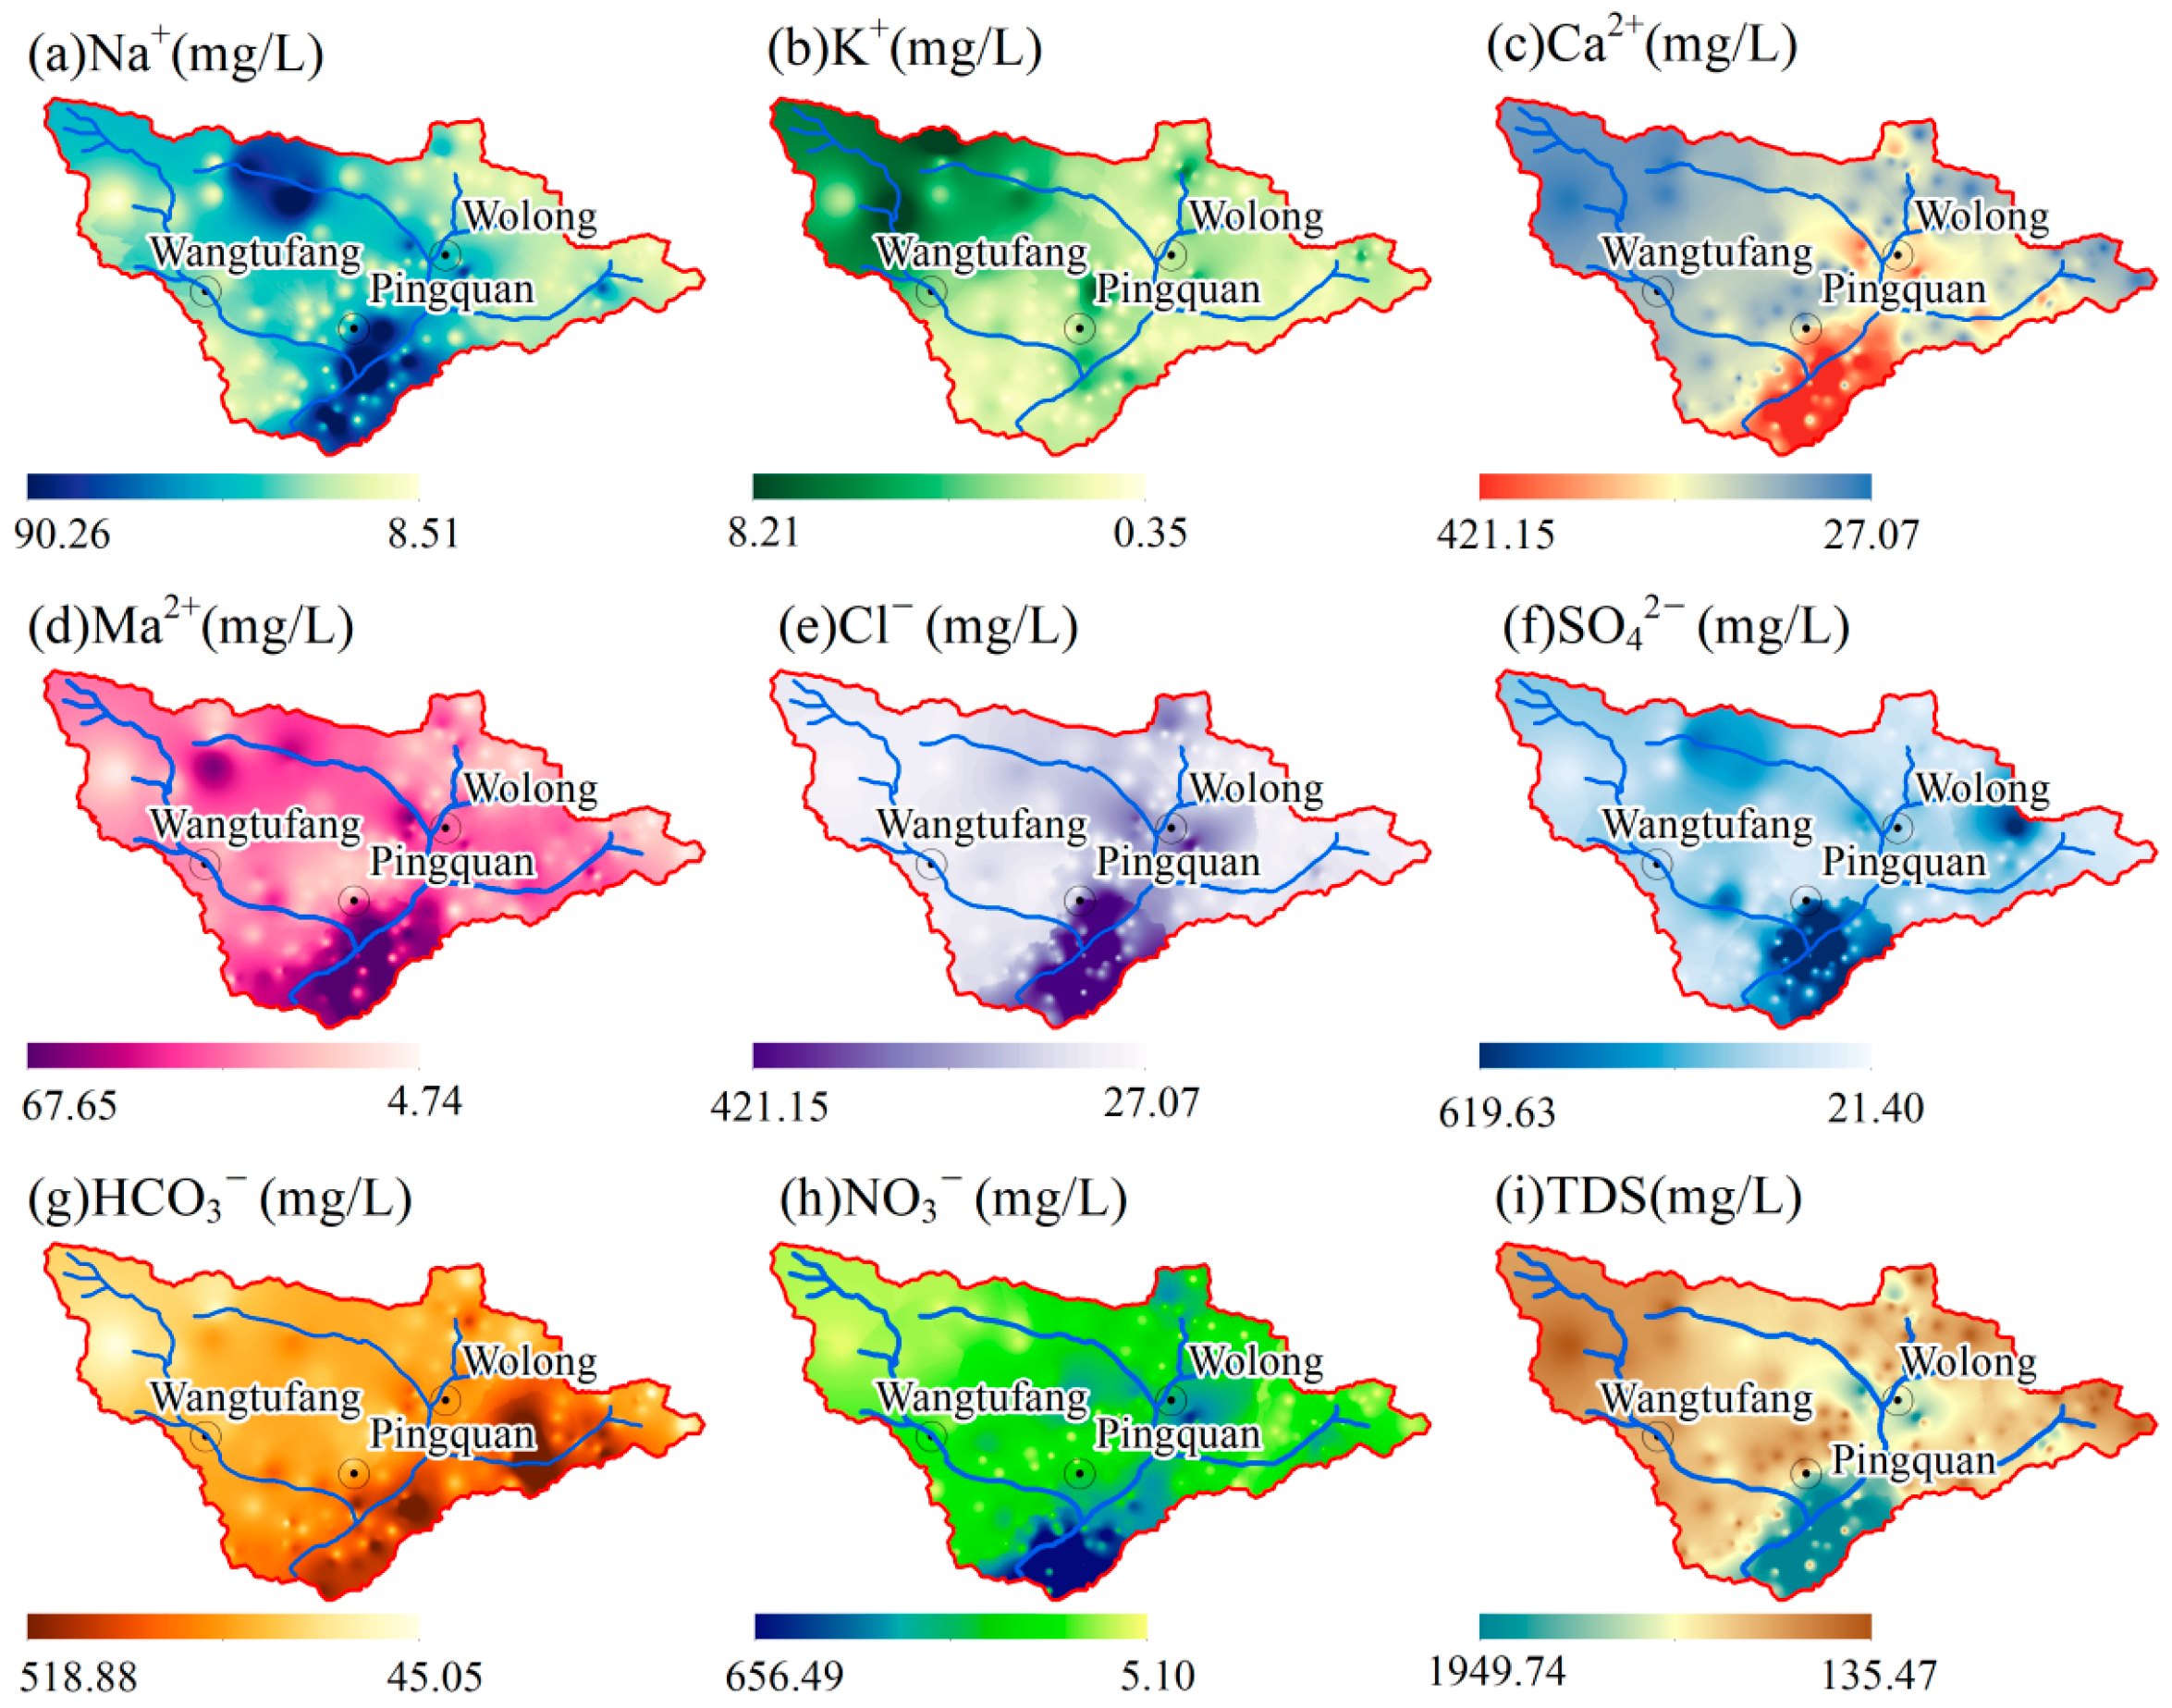
Figure 3 illustrates the spatial distribution of major ions (Na+, Ca2+, Mg2+, Cl, SO42−, HCO3, NO3) and TDS. These parameters exhibit a highly consistent spatial pattern, with concentrations gradually increasing along the groundwater flow path. Zones of low concentration are primarily located in higher-elevation forested regions, where groundwater is predominantly recharged by atmospheric precipitation. In these areas, rapid groundwater circulation and minimal anthropogenic disturbance result in lower TDS values. Conversely, elevated concentrations are mainly distributed across arable and construction lands, which are characterized by lower elevations and flatter topography. These areas serve as regional groundwater discharge zones, facilitating more prolonged and intense water–rock interactions. Furthermore, they are densely populated and subjected to intense human activities, which collectively contribute to the accumulation of dissolved ions in the groundwater.

3.2. Hydrochemical Types of Shallow Groundwater

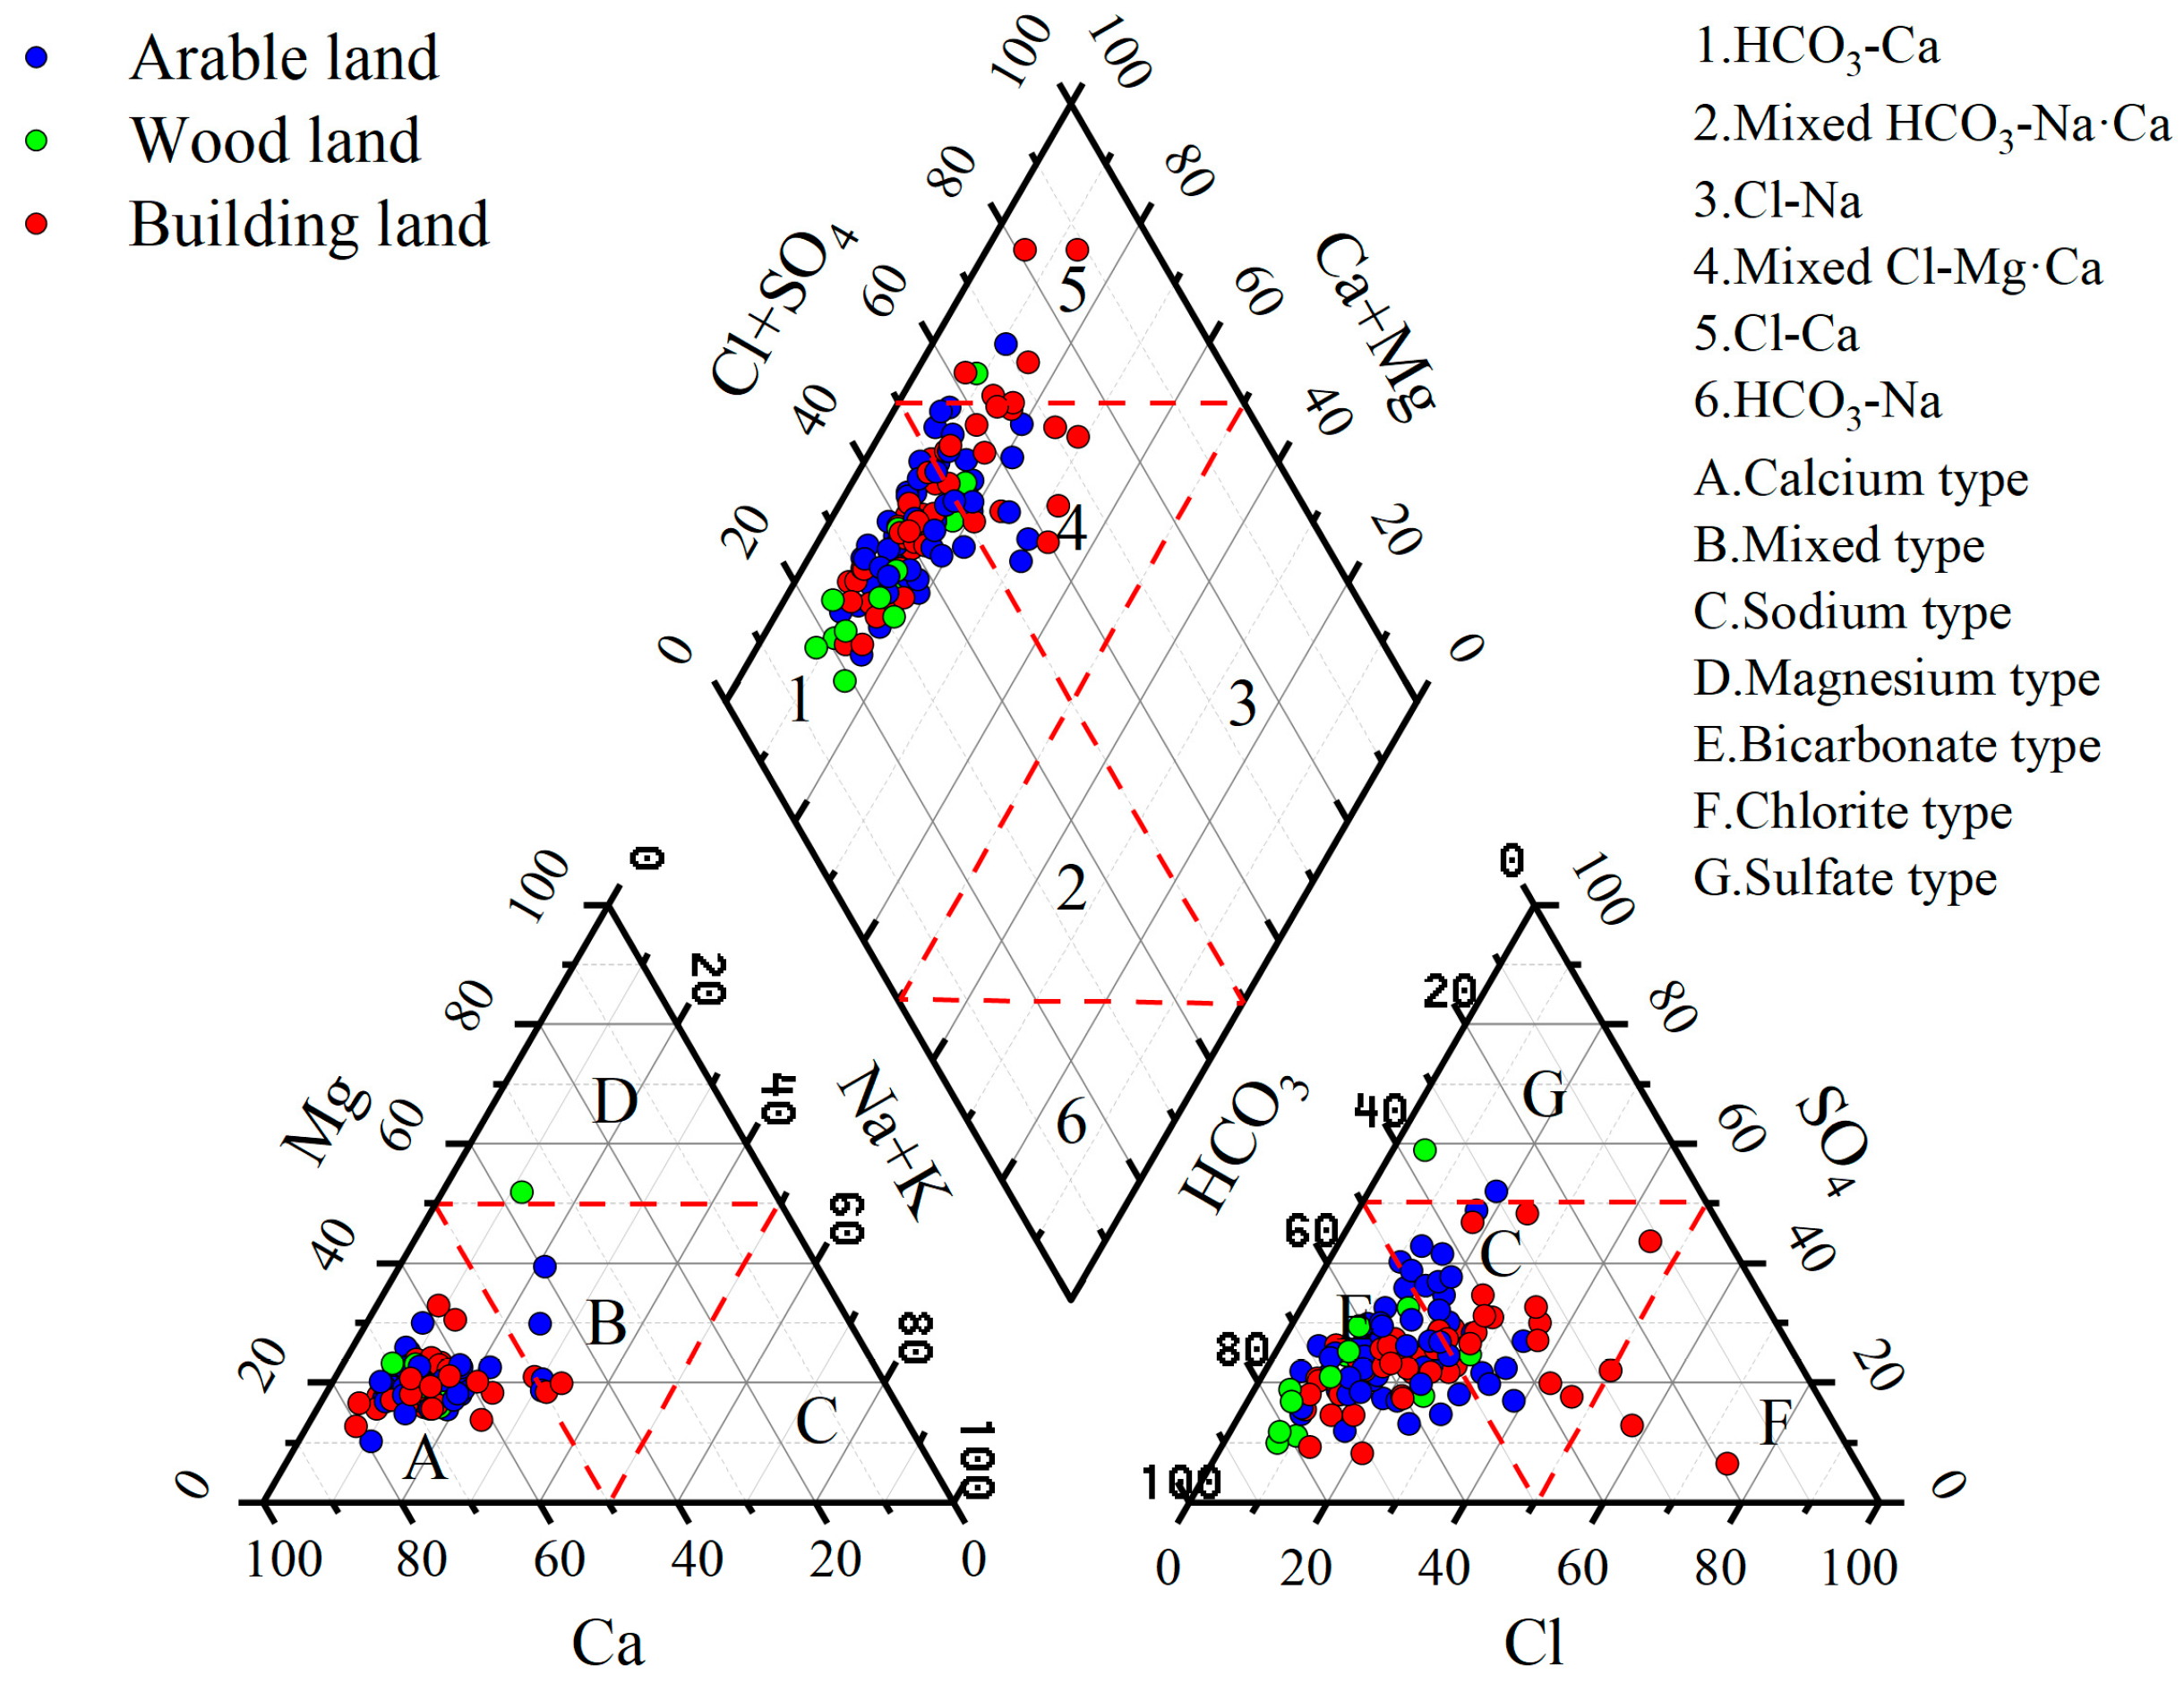
The Piper diagram is an effective tool for visualizing groundwater hydrochemical types and their evolutionary trends [24,25]. As shown in Figure 4, cations were predominantly distributed near the Ca2+ end-member, with fewer samples near the Mg2+ end-member, whereas anions were mainly concentrated near the HCO3 end-member, followed by SO42− and Cl. Based on Shukalev’s classification, groundwater in arable land exhibited a total of nine hydrochemical types, with the HCO3·SO4−Ca type (24 samples), HCO3−Ca type (19 samples), and HCO3·Cl−Ca type (7 samples) being the most dominant. Other types, such as HCO3−Ca·Mg and HCO3·SO4−Ca·Na, were also observed.
In construction land, nine hydrochemical types were identified as well, with the HCO3−Ca type (20 samples) and HCO3·SO4−Ca type (10 samples) being the most prevalent. Additional types included HCO3·Cl−Ca, HCO3·SO4·Cl−Ca, HCO3·SO4·Cl−Ca·Na, and HCO3−Ca·Mg. Groundwater in forest land displayed fewer hydrochemical types, totaling four, primarily HCO3−Ca (6 samples) and HCO3·SO4−Ca (5 samples), with HCO3·Cl−Ca and HCO3−Ca·Mg also present.
It is noteworthy that Cl-dominant types occurred at a relatively low frequency, which may be attributed to limited chloride sources from human activities or to the low solubility of chloride in the soil and rock layers.
Regarding the spatial distribution of hydrochemical types, forest land in the study area is characterized by relatively high terrain. Owing to the topographic influence, groundwater flow generally follows the terrain. In this area, groundwater is shallow, with rapid runoff and limited leaching, resulting in relatively simple hydrochemical types, primarily dominated by the HCO3−Ca type. In contrast, arable and construction lands are located at lower elevations with gentle slopes. Here, groundwater flow paths are longer, and leaching processes are more pronounced, leading to more complex hydrochemical types. These are mainly dominated by the HCO3·SO4−Ca and HCO3−Ca types, while additional types such as HCO3·Cl−Ca, HCO3·SO4·Cl−Ca, and HCO3−Ca·Mg emerge, largely influenced by human activities.
The lithology of the study area primarily consists of silicate and carbonate rocks. Weathering and dissolution of calcium-bearing minerals in silicate rocks (e.g., plagioclase, amphibole, pyroxene), together with carbonate rocks themselves, release Ca2+ and HCO3 ions through water–rock interactions. Consequently, Ca2+ and HCO3 are the dominant cation and anion in the region, with the local geological lithology being the primary factor controlling the hydrochemical types of groundwater.

3.3. Factors Controlling Hydrochemical Components

3.3.1. Correlation Analysis

Correlation analysis is a statistical method used to evaluate the strength of relationships between random variables [26]. Its primary purpose is to determine whether dependencies exist between different phenomena and to further assess the direction and magnitude of these relationships. The chemical composition of groundwater is closely related to its sources [27]. By analyzing correlations among chemical components, similarities and differences in groundwater hydrogeochemical parameters can be identified, providing insights into the stability and variability of their sources [28,29]. In this study, correlation analysis was performed on major hydrochemical parameters in groundwater, including K+, Na+, Ca2+, Mg2+, Cl, SO42−, HCO3, NO3, total hardness (TH), and total dissolved solids (TDS).
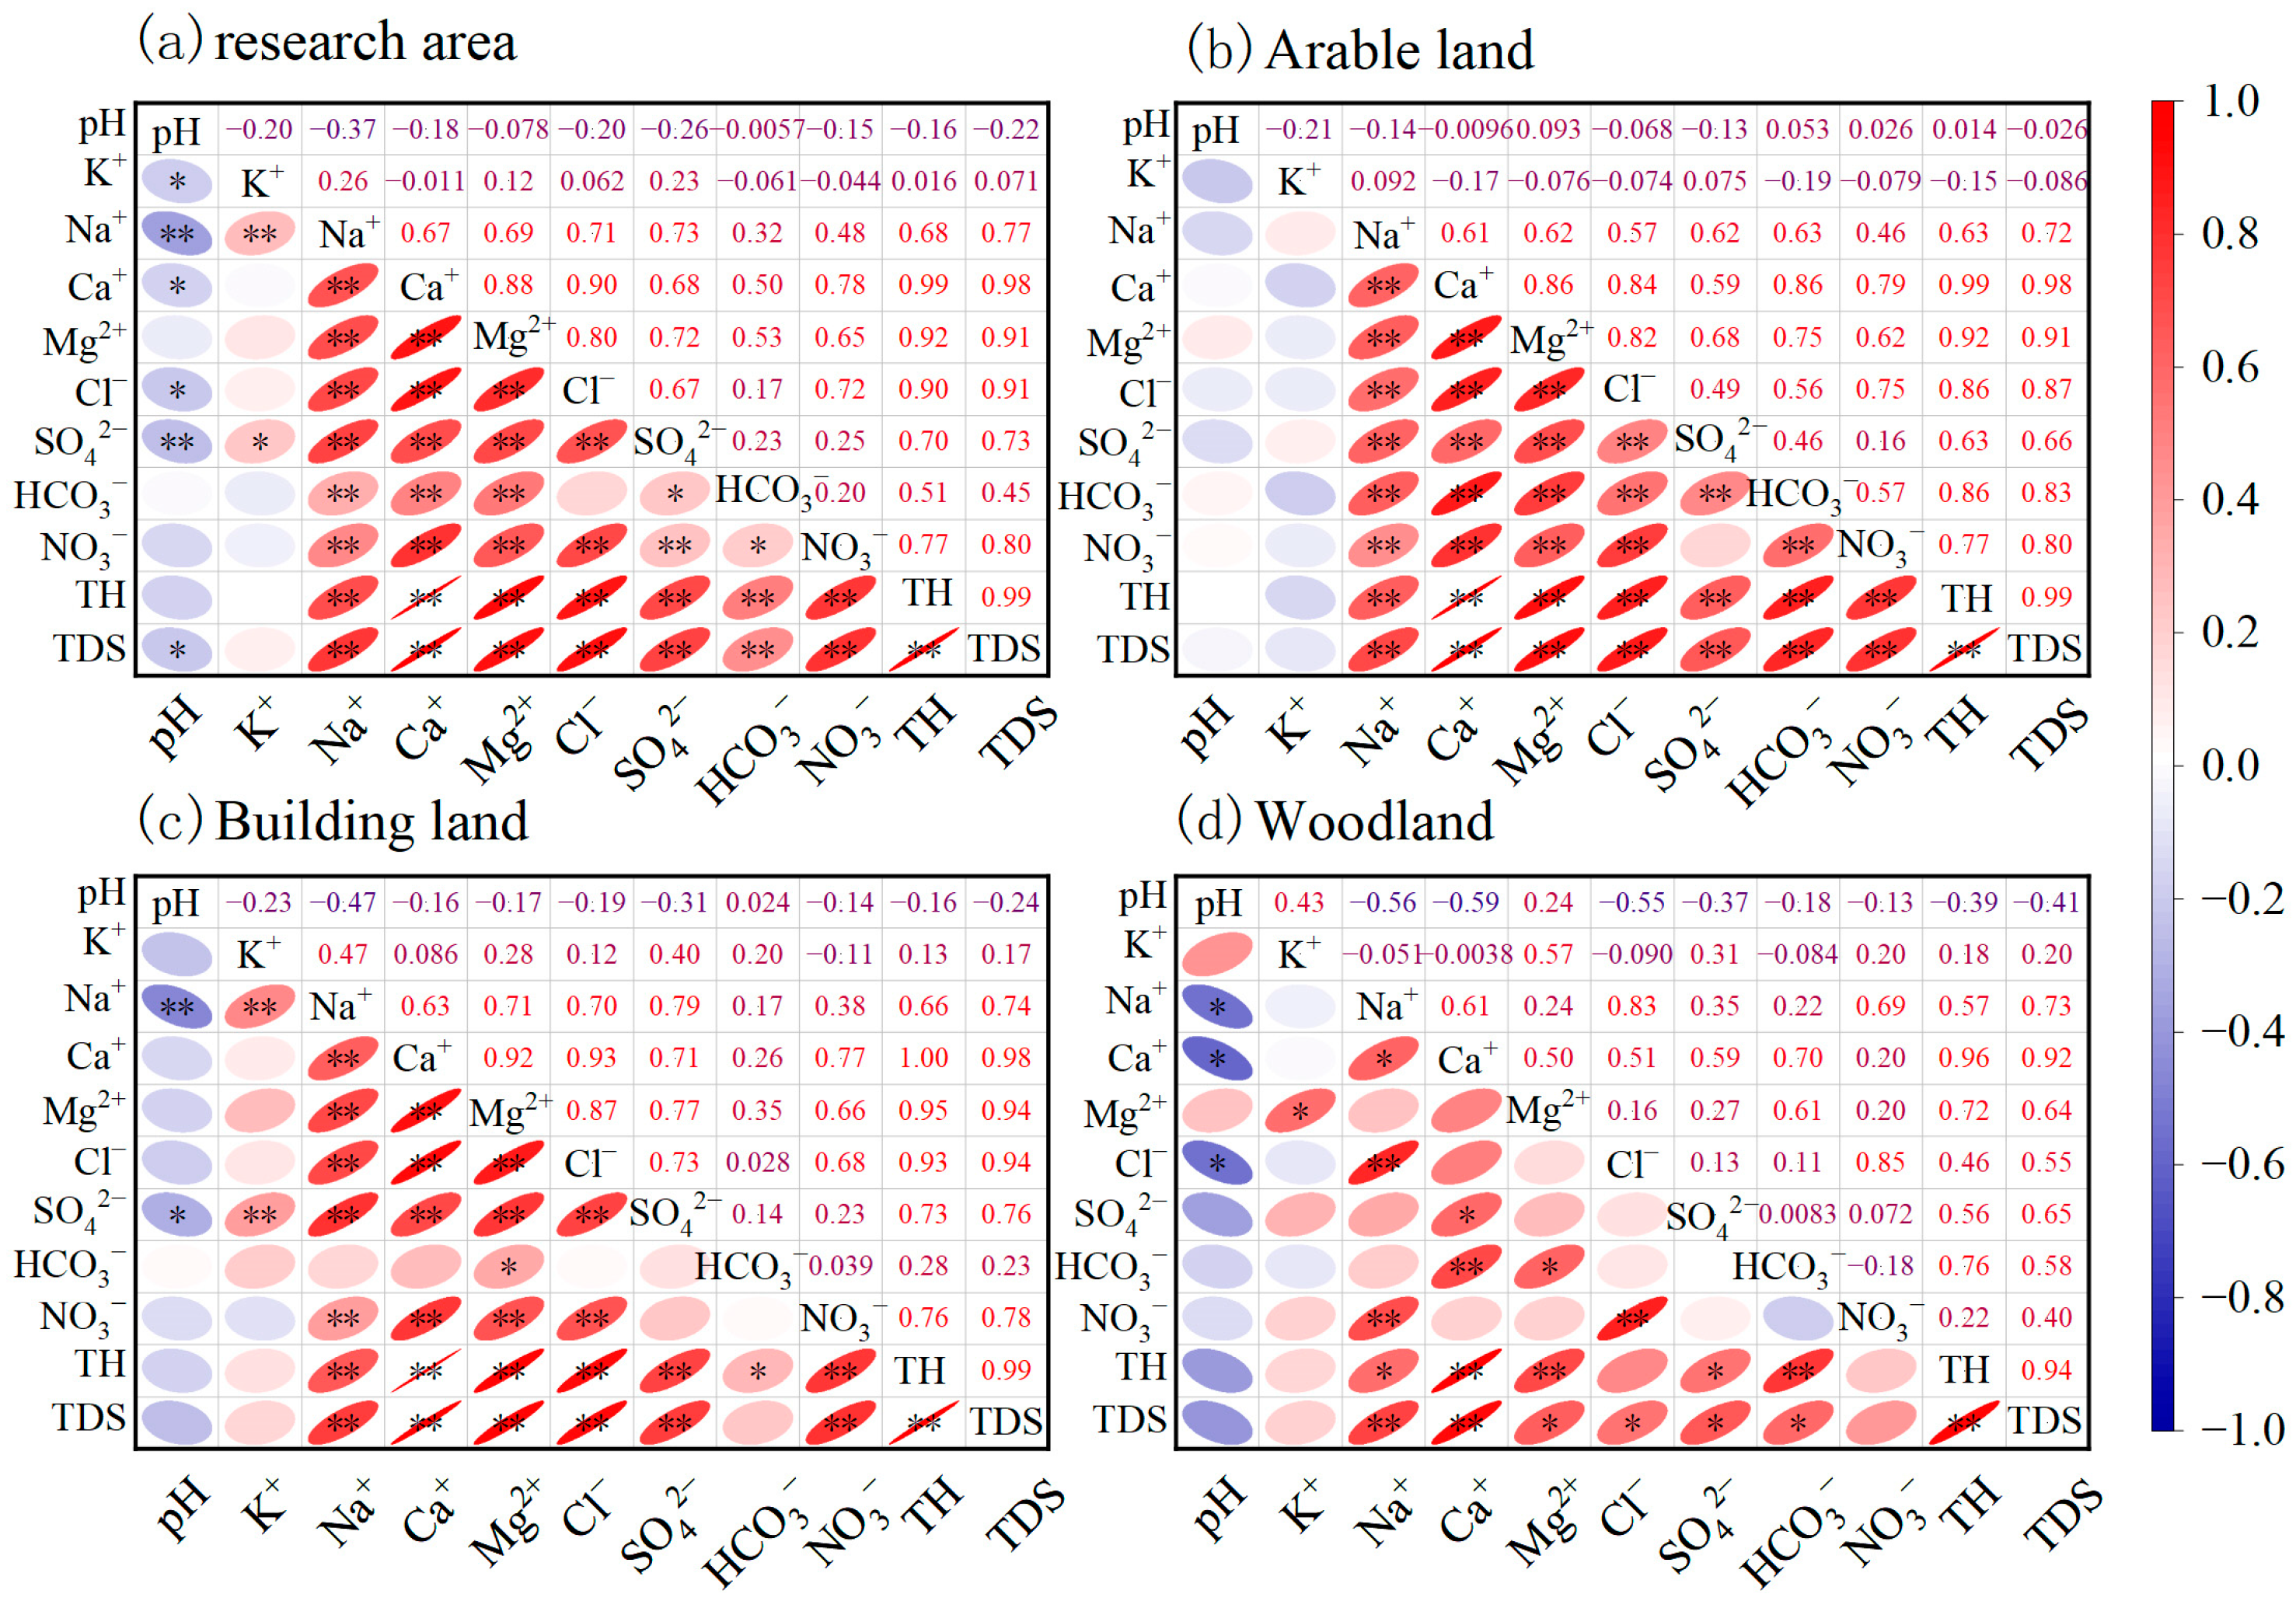
As shown in Figure 5, the correlations of major ions in shallow groundwater are relatively consistent across agricultural, construction, and forest lands. TDS exhibits significant positive correlations with Na+, Ca2+, Mg2+, Cl, SO42−, and NO3, indicating that these ions likely share a common water source and contribute substantially to TDS. In agricultural and construction areas, Ca2+ is notably correlated with Cl and SO42−, suggesting the dissolution of evaporite minerals, such as gypsum (CaSO4·2H2O) and other sulfate minerals. This pattern aligns with regional hydrogeochemical evolution and can be further corroborated by mineralogical evidence. In forested areas, the association between Ca2+ and Cl/SO42− is less pronounced, whereas the correlation with HCO3 is stronger, implying that both carbonate and evaporite rocks influence the groundwater chemical composition.
Mg2+ concentrations are correlated with Na+ and Cl, suggesting that Mg2+ may derive from the weathering processes of silicate minerals. Carbonate minerals in the study area, such as dolomite (CaMg(CO3)2) and magnesite (MgCO3), also represent important Mg2+ sources. Therefore, carbonate minerals likely serve as the primary contributors to Mg2+ levels.
In agricultural soils, the concentration of K+ exhibited weak or negative correlations with other ions, indicating that K+ has a different source from other ions. It is speculated that this may be related to local agricultural fertilization practices. Specifically, dryland crops such as corn are widely cultivated in the study area, and farmers commonly apply potassium chloride, potassium sulfate, and potassium-containing compound fertilizers to increase yields. After potassium fertilizer is applied to the soil, K+ is readily adsorbed by soil colloids or directly absorbed by crops. Its migration pathway differs significantly from ions such as Ca2+ and Mg2+, which originate from rock weathering, thus resulting in weak or negative correlations. NO3 exhibits significant correlations with TDS, TH, Ca2+, Mg2+, and Cl, suggesting that it has become a major component of groundwater affected by anthropogenic interference. This further highlights the significant anthropogenic impact on groundwater chemistry in the study area. Finally, the significant correlation between Ca2+ and Mg2+ suggests that these ions likely derive from the same rock weathering processes.

3.3.2. Control Factor Identification

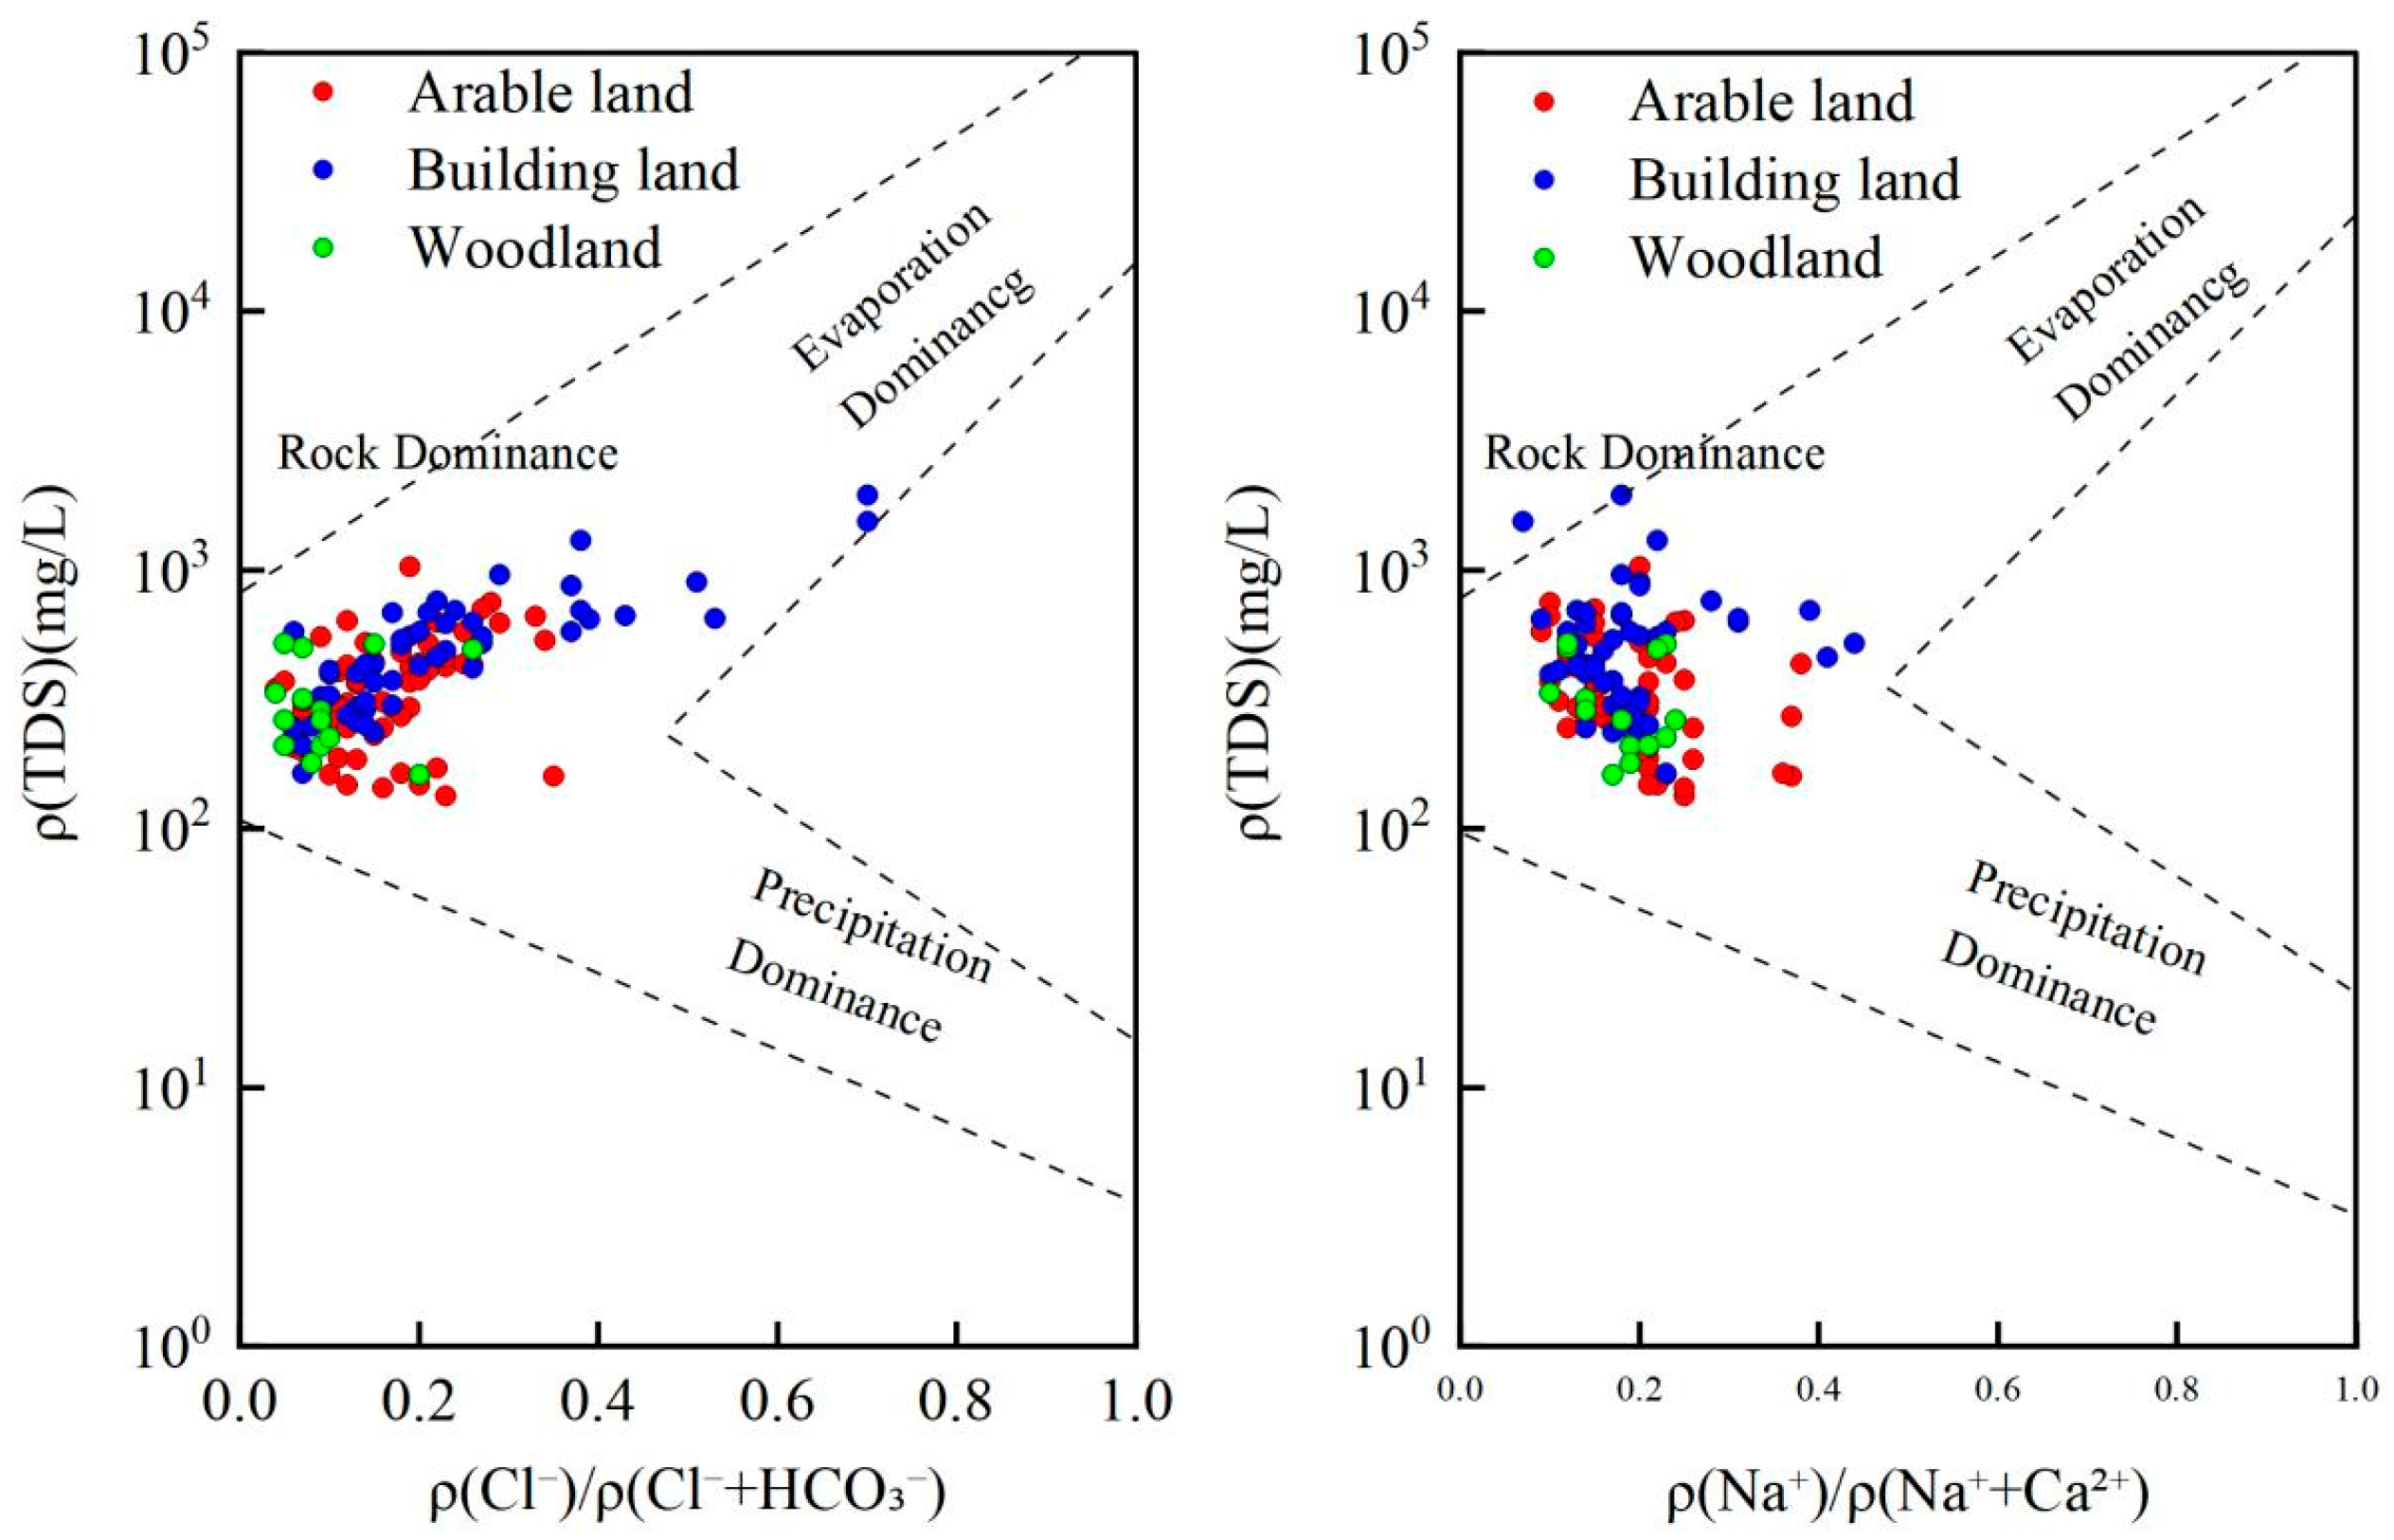
The contents of primary chemical constituents in groundwater are controlled by multiple natural geological processes, including rock weathering, atmospheric precipitation infiltration, and the effects of evaporation and solute concentration. Gibbs diagrams are commonly employed to visualize the dominant factors controlling groundwater chemistry [30,31,32]. As shown in Figure 6, the total dissolved solids (TDS) values at the groundwater sampling points in the study area primarily ranged from 100 to 1000 mg/L. The ratios ρ(Na+)/(ρ(Na+) + ρ(Ca2+)) and ρ(Cl)/(ρ(Cl) + ρ(HCO3)) varied from 0.07 to 0.44 and from 0.04 to 0.7, respectively.
Most sampling points were located near the rock weathering end-member, indicating that rock weathering is the primary process controlling groundwater hydrochemistry in the study area. A small number of sampling points, primarily in construction areas, were closer to the evaporation–concentration end, suggesting that evaporation and concentration processes also influence groundwater chemistry, although to a lesser degree than rock weathering. This effect is particularly noticeable in areas with higher TDS values, where ion concentrations, such as Na+ and Cl, are relatively enriched due to water loss through evaporation.
This observation implies that while evaporation and concentration processes are secondary, they can locally modify groundwater chemistry and contribute to mineral enrichment. Sampling points positioned farther from the precipitation control end-member suggest that rainfall has a relatively minor effect on the ionic constituents of groundwater.
Overall, rock weathering is the dominant process shaping groundwater chemistry in the study area, while evaporation, concentration, and atmospheric precipitation have comparatively limited, yet locally significant, effects.
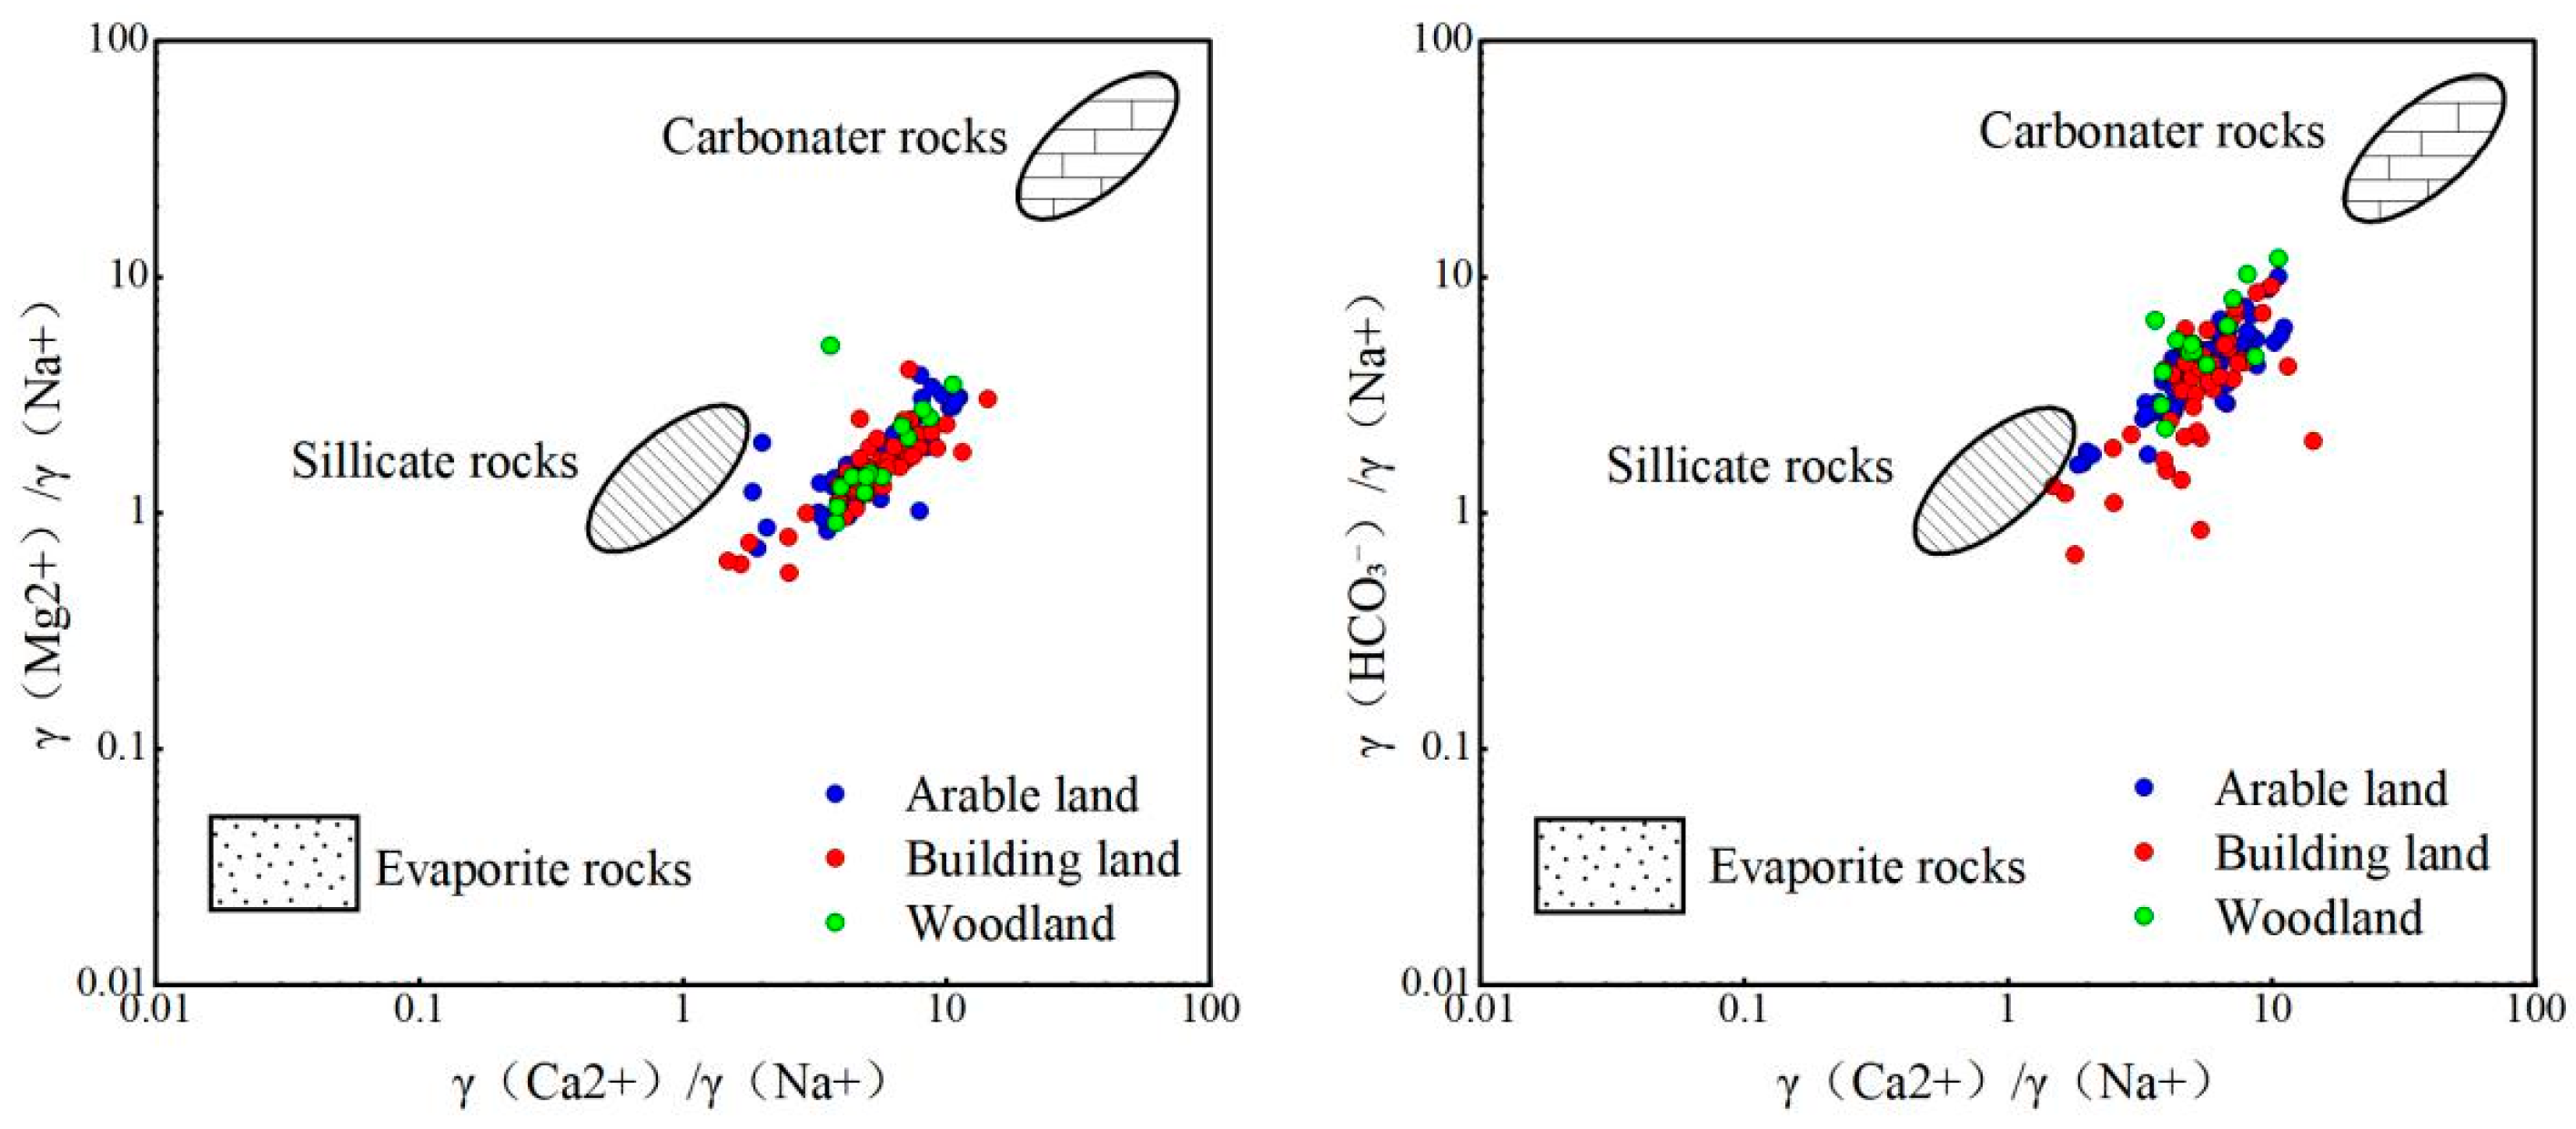
The notable variations in the contents of Na+, Ca2+, and Mg2+ in the groundwater system are mainly ascribed to the degree of weathering of carbonate, silicate, and evaporite rock minerals. As discussed earlier, the chemical composition of groundwater is predominantly influenced by rock weathering. By examining the relationships between the milligram equivalent ratios γ(HCO3)/γ(Na+), γ(Ca2+)/γ(Na+), and γ(Mg2+)/γ(Na+), the effects of different types of rock weathering on groundwater chemistry can be qualitatively assessed [33,34].
As illustrated in Figure 7, shallow groundwater samples in the study area exhibit a relatively concentrated distribution, primarily clustering in the vicinity of the silicate and carbonate end-members. This observation suggests that the dissolution of silicate and carbonate minerals constitutes the dominant process governing the hydrochemical composition of shallow groundwater, which is in good agreement with the regional geological setting characterized by the widespread occurrence of silicate and carbonate rocks.
Furthermore, a minor fraction of groundwater samples derived from cultivated land and construction area plots close to the evaporite end-member. This indicates that evaporite dissolution exerts a certain influence on groundwater chemistry, albeit with a relatively limited contribution. In light of the study area’s semi-arid climatic regime, combined with the shallow depth of the groundwater level and intense evaporation processes, the limited dissolution of evaporite minerals is deemed reasonable.
Overall, the hydrochemical composition of shallow groundwater in the study area is jointly controlled by the weathering and dissolution of silicate and carbonate rocks. In contrast, the impact of evaporite dissolution is relatively minor [17].

3.3.3. Leaching Effect

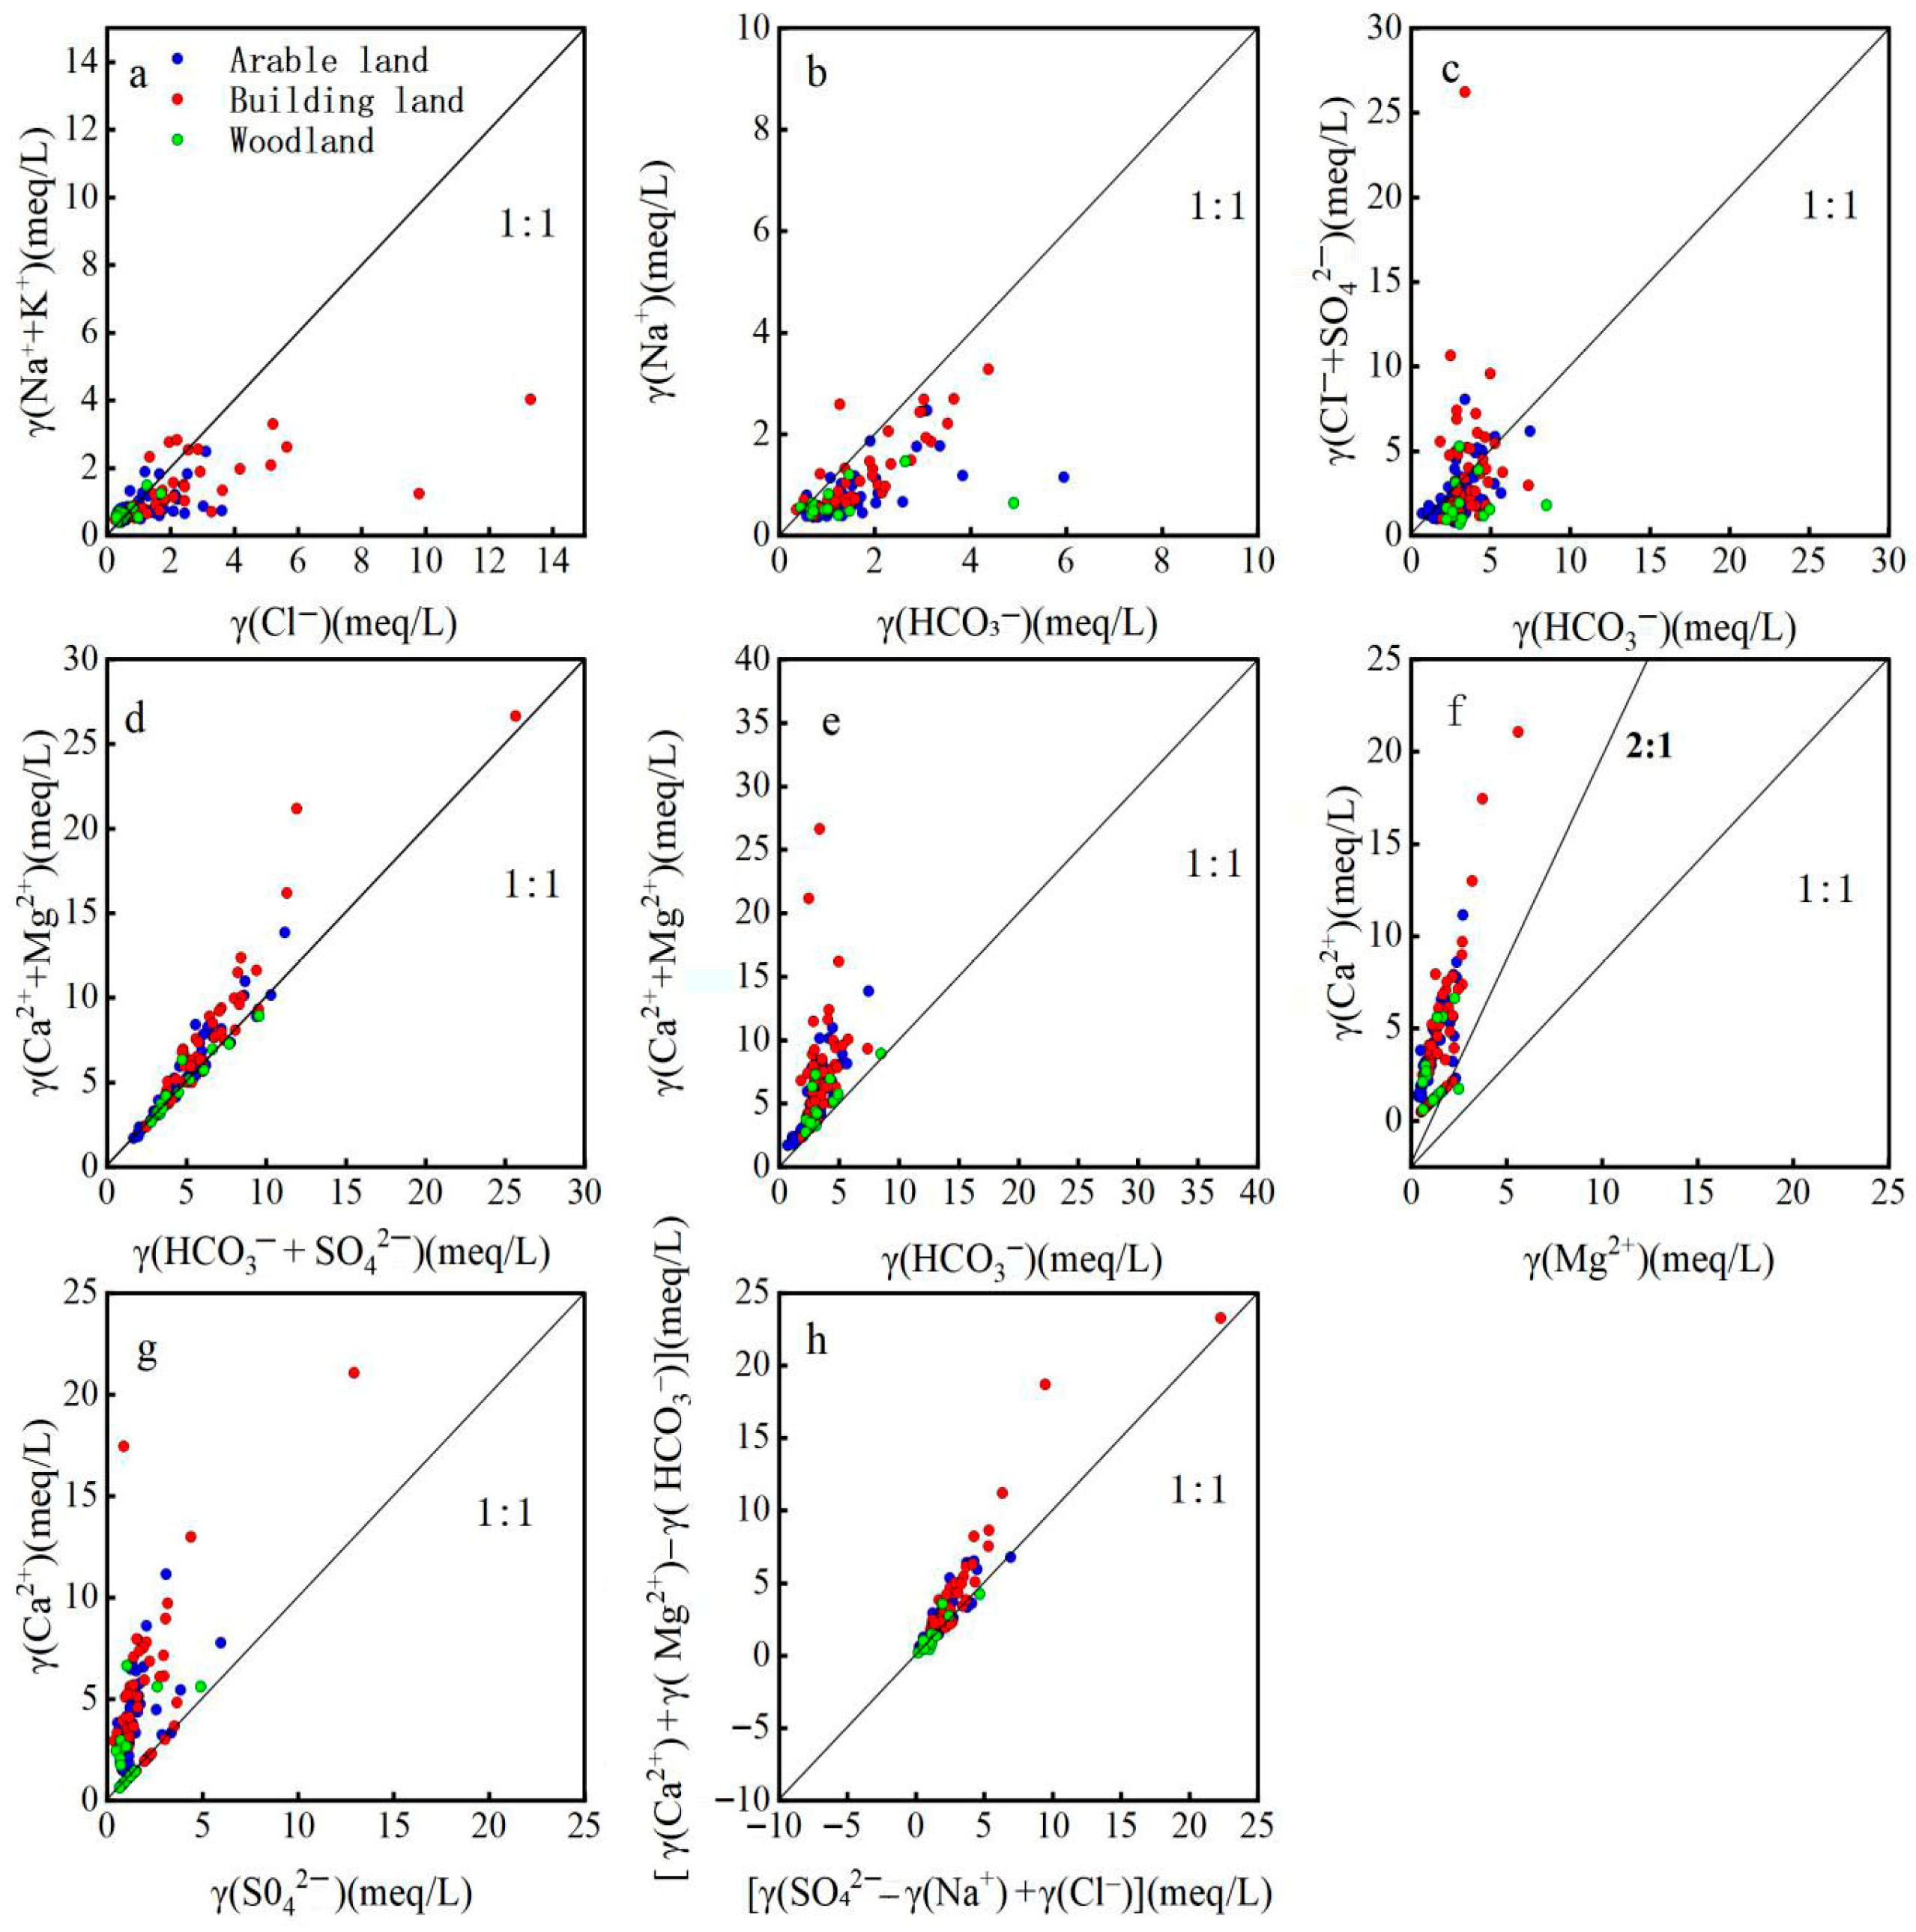
The ion ratio method is a key approach for studying groundwater chemistry. It can be employed to characterize the hydrochemical compositions of groundwater and identify the hydrochemical processes associated with water–rock interactions, helping to determine the origin of groundwater chemical components [35,36,37]. Chloride (Cl), sodium (Na+), and potassium (K+) are typically controlled by the dissolution of rock salt and silicate minerals. Therefore, the ratio γ(Na+ + K+)/γ(Cl) can be used to identify the sources of Na+ and K+. When γ(Na+ + K+)/γ(Cl) equals 1, rock salt dissolution is the dominant source. When the ratio exceeds 1, it denotes supplementary Na+ replenishment, which mainly stems from silicate weathering and mineral dissolution. By comparison, a ratio lower than 1 reveals excessive Cl enrichment, mostly controlled by anthropogenic activities. Figure 8a shows that most of the groundwater sampling points in the forest land are near the 1:1 line, indicating that the Na+ and K+ in this groundwater mainly result from rock salt dissolution. In contrast, some sampling points in the arable and construction lands fall below the 1:1 line, suggesting additional Cl inputs, possibly from human activities or the alternating adsorption of cations, which warrants further investigation. A few sampling points above the 1:1 line suggest some contribution from silicate weathering.
As shown in Figure 8b, most groundwater sampling points in the study area are located below the 1:1 line of γ(Na+)/γ(HCO3). This indicates that the concentration of Na+ in the shallow groundwater is insufficient to fully neutralize the HCO3 produced by mineral dissolution. Consequently, the dissolution of carbonate minerals generates an excess of HCO3 in the groundwater.
The molar ratio γ(Cl + SO42−)/γ(HCO3) serves as a reliable index to trace the provenance of Cl, SO42− and HCO3 in groundwater. Ratio values above 1 suggest that these ions are predominantly derived from silicate mineral dissolution; in contrast, values below 1 imply their major contributions stem from the weathering and dissolution of carbonate rocks. As shown in Figure 8c, most of the shallow groundwater sampling points in the study area are located on both sides of the 1:1 line, suggesting that Cl, SO42−, and HCO3 are influenced by the combined dissolution of both carbonate and silicate rocks. The above finding is consistent with the analytical results reported in Section 3.3.2.
The Ca2+, Mg2+, HCO3, and SO42− in the groundwater primarily result from the weathering and dissolution of minerals such as carbonate, silicate, and evaporite. The γ(Ca2+ + Mg2+)/γ(HCO3 + SO42−) ratio can be used to identify the sources of Ca2+ and Mg2+ [38]. When γ(Ca2+ + Mg2+)/γ(HCO3 + SO42−) is greater than 1, carbonate rock dissolution is the dominant source, whereas a ratio less than 1 indicates that silicate rock dissolution is the main contributor. As shown in Figure 8d, most of the groundwater sampling points in the study area are located above the 1:1 line, with some falling below it. This suggests that the Ca2+ and Mg2+ in the groundwater predominantly originate from carbonate rock dissolution but are also influenced by silicate rock dissolution.
It is feasible to trace the sources of Ca2+ and Mg2+ within groundwater via the γ(Ca2+ + Mg2+)/γ(HCO3) ratio. As shown in Figure 8e, most of the groundwater sampling points in the study area fall above the 1:1 line, confirming that the Ca2+ and Mg2+ in the groundwater mainly result from carbonate rock dissolution. The γ(Ca2+)/γ(Mg2+) ratio can further determine whether the dissolution of carbonate rock is primarily due to calcite or dolomite [39]. When γ(Ca2+)/γ(Mg2+) equals 1, dolomite dissolution is dominant; when the ratio exceeds 2, calcite dissolution prevails; and when the ratio is between 1 and 2, both dolomite and calcite are co-dissolving [40]. Figure 8f can be observed that the majority of sampling sites across the study plot lie above the 2:1 trend line, indicating that calcite dissolution is the dominant process, with a minor influence from dolomite dissolution at a few points.
Correlation analysis demonstrates a prominent correlation between Ca2+ and SO42− concentrations in shallow groundwater across the study region. Therefore, the γ(Ca2+)/γ(SO42−) ratio can effectively evaluate the occurrence of gypsum dissolution, as illustrated in Figure 8g. The majority of shallow groundwater sampling sites in the research area plot above the 1:1 equilibrium line, indicating that gypsum dissolution occurred in conjunction with carbonate rock dissolution.
The relational variation of [γ(Ca2+) + γ(Mg2+) − γ(HCO3)] versus [γ(SO42−) − γ(Na+) + γ(Cl)] enables an inference on the origin of SO42− in groundwater related to gypsum dissolution. Here, [γ(SO42−) − γ(Na+) + γ(Cl)] represents the concentration of SO42− from gypsum dissolution, while [γ(Ca2+) + γ(Mg2+) − γ(HCO3)] represents the concentration of Ca2+ from gypsum dissolution. As shown in Figure 8h, most shallow groundwater sampling points are near the 1:1 line, suggesting that the SO42− in the study area’s groundwater primarily comes from the dissolution of gypsum. Data points distributed above the 1:1 line imply that Ca2+ in groundwater is controlled by both gypsum dissolution and carbonate rock weathering and leaching processes.

3.3.4. Cation Exchange and Adsorption

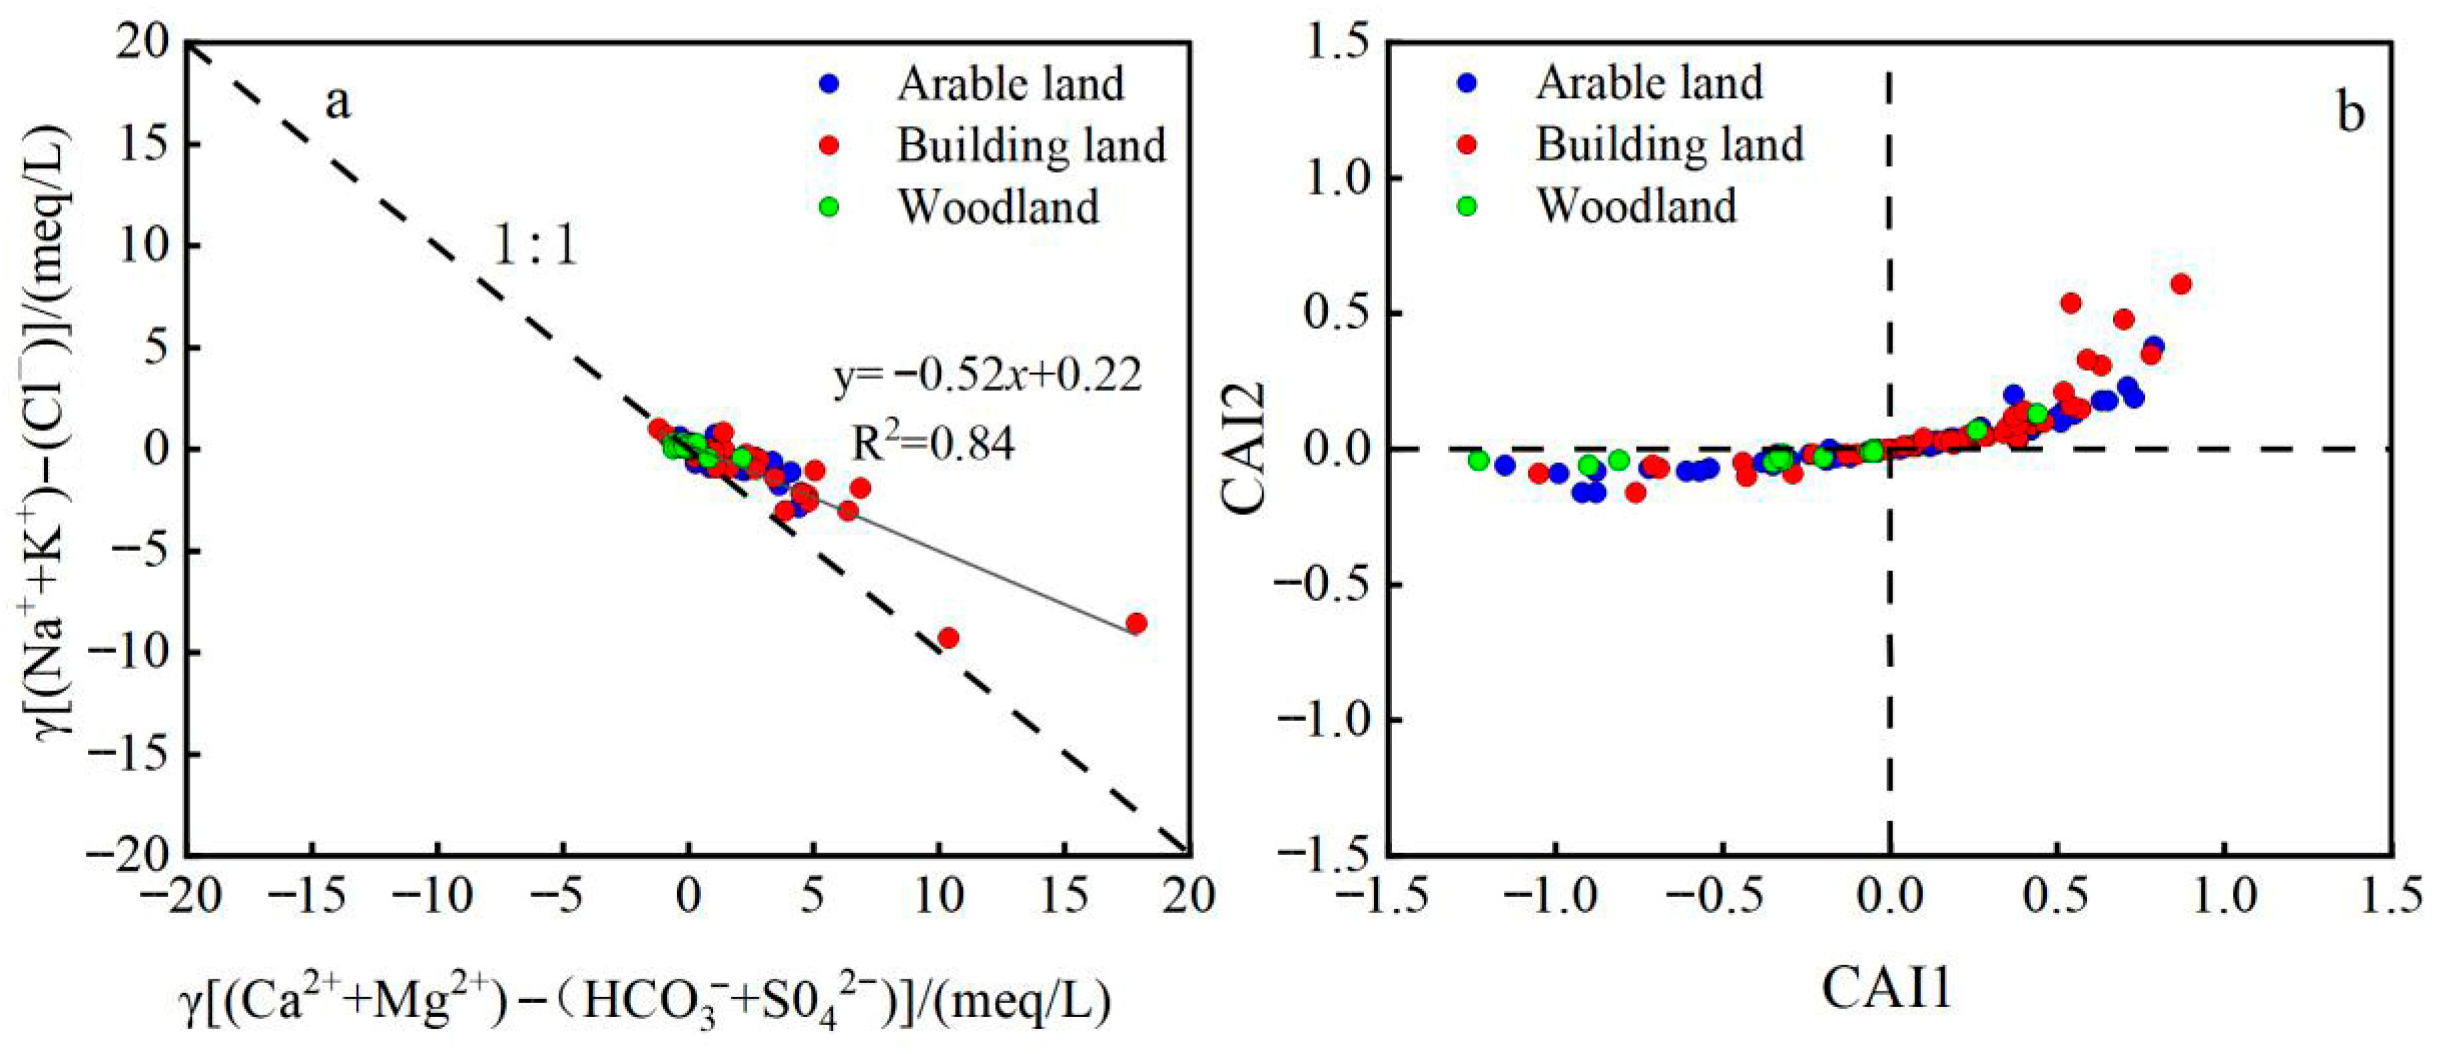
Cation exchange and adsorption are groundwater–rock interaction processes in which cations on rock surfaces are replaced by cations in the water, leading to changes in groundwater chemical composition. The occurrence of cation exchange and adsorption can be assessed using the ratio γ[(Na+ + K+) − Cl]/γ[(Ca2+ + Mg2+) − (SO42− + HCO3)] [34,41]. When this process is active, the ratio typically approaches −1. As shown in Figure 9a, the shallow groundwater sampling points in the study area exhibit a strong negative correlation, with a correlation coefficient of 0.84. However, the slope of −0.52 deviates substantially from −1, indicating that cation exchange and adsorption have occurred in the study area, albeit relatively weakly.
The chlor–alkali indices (CAI-1 and CAI-2) can be used to identify the type and intensity of cation exchange reactions in groundwater (Equations (6) and (7)). Positive values of the chlor–alkali index (CAI-1 or CAI-2) indicate reverse cation exchange, meaning that Na+ and K+ in the groundwater have replaced Ca2+ and Mg2+ in the aquifer medium. Conversely, negative values of the chlor–alkali index suggest forward cation exchange and adsorption, in which Ca2+ and Mg2+ ions displace Na+ and K+ in the aqueous solution. Increasing absolute index values correspond to stronger cation exchange and adsorption effects within the groundwater system.
C A I - 1 = C l N a + + K + C l
C A I - 2 = C l N a + + K + H C O 3 + S O 4 2 + C O 3 2 + N O 3
Figure 9b shows that majority of sampling sites within the investigated area had positive chlor–alkali indices (CAI-1 and CAI-2), indicating that reverse cation exchange and adsorption occurred in the groundwater, with low intensity. A few sampling points had negative chlor–alkali indices (CAI-1 and CAI-2), suggesting that forward cation exchange and adsorption also took place, but with a lower intensity compared to reverse cation exchange and adsorption.

3.3.5. SI Analysis

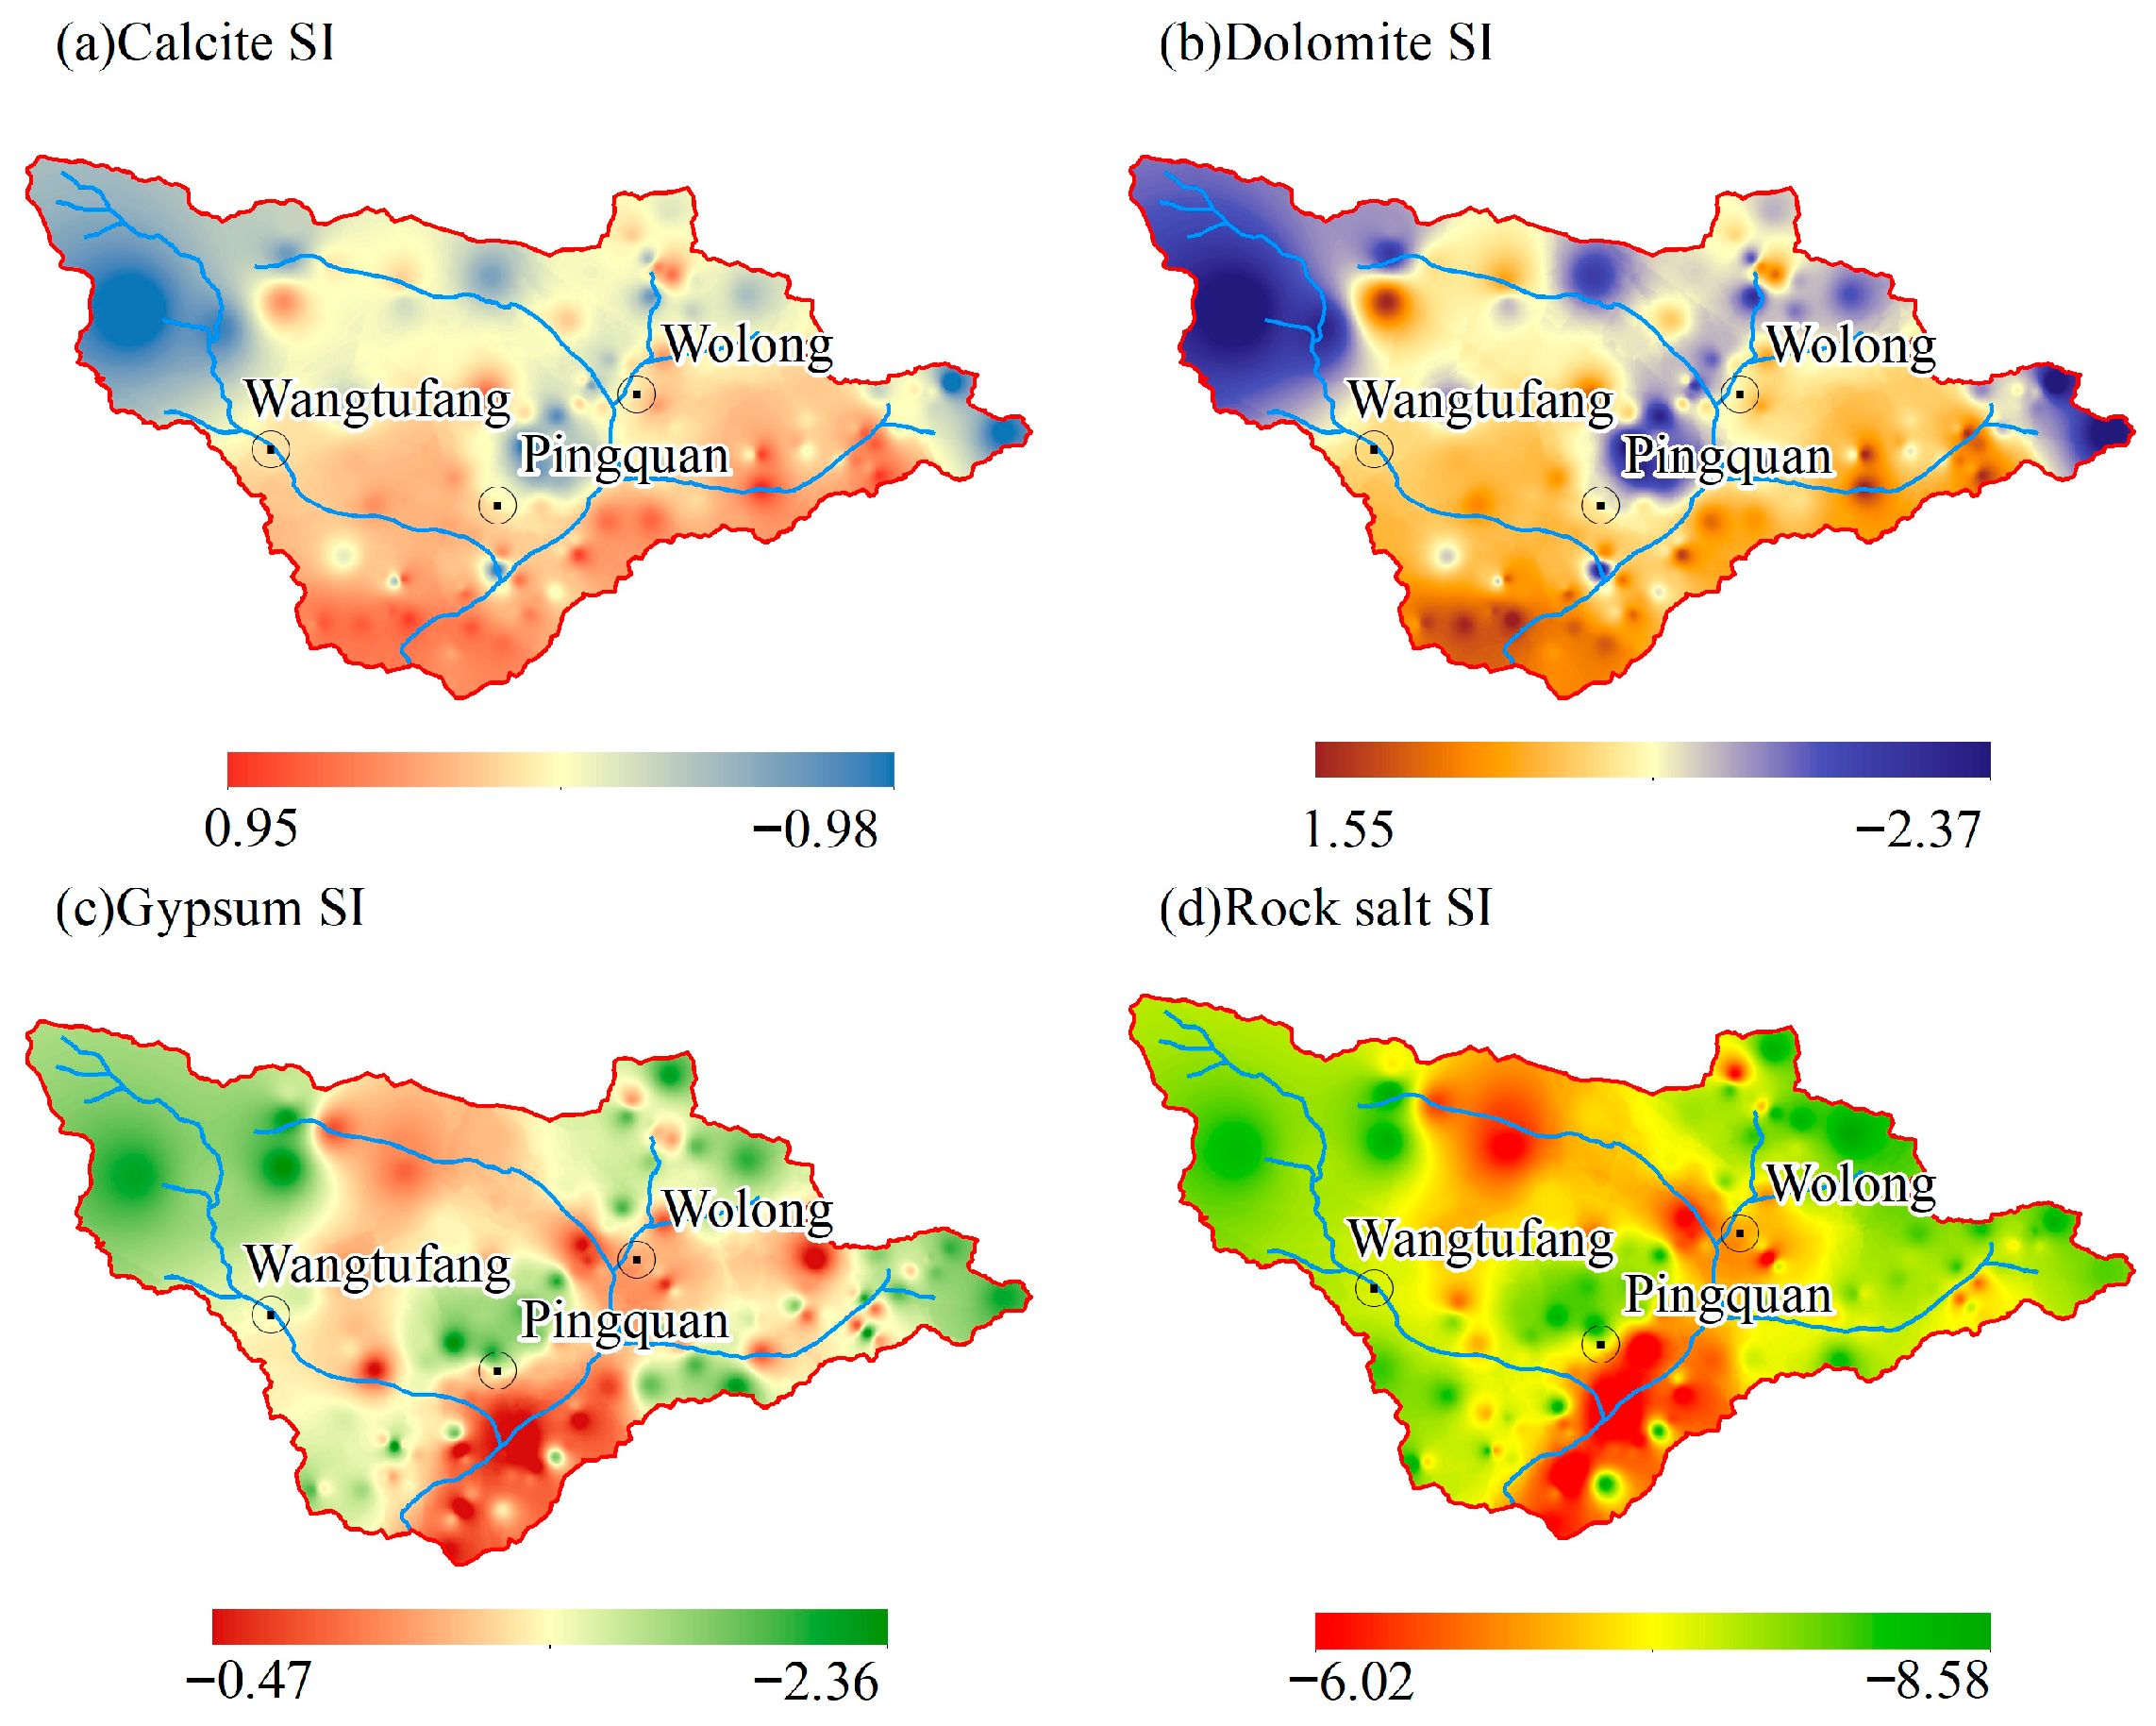
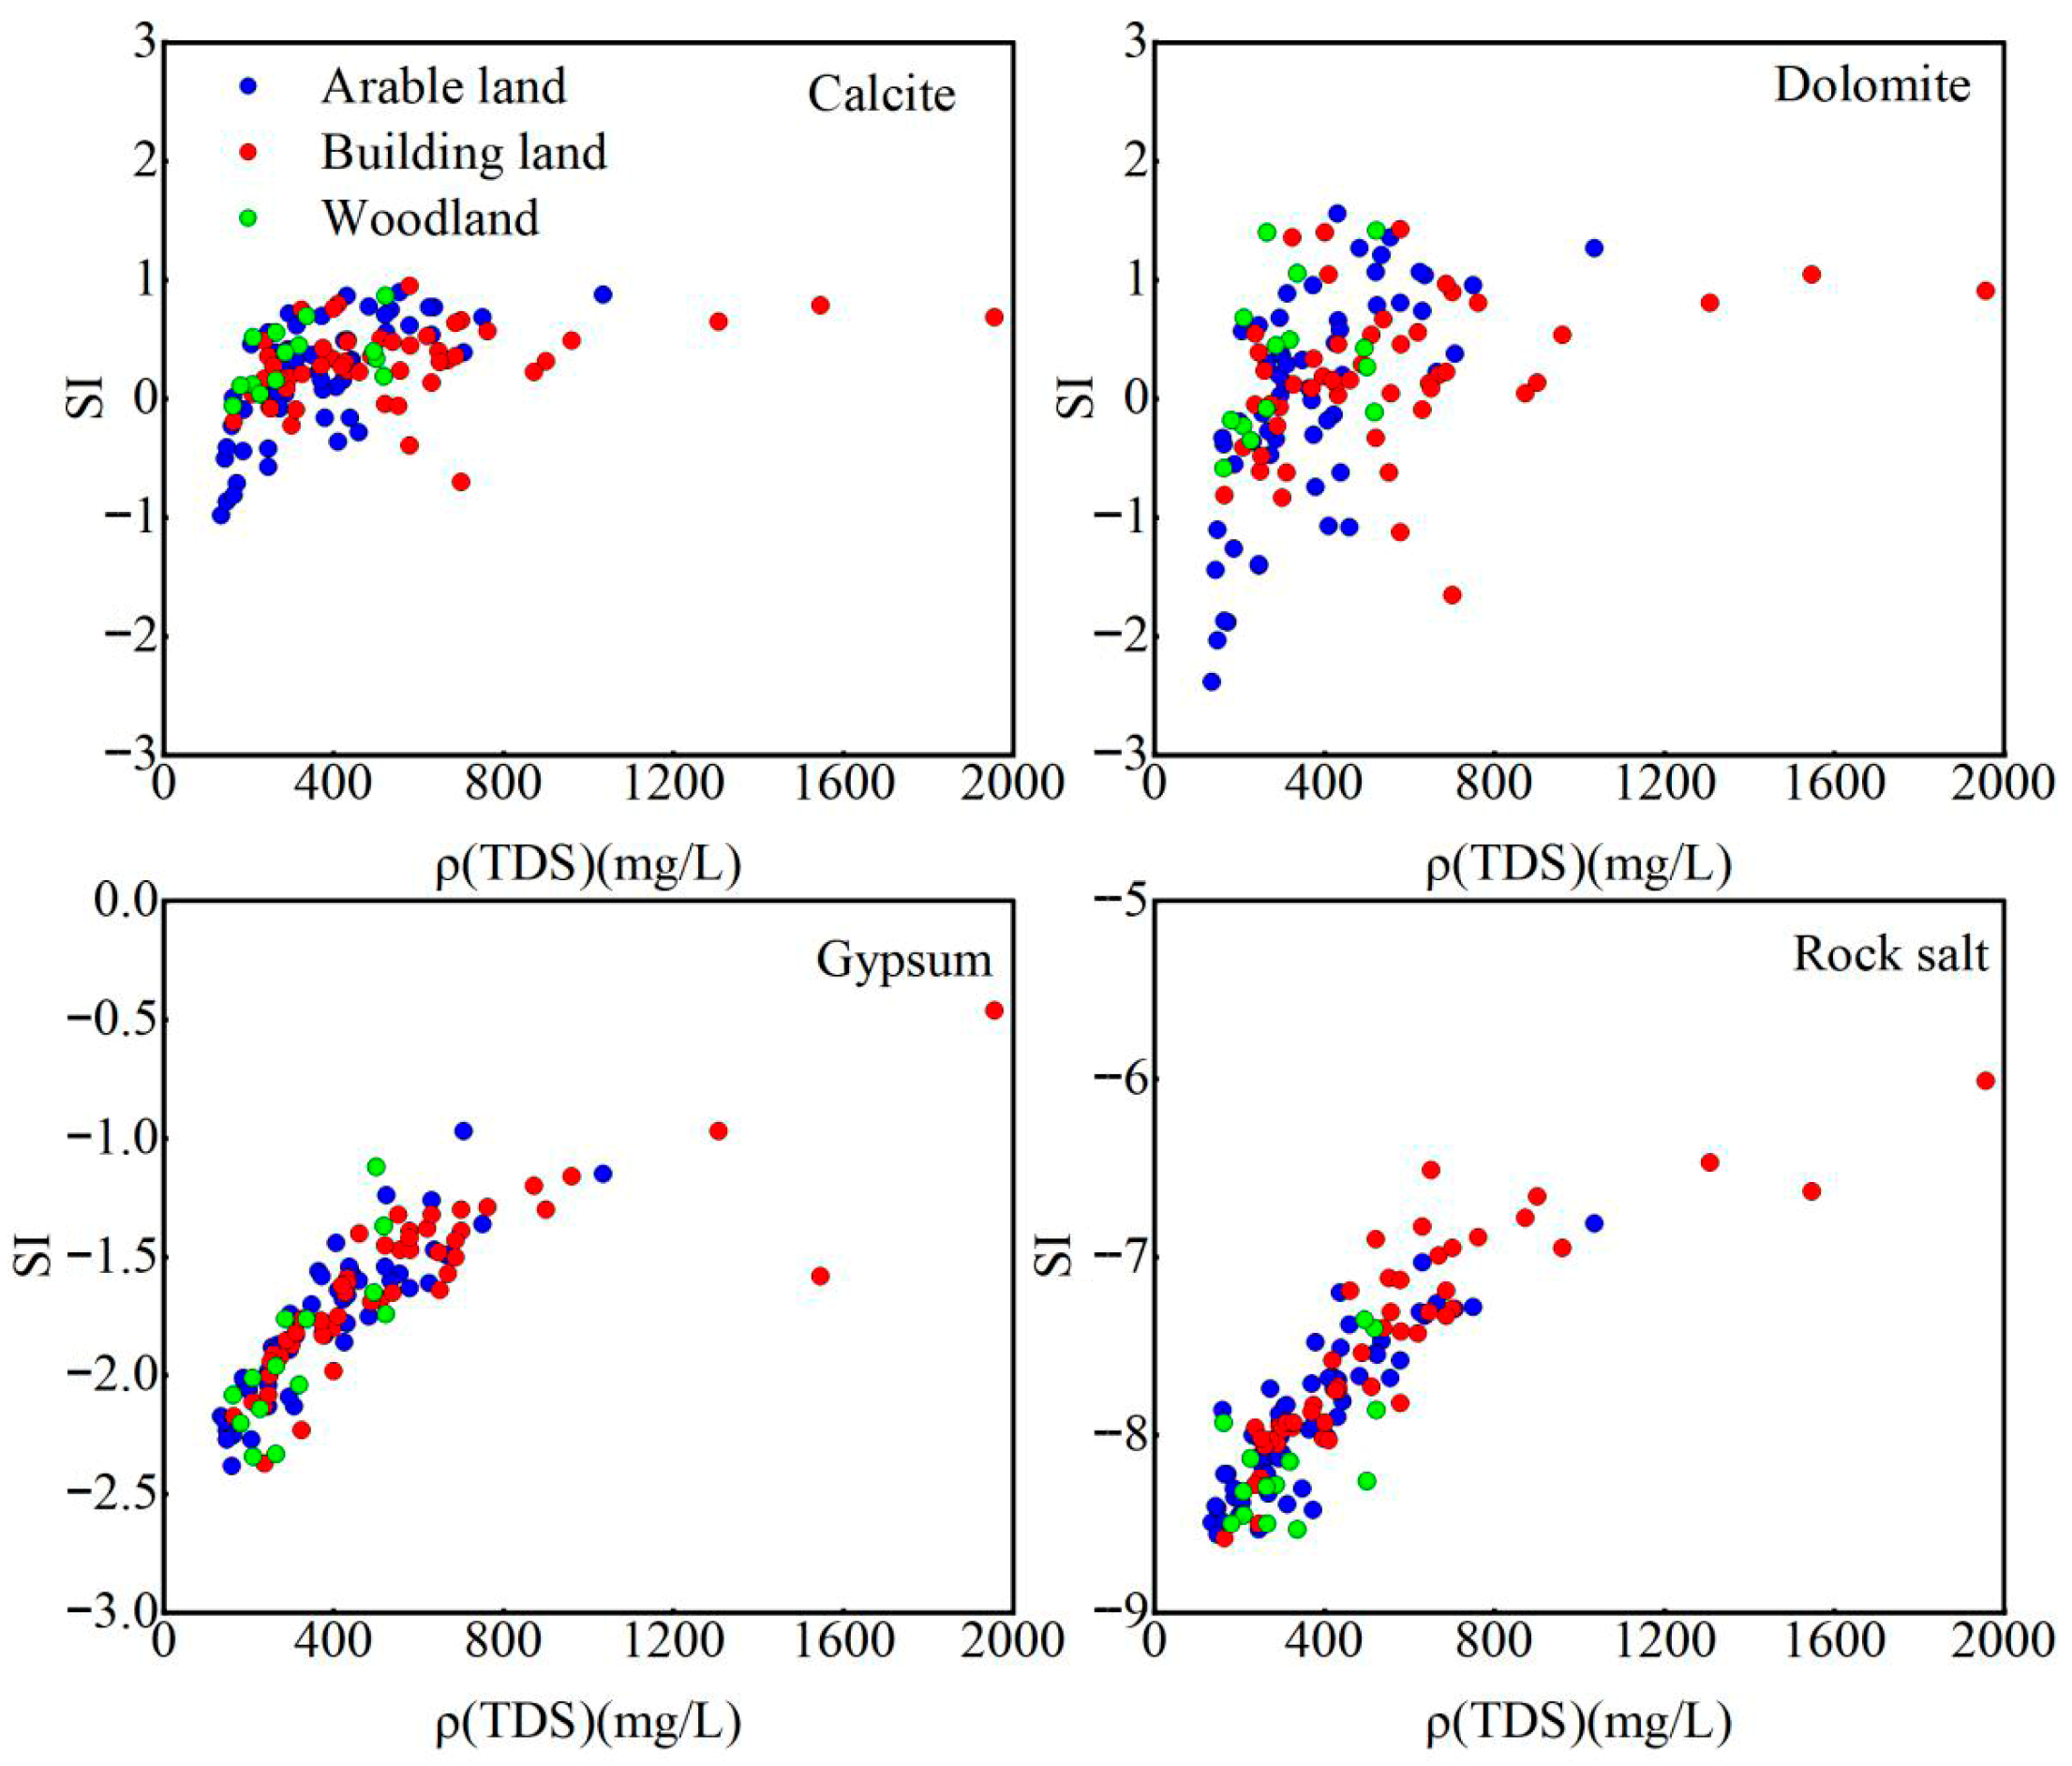
Analysis of the mineral saturation index (SI) allows assessment of the dissolution and precipitation conditions of minerals in the groundwater system [4]. When SI > 0, minerals are in a state of supersaturation and tend to precipitate. When SI < 0, minerals are undersaturated and tend to dissolve. SI = 0 indicates a dynamic equilibrium between dissolution and precipitation. As shown in Figure 10, the SI of calcite across the study region varied from −0.98 to 0.95, with a mean value of 0.25, while dolomite ranged from −2.38 to 1.56, with an average of 0.11. Both minerals have SI values near zero, indicating that calcite and dolomite are approximately in dynamic equilibrium. The SI of gypsum ranged from −2.38 to −0.46, averaging −1.7, and rock salt ranged from −8.58 to −6.01, averaging −7.8. The negative SI values for gypsum and rock salt indicate that these minerals are undersaturated and will continue to dissolve into the groundwater.
As shown in Figure 11, with increasing TDS (especially in high-TDS samples from Building land in the study area), the SI values of calcite and dolomite generally exhibit an upward trend, whereas gypsum and halite remain undersaturated under all TDS conditions. This comparison further confirms that the weathering and dissolution of carbonate rocks are the dominant factors controlling the hydrochemical composition of groundwater in this region. The persistent undersaturation of gypsum and halite precludes evaporites as the primary source of major ions, which is mutually corroborated by the results of the previous Gibbs diagram analysis.

3.3.6. Principal Component Analysis (PCA)

Principal Component Analysis (PCA), as one of the core methods of multivariate statistical analysis, exerts a vital influence on elucidating groundwater hydrochemical features and revealing their formation mechanisms [42]. Given the complex and diverse hydrochemical components of groundwater, and the frequent occurrence of multicollinearity between various water quality indicators, PCA can reduce dimensionality while retaining the maximum variability of the original data. It transforms multiple correlated hydrochemical variables into a few independent principal components. This method not only effectively reveals the dominant geochemical processes controlling the evolution of groundwater chemistry in the study area (such as rock mineral weathering, evaporation−concentration, and cation exchange), but also quantifies the contributions of natural geochemical background and human activities (such as agricultural fertilization, industrial emissions, and domestic wastewater) to water quality.
A total of 122 groundwater samples from the study area were subjected to PCA using SPSS. As presented in Table 2, the KMO value was above 0.6 and the significance level was below 0.05, indicating that PCA is suitable for the data. Two principal components, with eigenvalues greater than 1 and a total loading percentage of 68.942%, were extracted from the 11 groundwater indicators (Table 2).
PCA was applied to the 11 hydrochemical indicators of 122 groundwater samples from the study area, extracting two principal components whose eigenvalues exceeded 1, which collectively explained 68.942% of the total variance. The first principal component (PC1) explains 60.682% of the total variance and reflects the mixed controlling mechanism of regional groundwater mineralization and the “natural weathering–anthropogenic input” process. PC1 exhibits very high positive loadings on Ca2+, Mg2+, TH, and TDS (all > 0.92), and significant positive correlations with Cl, NO3, Na+, and SO42− (loadings > 0.65). Elevated loadings of Ca2+, Mg2+ and HCO3 reveal that bedrock dissolution and weathering processes, including limestone and dolomite, are the main natural origins of groundwater ions. However, the synchronous enrichment of NO3 and Cl with TDS suggests that, beyond natural geochemical background, extensive human activities—such as agricultural fertilizer application and infiltration of domestic sewage—have led to the accumulation of nitrate and chloride during groundwater flow. This process drives groundwater chemistry from natural background conditions toward higher mineralization, making PC1 the dominant factor influencing the chemical evolution and water quality security of the region.
The second principal component (PC2) accounts for 12.818% of the total variance and highlights the specific effects of localized agricultural fertilization on groundwater chemistry and acid–base balance. PC2 has the highest positive loading on K+ (0.753), accompanied by positive loadings on SO42− (0.514) and Na+ (0.538), while showing a significant negative correlation with pH (−0.668). This “high K+, high SO42−, low pH” pattern strongly indicates the influence of acidic fertilizers, such as potassium sulfate, where H+ is released into the soil–groundwater system during K+ uptake by crops, causing localized acidification and explaining the negative pH loading. The positive loadings of Na+ and SO42− may also reflect dissolution of evaporite minerals or cation exchange. The presence of PC2 demonstrates that, in addition to general non-point source pollution, specific agricultural management practices locally alter groundwater ion ratios and acid–base conditions, serving as a secondary but important driver of groundwater chemical evolution in water source conservation areas.

3.3.7. Impact of Human Activities

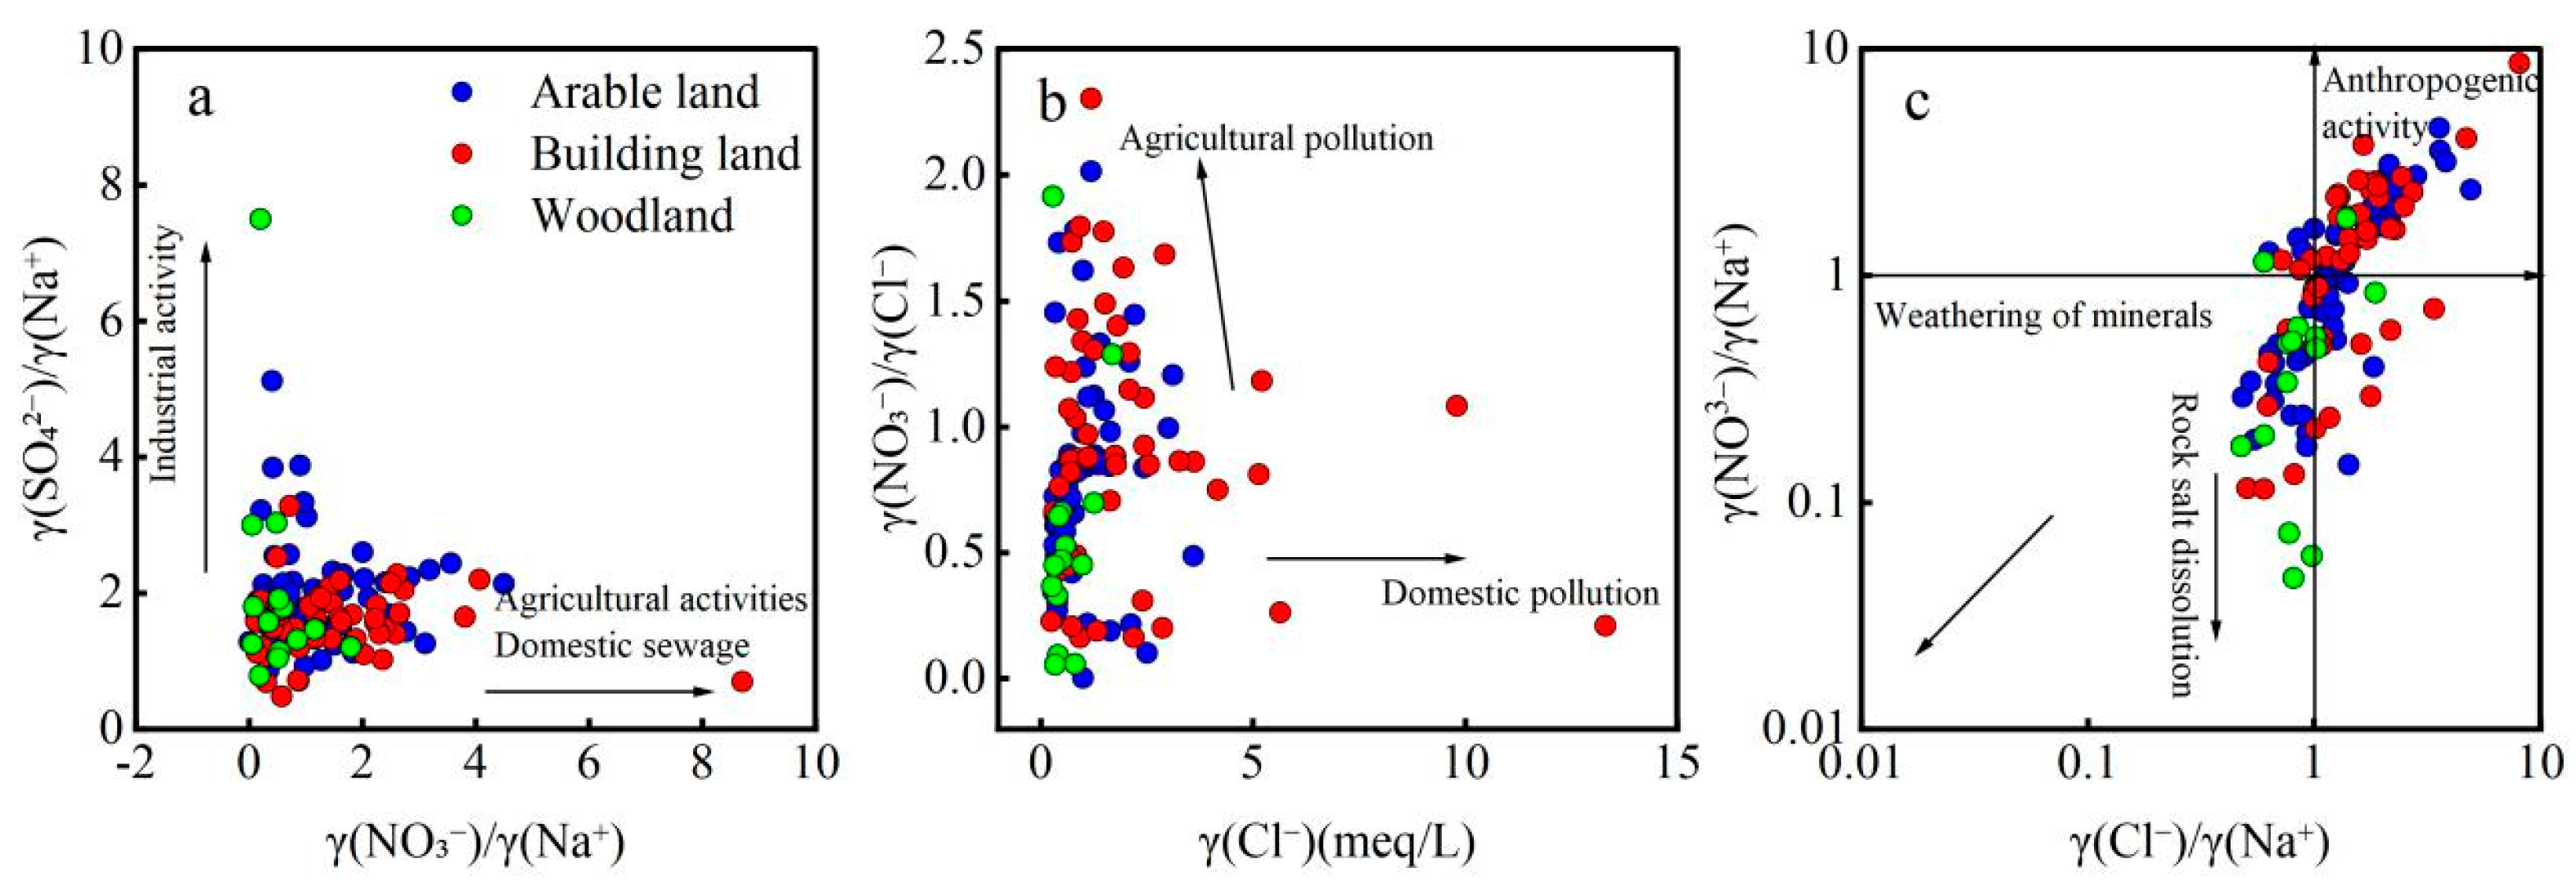
As socioeconomic development progresses, anthropogenic activities including industrial production, agricultural cultivation and mineral mining have emerged as major drivers altering groundwater hydrochemical signatures. This is primarily reflected in changes in ion concentrations, including SO42−, Cl, NO3, and Na+ [43]. SO42− is commonly used as a tracer for mining activities, whereas Cl, NO3, and Na+ typically indicate agricultural activities and domestic sewage inputs. The ratio of γ(SO42−)/γ(Na+) to γ(NO3)/γ(Na+) can be used to qualitatively distinguish the impacts of different human activities on groundwater chemistry. Generally, higher γ(NO3)/γ(Na+) values indicate a greater influence from agriculture and domestic wastewater, while higher γ(SO42−)/γ(Na+) values reflect the influence of mining activities.
As shown in Figure 12a, shallow groundwater in arable and urban construction areas exhibits higher γ(NO3)/γ(Na+) values, indicating significant impacts from agricultural practices and domestic wastewater. The high-value points are mainly concentrated in the primary agricultural zones along both sides of the river valley and around the main urban area of Pingshuan City, reflecting the effects of fertilizer use and urban sewage discharge. Only a few points exhibit elevated γ(SO42−)/γ(Na+) values, suggesting localized influence from mining activities. Several metal mines are present in the upper reaches of the Puhe River Basin in Pingquan City, indicating that mining has contributed to increased γ(SO42−)/γ(Na+) values at specific groundwater sampling points.
The correlation between γ(NO3)/γ(Cl) and γ(Cl) (meq/L) can provide further insight into the intensity of human impacts on groundwater. As shown in Figure 12b, most sampling points in construction and arable lands fall within the range indicative of agricultural pollution, characterized by low γ(Cl) (meq/L) and high γ(NO3)/γ(Cl) values. These sampling wells are predominantly located in rural areas, suggesting that shallow groundwater in the construction and arable lands of the study area is strongly influenced by agricultural fertilization.
In general, higher γ(Cl)/γ(Na+) and γ(NO3)/γ(Na+) ratios in groundwater indicate a stronger influence of human activities on its chemical composition [44]. As shown in Figure 12c, groundwater from construction and arable lands in the study area is primarily distributed in zones with elevated γ(Cl)/γ(Na+) and γ(NO3)/γ(Na+) values. In contrast, groundwater from forested areas is mainly found in regions with lower γ(Cl)/γ(Na+) and γ(NO3)/γ(Na+) values. This indicates that anthropogenic interference markedly affects groundwater quality in construction and arable lands, while its influence on forested areas is minimal, consistent with previous observations.

3.4. Comprehensive Evaluation of the Groundwater Quality

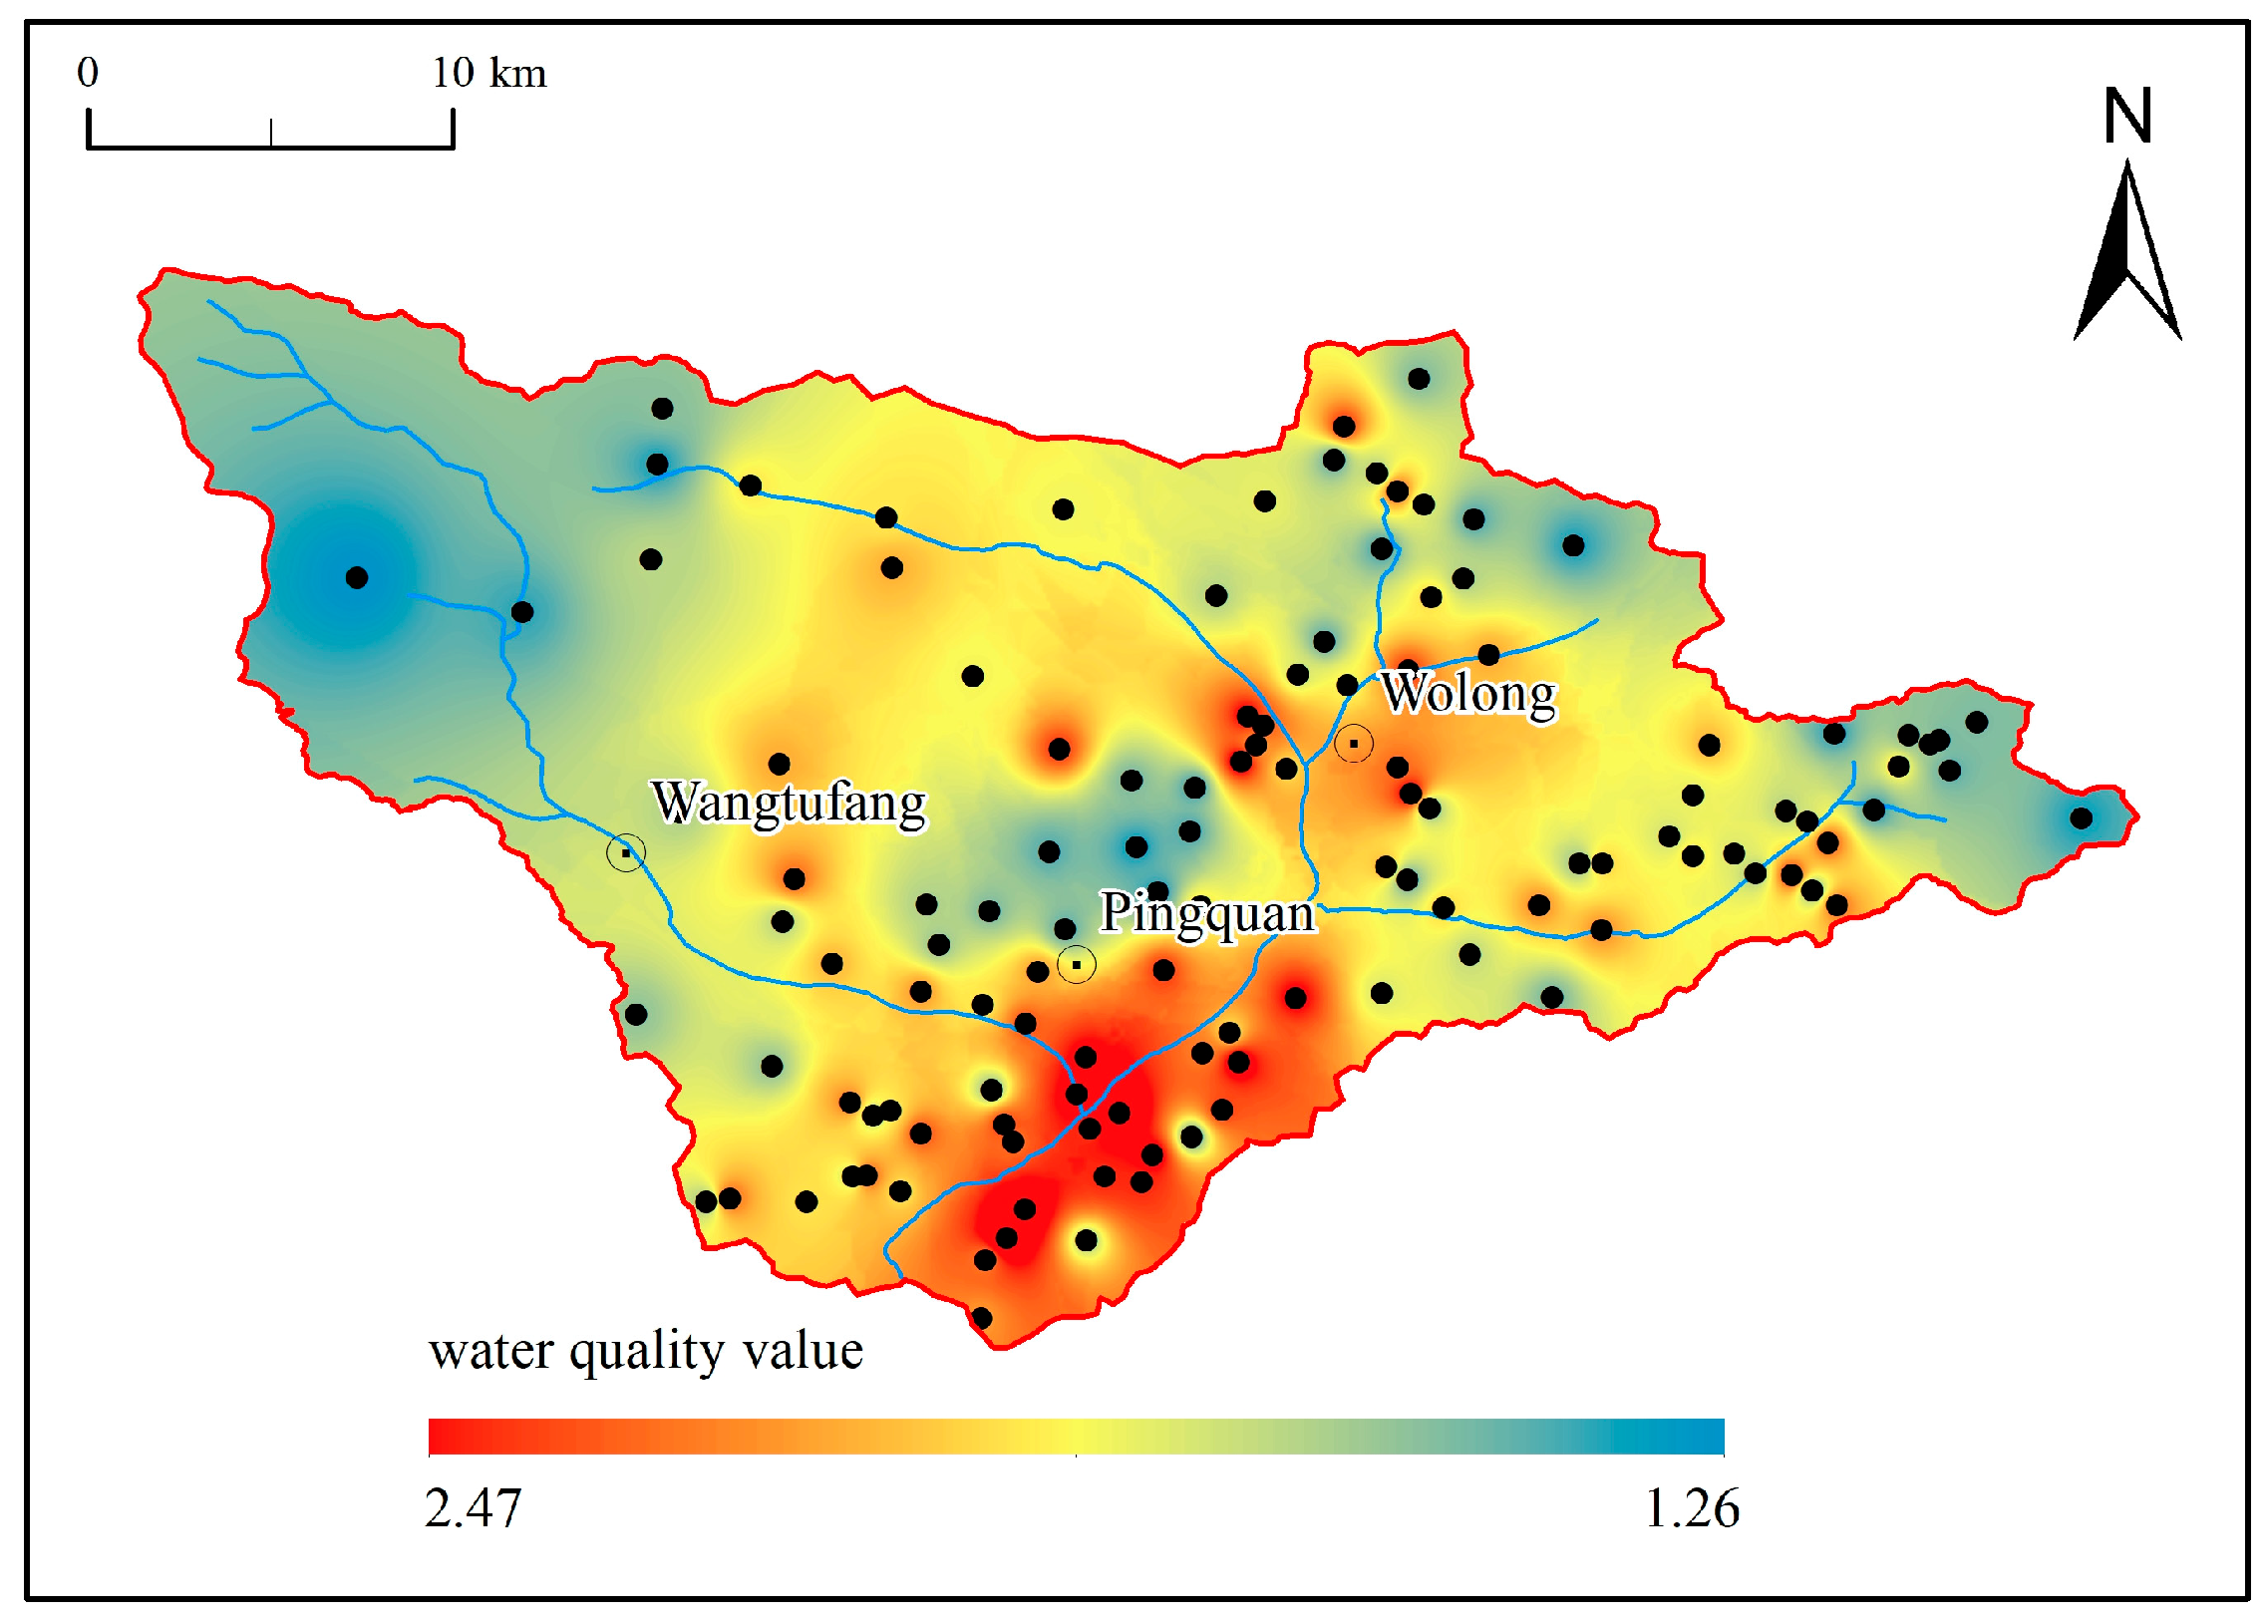
A comprehensive assessment of groundwater quality in the study area was conducted using the VFPR model. Twelve parameters, including pH, TDS, TH, Cl, SO42−, NO3, NO2, NH3-N, COD, F, Hg, and As, were selected for the evaluation. The evaluation procedure and calculation steps follow the methodology described in the literature [18], and the classification of evaluation index grades is presented in Table 3. The results were visualized in ArcGIS 10.8 using the inverse distance weighting (IDW) interpolation method, as shown in Figure 13.
The results indicate that shallow groundwater in the Puhe River Basin is generally of good quality, with values ranging from 1.26 to 2.47 and an average of 1.72. Groundwater in forested areas exhibited the highest quality, with an average value of 1.45, and all complied with the Grade II water quality criteria. In contrast, the average groundwater quality values in arable and construction lands were 1.55 and 1.83, respectively, with some sampling points exceeding the Class II standard. Analysis of the evaluation parameters revealed that elevated nitrate levels were the primary contributor to reduced water quality, with approximately 30% of the samples exceeding the Class III water quality standard. The elevated nitrate levels were primarily attributed to excessive fertilizer use in agricultural activities and the discharge of untreated or inadequately treated domestic wastewater. It is recommended to strengthen the management of fertilizer application in agricultural activities, promote the use of organic fertilizers, and improve the treatment of domestic wastewater to mitigate nitrate contamination. These measures could help improve groundwater quality and prevent further deterioration in the future.

4. Conclusions

4.1. Overall Groundwater Characteristics and Hydrochemical Types

Shallow groundwater across the investigated region is overall weakly alkaline in nature, fresh, and hard, although significant differences exist among different land-use types. Groundwater in forested land exhibits relatively stable hydrochemical characteristics with lower TDS and TH values, whereas groundwater in construction land shows higher TDS and TH due to the influence of urbanization and domestic wastewater. Groundwater in arable land presents intermediate characteristics. The major hydrochemical types are HCO3–Ca and HCO3·SO42−–Ca facies, reflecting the combined effects of topography and anthropogenic activities.

4.2. Analysis of Controlling Factors

Groundwater hydrochemistry is primarily controlled by rock weathering, particularly the dissolution of silicate and carbonate minerals, which supply major ions such as Ca2+, Mg2+, and HCO3. Meanwhile, anthropogenic activities significantly affect groundwater composition in arable and construction lands, mainly through agricultural fertilization and domestic sewage discharge, leading to elevated NO3 concentrations.

4.3. Correlation and Principal Component Analysis

The PCA extracted two principal components, which cumulatively explained 68.942% of the total variance. The first principal component (PC1) represents groundwater mineralization and the combined influence of natural weathering and anthropogenic inputs, accounting for the majority of variance. The second principal component (PC2) reflects the impact of agricultural fertilization on groundwater chemical composition and acid–base balance. These results quantitatively demonstrate that groundwater evolution is jointly controlled by natural geochemical processes and human activities.

4.4. Water Quality Assessment and Management Implications

Groundwater quality across the study area is generally satisfactory, with the highest quality observed in forested land. However, groundwater in some arable and construction areas shows localized deterioration, primarily due to elevated NO3 concentrations. It is therefore recommended to implement precision fertilization practices, strengthen agricultural runoff management, enhance domestic sewage collection and treatment, and implement a long-term groundwater monitoring scheme centered on NO3 pollution indicators. These measures will support the sustainable management and protection of groundwater resources in the water conservation area.

Author Contributions

Conceptualization, W.L. and S.H.; Methodology, W.L., H.A., J.L. and X.L.; Software, W.L.; Validation, J.Y. and Z.L.; Formal analysis, W.L. and S.H.; Investigation, W.L., X.L. and J.Y.; Resources, J.L.; Data curation, W.L. and X.L.; Writing—original draft, W.L. and X.L.; Writing—review & editing, W.L. and J.L.; Visualization, W.L. and S.H.; Supervision, X.L.; Project administration, W.L. and J.L.; Funding acquisition, S.H. and J.L. All authors have read and agreed to the published version of the manuscript.

Funding

This research was funded by the Science and Technology Innovation Foundation of Comprehensive Survey & Command Center for Natural Resources (No. KC20240003), Open Funding Project of the Key Laboratory of Groundwater Sciences and Engineering, Ministry of Natural Resources (No. SK202301−4), Geological Survey Projects of the China Geological Survey (Grant Nos. DD20230701103 and DD20251300106), Yanzhao Shanshui Science and Innovation Fund of Langfang Integrated Natural Resources Survey Center, China Geological Survey (No. YZSSJJ202401−001), Hydrogeological and Water Resources Investigation in Key Areas of the Upper Reaches of the Hutuo River (DD202605102003).

Institutional Review Board Statement

Not applicable.

Informed Consent Statement

Not applicable.

Data Availability Statement

All original research findings reported in this study are included in the manuscript. Readers may contact the corresponding author for any further questions.

Acknowledgments

The authors sincerely acknowledge the technical assistance offered by the “Laboratory of the Fourth Geological Brigade, Hebei Bureau of Geology and Mineral Exploration and Development” during the process of sample testing and analysis.

Conflicts of Interest

The authors confirm that there are no competing interests.

References

  1. Zineb, A.; Meriem, L. Formation mechanism of hydrochemical and quality evaluation of shallow groundwater in the Upper Kebir sub-basin, Northeast Algeria. J. Groundw. Sci. Eng. 2014, 12, 78–91. [Google Scholar] [CrossRef]
  2. Qasemi, M.; Farhang, M.; Biglari, H.; Afsharnia, M.; Ojrati, A.; Khani, F.; Samiee, M.; Zarei, A. Health risk assessments due to nitrate levels in drinking water in villages of Azadshahr, northeastern Iran. Environ. Earth Sci. 2018, 77, 782. [Google Scholar] [CrossRef]
  3. Yang, Y.; Xu, W.; Chen, J.; Chen, Q.; Pan, Z. Hydrochemical Characteristics and Groundwater Quality Assessment in the Diluvial Fan of Gaoqiao, Emei Mountain, China. Sustainability 2018, 10, 4507. [Google Scholar] [CrossRef]
  4. Liu, H.; Wei, W.; Song, Y.; Xu, J.; Guan, Z.-T.; Huang, J.-M.; Zhao, G.-H. Hydrochemical characteristics, controlling factors and water quality evaluation of shallow groundwater in the Tanlu Fracture Zone (Anhui Section). Environ. Sci. 2024, 45, 2665–2677. [Google Scholar] [CrossRef]
  5. Li, S.-J.; Han, X.; Wang, W.-H.; Li, Z. Hydrochemical characteristics and controlling factors of surface water groundwater in the Wuding River Basin. Environ. Sci. 2022, 43, 220–229. [Google Scholar] [CrossRef]
  6. Yang, L.; Zhang, Y.; Wen, X.; Pei, L.; Liu, P. Characteristics of groundwater urban emergency water sources optimazation in Luoyang China. J. Groundw. Sci. Eng. 2020, 8, 298–304. [Google Scholar] [CrossRef]
  7. Gong, Y.; Gong, X.; Xu, S.; Tang, X.; Su, D.; Wu, X. Chemical characteristics and evolutionary analysis of groundwater in Southern Jiangsu. Geol. Rev. 2020, 68, 2207–2218. [Google Scholar] [CrossRef]
  8. Kou, Y.; Hua, K.; Li, Z.; Li, Z. Hydrochemical characteristics of surface water groundwater and its controlling factors in the tributaries of Jinghe River. Environ. Sci. 2018, 39, 3142–3149. [Google Scholar] [CrossRef]
  9. Yang, Q.; Li, Z.; Ma, H.; Wang, L.; Martin, G. Identification of the hydrogeochemical processes and assessment of groundwater quality using classic integrated geochemical methods in the Southeastern part of Ordos Basin, China. Environ. Pollut. 2016, 218, 879–888. [Google Scholar] [CrossRef] [PubMed]
  10. Wang, Y.; Liu, Z.; Yang, J.; Wang, J.; Zhang, L.; Tan, Y.; Xiang, D. Hydrochemical Characteristics and Genetic Analysis of Groundwater in Zhanjiang City, Guangdong Province, South China. Water 2025, 17, 698. [Google Scholar] [CrossRef]
  11. Hyeroba, E.N.; Kalin, R.M.; Mukwaya, C. Hydrochemical and Isotopic Characterization of Groundwater in the Nakivale Sub-Catchment of the Transboundary Lake Victoria Basin, Uganda. Water 2024, 16, 3394. [Google Scholar] [CrossRef]
  12. Yan, Y.; Shi, H.; Miao, Q.; Zhao, Y.; Nie, X.; Li, Z.; Pan, M.; Feng, W. Evolution of chemical characteristics and irrigation suitability of groundwater in arid and semi-arid regions. Agric. Water Manag. 2025, 311, 109361. [Google Scholar] [CrossRef]
  13. Shiretorova, V.G.; Nikitina, E.P.; Bazarsadueva, S.V.; Taraskin, V.V.; Budaeva, O.D.; Nimbueva, N.B.; Shirapova, G.S.; Pintaeva, E.T.; Zhigzhitzhapova, S.V.; Radnaeva, L.D.; et al. Current State of Lake Kotokel (Eastern Cisbaikalia, Russia): Hydrochemical Characteristics, Water Quality, and Trophic Status. Water 2025, 17, 545. [Google Scholar] [CrossRef]
  14. Lu, L.; Wang, Z.; Wang, Z. Chemical characteristics water quality assessment of groundwater in the Dongjiang-Hanjiang River Basin, China. J. Environ. Chem. Eng. 2024, 12, 114721. [Google Scholar] [CrossRef]
  15. Yu, N.; Han, Y.; Liu, G.; Zhuang, F.; Wang, Q. The Hydrochemical Characteristics Evolution and Driving Factors of Shallow Groundwater in Luxi Plain. Sustainability 2025, 17, 6432. [Google Scholar] [CrossRef]
  16. Ba, J.; Dan, Y.; Luo, F.; Tang, C.; Peng, C. Seasonal Differences in the Hydrochemical Characteristics of Karst Wetlands and the Associated Mechanisms in Huixian, China. Water 2022, 14, 2362. [Google Scholar] [CrossRef]
  17. Gao, M.; Li, X.; Qian, J.; Wang, Z.; Hou, X.; Gui, C.; Bai, Z.; Fu, C.; Li, J.; Zuo, X. Hydrochemical Characteristics and Controlling Factors of Shallow and Deep Groundwater in the Heilongdong Spring Basin, Northern China. Sustainability 2023, 15, 15447. [Google Scholar] [CrossRef]
  18. Hu, S.; Liu, W.; Liu, J.; Wang, J.; Yang, J.; Li, Z.; Tang, Z.; Wang, G.; Yu, T. Evaluation of water quality and water resources carrying capacity using a varying fuzzy pattern recognition model: A case study of small watersheds in Hilly Region. J. Groundw. Sci. Eng. 2025, 13, 386–405. [Google Scholar] [CrossRef]
  19. Wang, T.; Xu, S. Dynamic successive assessment method of water environment carrying capacity and its application. Ecol. Indic. 2015, 52, 134–146. [Google Scholar] [CrossRef]
  20. Wen, J.; Wang, W.; Ji, D.; Du, Y.; Wang, F.; Ma, Z. Spatial variability of vertical hydraulic conductivity of riverbed sediments in the middle and lower reaches of the Luan River in China. J. Hydrol. 2025, 58, 102318. [Google Scholar] [CrossRef]
  21. Cao, Z.; Shen, M.; Chen, Q.; Liu, J.; Yan, G.; Wang, M.; Zhao, X. Multimedia and spatial distribution, internal accumulation and source diagnostics of polycyclic aromatic hydrocarbons (PAHs) of the Luan River Basin, China. Ecol. Indic. 2018, 38, 1–12. [Google Scholar] [CrossRef]
  22. Yang, N.; Zhang, T.; Li, J.; Feng, P.; Yang, N. Landscape ecological risk assessment and driving factors analysis based on optimal spatial scales in Luan River Basin, China. Ecol. Indic. 2024, 169, 112821. [Google Scholar] [CrossRef]
  23. GB/T 14848-2017; China’s Groundwater Quality Standard. Standardization Administration of China (SAC): Beijing, China, 2017.
  24. Li, X.; Wang, R.; Li, J. Study on hydrochemical characteristics formation mechanism of shallow groundwater in eastern Songnen Plain. J. Groundw. Sci. Eng. 2018, 6, 161–170. [Google Scholar] [CrossRef]
  25. Wei, H.; Liang, X.; Liu, S.; Liu, M.; Xiao, C. Hydrochemical Evolution of Groundwater in Dehui, China. Water 2020, 12, 3378. [Google Scholar] [CrossRef]
  26. Jiang, W.; Li, B.; Zhang, Z.; Zhang, Y. Hydrochemical Characteristics, Controlling Factors and Groundwater Sources of Zaozigou Gold Mine. Sustainability 2024, 16, 7989. [Google Scholar] [CrossRef]
  27. Yin, Z.; Lin, Q.; Xu, S. Analysis of spatial and temporal evolution of groundwater hydrochemistry and influencing factors in Dagu River Basin, Qingdao. Geol. Rev. 2018, 64, 1030–1043. [Google Scholar] [CrossRef]
  28. Liang, C.; Wang, W.; Ke, X.; Ou, A.; Wang, D. Hydrochemical Characteristics and Formation Mechanism of Strontium-Rich Groundwater in Tianjiazhai, Fugu, China. Water 2022, 14, 1874. [Google Scholar] [CrossRef]
  29. Hao, S.; Qian, Y.; Zhen, S.; Guo, C.; Yue, C.; Liu, W.; Yuan, G.; Chen, W. Hydrochemical Characteristics and Formation Mechanisms of Waters in the Xianglaqu Basin, a Typical Endorheic Basin of the Tibetan Plateau. Water 2026, 18, 1180. [Google Scholar] [CrossRef]
  30. Selvakumar, S.; Chandrasekar, N.; Kumar, G. Hydrogeochemical characteristics and groundwater contamination in the rapid urban development areas of Coimbatore, India. Water Resour. Ind. 2017, 17, 26–33. [Google Scholar] [CrossRef]
  31. Ismail, A.H.; Shareef, M.A.; Mahmood, W. Hydrochemical characterization of groundwater in Balad district Salah Al-Din Governorate Iraq. J. Groundw. Sci. Eng. 2018, 6, 306–322. [Google Scholar] [CrossRef]
  32. Marandi, A.; Shand, P. Groundwater chemistry and the Gibbs Diagram. Appl. Geochem. 2018, 97, 97209–97212. [Google Scholar] [CrossRef]
  33. Zhai, T.; Zhang, Q.; Wang, L.; Wang, H. Temporal spatial variations hydrochemical components driving factors in Baiyangdian Lake in the Northern Plain of China. J. Groundw. Sci. Eng. 2024, 12, 293–308. [Google Scholar] [CrossRef]
  34. Guo, L.; Ding, Y.; Fang, H.; An, C.; Jiang, W.; Yang, N. Integrating Inverse Modeling to Investigate Hydrochemical Evolution in Arid Endorheic Watersheds: A Case Study from the Qaidam Basin, Northwestern China. Water 2025, 17, 2074. [Google Scholar] [CrossRef]
  35. Masoud, A.M.; Abu El-Magd, S.A. Integration of hydrochemical and isotopic characteristics for identifying groundwater recharge sources of the Eocene carbonate aquifer, Western Desert, Egypt. J. Afr. Earth Sci. 2022, 187, 104449. [Google Scholar] [CrossRef]
  36. Jing, T.; Qu, C.; Wang, M.; Sun, Y.; Hu, B.; Chu, J. Analysis on temporal spatial variations of groundwater hydrochemical characteristics in the past decade in southern plain of Beijing China. J. Groundw. Sci. Eng. 2017, 5, 235–248. [Google Scholar] [CrossRef]
  37. Zhou, J.; Li, B.; He, M.; Jiao, J.; Tang, Z.; Li, Z. Hydrochemical Characteristics and Sources of Lithium in Carbonate-Type Salt Lake in Tibet. Sustainability 2023, 15, 16235. [Google Scholar] [CrossRef]
  38. Li, X.; Li, J. Hadrochemical Characteristics and Influencing Factors of Shallow Groundwaterin the Middle and Lower Reaches of the Dawen River Basin. Res. Environ. Sci. 2024, 37, 1015–1026. [Google Scholar] [CrossRef]
  39. Guo, Y.; Zhang, C.; Xiao, Q.; Bu, H. Hydrogeochemical characteristics of a closed karst groundwater basin in North, China. J. Radioanal. Nucl. Chem. 2020, 325, 365–379. [Google Scholar] [CrossRef]
  40. Liu, F.; Song, X.; Yang, L.; Zhang, D.; Han, D.; Ma, Y.; Bu, H. Identifying the origin and geochemical evolution of groundwater using hydrochemistry and stable isotopes in the Subei Lake Basin, Ordos energy base, Northwestern China. Hydrol. Earth Syst. Sci. 2015, 19, 551–565. [Google Scholar] [CrossRef]
  41. Zheng, T.; Jiao, T.; Hu, B.; Gong, J.; Hu, X.; Wang, H. Analysis of groundwater chemical characteristics and their causes in the central part of the Eddy River basin. Environ. Sci. 2021, 42, 766–775. [Google Scholar] [CrossRef]
  42. Chen, H.; Guo, L.; Li, J.; Lin, X.; Zhang, T.; Zhang, Q. Chemical Characterization of Shallow Groundwater in Northern Henan Plain based on Multivariate Statistical Analysis. Earth Environ. 2024, 52, 386–396. [Google Scholar] [CrossRef]
  43. Lü, J.; An, Y. Hydrochemical Characteristics and Risk Assessment of Tongzi River, Guizhou Province, Southwest China. Water 2023, 15, 802. [Google Scholar] [CrossRef]
  44. Liu, J.; Peng, Y.; Li, C.; Gao, Z.; Chen, S. Characterization of the hydrochemistry of water resources of the Weibei Plain, Northern China, as well as an assessment of the risk of high groundwater nitrate levels to human health. Environ. Pollut. 2021, 268, 115947. [Google Scholar] [CrossRef] [PubMed]
Figure 1. Hydrogeological Sketch Map and Sampling Point Locations in the Study Area.
Sustainability 18 05048 g001
Figure 2. Box line diagram of groundwater chemistry parameters in the study area.
Sustainability 18 05048 g002
Figure 3. Spatial distribution of concentrations of chemical parameters in shallow groundwater in the study area.
Sustainability 18 05048 g003
Figure 4. Piper’s trilinear map of shallow groundwater in the study area.
Sustainability 18 05048 g004
Figure 5. Correlation of major ions in groundwater in the study area. Note: The concentrations of K+, Na+, Ca2+, Mg2+, Cl, SO42−, HCO3, NO3, total hardness (TH), and total dissolved solids (TDS) are indicated. A * denotes that the correlation coefficients are significant at the 0.05 level, and ** indicates significance at the 0.01 level. The correlation coefficients are represented by ellipses, with the shape indicating the strength of the correlation. A more elongated ellipse suggests a stronger correlation, while a more circular ellipse indicates a weaker correlation. Leftward-skewed ellipses indicate a positive correlation, while rightward-skewed ellipses suggest a negative correlation.
Sustainability 18 05048 g005
Figure 6. Gibbs plot for shallow groundwater within the study area.
Sustainability 18 05048 g006
Figure 7. Groundwater γ(Mg2+)/γ(Na+), γ(HCO3)/γ(Na+) and γ(Ca2+)/γ(Na+) relationships.
Sustainability 18 05048 g007
Figure 8. Relationship between major ion ratios of groundwater in the study area.
Sustainability 18 05048 g008
Figure 9. Alternate adsorption of water chemistry cations and chlor−alkali index in the study area.
Sustainability 18 05048 g009
Figure 10. Mineral saturation index (SI) map of the study area.
Sustainability 18 05048 g010
Figure 11. Spatial distribution map of mineral saturation index (SI) in the study area.
Sustainability 18 05048 g011
Figure 12. Study area γ(SO42−)/γ(Na+) versus γ(NO3−)/γ(Na+), γ(NO3−)/γ(Cl−) versus γ(Cl−)(meq/L), and γ(Cl−)/γ(Na+) versus γ(NO3−)/γ(Na+).
Sustainability 18 05048 g012
Figure 13. Groundwater quality in the study area.
Sustainability 18 05048 g013
Table 1. The statistical results of groundwater chemical parameters of different land use types in the study area.
ItemK+Na+Ca2+Mg2+ClSO42−HCO3NO3TDSTHpH
plow landMIN0.418.5023.784.6710.2824.7042.310.20134.0085.577.00
MAX8.2156.93223.9232.90127.62285.24455.18232.061034.00693.208.10
AV1.8417.3681.1515.1037.5468.80181.4355.56370.07264.627.62
SD1.639.3240.407.2327.2543.7976.1452.46179.82127.350.26
CV0.890.540.500.480.730.640.420.940.490.480.03
building landMIN0.419.2037.326.468.5017.29110.883.44164.00120.716.90
MAX5.3990.59422.4367.87471.48621.10449.35657.961956.001334.258.00
AV1.8327.45116.6419.8873.8190.76210.84108.34545.40372.727.53
SD1.2019.0071.6510.7583.9688.0764.92114.50336.99220.160.23
CV0.660.690.610.541.140.970.311.060.620.590.03
woodlandMIN0.099.3834.977.349.5721.40134.221.18162.00134.507.30
MAX2.7133.84133.3830.1259.56235.02519.37134.08522.00446.618.20
AV1.2115.2773.3815.0521.9863.44214.8124.99320.50245.117.71
SD0.687.1130.537.2814.7856.03101.6534.58132.5994.650.22
CV0.560.470.420.480.670.880.471.380.410.390.03
Note: pH is a dimensionless parameter, while all other indicators are expressed in mg/L.
Table 2. Rotated Component Matrix.
IndicatorPC1PC2
pH−0.089−0.668
K+−0.0830.753
Na+0.690.538
Ca2+0.9810.088
Mg2+0.9230.139
Cl0.8780.239
SO42−0.6540.514
HCO30.536−0.199
NO30.789−0.044
TH0.9880.1
TDS0.9770.196
Eigenvalue6.6751.41
Contribution%60.68212.818
Cumulative contribution60.68273.5
Table 3. Classification of Evaluation Index Grades.
Evaluation IndicatorStandard Value
IIIIIIIVV
pH6.5 ≤ pH ≤ 8.55.5 ≤ pH < 6.5, 8.5 < pH ≤ 9<5.5 or >9
TDS≤300≤500≤1000≤2000>2000
TH≤150≤300≤450≤650>650
Cl≤50≤150≤250≤350>350
SO42−≤50≤150≤250≤350>350
NO3≤2≤5≤20≤30>30
NO2≤0.01≤0.1≤1≤4.8>4.8
NH3-N≤0.02≤0.1≤0.5≤1.5>1.5
COD≤1≤2≤3≤10>10
F≤1≤1≤1≤2>2
Hg≤0.0001≤0.0001≤0.001≤0.002>0.002
As≤0.001≤0.001≤0.01≤0.05>0.05
Note: pH possesses no dimensional unit, and the remaining indices are measured in mg/L.
Disclaimer/Publisher’s Note: The statements, opinions and data contained in all publications are solely those of the individual author(s) and contributor(s) and not of MDPI and/or the editor(s). MDPI and/or the editor(s) disclaim responsibility for any injury to people or property resulting from any ideas, methods, instructions or products referred to in the content.