1. Introduction
With the rapid expansion of the global photovoltaic (PV) industry and the worldwide advancement of carbon neutrality goals, the sector has experienced unprecedented growth. In 2024, global PV module production reached 725.9 GW, of which China accounted for 86.4%, making it the core driver of the global supply chain. As installed PV capacity continues to rise, the issue of module decommissioning has become increasingly prominent [
1]. PV modules typically have an operational lifespan of approximately 25 to 30 years [
2], which implies that modules installed during the early stages of large-scale deployment will gradually enter a concentrated retirement phase. A joint study by the International Renewable Energy Agency and the International Energy Agency Photovoltaic Power Systems Programme estimated that cumulative global waste from decommissioned PV modules will reach approximately 1.7–8 million tons by 2030 and increase to 60–78 million tons by 2050 [
3]. Decommissioned PV modules contain valuable materials such as silicon, silver, copper, and aluminum, but they may also contain hazardous substances including lead, antimony, cadmium, and fluorine. Improper disposal not only causes the loss of scarce resources but may also trigger significant environmental risks, including soil and water contamination [
4]. Therefore, establishing standardized recycling systems and environmentally sound disposal pathways is critical for promoting circular resource utilization and mitigating environmental risks. This issue has become an urgent global challenge requiring coordinated policy and managerial responses [
5].
Current end-of-life (EoL) management practices for PV modules differ markedly across regions, and these differences have direct economic and environmental implications. In the European Union, waste PV panels are managed under the Waste Electrical and Electronic Equipment (WEEE) framework, which has helped establish relatively formal collection and recycling channels. In the United States, by contrast, EoL management remains more fragmented and is shaped by a combination of landfill disposal, voluntary industry initiatives, and state-level regulation. In Australia and Japan, PV waste governance is also evolving from general waste management toward more targeted stewardship and recycling arrangements as retirement volumes continue to rise. These regional differences indicate that EoL practices are determined not only by technological feasibility, but also by the maturity of recycling infrastructure, the relative economics of recycling versus disposal, and the strength of institutional coordination [
6].
The environmental and economic consequences of these divergent practices are substantial. Where formal recycling channels remain weak, retired modules may be stored for long periods, landfilled, exported through poorly monitored secondary channels, or informally dismantled, resulting in both material losses and elevated environmental risks. By contrast, more mature recycling systems can improve the recovery of glass, aluminum, silicon, copper, and silver while reducing the environmental burden associated with improper treatment. From an economic perspective, the viability of recycling is strongly influenced by logistics costs, treatment costs, and the market value of recovered materials. In many regions, the cost gap between formal recycling and low-cost disposal remains a major barrier to the development of compliant recycling systems [
7,
8]. Accordingly, the challenge is not only how to handle growing waste volumes, but also how to align economic incentives with environmentally sound treatment under different institutional settings [
8].
The regulatory and legislative landscape for EoL PV modules has also become increasingly important. In the European Union, PV panels are regulated under the WEEE regime, and the amendment of Directive (EU) 2024/884 further clarified financial responsibility for PV waste management under extended producer responsibility. In the United States, no unified federal PV-specific recycling law currently exists; instead, several states have adopted their own rules. For example, Washington State has implemented a photovoltaic module stewardship and take-back program requiring manufacturers to provide a convenient and environmentally sound recycling pathway for covered modules. In Japan, the Ministry of the Environment revised its guidelines for promoting the recycling and proper disposal of PV equipment in 2024 in response to the expected waste peak in the late 2030s. In China, policy attention has also intensified, and national guidance issued in 2026 further emphasized the establishment of a comprehensive recycling and reuse system for retired PV modules. These differences show that PV recycling governance is evolving through multiple institutional paths, including mandatory producer responsibility, state-level stewardship, and administrative policy guidance [
9]. They also indicate that the practical effectiveness of PV recycling depends not only on the existence of policy instruments, but also on how such instruments influence the strategic responses of generators and recyclers in actual implementation.
From the perspective of market participants, the primary motivation for PV power generation firms and third-party recycling enterprises to engage in the recycling of decommissioned modules lies in economic returns, namely profits generated through the recovery of reusable materials from retired modules. However, in practice, EoL PV module recycling still faces two core challenges. First, the establishment of recycling channels entails relatively high costs [
10]. Based on quantitative assessments of transportation impacts at the end of the life cycle, some studies estimate that, in the United States, transporting crystalline silicon modules over a distance of 1000 km costs approximately USD 2.3 per square meter. This finding highlights the significant role of logistics costs in determining the economic viability of recycling. Second, recycling technologies remain insufficiently mature. PV module recycling involves multi-stage and technologically complex processes that require specialized equipment and skilled personnel. Driven by short-term economic incentives, some recyclers in developing countries adopt rudimentary dismantling methods to reduce costs, resulting in the inadequate recovery of high-value materials [
11]. According to the 2024 report of the China Photovoltaic Industry Association, the formal recycling rate of decommissioned PV modules in China is only about 22%. At the global level, the formal recycling rate of PV modules remains generally low. Even in Europe, where regulatory systems are relatively well developed, the actual recycling rate in 2022 was only 7.8%, far below the European Union target of 85% by 2030. Such informal dismantling practices not only lead to substantial resource losses but also release hazardous substances such as fluoropolymers and heavy metals, thereby causing soil and water contamination and further exacerbating the challenge of non-compliant PV module recycling.
In this study, PV power generators mainly refer to owners and operators of utility-scale PV plants and institutional distributed PV systems, especially commercial and industrial installations. Although residential PV is also an important source of EoL modules, its recycling is more fragmented because of dispersed ownership, small-batch collection, and higher transaction costs. Therefore, this paper focuses on the more organized generator segment and does not model residential households as an independent decision-making group.
Against this backdrop, establishing a multi-stakeholder collaborative recycling mechanism and guiding firms to voluntarily fulfill their recycling and disposal responsibilities constitute a critical pathway toward the standardized recycling of PV modules [
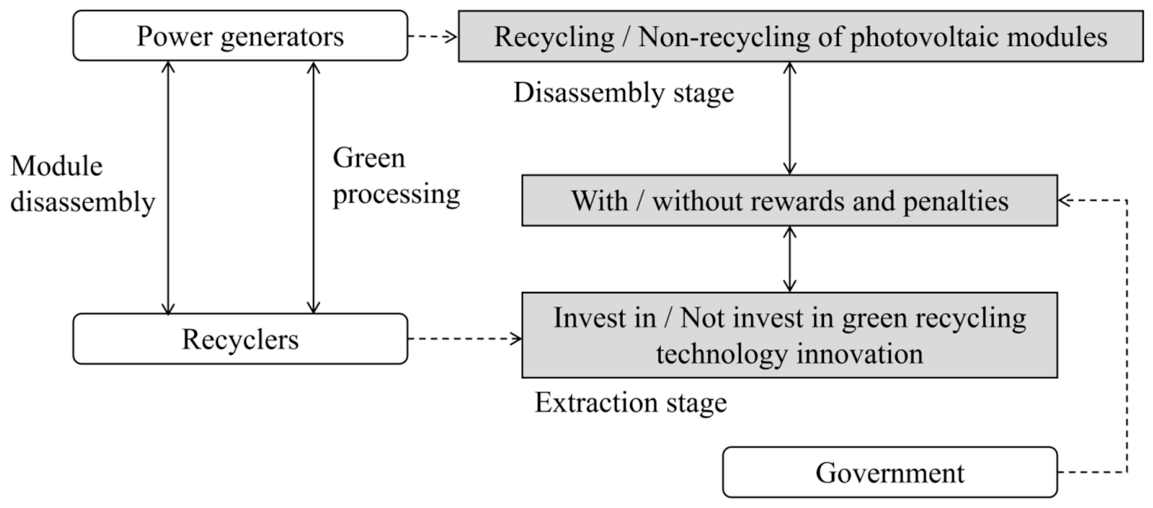
12]. From a process perspective, the green recycling of decommissioned PV modules generally involves three major stages: on-site dismantling, logistics and transportation, and environmentally sound dismantling with resource recovery. Specifically, PV power generation enterprises are responsible for dismantling, collecting, and storing retired modules and then transferring them to recycling firms for further treatment. Recycling enterprises subsequently apply environmentally sound and non-hazardous technologies to recover valuable materials such as silicon, silver, copper, and aluminum. Accordingly, PV power generation firms can establish dedicated recycling operation systems to optimize the collection, storage, and transportation of retired modules, while third-party recycling enterprises can improve resource extraction efficiency and reduce pollutant emissions through green technological innovation. For example, GEM Co., Ltd. in China has developed a closed-loop recycling production line for PV modules. By combining physical dismantling with chemical purification, the company has reportedly increased the recovery rate of materials such as silicon and silver to 92% while reducing hazardous waste emissions by 60% compared with traditional processes, thereby generating both environmental and economic benefits.
However, implementing the above pathway requires substantial upfront investment. PV power generation enterprises must bear the costs of recycling network construction and equipment procurement, while third-party recyclers face long R&D cycles, high capital input, and considerable uncertainty in technology upgrading. Under short-term cost–benefit considerations, firms often lack sufficient incentives to proactively promote PV module recycling. Generators may choose not to participate because of a long return-on-investment period, while recyclers may continue to adopt rudimentary processing methods because of the high costs associated with technological upgrading. This form of market failure makes government intervention particularly important. In practice, governments usually influence corporate behavior through combinations of subsidies, penalties, supervision, and administrative coordination. Financial rewards may be granted to power generation enterprises that actively recycle retired modules and to recycling firms that adopt green processing technologies, while fines may be imposed on passive or non-compliant behavior. Nevertheless, policy design faces practical constraints. If rewards are too low, firms may lack sufficient incentives; if they are too high, the fiscal burden may become excessive. Similarly, insufficient penalties may fail to generate deterrence, whereas overly severe penalties may undermine firms’ operational viability [
13]. Therefore, governments must balance environmental objectives, firms’ economic interests, and policy feasibility. Once such a regulatory mechanism is established, PV power generation enterprises and third-party recyclers will incorporate the expected rewards and penalties into their decision-making processes and dynamically adjust their strategic choices accordingly. This dynamic interaction between policy intervention and enterprise response is precisely the practical context that motivates the model developed in this paper.
Based on the issues discussed above, this paper adopts an evolutionary game perspective to construct a tripartite game model involving the government, PV power generators, and third-party recyclers. It systematically analyzes the strategic choices and evolutionary paths of each participant under government reward–penalty policies. Specifically, this paper addresses the following research questions:
Under what conditions will PV power generators and third-party recyclers choose to actively participate in the recycling of retired PV modules and adopt green processing strategies?
Under what circumstances does the government tend to implement or withdraw from regulation, and how do its reward–penalty policies influence the strategic evolution of enterprises?
How do key factors such as reward intensity, penalty severity, cost–benefit structure, and initial strategy probabilities affect the evolutionary stable state of the tripartite game system?
To answer these questions, this paper employs Evolutionary Game Theory (EGT) as the core analytical framework, taking into account the bounded rationality of stakeholders in the PV recycling system. A tripartite evolutionary game model is constructed to characterize the dynamic interactions among the government, PV power generators, and third-party recyclers. Specifically, the government’s reward–penalty mechanism and the enterprises’ cost–benefit structures are incorporated into the payoff matrix. By deriving the replicator dynamic equations and analyzing the Jacobian matrix, this study examines the asymptotic stability of the system’s equilibrium points and identifies the evolutionary stable strategies under different conditions. In addition, MATLAB R2023b (MathWorks, USA) simulations are conducted to visualize the evolutionary paths of the system and to test the sensitivity of the results to key parameters such as reward intensity, penalty severity, and initial strategy probabilities. Rather than representing a single empirical case, this modeling framework is intended to capture a realistic decision logic commonly observed in PV recycling practice, namely that firms adjust their behavior gradually in response to changing incentives, costs, and expected returns.
This study is conducted under a simplified analytical framework. Specifically, the model assumes a unified government regulatory authority and treats the behavioral decisions of PV power generators and recycling enterprises as relatively homogeneous. In real-world settings, however, substantial differences exist across regions in regulatory systems, market environments, and participant characteristics. For example, small-scale distributed PV owners and operators of large centralized utility-scale plants may differ significantly in their cost structures and behavioral responses. Therefore, the conclusions of this study are primarily applicable to scenarios characterized by relatively clear policy implementation, organized recycling systems, and a certain degree of market coordination. Even so, the analytical logic of the model remains practically relevant because many real-world PV recycling systems still face the same underlying problems of incentive mismatch, high initial cost, and uncertain returns.
Despite the growing literature on PV waste management and recycling policy, three important gaps remain. First, existing studies on PV module recycling have mainly focused on waste forecasting, value assessment, recycling network design, or static policy optimization, while insufficient attention has been paid to the dynamic strategic interactions among core stakeholders during the recycling process. Second, although evolutionary game theory has been widely applied in battery recycling and WEEE governance, its application to EoL PV module recycling remains limited. More importantly, most related studies do not explicitly capture the joint strategic evolution of government regulators, PV power generators, and third-party recyclers within a unified analytical framework. Third, prior studies have often examined subsidy mechanisms, regulatory instruments, or recycling strategies separately, but have paid less attention to how reward–penalty policies interact with firms’ cost–benefit structures to shape long-term behavioral evolution and equilibrium selection. Compared with prior studies that either emphasize static optimization or focus on bilateral relationships, this study places greater emphasis on multi-agent dynamic adjustment under combined policy incentives and market constraints.
To address these gaps, this study develops a tripartite evolutionary game model involving the government, PV power generators, and third-party recyclers under a reward–penalty policy framework. The contribution of this study is threefold. First, it extends the application of evolutionary game theory to the specific context of EoL PV module recycling and provides a dynamic analytical framework for understanding multi-stakeholder behavioral evolution in this emerging circular economy field. Second, unlike studies that focus on bilateral interactions or a single policy instrument, this paper simultaneously incorporates government regulation, generator recycling decisions, recycler green technology innovation, and reward–penalty mechanisms into one integrated model, thereby clarifying the interdependence between regulatory design and enterprise strategy choices. Third, by combining stability analysis with numerical simulation, this study identifies the conditions under which the system evolves toward a stable state characterized by generator recycling, recycler green innovation, and reduced government intervention. In this way, the paper not only contributes to the theoretical understanding of equilibrium formation in PV recycling systems but also provides practical insights for designing phased and differentiated policy tools.
The remainder of this paper is organized as follows.
Section 2 reviews the relevant literature on retired PV module recycling and the application of evolutionary game theory in recycling systems.
Section 3 constructs the tripartite evolutionary game model among the government, PV power generators, and recycling enterprises and derives the replicator dynamic equations.
Section 4 analyzes the equilibrium points and evolutionary stable strategies of the system.
Section 5 presents numerical simulation results to examine the effects of key factors, including reward and penalty intensity, cost–benefit parameters, and initial strategy probabilities, on the system’s evolutionary path.
Section 6 concludes the paper and presents policy implications, limitations, and directions for future research.
4. Model Analysis
In this section, we deeply explore the strategic evolutionary laws of the government, generators, and recyclers in the long-term game. Based on the replicator dynamic equations and adopting the criteria for evolutionary stable strategies (ESSs), we analyze the strategic stability of the three parties one by one. According to evolutionary game theory, the evolutionary stable state of the system is determined by the equilibrium points of the replicator dynamic equations and their stability. For a dynamic system described by a set of differential equations, if the real parts of all eigenvalues of the system’s Jacobian matrix are negative at a certain equilibrium point, then that equilibrium point is a locally asymptotically stable ESS. We first solve for the stable points where the replicator dynamic equations of each agent equal zero, then determine their stability through eigenvalue analysis, and thereby derive the behavioral evolutionary laws of each agent.
4.1. Stability of Government Strategy
Taking the derivative of the government’s replicator dynamic equation yields:
Let . Then, the stability criterion simplifies to: .
Corollary 1. The evolution of the government’s regulatory strategy is jointly influenced by the recycling probability of generators and the probability that recyclers adopt green recycling technology innovation. The corresponding stable strategy exhibits a clear dynamic switching characteristic, defined by a critical threshold of the generators’ recycling probability, denoted as . Specifically, when , the government tends to adopt a non-regulatory strategy; when , the government tends to implement regulation.
Proof. For the government’s probability of choosing regulation to be stable, the conditions and must be satisfied. Let . Solving for the critical threshold of the generator’s recycling probability yields . In practice, the government’s enforcement intensity against non-compliance and the losses from non-intervention are typically greater than the credibility gains from compliance, implying that . The system stability is determined by the sign of . When , we have and , indicating that is the stable strategy. Conversely, when , and , and becomes the stable strategy. When , , and the system is at a critical state where the government’s stable strategy cannot be determined. Therefore, as the generator’s recycling probability increases, the government’s regulatory strategy gradually shifts from “Regulate” to “Not Regulate”. □
Based on Corollary 1, taking the first-order partial derivatives of with respect to , , , , and yields: , , , , and . This implies that the critical generator recycling probability required for the government to shift to the “Not Regulate” strategy decreases as the intensity of government rewards and its own regulatory costs increase. Conversely, this critical threshold increases as the penalty for non-compliance increases. This indicates that excessive regulatory costs or reward expenditures accelerate the government’s withdrawal from direct intervention, whereas higher penalty revenues strengthen the government’s willingness to sustain regulation.
Managerial Implications: The above result suggests that the role of government regulation in EoL PV module recycling is inherently dynamic rather than static. In the early stage of system formation, when the probabilities of generator recycling and recycler green innovation remain low, government intervention is necessary to guide market participants toward compliant behavior and to reduce uncertainty in formal recycling development. As proactive strategies gradually become more prevalent, however, the government can reduce the intensity of direct intervention and shift toward supervision, coordination, and information disclosure, thereby lowering administrative costs. This finding is consistent with the broader literature on recycling governance, which suggests that policy intervention is especially important when formal recycling systems are immature, but may gradually recede once market-based incentives become sufficiently established. At the practical level, the result indicates that governments should design reward–penalty policies in a phased manner: stronger intervention is needed to initiate formal recycling behavior, whereas more flexible governance may be appropriate once the system approaches a self-sustaining equilibrium.
4.2. Stability of Generator Strategy
Taking the derivative of the generator’s replicator dynamic equation yields:
Let . Then, the stability criterion simplifies to: .
Corollary 2. The generator’s recycling strategy is jointly influenced by the government’s regulatory strategy and its own cost–benefit structure. When the net benefit of recycling exceeds its net cost, i.e., , the stable strategy uniquely converges to “Recycle”.
Proof. For the probability of the generator choosing recycling to be stable, the conditions and must be satisfied. Let . Solving for the critical threshold of the government’s regulation probability yields . The system stability is determined by the sign of . When , we have and , indicating that is the stable strategy. Conversely, when , and , and becomes the stable strategy. When , , and the system is at a critical state where the generator’s stable strategy cannot be determined. Furthermore, under the parameter setting of this study, since , it follows that . Given that the feasible domain of the government’s regulation probability is , we always have , which implies . Therefore, the generator’s evolutionary stable strategy uniquely converges to “Recycle”. □
According to Corollary 2, calculating the first-order partial derivatives of with respect to yields , , , , and . This implies that the probability of power generation enterprises adopting the recycling strategy increases with the increase in government recycling rewards, penalties for non-compliance, recycling revenue, and the cost of non-recycling; conversely, the probability of recycling decreases as the direct cost of recycling increases.
Managerial Implications: From the perspective of generators, the result shows that recycling behavior depends not only on government regulation, but also on whether the internal cost–benefit structure of recycling becomes sufficiently attractive. This finding echoes prior studies emphasizing that formal recycling participation cannot be sustained solely by regulation if firms continue to face high logistics, transaction, and processing costs. Therefore, policy design should not be limited to increasing rewards and penalties; it should also aim to improve the underlying economic conditions of generator participation. In practical terms, governments can support inter-regional transport coordination, standardized collection systems, and collaborative logistics platforms, while generators themselves can improve recycling profitability by optimizing storage, dismantling, and resource recovery arrangements. The implication is that a stable recycling strategy is more likely to emerge when external policy incentives and internal economic viability are strengthened simultaneously.
4.3. Stability Analysis of the Recycler’s Strategy
Taking the derivative of the replicator dynamics equation for the recycler yields:
Let . Then, the stability criterion simplifies to: .
Corollary 3. The recycler’s choice of green technological innovation is jointly influenced by the government’s regulatory intensity and its own cost–benefit structure. When the net benefit of green innovation exceeds its net cost, i.e., , the stable strategy uniquely converges to “Adopt Green Recycling Technology”.
Proof. For the probability of the recycler choosing green technological innovation to be stable, the conditions and must be satisfied. From , we obtain The system stability is determined by the sign of . When , we have and , indicating that is the stable strategy. Conversely, when , and , and becomes the stable strategy. Since , it follows that . Given that the feasible domain of the government’s regulation probability is , we always have , which implies . Therefore, the recycler’s evolutionary stable strategy is “implementing green recycling technological innovation”. □
Based on Corollary 3, calculating the first-order partial derivatives of with respect to , , , , and yields , , , , and . This indicates that the probability of the recycler adopting the green innovation strategy increases with the increase in government rewards, penalties, green recycling revenue, and the cost of traditional recycling; conversely, it decreases as the direct cost of green innovation increases.
Managerial Implications: For third-party recyclers, the result indicates that the adoption of green recycling technology is ultimately shaped by the interaction between regulatory pressure and expected economic return. This interpretation is broadly consistent with prior research showing that green technology upgrading in recycling industries depends not only on environmental requirements, but also on whether firms can recover the additional investment through higher efficiency, greater material recovery, or more stable market demand. Therefore, in addition to imposing penalties on crude dismantling, governments should also encourage technological upgrading through targeted support for equipment renewal, R&D collaboration, and industrial demonstration projects. At the enterprise level, recyclers should strengthen cooperation with generators to secure a stable supply of retired modules and improve the scale efficiency of green treatment. In practice, the result suggests that policy support for innovation is most effective when it is combined with measures that improve the long-term profitability and operational continuity of formal recycling.
4.4. Equilibrium Analysis of the Evolutionary System
This section aims to reveal the final trajectories and stable states of the synergistic strategic evolution among the government, power generation enterprises, and third-party recycling firms by solving for the system’s equilibrium points and analyzing their local stability. Following Friedman’s evolutionary game analysis method and Lyapunov’s stability theory [
52], let
,
, and
. That is, when the rate of change in the system’s strategic choices is zero, eight pure strategy equilibrium points of the dynamic system can be obtained:
. Additionally, there may exist a mixed-strategy equilibrium point
, which is the solution to the following system of equations:
According to evolutionary game theory, the stability of equilibrium points can be determined using Lyapunov’s first method (or indirect method). To this end, the Jacobian matrix
J of the system is first constructed. The local stability of each equilibrium point is assessed by calculating the eigenvalues of the Jacobian matrix evaluated at that point. Specifically, if all eigenvalues corresponding to an equilibrium point have negative real parts, the point constitutes an Evolutionarily stable strategy (ESS). If there exists at least one eigenvalue with a positive real part, the point is unstable. If the real parts of all eigenvalues are non-positive but include zero, the stability cannot be directly determined. The Jacobian matrix of the evolutionary game system is given by:
The components of the Jacobian matrix are expanded as follows:
Based on the parameter assumptions, the Jacobian matrix for each equilibrium point is derived, and the eigenvalues corresponding to each pure strategy equilibrium point are calculated. The results are summarized in
Table 3.
Proposition 1. Combining practical circumstances with different parameter settings and ESS judgment criteria, when the conditions , , and are satisfied, the system possesses a unique ESS, denoted as . In this state, the government chooses “Not Regulate”, the generator chooses “Recycle”, and the recycler chooses Innovate Green Recycling Technology.
Proposition 1 indicates that when the net benefit of recycling for generators exceeds that of non-recycling, and the net benefit of green innovation for recyclers exceeds that of non-innovation, both generators and recyclers will, driven by economic rationality, spontaneously adopt proactive strategies. This suggests that the green recycling chain can become economically sustainable under market-driven conditions once the relevant cost–benefit relationships are sufficiently favorable. This result is broadly in line with existing studies that emphasize the importance of incentive compatibility and profitability in the long-term operation of formal recycling systems. At the same time, when the total cost of government regulation exceeds its environmental and social returns, the marginal effectiveness of continued intervention declines. As firms’ compliant behaviors become increasingly sustained by market incentives, strict regulation is no longer economically optimal for the government. In practical terms, this implies that public policy should focus not only on stimulating early participation, but also on improving the economic conditions under which firms can continue recycling and innovating without relying indefinitely on direct government intervention. Ultimately, the system evolves toward a state characterized by enterprise autonomy, market-based self-regulation, and more limited but still supportive government involvement.
Proposition 2. The mixed-strategy equilibrium point unstable, indicating that no long-term and stable intermediate state exists in which partial regulation, partial recycling, and partial innovation coexist. The system inevitably evolves toward a pure-strategy equilibrium.
Proposition 2 reveals that the essence of the mixed strategy equilibrium point is a temporary balance of the strategy probabilities among the government, generator, and recycler. However, in reality, parameters continuously change with the market environment, technological progress, and policy adjustments, causing this balance to be extremely fragile and easily broken. For instance, an increase in the generator’s recycling revenue will push its recycling probability to breach the critical threshold. This, in turn, triggers a decrease in the government’s regulatory probability and subsequently drives an increase in the recycler’s innovation probability, forming a chain reaction. Consequently, the system deviates from the mixed strategy equilibrium and converges toward the pure strategy stable point . This implies that there is no compromised stable state in the evolution of the PV module recycling system. The strategies of the three parties will inevitably move toward an optimal configuration characterized by the government’s non-regulation and the active participation of enterprises.
Proposition 3. When the cost–benefit conditions for proactive corporate behavior are satisfied, i.e., and , all pure-strategy equilibrium points involving “non-recycling” by generators or “non-innovation” by recyclers are strictly unstable. Recycling by generators and green innovation by recyclers are inevitable outcomes driven by multi-agent interactions.
Proposition 3 further indicates that when the additional benefits of proactive strategies exceed their additional costs, for any equilibrium point where generators choose “Not Recycle”, the corresponding eigenvalues are strictly positive. Similarly, for any equilibrium point where recyclers choose “Not Innovate”, the corresponding eigenvalues are also strictly positive. According to Lyapunov stability theory, any equilibrium point with at least one positive eigenvalue is unstable. This implies that, whether driven by government reward–penalty mechanisms or by the market value of resource recovery from end-of-life modules, the overall payoff of passive strategies is always lower than that of proactive strategies for both generators and recyclers. Therefore, the model suggests that traditional extensive dismantling practices become progressively less attractive, while the establishment of a standardized green recycling chain becomes more likely under the specified parameter conditions.
5. Numerical Simulation Analysis
Through the theoretical analysis of the model presented above, evolutionary stable strategies (ESSs) were derived. To verify the analytical conclusions and intuitively reflect the impact of various factors on the game system, this study employs MATLAB R2023b (MathWorks, USA) to conduct numerical simulations. Based on the initial parameter constraints, the initial probabilities of the government, power generation enterprises, and third-party recycling firms adopting the “regulation,” “recycling,” and “green innovation” strategies, respectively, vary within the range of [0, 1] to examine the sensitivity of the evolutionary results to initial conditions. In the simulation figures, the x, y, and z axes represent these probabilities, respectively. The parameters satisfy the following conditions: , , and , where denotes evolutionary time.
The parameter values are selected with reference to prior studies on photovoltaic recycling and evolutionary game analysis, especially Miao et al. [
53], and are further calibrated to reflect the relative relationships among key variables in the PV module recycling system. Rather than representing a specific empirical case, these values are intended to capture a stylized but plausible decision environment commonly observed in EoL PV module recycling practice. In particular, the parameter setting reflects several realistic features discussed in the literature: formal recycling by generators generally involves higher short-term costs than non-recycling because of dismantling, collection, storage, and transportation requirements; green processing by recyclers usually requires additional investment in equipment, technology upgrading, and operation; compliant treatment may generate higher long-term returns through improved materia l recovery, regulatory compliance, and reputational benefits; and government intervention is associated with both regulatory costs and policy expenditures. In this sense, the parameter values are designed to reflect the empirical logic of the decision environment rather than to reproduce one specific market case.
In this study, the analytical conclusions mainly depend on the relative magnitudes among costs, benefits, rewards, and penalties, rather than on any single numerical value. Therefore, the simulation is used to verify whether the evolutionary trajectories remain consistent under different but reasonable parameter configurations. On this basis, the parameter settings reported in
Table 4 provide a representative scenario for illustrating the model dynamics, while the subsequent sensitivity analyses further examine the robustness of the main conclusions under variations in key parameters. This treatment improves the interpretability of the simulation setting by linking the parameter relationships to realistic policy and market conditions, while avoiding overstatement of empirical precision that the current study is not intended to claim.
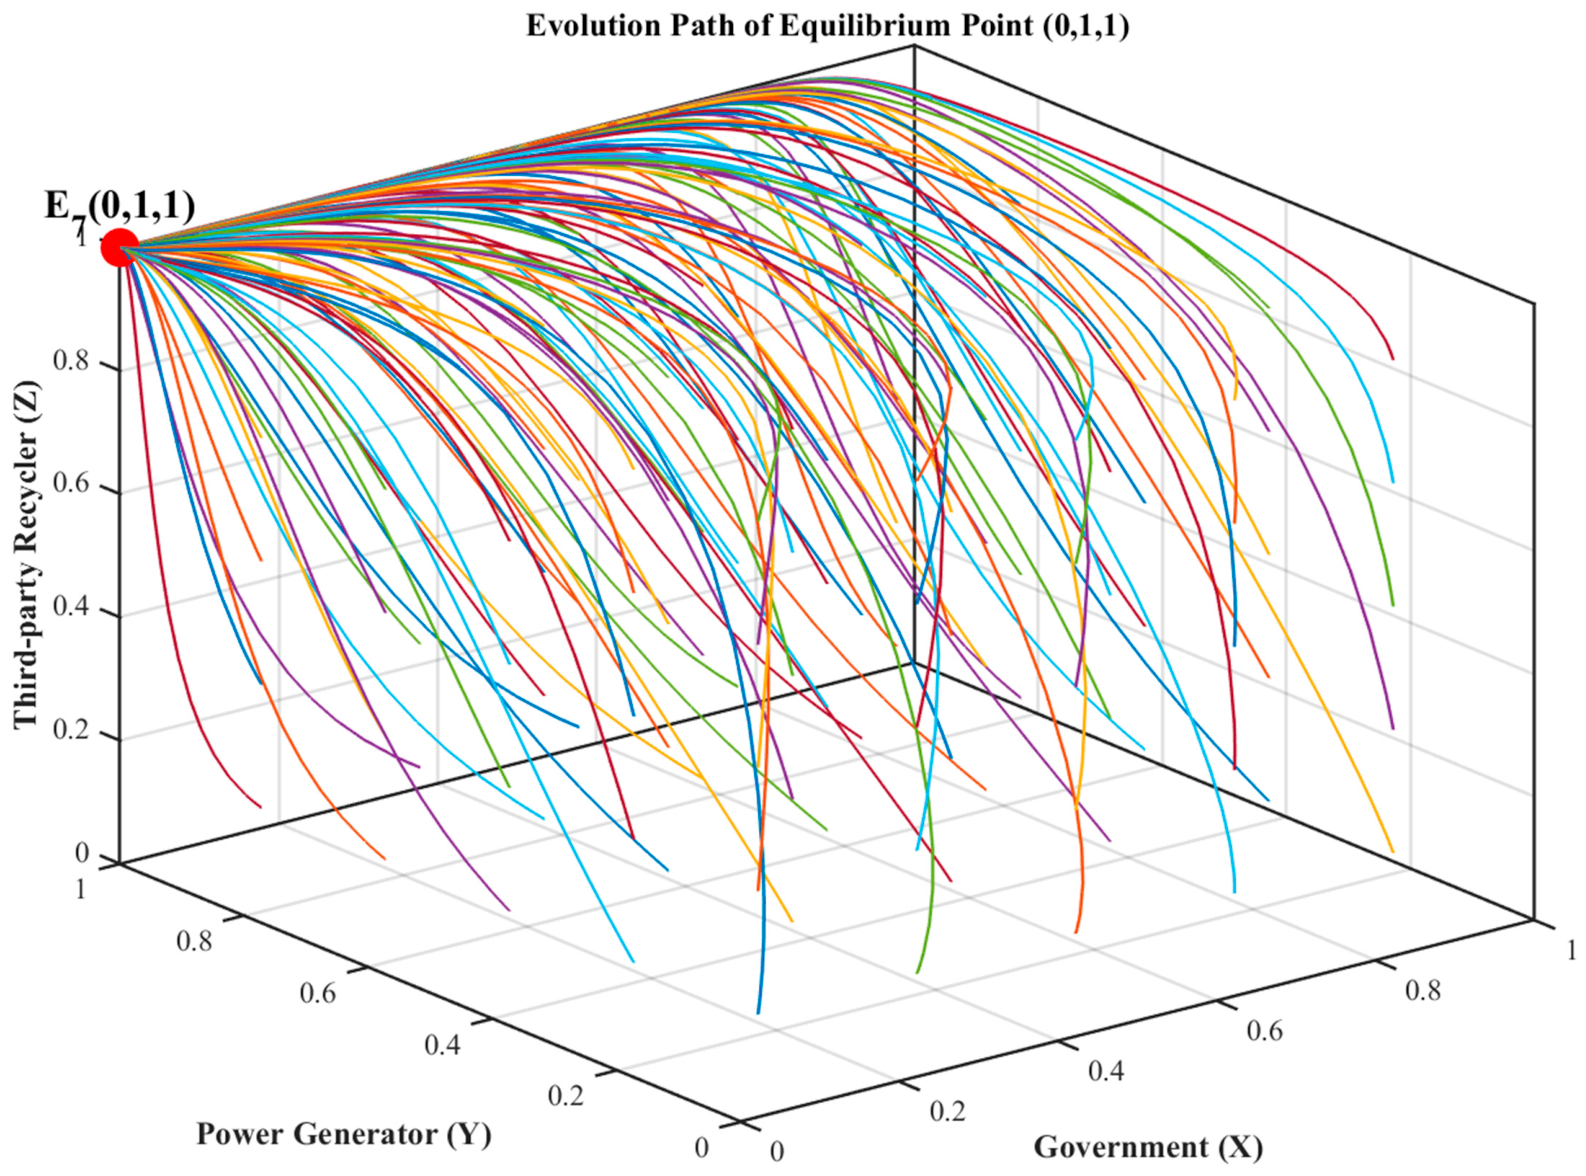
Using MATLAB R2023b (MathWorks, USA) for numerical simulation, the evolutionary path of the equilibrium point
is obtained, as shown in
Figure 2.
Based on the simulation of the evolutionary paths described above, it can be observed that when the conditions , , and are satisfied, the system ultimately evolves to the equilibrium point . This simulation result is consistent with the conclusions derived from the stability analysis, thereby verifying the validity of the proposed model. Consequently, the findings offer significant practical guidance for establishing collaborative mechanisms for PV module recycling among the government, power generation enterprises, and third-party recycling firms.
5.1. Sensitivity Analysis of Initial Probabilities
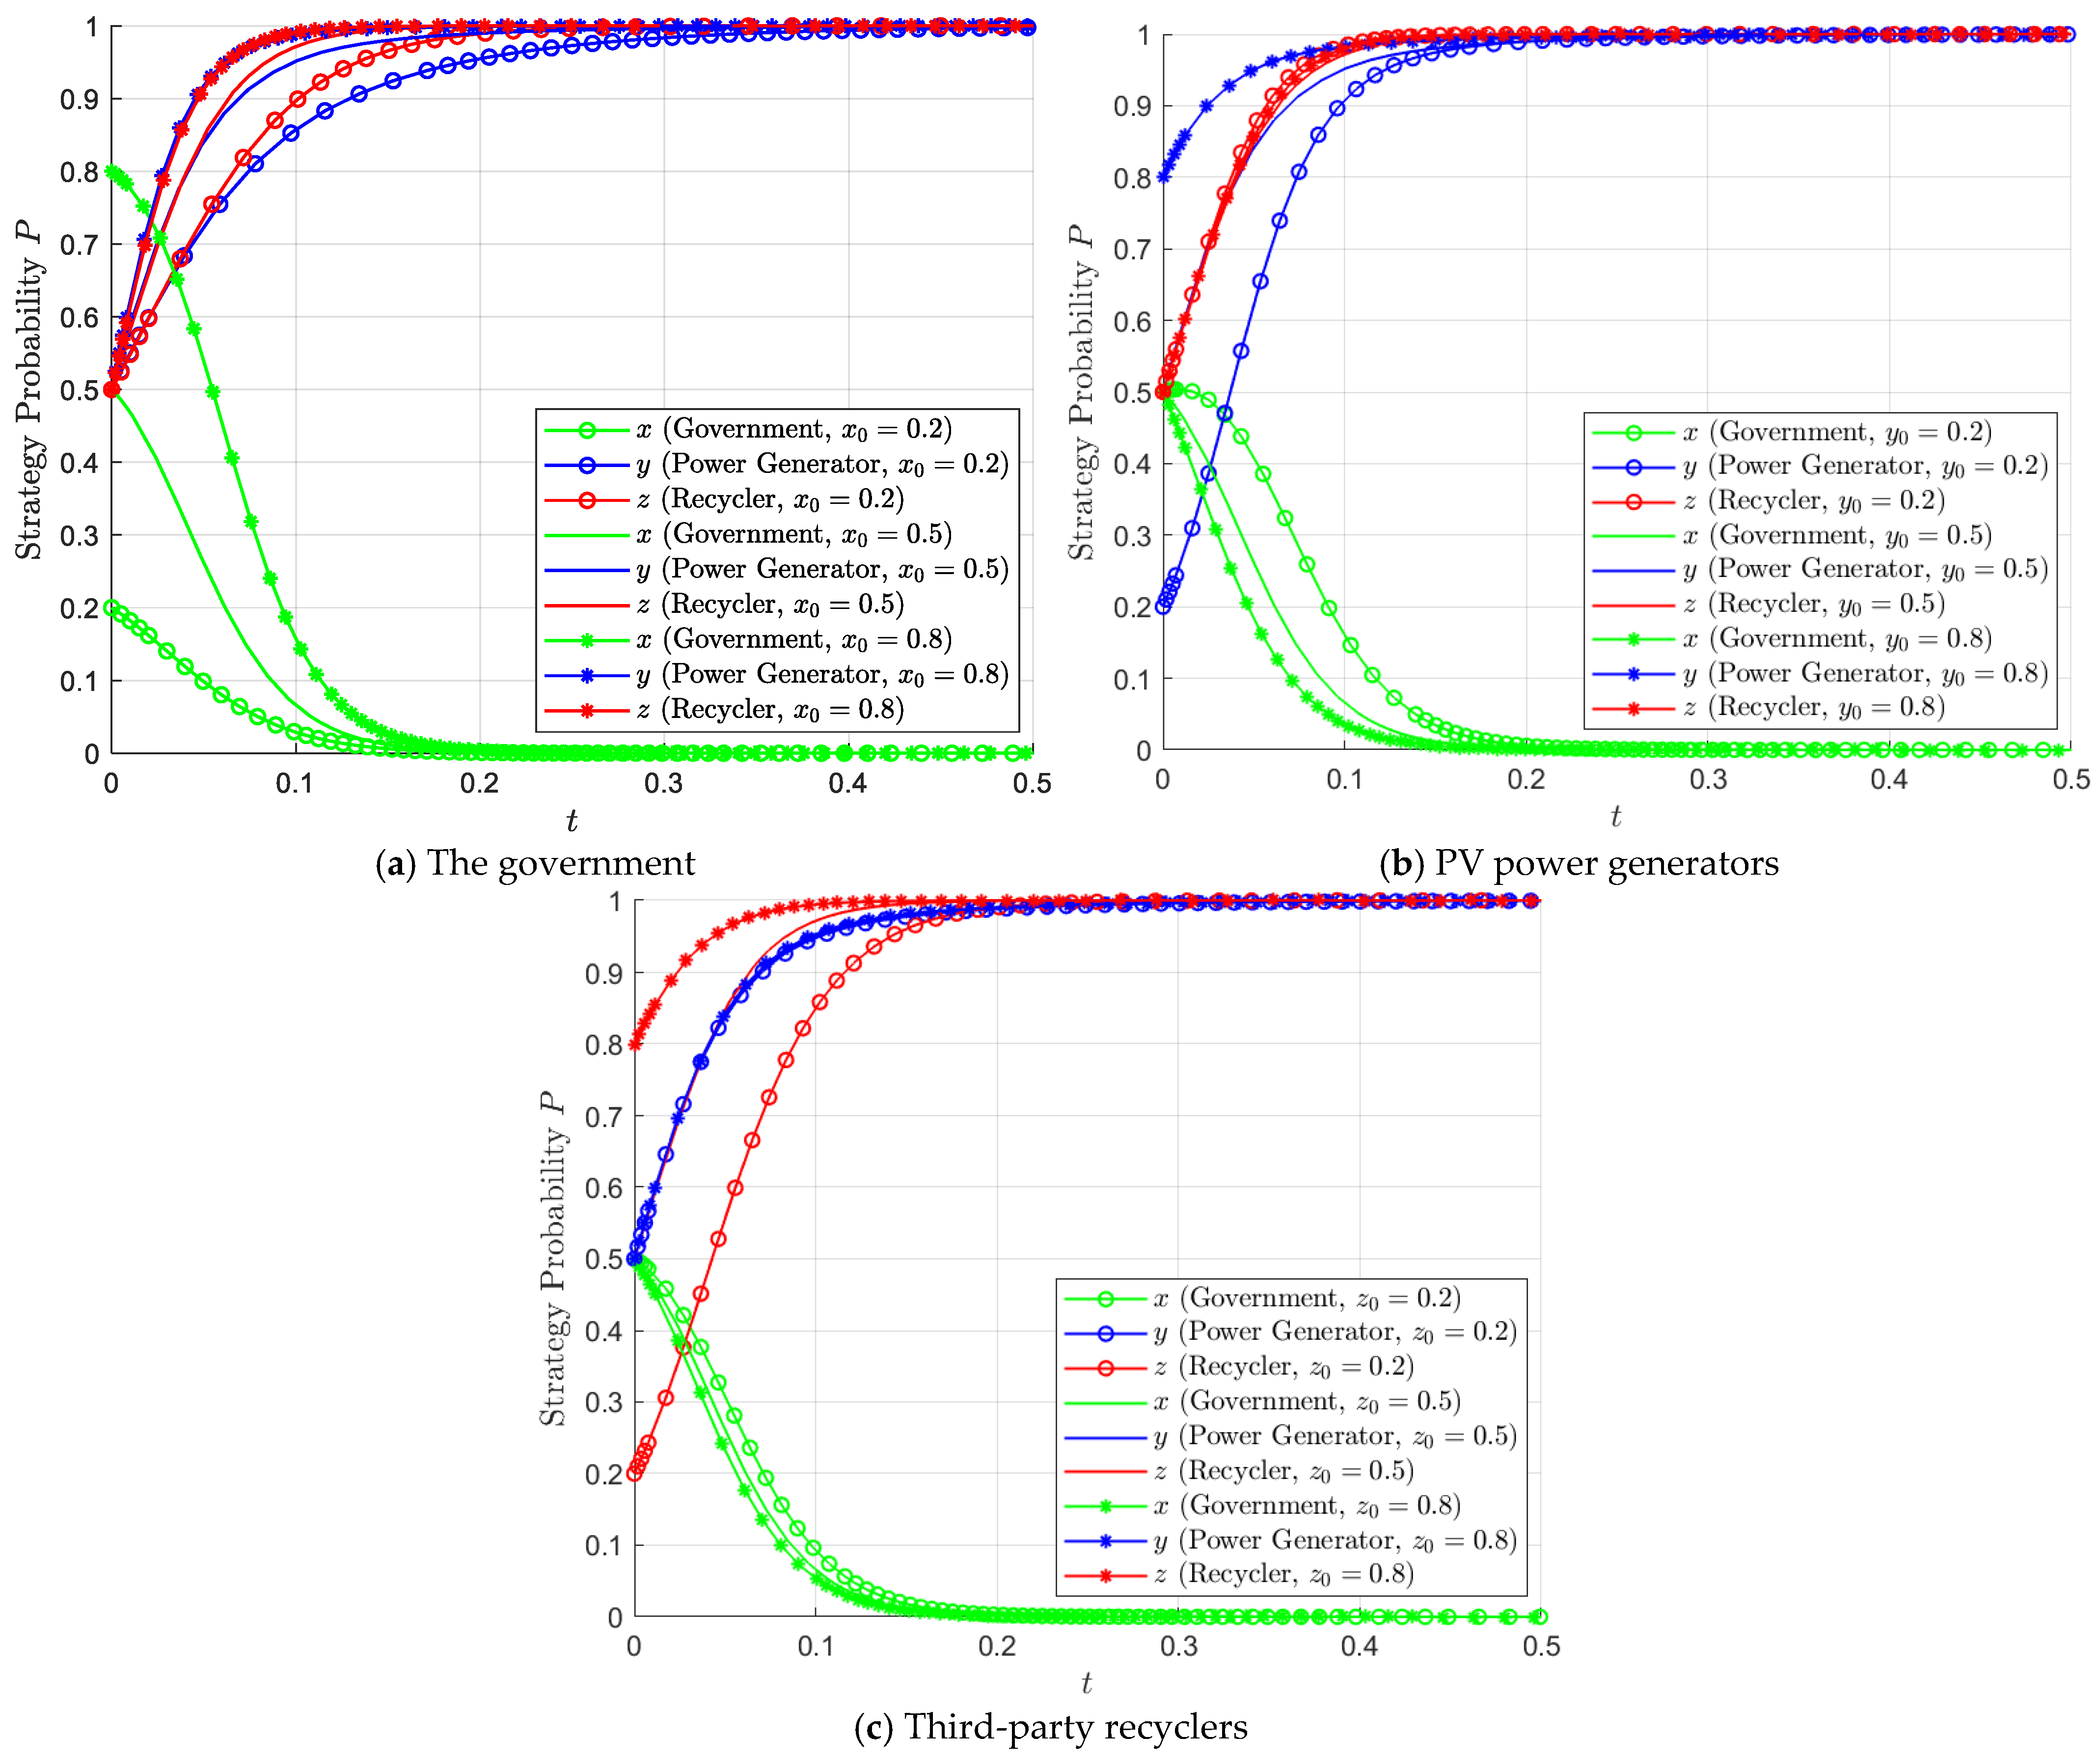
To investigate the impact of the three stakeholders’ initial strategic choices on the evolutionary trajectory of the system, numerical simulations are conducted based on the original parameter settings. Specifically, the analysis simulates scenarios where the initial probability of one party (the government, the power generator, or the recycler) varies, while the initial probabilities of the other two parties remain constant. The results are presented in
Figure 3.
As shown in
Figure 3, the system consistently converges to the evolutionary stable equilibrium
under different initial strategy probabilities, indicating that changes in initial conditions affect the convergence process rather than the final evolutionary outcome. Specifically, when the initial probability of government regulation increases, generators and recyclers converge toward the “Recycle” and “Innovate Green Recycling Technology” strategies, respectively, although the differences in convergence speed are not very pronounced in
Figure 3. This suggests that government regulation plays a facilitating role in promoting proactive strategies. When the initial probability of generators choosing recycling increases, the government converges more rapidly toward the “Not Regulate” strategy, while the convergence of recyclers toward green technological innovation becomes relatively slower. However, the recycler’s final strategy remains unchanged. Similarly, when the initial probability of recyclers adopting green technological innovation increases, the government also converges more rapidly toward the “Not Regulate” strategy, whereas the convergence of generators toward recycling slows down, although their final strategy remains “Recycle”.
The sensitivity of the evolutionary trajectory to initial strategy probabilities highlights the importance of early-stage policy intervention and behavioral coordination among stakeholders. Although the system eventually converges to the same equilibrium under different initial conditions, the convergence speed and adjustment path vary significantly. This finding implies that initial policy signals and early participation by key actors can have a lasting impact on the development of the recycling system. In particular, stronger initial regulatory efforts can accelerate the adoption of proactive strategies by enterprises, thereby shortening the transition period toward a stable and efficient recycling system. Compared with existing studies, this result further emphasizes that not only the policy intensity but also the timing of intervention plays a crucial role in shaping the evolutionary path of multi-agent systems. More importantly, from a robustness perspective, the consistent convergence of the system under different initial probability settings indicates that the final equilibrium is not dependent on a particular starting configuration. In other words, variations in initial strategic preferences mainly influence how quickly the system evolves, rather than overturning its core evolutionary tendency under the modeled conditions.
5.2. Evolutionary Strategies Under Different Government Reward Amounts
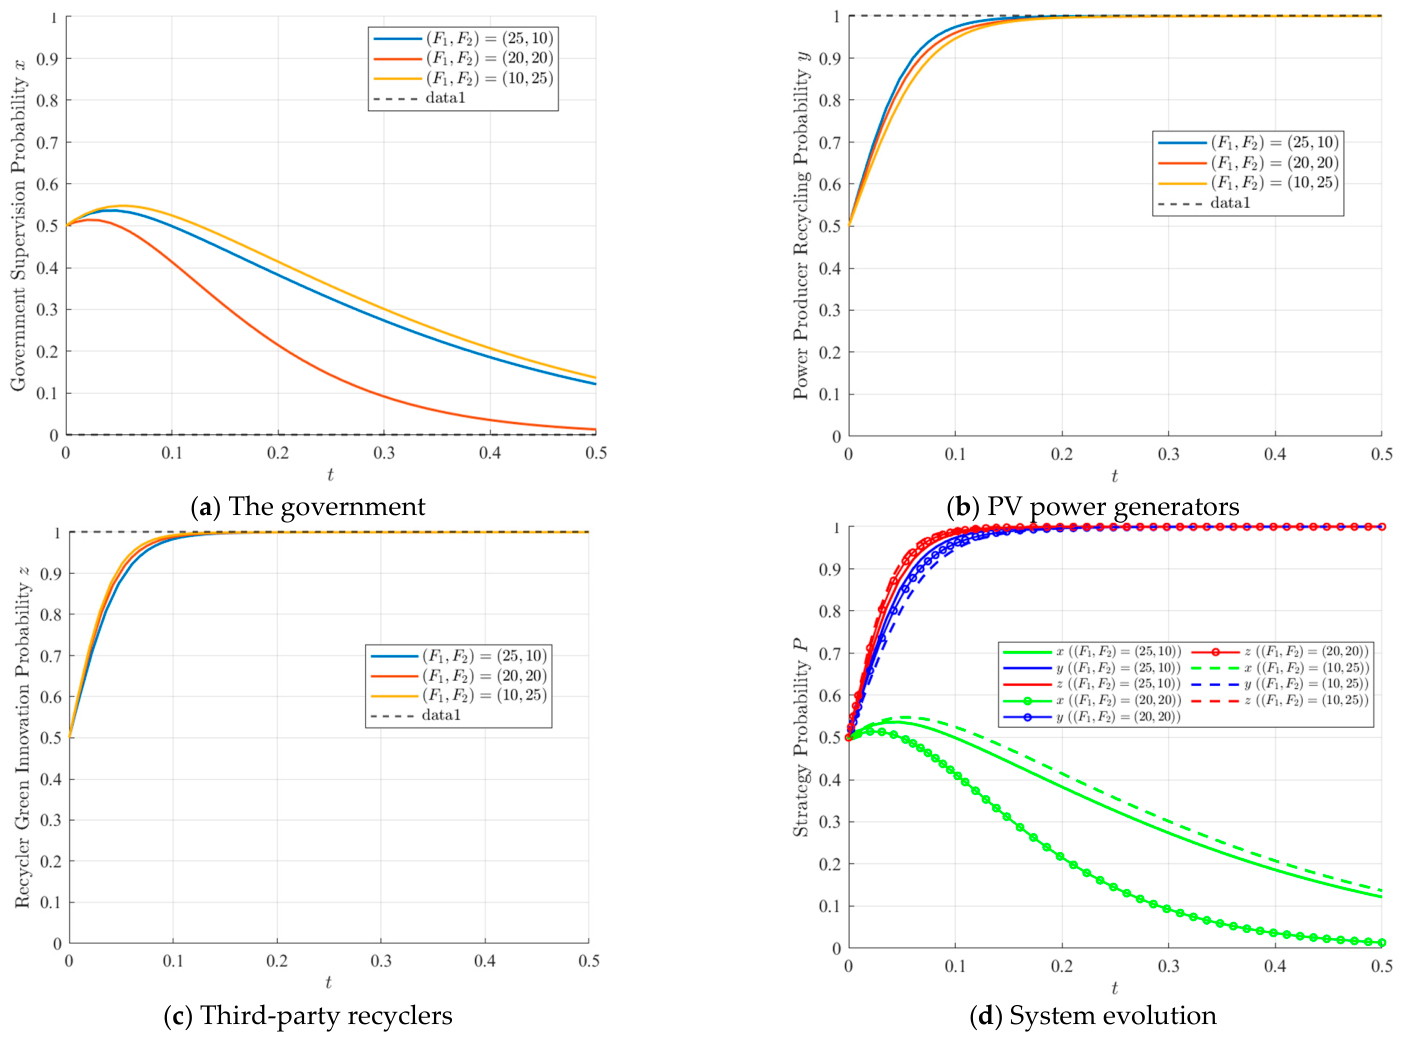
To investigate the effects of variations in government reward amounts on the evolutionary strategies of the three stakeholders, sensitivity analysis is performed using MATLAB R2023b (MathWorks, USA) (see
Figure 4). Based on the original parameter settings, the initial strategy probabilities for the government, power generation enterprises, and third-party recycling firms are set to
,
, and
, respectively. Three scenarios for reward allocation, represented as
, are assigned the values
,
, and
. The simulation results are presented in
Figure 4.
When the government provides different reward levels to generators and recyclers, distinct evolutionary dynamics emerge among the three agents. The reward settings are given as (25, 10), (20, 20), and (10, 25), corresponding to high–low, medium–medium, and low–high reward allocations for generators and recyclers, respectively.
It can be observed that when the total reward is maximized, i.e., under the (20, 20) strategy, the government converges most rapidly toward the “Not Regulate” strategy. This is because the total expenditure on rewards is highest in this scenario, which accelerates the adoption of proactive strategies by firms and reduces the need for sustained strict regulation.
When the total reward is fixed at 35, i.e., under (25, 10) and (10, 25), the government converges significantly faster toward “Not Regulate” under the (25, 10) strategy than under (10, 25). This indicates that, given the same total reward expenditure, increasing the reward intensity for generators is more effective in promoting the government’s transition toward non-regulation.
For generators and recyclers, the convergence rates of their strategies are positively correlated with their respective reward intensities. Specifically, the convergence rate of generators toward the “Recycle” strategy increases with , reaching its maximum under (25, 10) and minimum under (10, 25). Similarly, the convergence rate of recyclers toward “green recycling technological innovation” increases with , with the fastest convergence under (10, 25) and the slowest under (25, 10).
Overall, as government reward intensity increases, the convergence rates of both generators and recyclers toward proactive strategies accelerate. This suggests that reward-based policies effectively incentivize generators to adopt recycling and recyclers to implement green technological innovation, thereby providing strong positive guidance for the development of a photovoltaic module green recycling system.
The above results indicate that reward-based policy instruments play a stronger role than penalty-based instruments in accelerating the system’s convergence toward the desirable equilibrium. A possible explanation is that, in the context of end-of-life PV module recycling, both generators and recyclers face substantial upfront costs, including recycling network construction, logistics coordination, equipment upgrading, and green technology investment. Under such conditions, positive incentives directly improve the expected net return of proactive strategies, whereas penalties mainly increase the cost of passive behavior without necessarily compensating for the financial burden of active participation. Moreover, although different reward allocations affect the speed of convergence, they do not change the overall direction of system evolution in the simulated scenarios. From a robustness perspective, this suggests that the model’s main conclusion regarding the stronger role of reward-based incentives remains stable under reasonable variations in reward design. That is, parameter changes in the reward structure modify the pace of adjustment, but do not reverse the system’s tendency to evolve toward the desirable equilibrium under the assumed conditions.
5.3. Evolutionary Strategies Under Different Government Penalty Intensities
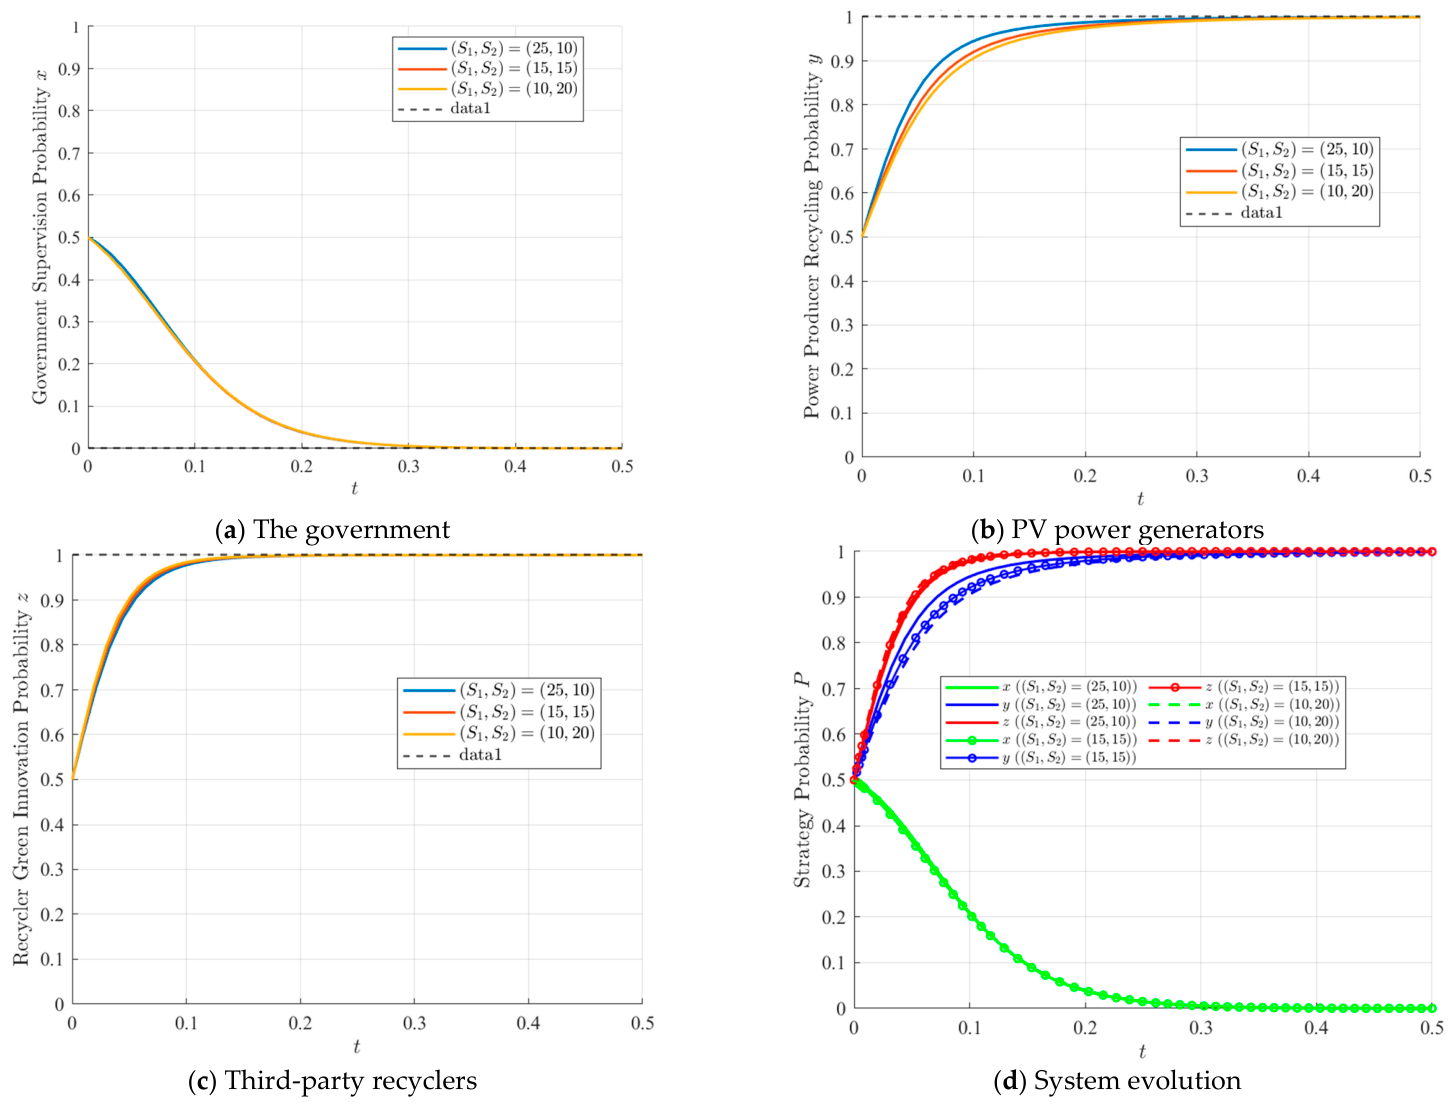
To investigate the effects of variations in government penalty amounts on the evolutionary strategies of the three stakeholders, sensitivity analysis is performed using MATLAB R2023b (MathWorks, USA) (see
Figure 5). Based on the original parameter settings, the initial strategy probabilities for the government, power generation enterprises, and third-party recycling firms are set to
,
, and
, respectively. Three scenarios for penalty allocation, represented as
, are assigned the values
,
, and
.
When the government imposes different penalty levels on generators and recyclers, distinct evolutionary dynamics arise among the three agents. The penalty settings are given as (25, 10), (15, 15), and (10, 20), corresponding to high–low, medium–medium, and low–high penalty allocations for generators and recyclers, respectively.
From the perspective of government strategy evolution, the convergence trends toward the “Not Regulate” strategy are highly consistent across the three scenarios, with only negligible differences in convergence rates. This is because the total penalties across the three settings are relatively similar, resulting in limited variation in the government’s cost–benefit structure. Therefore, differentiated penalty intensity has no significant impact on the government’s strategic evolution.
For generators and recyclers, the convergence rates of their strategies are positively correlated with their respective penalty intensities, indicating that penalty policies impose effective constraints on non-compliant behavior. Specifically, the convergence rate of generators toward the “Recycle” strategy increases with the penalty for non-compliance , reaching its maximum under (25, 10) and minimum under (10, 20). Similarly, the convergence rate of recyclers toward “green recycling technological innovation” increases with the penalty , with the fastest convergence under (10, 20) and the slowest under (25, 10).
Overall, as the penalty intensity for non-compliant behavior increases, both generators and recyclers exhibit faster convergence toward proactive strategies. This indicates that penalty-based policies effectively constrain non-recycling and non-green processing behaviors, thereby forcing market participants to adopt compliant strategies and providing a baseline guarantee for the standardized operation of the photovoltaic module recycling system.
Compared with the simulation results of reward-based policies, penalty policies exhibit more targeted constraint effects; however, their overall effectiveness in promoting the system’s evolution toward the optimal stable state is weaker than that of reward policies. This finding is consistent with the earlier theoretical conclusion that reward mechanisms have stronger incentive effects than penalty mechanisms.
The simulation results further show that penalty-based policies mainly exert a constraining effect on non-compliant behaviors, but their influence on the overall system evolution is relatively limited compared with reward-based mechanisms. This suggests that penalties alone may not be sufficient to induce a rapid transition toward proactive strategies, especially when firms face high initial investment costs. From a robustness perspective, the highly consistent convergence patterns observed under different penalty settings indicate that moderate changes in penalty intensity do not overturn the system’s final evolutionary tendency. Instead, they mainly affect the speed at which enterprises adjust their strategies. This further supports the stability of the simulation results and suggests that the core conclusions of the model are not highly sensitive to reasonable variations in penalty parameters.
5.4. Sensitivity Analysis of Future PV Market Scenarios
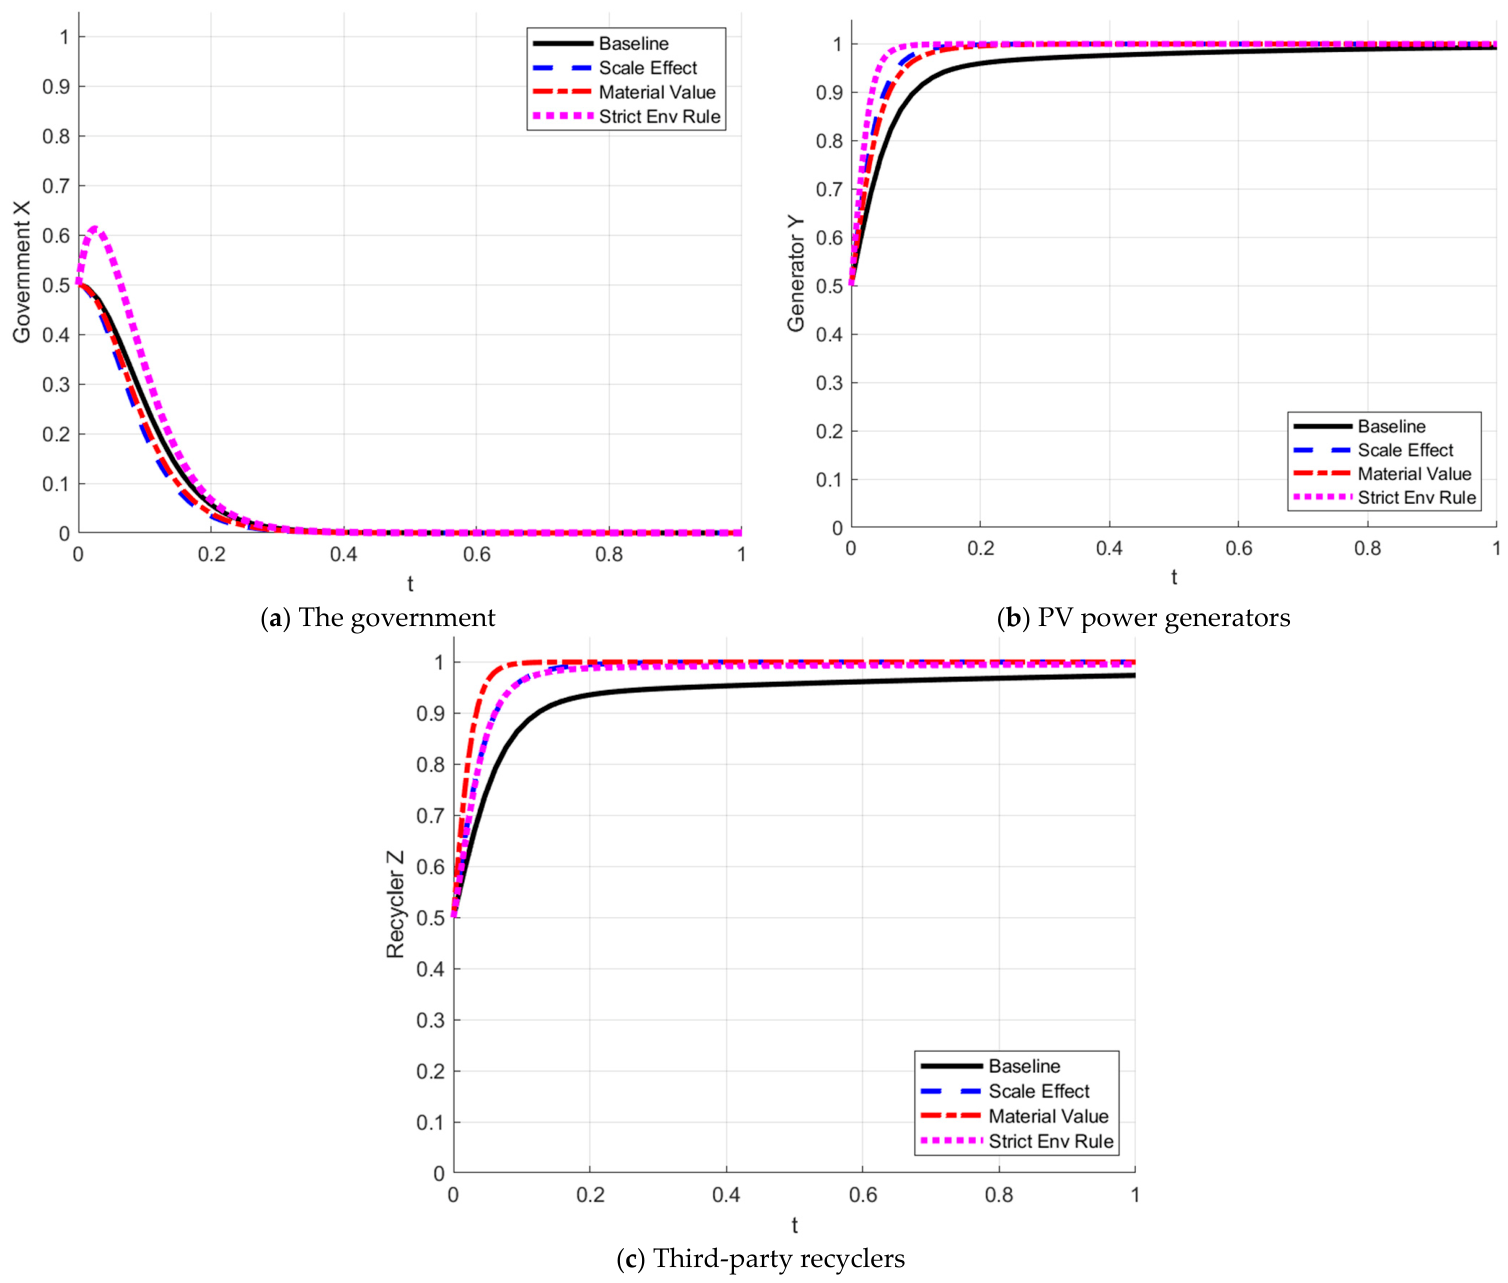
To explicitly address the dynamic evolution of the global photovoltaic (PV) industry and the anticipated surge in decommissioned modules, this section conducts a sensitivity analysis of key parameters under three projected future scenarios. To more intuitively observe the divergence of evolutionary paths, the baseline expected returns for proactive strategies are set close to the critical stability thresholds (, ) derived from the Jacobian matrix. This specific baseline simulates a stringent early-stage market environment, allowing for a clearer graphical demonstration of how future market and policy variations accelerate or alter system convergence. The time scale is set to . We introduce three distinct future scenarios representing the core trends of the PV recycling industry:
Scale Effect: A massive wave of decommissioned PV modules is expected to emerge, leading to a rapid accumulation of waste and significant economies of scale. Under this scenario, the basic recycling logistics cost of generators and the green innovation cost of recyclers are both reduced by 60%.
Material Value: With continuous technological advancements in PV systems, future retired modules are likely to contain higher proportions of valuable metals. In this scenario, the recycler’s innovation revenue increases substantially by 120%, while the generator’s residual value revenue rises moderately by 30%.
Strict Environmental Regulation: As new-generation PV modules involve increasingly complex chemical compositions, international environmental standards are expected to become more stringent. In this context, governmental penalties increase sharply, with penalties for non-compliant generators rising by 250% and those for non-green recyclers increasing by 80%.
The evolutionary trajectories of the three stakeholders under these scenarios are presented in
Figure 6.
Figure 6 illustrates the evolutionary trajectories of the government, power generation enterprises, and third-party recyclers under three future scenarios: Scale Effect, Material Value, and Strict Environmental Regulation. Despite differences in convergence speed, all scenarios ultimately reach the same stable equilibrium, where the government withdraws from regulation, generators recycle, and recyclers implement green innovation. This confirms the robustness of the model under varying market conditions.
The government exits regulation fastest under the Scale Effect scenario, as reduced recycling and innovation costs strengthen firms’ voluntary participation. Under Material Value, increased resource returns also promote non-regulation, while Strict Environmental Regulation slows government withdrawal due to reliance on external enforcement. Power generation enterprises converge fastest to recycling under Strict Environmental Regulation, reflecting the strong effect of increased penalties on non-compliance. Scale Effect and Material Value scenarios also accelerate convergence by reducing costs or increasing residual value, but their effect is weaker. Recyclers adopt green innovation fastest under the Material Value scenario, driven by higher returns from recovered materials. Scale Effect reduces innovation costs and moderately accelerates convergence. Strict Environmental Regulation promotes compliance through penalties but with slower adjustment compared to revenue-driven incentives.
Overall, the simulation results reveal a clear difference in the mechanisms affecting the two types of enterprises. For power generation enterprises, stricter environmental regulation produces the strongest short-term acceleration because penalties directly target non-recycling behavior. For recyclers, the increase in material value has the strongest effect because it directly improves the profitability of green innovation. At the system level, however, both market improvement and policy strengthening help push the system toward the desirable equilibrium. The difference lies in the channel through which they work. Market-based improvements mainly strengthen endogenous motivation by optimizing the cost–benefit structure, while regulatory tightening mainly accelerates adjustment by suppressing non-compliant behavior.
These findings provide important implications for the future design of PV module recycling policies. In the early stage of industry development, stricter environmental regulation remains necessary, especially for guiding generators to establish stable recycling behavior. At the same time, long-term policy design should place greater emphasis on fostering market conditions that improve the value of resource recovery and reduce the cost of green treatment. Once the economic viability of recycling and innovation is sufficiently strengthened, the dependence of the system on continuous government regulation will gradually decline. In this sense, the future evolution of the PV module recycling system will depend not only on regulatory pressure, but also on the combined effects of technological progress, economies of scale, and value enhancement in recovered materials. More importantly, the fact that the system converges to the same desirable equilibrium across different future market scenarios provides additional evidence of model robustness. Although different parameter changes alter the speed and pathway of adjustment, they do not overturn the core evolutionary tendency identified by the theoretical analysis.
6. Conclusions
By constructing a tripartite evolutionary game model involving the government, power generation enterprises, and recycling firms in the context of photovoltaic module recycling, and combining system stability analysis with numerical simulations, this study systematically investigates the interaction mechanisms, evolutionary trajectories, and the effects of key parameters on the strategic choices of the three stakeholders. The main findings of this study are summarized as follows.
In the tripartite game of PV module recycling, the evolutionary stable strategy of the system is , indicating that the government eventually tends to adopt a non-regulatory strategy, while power generation enterprises and recycling firms converge to the strategies of active recycling and green treatment, respectively. This result suggests that, under certain conditions, even after the government withdraws from direct regulation, market mechanisms can still induce enterprises to voluntarily fulfill their recycling responsibilities, thereby achieving coordination between environmental benefits and economic performance. Government regulation plays a significant role in guiding enterprise behavior at the early stage of the evolutionary process; however, as firms’ willingness to recycle gradually strengthens, the necessity of regulatory intervention correspondingly declines.
Significant dynamic dependencies exist among the strategic evolution of the three stakeholders. An increase in the probability of government regulation effectively accelerates the convergence rate of power generation enterprises and recyclers toward active strategies. Conversely, an increase in the initial participation willingness of either power generators or recyclers alleviates regulatory pressure, prompting the government to converge more rapidly to the “non-regulation” strategy. Furthermore, a positive shift in the strategy of one enterprise exerts an inhibitory effect on the convergence rate of the other, reflecting the substitution and complementarity relationships between their strategies.
Among government regulatory instruments, reward mechanisms exert a significant incentive effect on enterprises’ willingness to participate. An increase in reward amounts effectively accelerates the convergence rate of enterprises adopting “recycling” and “green recycling technological innovation” strategies, although this is accompanied by increased government expenditure. In contrast, penalty mechanisms function as a deterrent against passive corporate behaviors, yet their effectiveness is contingent upon the rational calibration of penalty intensity. Simulation results indicate that, under the condition of equal total reward amounts, allocating higher rewards to power generation enterprises promotes the government’s rapid convergence to the “non-regulation” strategy more effectively than offering higher rewards to third-party recycling firms.
The evolutionary trajectories of the system are highly sensitive to initial strategy probabilities. Minor adjustments to government or corporate strategies during the initial stage can trigger significant variations in the system’s convergence paths and rates. This underscores the pivotal role of the timing of policy intervention and the establishment of a cooperative foundation in fostering the sound development of the recycling system. In addition, the simulation results under different initial conditions and alternative policy parameter settings show broadly consistent convergence patterns, suggesting that the main conclusions of this study are robust within a reasonable range of parameter variations.
Further simulation under different future PV market scenarios also confirms the robustness of the model conclusions. Under the three scenarios of Scale Effect, Material Value, and Strict Environmental Regulation, the system still converges to the same desirable equilibrium, although the convergence speed of each stakeholder differs across scenarios. Specifically, the Scale Effect scenario accelerates the government’s transition toward the “non-regulation” strategy by lowering recycling and innovation costs, Strict Environmental Regulation most strongly promotes generators’ recycling behavior through stronger penalties on non-compliance, and the Material Value scenario most strongly stimulates recyclers’ green technological innovation by improving the profitability of resource recovery. These results indicate that both market-based improvements and strengthened regulation can promote the evolution of the PV module recycling system, but through different channels: the former mainly enhances endogenous motivation by optimizing the cost–benefit structure, whereas the latter mainly accelerates behavioral adjustment by suppressing non-compliant strategies.
Based on the above findings, several targeted implications can be derived for different stakeholders.
For governments, policy design should place greater emphasis on incentive-based measures during the early stages of system development. Providing sufficient financial support to power generation enterprises can effectively increase their willingness to participate in recycling activities and help establish a stable flow of retired modules. At the same time, appropriate support for recycling enterprises can encourage the adoption of environmentally friendly processing technologies. Penalty measures should be maintained at a reasonable level to discourage non-compliant behaviors, but they should mainly serve as a supplementary tool rather than the primary driver. As the recycling system matures and enterprises gradually adopt proactive strategies, governments can reduce direct intervention and shift toward supervision, coordination, and information disclosure. At the same time, policymakers should also pay attention to future market changes such as scale expansion, material value improvement, and tightening environmental standards, and dynamically adjust policy tools according to the different response characteristics of generators and recyclers.
For photovoltaic power generation enterprises, the key is to improve the economic attractiveness of recycling activities. This can be achieved by optimizing internal processes such as dismantling, storage, and transportation, thereby reducing operational costs. In addition, exploring diversified value recovery channels and strengthening cooperation with recycling enterprises can help increase expected returns and reduce uncertainty. Establishing long-term partnerships can further enhance stability in the recycling process. Furthermore, from an economic perspective, generators must weigh immediate material recycling against alternatives such as reuse or gifting. Currently, repurposing functional modules for second-life applications or gifting them often presents a more favorable short-term economic return, as these options bypass the high capital and energy costs associated with mechanical dismantling and material extraction. However, while reuse maximizes residual value and extends the operational lifespan of the modules, it merely delays ultimate disposal. Therefore, generators should strategically integrate second-life markets with eventual material recycling to optimize lifecycle economics.
For third-party recycling enterprises, priority should be given to improving technological capabilities and enhancing resource recovery efficiency. Investing in advanced processing technologies and optimizing operational processes can help increase economic returns from green recycling. At the same time, close collaboration with power generation enterprises can ensure a stable supply of retired modules, which is essential for maintaining economic viability.
Moreover, the impending commercialization of emerging technologies like perovskite and perovskite/silicon tandem modules requires forward-looking policies. With many companies accelerating their industrialization, these modules will introduce new challenges due to their shorter operational lifetimes and lead content, leading to a faster accumulation of high-risk PV waste. To manage this, policymakers should emphasize the Extended Producer Responsibility framework. Original manufacturers should be encouraged to implement end-to-end closed-loop recycling models, similar to the approach of First Solar. Internalizing waste management allows manufacturers to handle hazardous materials safely and recover valuable secondary resources early in the commercialization phase.
Overall, strengthening coordination among stakeholders and aligning policy incentives with market mechanisms are essential for promoting the sustainable and standardized development of photovoltaic module recycling systems.
This study contributes to the evolutionary game literature on recycling systems in two important ways. First, it extends the application of evolutionary game theory to the context of end-of-life photovoltaic module recycling, highlighting how cost–benefit structures and policy instruments jointly shape the strategic evolution of multiple stakeholders. Second, the results reveal that reward and penalty mechanisms do not function symmetrically: reward-based incentives play a more significant role in accelerating cooperative behavior, while penalties mainly provide a baseline constraint on non-compliant strategies. This finding enriches the theoretical understanding of regulatory design in emerging circular economy systems characterized by high initial investment and technological uncertainty.
Despite the contributions of this study, several limitations should be acknowledged.
First, this study is conducted under a simplified analytical framework that assumes a single regulatory authority implementing a unified reward–penalty mechanism. While this assumption facilitates model tractability and highlights the role of policy instruments, it does not fully capture the complexity of multi-level governance structures observed in practice, such as variations in policy design and enforcement across different regions and administrative levels.
Second, PV power generators are treated as relatively homogeneous decision-making agents. However, in reality, significant heterogeneity exists among different types of generators. For instance, small-scale distributed PV system owners may face higher transportation and transaction costs and exhibit weaker responsiveness to policy incentives compared to large-scale utility operators. Such differences may affect participation in recycling activities and the effectiveness of regulatory policies.
Third, this study treats power generators and third-party recyclers as distinct entities, but industry evolution may alter this structure. As new technologies like perovskites scale up, large-scale manufacturers might adopt end-to-end lifecycle management to safely handle toxic elements and protect their intellectual property. Under this model, the manufacturer merges the roles of technology provider and recycler. Future research should incorporate the Extended Producer Responsibility mechanism into the evolutionary game framework to explore scenarios where PV manufacturers directly participate in the recycling supply chain.
Moreover, recycling enterprises require a stable and sufficient supply of end-of-life PV modules to maintain economic viability. In practice, due to transportation costs, regulatory constraints, and market incentives, some waste flows may be diverted to informal channels or transferred across regions rather than being processed through formal recycling systems. These factors are not explicitly incorporated into the current model.
Future research could extend this study by incorporating multi-level government structures, heterogeneous agents, and informal recycling channels, thereby improving the model’s applicability to more complex real-world scenarios and enhancing its policy relevance.