1. Introduction
Against the backdrop of a rapidly changing global market and technological progress, enterprises are facing unprecedented challenges and opportunities. In this context, new quality productive forces, as an important indicator for measuring the sustainable development capacity of modern enterprises, have increasingly attracted attention from both academia and practice. In September 2023, General Secretary Xi Jinping, during a local inspection, formally introduced the concept of “new quality productive forces” for the first time. He emphasized that technological innovation should serve as the primary driving force and called for accelerating the development of productive forces characterized by high technology, high efficiency, and high quality. The core of new quality productive forces lies in innovation-driven development. Through the integration of technological breakthroughs, economic growth, and industrial upgrading, a modern industrial system can be established. As a key component, technological innovation facilitates the reallocation of production factors and enhances total factor productivity by upgrading traditional industries, fostering emerging sectors, and promoting industrial integration [
1]. New quality productive forces also contribute to sustainable development. As the micro-level carriers of social production, enterprises’ new quality productive forces constitute a fundamental component of national productive capacity and largely determine the overall level of a country’s new quality productive forces [
2]. As a new form of productivity emerging in the digital economy era, new quality productive forces are closely linked to digital transformation. Digital transformation enables enterprises to improve the efficiency of resource allocation and promote industrial upgrading. Specifically, it supports data-driven decision-making, enhances production efficiency, and optimizes the allocation of production factors through intelligent technologies, thereby improving total factor productivity. Moreover, digital transformation helps break down barriers between traditional industries and digital technologies, facilitating cross-industry integration and innovation. This accelerates the transition toward productive systems characterized by high technology, high efficiency, and high quality, and promotes the sustainable development of enterprises [
3]. From a practical perspective, enterprises’ digital transformation provides strong technological support and a favorable market environment for the development of new quality productive forces. With the rapid advancement of digital technologies such as cloud computing, big data, and artificial intelligence, these tools have been widely applied in production, manufacturing, and logistics, thereby enhancing enterprises’ innovation capacity and improving the flexibility and adaptability of supply structures [
4]. Therefore, digital transformation is not only an important pathway for developing new quality productive forces but also a key driver of industrial innovation and structural optimization. New quality productive forces represent an advanced form of productivity characterized by the integration of digital technologies and significant improvements in total factor productivity. Their development is particularly important in the context of a new wave of technological revolution and industrial transformation. Emerging digital technologies, such as artificial intelligence, are reshaping traditional production modes and accelerating industrial upgrading. Under these conditions, traditional forms of productivity are no longer sufficient to meet future development needs.
Since the Industrial Revolution, manufacturing has played a crucial role in driving technological innovation and economic development, and it remains a core component of the real economy. In China, its importance is particularly evident. Manufacturing not only serves as a vital pillar of the national economy but also represents a key pathway to national prosperity and rejuvenation. Within the energy–environment–economy system, the manufacturing sector plays a central role by linking energy consumption, economic growth, and environmental impacts [
5]. At the same time, the rapid development and widespread application of digital technologies—such as big data, cloud computing, blockchain, and artificial intelligence—have accelerated the digital transformation of manufacturing enterprises. The digital economy has become an important driver of China’s economic growth. Technologies and data elements involved in digital transformation facilitate the emergence of new business models and growth drivers, enhance industrial efficiency, and play a key role in fostering the development of new quality productive forces. On 11 May 2024, Premier Li Qiang presided over an executive meeting of the State Council, during which the “Action Plan for the Digital Transformation of the Manufacturing Sector” was approved. The meeting emphasized that digital transformation in manufacturing is a critical step toward advancing new industrialization and building a modern industrial system. Therefore, the digital transformation of the manufacturing sector is of great significance for developing new quality productive forces and promoting the construction of a modern industrial system. Examining its effects and underlying mechanisms not only helps to clarify the internal logic and pathways of manufacturing transformation and upgrading but also provides theoretical support and practical guidance for achieving high-quality and sustainable economic development.
The existing literature generally suggests that enterprises’ digital transformation can significantly enhance production efficiency and firm performance by optimizing resource allocation, reducing information asymmetry, and promoting technological innovation. However, as digital investment continues to grow, whether its impact on firm performance maintains a consistent linear positive relationship remains inconclusive. On the one hand, some studies argue that digital transformation can continuously generate efficiency gains. On the other hand, other studies find that as transformation deepens, enterprises may face challenges such as increased technological complexity, rising organizational and coordination costs, and diminishing marginal returns, thereby weakening their positive effect on productivity. These findings indicate that the impact of digital transformation on firm productivity may exhibit nonlinear characteristics. However, the existing literature remains limited, particularly with regard to systematic empirical evidence based on micro-level enterprise data.
Furthermore, the internal mechanisms through which digital transformation affects productivity warrant further exploration. Existing literature mainly explains this relationship from the perspectives of technological innovation, resource allocation efficiency, and organizational change. However, relatively few studies incorporate green development factors into a unified analytical framework. Under the constraints of the dual carbon targets, enterprises are increasingly transitioning toward green and low-carbon production modes. Green technological innovation and reductions in carbon emission intensity not only reflect enterprises’ environmental performance but also significantly affect production efficiency and long-term competitiveness. On the one hand, digital transformation enables cost reduction and efficiency improvement in green innovation through data-driven capabilities and technological synergy. On the other hand, the application of digital technologies in energy management and production optimization helps reduce carbon emission intensity. However, as digital transformation deepens, the rising energy consumption of digital infrastructure and technological path dependence may weaken its environmental and efficiency gains. Therefore, incorporating green technological innovation and carbon emission intensity into the analytical framework helps to more comprehensively reveal the transmission mechanisms through which digital transformation affects new quality productive forces.
Based on the above analysis, this paper uses data on Chinese A-share manufacturing listed enterprises from 2015 to 2023 as the research sample and systematically investigates the impact of digital transformation on enterprises’ new quality productive forces and their underlying mechanisms. Specifically, this paper addresses the following three questions: First, does an enterprise’s digital transformation exert a nonlinear effect on new quality productive forces, and how can its boundary conditions be defined? Second, do green technological innovation and carbon emission intensity serve as important mediating mechanisms through which digital transformation affects new quality productive forces? Third, are there significant heterogeneities in the above relationships across different regions and industries?
To empirically examine the proposed relationships, this study adopts a panel data regression framework based on firm-level longitudinal data. This approach is particularly suitable as it allows us to control for unobserved heterogeneity across firms and over time. Moreover, given that the core research question concerns a potential non-linear relationship, we introduce a quadratic specification of digital transformation to test for an inverted U-shaped effect. In addition, to address potential endogeneity concerns, we incorporate firm fixed effects, a comprehensive set of control variables, and conduct multiple robustness checks. This empirical strategy is closely aligned with the theoretical framework and enables a more rigorous identification of the relationship between digital transformation and new quality productivity. Compared with existing studies, the marginal contributions of this paper are mainly reflected in the following three aspects. First, from a nonlinear perspective, this paper identifies an inverted U-shaped relationship between enterprises’ digital transformation and new quality productive forces, thereby extending the existing literature based on linear assumptions. Second, this paper establishes a dual mediating mechanism of “green technological innovation and carbon emission intensity” to reveal the underlying pathways through which digital transformation affects new quality productive forces, thereby integrating the digital economy and green development into a unified analytical framework. Third, based on multidimensional heterogeneity analysis of regional characteristics and industrial pollution intensity, this paper examines the contextual dependence of digital transformation. This provides empirical evidence for formulating differentiated policies on digitalization and green transformation.
The structure of this paper is as follows.
Section 2 systematically reviews the relevant literature on new quality productive forces and digital transformation, and identifies research gaps in the existing literature.
Section 3 constructs a theoretical analytical framework and proposes research hypotheses based on theories of corporate digital capabilities, the resource-based view, and innovation theory.
Section 4 introduces the sample selection, variable definitions, and model specification.
Section 5 empirically examines the impact of enterprises’ digital transformation on new quality productive forces through baseline regression analysis and various robustness tests.
Section 6 further investigates the mediating mechanisms of green technological innovation and carbon emission intensity.
Section 7 conducts heterogeneity analysis from the perspectives of regional characteristics and industrial pollution intensity.
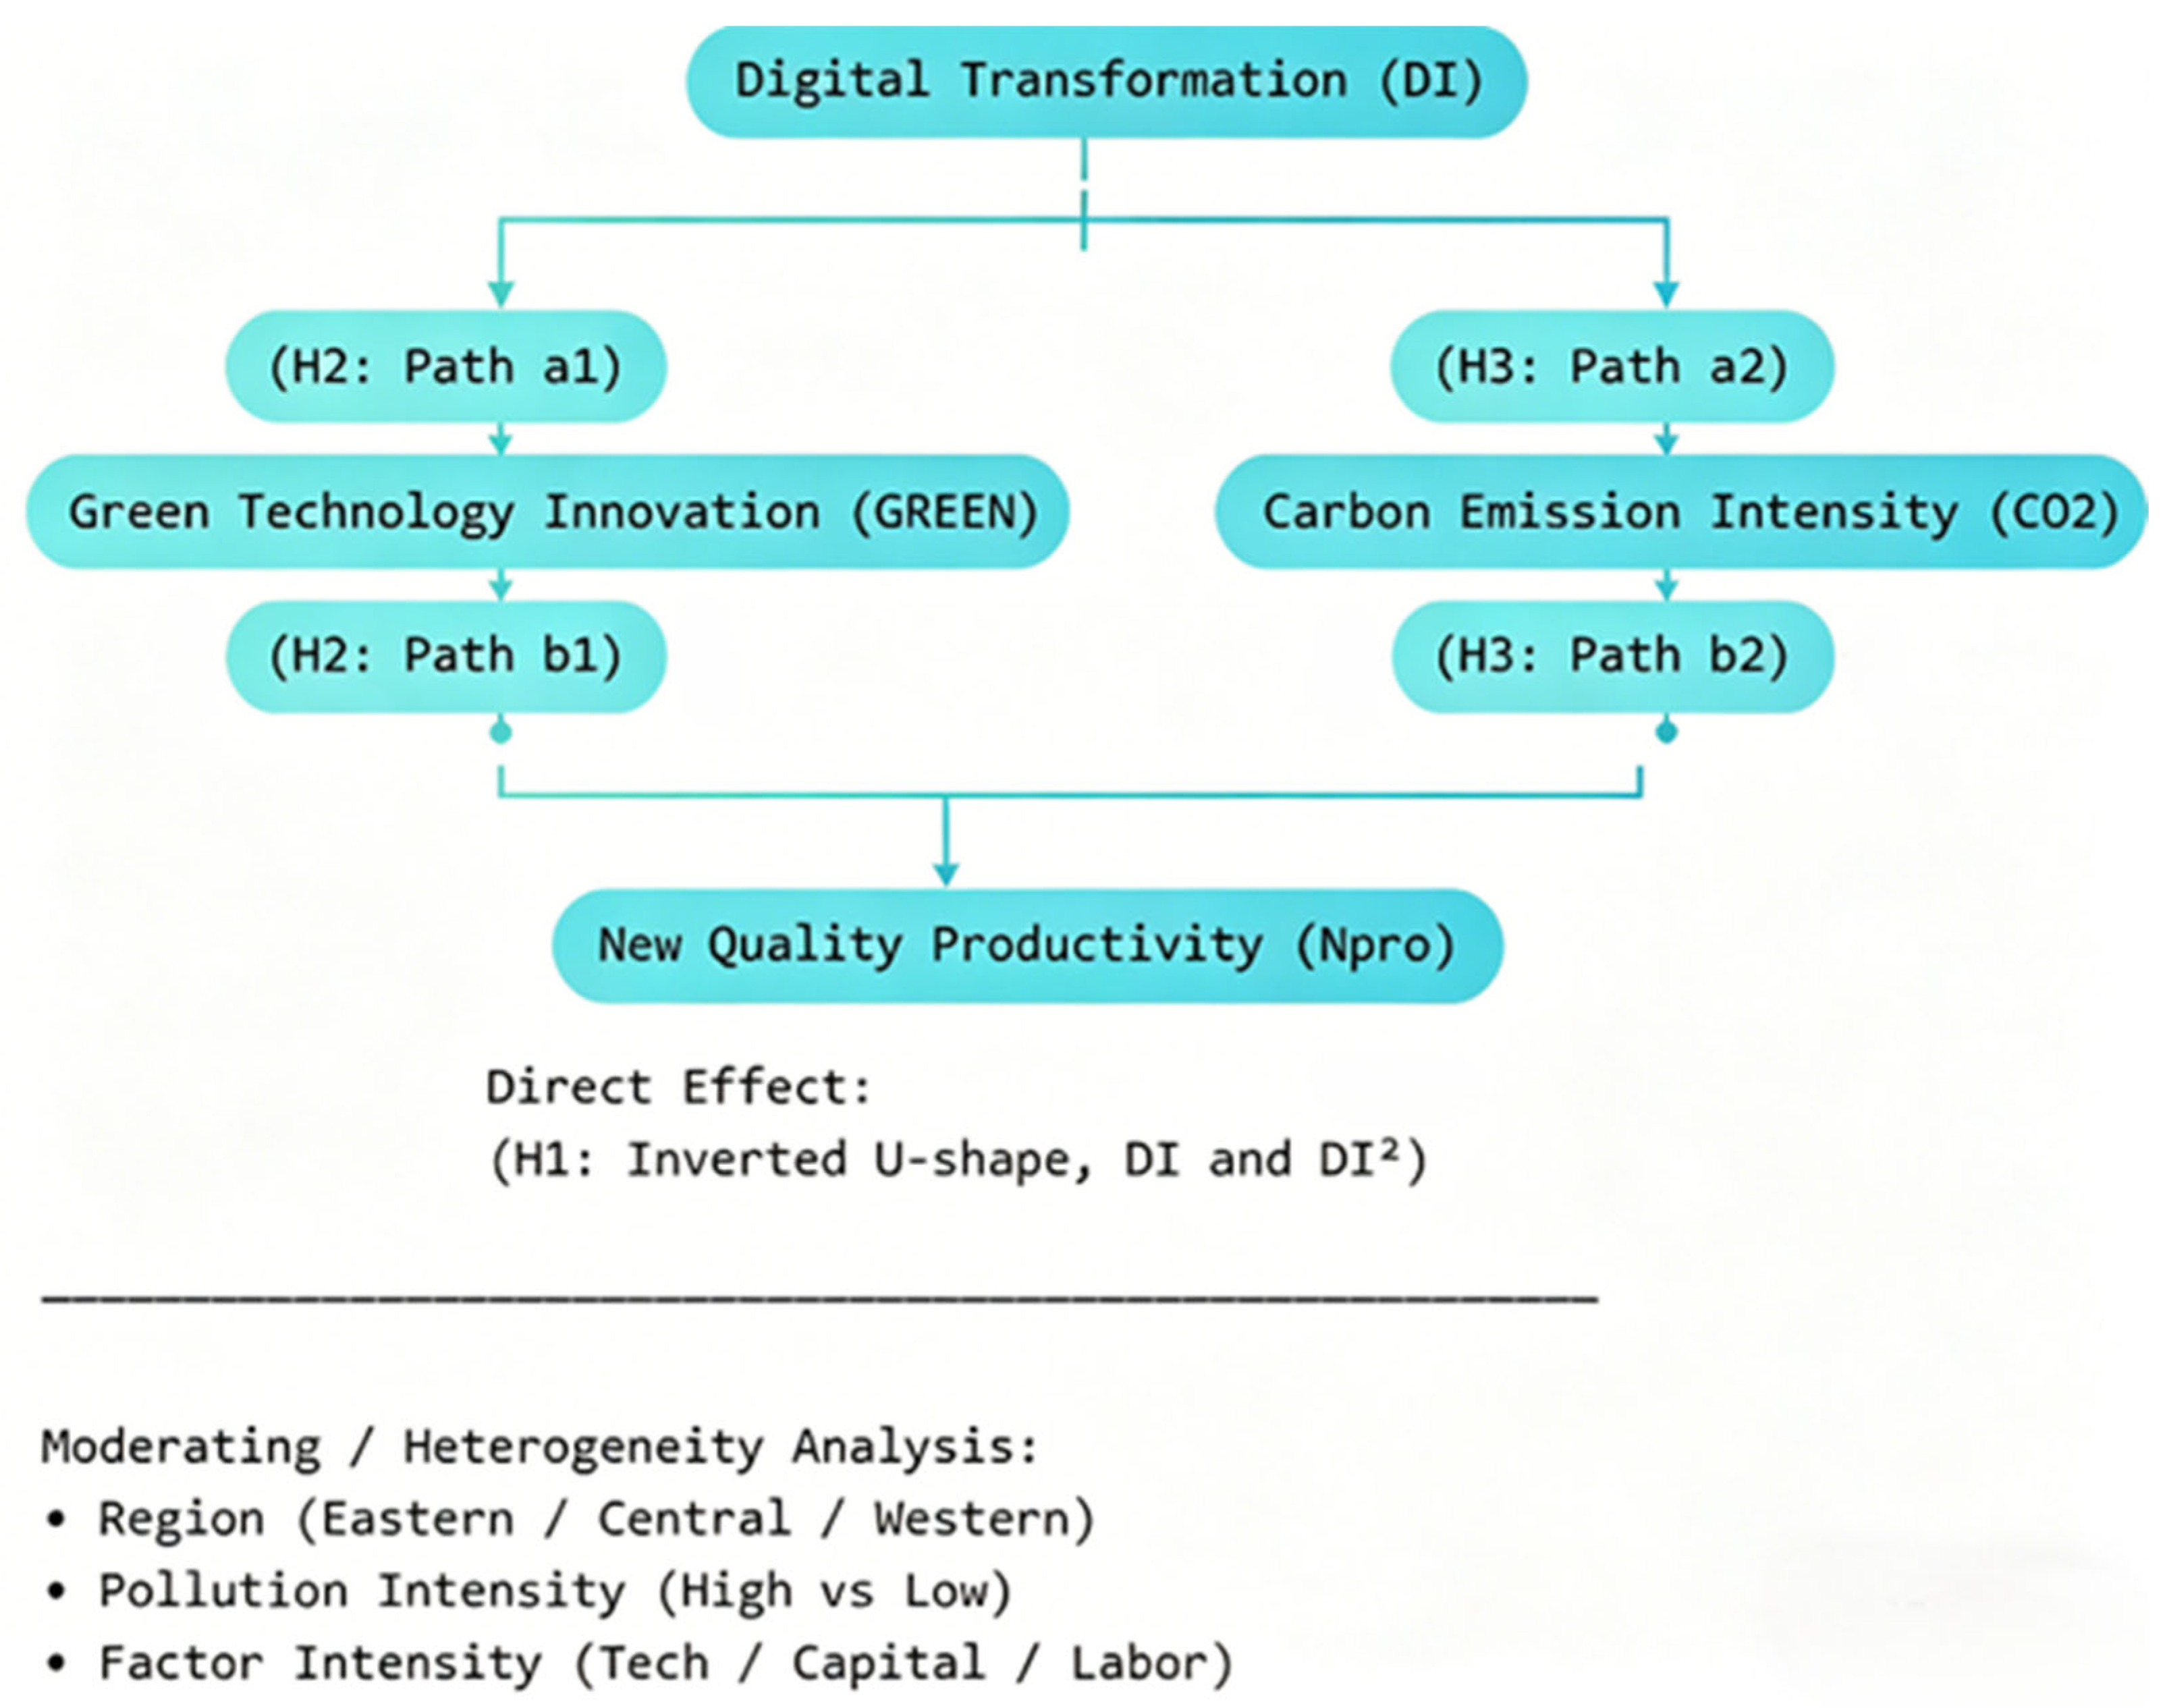
Section 8 summarizes the main conclusions and provides policy implications as well as directions for future research. The overall research framework of this paper is shown in
Figure 1.
2. Literature Review
2.1. Connotation and Measurement of New Quality Productive Forces
As an important concept proposed in recent years, “new quality productive forces” essentially represent a new form of productivity driven by scientific and technological innovation, and characterized by efficiency improvement and green development. In multiple important meetings and official reports, General Secretary Xi Jinping has repeatedly emphasized the significance of developing new quality productive forces. He pointed out that new quality productive forces have already taken shape in practice and have demonstrated a strong driving and supporting role in high-quality development [
6]. Subsequently, this concept has become a new academic focus in the literature, triggering a surge of related studies and marking the beginning of systematic academic research in this field [
7]. Existing studies mainly focus on two aspects: theoretical connotation and indicator measurement.
Theoretically, the academic community generally agrees that new quality productive forces differ from traditional productivity in that they rely on digital technologies, green technologies, and high-end production inputs. Through the reconfiguration of production factors and shifts in technological paradigms, these forces enable simultaneous improvements in production efficiency and development quality. Related research systematically explains the formation mechanisms of new quality productive forces from the perspectives of technological innovation, industrial structure upgrading, and factor allocation optimization, and argues that their core lies in the organic unity of “innovation-driven development, efficiency improvement, and green transformation.” When discussing the broad and narrow definitions of new quality productive forces, scholars further clarify the boundaries and categories of this concept. In a broad sense, new quality productive forces encompass all new forms of productivity that can promote social progress and civilizational development, including but not limited to information technology, biotechnology, and new energy technologies [
8]. In a narrow sense, they focus on the significant impact of specific technological innovations in certain fields on productivity improvement [
9]. Overall, existing theoretical research primarily explores new quality productive forces from perspectives such as comparisons with traditional productivity, qualitative innovation, disciplinary perspectives, and different theoretical frameworks, thereby enriching the theoretical understanding of new quality productive forces. These substantial research findings lay a solid foundation for subsequent empirical studies.
In terms of measurement methods, the existing literature mainly adopts two approaches. The first is a comprehensive evaluation method based on a multidimensional indicator system, which constructs an index system from the dimensions of scientific and technological innovation, green development, and production efficiency, and measures it using the entropy method or principal component analysis. Lu et al. (2024) [
10] constructed a comprehensive framework based on three primary indicators—scientific and technological productivity, green productivity, and digital productivity—as well as six secondary and eighteen tertiary indicators. They then applied an improved entropy weight method to assign weights to these indicators, thereby establishing a measurement framework for new quality productive forces. Sun et al. (2024) [
11] selected 14 specific indicators from the dimensions of scientific and technological innovation, industrial upgrading, and development conditions to construct an evaluation index system for new quality productive forces, and used the entropy weight method to measure its development level. The second approach is based on the decomposition of productivity factors, constructing an index system from the perspectives of labor, means of production, and technological factors to capture structural changes in productivity. Wang et al. (2023) [
12], based on Marxist political economy theory, constructed a comprehensive evaluation index system of new quality productive forces from three dimensions: laborers, labor objects, and means of production. They employed multiple methods, including the entropy method, Dagum Gini coefficient decomposition, and exploratory spatial data analysis, to obtain the final measurement results. Song et al. (2024) [
13] proposed that, based on the theory of the two-factor structure of productivity and integrating the innovative connotation of new quality productive forces, the index system can be constructed from two dimensions: labor (living labor and objectified labor) and means of production (hard technology and soft technology). Fourteen specific indicators were selected. The entropy method was used for weighting, and principal component analysis was applied for dimensionality reduction, thereby forming an evaluation framework for enterprises’ new quality productive forces. Overall, although existing studies have made progress in index construction, there are still significant differences in indicator selection and weighting schemes across studies, and a unified measurement standard has not yet been established.
2.2. Research on Digital Transformation
With the development of the digital economy, the economic consequences of enterprises’ digital transformation have become a central topic of academic attention. Existing studies generally suggest that digital transformation can significantly improve enterprise performance and production efficiency by enhancing information processing capabilities, optimizing resource allocation, and promoting business model innovation. This “positive spillover effect” has been supported by most empirical evidence. Berman (2012) [
14] pointed out that digital transformation is a process in which enterprises adopt digital technologies to strengthen customer interaction and collaboration by reshaping customer value propositions and transforming business operating models in a dynamic market environment. This enables enterprises to respond more quickly to changes in customer demand and formulate corresponding strategies to meet such demand, thereby enhancing business model innovation and competitive advantage. Demirkan et al. (2016) [
15] argued that digital transformation is essentially a strategic process of systematically reconstructing enterprises’ overall systems through the deep integration of digital technologies and data elements. In other words, it involves using digital technologies and data analytics to optimize existing business processes, enhance enterprise capabilities, and create new business models. This transformation goes beyond instrumental application and triggers multidimensional changes, including cultural transformation, institutional innovation, and strategic ecosystem reconstruction. Wang et al. (2024) [
16] pointed out that digital transformation involves enterprises comprehensively transforming their organizational structures, operational processes, workforce skills, and infrastructure through digital technologies, in order to adapt to the digital environment and build new business models and competitive advantages. Li et al. (2025) [
17] further emphasized that digital transformation is a process of digitally upgrading enterprises’ business processes, operational modes, management practices, and organizational structures by leveraging technologies such as 5G, big data, the Internet of Things, and artificial intelligence.
In summary, this paper argues that digital transformation refers to a process by which enterprises use digital technologies (such as artificial intelligence, blockchain, cloud computing, and big data) to reshape customer value propositions and business models across multiple dimensions. However, as the literature continues to evolve, scholars have gradually recognized that the impact of digital transformation does not always follow a linear pattern. On the one hand, some studies suggest that digital investment can continuously generate efficiency gains, thereby enhancing enterprises’ competitiveness through the effective use of data. On the other hand, other studies indicate that as digital transformation progresses, enterprises may face increasing technological complexity, higher system maintenance costs, and greater challenges in organizational coordination. These factors may lead to diminishing returns and even the so-called “over-digitalization.”
The above differences indicate that the impact of digital transformation on enterprises’ productivity may not follow a simple linear relationship but instead exhibits significant nonlinear characteristics. However, most existing studies are based on linear models and lack systematic tests of their “optimal range” and “boundary conditions,” especially micro-level empirical evidence from the perspective of new quality productive forces.
At present, there is no unified approach for measuring the degree of digital transformation in the literature, which can be mainly summarized into two categories: the digital intangible assets ratio method and the text analysis method. On the one hand, the digital intangible assets ratio method measures the degree of digital transformation of listed enterprises by calculating the proportion of digital-related intangible assets at the end of the year relative to total intangible assets. Qi et al. (2020) [
18] pointed out that when measuring the degree of digital transformation of enterprises, researchers can refer to detailed records of intangible assets in corporate financial statements and identify digital economy-related components, such as items containing keywords like “software,” “client,” and “intelligent platform,” as well as relevant patent information. The total value of these digital intangible assets is then summed up, and their proportion in total intangible assets is calculated. This proportion is finally used to reflect the degree of digital transformation of enterprises. On the other hand, the text analysis method extracts and counts the frequency of digital transformation-related keywords from annual reports of listed enterprises and constructs measurement indicators through systematic text mining procedures. Zhao et al. (2021) [
19] analyzed sample enterprises from four dimensions—digital technology application, internet-based business models, intelligent manufacturing, and modern information systems. They extracted keywords for each dimension and calculated their frequency in corporate disclosures. Based on this information, a digital transformation index was constructed, and the entropy method was used to assign weights to different indicators, thereby measuring the level of digital transformation. Wu et al. (2021) [
20] constructed a measurement model of digital transformation from two dimensions: underlying digital technology application and applied digital transformation practices. Specifically, keywords related to artificial intelligence, blockchain, cloud computing, big data, and digital integration were identified from textual data sources. High-frequency terms were systematically extracted and compiled into a frequency database. The frequency data were then aggregated and processed using methods such as logarithmic transformation. Ultimately, a quantitative index system was developed to measure the degree of digital transformation of enterprises.
2.3. The Mechanism of Digital Transformation Affecting the New Quality Productivity of Enterprises
At the mechanism level, existing studies mainly explain how digital transformation affects enterprises’ productivity from the perspectives of technological innovation, resource allocation efficiency, and organizational transformation.
As a core engine driving the development of new quality productive forces, digital transformation is assigned a fundamental and strategic role in academic literature. Scholars have conducted systematic investigations from multiple dimensions. Zhang et al. (2024) [
21] focus on the empowerment mechanism of digital transformation, arguing that it provides essential technologies and key elements required for technological innovation, establishes advanced strategic management models for managerial innovation, and creates an intelligent digital environment for business model innovation. Hou et al. (2024) [
22] examine the restructuring of production factors and point out that digital transformation in the manufacturing sector promotes the reorganization and upgrading of production factors. In this process, data, as a new production factor, are integrated with traditional factors, optimizes resource allocation and development patterns, improves production efficiency, and provides new momentum for productivity growth. Moreover, data elements enhance labor capabilities, enrich means of production, and expand the scope of labor objects. From the perspective of supply chain resilience, Wang and Hu (2024) [
23] find that digital transformation significantly promotes the growth of enterprises’ new quality productive forces. From a macro-industrial perspective, Yang et al. (2024) [
24] argue that technological innovation is central to optimizing industrial structure and advancing productivity, while digital transformation enhances enterprises’ innovation capacity and efficiency, reduces energy consumption, delivers high-quality and efficient supply, improves supply–demand matching, and ultimately leads to a qualitative leap in productivity. In summary, this paper argues that digital transformation primarily drives the upgrading of new quality productive forces through technological empowerment, factor restructuring, and efficiency enhancement.
First, from the perspective of technological innovation, digital transformation promotes data empowerment and knowledge sharing, reduces R&D costs and uncertainty, and thereby enhances enterprises’ innovation capabilities. Existing studies suggest that the application of digital technologies improves R&D efficiency, accelerates technology diffusion, and facilitates the transition from factor-driven growth to innovation-driven development.
Second, from the perspective of resource allocation, digital transformation reduces information asymmetry and transaction costs, improves resource allocation efficiency, and enables enterprises to better match production factors to market demand, thereby enhancing total factor productivity.
However, most existing literature focuses on traditional perspectives of technological innovation and efficiency, with limited attention paid to integrating green development into a unified analytical framework. Under the constraints of the “dual-carbon” goals, enterprises’ production modes are rapidly transitioning toward green and low-carbon development. Green technological innovation and carbon emission intensity are not only important indicators of environmental performance but also have profound implications for enterprises’ production efficiency and long-term competitiveness.
On the one hand, digital transformation enhances data processing and analytical capabilities, supports green technology R&D, reduces innovation costs, and accelerates technology diffusion. On the other hand, the application of digital technologies in energy management and production optimization helps reduce carbon emission intensity and improve resource utilization efficiency. However, as digital transformation deepens, the rising energy consumption from digital infrastructure and path dependence may weaken its green effects.
Therefore, systematically examining the mechanisms through which digital transformation affects new quality productive forces from the dual perspectives of green technological innovation and carbon emission intensity is of great significance for enriching and improving the existing literature.
2.4. Literature Review and Research Contributions
In summary, the existing literature provides an important foundation for understanding the relationship between digital transformation and enterprises’ productivity; however, several critical gaps remain.
First, most prior studies rely on linear analytical frameworks, which are insufficient to capture potential diminishing marginal returns and the issue of “over-digitalization” during the process of digital transformation. As a result, systematic examinations of nonlinear relationships remain limited.
Second, regarding the underlying mechanisms, existing research primarily focuses on technological innovation and resource allocation efficiency, while paying relatively limited attention to green development. A unified analytical framework integrating the digital economy and green transformation has yet to be established.
Third, from a research perspective, micro-level empirical studies focusing on the linkage between “digital transformation and new quality productive forces” remain relatively scarce. In particular, there is a lack of comprehensive analysis that jointly considers both underlying mechanisms and contextual heterogeneity.
To address these research gaps, this paper adopts a nonlinear perspective and develops an analytical framework of “digital transformation–green technological innovation–carbon emission intensity–new quality productive forces.” It further examines the inverted U-shaped effect of digital transformation and its dual mediating mechanisms, thereby contributing to and extending the existing literature.
4. Econometric Model and Variable Description
4.1. Sample Selection and Data Sources
China’s digital economy policy has undergone a gradual evolution from science and technology-oriented policies to industry and innovation-oriented policies, reflecting a policy implementation process that progresses from point to area and from partial to holistic coverage. Prior to 2015, the development of China’s digital economy was in a transitional stage, shifting from science and technology policies toward industrial policies. Since then, with the “Internet Plus” strategy as the core, a new pattern of digital economy development has been established. Listed firms account for a relatively large share of the industry, playing a leading role in technological progress and industrial upgrading. They are highly representative and influential within their respective industries, and their behavior to a certain extent reflects overall industry development trends. Therefore, this paper selects manufacturing listed firms in China from 2015 to 2023 as the research sample.
To ensure data accuracy and validity, the data are processed as follows: (1) ST and *ST listed firms are excluded, as such firms may have issues regarding data reliability and validity; (2) firms with missing key variables are removed; (3) a small amount of missing data is supplemented using linear interpolation; and (4) to mitigate the influence of outliers, all continuous variables are winsorized. Finally, a balanced panel dataset comprising 22,020 firm-year observations is constructed.
All financial data used in this study are obtained from the CSMAR database. To measure the degree of digital transformation, this paper constructs an indicator based on four dimensions, namely digital technology application, internet-based business models, intelligent manufacturing, and modern information systems. A total of 99 digitalization-related keywords are identified, and their frequencies are calculated. The data collection process employs Python 3.14-based web scraping techniques to extract information from the annual reports of all manufacturing listed firms. In addition, the Java PDFBox library is used to parse and extract textual content from PDF documents, thereby constructing a comprehensive keyword dictionary for digital transformation. Subsequently, keyword search, matching, and frequency statistics are conducted to obtain the digital transformation index. Carbon emission data are derived from the China Industrial Economic Statistical Yearbook and the China Energy Statistical Yearbook.
4.2. Econometric Model Specification
To test Hypotheses H1–H3, this paper constructs both a baseline regression model and a mediation effect model. Based on the theoretical analysis, the main models are specified as follows:
In the model, i and t denote firm and year, respectively; Npro represents the firm’s new quality productive forces; DI indicates the firm’s digital transformation level; GREEN signifies the firm’s green technological innovation level; CO2 denotes the firm’s carbon emission intensity; C is a vector of firm-level control variables; and respectively indicate that the model controls for individual fixed effects and time fixed effects; is the random error term.
4.3. Variable Definitions
The carbon dioxide conversion factor adopts the standard value of 2.493 provided by the Xiamen Energy Conservation Center.
- 5.
Control Variables. Based on existing studies, this paper controls for key variables that may influence firms’ digital transformation, including firm size (Size), leverage ratio (Lev), return on assets (Roa), total asset turnover (ATO), cash flow ratio (Cashflow), revenue growth rate (Growth), board size (Board), proportion of independent directors (Indep), CEO duality (Dual), shareholding ratio of the largest shareholder (Top1), equity balance degree (Balance1), Tobin’s Q (TobinQ), listing age (InListAge), and institutional ownership (INST). Definitions of all variables are reported in
Table 2.
Table 1.
Corporate New Quality Productive Forces Indicators.
Table 1.
Corporate New Quality Productive Forces Indicators.
| Factor | Sub-Factor | Indicator | Measurement Method | Weight (%) |
|---|
| Labor | Active Labor | R&D Personnel Salary Ratio | (R&D Expenses − Salaries)/Revenue | 28 |
| R&D Personnel Ratio | Number of R&D Personnel/Total Number of Employees | 4 |
| Percentage of Highly Educated Personnel | Number of employees with bachelor’s degree or higher/Total number of employees | 3 |
| Physical labor (object of labor) | Percentage of Fixed Assets | Fixed Assets/Total Assets | 2 |
| Manufacturing Overhead Ratio | (Subtotal of cash outflows from operating activities + Depreciation of fixed assets + Amortization of intangible assets + Impairment provisions − Cash paid for purchases of goods and services − Wages paid to employees and wages paid by employees)/(Subtotal of cash outflows from operating activities + Depreciation of fixed assets + Amortization of intangible assets + Impairment provisions) | 1 |
| Production Tools | Hard Technology | R&D Depreciation and Amortization Ratio | (R&D expenses − Depreciation and amortization)/Operating revenue | 27 |
| R&D Lease Expense Ratio | (R&D Expenses − Lease Expenses)/Operating Revenue | 2 |
| Direct R&D Investment Ratio | (R&D expenses − Direct expenditures)/Operating revenue | 28 |
| Soft Technology | Intangible Assets Ratio | Intangible Assets/Total Assets | 3 |
| Total Asset Turnover Ratio | Revenue/Average Total Assets | 1 |
Table 2.
Description of Key Variables.
Table 2.
Description of Key Variables.
| Variable | Variable Name (Symbol) | Variable Definition |
|---|
| Explanatory Variable | Enterprise Digital Transformation (DI) | Natural Logarithm of Term Frequency Related to Annual Report Digitization |
| Dependent Variable | Enterprise new quality productive forces Level (Npro) | Enterprise new quality productive forces Indicators |
| Instrumental Variables | Green Technology Innovation Level (GREEN) | Number of Green Utility Models + Number of Green Inventions |
| Enterprise Carbon Emission Intensity (CO2) | Corporate Carbon Emissions/Corporate Main Business Revenue |
| Control Variables | Company Size (Size) | Natural logarithm of total annual assets |
| Asset-Liability Ratio (Lev) | Total Assets at Year-End/Shareholders’ Equity at Year-End |
| Return on Assets (RoA) | Net Income/Total Assets |
| Asset Turnover Ratio (ATO) | Total Assets/Operating Revenue |
| Cash Flow Ratio (Cashflow) | Cash flow/Total assets |
| Revenue Growth Rate (Growth) | Current Year Operating Revenue/Previous Year Operating Revenue − 1 |
| Number of Board Members (Board) | Natural logarithm of the number of board members |
| Percentage of Independent Directors (Indep) | Independent Directors/Total Board Members |
| Dual Role (Dual) | 1 if the Chairman and CEO are the same person, otherwise 0 |
| Largest shareholder’s ownership ratio (Top1) | Number of Shares Held by Largest Shareholder/Total Number of Shares |
| Equity Balance Ratio (Balance1) | Second Largest Shareholder’s Shareholding Ratio/Largest Shareholder’s Shareholding Ratio |
| Tobin’s Q ratio (TobinQ) | (Market Value of Floating Shares + Number of Non-Trading Shares × Net Asset Value per Share + Book Value of Liabilities)/Total Assets |
| Listing Duration (InListAge) | ln(Current Year − Listing Year + 1) |
| Institutional investor shareholding ratio (INST) | Total Institutional Shareholding/Total Share Capital |
The descriptive statistics of the main variables for manufacturing listed firms are reported in
Table 3. As shown in
Table 3, the mean value of enterprises’ new quality productive forces is 0.045, with a maximum of 1 and a minimum of 0, indicating substantial variation across firms. This suggests that significant heterogeneity exists among manufacturing firms in terms of technological innovation and green transformation levels. The mean value of firms’ digital transformation is 1.535, with a maximum of 4.860 and a minimum of 0, indicating that the overall level of digital development among sample firms remains relatively low, while considerable disparities exist across firms. The mean level of green technological innovation is 0.027, with a median of 0, implying that green innovation investment is limited in most firms, and only a small proportion of firms possess relatively strong innovative capabilities. The mean value of carbon performance is 0.810, with a maximum of 3.836, suggesting substantial differences in carbon emission reduction and energy efficiency across firms. Among the main control variables, firm size (mean: 22.069), leverage ratio (mean: 0.379), return on assets (mean: 0.045), and total asset turnover (mean: 0.643) all fall within reasonable ranges. Regarding corporate governance variables, the average proportion of independent directors is 37.9%, the CEO duality ratio is 0.354, and ownership concentration is at a moderate level. Overall, the sample firms exhibit considerable heterogeneity in new quality productive forces, digital transformation, and green innovation, with a reasonable data distribution, providing a solid foundation for subsequent empirical analysis.
5. The Direct Impact of Digital Transformation on New Quality Productive Forces in Manufacturing Enterprises
5.1. Baseline Regression Analysis
This section examines Hypothesis H1, namely the nonlinear relationship between digital transformation and new quality productive forces. Based on the regression model, this paper analyzes the impact of digital transformation (DI) on manufacturing firms’ new quality productive forces (Npro), and conducts a series of robustness checks to ensure the reliability of the results. The baseline regression results are reported in
Table 4.
The empirical results indicate that, in the regression models, an increase in the degree of digital transformation is associated with a significant improvement in enterprises’ new quality productive forces. Further analysis shows that the squared term of digital transformation (DI
2) is negative and statistically significant in both Model (2) and Model (4), suggesting that the relationship between digital transformation and new quality productive forces exhibits an inverted U-shaped pattern. This implies that, at the initial stage, digital transformation significantly promotes the improvement of new quality productive forces; however, as the transformation reaches a certain level, its marginal effect gradually diminishes and its promotional effect begins to weaken. Moreover, the cubic term of digital transformation (DI
3) is statistically insignificant, further confirming the inverted U-shaped relationship between digital transformation and new quality productive forces. The U-test results indicate that the slope is significantly positive at the left end of the DI distribution (slope_l = 0.006,
p < 0.01) and significantly negative at the right end (slope_u = −0.016,
p < 0.01). The estimated turning point (1.407) lies within the observed range of DI [0, 4.860]. Manufacturing listed firms account for a relatively large share of the industry and play a leading role in technological progress and industrial upgrading; therefore, their level of digital transformation is relatively high. The estimated turning point should be interpreted as a threshold of diminishing marginal returns rather than a strict boundary between positive and negative effects. Beyond this point, additional digitalization does not necessarily reduce productivity in absolute terms, but rather weakens its marginal contribution. In practice, only a limited number of firms exceed the estimated threshold, and most observations are concentrated at moderate levels of digitalization, suggesting that the inverted U-shaped relationship reflects heterogeneity in marginal effects rather than a widespread negative impact of digital transformation. In addition, the results of the Hausman test, as reported in
Table 4, indicate that the test is passed, supporting the use of the specified model.
Overall, the above analysis demonstrates that the impact of digital transformation on new quality productive forces follows an inverted U-shaped pattern, thereby supporting Hypothesis H1.
5.2. Endogeneity Tests
The baseline regression results above may be prone to potential endogeneity issues. To address this concern, this study employs an instrumental variable (IV) approach. Specifically, the proportion of employees in the information transmission, computer services, and software industries in the city where the firm is located is selected as the instrumental variable, which satisfies both the relevance and exogeneity conditions.
In addition, to account for potential selection bias, this paper further implements the Heckman two-stage estimation procedure. The corresponding results are reported in
Table 5.
5.3. Robustness Tests
To ensure the robustness of the baseline findings regarding the impact of digital transformation on new quality productive forces in manufacturing listed firms, this study conducts a series of robustness checks.
Replacement of the core explanatory variable. To further verify the robustness of the effect of digital transformation, this paper adopts the digital intangible asset share (DI_2) proposed by Zhang et al. (2021) as [
28] an alternative proxy for firms’ digital transformation level. Zhang et al. [
28] argue that digital intangible assets include firms’ investments in digital technologies, software, and information systems, which can effectively reflect the degree of digitalization. Therefore, using the share of digital intangible assets as a substitute indicator allows for an additional test of the stability and reliability of the impact of digital transformation on new quality productive forces. Alternative regression specification. In addition, a Tobit model (2) is employed as an alternative estimation approach. The regression results using the Tobit specification indicate that the effect of digital transformation on new quality productive forces remains statistically significant and consistent with the baseline results.
As shown in
Table 6, both the replacement of the core explanatory variable and the change in the regression model confirm that the baseline conclusions remain unchanged.
From an economic perspective, the inverted U-shaped relationship identified in the baseline regression is not only statistically significant but also reflects the stage-dependent returns and optimal investment boundary in the process of digital transformation among manufacturing firms.
First, in the initial stage of digital transformation, firms significantly reduce information asymmetry and transaction costs by adopting digital technologies such as big data, cloud computing, and industrial internet platforms. This facilitates more refined production process management and more efficient allocation of resources. At this stage, firms essentially experience a “technological dividend release period,” in which relatively low costs generate substantial efficiency gains, thereby promoting a rapid improvement in new quality productive forces. This is highly consistent with the inherent “high efficiency” characteristic of new quality productive forces.
Second, once the degree of digital transformation reaches a certain threshold, its marginal promoting effect gradually diminishes and may even turn negative. The economic implication of this finding is that digital transformation is not necessarily “the more, the better,” but instead exhibits an optimal digitalization range. When firms over-invest in digitalization, several issues may arise, including: increased system maintenance costs due to higher technological complexity; rising managerial frictions and coordination costs caused by lagging organizational restructuring; “technological mismatch” arising from insufficient employee digital skills; and conflicts between efficiency improvement and green objectives due to increased energy consumption of digital infrastructure. Therefore, the inverted U-shaped relationship essentially reflects the law of diminishing returns in digitalization, indicating that firms should place greater emphasis on the quality rather than the scale of digital transformation.
Furthermore, the estimated turning point (approximately 1.407) carries important policy implications. It characterizes the “moderate range” of digital transformation for manufacturing firms and provides a quantitative benchmark for formulating digital strategies. This suggests that policymakers should avoid a one-size-fits-all approach to promoting digital transformation and instead encourage firms to adopt digitalization paths tailored to their respective development stages.
6. Mechanism Analysis of the Impact of Digital Transformation on New Quality Productive Forces in Manufacturing Enterprises
The previous section examined the direct impact of digital transformation on new quality productive forces and identified a significant inverted U-shaped relationship. This section further tests Hypotheses H2 and H3, namely the mediating roles of green technological innovation and carbon emission intensity. To gain a deeper understanding of the mechanisms through which digital transformation affects new quality productive forces, this paper constructs a mediation effect model to examine the transmission channels of green technological innovation and carbon emission intensity in this process.
Digital transformation provides essential technological foundations and organizational conditions for firms’ green technological innovation. On the one hand, the application of digital technologies—such as big data, artificial intelligence, and the Industrial Internet—significantly enhances firms’ real-time monitoring and intelligent analysis capabilities regarding environmental data, energy consumption, and production processes. This helps identify high-pollution and high-energy-consumption activities, thereby providing precise targets for green process improvement and product innovation. On the other hand, digital platforms facilitate knowledge sharing and collaborative R&D across departments, firms, and even industries, reducing information barriers and experimentation costs in green innovation and accelerating the transformation from R&D to industrial application.
The empirical results are reported in
Table 7. Model (1) shows that digital transformation (DI) has a significantly positive effect on green technological innovation (GREEN), while the coefficient of its squared term (DI
2) is significantly negative, indicating that the promoting effect of digital transformation on green technological innovation also exhibits an inverted U-shaped pattern. In other words, as digital transformation deepens, its marginal effect gradually diminishes. Model (2) further introduces the green technological innovation variable, and the results show that green technological innovation (GREEN) has a significantly positive effect on firms’ new quality productive forces (Npro). Meanwhile, the coefficients of both the linear and quadratic terms of digital transformation remain statistically significant, indicating that green technological innovation plays a partial mediating role in the relationship between digital transformation and new quality productive forces. This finding supports Hypothesis H2, suggesting that digital transformation enhances firms’ new quality productive forces by stimulating green technological innovation.
The results of Models (3) and (4) further indicate that digital transformation contributes to a reduction in carbon emission intensity to a certain extent, thereby promoting the improvement of new quality productive forces. This finding validates Hypothesis H3, confirming that carbon emission intensity serves as a mediating channel in the relationship between digital transformation and new quality productive forces.
The mechanism analysis results indicate that digital transformation not only has a direct effect on new quality productive forces, but also exerts indirect effects through two channels: green technological innovation and carbon emission intensity. This finding reveals, from an economic perspective, the intrinsic coupling between the digital economy and green development.
First, regarding the green technological innovation channel, digital transformation enhances firms’ capabilities through data factor empowerment and knowledge spillover effects, thereby significantly reducing uncertainty and trial-and-error costs in green innovation. This implies that digital transformation fundamentally reshapes firms’ innovation function, shifting it from a traditional “high-cost trial-and-error mode” to a “data-driven innovation mode.” Consequently, green technological innovation is no longer primarily dependent on capital investment but increasingly relies on data resources and algorithmic capabilities. This transformation constitutes an important manifestation of the “high technology” feature of new quality productive forces.
Second, regarding the carbon emission intensity channel, digital transformation improves energy utilization efficiency through intelligent production systems and optimized energy management, thereby reducing carbon emissions per unit of output. This suggests that digitalization is not only an efficiency-enhancing tool but also a green transformation instrument. In other words, digital transformation enables a development pattern characterized by “substituting technology for resource consumption,” which facilitates the shift in economic growth from factor-driven expansion to efficiency-driven improvement.
7. Heterogeneity Analysis of the Impact of Digital Transformation on New Quality Productive Forces in Manufacturing Enterprises
7.1. Regional Heterogeneity
To examine the heterogeneous impact of corporate digital transformation on new quality productive forces across different regions, this paper divides the full sample into three groups (eastern, central and western China) based on the registered locations of listed firms and conducts grouped regression analysis. The regression results are presented in
Table 8.
In the eastern region, there exists a significant inverted U-shaped relationship between digital transformation and new quality productive forces. The empirical results show that digital transformation can greatly boost new quality productive forces in the early stage, while its marginal effect gradually weakens as transformation deepens. As the frontier of digital technology research, development and application in China, the eastern region boasts sound digital infrastructure, mature factor markets and a favorable innovation environment. Local enterprises can smoothly integrate digital technologies into daily operation, production, product innovation and service optimization. These superior conditions and sufficient resource support help enterprises improve new quality productive forces, and maximize the benefits brought by digital transformation.
In comparison, the effects of digital transformation are weaker in central and western China. In these two regions, the positive impact of digital transformation on new quality productive forces fails to reach statistical significance. This result reflects that central and western areas are plagued by multiple bottlenecks, such as backward digital infrastructure, insufficient technological absorption capacity and a shortage of innovation resources. These constraints greatly limit the practical effects of corporate digital transformation. Besides, the western region is faced with severe pressure in industrial restructuring and prominent energy consumption problems. These factors further weaken the role of digital transformation in boosting productivity. Accordingly, the benefits brought by digital transformation are released slowly in such regions and far less pronounced than those in the eastern area.
This result reveals that the boosting effect of corporate digital transformation on new quality productive forces has obvious regional heterogeneity, and its positive impact is currently concentrated mainly in eastern China. As the frontier of digital technology research, development and industrialization in China, the eastern region boasts sound digital infrastructure, mature factor markets and a vibrant innovation ecosystem. These favorable conditions enable enterprises to integrate digital technologies into daily production and operation, so as to stimulate the growth of new quality productive forces. In addition, eastern enterprises account for approximately 72.6% of the total research samples. Strong industrial agglomeration and fierce market competition in this region may also strengthen the overall effectiveness of digital transformation. By comparison, constrained by inadequate digital infrastructure, weak technological absorption capacity and insufficient innovative resources, enterprises in central and western China lag behind in digital transformation. It is difficult for them to translate digital efforts into tangible improvements in new quality productive forces in the short run. In particular, the western region faces dual pressures from industrial restructuring and high energy consumption of digital facilities, which further limit the release of digital dividends. Therefore, at the current stage, the empowering effect of digital transformation on new quality productive forces presents a gradual declining gradient from the east to the west.
7.2. Heterogeneity Between Heavily Polluting and Non-Heavily Polluting Enterprises
To examine the heterogeneous impact of digital transformation on new quality productive forces of enterprises with different pollution characteristics, this paper classifies the full sample into heavily polluting industries and non-heavily polluting industries for grouped regression, following the research of Pan Ailing et al. (2019) [
31]. The regression results are presented in
Table 9.
In terms of the core explanatory variables, for non-heavily polluting enterprises in Column (2), the linear coefficient of digital transformation is significantly positive at the 1% statistical level, while its quadratic coefficient is markedly negative. This reveals a significant inverted U-shaped relationship between digital transformation and the new quality productive forces of non-heavily polluting enterprises. By contrast, neither of the two coefficients passes the significance test for heavily polluting enterprises in Column (1), which indicates that digital transformation has not yet exerted any statistically significant promotional effect on their new quality productive forces.
Within non-heavily polluting industries, digital transformation can greatly improve new quality productive forces with an obvious inverted U-shaped trend. In such industries, digital transformation helps enterprises advance product innovation, strengthen resource allocation efficiency and optimize production procedures, so as to achieve substantial growth in new quality productive forces. Generally, non-heavily polluting enterprises are subject to looser environmental regulations. They can adopt digital technologies flexibly to optimize business operation and carry out technological innovation, thus gaining more remarkable outcomes from digital transformation.
On the contrary, enterprises in heavily polluting industries face stricter environmental rules and policy constraints in the process of digital upgrading. Although digital transformation can improve corporate compliance and pollution control capacity to a certain extent, these firms still rely heavily on high-energy-consumption and high-emission traditional equipment and production methods. In the short run, digital transformation mainly helps them meet environmental standards and control pollution, rather than directly boosting new quality productive forces. Accordingly, its influence on such enterprises fails to reach statistical significance. This finding proves that industrial characteristics matter greatly in digital transformation, and the effects of digitalization vary greatly across industries with different pollution levels.
It can be concluded that the empowering effect of digital transformation on new quality productive forces has prominent industrial heterogeneity, and its positive benefits are mostly concentrated in non-heavily polluting sectors. On the one hand, non-heavily polluting enterprises operate under less stringent environmental supervision and more intense market competition. They are able to apply digital technologies to product research, service improvement and organizational reform in a more flexible way, and better convert digital advantages into new quality productive forces. On the other hand, heavily polluting enterprises are trapped in intense environmental pressure and path dependence of traditional production. Their digital investment is mostly used for pollution management and standardized operation, making it hard to realize noticeable productivity growth in the short term. In addition, the inherent technical rigidity and asset specificity of heavily polluting industries further limit the conversion efficiency from digital transformation to high-quality productivity improvement. Therefore, the promotional effect of digital transformation shows clear industrial differentiation at the current stage, with relatively limited performance in environmentally sensitive industries.
7.3. Heterogeneity of Enterprise Factor Intensity Types
To examine the heterogeneous impact of digital transformation on the new quality productive forces of enterprises with different factor intensity, this paper divides the full sample into three groups, namely technology-intensive, capital-intensive and labor-intensive enterprises, for grouped regression analysis, following the research of Yin et al. (2018) [
32] The regression results are presented in
Table 10.
For technology-intensive enterprises, the coefficient of digital transformation (DI) is 1.163 and significantly positive at the 1% statistical level, while the coefficient of its squared term (DI2) is −0.362 and significantly negative at the same level. This proves a notable inverted U-shaped relationship between digital transformation and new quality productive forces in technology-intensive firms. In such enterprises, early digital transformation can effectively stimulate technological coordination and knowledge spillover, optimize research and development processes, and facilitate the transformation of innovative achievements, so as to greatly improve new quality productive forces. Nevertheless, with the deepening of transformation, the growing complexity of technical systems, increased reliance on original R&D paths and higher barriers to organizational adaptation will gradually weaken the marginal benefits of digital investment.
As for capital-intensive enterprises, both the linear and quadratic coefficients of digital transformation show no statistical significance. It indicates that digital transformation has not yet exerted a statistically recognizable influence on their new quality productive forces. Capital-intensive enterprises rely heavily on large-scale fixed assets and heavy equipment, with highly rigid production modes. Their digital transformation is mostly limited to basic applications such as equipment networking and status monitoring, failing to reach the core links of production organization and value creation in the short term. Hence, it cannot effectively drive the overall improvement of new quality productive forces.
In labor-intensive enterprises, the linear coefficient of digital transformation is 0.772, significantly positive at the 5% level, and its quadratic coefficient is −0.310, significantly negative at the 1% level. Similarly, an inverted U-shaped correlation exists between digital transformation and new quality productive forces. At the initial transformation stage, labor-intensive enterprises adopt automatic equipment and information management systems to raise operational efficiency, cut labor costs, and improve employees’ skill structure, thereby boosting productivity. However, the continuous improvement of automation will aggravate the adaptation conflicts between the original labor structure and new technologies, slowing down the release of transformation dividends.
To sum up, the impact of digital transformation on new quality productive forces varies greatly across different enterprise factor intensity types. The promotional effect is the strongest in technology-intensive enterprises, followed by labor-intensive ones, while such effect has not been fully reflected in capital-intensive enterprises. This finding reveals the internal connection between corporate factor structure and digital adaptation capacity, and also provides empirical evidence for the targeted promotion of digital transformation in the manufacturing industry.
Heterogeneity analysis reveals the context dependence of digital transformation’s impact on new quality productive forces from the perspectives of regional division, industrial attributes and factor structure. Its economic implications are mainly reflected in the following three aspects:
- (1)
Regional heterogeneity: the role of digital infrastructure and institutional environment
The promotional effect of digital transformation is more significant in eastern regions, which indicates that its economic performance is highly subject to the external development environment. With obvious advantages in digital infrastructure, talent reserve and marketization level, eastern regions can better convert digital technologies into productivity growth. This finding proves that digital transformation is not merely a technical issue, but a comprehensive outcome driven by technology, institutions and market conditions. Accordingly, to improve the effectiveness of digital transformation, central and western regions need to make efforts in three key areas: improving digital infrastructure such as the industrial Internet, optimizing the training system for digital talents, and completing the market mechanism of data factors.
- (2)
Industrial heterogeneity: differences in pollution features and transformation benefits
Digital transformation plays a stronger role in non-heavily polluting industries, suggesting that such industries can gain efficiency dividends more easily under loose environmental regulations. By comparison, heavily polluting industries are faced with stricter environmental restrictions and higher transformation costs, which may reduce the short-term returns of digital investment. In short, digital transformation mainly serves as compliance investment in heavily polluting industries, while acting as an effective tool for efficiency improvement in non-polluting industries. Hence, differentiated policies instead of unified measures should be formulated in accordance with specific industrial characteristics.
- (3)
Heterogeneity of Enterprise Attributes: The Importance of Technological Foundation and Absorptive Capacity
For high-tech enterprises, digital transformation delivers a more remarkable effect, which indicates that firms’ absorptive capacity acts as a core constraint factor. Only enterprises with solid R&D capabilities and sound technological foundations can effectively translate digital investment into productivity growth. This finding reveals a vital economic mechanism: digital transformation cannot boost productivity automatically. Instead, only when combined with solid technological competence can digital transformation foster the growth of new quality productive forces. Accordingly, when promoting digital transformation, medium and low-tech enterprises should give priority to optimizing talent structure, accumulating technological advantages and improving organizational learning capacity.
Overall, this paper systematically clarifies the influencing paths of digital transformation on new quality productive forces from three dimensions: direct effects, functional mechanisms and contextual differences. The research demonstrates that the relationship between digital transformation and productivity is not a simple input-output correlation. On the contrary, it is a complex process featured by nonlinear characteristics, mechanistic transmission and context dependence.
Its core economic implication is that digital transformation helps enterprises shift from scale-driven expansion to quality-and-efficiency-oriented development through technological empowerment, green transition and optimized resource allocation. However, this process is restricted by both corporate capability boundaries and external environmental conditions. To maximize the dividends of digital transformation, enterprises need to grasp a moderate transformation pace and avoid excessive digitalization, strengthen the coordination between innovation and green development, and adopt differentiated development strategies.
8. Conclusions and Implications
8.1. Conclusions
Based on the data of Chinese A-share listed manufacturing enterprises from 2015 to 2023. Compared with alternative approaches such as structural equation modeling (SEM) or difference-in-differences (DID) designs, the panel fixed-effects model with a non-linear specification is more appropriate in this context, as it allows for transparent estimation of heterogeneous marginal effects using firm-level longitudinal data. Therefore, this paper systematically examines the impact of digital transformation on enterprises’ new quality productive forces and its underlying mechanism. The research conclusions are drawn as follows:
First, the impact of digital transformation on new quality productive forces presents a significant nonlinear characteristic. Specifically, with the deepening of digital transformation, its promotional effect on new quality productive forces strengthens initially and then weakens, showing an obvious inverted U-shaped relationship. It indicates that digital transformation does not follow the principle of “the more, the better”, and there exists an optimal development range.
Second, the mechanism test verifies that digital transformation affects new quality productive forces through two core paths: the promotion effect of green technological innovation and the constraint effect of carbon emission intensity. On the one hand, digital transformation greatly boosts enterprises’ green technological innovation, thereby improving production efficiency and technological added value. On the other hand, it reduces carbon emission intensity, improves resource utilization efficiency, and ultimately facilitates the advancement of new quality productive forces.
Third, the heterogeneity analysis suggests that the influence of digital transformation is highly context-dependent. The positive impact of digital transformation is more prominent in eastern regions, non-high-pollution industries and technology-intensive industries, while such promotional effects are relatively limited in other contextual conditions.
8.2. Theoretical Contributions
Based on previous research achievements, this paper further explores the relationship between digital transformation and new quality productive forces from the perspectives of nonlinearity and green transition. Its major contributions are summarized in three aspects:
First, this study expands the analytical framework concerning the economic consequences of digital transformation. Different from most existing research that adopts a linear research assumption, this paper adopts a nonlinear perspective. It identifies the inverted U-shaped relationship between digital transformation and new quality productive forces, and reveals the feature of diminishing marginal returns. It also provides new empirical evidence for defining the boundary of digital transformation’s practical effects.
Second, it constructs a green mechanism framework to explain how digital transformation affects new quality productive forces. This paper incorporates green technological innovation and carbon emission intensity into an integrated analytical system. It clarifies that digital transformation improves productive forces through two paths, namely innovation promotion and environmental regulation. This finding makes up for the deficiency of insufficient discussion on green factors in the current literature.
Third, it enriches empirical research on new quality productive forces at the micro enterprise level. Unlike studies focusing on macroeconomic or regional dimensions, this paper adopts firm-level data to analyze the influence of digital transformation and its heterogeneous characteristics. It offers new micro-level evidence for understanding the high-quality development and productivity upgrading of individual enterprises.
8.3. Policy Implications
Drawing on the above research conclusions, this paper puts forward several policy suggestions:
First, governments and enterprises should properly control the pace of digital transformation and avoid excessive digitalization. As firms approach the identified non-linearity threshold of digital transformation, managers should shift their strategic focus from “scale expansion” to “quality-oriented digital governance.” This study confirms that digital transformation has an optimal scope of development. Firms should strengthen cross-departmental coordination and establish unified digital governance systems to avoid data fragmentation and duplicated digital platforms. Managers should place greater emphasis on developing employee digital capabilities rather than relying solely on continuous technology investment. Managers should carefully evaluate the marginal returns of digital investment and avoid “over-digitalization.” Accordingly, based on their own development stages and resource endowments, they need to formulate digital development strategies in a scientific manner. It is necessary to prevent blind expansion and redundant investment, so as to improve the allocation efficiency of digital resources.
Second, it is essential to increase support for green technological innovation and advance the in-depth integration of digitalization and green transition. Governments can offer financial subsidies, tax preferences and innovation incentives to encourage enterprises to invest more in green technology research and development. Promoting the application of digital technologies in green innovation will help achieve coordinated growth of economic and environmental benefits.
Third, improve the carbon emission management system and give full play to the role of digital technology in green governance. Authorities should accelerate the construction of carbon emission monitoring systems and information platforms. Digital tools can improve the accuracy and transparency of carbon emission management, guide enterprises to reduce carbon emission intensity, and boost sustainable low-carbon development.
Fourth, adopt differentiated policies to enhance the regional and industrial adaptability of digital transformation. In view of unbalanced regional development and diverse industrial characteristics, targeted policies on digital and green transition should be formulated. More efforts are needed to build digital infrastructure in central and western regions, and strengthen green supervision and technological upgrading in high-pollution industries, so as to ensure better policy implementation.
Furthermore, the findings imply that firms should pay close attention to several organizational risks that may serve as early warning signals of “digitalization overdose.” Although digital transformation initially improves productivity and innovation efficiency, excessive digitalization may gradually generate organizational burdens that offset its positive effects. One important warning signal is the rapid increase in coordination and communication costs within the organization. As digital systems become increasingly complex, firms may experience fragmented data platforms, duplicated digital processes, and reduced interoperability across departments, which can weaken operational efficiency rather than improve it. A second warning signal is the emergence of employee adaptation difficulties and digital fatigue. Excessive reliance on digital tools may increase employees’ cognitive pressure, reduce organizational flexibility, and create resistance to technological change, particularly when digital skill upgrading fails to keep pace with technological expansion.
The policy implications derived from this study should be interpreted with caution, as their applicability may be limited in contexts with weak digital infrastructure, low transparency, or underdeveloped innovation systems.
8.4. Limitations and Future Prospects
Although this paper conducts a systematic analysis of the relationship between digital transformation and new quality productive forces from the perspectives of nonlinearity and green mechanisms, it still has several research limitations.
First, the measurement of digital transformation in this study mainly relies on text analysis and the construction of corresponding indicators. While this method can effectively reflect firms’ strategic orientation toward digital development, it fails to fully capture the in-depth practical application of digitalization. Subsequent research can adopt corporate micro operational data to achieve a more refined measurement of digital transformation.
Second, this paper mainly explores the mediating roles of green technological innovation and carbon emission intensity. Other potential influencing factors, such as organizational governance and supply chain collaboration, have not been fully taken into account. Follow-up studies can further expand the analytical framework of influencing mechanisms from multiple dimensions.
Third, the empirical analysis is conducted based on the sample of Chinese listed manufacturing enterprises. Hence, whether the research findings can be applied to other industries or countries still needs further verification. Cross-national comparative research can be carried out in the future to improve the external validity of relevant conclusions.