Article

Township-Scale Identification of Social–Ecological System Resilience in a Small Basin: A Case Study of the Erhai Lake Basin

by
Lian Liu
1,
Hanshen Li
2 and
Yao Wang
1,*
1
School of International Relations, Sichuan University, Chengdu 610065, China
2
China Electric Power Planning & Engineering Institute, Beijing 100120, China
*
Author to whom correspondence should be addressed.
Sustainability 2026, 18(10), 4840; https://doi.org/10.3390/su18104840
Submission received: 30 March 2026 / Revised: 30 April 2026 / Accepted: 7 May 2026 / Published: 12 May 2026

Abstract

Small plateau lake basins are sensitive social–ecological systems in which ecological protection, rural development, and institutional governance are closely intertwined. Therefore, fine-scale resilience assessment is needed to support adaptive basin governance. However, integrated township-scale assessments of social–ecological system resilience in such basins remain limited. Taking 13 township-level units in the Dali City portion of the Erhai Lake Basin as a case study, this paper integrates social–ecological system theory with the pressure–state–response framework to construct a 30-indicator resilience evaluation system. It measures social resilience, ecological resilience, and comprehensive social–ecological resilience at four time points from 2010 to 2025, and examines their temporal trends, spatial differentiation, and governance implications. The results show that average social resilience rose from 0.509 to 0.682, ecological resilience from 0.503 to 0.658, and comprehensive resilience from 0.506 to 0.668. Linear mixed-effects modelling confirmed a significant upward trend in comprehensive resilience, with an average increase of 0.053 per five-year interval, while Global Moran’s I indicated weak but consistently positive spatial clustering. However, township-level heterogeneity persisted in improvement magnitude and resilience sources. Neither ecological advantages nor social development alone can sustainably enhance comprehensive resilience; stronger coordination between the two is required. Based on an “ecological protection × social development” matrix, the townships are classified into four types: dual vulnerability, economic priority, ecological priority, and coordinated development. This typology provides a basis for differentiated adaptive governance in ecologically fragile basins.

1. Introduction

River basins are critical spatial units where ecological processes, resource utilization, economic development, and public governance are highly intertwined; they are regarded as a crucial testing ground for the comprehensive governance capabilities of modern states. Centered on the backdrop of the parallel advancement of ecological civilization and high-quality development, river basin social–ecological systems exhibit highly complex and dynamically coupled operational characteristics. With numerous and diverse river basins in China, basin governance has always been a key issue in national governance [1]. In recent years, China has accumulated a wealth of research and practical achievements in the field of river basin governance, providing valuable insights and replicable solutions for the global community [2,3,4]. However, existing research still has three shortcomings. (1) In terms of research scale, many basin resilience studies have been conducted at relatively macro scales, such as the provincial, municipal, county, or whole-basin levels. Although township-scale resilience assessments have begun to appear in scholarship, integrated social–ecological resilience assessments at the township scale remain relatively limited in the specific context of small plateau lake basins, especially those characterized by strong ecological constraints and protection-development tensions. This makes it difficult to reveal subtle differences within river basins regarding development foundations, resource endowments, ecological pressures, and governance capabilities. (2) In terms of research subjects, existing studies have primarily focused on larger-scale river basins such as the Yangtze River Basin [5,6], the Yellow River Basin [7,8], the Taihu Lake Basin [9,10], and the Tarim River Basin [11]. Systematic empirical research on plateau lake basins in China’s frontier regions remains scarce. Compared to large river basins, these basins typically face stricter ecological constraints, higher governance costs, and more limited development alternatives, and their resilience evolution logic is unique. (3) Regarding analytical frameworks, while some studies have established indicator systems to measure basin development performance or governance effectiveness [12,13], discussions on the dynamic relationships among pressures, states, and responses, as well as the co-evolution of social and ecological systems, remain insufficient. This limits in-depth interpretations of resilience variations within basins and their implications for governance.
To further position this study within the broader resilience literature, it is necessary to examine how international scholarship has conceptualized and operationalized social–ecological resilience in water-related systems. International scholarship has already made important progress in the study of social–ecological resilience in water-related systems. Existing work has advanced the empirical operationalization of resilience [14,15], developed governance-oriented indicator frameworks for lake and watershed systems [16], and applied resilience thinking to specific watersheds and lake ecosystems under conditions such as hydrological stress, invasive disturbance, and governance transition [17,18]. At the same time, recent reviews have shown that resilience metrics have become increasingly diverse, while their conceptual foundations, quantification approaches, and domains of application remain highly heterogeneous [19]. However, three limitations remain. First, a considerable part of the literature still emphasizes conceptual framing, governance diagnosis, or single-risk contexts, rather than integrating social and ecological subsystems into a unified resilience assessment structure [14,16,19]. Second, many empirical studies are conducted at the basin-wide, grid, county, or community-perception scale. In contrast, township-level heterogeneity within small plateau lake basins has received comparatively less attention in the international resilience literature [17,18,20]. Third, small lake basins where ecological fragility, cumulative pressure, and protection-development tensions are especially acute, but remain underrepresented in the international resilience literature. Existing studies on plateau lake areas have more often focused on ecological resilience, urbanization effects, or broader regional SES assessment, rather than township-scale integrated SES resilience in a small lake basin [20,21]. These gaps suggest the need for a fine-scale, integrated SES resilience assessment in a small plateau lake basin where ecological fragility, development pressure, and governance intervention are closely intertwined.
Against this background, the Erhai Lake Basin provides a representative case study in addressing these issues [22]. Located in the central part of Dali Bai Autonomous Prefecture, Yunnan Province, the Erhai Lake Basin is a typical semi-enclosed social–ecological system centered on a highland lake, covering 13 towns (subdistricts) in Dali City. On the one hand, Erhai Lake serves as both a vital barrier for regional ecological security and a core resource for the socio-economic development of Dali Prefecture; on the other hand, the basin has long faced the practical pressures of coexisting agricultural non-point source pollution, urban expansion, tourism development, and ecological conservation constraints, with persistent tensions between ecological protection and development transformation. Furthermore, given the Erhai Basin’s distinct institutional embeddedness—marked by the continuous intervention of governance tools such as local legislation, leadership directives [23], zoned management, ecological restoration, and comprehensive remediation—it serves as a crucial window for observing ecological governance practices and adaptive adjustment processes in China’s western frontier regions. Therefore, the Erhai Lake Basin is not only an empirical case for examining township-scale resilience differentiation, but also a suitable context for developing an integrated analytical framework that connects social–ecological coupling with pressure–state–response dynamics.
Theoretically, the Social–Ecological System (SES) theory emphasizes the continuous coupling, feedback, and co-evolution between natural ecosystems and human social systems in terms of resource utilization, institutional arrangements, interest linkages, and behavioral interactions [24,25,26]. The Pressure-State-Response (PSR) model transforms complex systemic interactions into an analytical chain of “pressure input–state change–governance response,” thereby identifying the system’s transformation process under external disturbances and governance interventions [27]. For the Erhai Lake Basin, SES theory helps grasp the holistic connections among ecological conservation, social development, and institutional adaptation, while the PSR model aids in characterizing how factors such as agricultural pollution, construction expansion, public services, environmental governance, and policy constraints collectively influence the basin’s resilience. Therefore, integrating SES theory with the PSR framework helps construct an analytical framework better suited to the context of the Erhai Lake basin and enhances the explanatory power regarding spatial variations at the grassroots level and the characteristics of system evolution.
Based on this, the present study takes the 13 towns (subdistricts) in the Erhai Lake Basin as the basic units of analysis. From the perspective of SES theory, it integrates the PSR framework to construct an evaluation index system for basin resilience covering both the social and ecological subsystems. It measures social system resilience, ecological system resilience, and comprehensive resilience at the township level, and combines temporal comparisons and typological analysis to reveal the evolutionary differences and combined characteristics of resilience within the Erhai Lake watershed. This paper primarily addresses the following three questions: (1) What evolutionary characteristics do the social system resilience, ecosystem resilience, and comprehensive resilience of different townships (subdistricts) in the Erhai Lake Basin exhibit from 2010 to 2025? (2) At the township scale, in which aspects are the typological differences in the resilience of the Erhai Lake Basin primarily manifested? (3) Based on the structural characteristics and evolutionary trajectories of resilience across different townships, how can the Erhai Lake Basin develop targeted, differentiated governance strategies?
The main contributions of this paper are primarily reflected in four aspects. (1) In terms of research subjects, this study extends research on watershed resilience from large, open river basins to semi-enclosed plateau lake basins in China’s western frontier regions, addressing the lack of research on watershed governance under conditions of strong ecological constraints and limited development alternatives. (2) In terms of research scale, this study uses townships and subdistricts as the units of analysis to identify intra-basin differences in resilience within the core area of the Erhai Lake Basin. Rather than claiming township-scale assessment as a wholly new approach, this study contributes by applying this scale to an integrated SES–PSR resilience framework in a small plateau lake basin, where ecological constraints, tourism development, agricultural non-point source pollution, and governance intervention are spatially intertwined. (3) In terms of the analytical framework, this study integrates SES theory with the PSR framework to construct a two-dimensional evaluation system encompassing social and ecological subsystems, thereby presenting the foundational mechanisms and differentiation logic of watershed resilience in a more systematic manner. (4) At the practical level, this study transforms resilience measurement results into differentiated governance strategies through typological classification, offering empirical insights and references for the coordinated advancement of ecological conservation, regional development transformation, and grassroots governance in plateau lake watersheds.
The remainder of this paper is structured as follows. Section 2 presents the theoretical basis and analytical framework. Section 3 describes the study area, data sources, and methods. Section 4 reports the spatiotemporal evolution of social, ecological, and comprehensive social–ecological resilience. Section 5 discusses adaptive governance strategies. Section 6 concludes with the main findings, limitations, and future research directions.

2. Theoretical and Analytical Framework

2.1. Social–Ecological System Theory

Social–ecological system (SES) theory emphasizes that natural ecosystems and human society should not be treated as two separate and independent domains, but as an integrated system characterized by coupling, interaction, and co-evolution [24,25]. Through resource use, institutional arrangements, interest linkages, and behavioral interactions, ecological processes and social processes continuously influence one another and generate dynamic feedback. In this sense, changes in the ecological environment are shaped not only by natural conditions, but also by social factors such as population concentration, industrial development, policy intervention, and governance capacity. At the same time, changes in ecosystem conditions affect socio-economic activities and governance structures through resource supply, environmental constraints, and risk transmission.
SES theory highlights a holistic and dynamic understanding of the operational logic of coupled human–nature systems. SES theory is particularly suitable for basin studies [28], where ecological conservation, economic development, and governance adjustment are deeply intertwined. The Erhai Lake Basin represents a typical SES formed through the interaction of resource and environmental conditions, socio-economic development, and institutional governance [23]. Examining the basin through the lens of SES theory helps reveal the coupled relationships and feedback mechanisms among ecological conservation, social development, and governance adaptation, thereby providing an important theoretical basis for analyzing basin resilience.

2.2. Pressure–State–Response Framework

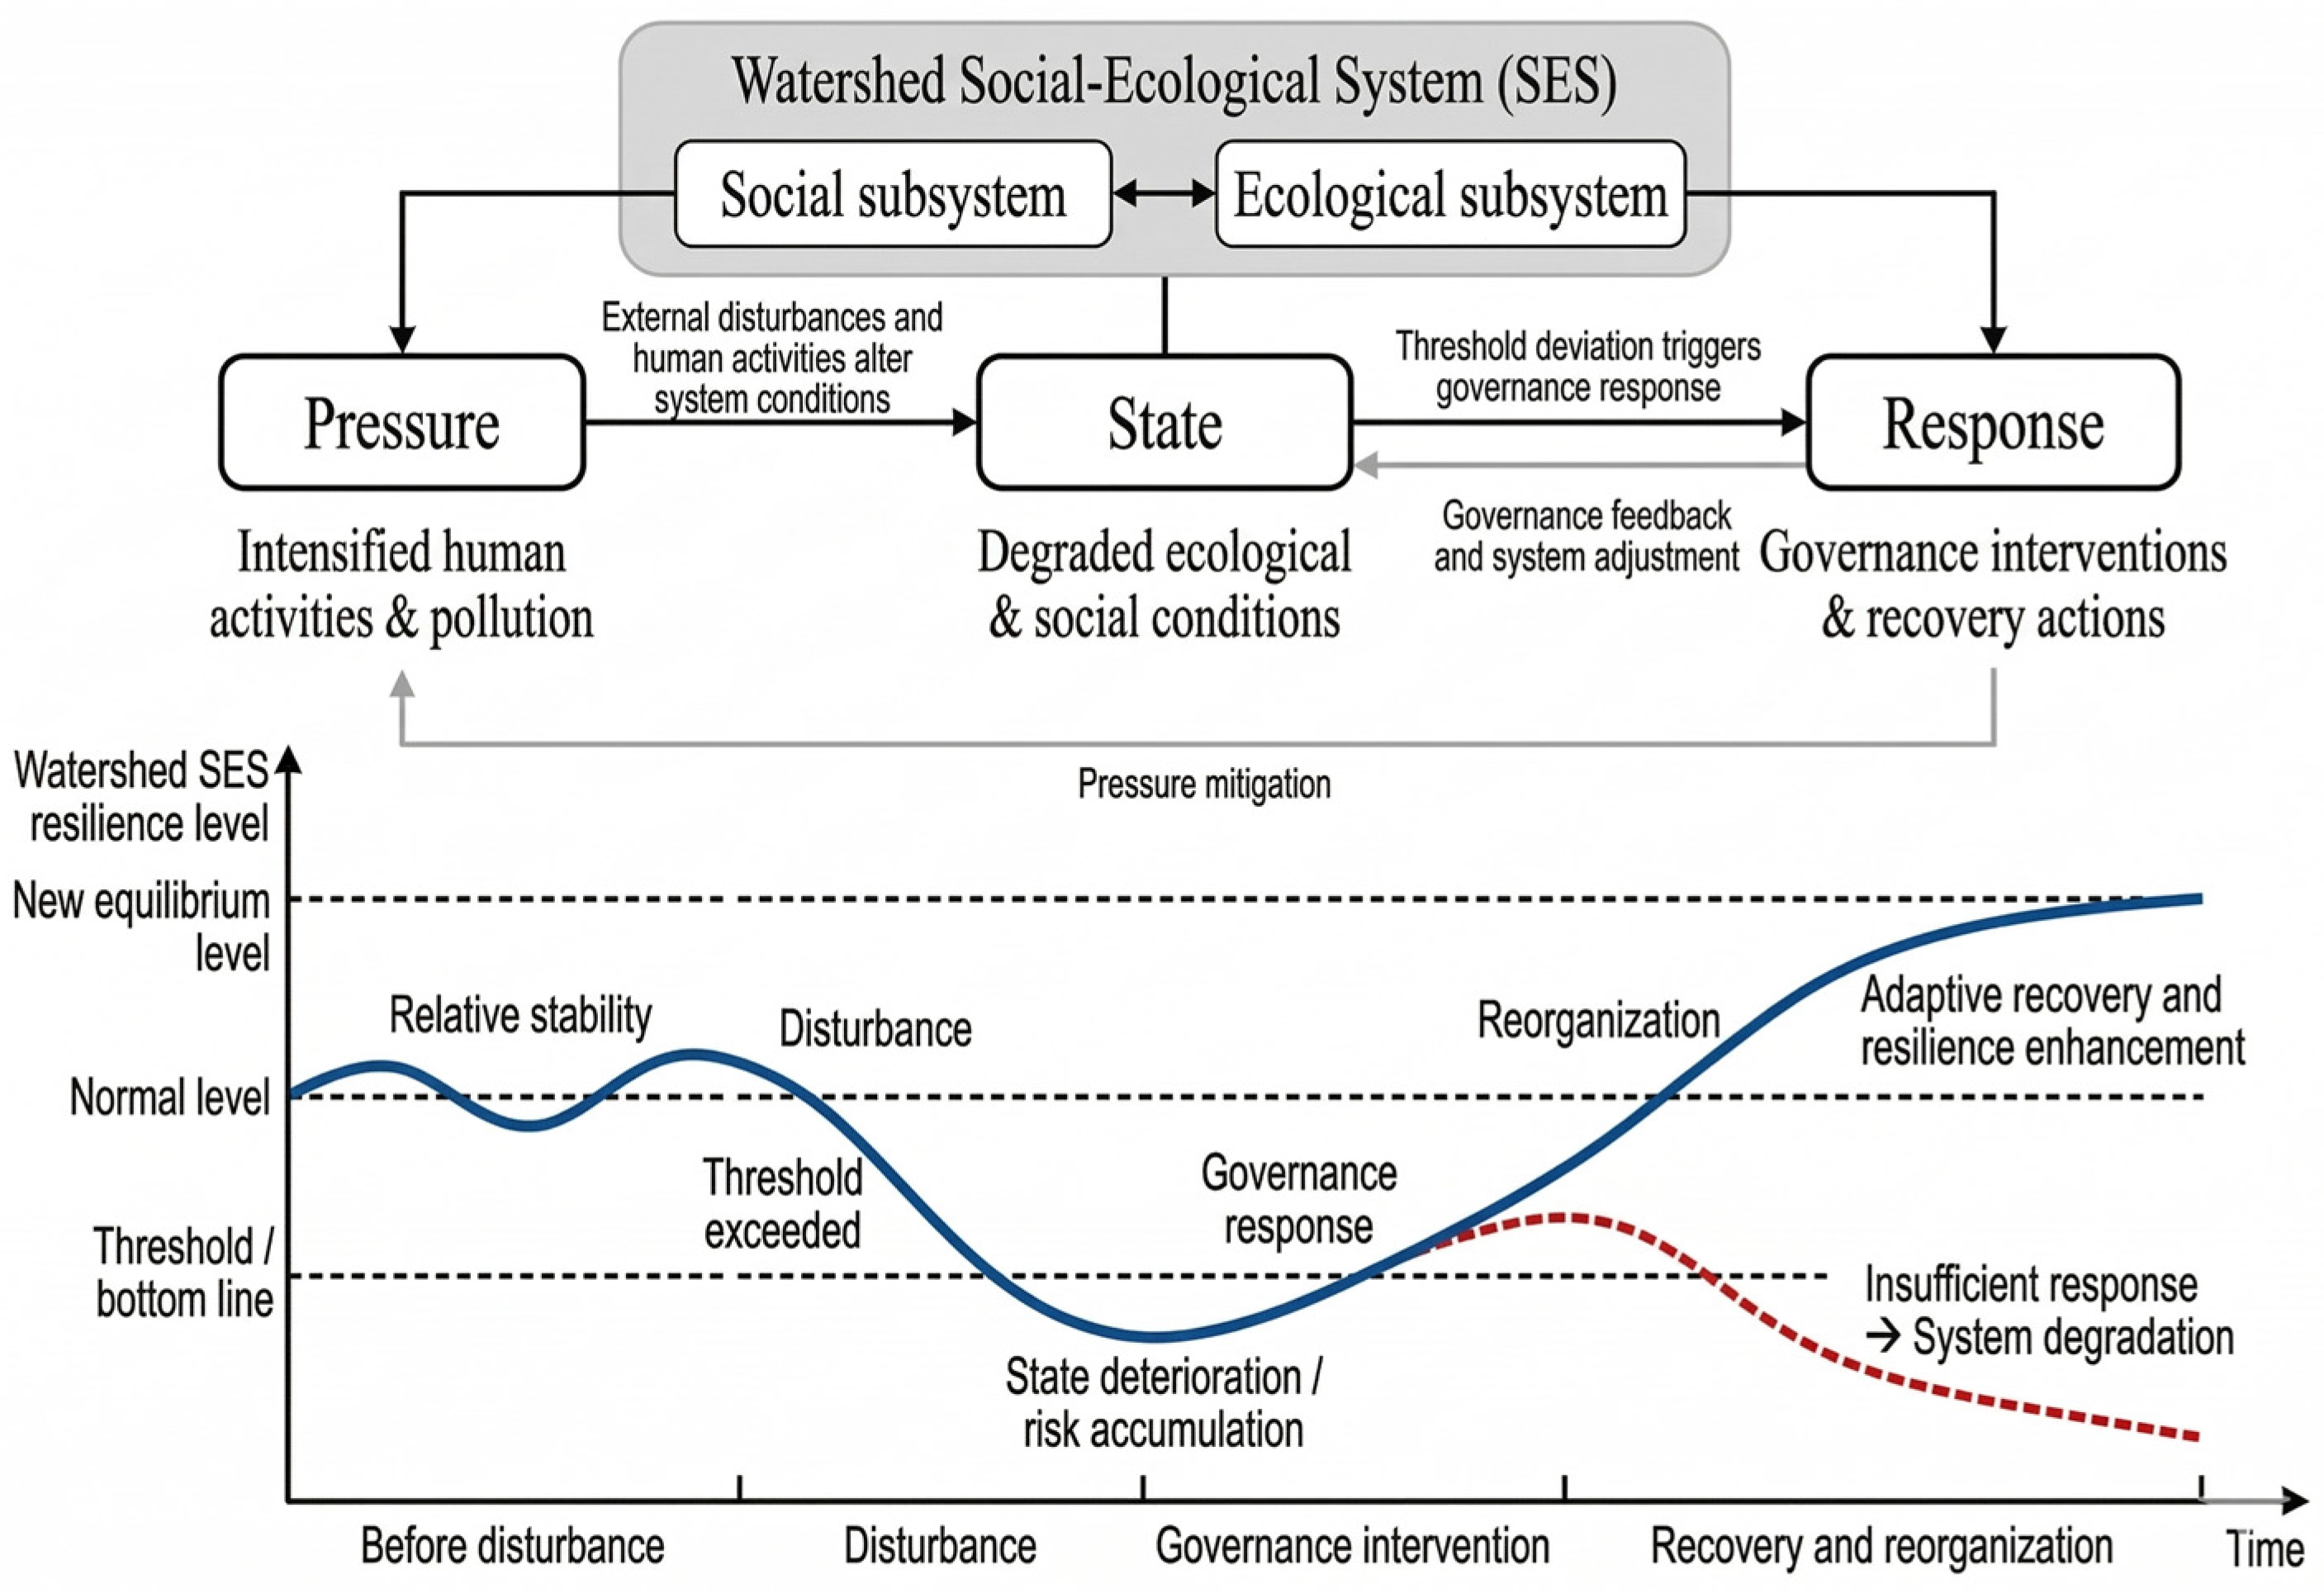
The pressure–state–response (PSR) framework is a classic analytical model for examining the interactions among human activities, environmental change, and governance feedback [29]. Its logic is that human activities and external disturbances impose pressures on a system, the accumulation of these pressures alters the state of the system, and when such changes exceed ecologically or socially acceptable limits, governance actors respond through institutional arrangements, policy instruments, and management measures in order to reduce pressures, restore system conditions, or redirect the system toward a more sustainable trajectory. By organizing complex interactions into a relatively clear analytical chain, the PSR framework provides an effective tool for examining the dynamic relationships among external disturbance, system condition, and governance response [30].
For this study, the PSR framework is suitable for analyzing the evolution of the SES in the Erhai Lake Basin for four main reasons. (1) The Erhai Lake Basin is a semi-enclosed plateau lake system with high ecological fragility, strong cumulative pollution effects, and marked threshold characteristics in ecological capacity and environmental carrying capacity [31]. Historical blue-green algae outbreaks indicate that its ecological state is highly sensitive to human disturbance [32]. (2) The basin is simultaneously affected by multiple pressures, including agricultural non-point source pollution, urban domestic wastewater discharge, and tourism expansion. The PSR framework is suited to capturing the resulting dynamic evolution of the basin SES. (3) The Erhai Lake Basin exhibits strong institutional embeddedness. Policy instruments such as local legislation [23], protection zoning [33,34], ecological red lines [35,36], the River (Lake) Chief System [37,38], unbalanced cost-sharing [39], the ecological network [40], and comprehensive basin governance provide concrete examples of how governance responses are mobilized when pressure-induced changes in system state emerge [41]. (4) The basin shows substantial internal spatial heterogeneity. Clear differences exist among upstream townships, lakeside core areas, and urban expansion zones in terms of development foundations, governance capacity, and ecological stress, which provide an appropriate empirical basis for examining resilience differentiation and exploring adaptive governance pathways.
On this basis, we integrate the SES theory with the PSR framework to construct an analytical framework for resilience assessment in the Erhai Lake Basin (Figure 1). SES provides the systemic perspective needed to understand the coupling and co-evolution of social and ecological subsystems, while PSR offers an operational structure for identifying how pressures, system states, and governance responses interact across time and space. Their integration makes it possible to evaluate social subsystem resilience, ecological subsystem resilience, and comprehensive resilience in a unified manner, and to further analyze the temporal evolution, spatial differentiation, and typological characteristics of basin resilience at the township scale.

3. Materials and Methods

3.1. Study Area

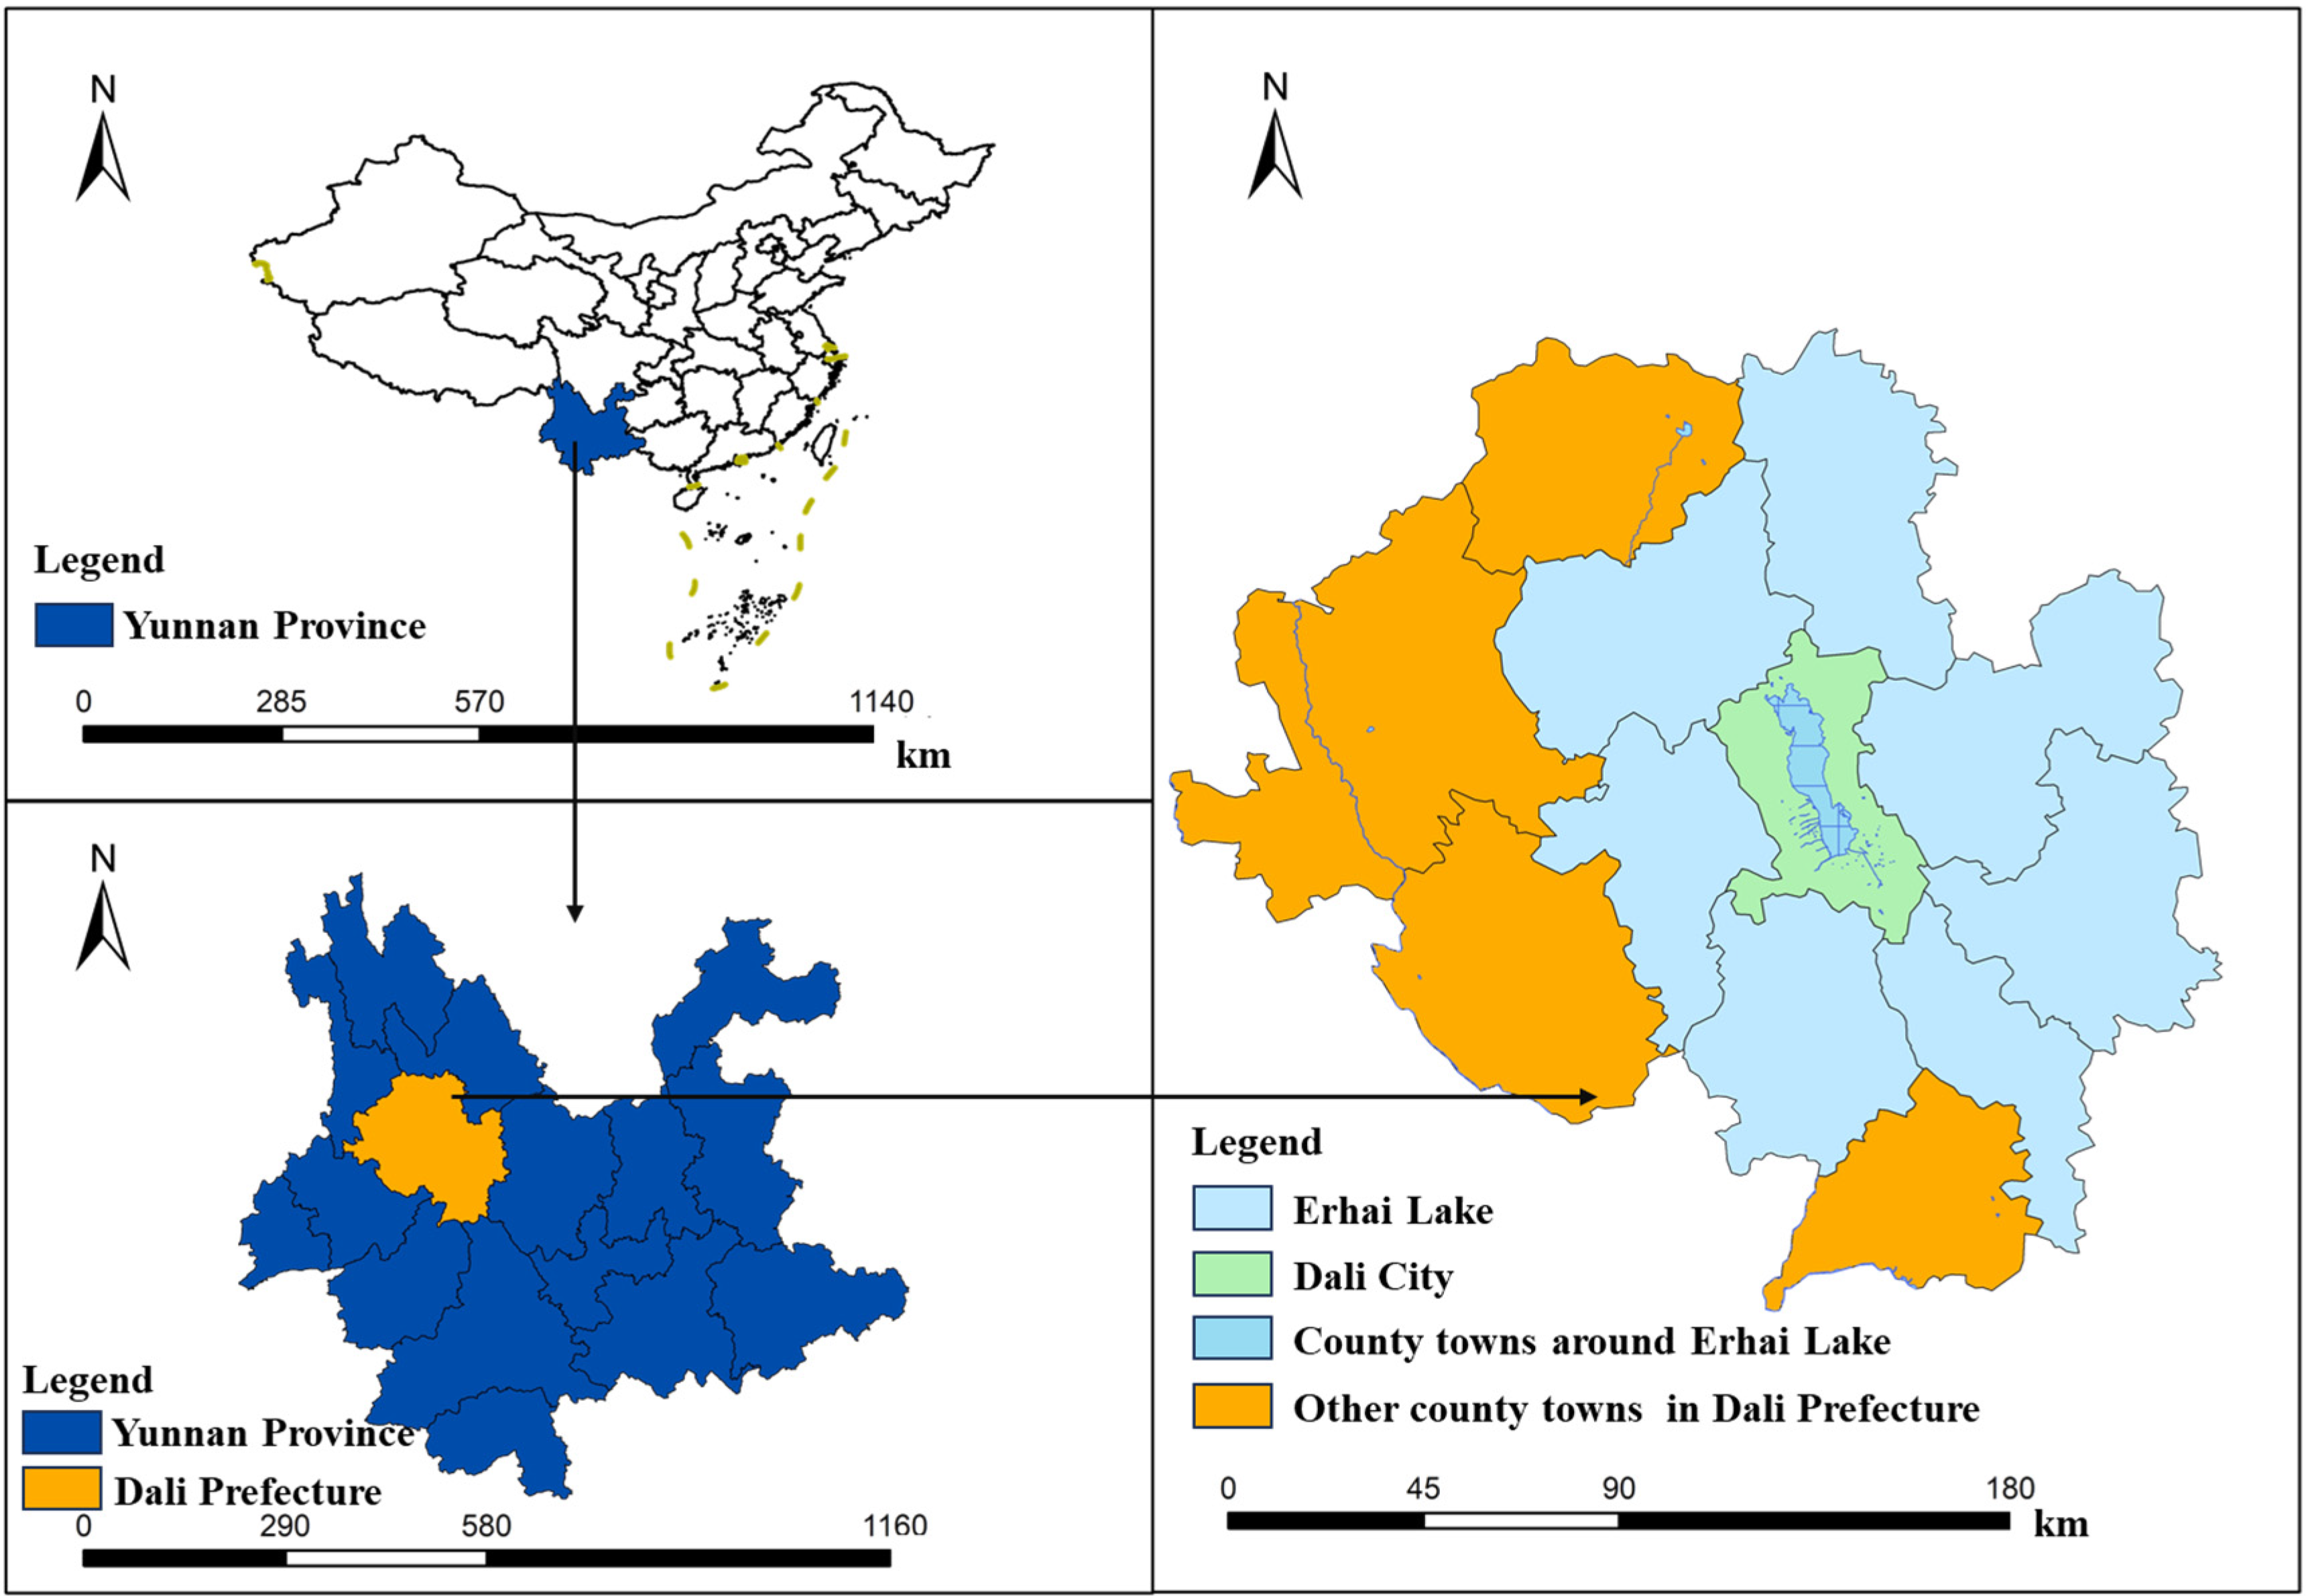
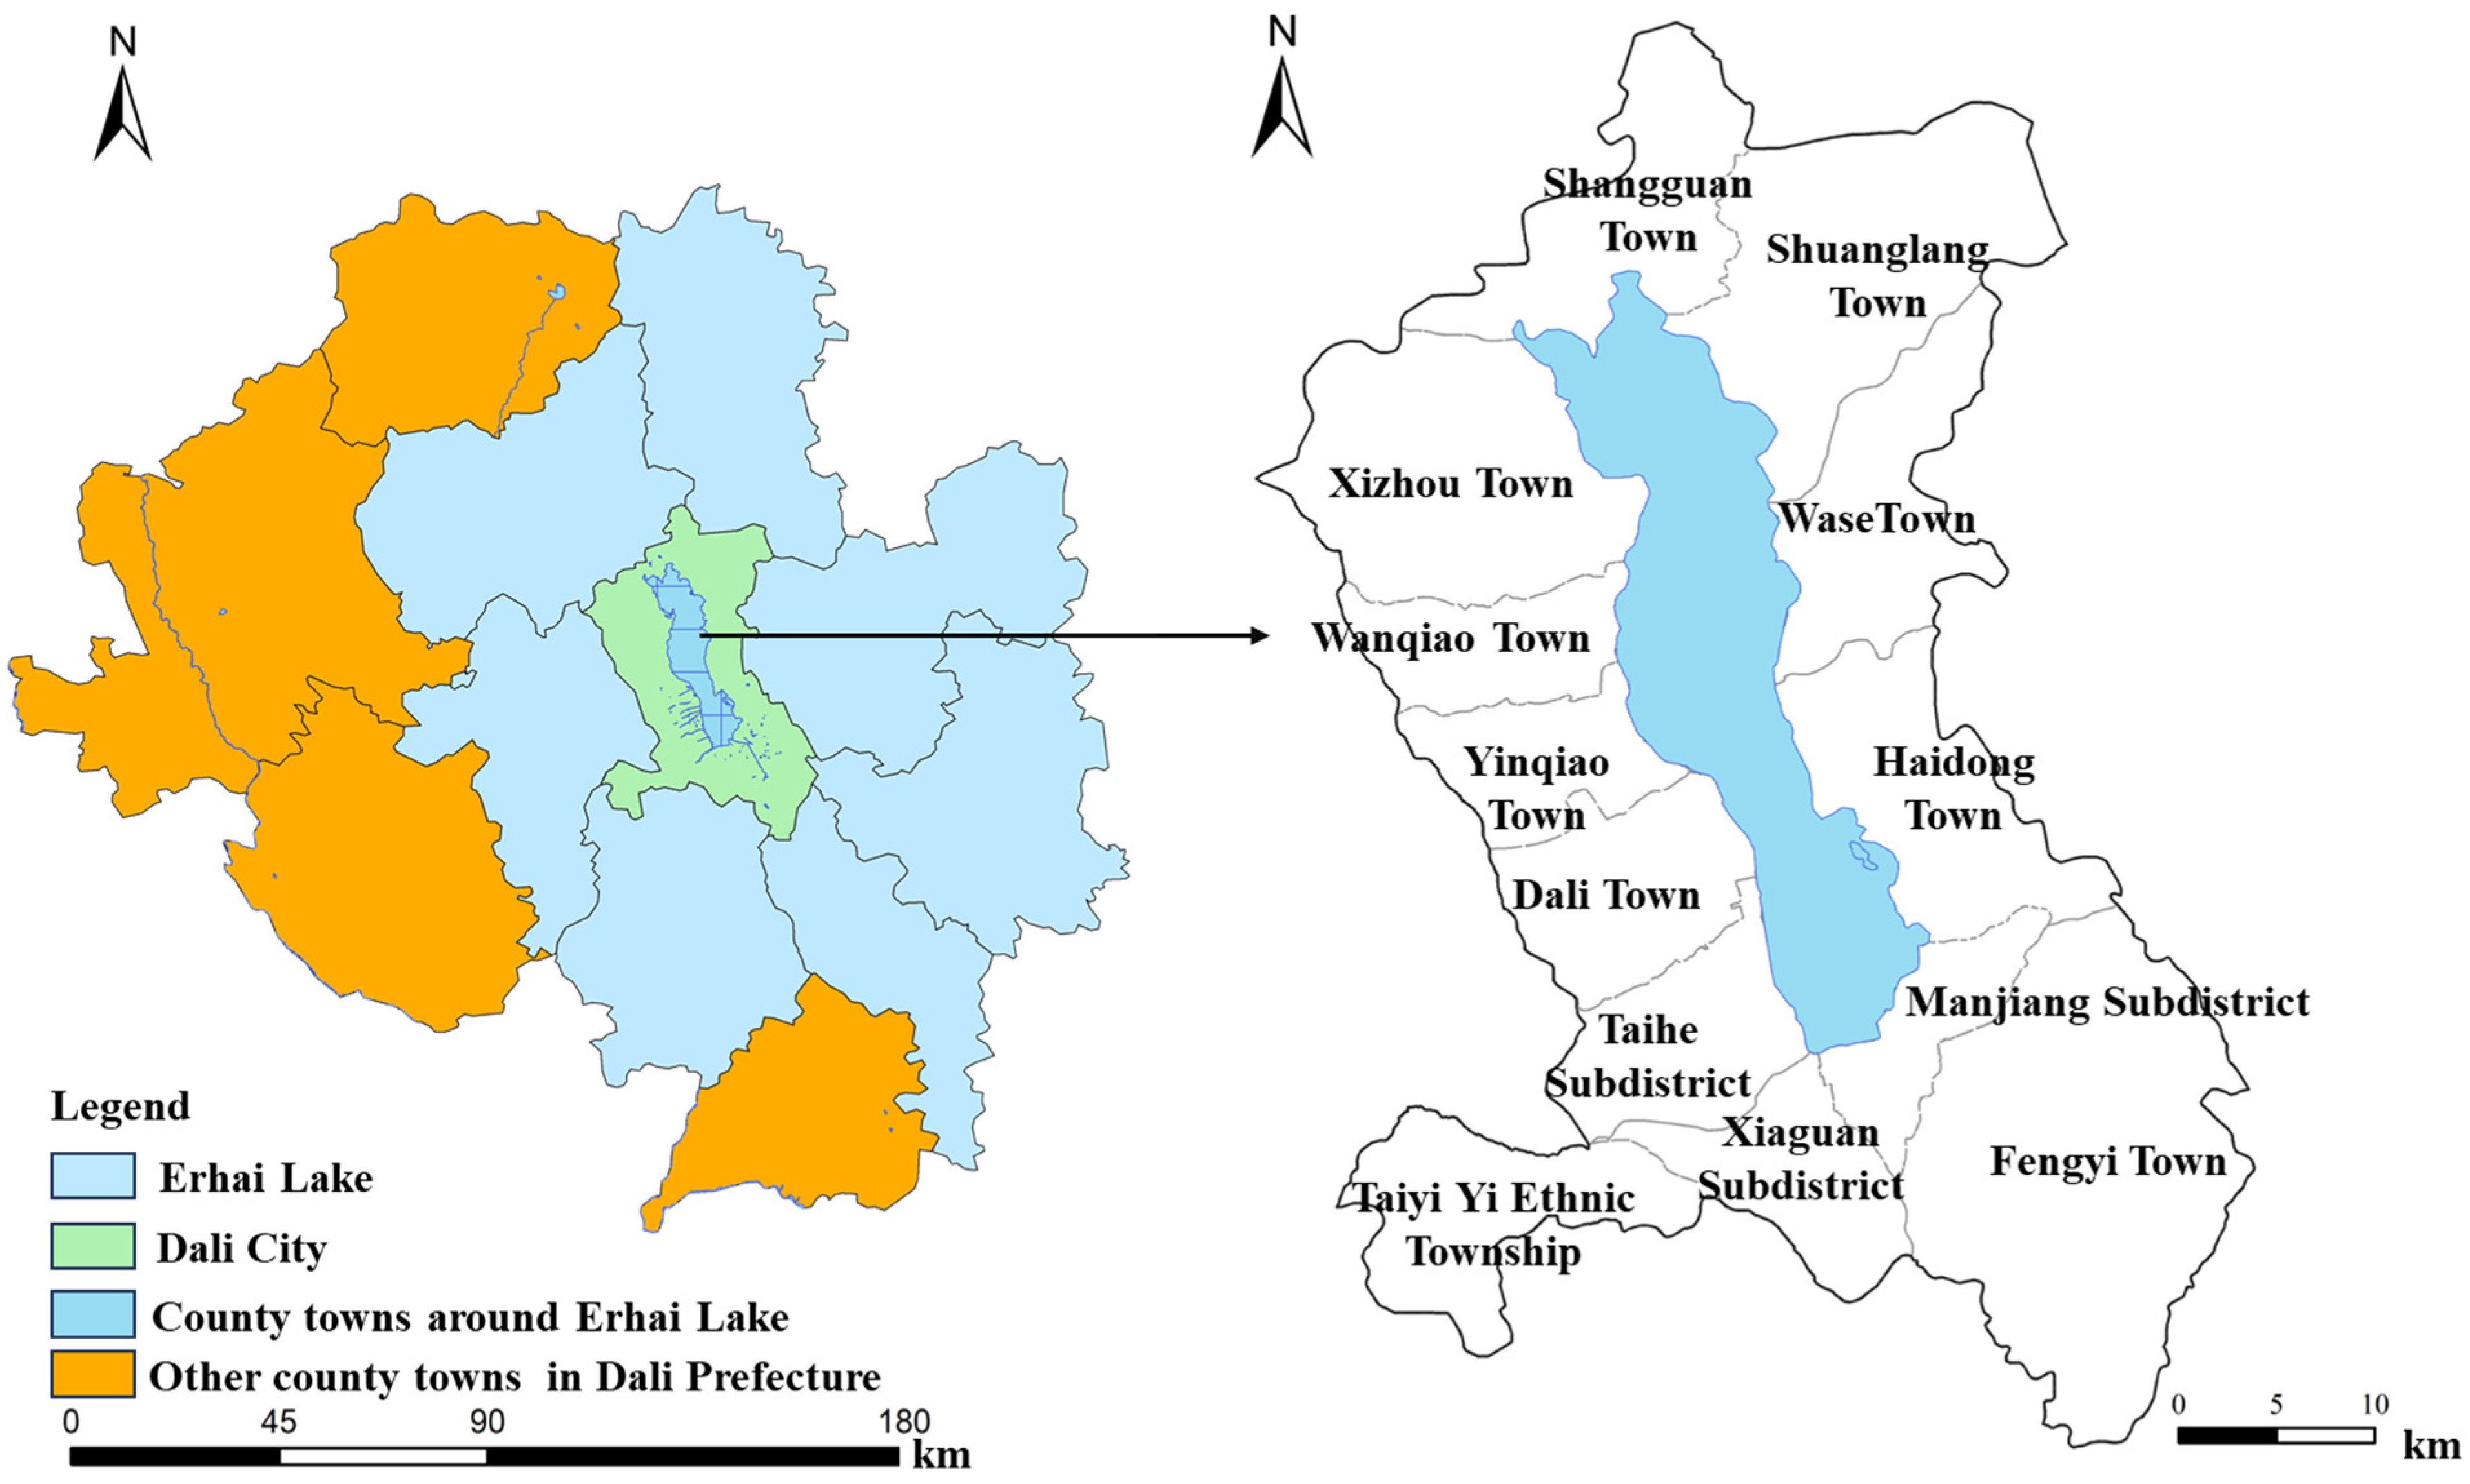
The Erhai Lake Basin is located in the central part of Dali Bai Autonomous Prefecture, Yunnan Province, China, and comprises the entire watershed centered on Lake Erhai, extending approximately between longitudes 99°32′–100°27′ E and latitudes 25°25′–26°16′ N. As the second-largest plateau freshwater lake in Yunnan Province, at an elevation of approximately 1972 m above sea level, Erhai is an important ecological unit within the province’s highland lake system and a key area for ecological protection and integrated basin management. According to the revised Regulations on the Protection and Management of Erhai Lake [42], the basin covers approximately 2565 km2. Considering administrative consistency and township-level data availability, this study focuses on the Dali City portion of the basin, including 13 township-level administrative units in Dali City, consisting of 9 towns, 3 subdistricts, and 1 ethnic township (Figure 2 and Figure 3).
The Erhai Lake Basin is a representative, ecologically fragile plateau lake basin characterized by the close interaction of ecological conservation, socio-economic development, and institutional governance. Agricultural non-point source pollution, urban expansion, tourism development, and policy intervention have together generated the Erhai Lake Basin’s persistent tensions between environmental protection and regional transformation. At the same time, substantial differences exist among townships in ecological conditions, development foundations, and governance capacity. These features make the basin an appropriate case for examining the spatiotemporal evolution and internal heterogeneity of social–ecological system resilience at the township scale. Accordingly, this paper takes the 13 township-level units within the basin as the basic units of analysis to identify variations in ecological pressure, system state, and governance response across the Erhai Lake Basin.

3.2. Construction of the Indicator System

This study constructs an indicator system to evaluate social–ecological system resilience in the Erhai Lake Basin by integrating SES with PSR. The assessment focuses on two subsystems, namely the social subsystem and the ecological subsystem, and incorporates basin-level pressures, system states, and governance responses into a unified analytical structure. To improve the policy relevance of the framework, the indicator system draws on the core goals of the United Nations 2030 Agenda for Sustainable Development [43]. The system is organized into three levels: the system level, the dimension level, and the indicator level. The system level includes the social and ecological subsystems; the dimension level consists of pressure, state, and response; and the indicator level contains 30 specific indicators (Table 1).
The selection of indicators was based on previous studies on basin social–ecological systems [44], basin resilience [45], agricultural non-point source pollution [46], and ecological governance [47,48]. Following the principles of representativeness, scientific validity, and operability, indicators with overlapping meanings, strong redundancy, or limited data reliability at the township scale were merged or excluded. Given the ecological sensitivity of the Erhai Lake Basin, the complexity of watershed governance, and the unevenness of regional development, this study further incorporates several basin-specific variables, including per capita arable land area, agricultural non-point source pollution, transportation accessibility, tourism resource endowment, and the proportion of the labor force working outside the region. These indicators help better reflect the local characteristics of the Erhai Lake Basin and improve the applicability of the resilience assessment at the township scale.

3.3. Data Sources

This study covers the period from 2010 to 2025. The indicator data were collected from three main sources. (1) Publicly available policy and statistical documents were used, including government statistical data and statistical yearbooks (2010–2025) [49], the Dali Municipal Government Work Reports [50], and the Dali Municipal Statistical Bulletin on National Economic and Social Development [51]. These materials were mainly used to obtain township-level time-series data on population, infrastructure, public services, social security, and other basic socio-economic indicators. (2) Data provided by environmental protection enterprises were used to supplement information related to ecological governance, environmental services, and governance investment at the township level. (3) First-hand materials obtained through fieldwork, including interview records, photographs of bulletin boards, and other on-site documentation, were used to identify and supplement indicator data that could not be directly obtained from public statistical sources.
Given the difficulties of ensuring consistency in statistical definitions and temporal continuity at the township level, every effort was made during data compilation to maintain consistent definitions and measurement standards for the same indicators across different years. For a small number of missing values, incomplete annual observations, or minor discrepancies in statistical definitions, the data were supplemented through interpolation based on adjacent years or by cross-checking fieldwork materials with existing records. Interpolated values account for less than 5% of the total dataset. Although this proportion is limited, we recognize that the potential influence of missing-data treatment depends not only on the amount of missing data but also on the missingness mechanism and the interpolation procedure [7]. Therefore, we further examined the distribution of interpolated observations and found that they were not systematically concentrated in townships with weaker development conditions or lower resilience levels, but mainly resulted from inter-year inconsistencies in statistical definitions or delayed reporting. This suggests that the missing observations were unlikely to introduce a directional bias into cross-township comparisons. In addition, all interpolated values were triangulated against at least two independent sources, including statistical yearbooks, enterprise-provided environmental records, and field documentation, before being incorporated into the dataset. These procedures were adopted to reduce the possibility that interpolation would distort the overall trend or affect the reliability of the empirical results.

3.4. Research Methods

3.4.1. Standardization of Indicators Using the Range Standardization Method

Indicator standardization is necessary to eliminate objective differences among indicators, such as inconsistent units, opposite directions, and variations in magnitude, thereby enabling horizontal comparison and vertical integration of multiple indicators within the same evaluation system. Common standardization methods include range standardization, mean standardization, Z-score standardization, and ratio standardization. Ratio standardization is highly sensitive to extreme values, while mean standardization and Z-score standardization may generate negative values, which can interfere with subsequent entropy-based calculations. Therefore, this study adopts the range standardization method to transform all indicators into values within the interval of [0,1], thus ensuring comparability across indicators and facilitating the subsequent calculation of indicator weights.
Let i = 1 , 2 , , N denote the township or subdistrict, where N = 13 ; let t = 1 , 2 , , T denote the time period, where T = 4 ; let s { S , E } denote the subsystem, where S represents the social subsystem and E represents the ecological subsystem; and let j = 1 , 2 , , p s denote the indicator within subsystem s . The number of indicators is p S = 16 for the social subsystem and p E = 14 for the ecological subsystem. The raw value of the j -th indicator for township i in time period t within subsystem s is denoted as x i t j s , and the standardized value is denoted as y i t j s .
  • Positive Indicators
Positive indicators refer to those where a higher value is more conducive to enhancing system resilience, meaning the indicator has a positive correlation with the resilience level. Examples include public service capacity, investment in ecological projects, and vegetation coverage. The closer the standardized value of a positive indicator is to 1, the better the sample’s performance on that indicator, and the stronger its supportive role in resilience. The standardization formula for positive indicators is:
y i t j ( s ) = x i t j ( s ) min i , t x i t j ( s ) max i , t x i t j ( s ) min i , t x i t j ( s )
where m a x i , t x i t j s and m i n i , t x i t j s represent the maximum and minimum values of the j -th indicator in subsystem s across all township–year observations.
2.
Negative Indicators
Negative indicators refer to those where a higher value is less conducive to improving system resilience, meaning the indicator has a negative correlation with the resilience level. Examples include indicators such as wastewater discharge volume within a watershed, ecological pressure, and frequency of chemical fertilizer use. After standardization, the values of negative indicators are all converted to the [0,1] interval; a larger value indicates a stronger positive supporting effect of that negative indicator on system resilience. The evaluation direction of negative indicators aligns with that of positive indicators. The standardization formula for negative indicators is:
y i t j ( s ) = max i , t x i t j ( s ) x i t j ( s ) max i , t x i t j ( s ) min i , t x i t j ( s )

3.4.2. Principal Component Analysis

  • Applicability Test
Before conducting principal component analysis (PCA), the Kaiser–Meyer–Olkin (KMO) measure of sampling adequacy and Bartlett’s test of sphericity were performed separately on the indicator data of the social resilience and ecological resilience subsystems to determine whether the data met the prerequisites for PCA. The KMO statistic measures the relative magnitude of partial correlations among variables, with values ranging from 0 to 1. In general, a KMO value greater than 0.6 indicates that the data are suitable for PCA. Bartlett’s test of sphericity tests the null hypothesis that the correlation matrix is an identity matrix, meaning that the variables are mutually independent. If the test result is significant (p < 0.05), the null hypothesis is rejected, indicating that significant correlations exist among the variables and that the data are appropriate for PCA.
In this study, the standardized data from the four time periods were vertically stacked to construct two global data matrices. The social subsystem matrix contained 52 township–year observations and 16 indicators, while the ecological subsystem matrix contained 52 township–year observations and 14 indicators. The results of the KMO and Bartlett’s tests are presented in Table 2. The KMO values were 0.763 for the social subsystem and 0.714 for the ecological subsystem. Bartlett’s test was significant for both subsystems, with p < 0.001 . These results indicate that the two subsystem datasets have appropriate correlation structures and are suitable for PCA.
2.
Global Principal Component Analysis
The social and ecological resilience data used in this study cover four time points: 2010, 2015, 2020, and 2025. If principal component analysis (PCA) were conducted separately for each individual year, the resulting component loading matrices would differ across periods because of variations in the annual data structure. This would weaken the comparability of resilience scores across different years. To ensure both the horizontal comparability among townships and the vertical consistency of resilience indices over time, this study adopts a global principal component analysis approach, following its recent application in multi-period index evaluation studies [52]. Specifically, the standardized township-level data from 2010, 2015, 2020, and 2025 were pooled into a single global matrix for each subsystem, and PCA was then conducted on the pooled matrix.
For subsystem s , the standardized matrix for time period t is expressed as:
Y t ( s ) = y i t j ( s ) N × p s
where N = 13 , p S = 16 , and p E = 14 . By vertically stacking the standardized matrices from the four time periods, the global data matrix for subsystem s is constructed as:
Y 2010 2025 ( s ) = Y 2010 ( s ) Y 2015 ( s ) Y 2020 ( s ) Y 2025 ( s ) ( N × T ) × p s
Thus, the social subsystem matrix is Y 2010 2025 ( S ) R 52 × 16 , and the ecological subsystem matrix is Y 2010 2025 ( E ) R 52 × 14 . PCA was then performed on each global matrix. Principal components were retained according to the combined consideration of eigenvalues and cumulative variance contribution. For the social subsystem, four principal components were retained, explaining 71.36% of the total variance. For the ecological subsystem, three principal components were retained, explaining 75.61% of the total variance. The results are shown in Table 3.
Let F r , i t s denote the score of the r -th retained principal component for township i in time period t within subsystem s . Let K s denote the number of retained principal components in subsystem s , where K S = 4 and K E = 3 . The normalized weight of the r -th retained principal component is calculated as:
a r ( s ) = V r ( s ) r = 1 K s V r ( s )
where V r s is the variance contribution rate of the r -th retained principal component in subsystem s . The preliminary subsystem resilience index is then calculated as:
R ˜ i t ( s ) = r = 1 K s a r ( s ) F r , i t ( s )
Since PCA scores may contain negative values and the direction of principal components can be arbitrary, the direction of each retained principal component was checked to ensure that a higher score consistently represented stronger subsystem resilience. The preliminary subsystem indices were then rescaled into the interval [0,1] to obtain the final subsystem resilience indices:
R i t ( s ) = R ˜ i t ( s ) min i , t R ˜ i t ( s ) max i , t R ˜ i t ( s ) min i , t R ˜ i t ( s )
Accordingly, the social resilience index and ecological resilience index are denoted as R S , i t and R E , i t , respectively. These two subsystem indices provide the basis for the subsequent construction of the comprehensive social–ecological system resilience index.

3.4.3. The Entropy Method for Calculating Subsystem Weights

After the social resilience index R S , i t and ecological resilience index R E , i t were obtained through global principal component analysis (GPCA), the entropy weight method was further used to determine the relative weights of the two subsystems. Unlike subjectively fixed weighting ratios, this data-driven approach allocates weights based on the actual degree of informational variation across townships and observation periods. Consequently, it prevents the mechanical assignment of equal weights from obscuring the substantive contributions of highly dispersed subsystems, thereby enhancing the explanatory power of the comprehensive social–ecological resilience index.
In this study, the entropy weight method was applied to the two subsystem indices obtained through GPCA, rather than to the original indicators. Given N townships and T time periods, the total number of township–year observations is M = N × T = 52 . Let j = 1 , 2 denote the subsystem index, where j = 1 represents the social resilience index R S , i t , and j = 2 represents the ecological resilience index R E , i t . Let y i t , j denote the standardized value of the j -th subsystem index for township i in time period t . Since the subsystem indices obtained in Section 3.4.2 were already rescaled into the interval [0,1], they were directly used for entropy-weight calculation. The calculation steps are as follows.
  • The Proportion of Each Subsystem Index
p i t , j = y i t , j i = 1 N t = 1 T y i t , j , i = 1 , 2 , , N ; t = 1 , 2 , , T ; j = 1 , 2 .
where p i t , j represents the proportion of township i in time period t under the j -th subsystem index, and y i t , j is the standardized value of the corresponding subsystem index.
2.
Indicator Entropy
e j = k i = 1 N t = 1 T p i t , j ln p i t , j
k = 1 ln N T
where e j represents the entropy value of the j -th subsystem index, and k is a normalization constant used to ensure 0 e j 1 . When p i t , j = 0 , p i t , j l n p i t , j is defined as 0.
3.
Degree of Divergence
d j = 1 e j
where d j represents the information utility value of the j -th subsystem index.
4.
Subsystem Weights
w j = d j j = 1 2 d j
where wj represents the weight of the j-th subsystem index, satisfying:
j = 1 2 w j = 1
The weighting results yield w 1 = 0.412 and w 2 = 0.588 . Since w 1 corresponds to the social subsystem and w 2 corresponds to the ecological subsystem, the final subsystem weights are:
w S = 0.412 , w E = 0.588

3.4.4. Synthesis of Comprehensive Resilience Index

After obtaining the social resilience index R S , i t , ecological resilience index R E , i t , and their corresponding subsystem weights, the comprehensive social–ecological system resilience index was calculated through weighted linear aggregation. The formula is as follows:
R C , i t = w S R S , i t + w E R E , i t
where R C , i t denotes the comprehensive social–ecological system resilience index of township i in time period t , R S , i t denotes the social resilience index, R E , i t denotes the ecological resilience index, and w S and w E denote the entropy weights of the social and ecological subsystems, respectively.

3.4.5. Linear Mixed-Effects Model

To further examine whether the resilience indices changed significantly over time while accounting for the repeated observations of the same townships, this study employed a linear mixed-effects model (LMM). Since each township or subdistrict was observed at four time points, namely 2010, 2015, 2020, and 2025, the observations are not fully independent. The LMM can account for this nested data structure by incorporating township-specific random effects. In this study, separate LMMs were estimated for the social resilience index R S , i t , ecological resilience index R E , i t , and comprehensive social–ecological system resilience index R C , i t . Let R k , i t denote the resilience index of type k for township i in time period t , where k { S , E , C } . The model is specified as follows:
R k , i t = β 0 k + β 1 k T i m e t + u i k + ε k , i t
where R k , i t denotes the resilience index of township i in time period t ; β 0 k is the fixed intercept; β 1 k represents the fixed effect of time; u i k is the random intercept for township i ; and ε k , i t is the residual error term. The township-specific random intercept and residual error were assumed to follow normal distributions with mean zero. T i m e t was coded as 0, 1, 2, and 3 for 2010, 2015, 2020, and 2025, respectively. Township was specified as a random intercept to account for repeated observations within the same township.

3.4.6. Classification of Comprehensive Resilience Index

Classifying the Comprehensive Resilience Index (RC,it) helps to visually represent spatial disparities among townships and provides a standardized reference for intertemporal analysis. While the equal interval method is commonly used for its simplicity, its assumption of linear distribution contradicts the nonlinear threshold effects and structural discontinuities typical of socio-ecological systems. To more accurately categorize resilience levels, this study adopts Jenks’ natural breaks optimization algorithm, supplemented by the bootstrap sampling method to verify breakpoint robustness.
  • Jenks’ Natural Breaks Method
To accurately reflect the inherent data structure and avoid the distortions caused by artificial equidistant boundaries, this study employed Jenks’ natural breaks method [53]. To ensure strict intertemporal comparability, the comprehensive resilience index (RC,it) values across the four time periods (2010, 2015, 2020, and 2025) were pooled into a global sample (N × T = 52) to generate a unified breakpoint classification applicable to all periods.
The classification performance was evaluated using the Goodness of Variance Fit (GVF) index:
G V F =   1   S D C M S D A M
where SDAM is the total variance of the sample, and SDCM is the sum of the variances of each class.
A GVF value closer to 1 indicates that the classification scheme better accounts for within-sample variation, and a GVF value of 0.90 or above is generally regarded as indicating excellent classification performance. In this study, the Jenks natural breaks classification produced a GVF value of 0.9294, suggesting that the identified breakpoints effectively capture the inherent distributional structure of the pooled sample. The resulting breakpoints and corresponding classification intervals are reported in Table 4.
2.
Bootstrap Robustness Test
To assess the statistical stability of the Jenks’ breakpoints, we employed a nonparametric percentile bootstrap sampling method. Specifically, random samples were drawn with replacement from the original observations, and the Jenks’ algorithm was reapplied to the resampled data to record the four internal breakpoints. This procedure was repeated for B = 5000 iterations. Subsequently, a 95% confidence interval for each breakpoint was constructed using the 2.5th and 97.5th percentiles of the bootstrap distribution. The robustness test results are presented in Table 5 and are used as supplementary empirical evidence to support the choice of the Jenks-based categorization criterion.
The bootstrap results show that the middle- and upper-level breakpoints are relatively stable, especially BP3 and BP4, which have narrower confidence intervals and smaller standard deviations. BP2 also shows moderate stability. In contrast, BP1 has a wider confidence interval, indicating greater uncertainty near the lower tail of the pooled distribution. This is likely related to the relatively sparse observations in the low-resilience range. Therefore, while the Jenks classification is generally robust for distinguishing medium-to-high resilience levels, the interpretation of the low and low–medium boundary should remain cautious. Based on the above classification results, the comprehensive social–ecological system resilience index R C , i t was divided into five levels: low, low–medium, medium, medium–high, and high (Table 4). These unified breakpoints were applied consistently to all four time periods, thereby ensuring comparability of resilience levels across townships and years.

3.4.7. Global Moran’s I

To determine whether township resilience levels exhibit systematic spatial clustering or dispersion, this study employed the Global Moran’s I to conduct spatial autocorrelation tests on the comprehensive resilience index (RC,it) across the four time periods. Following the temporal analysis, this spatial evaluation provides a rigorous statistical basis for the subsequent interpretation of spatial heterogeneity across the basin.
  • The spatial weight matrix
The configuration of the spatial weight matrix is a critical parameter that significantly influences spatial autocorrelation analysis. Given the small sample size (N = 13) and the irregular areas and shapes of the administrative units in the Erhai Lake Basin, a traditional contiguity-based matrix might overlook geographically linked but non-adjacent units. Conversely, a fixed-distance threshold approach is prone to generating isolated nodes under a limited sample size. To overcome these limitations, we employed a K-Nearest Neighbors (KNN) weight matrix. Using the coordinates of the township government seats as spatial reference points, setting K = 3 means connecting each unit to its 3 closest neighbors to ensure matrix connectivity and consistent neighborhood scales across all nodes. Finally, the matrix was row-standardized to normalize the spatial weights and eliminate potential scale biases.
2.
Global Moran’s Index
The formula for calculating the Global Moran’s I is:
I t = N S 0 i = 1 N j = 1 N w i j ( R C , i t R ¯ C , t ) ( R C , j t R ¯ C , t ) i = 1 N ( R C , i t R ¯ C , t ) 2
where I t denotes Global Moran’s I in time period t ; N = 13 denotes the number of township-level spatial units; w i j denotes the row-standardized spatial weight between townships i and j ; R C , i t and R C , j t denote the comprehensive resilience indices of townships i and j in time period t , respectively; R ¯ C , t denotes the mean value of the comprehensive resilience index across all townships in time period t ; and S 0 denotes the sum of all spatial weights. A positive value of Global Moran’s I indicates positive spatial autocorrelation, meaning that townships with similar resilience levels tend to be spatially clustered. A negative value indicates negative spatial autocorrelation, meaning that townships with dissimilar resilience levels tend to be adjacent. A value close to zero indicates a random spatial distribution.

3.4.8. Typological Analysis

Typological analysis is an effective approach for identifying structural differences and combination patterns within complex systems [54]. By reducing multidimensional and heterogeneous phenomena into analytically meaningful categories, it helps reveal the internal structure, developmental trajectories, and differentiated characteristics of the research object. This method is particularly useful for examining how different units exhibit distinct patterns under specific combinations of key variables.
In this study, typological analysis is employed to further interpret the internal structure of SES resilience in the Erhai Lake Basin based on the comprehensive resilience assessment results. Beyond measuring overall resilience levels, this approach enables a deeper examination of the differentiated relationships between ecological protection and social development across townships in the basin.
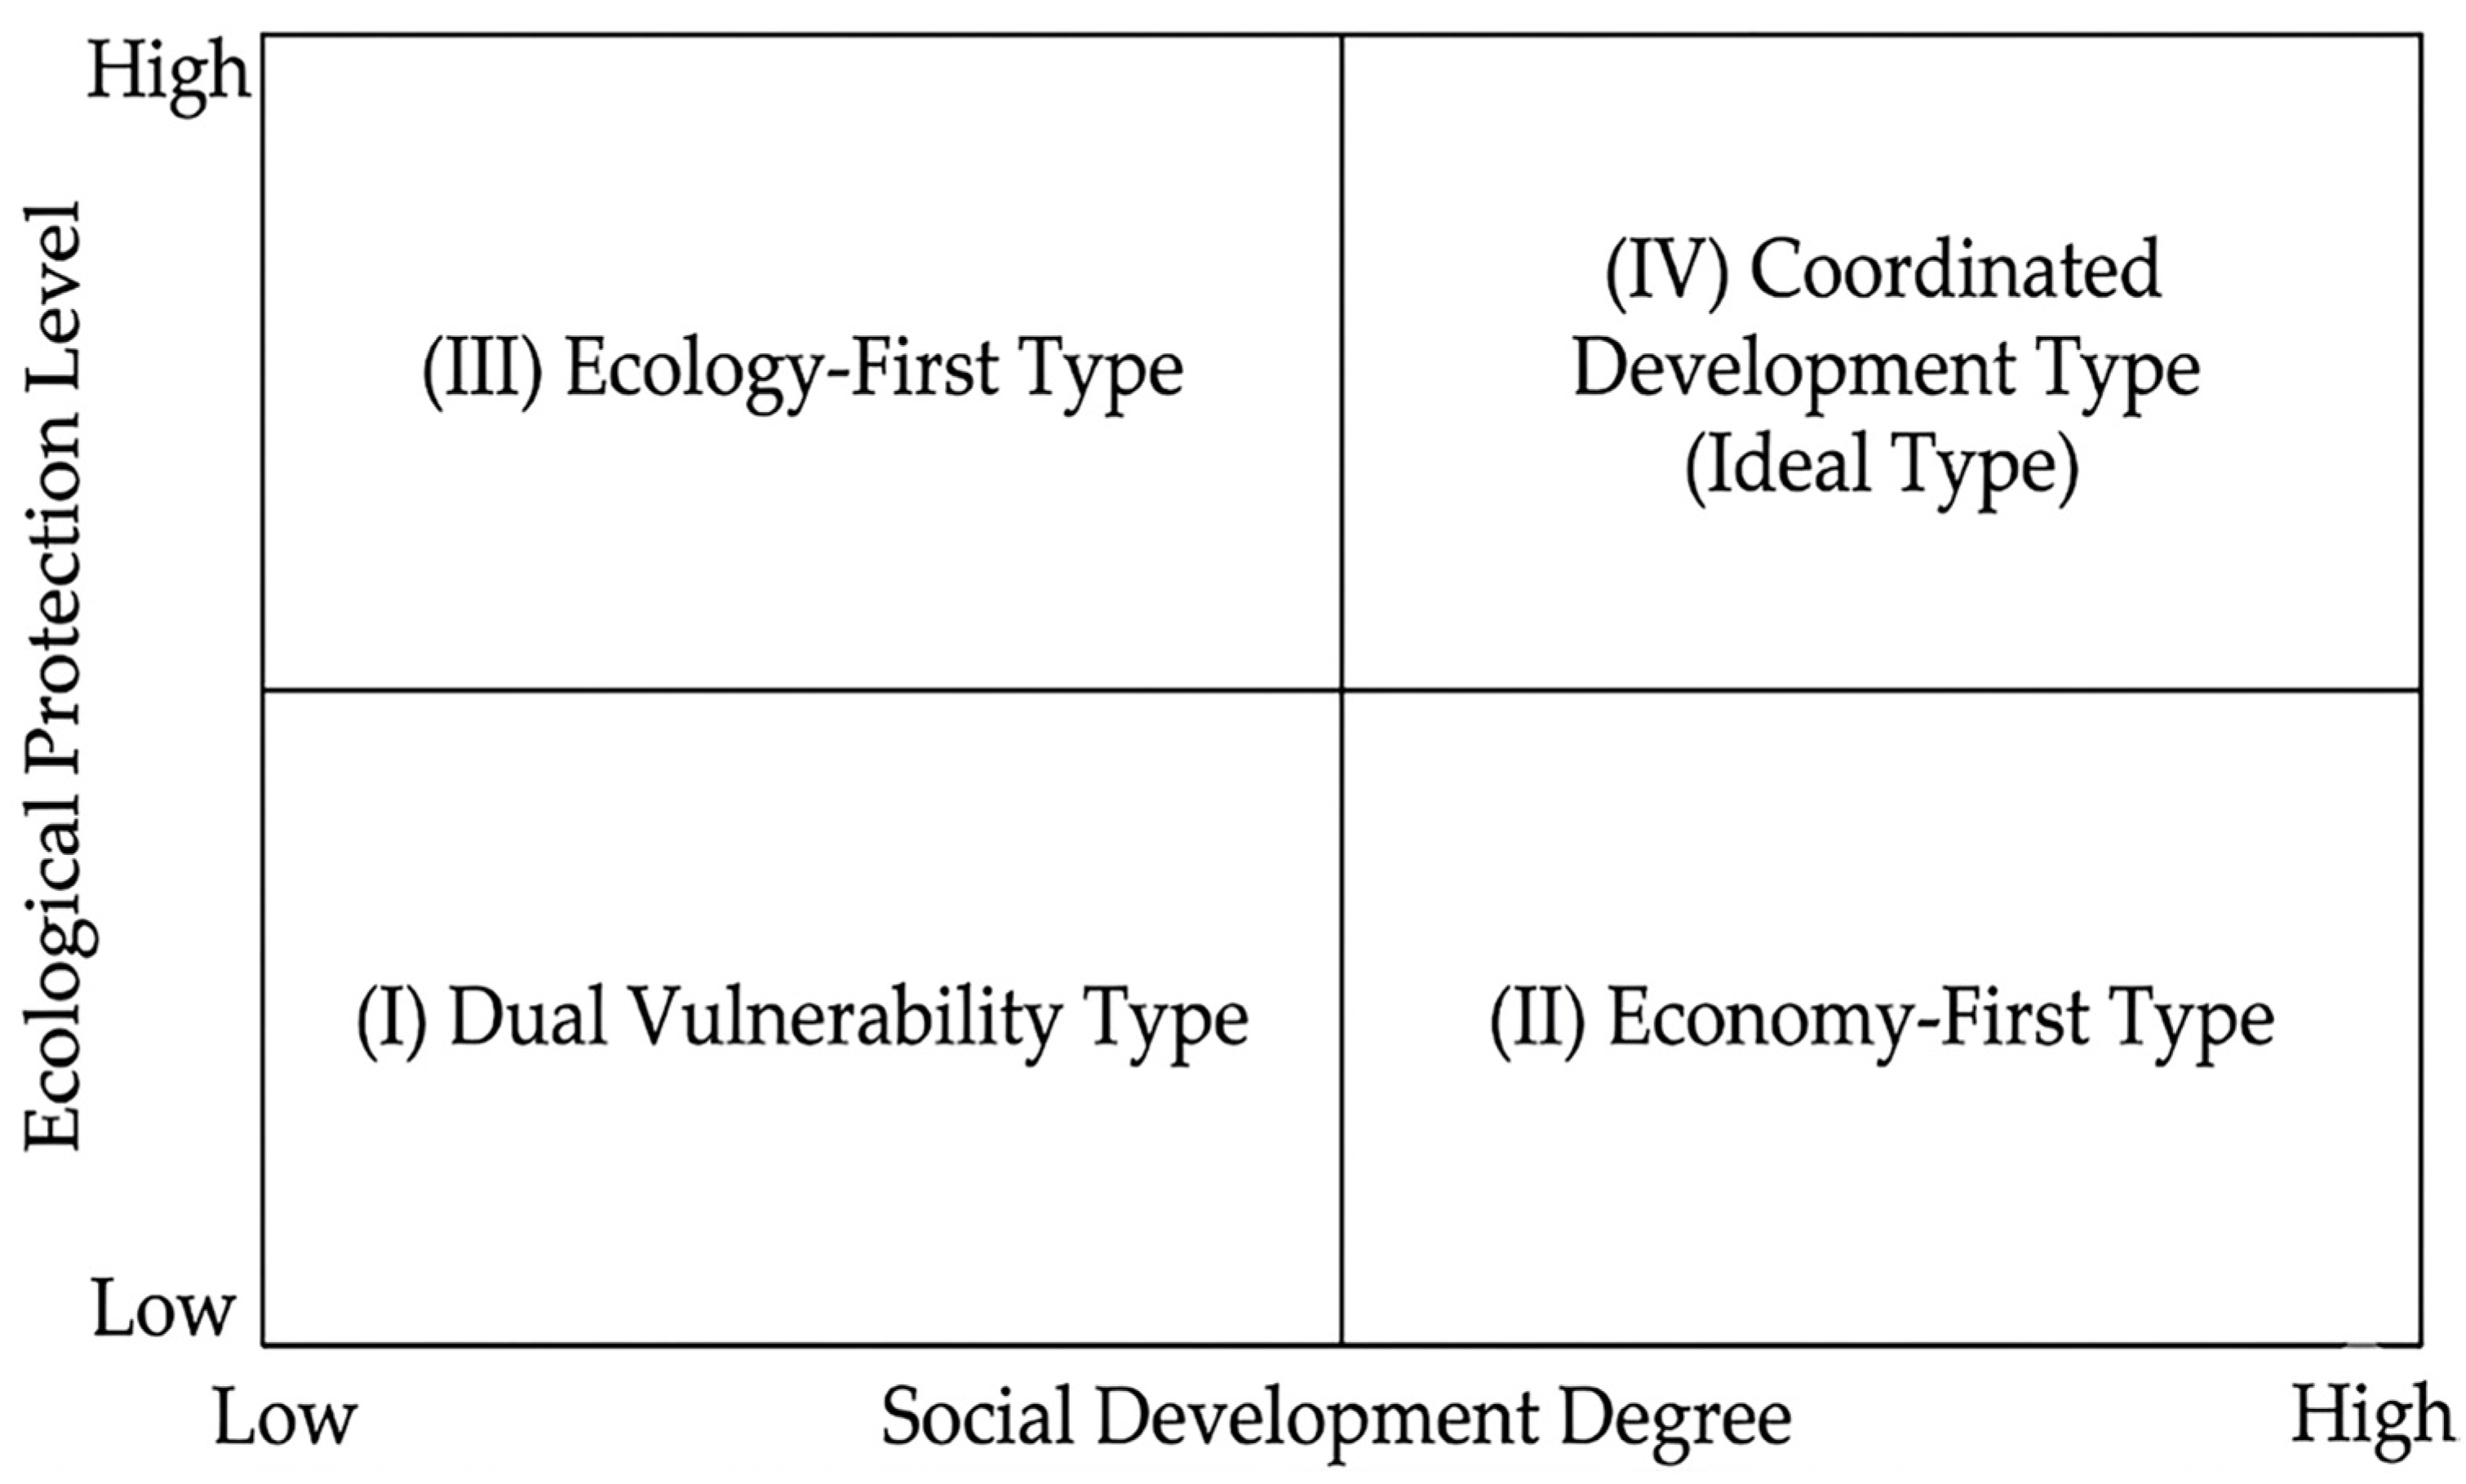
Specifically, a two-dimensional analytical matrix of “Ecological Protection (Level) × Social Development (Degree)” is constructed, with Ecological Protection (Level) as the vertical axis and Social Development (Degree) as the horizontal axis. Based on this matrix, the SES of the Erhai Lake Basin is classified into different types, thereby providing a clearer basis for understanding spatial differentiation and identifying targeted governance pathways (Figure 4).
The SES of the Erhai Lake Basin is categorized into four basic types: (I) the dual-vulnerability type characterized by low levels of ecological protection and low levels of social development; (II) the economy-priority type characterized by low levels of ecological protection and high levels of social development; (III) the ecological priority type, characterized by high levels of ecological protection and low levels of social development; and (IV) the coordinated development type, characterized by high levels of both ecological protection and social development. Among these, the coordinated development type (IV) represents the ideal model for ecological protection and social development in the basin.

4. Results

4.1. Temporal Evolution Characteristics

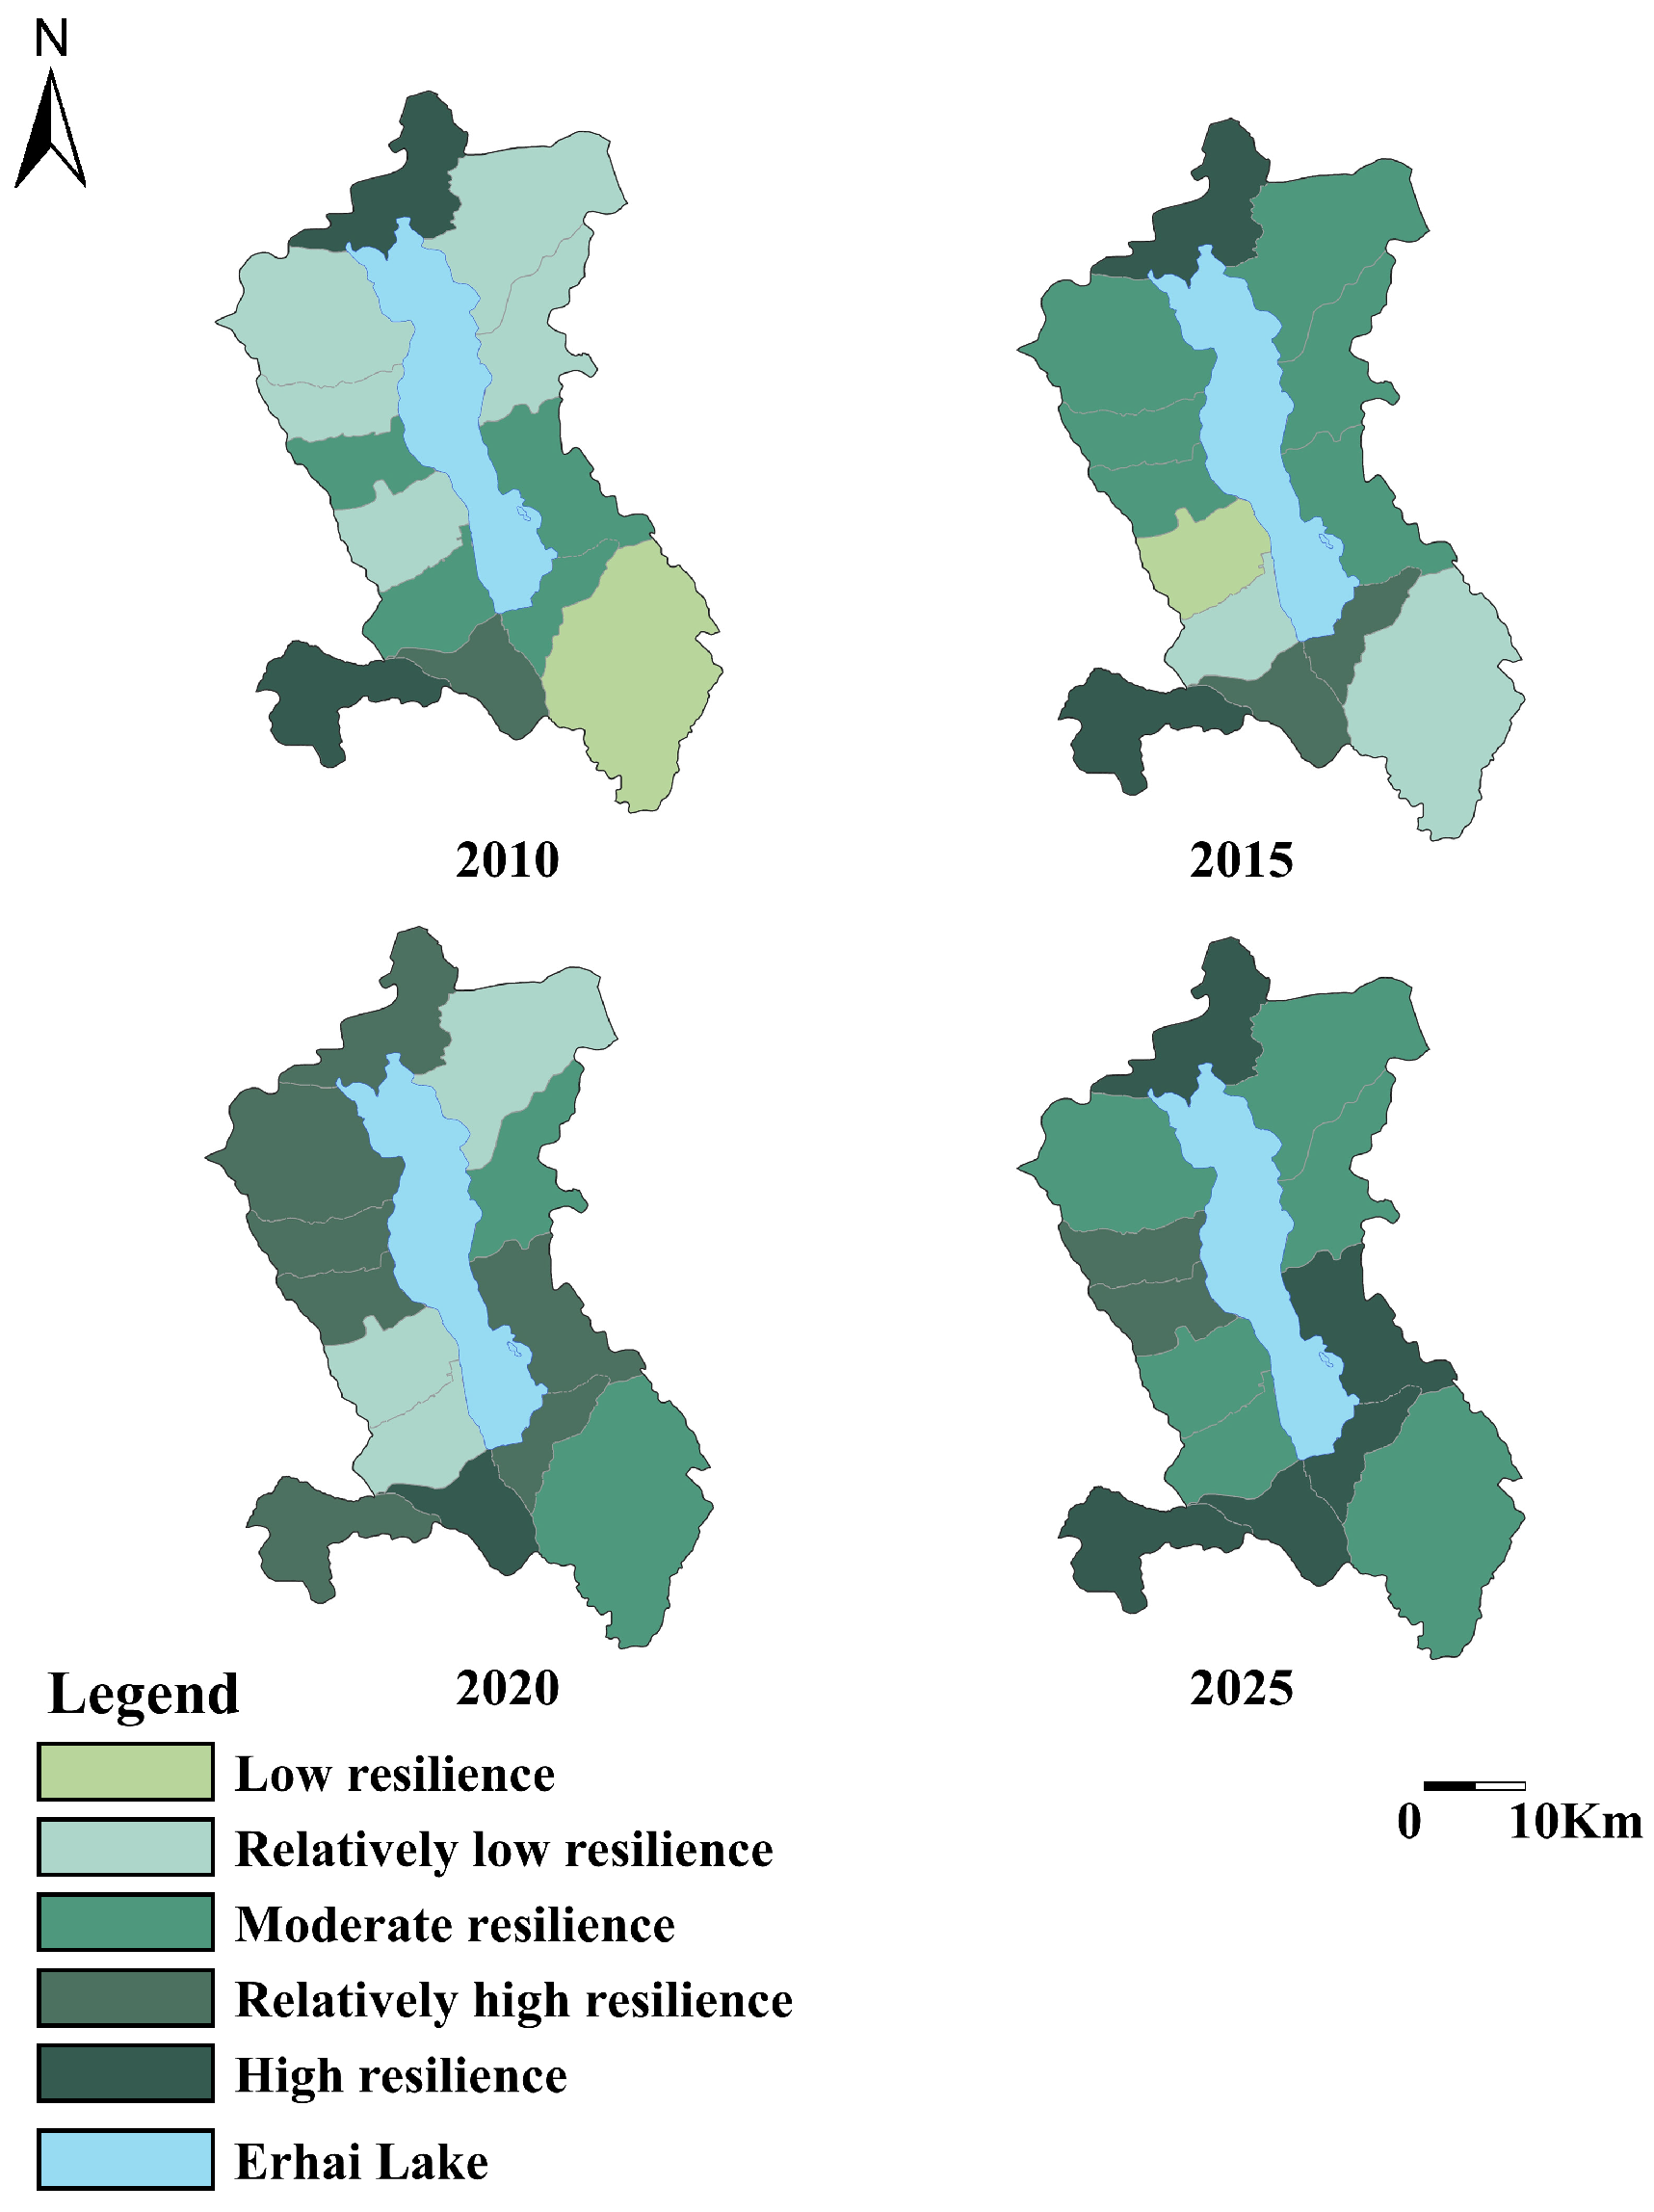
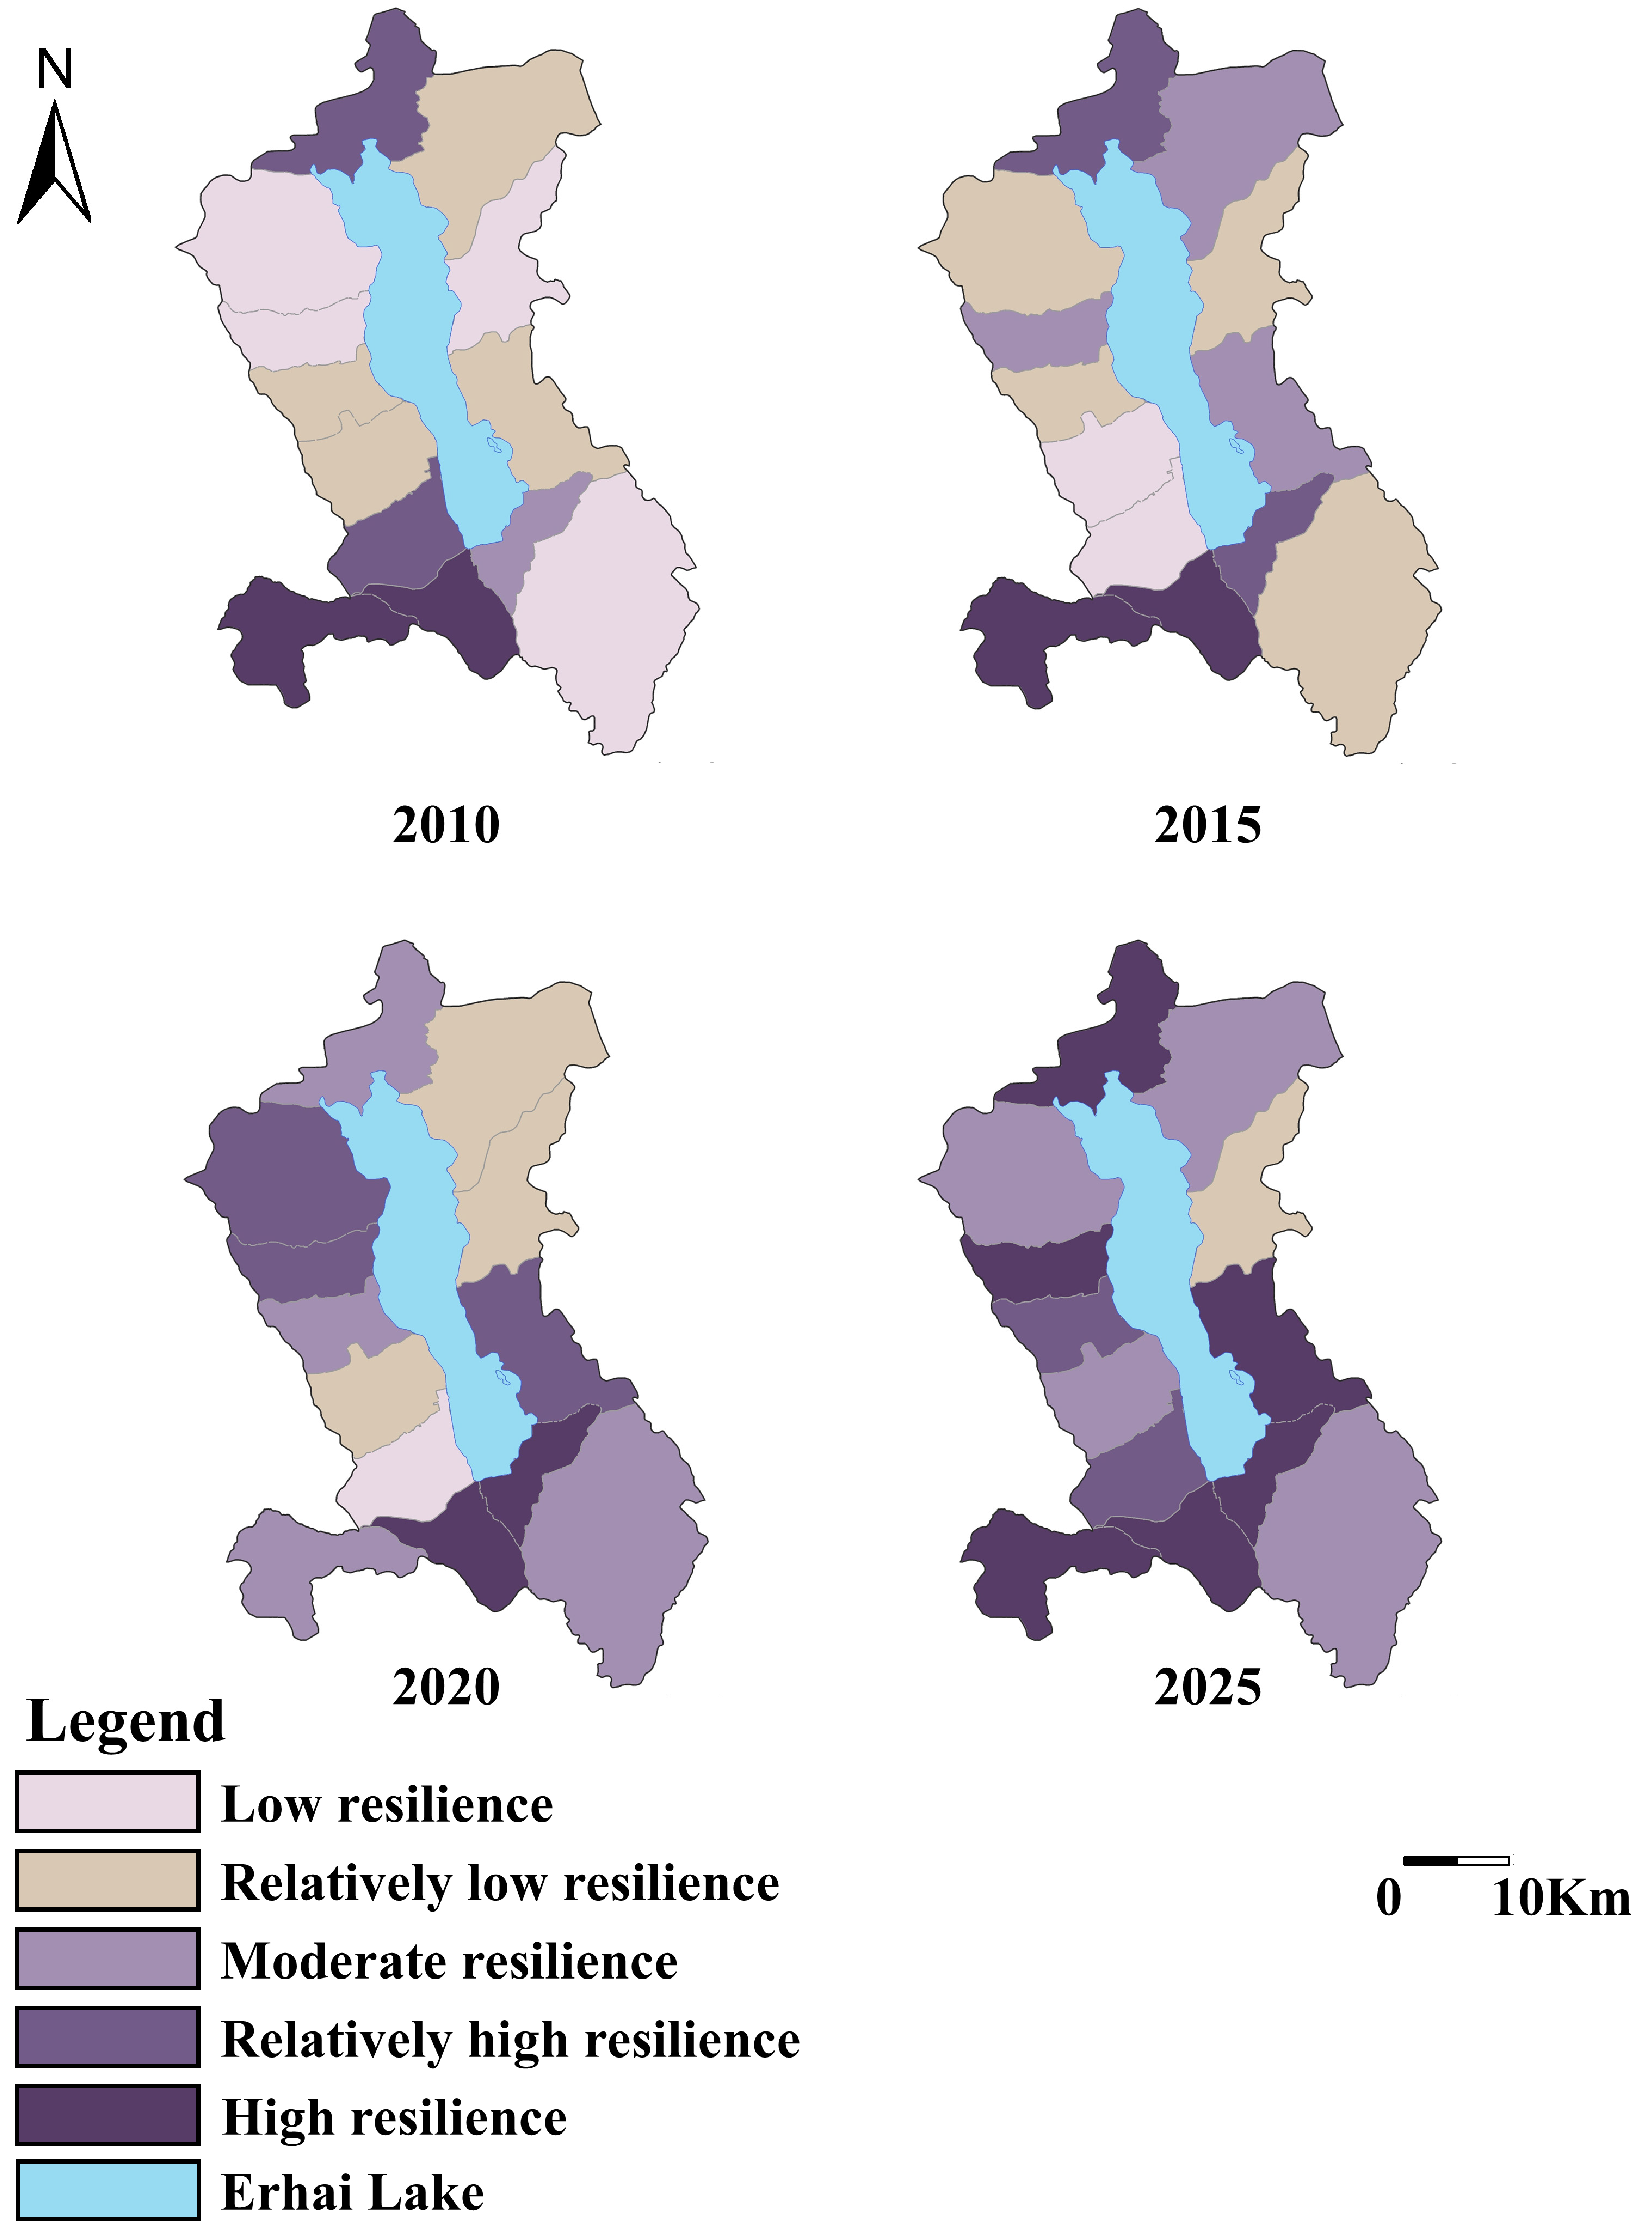
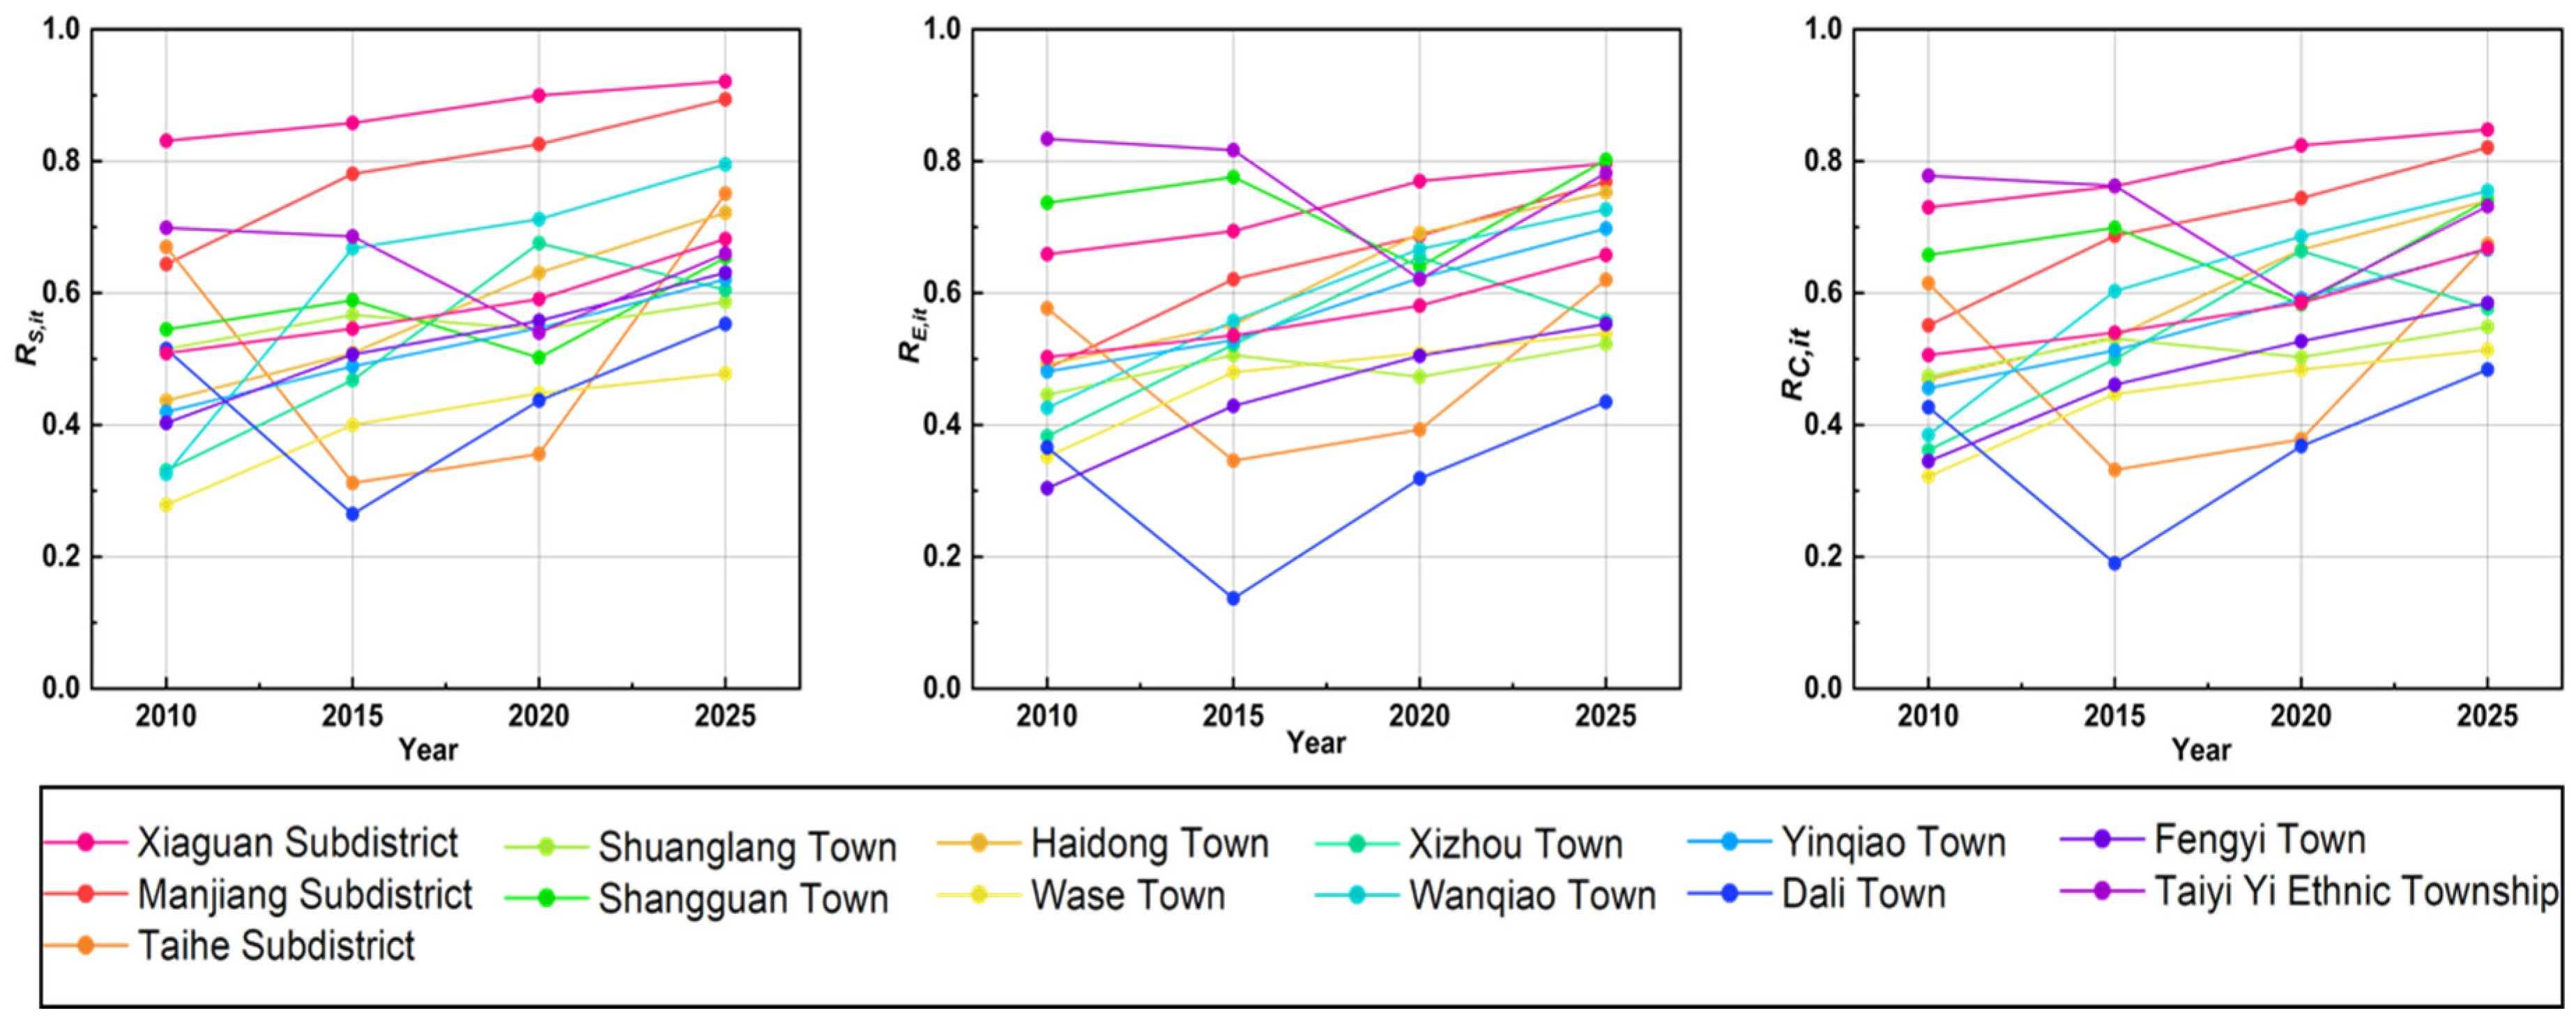
Based on the measurement results for 2010, 2015, 2020, and 2025 (Table 6 and Figure 5), the resilience of the social subsystem, ecological subsystem, and integrated social–ecological system in the Erhai Lake Basin generally increased, although the trend was accompanied by clear hierarchical differentiation and phased fluctuations. In terms of average values, social subsystem resilience rose from 0.509 to 0.682, ecological subsystem resilience from 0.503 to 0.658, and comprehensive resilience from 0.506 to 0.668. This indicates that basin-wide resilience improved during the study period, while significant township-level differences persisted in improvement rate, fluctuation intensity, and resilience sources.
In terms of social subsystem resilience, areas with stronger administrative functions, better infrastructure, and greater concentrations of public resources generally maintained higher levels. Xiaguan Subdistrict consistently ranked highest, while Manjiang Subdistrict showed strong growth potential. Wanqiao, Haidong, Fengyi, and Yinqiao also improved steadily. By contrast, Taihe Subdistrict and Dali Town experienced a fluctuating trajectory, and Wase Town and Shuanglang Town remained at relatively low levels despite moderate improvement, suggesting that social resilience is strongly shaped by locational and governance conditions.
Ecological subsystem resilience displayed a more differentiated pattern. Shangguan Town and Taiyi Yi Ethnic Township generally maintained relatively high ecological resilience, reflecting strong ecological endowments and environmental carrying capacity, although both experienced a temporary decline in 2020. Xiaguan, Manjiang, Haidong, and Wanqiao showed more obvious governance-driven improvement, indicating that ecological resilience depends not only on natural conditions but also on restoration efforts, environmental remediation, and policy intervention. In contrast, Dali Town, Taihe Subdistrict, Wase Town, and Fengyi Town remained at medium-to-low levels overall.
For comprehensive resilience, Xiaguan Subdistrict consistently remained among the highest-ranked areas, while Manjiang, Wanqiao, and Haidong recorded the most notable gains, reflecting stronger synergy among social support, ecological governance, and development transformation. By contrast, Shangguan Town and Taiyi Yi Ethnic Township did not always convert ecological advantages into comprehensive resilience advantages. Taihe Subdistrict and Dali Town showed the greatest fluctuations, whereas Wase and Shuanglang remained at relatively low levels and improved only slowly. Fengyi Town also remained at a relatively low-to-medium level, although it showed steady improvement over the study period.
To further test the temporal changes observed in Figure 5, we fitted linear mixed-effects models with year as a fixed effect and township as a random intercept. This model accounts for the repeated observations of the same townships across the four study years and provides a statistical test of whether resilience changed significantly over time. The time variable was coded as 0, 1, 2, and 3 for 2010, 2015, 2020, and 2025, respectively, so that the time coefficient represents the average change in the resilience index per five-year interval. As shown in Table 7, the time coefficients are positive and statistically significant for social resilience, ecological resilience, and comprehensive resilience. Specifically, the comprehensive resilience index increased by approximately 0.053 per five-year interval p 0.001 , indicating a significant upward trend during the study period after accounting for township-level repeated observations. The intraclass correlation coefficient (ICC) of the comprehensive resilience model is 0.625, suggesting that township-level heterogeneity remains substantial even after controlling for temporal change. These results statistically support the temporal patterns shown in Figure 5 and further confirm that basin-wide resilience improvement coexists with persistent differentiation among townships.

4.2. Spatial Distribution of Resilience Levels

4.2.1. Resilience Index of the Social Subsystem

Across 2010, 2015, 2020, and 2025, the social subsystem resilience of the 13 townships (subdistricts) in the Erhai Lake Basin exhibited clear hierarchical differentiation, together with an evolutionary pattern characterized by overall improvement and periodic fluctuations. Areas with stronger administrative functions, better infrastructure, and higher concentrations of public resources generally maintained relatively high levels of social resilience, whereas townships with weaker development foundations and limited social support capacity tended to remain in the lower-to-middle tiers (Figure 6).
Specifically, Xiaguan Subdistrict and Manjiang Subdistrict showed sustained increases and consistently strong social resilience. Wanqiao Town, Haidong Town, Fengyi Town, and Yinqiao Town also recorded notable improvements, with Wanqiao Town showing the most pronounced growth, which was closely associated with strong policy attention [2,22]. By contrast, Taihe Subdistrict, Dali Town, and Taiyi Ethnic Township displayed more evident fluctuations, typically following a pattern of decline and subsequent recovery. Wase Town, Shuanglang Town, and Shangguan Town generally remained at low-to-middle or middle levels; although some improvement was observed, the growth rate remained limited. High-value areas were mainly concentrated in townships with stronger comprehensive functions and better public resources, while areas with weaker social foundations still had considerable room for improvement.

4.2.2. Ecological Subsystem Resilience Index

Across the four study years, the ecological subsystem resilience of the 13 townships (subdistricts) in the Erhai Basin also showed clear hierarchical differentiation, although its spatial variation was more strongly shaped by differences in ecological endowment, development intensity, and governance constraints. Overall, townships with stronger ecological foundations and higher conservation intensity tended to maintain higher resilience, whereas areas under greater development pressure or with weaker ecological carrying capacity remained at medium-to-low levels over the long term (Figure 7).
Specifically, Taiyi Ethnic Township and Shangguan Town consistently remained at high levels, representing the strongest ecological resilience in the basin. Xiaguan Subdistrict, Wanqiao Town, Manjiang Subdistrict, and Haidong Town exhibited sustained upward trends during the study period. Among them, Wanqiao Town improved most rapidly, suggesting a relatively strong synergy between local governance and ecological restoration. Taihe Subdistrict and Dali Town showed more pronounced fluctuations, indicating relatively weaker ecosystem stability and stronger sensitivity to development pressure and external disturbance. Shuanglang Town, Xizhou Town, Wase Town, Fengyi Town, and Yinqiao Town improved gradually, but remained differentiated in overall resilience level.

4.2.3. Social–Ecological Comprehensive Resilience Index

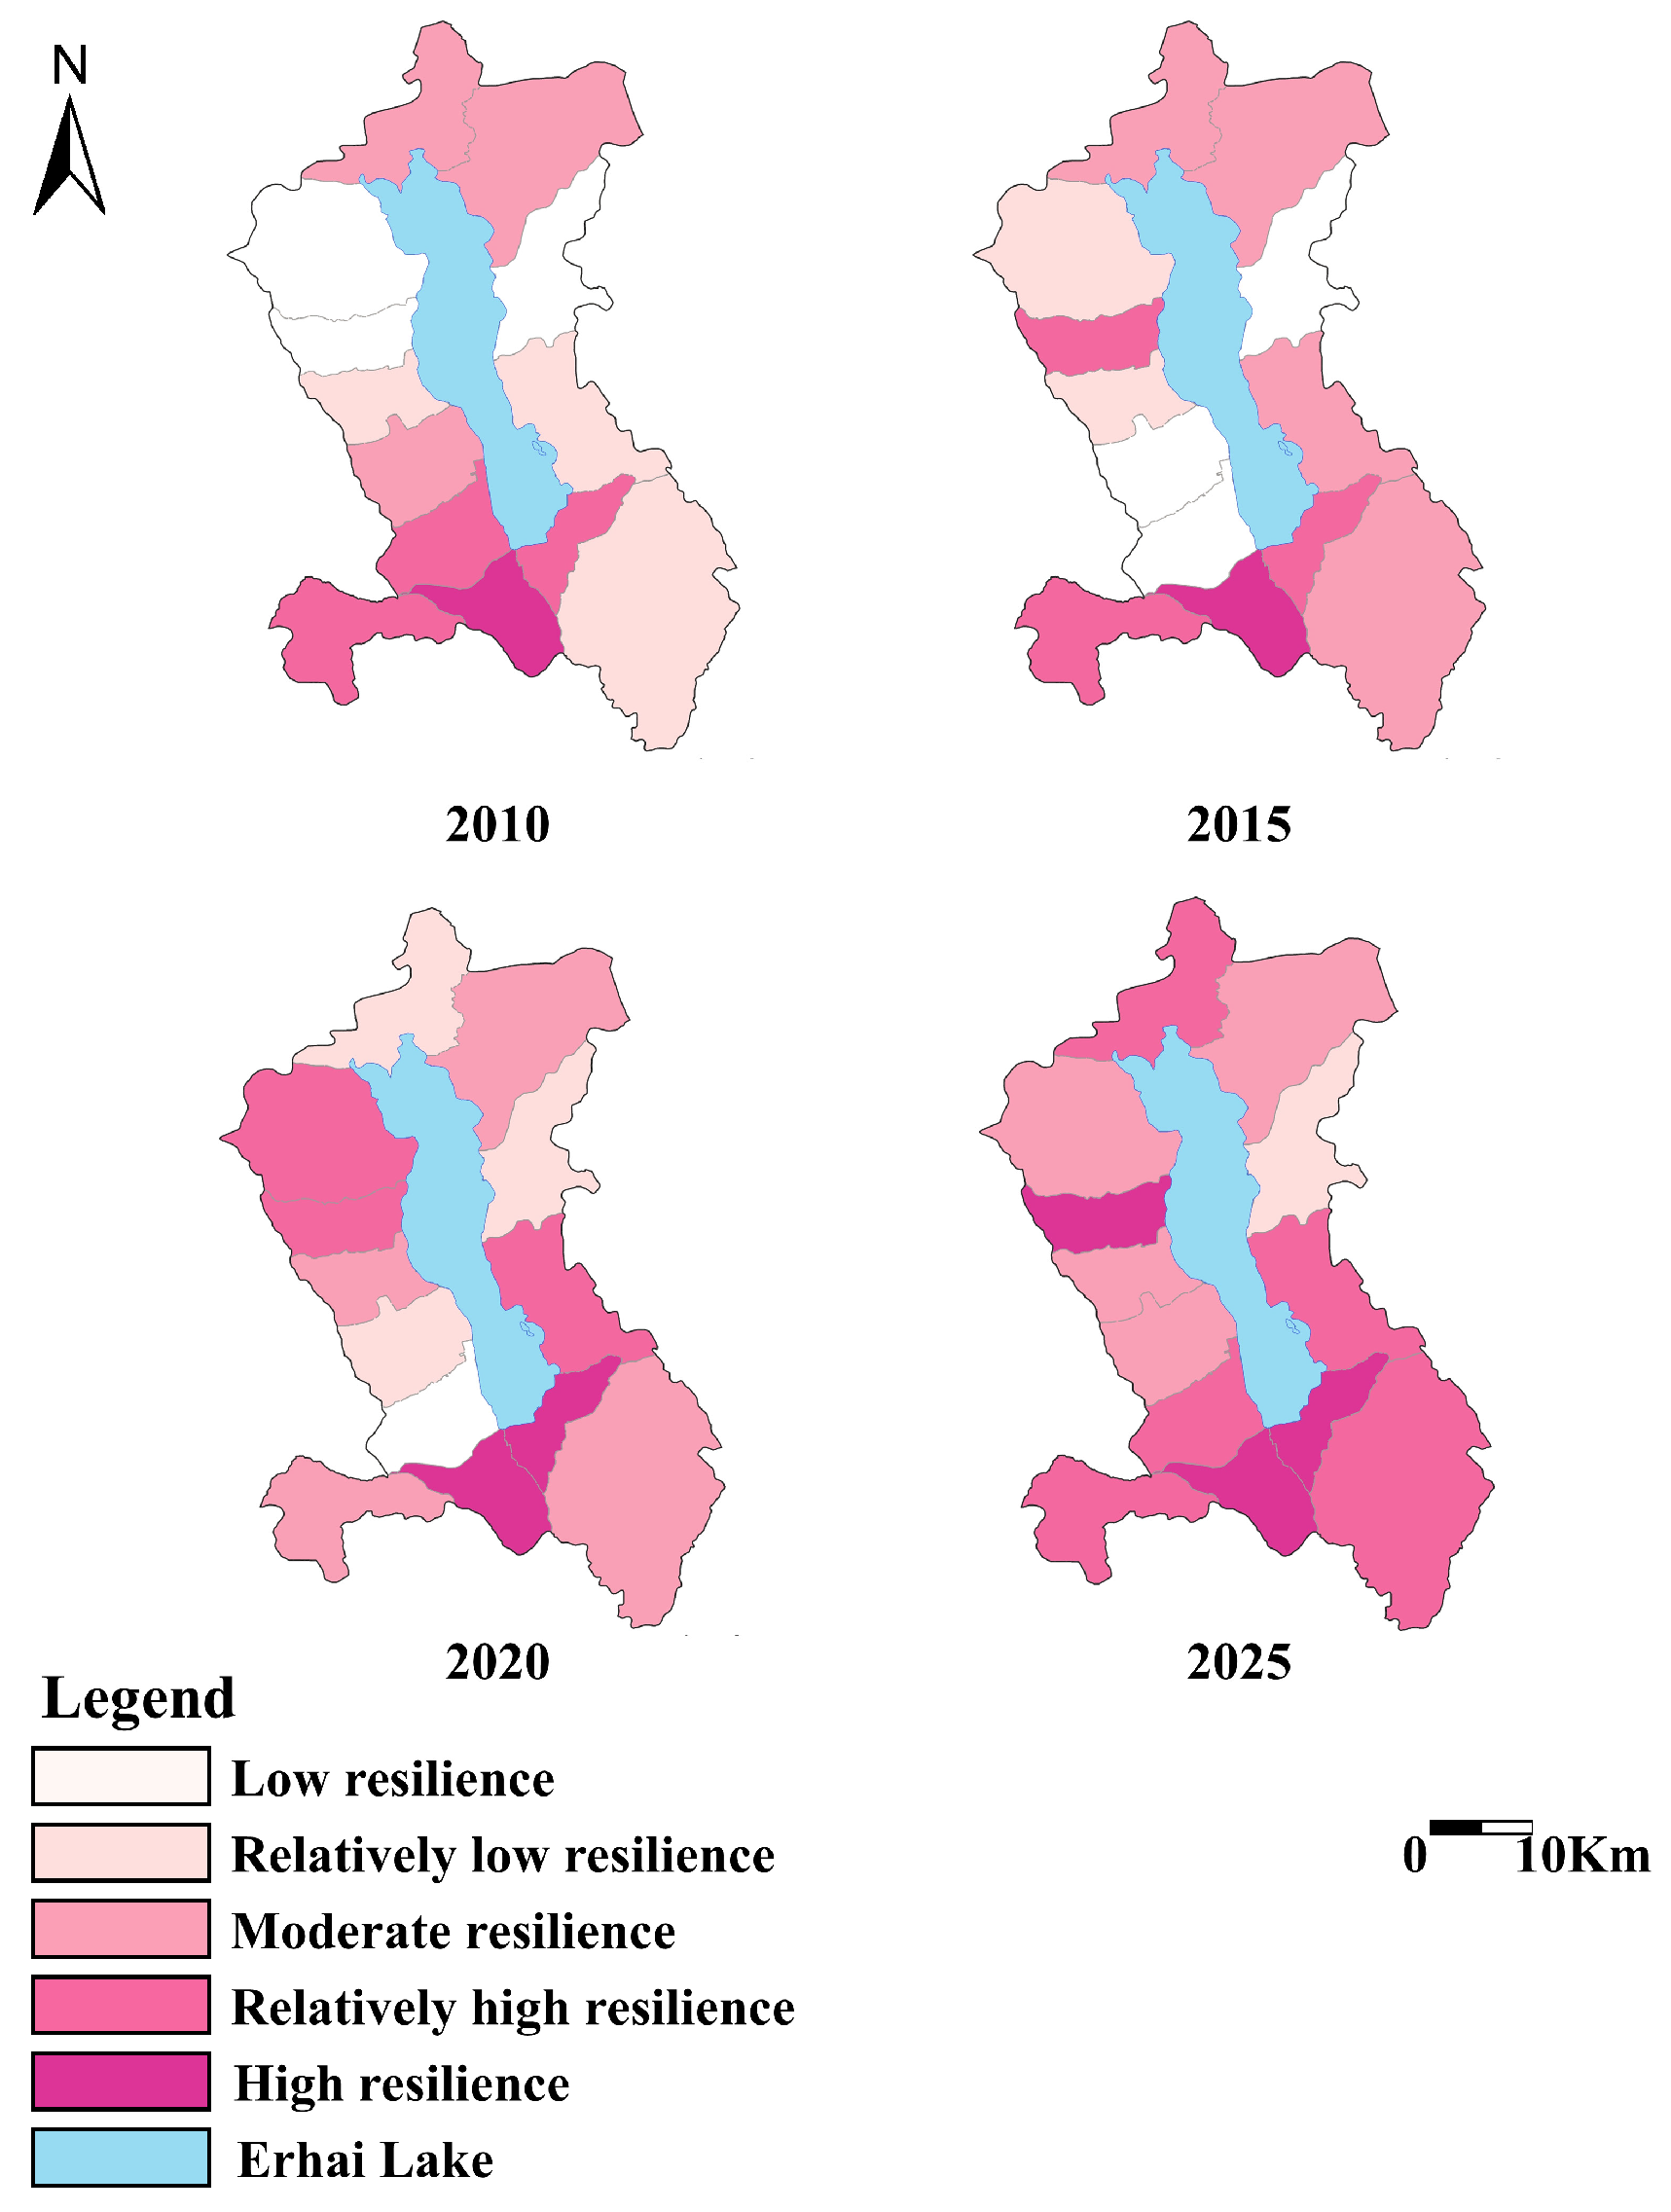
Across 2010, 2015, 2020, and 2025, the comprehensive resilience of the 13 townships (subdistricts) in the Erhai Basin showed marked spatial variation. High-value areas maintained a relatively stable lead, while some townships achieved rapid improvement under governance intervention, accompanied by varying degrees of fluctuation and adjustment (Figure 8).
Specifically, Xiaguan Subdistrict consistently maintained a high level of comprehensive resilience, while Manjiang Subdistrict showed a clear trend of continuous strengthening and strong stability. Haidong Town and Yinqiao Town also followed relatively stable growth trajectories. By contrast, Taihe Subdistrict, Dali Town, and Taiyi Ethnic Township exhibited the most significant fluctuations. Wase Town, Shuanglang Town, and Fengyi Town remained in a gradual improvement process, but their overall resilience levels were still relatively low. The spatial pattern of comprehensive resilience reflected not only differences in ecological endowment and social development conditions, but also variation in the degree of coordination between ecological governance and socio-economic transformation across townships.

4.2.4. Global Moran’s I Spatial Autocorrelation Analysis

The test results show that the Global Moran’s I values are positive across all four time points (Table 8). Specifically, the result for 2010 is significant at the one-tailed 5% level (z = 1.80, psim = 0.036), while the other three years are marginally significant at the one-tailed 10% level (0.055 < psim < 0.086). This indicates that ecological resilience in the Erhai Lake Basin exhibits a weak but positive pattern of spatial autocorrelation. In other words, townships with similar levels of ecological resilience tend to be located near one another to some extent.
First, the existence of spatial clustering is supported. The positive Moran’s I values suggest that the spatial distribution of ecological resilience is not entirely random. Instead, townships with similar resilience levels show a certain tendency toward spatial adjacency. Specifically, high-resilience townships such as Xiaguan, Manjiang, and Wanqiao form a relatively high-resilience cluster in the southwestern lakeshore area. By contrast, low-resilience townships such as Dali Town, Taihe Subdistrict, and Wase Town are relatively isolated but geographically proximate to one another. These patterns suggest that both high- and low-resilience units display weak forms of spatial clustering.
Second, the significance of spatial autocorrelation changes non-monotonically over time. Spatial autocorrelation is strongest in 2010 (I = 0.173, psim = 0.036) and weakest in 2015 (I = 0.108, psim = 0.086), followed by a slight rebound in 2020 and 2025. This temporal pattern is highly consistent with the period of intensive policy adjustment for Erhai Lake protection around 2015. The intensified policy intervention may have temporarily disrupted the existing spatial equilibrium, leading to differentiated resilience responses across townships and a short-term weakening of spatial dependence. After 2020, as relevant policies were gradually implemented and entered a more stable phase, the spatial pattern of ecological resilience became more stable, and the degree of spatial clustering increased slightly.
Third, the weak clustering pattern reflects the internal spatial structure of the basin. The Moran’s I values range from approximately 0.11 to 0.17, indicating weak rather than strong spatial clustering. This result is consistent with the spatial reality of the Erhai Lake Basin. As a small-scale and relatively enclosed plateau-lake basin in China’s borderland region, the basin contains a mixture of different township types: high-resilience units such as administrative centers and tourism-oriented townships; townships with favorable ecological conditions but relatively weaker economic foundations; and low-resilience units dominated by traditional agriculture and stronger governance pressures. These different types of townships are spatially interwoven rather than clearly separated. Therefore, the overall intensity of spatial clustering remains limited. Nevertheless, the consistently positive direction of Moran’s I suggests that geographical proximity remains an important structural factor shaping the spatial distribution of ecological resilience.

4.3. Comparison of Resilience Types

4.3.1. Dual-Vulnerability Type

The dual-vulnerability type refers to townships with both low ecological protection and low social development, and is typically characterized by weak social subsystem resilience and ecological subsystem resilience. These townships generally have limited public services, infrastructure, industrial support, and resource integration capacity, resulting in insufficient ability to respond to and recover from external shocks. At the same time, their ecosystems remain under considerable carrying-capacity pressure, and the effects of ecological restoration and environmental governance have not yet been fully translated into stronger resilience. Because neither the social nor the ecological subsystem exhibits clear advantages, the comprehensive resilience of dual-vulnerability townships remains persistently low.
From a dynamic perspective, Wase Town and Fengyi Town remained in this category throughout 2010–2025, indicating the persistence of their dual vulnerability in both ecological protection and social development. Xizhou Town briefly entered the coordinated-development type in 2020 but reverted to the dual-vulnerability type by 2025. Dali Town shifted from the economic-priority type in 2010 to the dual-vulnerability type, suggesting a weakening of its relative development advantage over time.

4.3.2. Economic-Priority Type

The economic-priority type refers to townships with relatively high social development but comparatively weak ecological protection. These townships are typically characterized by better infrastructure, stronger industrial support, greater market connectivity, and higher concentrations of public resources, which provide them with clear advantages in the social development dimension. However, their ecological subsystem resilience tends to lag behind, and insufficient ecological protection constrains the further improvement of overall resilience.
In 2025, Taihe Subdistrict was the main representative of the economic-priority type in the Erhai Lake Basin. From a dynamic perspective, Taihe was classified as coordinated development in 2010, shifted to dual vulnerability in 2015 and 2020, and returned to the economic-priority type by 2025. This suggests that its socio-economic support recovered in the later stage, whereas ecological improvement remained relatively limited. In addition, Manjiang Subdistrict, Shuanglang Town, and Dali Town also displayed economy-priority characteristics in earlier years, but later shifted to either the coordinated-development or dual-vulnerability type. This indicates that an economy-priority trajectory may provide short-term support, but is difficult to sustain without parallel ecological improvement.

4.3.3. Ecological-Priority Type

The ecological-priority type refers to townships with relatively high ecological protection but comparatively low social development. These areas are characterized by strong ecological subsystem resilience, but relatively weak social support and limited capacity to transform ecological advantages into broader development outcomes. They usually benefit from favorable ecological conditions, stronger environmental carrying capacity, or stricter conservation constraints, and therefore perform well in ecological protection, pollution control, and environmental governance. However, their industrial bases are often fragile, market connectivity remains limited, and public service and resource integration capacity still need to be strengthened.
By 2025, Shangguan Town, Yinqiao Town, and Taiyi Yi Ethnic Township were classified as ecological-priority townships. From a dynamic perspective, Shangguan Town and Taiyi Yi Ethnic Township belonged to the coordinated-development type in 2010 and 2015, but shifted to the ecological-priority type in 2020 and 2025. Yinqiao Town gradually moved out of early dual vulnerability and eventually entered the ecological-priority category, while Haidong Town also briefly displayed ecological-priority characteristics in 2015.

4.3.4. Coordinated-Development Type

The coordinated-development type represents the strongest synergy between ecological protection and social development among the four categories. These townships possess not only relatively strong public service capacity, industrial support, and resource integration ability, but also higher ecological carrying capacity and stronger environmental governance performance. As a result, the social and ecological subsystems maintain a relatively stable and mutually reinforcing relationship, and comprehensive social–ecological resilience remains comparatively high.
In 2025, Xiaguan Subdistrict, Manjiang Subdistrict, Haidong Town, and Wanqiao Town were classified as coordinated-development townships. From a dynamic perspective, Xiaguan Subdistrict consistently remained in this category throughout 2010–2025. Manjiang Subdistrict shifted from the economic-priority type in 2010 to the coordinated-development type and subsequently maintained this position. Haidong Town followed an upgrading trajectory from dual vulnerability and ecological priority to coordinated development, while Wanqiao Town moved from dual vulnerability in 2010 to coordinated development and remained relatively stable thereafter.

5. Discussion

5.1. Spatiotemporal Evolutionary Characteristics

The results show that from 2010 to 2025, the resilience of the social subsystem, ecological subsystem, and integrated social–ecological system in the Erhai Lake Basin generally increased at the township scale [55]. This suggests that ecological restoration, environmental remediation, improvements in public services, and regional development transformation jointly contributed to the enhancement of basin resilience during the study period. However, the magnitude and trajectory of this improvement varied considerably across townships, reflecting differences in social support conditions, ecological endowments, governance input, and development capacity.
From a temporal perspective, social subsystem resilience improved relatively rapidly, indicating that infrastructure upgrading, the concentration of public resources, and strengthened governance capacity had a strong positive effect on social resilience. At the same time, its evolution still displayed noticeable fluctuations, suggesting that social support capacity has a phased-in nature and remains sensitive to changes in the external environment and development transition. Ecological subsystem resilience also showed a sustained upward trend, reflecting the positive effects of ecological restoration, environmental governance, and stronger policy constraints on ecological carrying capacity and recovery. Comprehensive resilience, in turn, resulted from the combined effects of the social and ecological subsystems. Its continued improvement depended not on the unilateral strengthening of one subsystem, but on the coordinated interaction among social support, ecological foundations, and development transformation capacity.
From a spatial perspective, the resilience pattern of the Erhai Lake Basin exhibited clear hierarchical differentiation and typological variation, echoing recent evidence that social–ecological resilience often shows significant spatial differentiation and can be further interpreted through management zoning or typological classification [56]. Areas with high social resilience were mainly concentrated in townships with stronger administrative functions, better public resources, and more developed infrastructure, and showed a tendency to expand outward from the core area. Areas with high ecological resilience were more concentrated in townships with stronger ecological endowments and higher conservation intensity, although some governance-intensive areas also showed marked improvement. The spatial pattern of comprehensive resilience reflected the combined effects of social support and ecological conditions, and was generally characterized by relatively stable high-value areas, dynamic restructuring in intermediate areas, and gradual improvement in low-value areas.
Overall, the spatiotemporal evolution of resilience in the Erhai Lake Basin reflects the joint effects of pressure, state, and response within the socio-ecological subsystems. Crucially, resilience disparities across the basin stem not only from absolute resilience levels but also from varying combinations of social support capacity, ecological conditions, and governance responses. Consequently, this discussion extends beyond general trend interpretation to examine how different township types can implement differentiated adaptive governance pathways.

5.2. Differentiated Adaptive Governance Strategies

To make the typology more operational, the following governance strategies are further specified by embedding the four township types into the existing institutional architecture of Erhai Lake governance. Over recent years, basin governance in the Erhai Lake area has gradually developed a multi-level institutional framework that combines spatial zoning control, ecological red-line and buffer-zone management, target-responsibility assessment, river/lake chief and forest chief systems, cross-departmental coordination, pollution-source regulation, sewage treatment, agricultural non-point source control, tourism regulation, water-resource management, and ecological monitoring and early-warning mechanisms. On this basis, the four resilience types identified in this study are not treated as static categories, but are further linked to differentiated transition pathways, policy instruments, monitoring cycles, and adjustment triggers.

5.2.1. Dual-Vulnerability Townships: Strengthening Basic Capacity to Reduce System Vulnerability

For dual-vulnerability townships, the priority is to strengthen foundational capacity and reduce structural vulnerability, thereby creating the conditions for subsequent coordination between ecological conservation and development. These townships generally lack adequate public services, infrastructure support, resource integration capacity, and stable ecological restoration capacity. Policy interventions should therefore focus first on improving basic public services, including rural roads, sewage and waste treatment, village environmental improvement, public health care, digital access, and educational support, so as to enhance livelihood security and the functioning of grassroots governance. At the same time, governance should strengthen agricultural non-point source pollution control, small-watershed ecological restoration, riparian remediation, fragile patch management, and village landscape improvement in order to prevent continued ecological degradation from further constraining local development. In addition, targeted fiscal transfers, ecological compensation, paired assistance mechanisms, and cross-regional public service sharing should be introduced to raise the minimum resilience threshold of these areas.
Operationally, dual-vulnerability townships must adopt a phased transition pathway: initial capacity-building, subsequent ecological stabilization, and eventual coordinated upgrading. Rather than pursuing rapid industrial expansion, the immediate objective is to establish a minimum resilience threshold. Aligned with the institutional framework of Erhai Lake governance, interventions should prioritize rural sewage treatment, village waste collection, rainwater–sewage separation, agricultural waste recycling, fertilizer and pesticide reduction, and small-watershed restoration [57]. Specifically, township governments should identify weak infrastructure nodes; housing and urban-rural development departments must manage sewage and waste facilities; ecological-environment departments should oversee water-quality monitoring and pollution-source supervision; and agricultural departments are tasked with fertilizer control and agricultural waste recycling. The primary transition target for these townships is to shift from “dual vulnerability” to either “ecological priority” or “coordinated development,” depending on whether ecological recovery or social-service enhancement progresses more rapidly. To monitor this trajectory, a quarterly resilience review should be implemented to assess sewage-facility operations, waste-collection coverage, agricultural non-point source pressure, and basic public-service provision. This package should encompass targeted fiscal transfers, ecological compensation, cross-township public-service co-supply, and project-based infrastructure support. Social capital, collective action, and institutional support are fundamental to fostering adaptive capacity in vulnerable socio-ecological systems.

5.2.2. Economic-Priority Townships: Promoting Green Transformation and Ecological Rebalancing

Economic-priority townships are characterized by relatively strong social support and development capacity, but comparatively weak ecological protection. Their advantages in infrastructure, market connectivity, public resource concentration, and industrial vitality often come with sustained ecological pressure. In such areas, the policy focus should be on promoting green transformation while strengthening ecological constraints. Specifically, governance should reinforce controls over construction intensity and development scale, improve mechanisms for shoreline regulation, project approval, environmental capacity management, and ecological red-line implementation, and prevent development advantages from continuing to rely on the occupation of ecological space. At the same time, these townships should be encouraged to shift from extensive and expansion-oriented growth toward quality- and efficiency-oriented development, with greater emphasis on low-impact, high-value-added green industries, eco-tourism, and modern service sectors. Continued investment in ecological restoration, pollution control facilities, and green infrastructure is also essential.
For economic-priority townships, the transition pathway must center on “ecological rebalancing under strict development constraints.” Operationally, this mandates highly stringent oversight across project approvals, land-use planning, shoreline management, wastewater discharge, and tourism-environment supervision. For the construction, hospitality, industrial, and tourism sectors, the core governance imperative is to ensure that all development projects strictly comply with territorial spatial planning, ecological red-line and yellow-line controls, sewage discharge permits, rainwater–sewage separation, and environmental carrying capacity constraints. The ultimate transition target is to shift these townships from an “economic priority” to a “coordinated development” status. To achieve this, a monthly ecological-pressure monitoring mechanism should be deployed across major inflow rivers, drainage outlets, tourism-intensive zones, and construction expansion areas, complemented by quarterly compliance audits for local enterprises and facilities. This rigorous strategy is consistent with the principles of adaptive water management, which emphasize a shift from prediction-and-control approaches toward iterative adjustment, continuous monitoring, and institutional learning under changing environmental and socio-economic conditions [58].

5.2.3. Ecological-Priority Townships: Converting Ecological Advantages into Social Development Capacity

For ecological-priority townships, the core governance task is to transform ecological advantages into sustainable social development capacity. These townships usually possess favorable ecological conditions, relatively high environmental carrying capacity, or strong conservation constraints, but often face weaknesses in social support, benefit-sharing mechanisms, and industrial transformation capacity. Policy design should therefore focus on ecological value realization. On the one hand, ecological resources should be better translated into ecological agriculture, eco-tourism, eco-branding, and green products, so as to strengthen the linkage between local industries and ecological conservation. On the other hand, greater efforts are needed to improve transportation accessibility, digital infrastructure, public services, market-linkage platforms, and grassroots cooperative organizations, thereby enhancing the social system’s ability to convert ecological advantages into more stable income, collective economic growth, and local public service provision. In addition, for townships bearing higher conservation costs, support through horizontal ecological compensation, public welfare employment, green finance, and special transfer payments should be strengthened in order to reduce the opportunity costs of strict conservation and translate non-market ecological values into tangible incentives for local actors [59].
For ecological-priority townships, the transition pathway must center on “ecological value realization without overuse.” Rather than relaxing conservation requirements due to their superior ecological baselines, these areas must capitalize on their ecological advantages to secure stable livelihoods and enhance public services under strict environmental constraints. Operationally, this necessitates deploying ecological compensation, public welfare employment, eco-agriculture, low-impact ecotourism, and digital market-linkage platforms. Specifically, industrial development near core protection or buffer zones must strictly align with conservation goals, while designated green development zones should act as the primary spatial carriers for moderate ecotourism and the realization of ecological product value. The ultimate transition target is to advance from an “ecological priority” to a “coordinated development” status by bolstering social resilience, strictly prohibiting the conversion of ecological space into extensive construction or mass tourism. To monitor this progress, an annual ecological-product value assessment must be implemented to track the translation of ecological resources into local income, collective economic growth, and public-service enhancements. Crucially, if commercialization exacerbates pressure on sewage, waste, shorelines, or traffic, development intensity must be immediately curtailed. This framework effectively translates non-market ecological values into tangible incentives for conservation-compatible livelihoods.

5.2.4. Coordinated-Development Townships: Strengthening Regional Spillover and Demonstration Effects

Coordinated-development townships represent the strongest synergy between ecological protection and social development. Their policy priority should not only be to consolidate their own advantages, but also to enhance their role in resource aggregation and regional spillover. As the most resilient areas in the basin, such townships can function as key nodes for improving resilience across the wider basin. Policy support should therefore help them further improve green industrial chains, ecological product value-realization mechanisms, high-quality public service systems, and governance innovation platforms, thereby consolidating their leading position in the coordination between ecological protection and high-quality development. More importantly, these townships should be encouraged to move from isolated excellence to networked leadership by establishing closer institutional linkages with neighboring townships in joint pollution control, cross-regional ecological restoration, tourism coordination, industrial collaboration, talent cultivation, and public service sharing. Through such mechanisms, their governance experience, market influence, and resource allocation capacity can be diffused more broadly across the basin.
For coordinated-development townships, the governance priority should be “risk prevention, institutional demonstration, and cross-township spillover.” These townships should not only maintain their own social–ecological balance, but also serve as demonstration nodes for basin-wide resilience improvement. Their role can be institutionalized through cross-township agreements on joint pollution control, tourism diversion, ecological restoration, public-service sharing, and green industrial collaboration. In particular, coordinated-development townships can provide technical support, market access, tourism-management experience, and public-service resources to neighboring dual-vulnerability or ecological-priority townships. The transition target is to prevent regression from “coordinated development” to “economic priority” or “ecological priority.” A semi-annual risk review should be introduced to assess whether economic growth, tourism expansion, infrastructure construction, or industrial upgrading is generating new ecological pressure. The townships should activate a preventive adjustment mechanism, including tourism-capacity control, stricter sewage-discharge supervision, ecological-restoration investment, and cross-departmental enforcement. At the same time, these townships should be incorporated into a basin-level adaptive co-management network, in which government departments, township authorities, enterprises, village organizations, and community actors jointly participate in monitoring, learning, and policy adjustment. This arrangement is consistent with adaptive governance and adaptive co-management approaches, which emphasize cross-scale institutional linkages, collaborative learning, flexible adjustment, and multi-actor participation in the governance of social–ecological systems [60].

5.2.5. The Basin as a Whole: Building Collaborative Governance and Dynamic Assessment Mechanisms

The Erhai Lake watershed is a highly coupled social–ecological system. In addition to implementing differentiated governance approaches for different types of townships, a systematic governance framework covering the entire watershed should be established. First, taking the watershed as the basic governance unit, we must move beyond traditional governance models fragmented by administrative boundaries and strengthen cross-township coordination in pollution control, ecological restoration, shoreline management, industrial layout, and public service allocation. Second, building on existing spatial linkages within the basin, a cross-township collaborative governance platform should be established to create more stable institutional arrangements regarding ecological compensation, profit sharing, tourism diversion, industrial cooperation, transportation connectivity, and the sharing of public services, thereby fostering complementary and mutually supportive relationships among townships of different types. Third, a dynamic monitoring and classification assessment mechanism should be established to regularly track changes in the social system resilience, ecosystem resilience, and comprehensive resilience of each township. This will enable the timely identification of trends in typological shifts and risk accumulation, allowing governance policies to undergo dynamic, adaptive adjustments based on actual changes. Finally, by integrating classified governance, spatial coordination, and institutional feedback, a closed-loop governance mechanism of “classified policy implementation, regional coordination, dynamic correction” should be formed to achieve the unification of ecological protection and social sustainable development.
At the basin scale, differentiated governance should be embedded in a closed-loop adaptive management mechanism. First, a township-level resilience dashboard should be established by integrating water-quality monitoring, agricultural non-point source indicators, sewage-treatment operation, waste-treatment coverage, land-use and construction approval, tourism pressure, ecological-restoration progress, public-service provision, and fiscal-support information. Second, monitoring should be organized at different frequencies according to indicator type: water quality, inflow river conditions, drainage outlets, and major pollution sources should be monitored monthly; sewage-treatment facilities, waste collection, tourism-environment compliance, and agricultural non-point source control should be reviewed quarterly; and township resilience classification should be updated annually. Third, once a trigger is reached, the township should enter a targeted policy-adjustment process. Dual-vulnerability townships should receive basic-capacity support and special ecological-restoration projects; economic-priority townships should face stricter development control and mandatory ecological rebalancing; ecological-priority townships should receive stronger ecological compensation and social-service investment; and coordinated-development townships should activate preventive risk-control measures and provide spillover support to neighboring areas. This trigger-based adjustment mechanism is consistent with the logic of dynamic adaptive policy pathways, which emphasize sequencing policy actions and adjusting governance pathways in response to changing conditions and adaptation signals [61]. This adaptive policy pathway clarifies how different township types can move toward coordinated development rather than remaining static categories. It also transforms the typology from a descriptive classification into a practical governance tool for enhancing resilience, adaptability, and transformability in social–ecological systems [62].

5.3. Alignment with the Sustainable Development Goals

The relevance of this study to the Sustainable Development Goals (SDGs) lies not only in the correspondence between individual indicators and specific SDGs, but also in its ability to reveal how different SDG objectives interact within a small, ecologically fragile basin. The SDGs are increasingly understood as an interconnected system of goals and targets rather than a set of isolated objectives, and their implementation requires attention to synergies, trade-offs, and policy coherence across goals [63,64,65]. Recent social–ecological resilience research further suggests that SDG implementation should pay greater attention to cross-scale interactions, feedbacks, adaptive capacity, and governance processes [66]. From this perspective, the SES-PSR framework used in this study provides an analytical bridge between township-scale resilience assessment and localized SDG implementation. The pressure dimension helps identify development activities and ecological stresses that may generate inter-goal conflicts; the state dimension reflects the social and ecological outcomes of these interactions; and the response dimension captures the governance capacity through which trade-offs may be mitigated and synergies enhanced.
At the indicator level, the social subsystem is mainly associated with SDG 1, SDG 3, SDG 4, SDG 8, SDG 9, SDG 11, and SDG 16, as it includes indicators related to livelihood security, education, health care, employment, transport accessibility, information access, public participation, and governance capacity. The ecological subsystem is mainly related to SDG 2, SDG 6, SDG 12, SDG 13, and SDG 15, because it captures agricultural input intensity, wastewater and waste treatment, ecological conservation, land-resource allocation, ecological compensation, and environmental regulation. Indicators related to cooperative organizations, public investment, fiscal support, and policy response are also linked to SDG 17, which emphasizes implementation capacity and institutional coordination. This indicator structure reflects the broader argument that sustainable development requires integrated social, economic, and ecological foundations rather than fragmented sectoral interventions [67].
The township typology further shows that SDG implementation in the Erhai Lake Basin is shaped by the interaction between ecological protection and social development. In dual-vulnerability townships, weak social and ecological resilience indicates overlapping deficits in livelihood capacity, public services, infrastructure, environmental quality, and governance response. These areas face simultaneous challenges related to SDG 1, SDG 3, SDG 4, SDG 6, SDG 11, and SDG 15. For such townships, the priority is not single-goal optimization, but the establishment of a minimum resilience threshold through basic public-service improvement, pollution-control infrastructure, ecological restoration, and targeted fiscal and institutional support. By contrast, economic-priority townships illustrate a typical trade-off between development-oriented goals and ecological goals. Stronger social and economic development capacity may advance SDG 8 and SDG 11, but construction expansion, tourism growth, wastewater discharge, and agricultural input intensity may increase pressure on SDG 6, SDG 12, and SDG 15. This finding is consistent with the SDG interlinkage literature, which emphasizes that progress toward one goal may either reinforce or constrain progress toward others depending on local social–ecological conditions [65].
Ecological-priority townships represent another form of SDG tension. Although these areas are more closely aligned with SDG 6, SDG 13, and SDG 15, ecological advantages are not automatically converted into social development capacity. Limited infrastructure, weak market linkages, insufficient public services, or restricted development opportunities may constrain progress toward SDG 1, SDG 8, SDG 9, and SDG 11. Ecosystem-service research has similarly emphasized that ecological benefits and human well-being are co-produced through social–ecological systems, and that the distribution of ecosystem-service benefits is central to sustainability governance [68]. Therefore, the key SDG pathway for ecological-priority townships is ecological value realization, including ecological compensation, eco-agriculture, low-impact eco-tourism, green branding, cooperative organizations, and public-service investment. Coordinated-development townships, by contrast, demonstrate the possibility of generating synergies among multiple SDGs, especially SDG 6, SDG 8, SDG 11, SDG 15, SDG 16, and SDG 17. However, they should not be regarded as risk-free. If tourism expansion, construction intensity, or resource consumption continues to grow without effective regulation, these townships may regress toward an economic-priority pattern. Their role should therefore be defined as both demonstration and risk prevention.
The SDG implications of this study lie in showing that township-scale resilience assessment can serve as a practical tool for identifying where SDG synergies are emerging, where trade-offs are accumulating, and where governance intervention should be prioritized. In the Erhai Lake Basin, the central challenge is how different township types can be guided toward coordinated social–ecological resilience. Therefore, the typological framework contributes to localized SDG implementation by translating broad sustainability goals into differentiated governance pathways for ecologically fragile basin areas.

5.4. Limitations

Although this study provides a township-scale assessment of social–ecological system resilience in the Erhai Lake Basin, two limitations should be acknowledged.
(1)
The availability and comparability of township-level data remain constrained. The study cross-validated data using government statistical records, departmental materials, enterprise-provided information, and fieldwork evidence; nevertheless, rural statistical data in China are often affected by differences in reporting continuity, completeness, and administrative consistency across years. Although interpolated values account for less than 5% of the total dataset and were checked against multiple independent sources before inclusion, the possibility of minor uncertainty in cross-year comparison cannot be fully eliminated.
(2)
The indicator system remains subject to the constraints of indicator selection and variable operationalization. Some factors were not included because they could not be measured consistently and reliably at the township-year scale. For example, the impact of COVID-19 represents an important external shock, yet its township-level effects on social-ecocial resilience are difficult to separate from other concurrent policy, economic, and governance changes using the available four-period dataset.

5.5. Future Directions

(1)
Future research could improve the temporal resolution of township-scale resilience assessment by using denser annual or multi-year panel data. This would help capture short-term fluctuations, nonlinear changes, and delayed effects of policy interventions, ecological restoration, and socio-economic transitions, thereby revealing the dynamic processes through which resilience is formed, weakened, restored, or transformed over time.
(2)
Future research could combine quantitative assessment with household–level or village–level surveys, interviews, and qualitative comparative evidence. Such mixed-method approaches would help identify institutional, behavioral, and community-level mechanisms that are difficult to capture through township-level indicators alone.
(3)
Greater attention should be paid to external shocks, such as public health emergencies, extreme climate events, tourism-market fluctuations, and policy adjustments, to better explain how small basin social–ecological systems respond to disturbance and recover through adaptive governance.

6. Conclusions

(1)
Overall Improvement in Social–Ecological Resilience
The resilience of the Erhai Lake Basin generally improved during the study period. From 2010 to 2025, the average social subsystem resilience increased from 0.509 to 0.682, the average ecological subsystem resilience increased from 0.503 to 0.658, and the average comprehensive resilience increased from 0.506 to 0.668. This indicates that the basin has made progress in social support capacity, ecological restoration, environmental governance, and adaptive adjustment. However, the improvement was not linear across all townships. Some areas experienced clear growth, while others showed fluctuations or slow improvement, suggesting that resilience enhancement remains uneven within the basin.
(2)
Persistent Spatial Heterogeneity and Weak Spatial Clustering
The spatial distribution of resilience showed clear township-level heterogeneity. Areas with stronger administrative functions, better infrastructure, stronger public-resource concentration, or more active governance intervention generally maintained higher resilience levels. By contrast, some townships with weaker development foundations, heavier ecological pressure, or limited governance capacity remained at relatively low or medium-low levels. The Global Moran’s I results further show that resilience exhibited weak but positive spatial autocorrelation across the four time points. This suggests that townships with similar resilience levels tended to be geographically proximate to some extent, but the overall clustering effect was not strong. Therefore, the Erhai Lake Basin does not present a simple high–low spatial division; rather, it shows an interwoven pattern of administrative centers, ecological conservation areas, tourism-oriented towns, and agriculture-dominated townships.
(3)
Comprehensive Resilience Depends on Social–Ecological Coordination
The results demonstrate that comprehensive social–ecological resilience cannot be explained by either ecological endowment or social development alone. Some townships with strong ecological foundations did not necessarily achieve high comprehensive resilience because their social development capacity, public services, or ecological value conversion remained relatively limited. Conversely, some townships with stronger social and economic foundations were constrained by ecological pressure or insufficient ecological improvement. The higher and more rapidly improving comprehensive resilience was observed in areas where social support, ecological governance, infrastructure conditions, and development transformation were better coordinated. This finding confirms the necessity of analyzing basin resilience through an integrated SES perspective rather than through a single ecological or socio-economic dimension.
(4)
Four Resilience Types Require Differentiated Governance Pathways
Based on the two-dimensional matrix of ecological protection and social development, the townships in the Erhai Lake Basin can be classified into four resilience types: dual-vulnerability, economic-priority, ecological-priority, and coordinated-development types. These types reveal different combinations of ecological protection capacity and social development foundation, and therefore require differentiated governance strategies. Dual-vulnerability townships should prioritize basic capacity building, ecological restoration, and public-service improvement. Economic-priority townships need stronger ecological regulation and development-control mechanisms to reduce ecological pressure. Ecological-priority townships should strengthen ecological compensation, public services, and ecological value realization to transform ecological advantages into comprehensive resilience. Coordinated-development townships should focus on preventive risk control, institutional innovation, and spillover support for surrounding areas. Overall, adaptive and differentiated governance is essential for improving the long-term resilience of small plateau lake basins under strong ecological constraints.


Supplementary Materials

The following supporting information can be downloaded at: https://www.mdpi.com/article/10.3390/su18104840/s1, Table S1: Evaluation Indicator System for Social-Ecological System Resilience in the Erhai Lake Basin.

Author Contributions

Conceptualization, L.L. and Y.W.; methodology, L.L. and H.L.; software, H.L. and Y.W.; validation, L.L. and Y.W.; formal analysis, L.L.; investigation, L.L. and Y.W.; resources, Y.W. and H.L.; data curation, L.L. and Y.W.; writing—original draft preparation, L.L.; writing—review and editing, L.L. and Y.W.; visualization, L.L. and Y.W.; project administration, L.L. and H.L.; funding acquisition, L.L. All authors have read and agreed to the published version of the manuscript.

Funding

This research was supported by the 2025 Empirical Research Special Project of the Chengdu Science and Decision-Making Research Association (No. KXJC20251013), and by the 2026 Youth Project of the Sichuan Provincial Key Research Base for Philosophy and Social Sciences (No. ZTZX26012).

Institutional Review Board Statement

Not applicable.

Informed Consent Statement

Not applicable.

Data Availability Statement

The original contributions presented in this study are included in the article. Further inquiries can be directed to the authors. The data supporting the findings of this study are available from the corresponding author upon reasonable request (wangyao67@stu.scu.edu.cn). The dataset was compiled from publicly available sources, including statistical yearbooks, government work reports, and statistical communiqués on national economic and social development, as well as first-hand field materials collected by the authors. Public-source data can be accessed through the official websites or published documents of the relevant government departments. Due to the nature of the fieldwork materials, we hope researchers seeking access are kindly requested to provide a brief statement of intended use.

Conflicts of Interest

The authors declare no conflicts of interest.

Abbreviations

The following abbreviations are used in this manuscript:
SESSocial–Ecological System
PSRPressure–State–Response
SDGsSustainable Development Goals

References

  1. Xinhua News Agency. Opinions of the General Office of the CPC Central Committee and the General Office of the State Council on Comprehensively Promoting the Protection and Governance of Rivers and Lakes. Available online: https://www.gov.cn/zhengce/202506/content_7029509.htm (accessed on 28 March 2026).
  2. People’s Daily Online. Lucid Waters, Lush Mountains Yield Ecological, Economic Benefits. Available online: https://en.people.cn/n3/2022/1020/c90000-10161292.html (accessed on 28 March 2026).
  3. Jia, S.; Li, D. Evolution of Water Governance in China. J. Water Resour. Plan. Manag. 2021, 147, 04021050. [Google Scholar] [CrossRef]
  4. Zhen, N.; Rutherfurd, I.; Webber, M. Ecological Water, a New Focus of China’s Water Management. Sci. Total Environ. 2023, 879, 163001. [Google Scholar] [CrossRef]
  5. Ma, Y.; Xu, Z.; Dong, Z.; Liu, H.; Gao, X.; Cao, X.; Li, Y.; Liang, L.; Yang, Z.; Li, X.; et al. Spatiotemporal Trends of Precipitation and Natural Streamflow in the Upper Yangtze River Basin from 1951 to 2020. Hydrology 2025, 12, 243. [Google Scholar] [CrossRef]
  6. Xiong, F.; Chen, Y.; Zhang, S.; Xu, Y.; Lu, Y.; Qu, X.; Gao, W.; Wu, X.; Xin, W.; Gang, D.D.; et al. Land Use, Hydrology, and Climate Influence Water Quality of China’s Largest River. J. Environ. Manag. 2022, 318, 115581. [Google Scholar] [CrossRef]
  7. Lu, F.; Yoon, S.J. Spatiotemporal Evolution and Spillover Effects of Tourism Industry and Inclusive Green Growth Coordination in the Yellow River Basin: Toward Sustainable Development. Sustainability 2025, 17, 11372. [Google Scholar] [CrossRef]
  8. Zhang, K.; Fang, B.; Zhang, Z.; Liu, T.; Liu, K. Exploring Future Ecosystem Service Changes and Key Contributing Factors from a “Past-Future-Action” Perspective: A Case Study of the Yellow River Basin. Sci. Total Environ. 2024, 926, 171630. [Google Scholar] [CrossRef] [PubMed]
  9. Li, P.; Li, H.; Yang, G.; Zhang, Q.; Diao, Y. Assessing the Hydrologic Impacts of Land Use Change in the Taihu Lake Basin of China from 1985 to 2010. Water 2018, 10, 1512. [Google Scholar] [CrossRef]
  10. Xu, X.; Yang, G.; Tan, Y.; Zhuang, Q.; Li, H.; Wan, R.; Su, W.; Zhang, J. Ecological Risk Assessment of Ecosystem Services in the Taihu Lake Basin of China from 1985 to 2020. Sci. Total Environ. 2016, 554, 7–16. [Google Scholar] [CrossRef] [PubMed]
  11. Zhang, Y.; Yang, Y.; Wu, W. Spatial Distribution Characteristics and Influencing Factors of Intangible Cultural Heritage in the Tarim River Basin of China. Sustainability 2026, 18, 2100. [Google Scholar] [CrossRef]
  12. Lu, S.; Xiao, B.; Li, J.; Tang, Y.; Guo, M. Research on Standard Calculation Method for Watershed Water Pollution Compensation. Sci. Total Environ. 2020, 737, 138157. [Google Scholar] [CrossRef]
  13. Huang, X.; Hua, W.; Dai, X. Performance Evaluation of Watershed Environment Governance—A Case Study of Taihu Basin. Water 2022, 14, 158. [Google Scholar] [CrossRef]
  14. Cumming, G.S.; Barnes, G.; Perz, S.; Schmink, M.; Sieving, K.E.; Southworth, J.; Binford, M.; Holt, R.D.; Stickler, C.; Van Holt, T. An Exploratory Framework for the Empirical Measurement of Resilience. Ecosystems 2005, 8, 975–987. [Google Scholar] [CrossRef]
  15. Cookey, P.E.; Darnsawasdi, R.; Ratanachai, C. Performance Evaluation of Lake Basin Water Governance Using Composite Index. Ecol. Indic. 2016, 61, 466–482. [Google Scholar] [CrossRef]
  16. Fallon, A.; Jones, R.W.; Keskinen, M. Bringing Resilience-Thinking into Water Governance: Two Illustrative Case Studies from South Africa and Cambodia. Glob. Environ. Change 2022, 75, 102542. [Google Scholar] [CrossRef]
  17. Merlo-Galeazzi, A.; Avila-Foucat, V.S.; Perevochtchikova, M. Analysis of the Watershed Social–Ecological System Trajectory in Copalita-Huatulco, Mexico: The Impact of Drivers on Hydrological Ecosystem Services. Ambio 2024, 53, 1797–1812. [Google Scholar] [CrossRef] [PubMed]
  18. Pedroza-Martínez, D.R.; Beltrán-Vargas, J.E.; Zafra-Mejía, C.A. Socioecological Resilience: Quantitative Assessment of the Impact of an Invasive Species Assemblage on a Lake Ecosystem. Resources 2024, 13, 132. [Google Scholar] [CrossRef]
  19. Steinmann, P.; Tobi, H.; Van Voorn, G.A.K. Resilience Metrics for Socio-Ecological and Socio-Technical Systems: A Scoping Review. Systems 2024, 12, 357. [Google Scholar] [CrossRef]
  20. Wang, S.; Li, Z.; Long, Y.; Yang, L.; Ding, X.; Sun, X.; Chen, T. Impacts of Urbanization on the Spatiotemporal Evolution of Ecological Resilience in the Plateau Lake Area in Central Yunnan, China. Ecol. Indic. 2024, 160, 111836. [Google Scholar] [CrossRef]
  21. Li, Y.; Zhao, H.; Zhang, Z.; Zhu, J. Assessing Social-Ecological System Resilience and Interaction Mechanisms in the Agro-Pastoral Ecotone Using PSR and PVAR Models: A Case Study of Northern Hebei Province. Environ. Sustain. Indic. 2025, 29, 101046. [Google Scholar] [CrossRef]
  22. China Daily. Erhai Lake Cleans Up Its Act in Pollution Fight. Available online: https://www.chinadaily.com.cn/global/2019-02/13/content_37436097.htm (accessed on 29 March 2026).
  23. Feng, Y.; Wu, F.; Zhang, F. Environmental Statecraft and Changing Spatial Politics: Erhai Lake Protection in China. Political Geogr. 2024, 115, 103196. [Google Scholar] [CrossRef]
  24. Ostrom, E. A General Framework for Analyzing Sustainability of Social-Ecological Systems. Science 2009, 325, 419–422. [Google Scholar] [CrossRef] [PubMed]
  25. Folke, C. Resilience: The Emergence of a Perspective for Social-Ecological Systems Analyses. Glob. Environ. Change 2006, 16, 253–267. [Google Scholar] [CrossRef]
  26. Wang, Y.; Shu, Q. Review and Prospect of Collective Action Studies on Commons Governance. China Popul. Resour. Environ. 2021, 31, 118–131. [Google Scholar]
  27. OECD. OECD Core Set of Indicators for Environmental Performance Reviews: A Synthesis Report by the Group on the State of the Environment; OECD: Paris, France, 1993. [Google Scholar]
  28. Wang, Y.; Gong, J.; Zhu, Y. Integrating Social-Ecological System into Watershed Ecosystem Services Management: A Case Study of the Jialing River Basin, China. Ecol. Indic. 2024, 160, 111781. [Google Scholar] [CrossRef]
  29. Berger, A.R.; Hodge, R.A. Natural Change in the Environment: A Challenge to the Pressure-State-Response Concept. Soc. Indic. Res. 1998, 44, 255–265. [Google Scholar] [CrossRef]
  30. Hazbavi, Z.; Sadeghi, S.H.; Gholamalifard, M.; Davudirad, A.A. Watershed Health Assessment Using the Pressure–State–Response (PSR) Framework. Land Degrad. Dev. 2020, 31, 3–19. [Google Scholar] [CrossRef]
  31. Liu, X.; Chen, J.; Tang, B.H.; He, L.; Xu, Y.; Yang, C. Eco-Environmental Changes Due to Human Activities in the Erhai Lake Basin from 1990 to 2020. Sci. Rep. 2024, 14, 8646. [Google Scholar] [CrossRef] [PubMed]
  32. Liu, B.; Chen, S.; Liu, H.; Guan, Y. Blue-Green Algae Enhanced Performance of Diatom-Based Multimetric Index on Defining Lake Condition under High Level of Human Disturbance. Sci. Total Environ. 2020, 730, 138846. [Google Scholar] [CrossRef]
  33. Dali Bai Autonomous Prefecture Government. Notice from the People’s Government of Dali Bai Autonomous Prefecture on Issuing the “Detailed Rules for the Implementation of the Three-Zone Management and Control Measures for Erhai Lake in Dali Bai Autonomous Prefecture”. Available online: https://www.dali.gov.cn/dlzrmzf/xxgkml/c105889/pc/content/1968566128979578880/content_1968566128979578880.html (accessed on 28 March 2026).
  34. Li, Y. The Experience and Inspiration of the Construction of Ecological Civilization in Eryuan: Thinking and Exploring of the Construction of Ecological Civilization in Water-Reserved and Ethnic Areas. Ecol. Econ. 2010, 6, 180–182+187. [Google Scholar]
  35. Fan, X.-S.; Jixi, G.; He, P.; Feng, C.-Y.; Jie, X.; Hou, L.; Ren, Y.; Wang, D.; Jiao, J.; Hou, C. Technical Solutions for Ecological Red-Line Management Based on Problems of Ecological Security. China Environ. Sci. 2018, 38, 4749–4754. [Google Scholar]
  36. Li, W.; Ma, L.; Zang, Z.; Gao, J.; Li, J. Construction of Ecological Security Patterns Based on Ecological Red Line in Erhai Lake Basin of Southwestern China. J. Beijing For. Univ. 2018, 40, 85–95. [Google Scholar] [CrossRef]
  37. Wei, Y.; Wu, M. Policy Evolution and Multi-Dimensional Coupling Characteristics in Chinese River and Lake Chief System—Based on an Econometric Analysis of Policy Texts since 2008. J. Econ. Water Resour. 2025, 43, 69–77. [Google Scholar]
  38. Zhang, Z.; Yan, Z.; Jin, T. Impact of Officials’ Ecological Accountability on the Effectiveness of the River Chief System and Its Mechanisms. China Popul. Resour. Environ. 2024, 34, 70–79. [Google Scholar] [CrossRef]
  39. Xu, J.; Peng, Q.; Yang, J. Research on Unbalanced Cost-Sharing in Watershed Co-Governance in China. Stat. Res. 2024, 41, 86–98. [Google Scholar]
  40. Wang, T.; Huang, Y.; Cheng, J.; Xiong, H.; Ying, Y.; Feng, Y.; Wang, J. Construction and Optimization of Watershed-Scale Ecological Network Based on Complex Network Method: A Case Study of Erhai Lake Basin in China. Ecol. Indic. 2024, 160, 111794. [Google Scholar] [CrossRef]
  41. Xiang, J.Q. Lake Management: From” Project Based Pollution Control” to” Governance”: Experience and Thinking on the Erhai Water Pollution Control. China Soft Sci. Mag. 2013, 2, 81–89. [Google Scholar]
  42. Dali Bai Autonomous Prefecture Government. Notice from the People’s Government of Dali Bai Autonomous Prefecture on Issuing the Implementation Measures of the Regulations on the Protection and Management of Erhai Lake in Dali Bai Autonomous Prefecture, Yunnan Province. Available online: https://www.dali.gov.cn/dlzrmzf/xxgkml/c105889/pc/content/1968566245811916800/content_1968566245811916800.html (accessed on 28 March 2026).
  43. Colglazier, W. Sustainable development agenda: 2030. Science 2015, 349, 1048–1050. [Google Scholar] [CrossRef]
  44. Sebesvari, Z.; Renaud, F.G.; Haas, S.; Tessler, Z.; Hagenlocher, M.; Kloos, J.; Szabo, S.; Tejedor, A.; Kuenzer, C. A Review of Vulnerability Indicators for Deltaic Social–Ecological Systems. Sustain. Sci. 2016, 11, 575–590. [Google Scholar] [CrossRef]
  45. Schlüter, M.; Herrfahrdt-Pähle, E. Exploring Resilience and Transformability of a River Basin in the Face of Socioeconomic and Ecological Crisis: An Example from the Amudarya River Basin, Central Asia. Ecol. Soc. 2011, 16, 32. [Google Scholar] [CrossRef]
  46. Wang, J.; Lu, J.; Zhang, Z.; Han, X.; Zhang, C.; Chen, X. Agricultural Non-Point Sources and Their Effects on Chlorophyll-a in a Eutrophic Lake over Three Decades (1985–2020). Environ. Sci. Pollut. Res. 2022, 29, 46634–46648. [Google Scholar] [CrossRef] [PubMed]
  47. Hezri, A.A.; Dovers, S.R. Sustainability Indicators, Policy and Governance: Issues for Ecological Economics. Ecol. Econ. 2006, 60, 86–99. [Google Scholar] [CrossRef]
  48. Butt, B. Environmental Indicators and Governance. Curr. Opin. Environ. Sustain. 2018, 32, 84–89. [Google Scholar] [CrossRef]
  49. Dali City Statistical Yearbook 2024. Available online: https://www.yndali.gov.cn/dlsrmzf/c106688/pc/content/2022493694320480256/content_2022493694320480256.html (accessed on 28 March 2026).
  50. Government Work Report of Dali City 2025. Available online: https://www.yndali.gov.cn/dlsrmzf/c103329/pc/content/1981629843773689856/content_1981629843773689856.html (accessed on 28 March 2026).
  51. Statistical Communiqué of Dali City on the 2024 National Economic and Social Development. Available online: https://www.yndali.gov.cn/dlsrmzf/c106688/pc/content/1983722742204174336/content_1983722742204174336.html (accessed on 28 March 2026).
  52. Tong, H.; Xia, E.; Sun, C.; Yan, K.; Li, J.; Huang, J. Construction and Comprehensive Evaluation of an Index System for Climate-Smart Agricultural Development in China. J. Clean. Prod. 2024, 469, 143216. [Google Scholar] [CrossRef]
  53. Jenks, G.F.; Caspall, F.C. Error on Choroplethic Maps: Definition, Measurement, Reduction. Ann. Assoc. Am. Geogr. 1971, 61, 217–244. [Google Scholar] [CrossRef]
  54. Dobson, A. Environment Sustainabilities: An Analysis and a Typology. Environ. Politics 1996, 5, 401–428. [Google Scholar] [CrossRef]
  55. Yin, N.; Zuo, J.; Yang, M.; Yang, J.; Liu, S.; Wu, J. Spatio-Temporal Evolution of Social-Ecological System Resilience in Ethnic Tourism Destinations in Mountainous Areas and Trend Prediction: A Case Study in Wuling, China. Sci. Rep. 2024, 14, 23563. [Google Scholar] [CrossRef]
  56. Zhang, H.; Liang, X.; Chen, H.; Shi, Q. Spatio-Temporal Evolution of the Social-Ecological Landscape Resilience and Management Zoning in the Loess Hill and Gully Region of China. Environ. Dev. 2021, 39, 100616. [Google Scholar] [CrossRef]
  57. Goetz, A.; Hussein, H.; Thiel, A. Polycentric Governance and Agroecological Practices in the MENA Region: Insights from Lebanon, Morocco and Tunisia. Int. J. Water Resour. Dev. 2024, 40, 816–831. [Google Scholar] [CrossRef]
  58. Pahl-Wostl, C. Transitions towards Adaptive Management of Water Facing Climate and Global Change. Water Resour. Manag. 2007, 21, 49–62. [Google Scholar] [CrossRef]
  59. Engel, S.; Pagiola, S.; Wunder, S. Designing Payments for Environmental Services in Theory and Practice: An Overview of the Issues. Ecol. Econ. 2008, 65, 663–674. [Google Scholar] [CrossRef]
  60. Folke, C.; Hahn, T.; Olsson, P.; Norberg, J. Adaptive Governance of Social-Ecological Systems. Annu. Rev. Environ. Resour. 2005, 30, 441–473. [Google Scholar] [CrossRef]
  61. Haasnoot, M.; Kwakkel, J.H.; Walker, W.E.; ter Maat, J. Dynamic Adaptive Policy Pathways: A Method for Crafting Robust Decisions for a Deeply Uncertain World. Glob. Environ. Change 2013, 23, 485–498. [Google Scholar] [CrossRef]
  62. Walker, B.; Holling, C.S.; Carpenter, S.R.; Kinzig, A. Resilience, Adaptability and Transformability in Social-Ecological Systems. Ecol. Soc. 2004, 9, 5. [Google Scholar] [CrossRef]
  63. Le Blanc, D. Towards Integration at Last? The Sustainable Development Goals as a Network of Targets. Sustain. Dev. 2015, 23, 176–187. [Google Scholar] [CrossRef]
  64. Nilsson, M.; Griggs, D.; Visbeck, M. Policy: Map the Interactions between Sustainable Development Goals. Nature 2016, 534, 320–322. [Google Scholar] [CrossRef]
  65. Pradhan, P.; Costa, L.; Rybski, D.; Lucht, W.; Kropp, J.P. A Systematic Study of Sustainable Development Goal (SDG) Interactions. Earth’s Future 2017, 5, 1169–1179. [Google Scholar] [CrossRef]
  66. Scown, M.W.; Craig, R.K.; Allen, C.R.; Gunderson, L.; Angeler, D.G.; Garcia, J.H.; Garmestani, A. Towards a Global Sustainable Development Agenda Built on Social-Ecological Resilience. Glob. Sustain. 2023, 6, e8. [Google Scholar] [CrossRef]
  67. Stafford-Smith, M.; Griggs, D.; Gaffney, O.; Ullah, F.; Reyers, B.; Kanie, N.; Stigson, B.; Shrivastava, P.; Leach, M.; O’Connell, D. Integration: The Key to Implementing the Sustainable Development Goals. Sustain. Sci. 2017, 12, 911–919. [Google Scholar] [CrossRef] [PubMed]
  68. Bennett, E.M.; Cramer, W.; Begossi, A.; Cundill, G.; Díaz, S.; Egoh, B.N.; Geijzendorffer, I.R.; Krug, C.B.; Lavorel, S.; Lazos, E.; et al. Linking Biodiversity, Ecosystem Services, and Human Well-Being: Three Challenges for Designing Research for Sustainability. Curr. Opin. Environ. Sustain. 2015, 14, 76–85. [Google Scholar] [CrossRef]
Figure 1. Analytical framework of the SES-PSR model for the Erhai Basin.
Sustainability 18 04840 g001
Figure 2. Location of the Erhai Basin. Source: Compiled by the authors based on the standard map service of the Ministry of Natural Resources of the People’s Republic of China (map approval No. GS (2020) 4632); the base map has not been modified.
Sustainability 18 04840 g002
Figure 3. River system map of the Erhai Basin and surrounding townships (subdistricts). Source: Compiled by the authors based on the standard map service of the Ministry of Natural Resources of the People’s Republic of China (map approval No. GS (2020) 4632); the base map has not been modified.
Sustainability 18 04840 g003
Figure 4. Two-dimensional matrix of ecological protection and social development in the Erhai Lake Basin.
Sustainability 18 04840 g004
Figure 5. Temporal evolution of resilience across townships (subdistricts) in the Erhai Basin, 2010–2025.
Sustainability 18 04840 g005
Figure 6. Social Subsystem Resilience of the Erhai Basin.
Sustainability 18 04840 g006
Figure 7. Ecological Subsystem Resilience of the Erhai Basin.
Sustainability 18 04840 g007
Figure 8. Comprehensive Social–Ecological Resilience of the Erhai Basin.
Sustainability 18 04840 g008
Table 1. Evaluation Indicator System for Social–Ecological System Resilience in the Erhai Lake Basin.
System LayerCriteria LayerPrimary Indicator GroupIndicator CodeSecondary IndicatorIndicator AttributeSDG(s)
Social subsystemPressureSocial vulnerabilitySP1Proportion of poor (formerly poor) households (%)SDG 1
Social vulnerabilitySP2Proportion of the population aged 60 and over (%)SDG 3
Mobility and labor outflow pressureSP3Proportion of migrant labor force (%)SDG 8
Human capital constraintSP4Proportion of the population with a junior high school education or below (%)SDG 4
Population and development pressureSP5Population density (persons/km2)SDG 11
Tourism development pressureSP6Tourism development intensitySDG 8, SDG 11
StateSocioeconomic development foundationSS1Transport accessibility+SDG 9, SDG 11
Socioeconomic development foundationSS2Annual per capita income+SDG 1, SDG 8
Socioeconomic development foundationSS3Collective economic income+SDG 8
Socioeconomic development foundationSS4Tourism resource base+SDG 8, SDG 11
Socioeconomic development foundationSS5Household Internet access rate (%)+SDG 9
Social organization densitySS6Social organization density (units/1000 persons)+SDG 16, SDG 17
ResponseSocial organization and governance supportSR1Number of industrial or cooperative associations+SDG 17
Social organization and governance supportSR2Medical insurance coverage rate (%)+SDG 3
Social organization and governance supportSR3Agricultural insurance coverage rate (%)+SDG 2, SDG 13
Social organization and governance supportSR4Participation rate in major public affairs (%)+SDG 16
Social organization and governance supportSR5Government financial contribution+SDG 16, SDG 17
Per capita financial transfer paymentSR6The total amount of transfer payments received by the township in the current year divided by the permanent population of the township (CNY/person)+SDG 10, SDG 16
Ecological subsystemPressureAgricultural input pressureEP1Chemical fertilizer load per unit of cultivated land (kg/mu)SDG 2, SDG 15
Agricultural input pressureEP2Pesticide cost per unit of cultivated land (CNY/mu)SDG 3, SDG 15
Land development pressureEP3Proportion of construction land area (%)SDG 11, SDG 15
Frequency of meteorological disastersEP4Frequency of meteorological disasters (times)SDG 13
StateEcological resource endowmentES1Per capita cultivated land area (mu/person)+SDG 2
Ecological resource endowmentES2Average vegetation coverage+SDG 15
ResponseEnvironmental governance and ecological regulationER1Centralized domestic sewage treatment rate (%)+SDG 6
Environmental governance and ecological regulationER2Centralized domestic waste treatment rate (%)+SDG 11, SDG 12
Environmental governance and ecological regulationER3Intensity of ecological protection policy restrictions+SDG 15
Environmental governance and ecological regulationER4Level of ecological compensation/dividend distribution (%)+SDG 15, SDG 1
Environmental governance and ecological regulationER5Cultivated land transfer rate (%)+SDG 2, SDG 8
Environmental regulation strengthER6Number of environmental law enforcement inspections and rectifications conducted in townships this year (times) +SDG 15, SDG 16
Note: “+” indicates a positive indicator, and “−” indicates a negative indicator. SP denotes Social Pressure; SS denotes Social State; SR denotes Social Response; EP denotes Ecological Pressure; ES denotes Ecological State; ER denotes Ecological Response. For a more complete and specific table of indicator systems, please refer to Supplementary Table S1.
Table 2. KMO and Bartlett’s test of sphericity results.
SubsystemsKMO ValueBartlett’s Test of Sphericity: Chi-Square StatisticDegrees of Freedom (df)Significance Level (p-Value)
Social Subsystem0.763412.856120p < 0.001
Ecological Subsystem0.714298.43191p < 0.001
Table 3. Global principal component analysis results.
SubsystemsPrincipal ComponentCharacteristic RootsVariance Contribution Rate (%)Cumulative Variance Contribution Rate (%)Normalized Component Weight
Social SubsystemPC15.23432.7132.710.4584
PC22.89118.0750.780.2532
PC32.14313.3964.170.1877
PC41.1497.1871.360.1006
Ecological SubsystemPC14.87634.8334.830.4606
PC23.17522.6857.510.3000
PC32.53418.1075.610.2394
Note: The normalized component weight was calculated by dividing the variance contribution rate of each retained principal component by the total variance contribution rate of all retained principal components within the same subsystem.
Table 4. Classification of Space Unit Comprehensive Resilience Index.
Range of RC,it Values0.190 ≤ RC,it < 0.3850.385 ≤ RC,it < 0.5140.514 ≤ RC,it < 0.6150.615 ≤ RC,it < 0.6990.699 ≤ RC,it ≤ 0.848
Resilience GradeLowLow–MediumMediumMedium–HighHigh
Number of Observations71212813
Note: The minimum and maximum observed values of R C , i t in the pooled sample are 0.190 and 0.848, respectively. Therefore, the classification intervals are defined within the observed sample range. The last interval is closed at the upper bound to include the maximum observed value.
Table 5. Breakpoint Robustness Test Results.
BreakpointPoint Estimate95% Confidence Interval Lower Bound95% Confidence Interval Upper BoundStandard Deviation
BP1 (Low/Low–Medium)0.3850.1900.4270.0953
BP2 (Low–Medium/Medium)0.5140.3780.5490.0595
BP3 (Medium/Medium–High)0.6150.5140.6660.0371
BP4 (Medium–High/High)0.6990.6150.7780.0368
Table 6. Resilience Indices of Townships (Subdistricts) in the Erhai Lake Basin.
Township (Subdistrict)2010201520202025
RS,itRE,itRC,itRS,itRE,itRC,itRS,itRE,itRC,itRS,itRE,itRC,it
Xiaguan Subdistrict0.8310.6590.7300.8580.6940.7620.9000.7700.8240.9210.7970.848
Manjiang Subdistrict0.6440.4860.5510.7810.6210.6870.8260.6870.7440.8940.7690.821
Taihe Subdistrict0.6700.5770.6150.3120.3460.3320.3560.3930.3780.7510.6200.674
Haidong Town0.4370.4920.4690.5090.5520.5340.6310.6910.6660.7220.7530.740
Wase Town0.2790.3520.3220.4000.4800.4470.4480.5090.4840.4780.5390.514
Shuanglang Town0.5150.4460.4740.5670.5060.5310.5450.4730.5030.5870.5230.549
Shangguan Town0.5450.7370.6580.5890.7760.6990.5020.6400.5830.6540.8020.741
Xizhou Town0.3310.3830.3620.4680.5220.5000.6760.6550.6640.6050.5580.577
Wanqiao Town0.3260.4260.3850.6680.5580.6030.7120.6670.6860.7950.7270.755
Yinqiao Town0.4200.4810.4560.4890.5290.5130.5470.6230.5920.6210.6980.666
Dali Town0.5150.3660.4270.2650.1370.1900.4370.3190.3680.5530.4350.484
Fengyi Town0.4030.3040.3450.5070.4290.4610.5580.5050.5270.6310.5530.585
Taiyi Yi Ethnic Township0.6990.8340.7780.6860.8170.7630.5400.6210.5880.6600.7820.732
Average Value0.5090.5030.5060.5460.5360.5400.5910.5810.5850.6820.6580.668
Note: RS,it represents the social subsystem resilience index of township i in time period t. RE,it represents the ecological subsystem resilience index of township i in time period t. RC,it represents the comprehensive resilience index of township i in time period t.
Table 7. Linear mixed-effects model results for temporal changes in resilience indices.
Dependent VariableTime Coefficient (β1)Standard ErrorWald z Valuep-Value95% Confidence Interval 95%ICC
Social resilience (RS,it)0.05650.01234.587<0.001[0.0324, 0.0807]0.594
Ecological resilience (RE,it)0.05100.01025.015<0.001[0.0310, 0.0709]0.698
Comprehensive resilience (RC,it)0.05330.01084.922<0.001[0.0321, 0.0745]0.625
Table 8. Global Moran Index Results under Spatial Weight Matrix.
YearsGlobal Moran’s Iz-Valuep-Value (psim)
20100.17341.79530.0363
20150.10791.36690.0858
20200.12261.49010.0681
20250.15311.59860.0550
Disclaimer/Publisher’s Note: The statements, opinions and data contained in all publications are solely those of the individual author(s) and contributor(s) and not of MDPI and/or the editor(s). MDPI and/or the editor(s) disclaim responsibility for any injury to people or property resulting from any ideas, methods, instructions or products referred to in the content.