Article

Path Dependence and Spatial Spillovers in Regional Digitalization: Evidence from Dynamic Spatial Panel Analysis in Europe


1
Department of International Trade and Administration, Faculty of Economics and Administrative Sciences, Munzur University, Tunceli 62000, Türkiye
2
Department of Finance and Banking, Faculty of Economics and Administrative Sciences, Munzur University, Tunceli 62000, Türkiye
*
Author to whom correspondence should be addressed.
Sustainability 2026, 18(10), 4839; https://doi.org/10.3390/su18104839
Submission received: 22 March 2026 / Revised: 4 May 2026 / Accepted: 6 May 2026 / Published: 12 May 2026

Abstract

Digitalization is the driver of regional competitiveness and sustainable development, but its geographical impacts differ significantly across Europe. This study was conducted to determine if digital transformation results in regional sustainability or if it increases spatial inequalities, concentrating on European NUTS-1 regions for the period 2021–2025. A composite Regional Digitalization Index was developed by means of Principal Component Analysis (PCA) based on indicators measuring internet access, internet usage, and the availability of digital public services. Dynamic spatial panel econometric models were used for empirical investigation, including a Spatial Autoregressive (SAR) model and a Spatial Durbin model (SDM), which facilitated the exploration of both temporal dependence and spatial spillover. Three main conclusions can be derived from the results, as follows: The level of digitalization in a region is highly stable over time, whereby the development depends most on previous paths. Subsequently, human capital is highly significant for digital development, and its effects are not only local but also spill over to neighboring regions. Lastly, spatial interactions consist of two opposite forces—the positive diffusion from digitally advanced neighboring regions and the competitive effects related to the economic strength of neighboring regions—that further intensify the core–periphery divide.

1. Introduction

In the European Union (EU), digital transformation is among the main priorities in the modernization of regional development strategies. Its role as a key driver of inclusive, resilient, and sustainable growth is strongly emphasized throughout the EU’s Digital Decade agenda [1]. Digitalization represents a far-reaching socio-economic transformation shaping production, governance, and regional development. By supporting higher productivity, stronger innovation capacity, and improved service accessibility, it can contribute to achieving several Sustainable Development Goals (SDGs), including reducing inequalities (SDG 10), sustaining economic growth (SDG 8), and the development of sustainable cities and communities (SDG 11) [2].
Nonetheless, the regional outcomes of digital transformation remain very uneven. While digital technologies may create new opportunities for convergence, growing evidence suggests that they may also reinforce existing territorial disparities. Differences in human capabilities, institutional effectiveness, and local innovation systems generate substantial variation in digital adoption and outcomes across regions [3,4,5]. This raises an important question as to whether digital transformation narrows or reproduces existing spatial inequalities. These dynamics can be understood through inherited regional conditions and cross-regional interaction effects. Regional digitalization may reflect earlier infrastructure, skills, and institutional conditions [6,7]. At the same time, theories of territorial interdependence suggest that regional development does not occur in isolation; neighboring territories influence one another through knowledge exchange, competition for resources, and interregional linkages. Recent evidence indicates that digital transformation may generate both positive spillovers that support convergence and negative spillovers that reinforce divergence, depending on regional conditions [8,9].
Although the literature on digitalization and regional development has expanded rapidly, several important gaps remain. First, many empirical studies rely on static or cross-sectional methods, which are limited in capturing the cumulative nature of digital transformation. Second, the integration of spatial interactions into dynamic modeling frameworks remains underdeveloped, restricting our understanding of interregional dependencies. Third, many studies depend on single indicators such as broadband access, thereby overlooking the multidimensional character of digitalization [10,11]. Finally, persistence, spatial interaction, and regional heterogeneity are often examined separately, leading to fragmented interpretations.
These limitations are particularly relevant in Europe, where territorial heterogeneity remains substantial. Yet the use of dynamic spatial panel models to study regional digitalization is still limited. Such models are especially useful because they can jointly capture persistence over time, cross-regional interaction effects, and structural territorial differences within a single framework.
In response to these gaps, this study offers three main contributions. First, Principal Component Analysis (PCA) was employed to construct a composite Digitalization Index that captures multiple dimensions of digital transformation, thereby overcoming the limits of one-dimensional indicators. Second, the index was incorporated into a dynamic spatial panel model to examine persistence and spillovers simultaneously. Third, new evidence is provided that equalizing diffusion forces and polarizing competitive effects coexist across European regions. Beyond these empirical contributions, this study also contributes by conceptualizing digitalization as a territorially embedded and multidimensional development process shaped simultaneously by persistence mechanisms, interregional interaction effects, and uneven regional capabilities. Integrating these dynamics within a single analytical framework provides a more comprehensive account of how digital transformation evolves across space and over time. The conclusions of this study differ from conventional interpretations that treat digitalization as a purely technological or linear convergence process and instead highlight its interaction-driven and uneven nature, thereby advancing the literature by emphasizing the joint role of structural persistence and spatial dependence in shaping regional digital outcomes.
Accordingly, this study was conducted to address three related research questions: (i) Does regional digitalization exhibit path-dependent behavior? (ii) How do spatial interactions shape regional digital trajectories? (iii) How do human capital and economic capacity influence digital outcomes? Based on these questions, three hypotheses are proposed. H1: regional digitalization is persistent over time. H2a/H2b: digitalization generates both positive and negative spillovers. H3: human capital is an important determinant of regional digital development.
These issues are highly relevant for the EU Digital Decade and Green Deal agendas, both of which emphasize that territorial cohesion depends not only on digital infrastructure but also on human capital, institutional quality, and interregional cooperation. Understanding how persistence and spillovers interact is therefore important for designing effective and differentiated regional policies.
An empirical analysis was performed to investigate digitalization paths across European NUTS-1 regions over the period 2021–2025. While the relatively short time span precludes the observation of long-run structural adjustment, it provides timely evidence on recent digital transformation dynamics in Europe.
The remainder of the paper is organized as follows: Section 2 presents a review of the literature, Section 3 presents the data and methodology, Section 4 reports empirical findings, the results and policy implications are discussed in Section 5, and conclusions are provided in Section 6.

2. Literature Review

2.1. Digitalization and Regional Development

In the existing literature, digitalization has been conceptualized as a multifaceted driver of regional development that reshapes economic competitiveness, governance capacity, and spatial organization. Recent studies show that digital transformation affects competitiveness, institutional capacity, and spatial organization [12,13]. Evidence from European regions further indicates that digital infrastructure and innovation capacity contribute to productivity, innovation performance, and regional growth [14]. Overall, these results indicate that digitalization is a strong driver of territorial development in addition to technological change.
The digital transformation also leads to considerable changes in planning systems and regional governance structures [12,13]. In this context, the role of Spatial Data Infrastructures (SDIs) is particularly important, as they facilitate digital government operations and improve public administration efficiency and transparency of service delivery [12]. The incorporation of SDIs into broader European data spaces also suggests that inter-operability, open data systems, and cross-sector integration are becoming key drivers of regional competitiveness [15,16,17,18,19]. In particular, it has been found that digital planning data stimulate innovation and improve the effectiveness of land-use planning, and thus influence spatial decision-making processes [13].
Firm-level digitalization is also a key determinant of regional economic restructuring. The ability of SMEs to adopt digital tools, exploit Internet of Things applications, access interoperable location-based data, and upgrade work-force skills increasingly shapes their competitiveness and innovation performance [20,21,22]. SMEs in regions with limited digital capacity are more vulnerable to economic exclusion, which can further intensify existing patterns of uneven development [23,24,25,26]. Thus, regional digitalization is not only influenced by public infrastructure but also by the absorptive capacity of the private sector and the entrepreneurial ability of firms to adapt.

2.2. Digital Divide, Spatial Inequality, and Spillover Mechanisms

Digitalization may well promote development, but its benefits are not evenly distributed in space. Improving access to ICT infrastructure can help bridge connectivity gaps. However, persistent differences in digital skills, institutional quality, and socio-economic preparedness remain strong determinants of regional inequality [4,10,27,28]. As a result, access alone is unlikely to result in inclusive territorial development.
Another perennial challenge is the urban–rural divide. Rural areas are often characterized by weaker infrastructure, lower governance capacity, smaller labor markets, and lower levels of digital literacy [29,30,31,32]. Under such conditions, digital transformation can reinforce, not reduce, existing territorial inequalities.
European evidence also shows clear gaps between core and peripheral territories in digital performance and absorptive capacity [8,33]. Borda et al. [34] find a similar pattern, showing that digital inequality between EU countries was a significant factor in the differences in vulnerability during the COVID-19 period. This highlights the close link between internet use, digital skills, and wider social resilience.
From a regional perspective, development outcomes are not isolated. Regions are linked by commuting flows, supply chains, shared infrastructure, and knowledge networks. Thus, the digital development of one territory can create positive spillover effects or negative competitive externalities for its neighboring regions [35,36]. In addition, ignoring such interdependencies can lead to misleading results of convergence and divergence processes, as spatial econometric studies have shown [37,38].
In the literature, interregional transmission mechanisms are usually distinguished. Positive diffusion effects are observed when technological knowledge, innovation practices, and digital capabilities are diffused between neighboring regions, promoting convergence [39]. Competitive spillovers, by contrast, occur when digitally advanced core regions attract skilled labor, investment, and innovative activity from surrounding territories, reinforcing center–periphery polarization [40,41]. The concurrent existence of both mechanisms suggests that digital transformation can produce convergence and divergence pressures in different places.
Also, empirical studies based on the multidimensional measurement approach show that regional digitalization is more likely to follow spatial patterns strongly related to wider socio-economic inequalities than random distributions of geography [42]. This further underpins the argument that digital divides are embedded in larger territorial development frameworks, so applying spatial analysis is crucial to understanding regional digital transformation.

2.3. Dynamics, Path Dependence, and Persistent Digital Gaps

The concept of digital inequality is increasingly understood as a development process that is historically changing and self-reinforcing, rather than a fixed gap in access. Early work focused largely on distinguishing between access to technology and broader gaps in use, quality, and socioeconomic outcomes [43]. More recent research indicates that enduring digital divides are frequently indicative of infrastructural legacies, historical investment trends, and institutional trajectories [6,7]. New Zealand is one such example, where research shows that the legacy of railway access still shapes the present-day patterns of broadband rollout [44]. Therefore, digital divides may be partly produced by existing structures and are not completely new phenomena [6,44].
Similar arguments have been made in other regional contexts, where early investments in connectivity, skill development, and innovation systems generate reinforcing advantages over time. Regions that initially benefited from digital infrastructure and complementary capabilities tend to accumulate further gains through positive feedback loops between technology adoption, skill upgrading, and productivity growth [45]. In contrast, lagging regions may be locked into a structural disadvantage, with less motivation for investment and a slower pace of digital adoption [7,45].
From a sustainability perspective, delayed digital development can generate broader long-term costs. Regions with weaker digital capacity may be less able to implement climate-smart technologies, circular economy practices, smart mobility systems, and data-driven governance tools [46,47]. As a result, digital underdevelopment can reduce the environmental adaptation capacity and the pace of progress in sustainable regional development [46,47].
These results suggest that digital transformation must be understood as a dynamic territorial process with the ongoing influence of long-standing structural conditions on present and future outcomes; as a result, the problem of temporal persistence is an important subject for empirical analysis.

2.4. Digitalization, Sustainability, and Rural Transformation

Digitalization is increasingly viewed as a mechanism for promoting inclusive growth, rural revitalization, and smart specialization strategies. Sustainability-oriented research highlights digital villages and smart rural initiatives as potentially important instruments for improving governance, connectivity, entrepreneurship, and service provision in peripheral territories [8]. Incorporating digital transformation into place-based policy frameworks can create new opportunities to support balanced territorial development [8,48].
At the same time, aggregate digital progress does not necessarily imply territorial convergence. Comparative evidence from European regions shows that digitally advanced territories often receive a disproportionate share of the benefits associated with innovation, high-value services, and knowledge-intensive activity [8,33,49]. Without the right policy measures, digitalization may exacerbate rather than reduce disparities between the center and the periphery [49].
An increasing number of studies in the literature argue that successful and sustainable digital development requires the integration of multiple complementary dimensions. These include infrastructure provision, interoperability of data systems, digital skill development, institutional quality, innovation ecosystems, and participatory governance arrangements [50,51]. Digital infrastructures are rarely sufficient if local absorptive capacity is ineffective [27,50,51].
Although Spatial Data Infrastructures (SDIs) and European data spaces are increasingly considered pillars of sustainable regional development, substantial territorial differences remain in the institutional capacity required for their effective implementation. Therefore, identical digital policy tools could produce quite different results across regions based on factors such as the quality of governance, the level of administrative competence, and the local conditions [17,18,19,51].
Generally, the existing sustainability literature implies that the role of digitalization in inclusive development is substantial, but empirical studies show that regional digital outcomes are stronger where skills, institutional quality, and governance capacity complement infrastructure investments [8,46,51].

2.5. Synthesis and Research Gap

Despite substantial advances, the literature offers three broad conclusions: First, digitalization has become an increasingly important driver of regional development through its effects on competitiveness, governance capacity, productivity, innovation, and spatial organization [8,14,20]. However, these benefits are distributed unevenly across regions, reflecting differences in institutional quality, human capital, innovation systems, and historical development conditions.
Second, regional digital outcomes are shaped by territorial interdependence and long-term reinforcement mechanisms. Diffusion effects may support learning, technology transfer, and convergence across neighboring regions, whereas competitive spillovers may reinforce core–periphery disparities by concentrating talent, investment, and innovation activity in already advantaged territories [39,40,41,42]. Historical trajectories also remain relevant in explaining present digital disparities [6,7,44,45].
Third, sustainability-oriented research indicates that the territorial benefits of digital transformation depend on the broader regional environment in which connectivity is embedded. Digital investments are more likely to deliver inclusive development outcomes in regions with stronger skill bases, effective institutions, innovation capacity, and place-based governance [8,46,51]. In contrast, where such enabling conditions are weak, digitalization may reinforce rather than reduce territorial disparities [33,48].
Important gaps in the research remain. Many studies have investigated digital capacity, spatial inequality, path dependence, or sustainability separately and not within an integrated analytical framework [47,52]. Thus, little attention has been paid to the joint effects of multidimensional digitalization, temporal persistence, and spatial spillovers on regional outcomes. Empirical work that combines composite digitalization measures with dynamic spatial econometric modeling is also relatively scarce, especially in the European context [10,11].
These limitations are particularly important in Europe, where territorial heterogeneity, urban–rural divides, and core–periphery structures still shape patterns of digital development [8,19,29]. To overcome these shortcomings, we constructed a multidimensional Digitalization Index based on a Principal Component Analysis (PCA) and developed dynamic spatial panel models for NUTS-1 regions of Europe. By jointly modeling persistence and spillovers, we provide new evidence on whether digital transformation supports sustainable regional convergence or reinforces pre-existing territorial inequalities.

3. Materials and Methods

3.1. Study Area and Data

The years 2021–2025 were a critical period in which digitalization was embedded in everyday life, business activity and public service provision in European regions. The relatively short timeframe notwithstanding, post-pandemic conditions accelerated the shift of digital technologies from temporary solutions to established practices in many sectors. Remote work was rapidly expanded, online education was more institutionalized, e-government services were broadened, and platform-based commerce reached wider user groups. Digital infrastructures became increasingly important to maintain production, service delivery, and social interaction [53]. Institutional adaptation also accelerated during this period through new public investment programs under the EU’s Digital Decade strategy, which presented digitalization as a driver of competitiveness, inclusion, and sustainable development [1]. Therefore, the years 2021–2025 can be considered a period of broad economic and administrative restructuring, in addition to technological progress.
In this study, the term digitalization is used to denote measurable regional results regarding digital access, utilization, and service integration. Digital readiness, on the other hand, refers to the more general enabling conditions that allow for such a transformation. Digitalization is measured by three harmonized indicators from Eurostat, namely the share of households with internet access, the share of individuals using the internet, and the prevalence of online public services. These indicators are drawn from Eurostat’s Information Society and e-Government databases, ensuring comparable measurement across countries. The first indicator reflects infrastructure capacity, the second captures usage and adoption, and the third represents digital public service provision. Together, they capture multidimensional regional digital outcomes rather than simple internet availability [11,54].
The analysis was carried out at the NUTS-1 level to allow for cross-country comparison while reflecting broad regional development patterns. This territorial scale is well-suited to studying deep-rooted regional disparities, institutional differences, and large-scale spatial interactions in digital development. The dataset comprises 110 NUTS-1 regions in the EU member states and select wider European regions, offering a balanced panel of 550 observations over five years. Once the lagged dependent variable was added to the dynamic model, the available sample was reduced to 440 observations as first period values were excluded. This is a normal consequence of dynamic panel modeling and not an indication of data loss or missing values. Given that several harmonized digital indicators are still not available or inconsistent at finer regional scales, conducting the analysis at the NUTS-1 level is the most practical option, as it balances territorial detail, statistical reliability, and international comparability.
GDP per capita and participation in education and training are included as socio-economic control variables. GDP per capita data were obtained from Eurostat regional accounts [55], while education and training indicators were drawn from Eurostat labor market and lifelong learning statistics [56]. These variables were used to capture regional economic resources and workforce skill formation [57,58].
Before constructing the composite index, all variables were standardized. This procedure removes scale differences between indicators and allows variables measured in different units to be compared directly. It also prevents any single variable from dominating the composite index purely because of its measurement scale.
Stata 18 was used for data preparation, principal component analysis, panel estimations, spatial diagnostics and spatial autocorrelation analysis. The maximum likelihood estimations for the SAR and SDM specifications, including impact decomposition analyses, were additionally implemented in Python 3 (Google Colab environment) using PySAL spatial econometric libraries.

3.2. Construction of the Regional Digitalization Index

To measure digitalization as a multidimensional phenomenon, a Regional Digitalization Index was constructed using Principal Component Analysis (PCA) (Table 1). PCA was used to retain most of the original information while reducing correlated indicators into a smaller number of components and producing a data-driven composite index without arbitrary weighting. The index was constructed through a two-stage approach. In the first stage, indicators were divided into three conceptually distinct pillars: digital access, digital use, and digital services/economy. After normalization, separate sub-indices were created for each pillar. At the second stage, a higher-level PCA was applied to these three sub-indices to produce the final Regional Digitalization Index. This tiered strategy improved interpretability while maintaining the multidimensional nature of digital transformation.
Before estimation, all indicators were normalized using the Min–Max transformation:
X n = X i X m i n X m a x X m i n
Sampling adequacy and internal consistency were assessed using standard diagnostic statistics, and components with eigenvalues greater than one were retained using the Kaiser criterion [59]. The index is interpreted as a composite measure of realized regional digital capacity, usage intensity and digitally enabled service outcomes.

3.3. Explanatory Variables

Regional absorptive capacity and skill availability are widely recognized as key determinants of digital development over time. Thus, participation in education and training is used as a proxy for human capital. This variable captures the ability of regional labor forces to acquire new skills, adapt to technological change and effectively participate in digital transformation processes.
GDP per capita is included as a measure of regional economic strength and investment capacity. Generally, wealthier regions are better able to finance digital infrastructure, support innovation ecosystems, attract skilled labor, and adopt new technologies [60]. A positive relationship between GDP per capita and regional digitalization outcomes can therefore be expected.
Together, these variables represent two complementary dimensions of digital transformation: economic resources and human capabilities. Their inclusion enabled the verification of whether regional digitalization is more associated with financial capacity, skill endowments, or a blend of both.
Employment and population were initially included as additional controls. However, robustness checks indicated that their inclusion provided little additional explanatory power once temporal persistence and spatial dependence were accounted for. To avoid unnecessary over-parameterization and in the interest of parsimony, these variables were removed from the preferred baseline specification. Appendix B Table A1 shows the full results for the alternative models.

3.4. Spatial Weight Matrix

Spatial dependence is modeled using a contiguity-based spatial weight matrix (W) in which regions sharing a common border are considered neighbors. This specification is based on the hypothesis that neighboring regions are more likely to interact through commuting flows, infrastructural linkages, policy diffusion, and knowledge exchange.
The matrix is row-standardized so that the weights assigned to neighboring regions sum to one for each observation. Standardizing the rows improves the interpretability of spatial coefficients by expressing them as average neighboring influences rather than as raw counts of neighboring regions.
A contiguity structure is particularly suitable for regional analysis in Europe, where many socio-economic interactions remain strongly influenced by territorial proximity, transport networks, and institutional cross-border linkages. Alternative weighting schemes may also provide useful information; however, the contiguity matrix offers a transparent and theoretically grounded benchmark for modeling local spatial spillovers.

3.5. Dynamic Spatial Panel Model

To jointly capture temporal persistence and spatial spillovers, the following dynamic spatial panel specification was estimated:
D i t = α D i , t 1 + ρ W D i t + β X i t + θ W X i t + μ i + λ t + ε i t
where D i t denotes the regional Digitalization Index for region i in year t ; D i , t 1 is the lagged dependent variable capturing persistence effects; W is the spatial weight matrix; ρ measures endogenous spatial dependence; X i t is a vector of explanatory variables; W X i t represents spatially lagged covariates; μ i denotes region fixed effects; λ t denotes time fixed effects; and ε i t is the idiosyncratic error term.
Including the lagged dependent variable allows digitalization to be modeled as a dynamic process in which past regional conditions continue to shape present outcomes. This is consistent with self-reinforcing mechanisms and historically conditioned regional trajectories discussed in the literature [6,44].
The Spatial Durbin Model (SDM) framework is particularly valuable because it permits the simultaneous estimation of direct regional effects, indirect spillover effects, and total effects. Accordingly, the model enables the empirical identification of whether neighboring development generates diffusion dynamics (convergence) or competition-driven polarization effects (divergence).

3.6. Model Selection Strategy

Model specification follows a sequential selection strategy beginning with non-spatial panel estimators and subsequently introducing spatial dependence and dynamic persistence components. This stepwise approach allows for a systematic evaluation of the contribution of each modeling feature.
The analysis first considers conventional panel models, followed by Spatial Autoregressive (SAR) and Spatial Durbin model (SDM) specifications. The Hausman test indicates that fixed effects should be used instead of random effects to show that unobserved regional heterogeneity is correlated with the explanatory variables.
The SDM framework is particularly attractive among the spatial alternatives as it considers both endogenous interaction effects (i.e., spatial lag of the dependent variable) and exogenous interaction effects (i.e., spatially lagged explanatory variables). This reduces the risk of omitted-spillover bias that might occur in more restrictive SAR specifications.
Final model selection was based on overall statistical performance, economic interpretability, and parsimony. In Section 4.4, we report comparative evidence from alternative specifications by reporting AIC values, log-likelihood statistics, and coefficient stability to identify the preferred specification. The dynamic SDM was maintained as the benchmark estimator, as it achieves an optimal balance between model fit and theoretical consistency without unwarranted over-parameterization.
In an observational setting, potential endogeneity, especially reverse causality between economic development and digitalization, cannot be ruled out completely. However, the chosen dynamic spatial panel framework provides a structured means of overcoming these concerns. The model can capture temporal adjustment processes and interregional interactions through the use of lagged dependent variables, spatial dependence and key control variables, thus reducing the risk of omitted-variable and simultaneity biases, although they cannot be completely eliminated.

3.7. Sustainability Interpretation Framework

The econometric framework also makes it possible to interpret the results in the context of sustainable regional development. Specifically, the estimated relationships map to three broader mechanisms.
First, the positive lagged effects imply long-term persistence, suggesting that digital advantages or disadvantages can accumulate over time. This is particularly true for territorial cohesion, where regions starting from a disadvantaged position may find it harder to catch up without specific interventions.
Second, positive spillovers imply diffusion processes, where neighboring regions benefit from knowledge exchange, imitation, shared infrastructure and interregional cooperation. These effects generally conform to development paths associated with regional convergence.
Third, negative spillovers to neighbors show competitive polarization, where stronger neighbors can attract talent, investment, firms or digital resources from weaker ones. Such processes may intensify core and periphery inequalities and may compromise balanced regional development.
Together, multidimensional measurement and dynamic spatial modeling enable the analysis of digitalization as a territorially embedded development process shaped by infrastructure, human capital, institutional capacity, and inherited development patterns. This perspective is very important for the analysis of the compatibility of digital transformation with the long-term sustainability and cohesion objectives of Europe.

4. Results

4.1. Construction and Validation of the Digitalization Index

The Regional Digitalization Index was developed through the Principal Component Analysis (PCA) method based on three main dimensions of digital development: household internet access, internet usage by individuals, and access to digital public services. The first principal component accounts for 80.41% of the total variance (eigenvalue = 2.412), indicating a strong common dimension underlying regional digital development.
The sampling adequacy is satisfactory (Kaiser–Meyer–Olkin statistic, KMO = 0.7097), and Cronbach’s alpha shows strong internal consistency (α = 0.8777). These results, taken together, suggest that the composite indicator reflects the underlying concept in a reliable and coherent manner. The factor loadings also indicate that each of the three dimensions contributes significantly to the index.
The resulting measure is therefore best conceived of as a multidimensional indicator of regional digital capacity and realized digital outcomes rather than a narrow infrastructural proxy. This interpretation is consistent with wider perspectives that focus on effective digital capabilities rather than single-indicator measures of access.

4.2. Spatial Distribution and Descriptive Dynamics

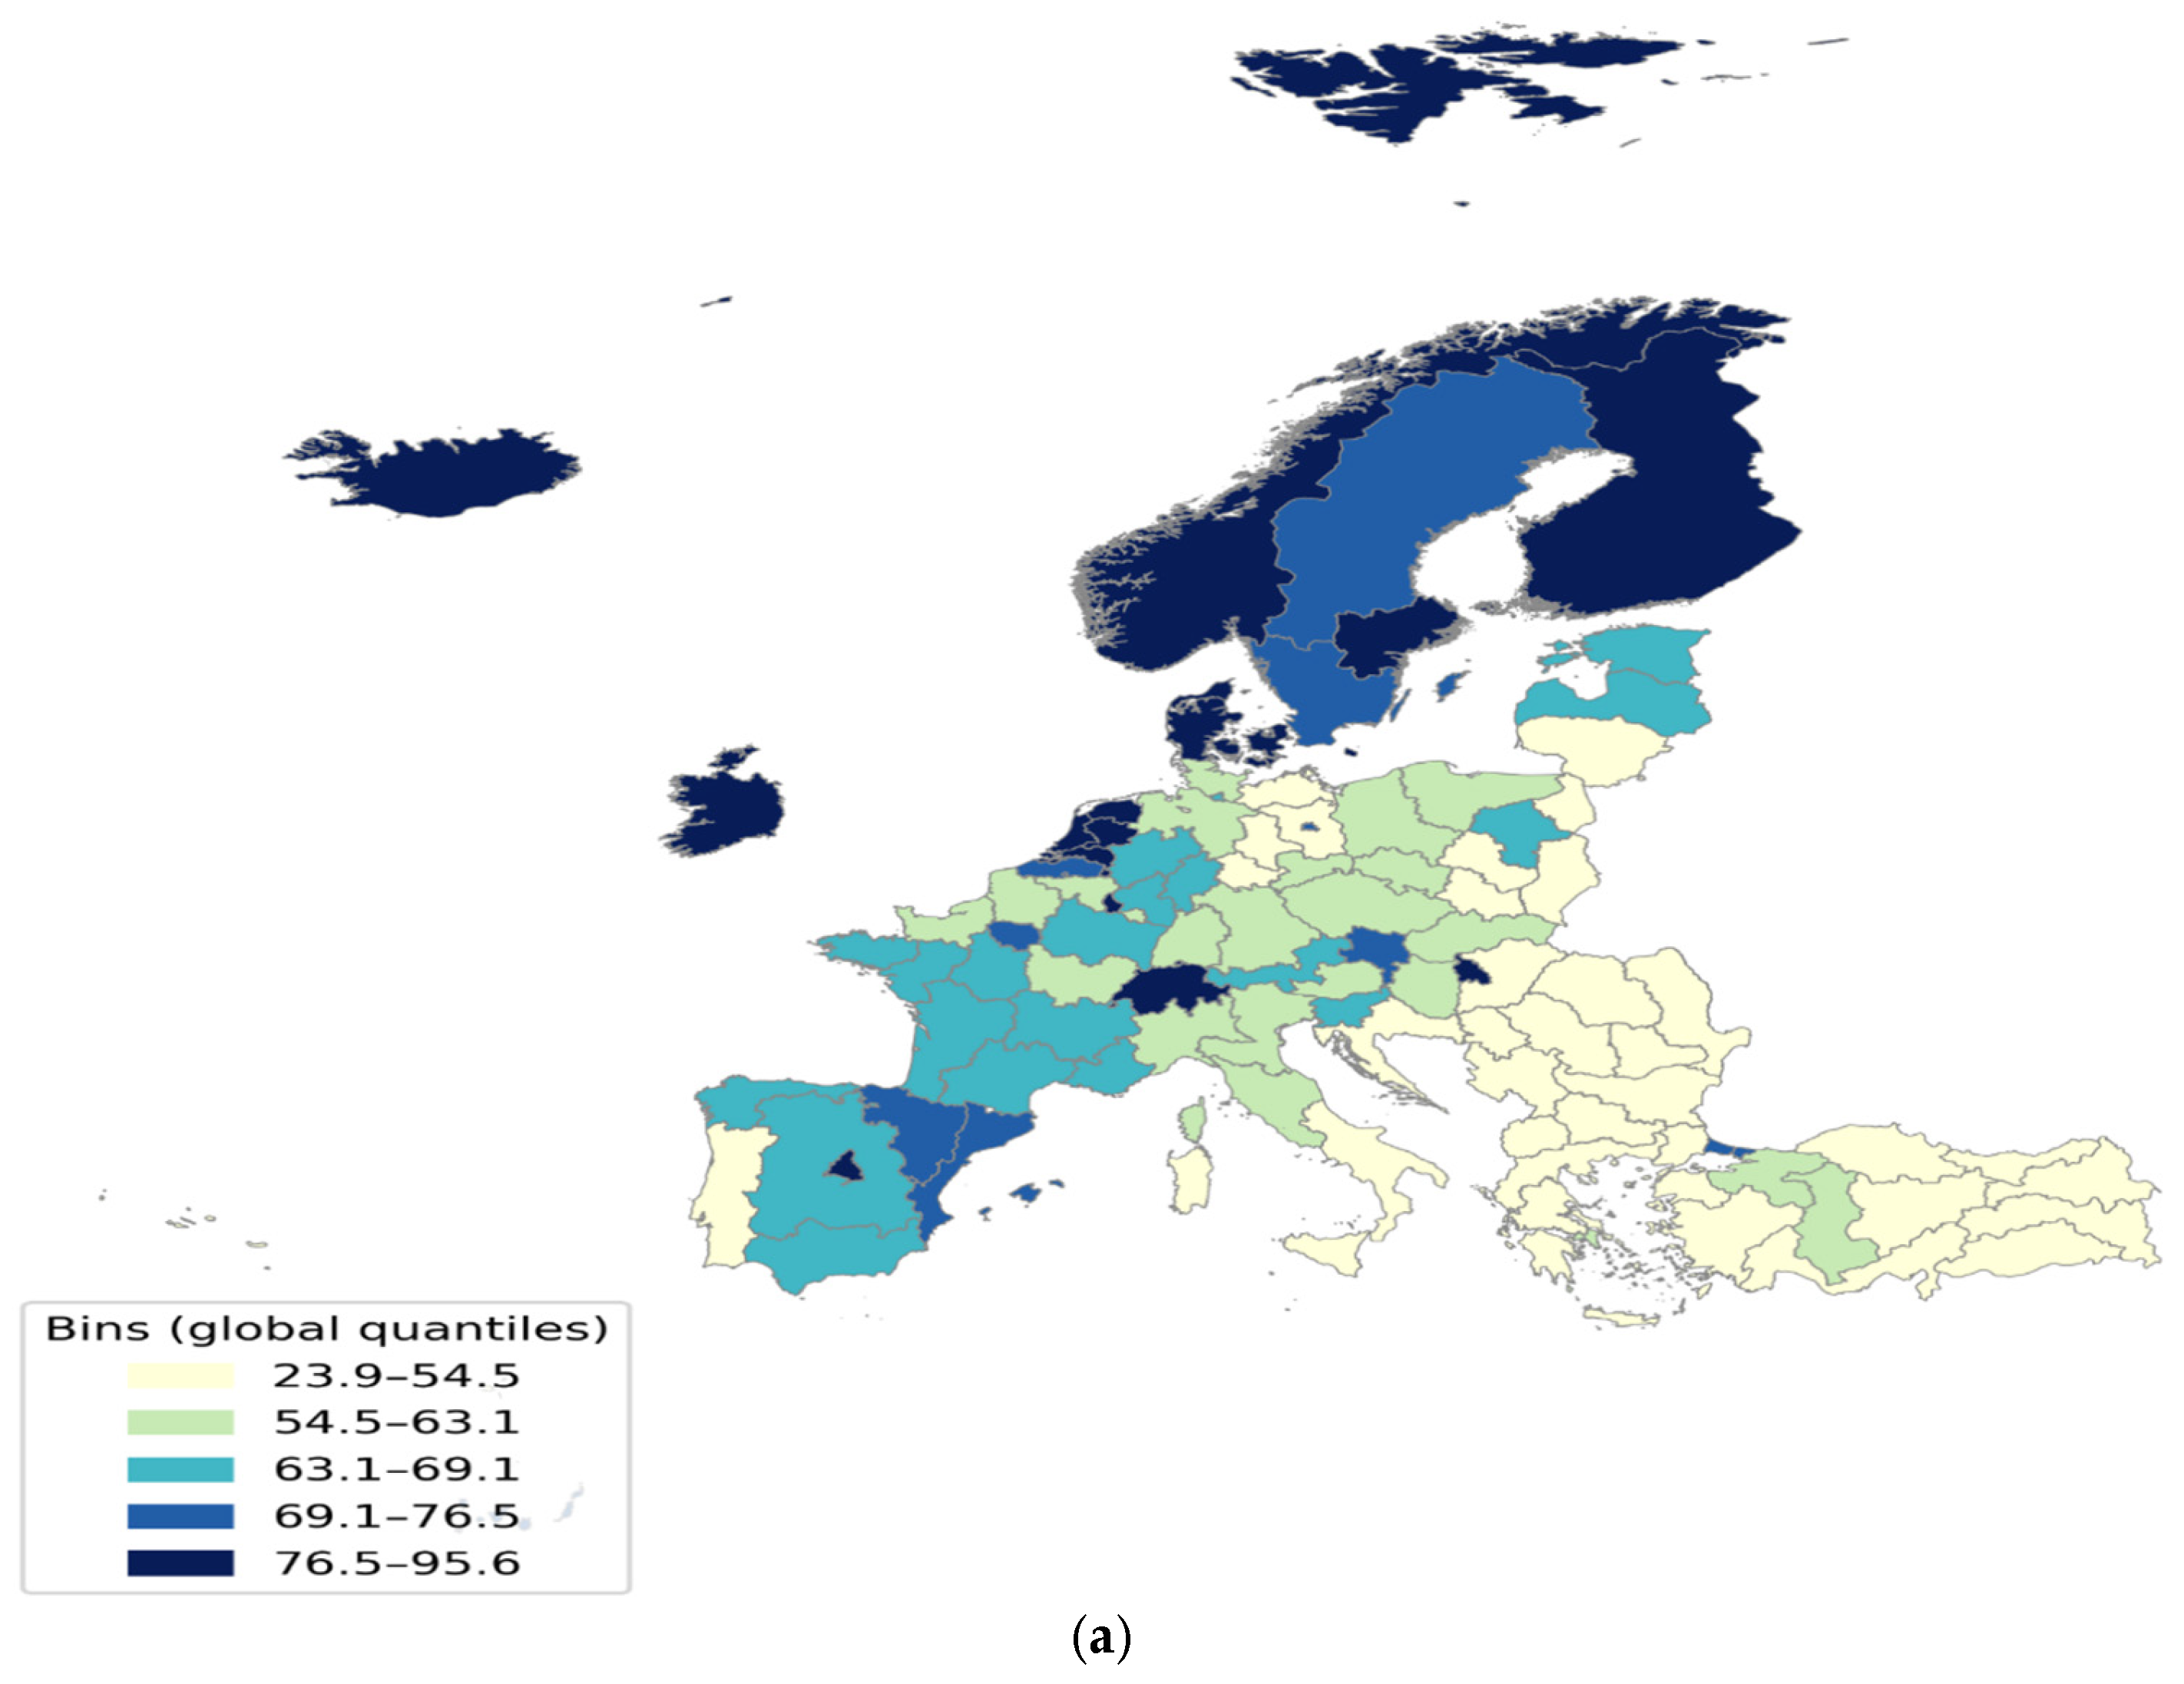
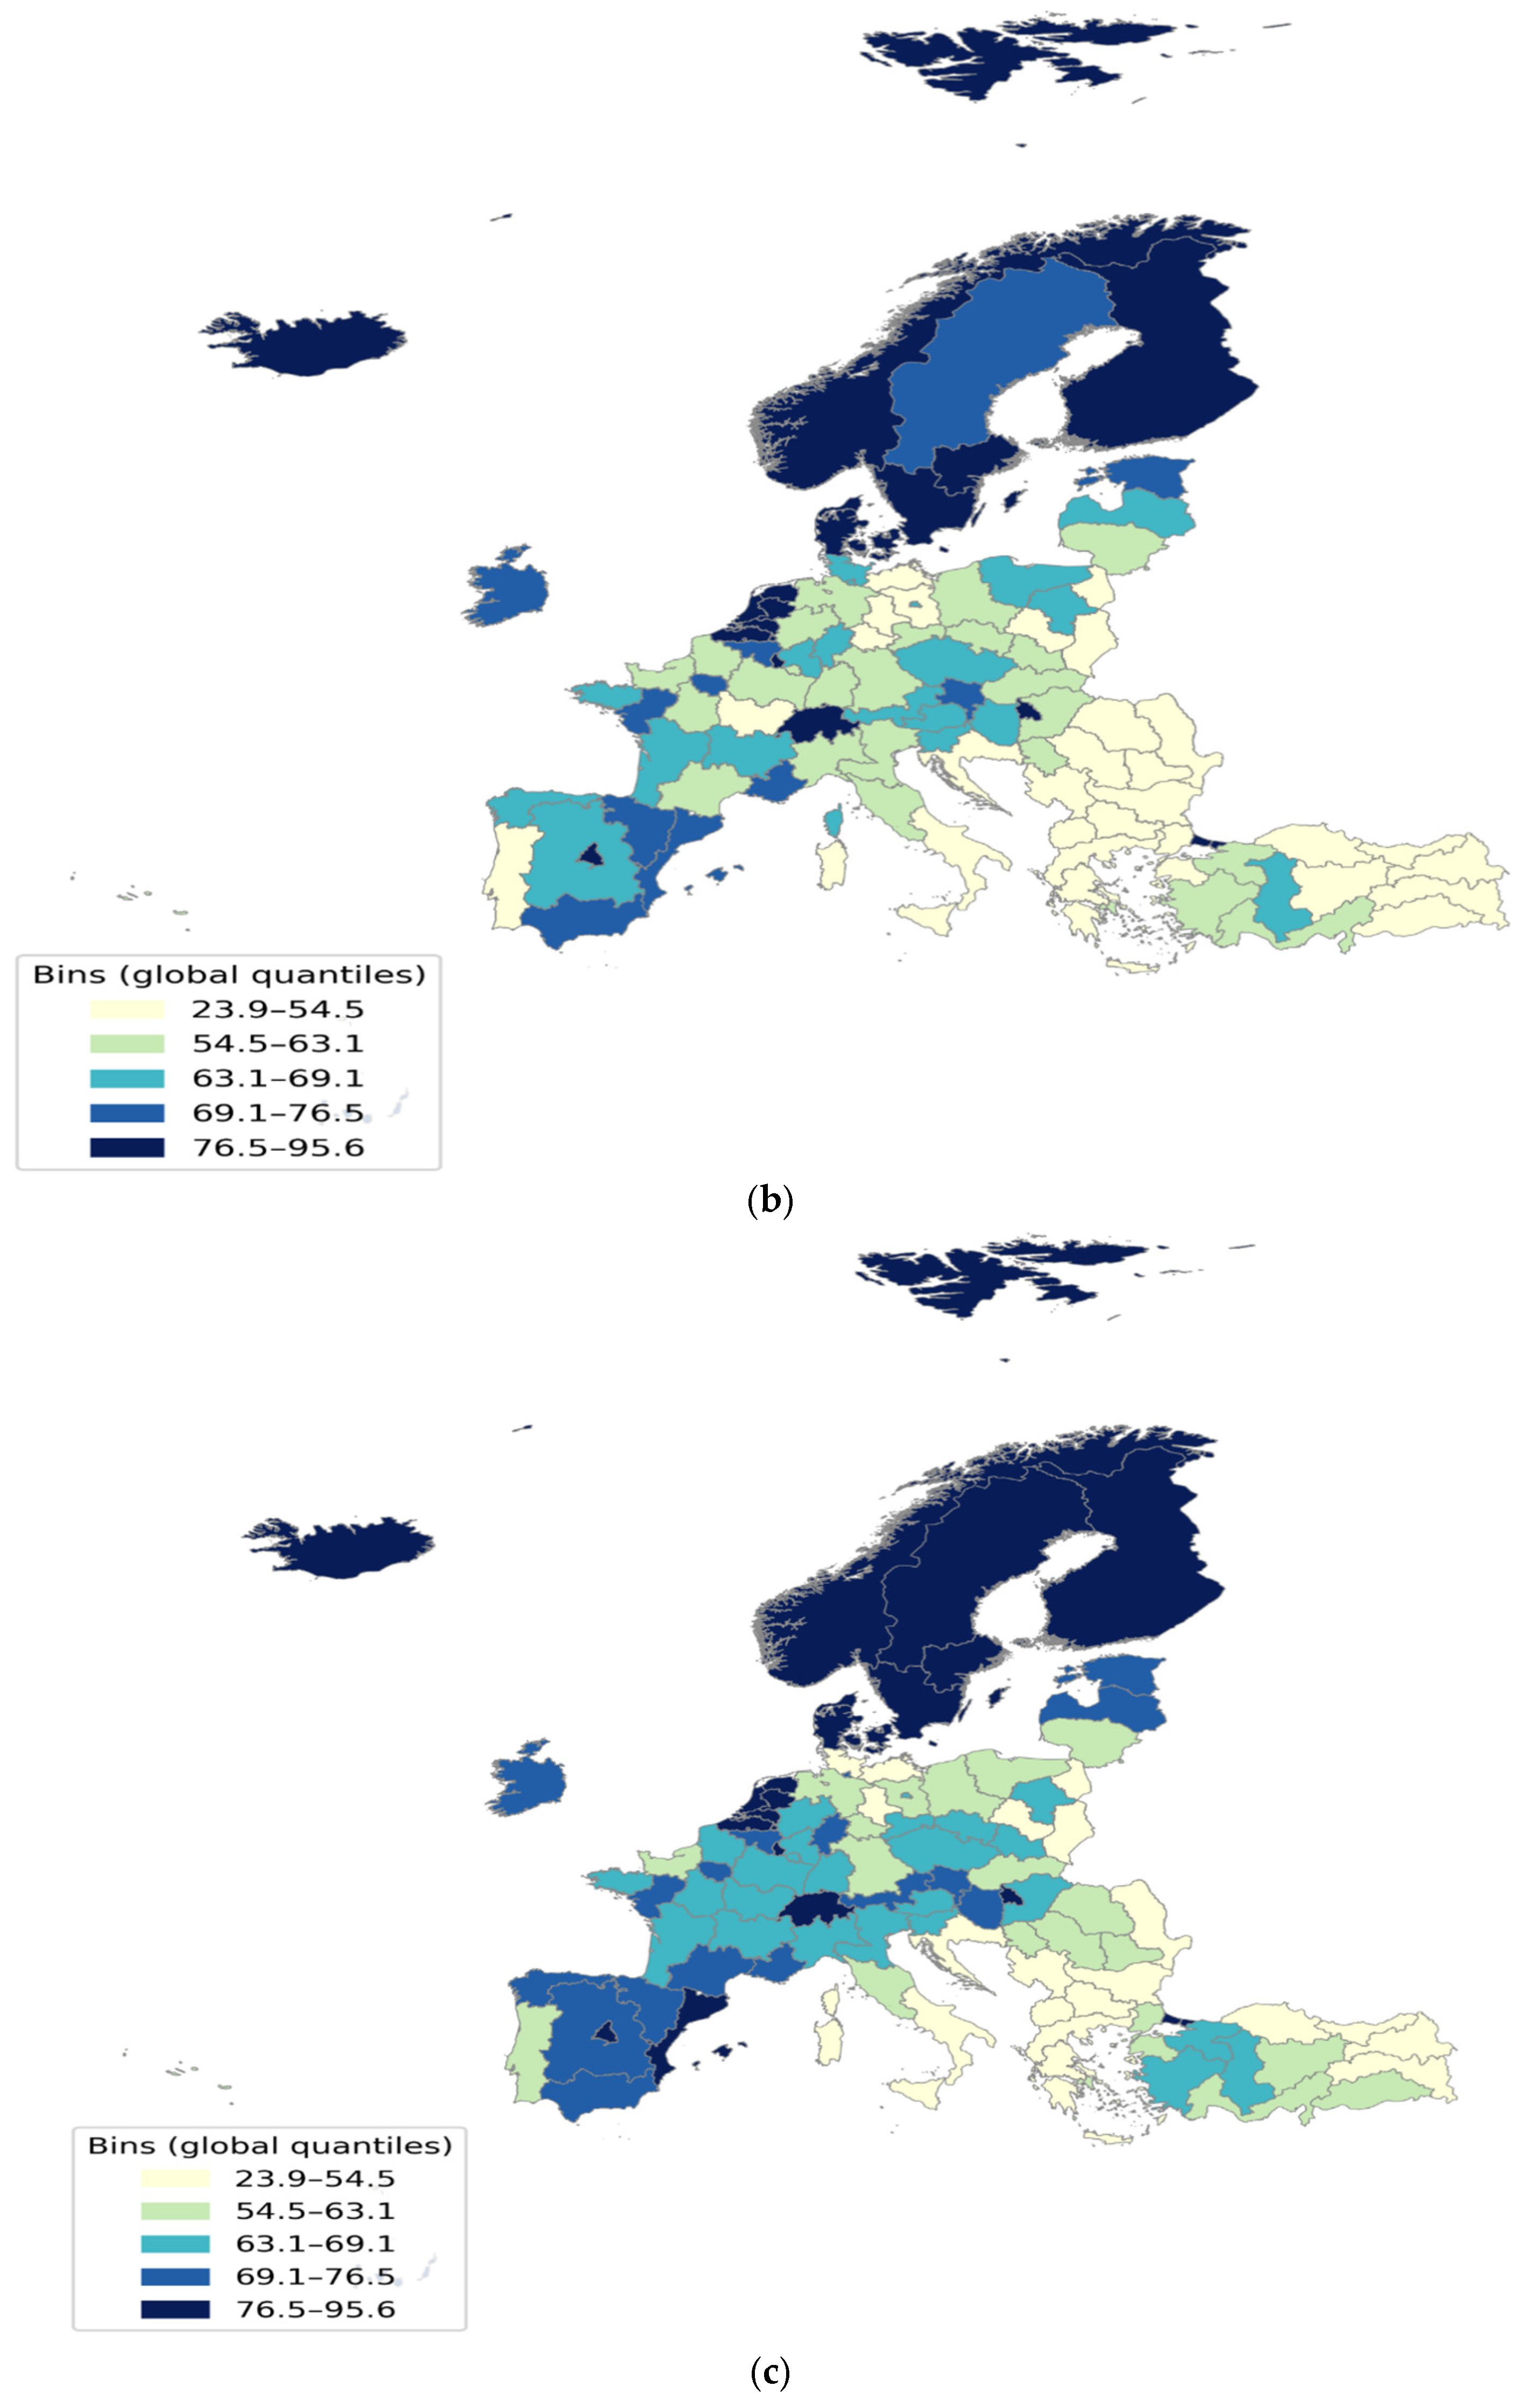
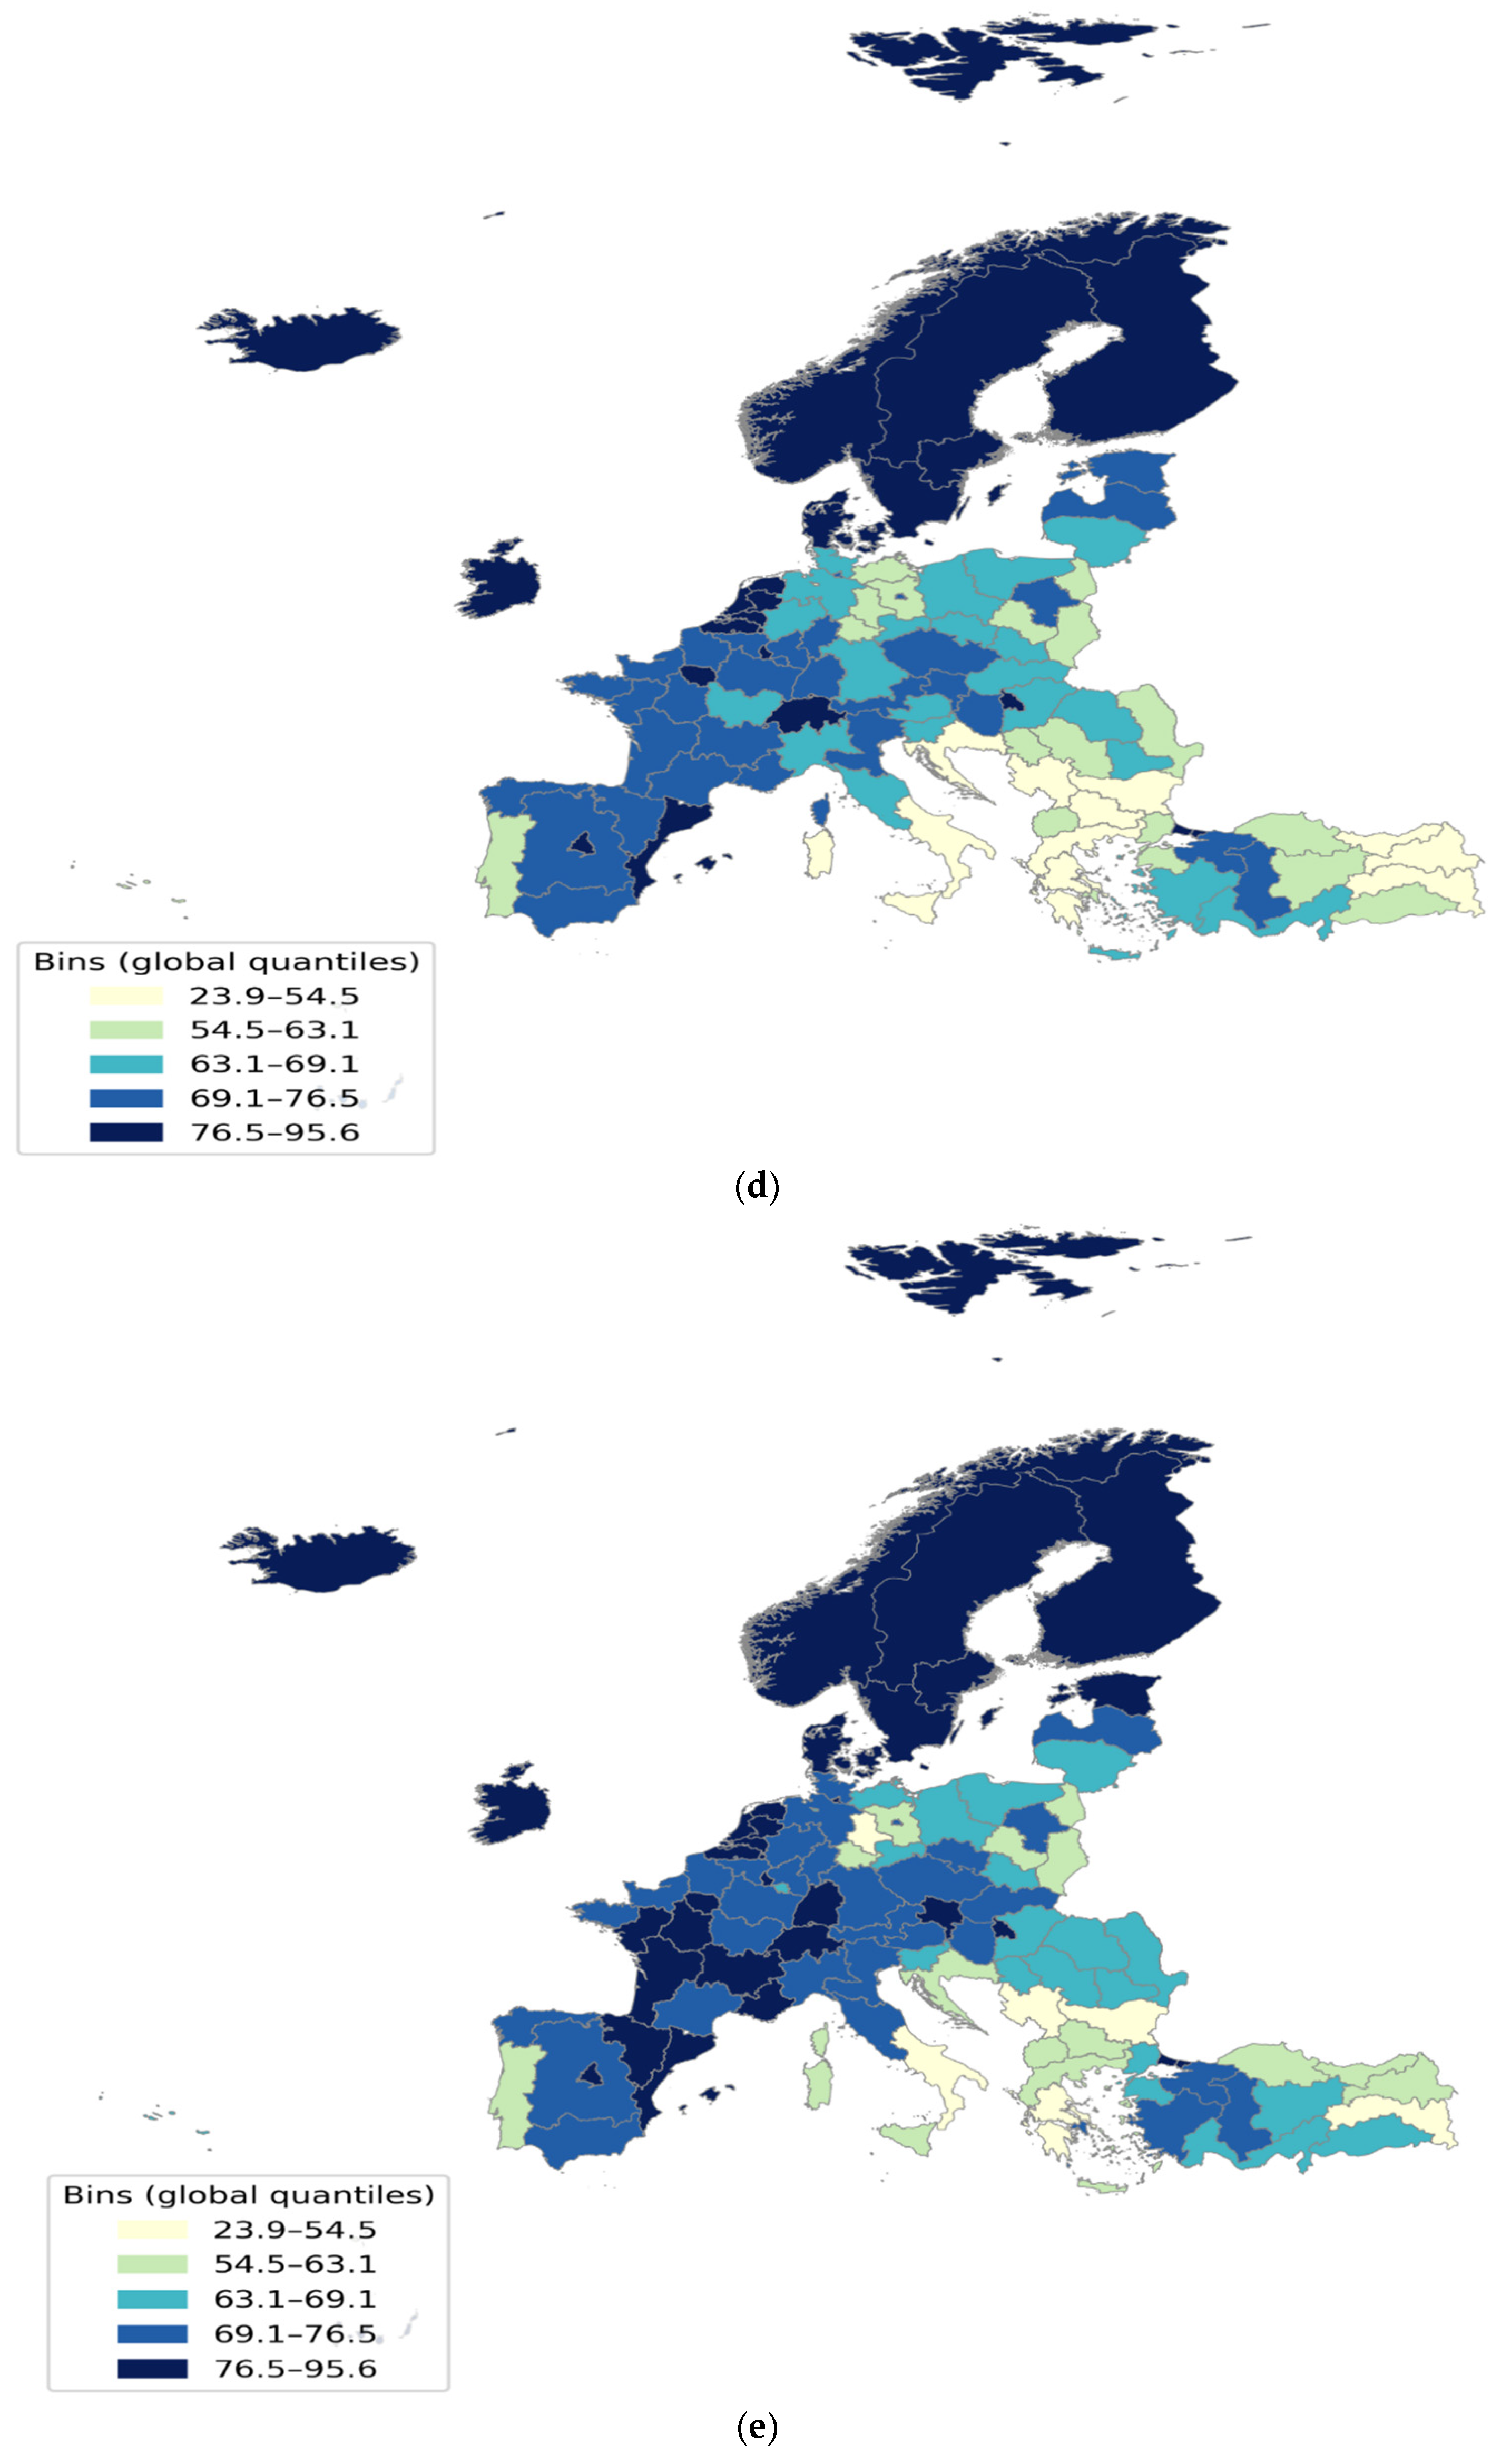
The spatial pattern of the Digitalization Index for the European NUTS-1 regions shows strong and persistent regional clustering. Figure 1, with a common color scale, illustrates that digitally advanced regions are mainly concentrated in Northern and Western Europe, while lower-performing regions are more often found in Southern and Eastern Europe.
The overall spatial patterns did not change significantly between 2021 and 2025, meaning that regional digital hierarchies changed only slowly during the sample period. Although several initially lagging regions recorded moderate improvements, these gains were generally not large enough to alter the broader European spatial pattern of digital development.
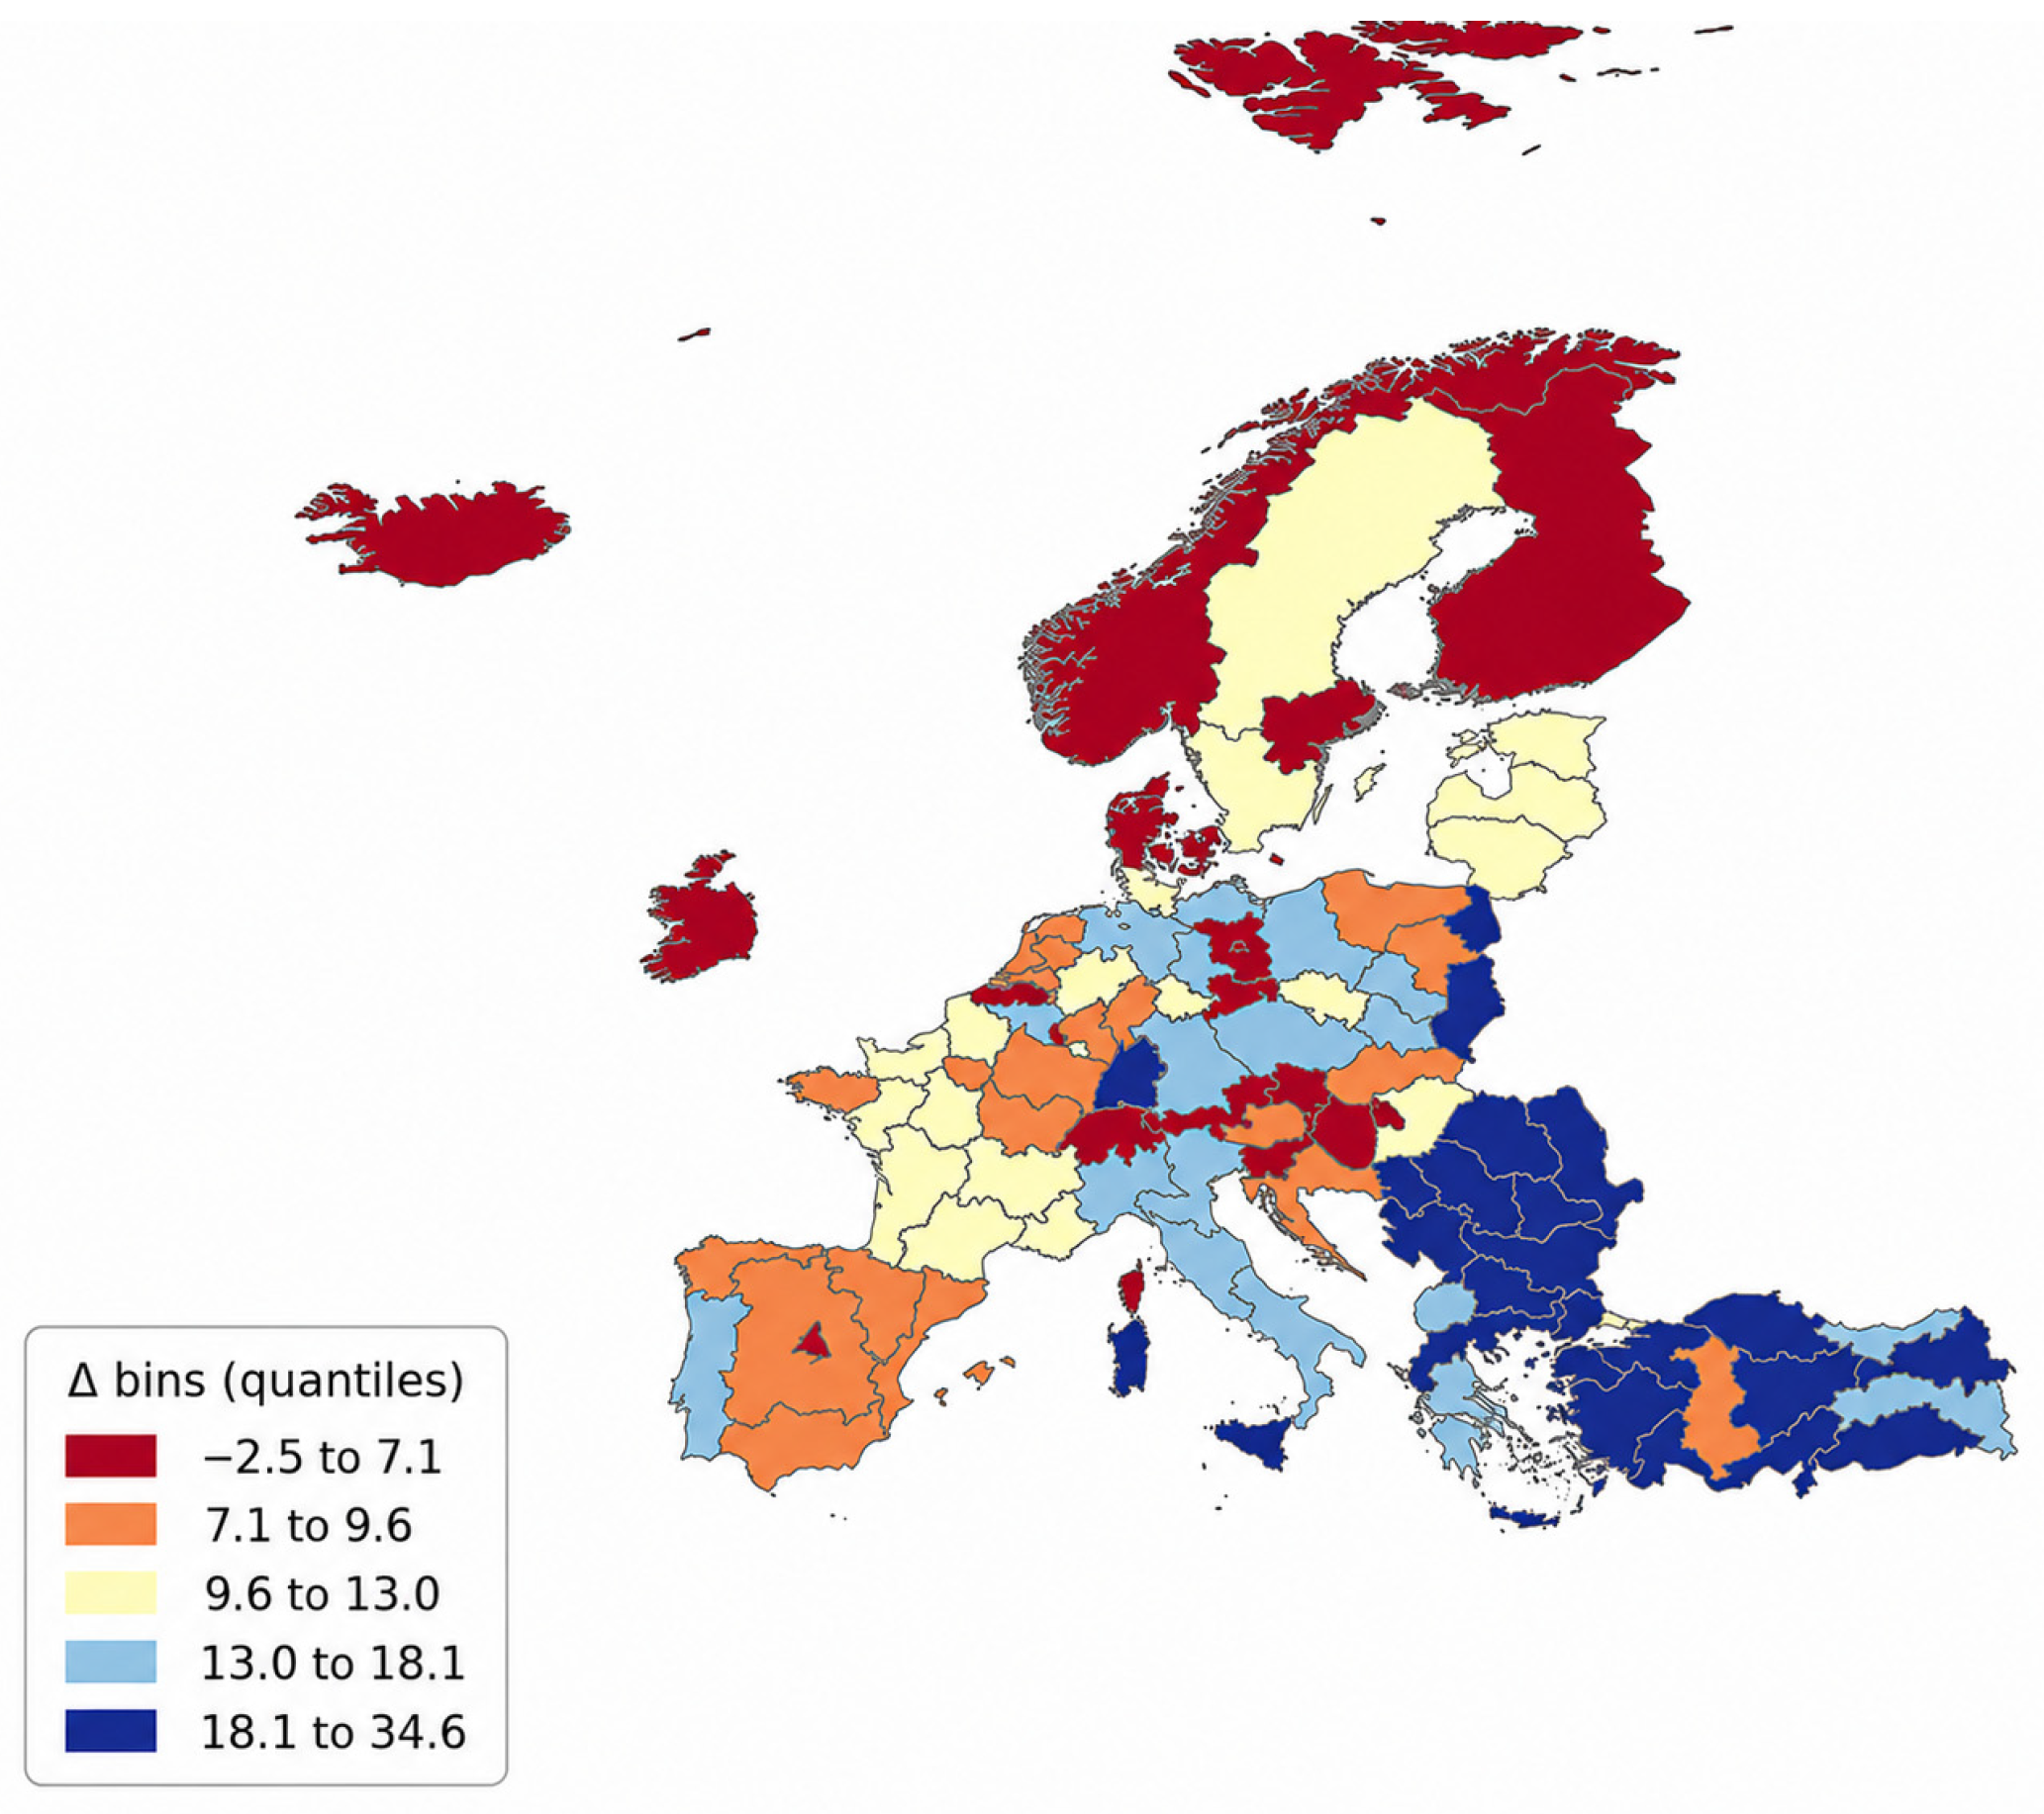
Figure 2 presents the absolute changes in regional digitalization from 2021 to 2025. Some peripheral regions achieved measurable progress, but leading regions also continued to advance. As a result, relative convergence remained limited: digital leaders largely preserved their advantage, while lagging territories reduced their gaps only modestly.
Overall, the descriptive evidence suggests more cumulative digital development trajectories than rapid spatial equalization in digital capacity. These initial patterns were examined more closely, as described in the following subsection, using spatial autocorrelation tests and local cluster analysis.

4.3. Global Spatial Autocorrelation and Local Spatial Clustering

Global Moran’s I statistics indicate strong and statistically significant positive spatial autocorrelation throughout the sample period. As reported in Table 2, Moran’s I values ranged between 0.415 and 0.483 (p < 0.01), indicating that regions with similar digitalization levels tend to be geographically concentrated.
The consistently positive values indicate stable clustering of both digitally advanced and digitally lagging regions over time. This finding supports the use of spatial econometric models rather than non-spatial alternatives.
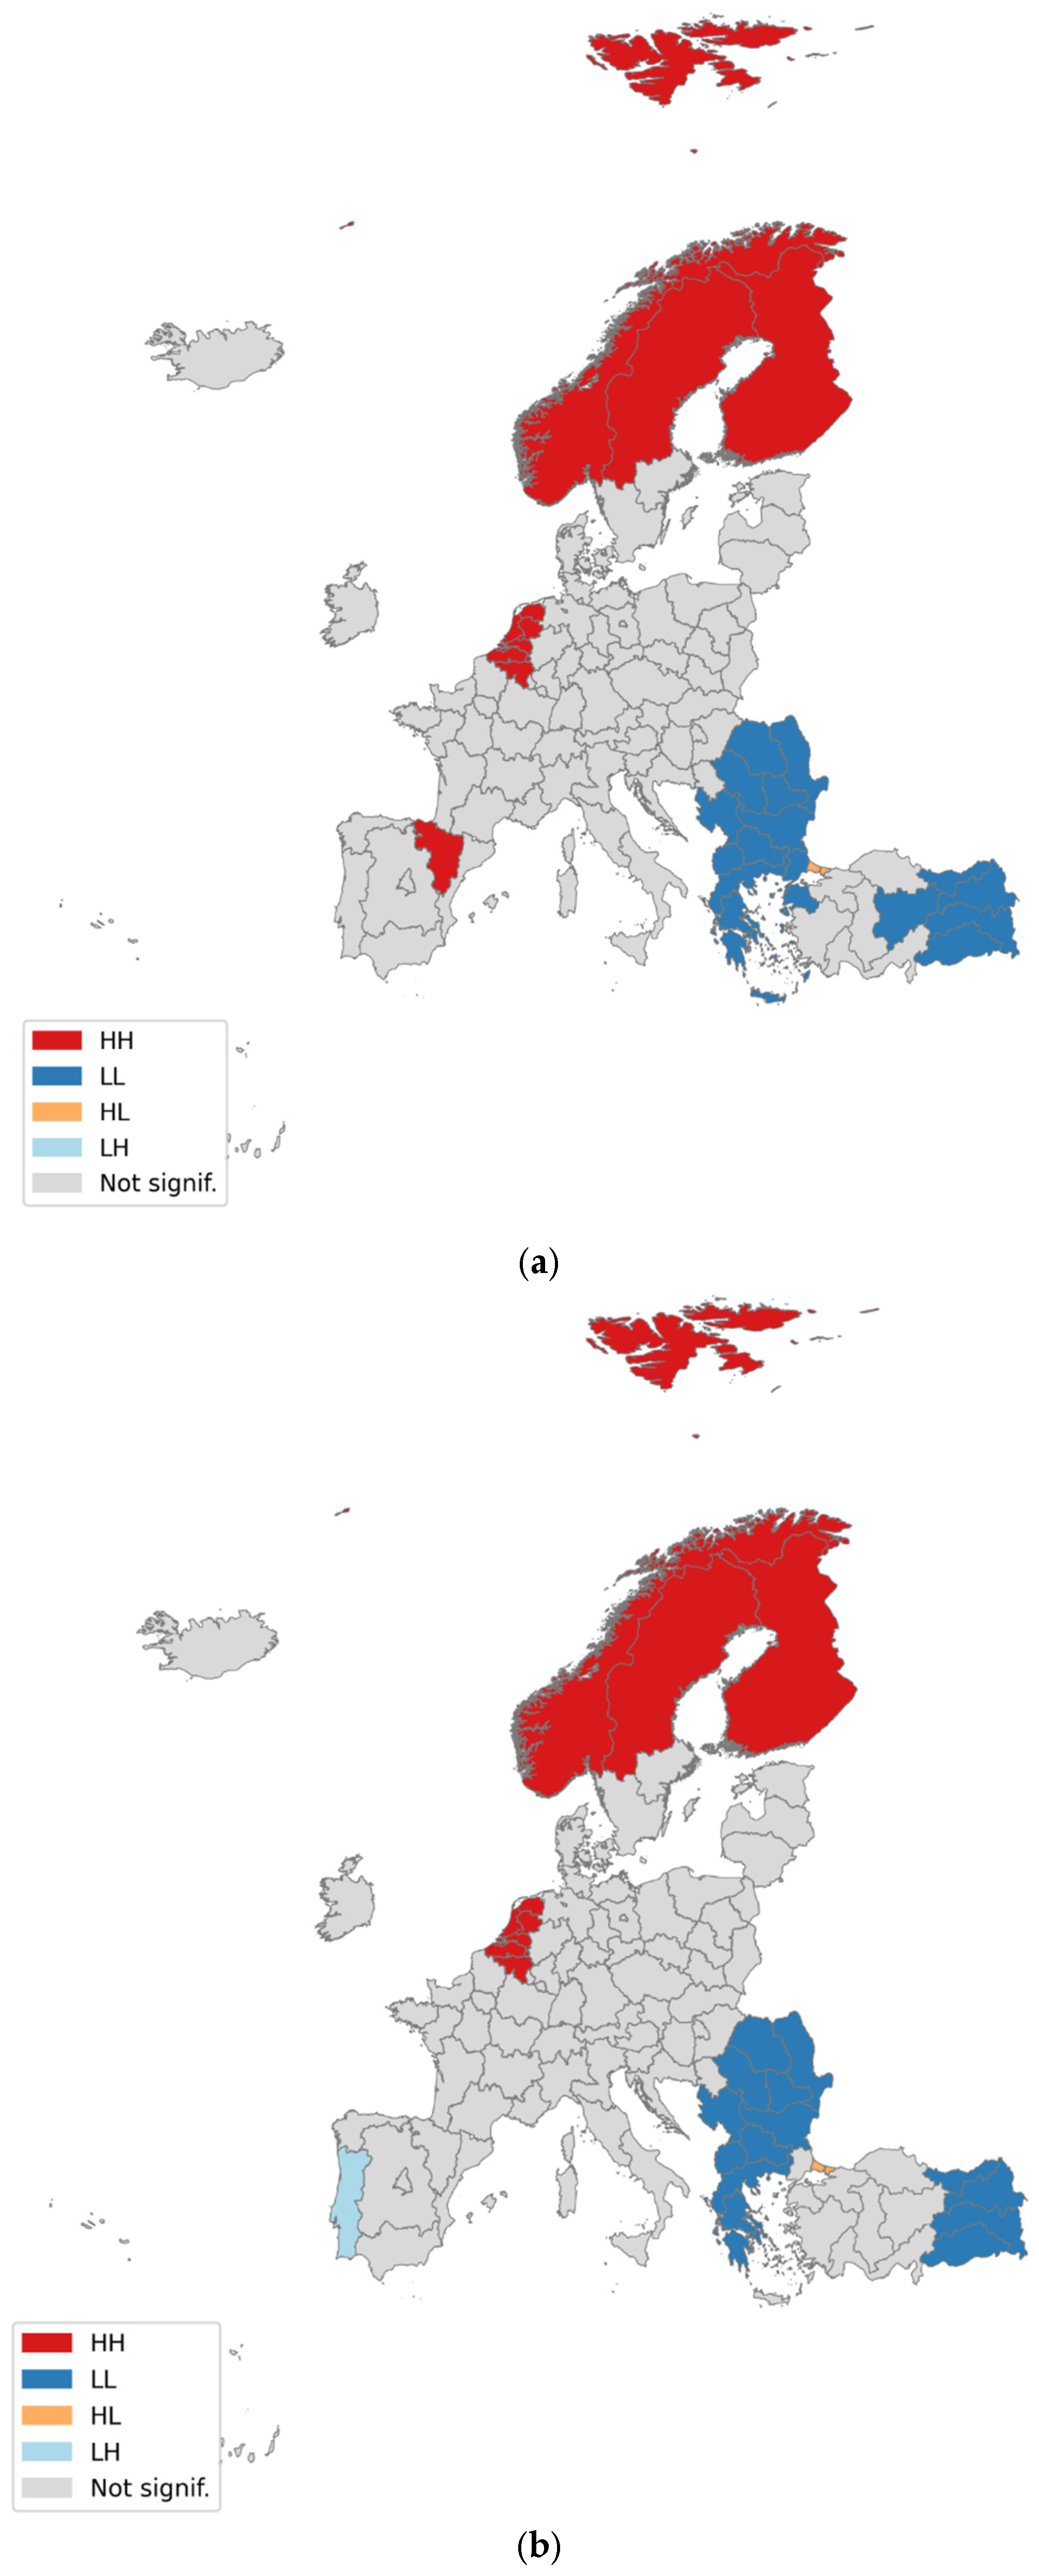
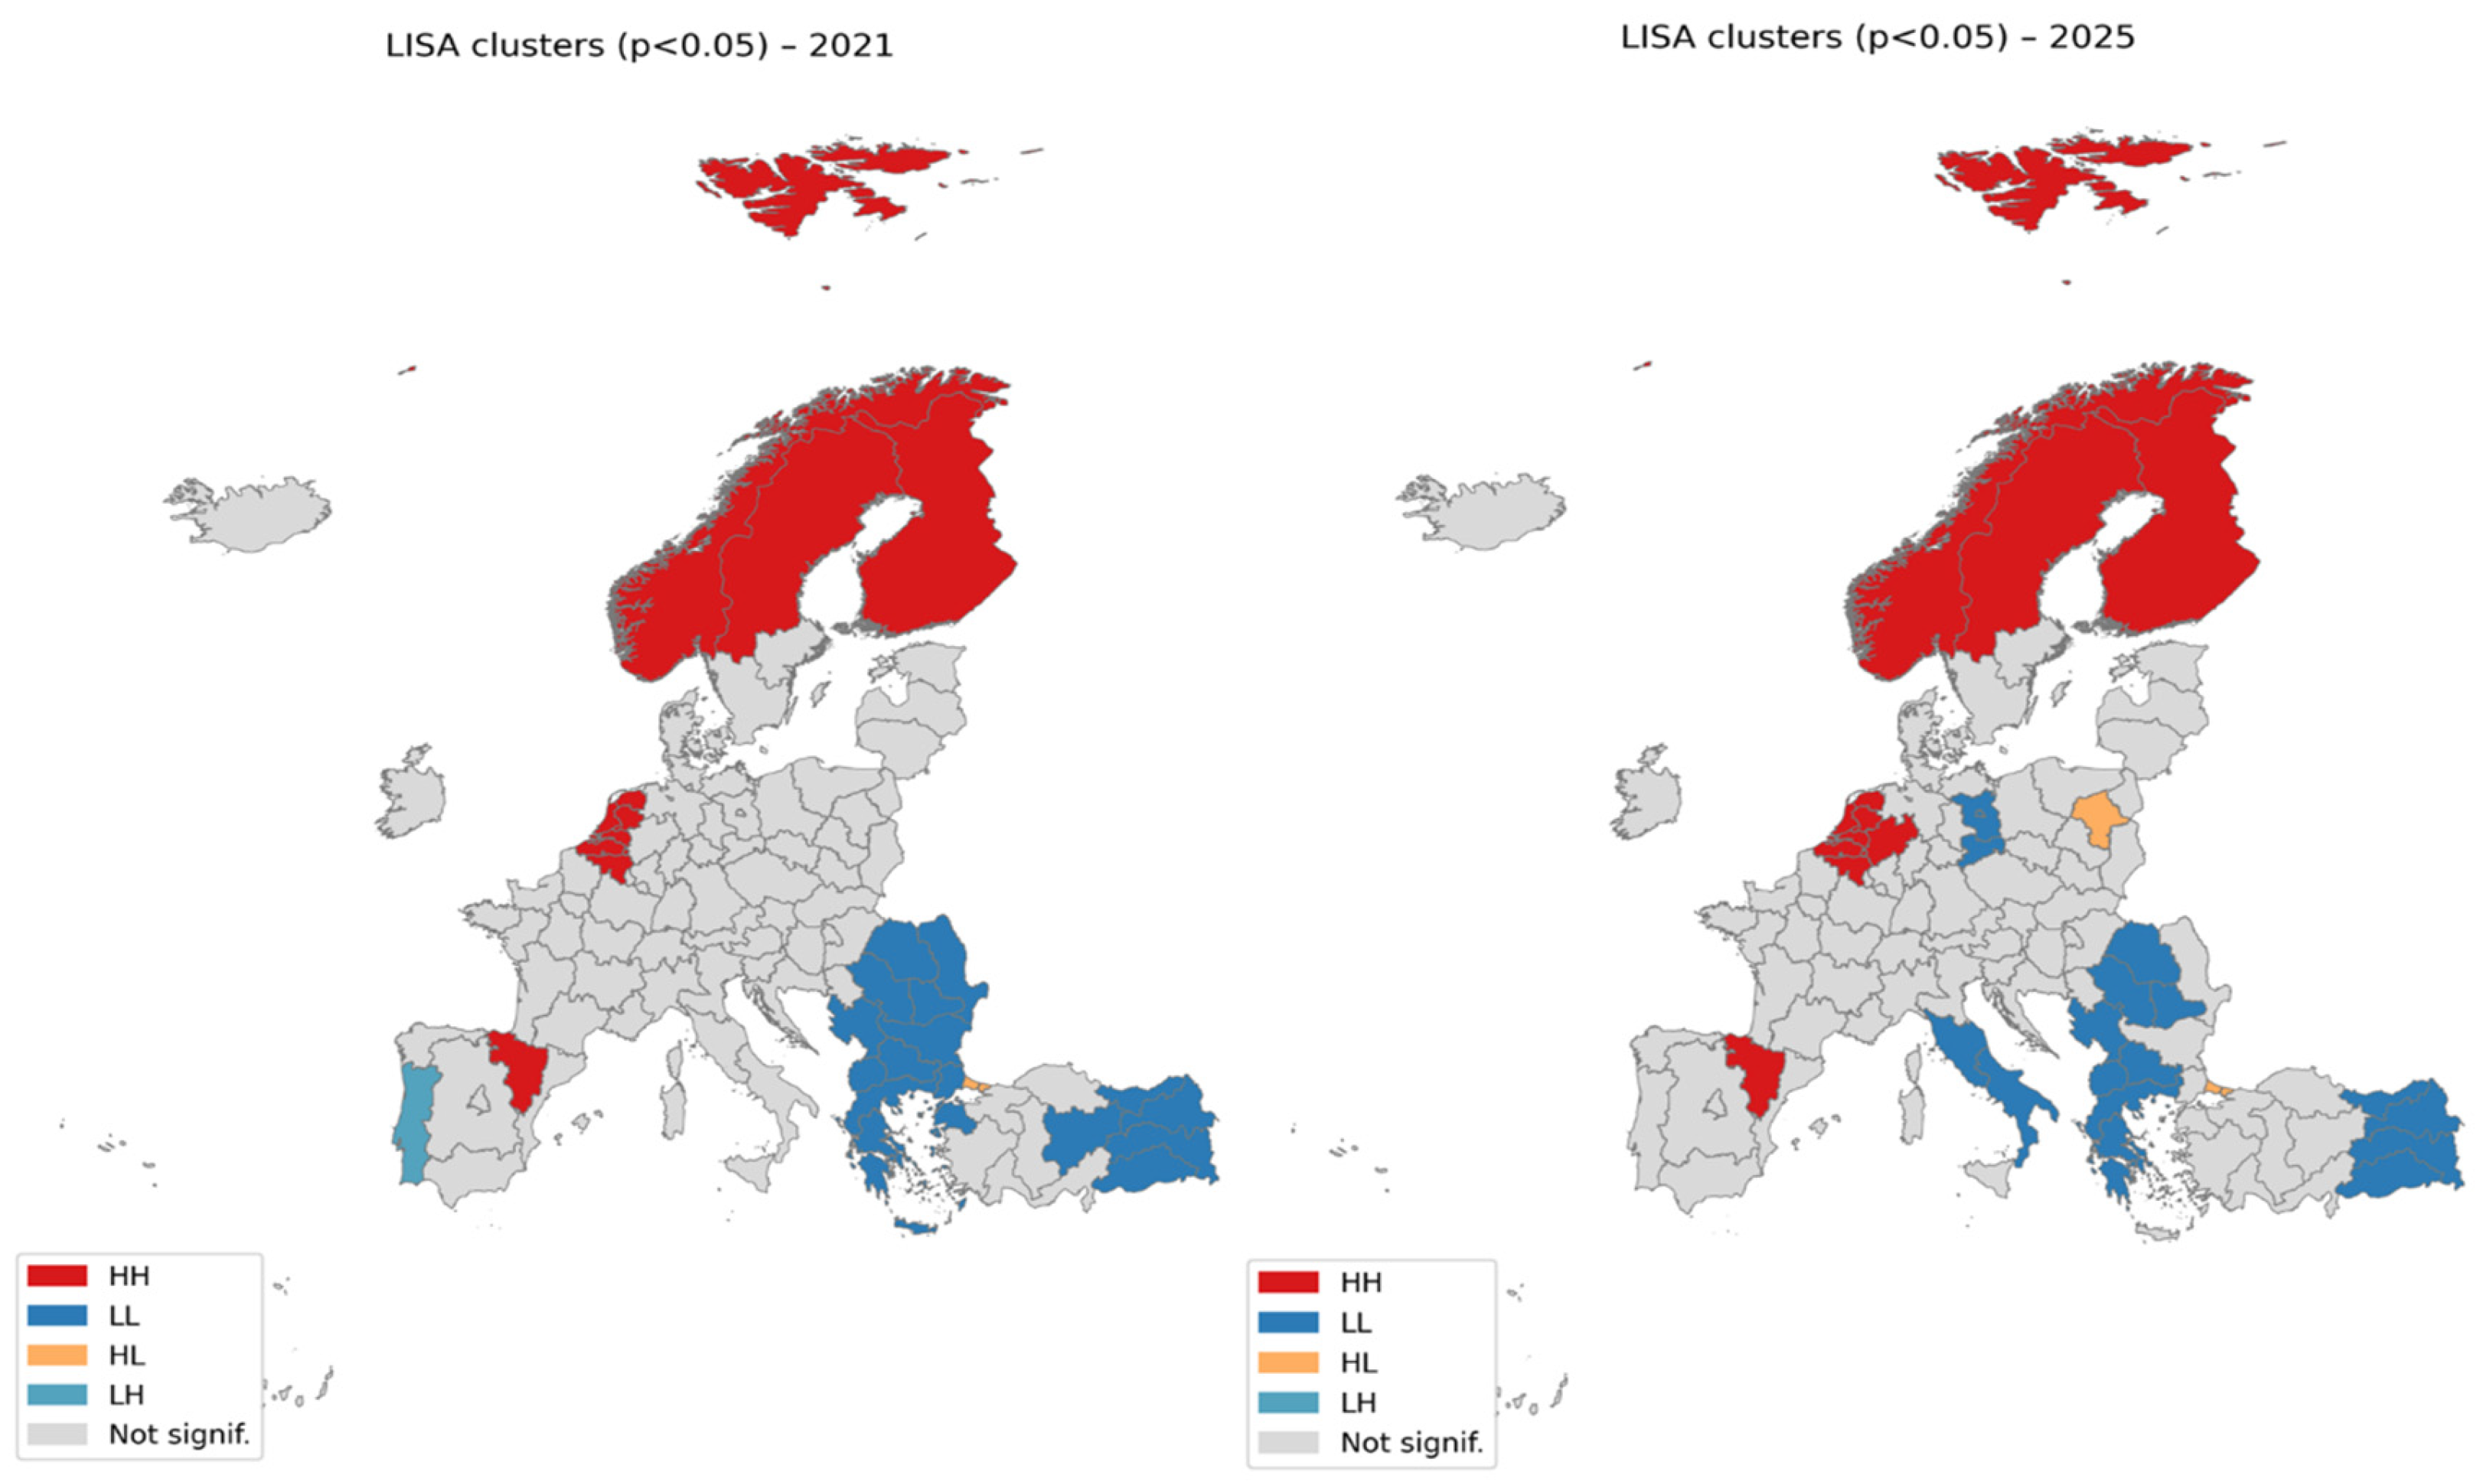
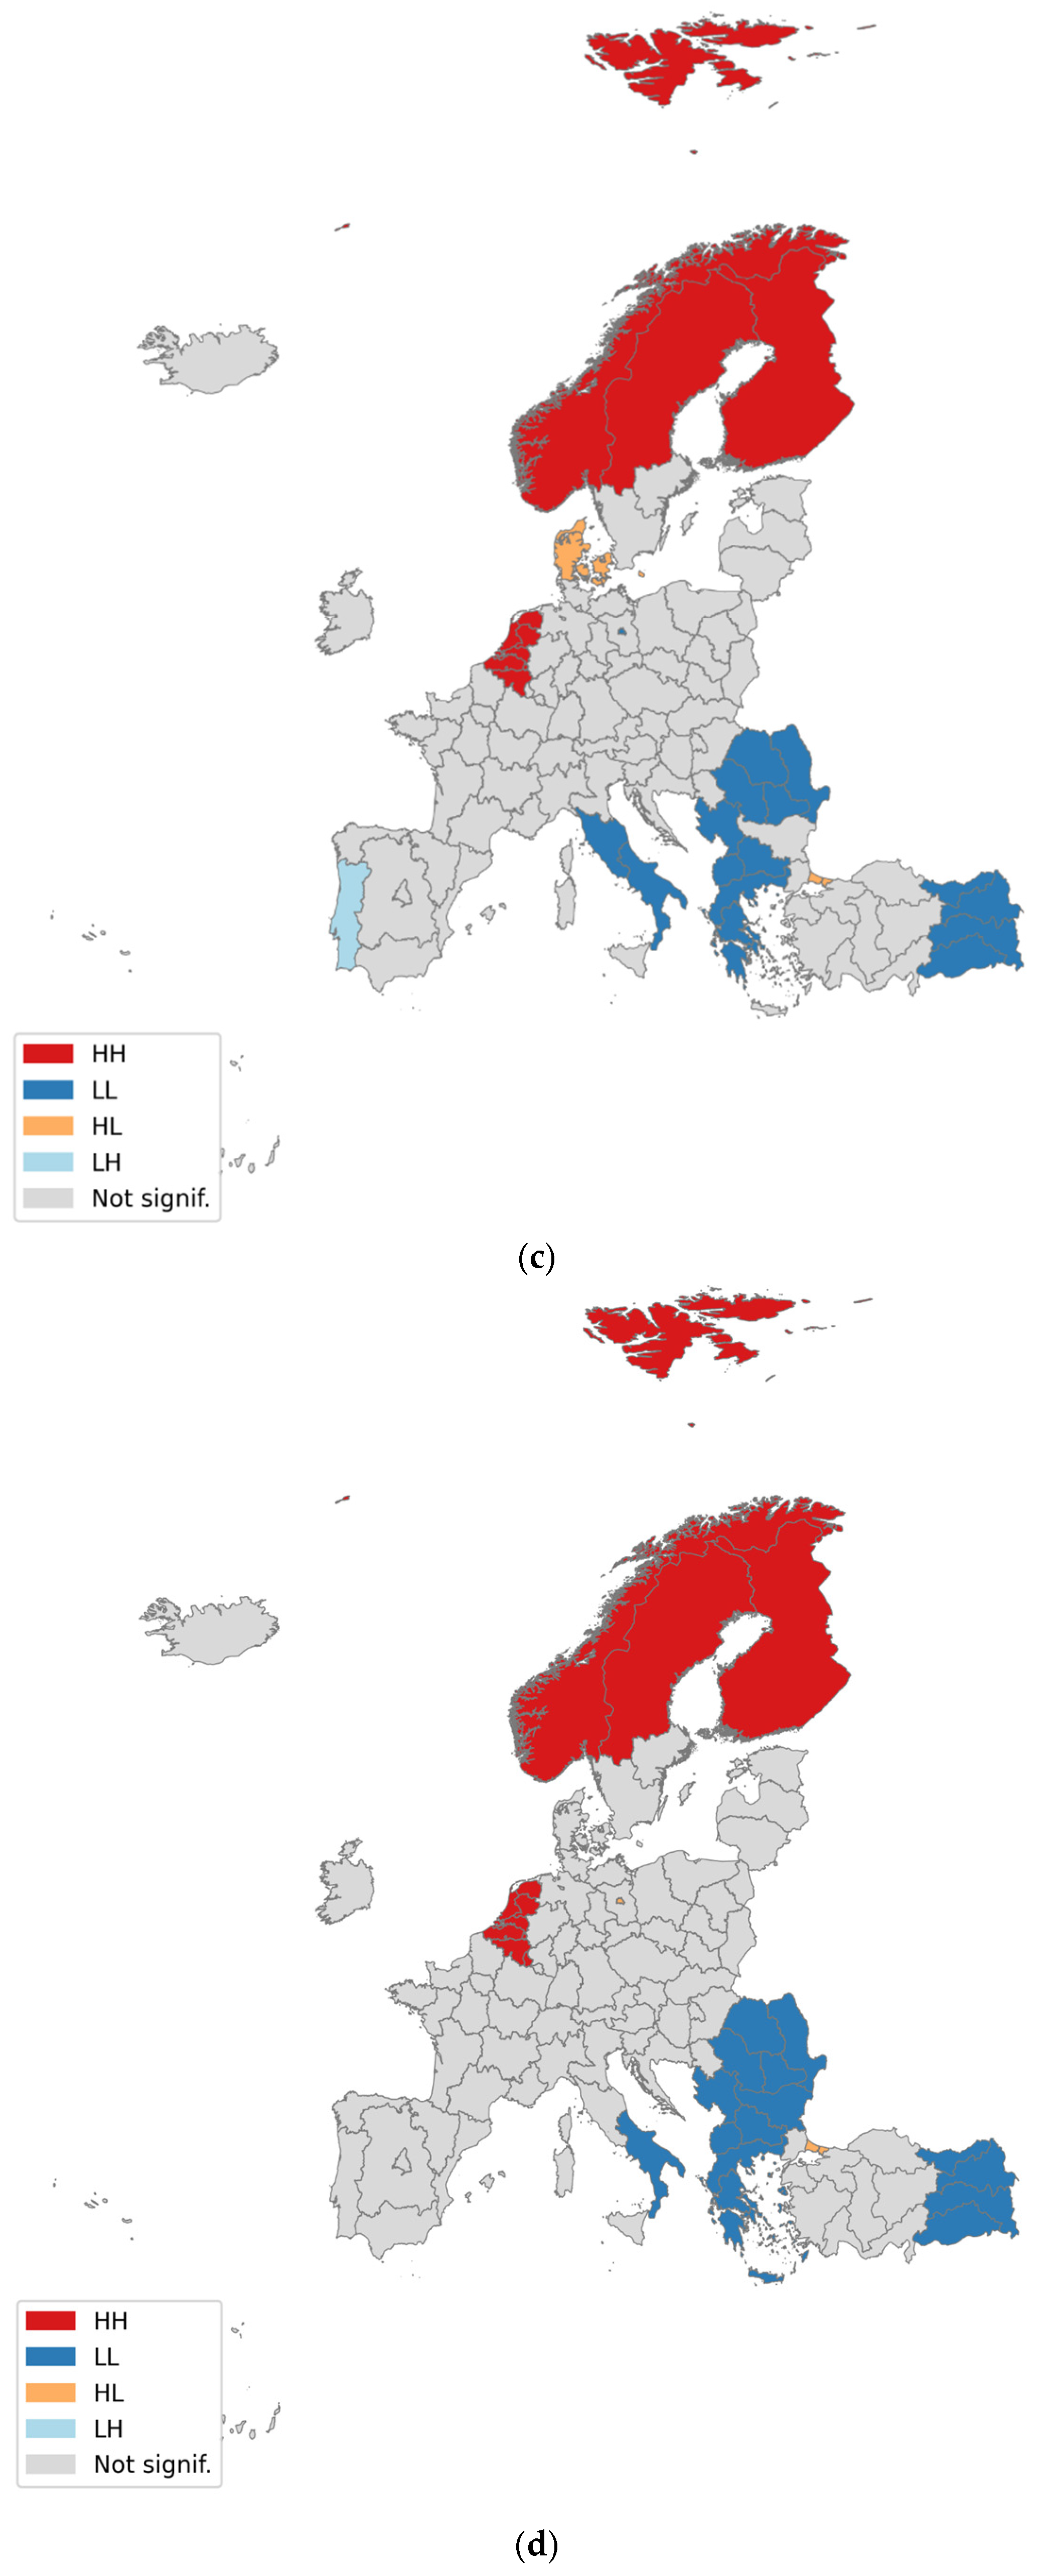
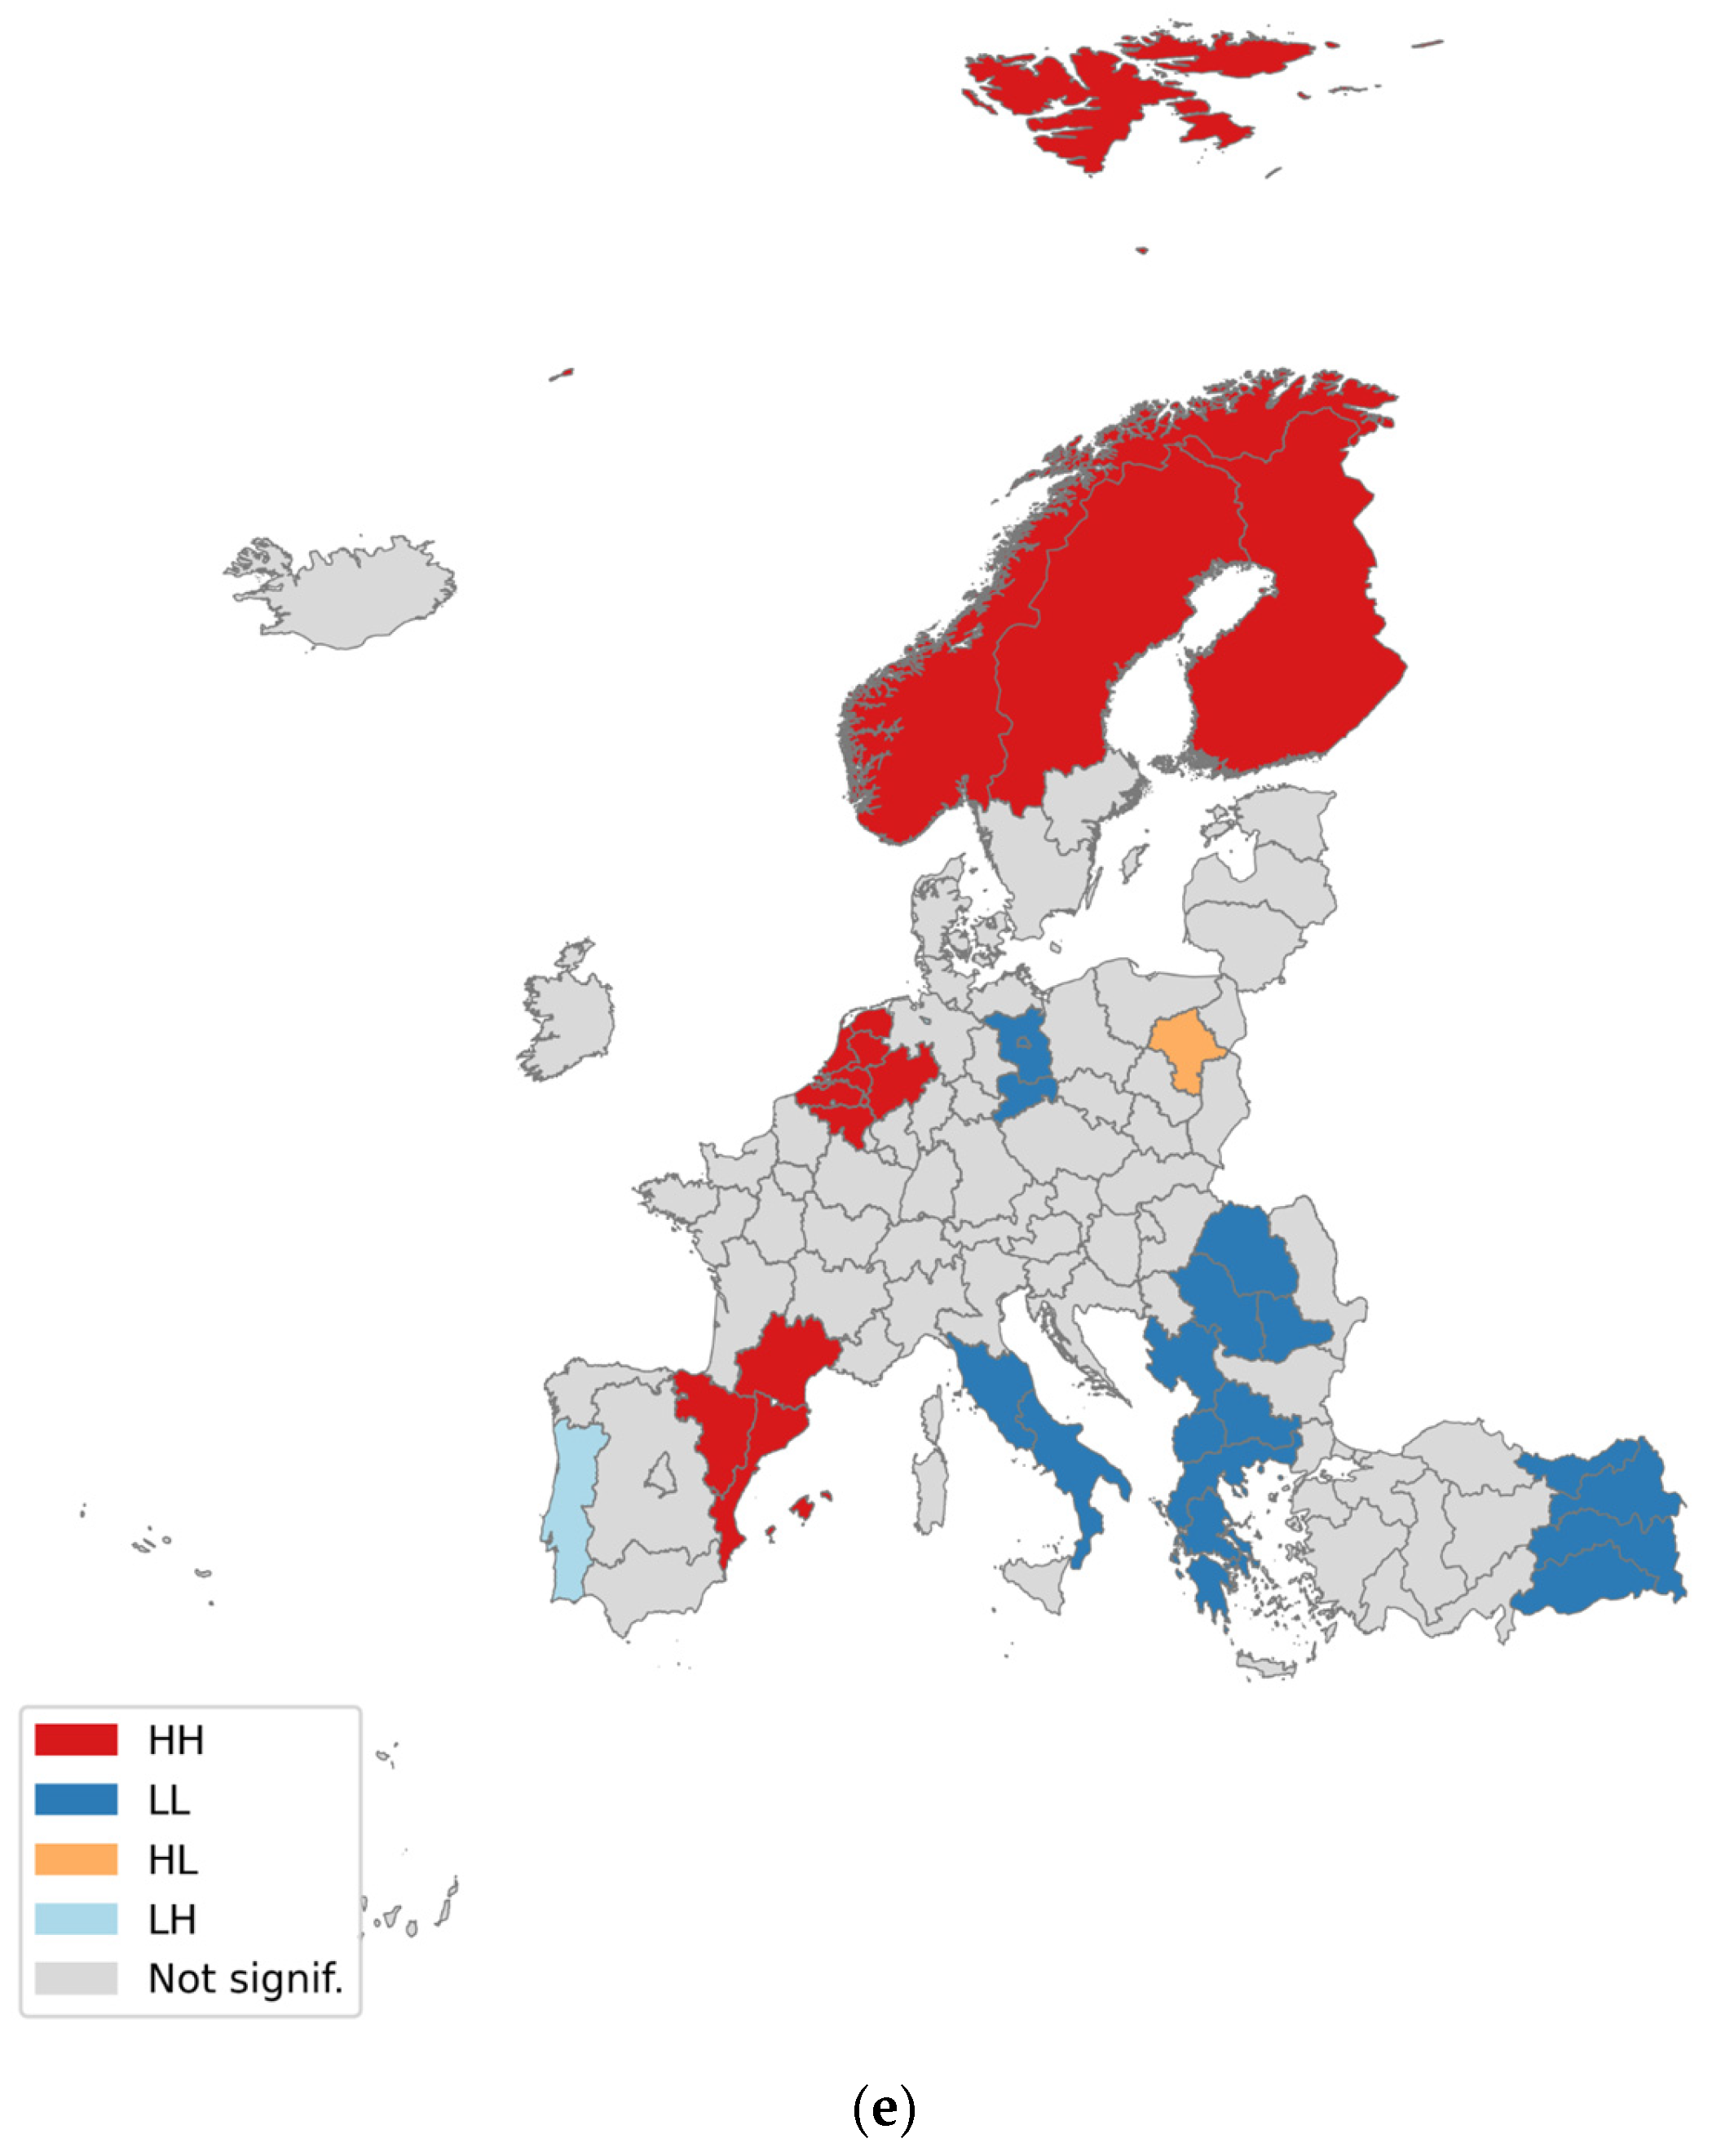
While Moran’s I confirms the presence of global clustering, it does not identify where such patterns occur. To address this issue, a Local Indicators of Spatial Association (LISA) analysis was conducted for the 2021–2025 period (Figure 3).
The LISA results reveal persistent high–high clusters concentrated in Northern and Western Europe, particularly in Belgium, the Netherlands, Finland, Norway, and Sweden. These areas can be interpreted as stable digital core regions. By contrast, low–low clusters are predominantly located in Southeastern and peripheral regions, including Bulgaria, Greece, Romania, Serbia, North Macedonia, and several Turkish regions, indicating persistent digital lagging (Table 3).
The relative stability in the number of high–high and low–low clusters over time suggests that regional digitalization patterns are highly persistent rather than transitional. This localized evidence complements the dynamic panel estimates reported below and is consistent with the presence of path-dependent regional digital trajectories. Detailed yearly cluster memberships and additional LISA outputs are reported in Appendix A, Figure A2a–e, and in Appendix C, Table A2.

4.4. Dynamic Model Specification and Selection

To evaluate the robustness of the baseline findings and identify the most appropriate empirical specification, several alternative dynamic spatial panel models were estimated. Among the models examined were a benchmark Spatial Autoregressive (SAR) model, a targeted Spatial Durbin (SDM) specification, and extended variants with additional controls such as population and employment.
Table 4 shows that the main findings do not change substantially in qualitative terms when different model specifications are employed. Spatial dependence remains positive and statistically significant, while the selected control variables continue to display their expected signs across the different model versions. The Fully Augmented Model has the lowest AIC, but the baseline Target SDM remained the preferred specification as it provides a better trade-off between model fit, parsimony, and interpretability.
The marginal increase in fit from adding further controls shows that the main relationships are captured by the GDP per capita, training participation, temporal persistence, and spatial interaction terms. Full coefficient estimates and additional robustness checks are provided in Appendix B, Table A1.

4.5. Dynamic Spatial Panel Estimates

Results for the dynamic Spatial Autoregressive (SAR) and preferred Spatial Durbin (SDM) model specification are presented in Table 5. In both models, the lagged dependent variable remains large and highly significant (around 0.75), suggesting that regional digitalization is very persistent over time.
The size of the lagged coefficient is in line with the path dependence hypothesis, which suggests that regions with higher initial levels of digitalization are less likely to lose their relative advantages over time. More generally, the results suggest that regional digital hierarchies adjust only gradually, making rapid convergence unlikely without targeted intervention.
Training participation is positive and statistically significant in both models, emphasizing the role of human capital as a significant factor in regional digital development. GDP per capita also has a positive effect, with a larger estimated coefficient in the SDM specification. This indicates that once spatial interactions are explicitly modeled, the role of regional economic capacity becomes more visible.
In the preferred SDM, the Spatial Autoregressive coefficient is positive, confirming the presence of beneficial diffusion-type spillovers, whereby digital progress in neighboring regions supports local digitalization. By contrast, the coefficient of the spatially lagged GDP per capita is negative and statistically significant, indicating the presence of competitive spillovers. This implies that stronger neighboring economies may attract investment, firms, and skilled labor away from weaker regions.
Together, the estimates suggest that positive digital spillovers do exist, but adverse competitive forces associated with neighboring economic strength may also play a role in the persistence of territorial disparities. These results are robust to alternative specifications, providing more confidence in the main results.

4.6. Direct, Indirect, and Total Effects

The estimated coefficients were decomposed into direct, indirect, and total effects to better interpret the spatial transmission mechanisms embedded in the preferred SDM specification. The decomposition in Table 6 is particularly important since coefficients in spatial models do not have the same interpretation as in standard non-spatial regressions.
The lagged dependent variable is still strongly positive and statistically significant in both its direct and indirect components, which confirms the coexistence of temporal persistence and spatial feedback mechanisms. In practical terms, the benefits of past digital progress not only remain in the originating region but are also transmitted to neighboring territories over time.
GDP per capita has positive and statistically significant direct and indirect effects, indicating that stronger regional economic capacity supports digitalization both locally and in neighboring regions. This also suggests that economically advanced regions can serve as broader centers of digital development through means such as investment capacity, larger markets, and innovation networks.
Participation in training also has positive direct and indirect effects, indicating that investment in human capital generates benefits beyond regional borders. These spillovers may arise through labor mobility, cross-regional learning, and knowledge exchange.
By contrast, the total effect of spatially lagged GDP per capita is negative and statistically significant. This indicates a process of competitive regional polarization, in which stronger neighboring economies attract firms, digital investment, and skilled labor away from weaker territories.
Taken together, the decomposition results suggest that positive diffusion mechanisms coexist with negative competitive spillovers. The latter appear stronger overall, helping to explain the persistence of regional digital inequalities across Europe.

5. Discussion

This study provides new evidence of the territorial dynamics of regional digitalization in Europe and their implications for sustainable development. By combining a multidimensional Digitalization Index with a dynamic spatial panel framework, the analysis captures persistence over time, neighborhood effects, and regional heterogeneity within a single setting, revealing why digital progress advances in different regions at different rates.
A major revelation is that the level of digital development in regions still largely depends on pre-existing structural advantages. Previous gains in infrastructure, institutional quality, and skill development continue to shape patterns in their growth, suggesting that digital divides are shaped by persistent and self-reinforcing conditions rather than temporary imbalances. This means that shrinking the gap in skills is unlikely without targeted intervention. This is in line with the findings of Apatov et al. [44], who consider infrastructure legacies an important long-term factor, and those of Claudia and Mihaela [27], who stress the importance of institutional quality and human capital. In practice, lagging regions face barriers to catching up, while leading regions continue to consolidate their position.
Another important consideration is the capability of the workforce. The ongoing relevance of education and training demonstrates that labor adaptability is still crucial for digital development. Such capabilities primarily benefit the originating region but may also generate wider gains through labor mobility, knowledge diffusion, and interregional learning. These results are in line with the findings of De Martino et al. [20], who identify skills as a key determinant of SME digitalization, and Claudia and Mihaela [27], who emphasize competencies as a core condition of digital readiness. This implies that investment in infrastructure alone is unlikely to be sufficient where regional absorptive capacity remains weak.
Spatial interactions appear to manifest through two counteracting channels. Imitation and technological diffusion may make neighboring regions new sources of capable workers. At the same time, stronger surrounding economies may draw firms, investment, and skilled labor away from weaker territories. In many cases, benefits are offset by stronger competitive pressures. This tension explains the limited convergence across European regions.
These results are in line with the findings of Wójcik et al. [29] and Lei et al. [8], who demonstrate that digital developments tend to favor already advanced regions. Maucorps et al. [33] also argue that uneven digital capacity may reinforce broader territorial divergence. Taken together, this evidence suggests that digitalization does not function as an inherently equalizing process. By contrast, under predominantly market-driven conditions, it may replicate or even aggravate existing spatial inequalities and core–periphery imbalances.
While the analysis emphasizes persistence and spatial interaction mechanisms, alternative explanations may also contribute to the observed regional disparities. Differences in national institutional environments, governance quality, and the uneven allocation of European digital investment programs may influence regional digital outcomes alongside the mechanisms captured in the model. Although these factors are not explicitly modeled in the present study, they may reinforce or moderate the identified patterns and therefore warrant further investigation in future research.
From a broader sustainability perspective, the spread of technology alone is insufficient to overcome long-standing structural disadvantages. Digital transformation is more likely to contribute to territorial cohesion when combined with complementary investments in skills, institutional quality, innovation capacity and regional cooperation. In this sense, digitalization can be better understood as a place-based development process shaped by economic, social, and institutional factors. In the absence of coordinated policy intervention, digital progress may increase aggregate efficiency without resolving these imbalances.

6. Conclusions

In this study, patterns of regional digitalization across Europe were examined using a PCA-derived Digitalization Index together and dynamic spatial econometric modeling. Drawing on panel data for 110 NUTS-1 regions over the period 2021–2025, the results reveal persistent regional trajectories and meaningful interactions across regions. These developments have important implications for territorial cohesion, competitiveness, and long-term sustainability.
Overall, the findings indicate that digital transformation in Europe has been neither spatially neutral nor inherently equalizing. Regional outcomes continue to reflect inherited structural conditions. Although neighboring linkages may provide opportunities for learning and diffusion, market-led adjustment by itself seems inadequate to achieve balanced territorial convergence. These patterns should be regarded as suggestive of short- to medium-term dynamics rather than confirmed long-term structural outcomes.
The study combines a composite measure of digitalization with a dynamic spatial framework that considers continuity over time, interactions with neighboring regions, and regional heterogeneity. This underscores the importance of understanding digital transformation not merely as technological advancement but also as a process of regional development. In doing so, this study offers an integrated perspective, jointly capturing persistence mechanisms and spatial interaction effects to provide a more comprehensive explanation of regional digital outcomes.

6.1. Policy Implications

The results show that Europe needs to develop region-specific policies. Regions with higher institutional capacity, particularly in Northern and Western Europe, advanced skill bases, and developed innovation systems are most likely to benefit from leading policies aimed at technological advancement, productivity growth, and the dissemination of knowledge. In contrast, underdeveloped and peripheral regions need stronger support in areas such as broadband quality, digital public services, workforce skills, digitalization of SMEs, and institutional capacity building.
Rural and disadvantaged regions, often concentrated in peripheral parts of Southern and Eastern Europe, have less internet connectivity, smaller labor markets, and fewer innovation opportunities because of digital exclusion. Therefore, special attention should be paid to digital exclusion. Consequently, policies promoting reliable broadband access, remote working opportunities, digital public services, and local entrepreneurial ecosystems are particularly important in these areas.
More broadly, closer cooperation between national and regional authorities is necessary for interregional interactions to become pathways to convergence rather than mechanisms of divergence. This can be coordinated through common innovation platforms, education systems, interregional cooperation networks, and targeted adaptation tools that help distribute the benefits of digital transformation more equitably across regions. Monitoring systems should also assess not only aggregate digital progress but also how gains are distributed spatially.
Whether digitalization narrows or widens regional disparities will depend less on technology itself than on policy choices that govern its territorial diffusion.

6.2. Limitations and Future Research

This research has several limitations. The period from 2021 to 2025 captures an important phase of recent digital acceleration but remains relatively short for assessing long-term structural adjustment. Although the dynamic spatial framework identifies persistence and interregional dependence, some endogeneity and unobserved heterogeneity may remain. As such, the relationships estimated should be interpreted as conditional associations rather than definitive causal effects. Future research may therefore consider using longer time horizons, quasi-experimental methods, and more disaggregated territorial data to examine the interaction between digitalization and green transition strategies, circular economy objectives, and sector-specific transformation pathways across Europe.

Author Contributions

Conceptualization, A.K.; methodology, G.K.; software, G.K.; validation, A.K. and G.K.; formal analysis, G.K.; investigation, A.K.; resources, A.K.; data curation, G.K.; writing—original draft preparation, G.K.; writing—review and editing, A.K.; visualization, G.K.; supervision, A.K. All authors have read and agreed to the published version of the manuscript.

Funding

This research received no external funding.

Institutional Review Board Statement

Not applicable.

Informed Consent Statement

Not applicable.

Data Availability Statement

The data that support the findings of this study are available from the corresponding author upon reasonable request.

Conflicts of Interest

The authors declare no conflicts of interest.

Abbreviations

The following abbreviations are used in this manuscript:
PCAPrincipal Component Analysis
SARSpatial Autoregressive Models
SDMSpatial Durbin Models
SDGSustainable Development Goals
SDISpatial Data Infrastructures
ICTInformation and Communication Technology
SMESmall and Medium-Sized Enterprise
NUTS-1Nomenclature of Territorial Units for Statistics-Level 1
EUEuropean Union
KMOKeiser Meyer Ohlin Statistics
LISALocal Indicators of Spatial Association

Appendix A

This appendix contains supplementary materials supporting the empirical analysis, including annual spatial distribution maps, LISA cluster maps, and additional robustness checks.

Additional Figures

Figure A1. (a). Spatial distribution of the Digitalization Index across European NUTS-1 regions in 2021. (b). Spatial distribution of the Digitalization Index across European NUTS-1 regions in 2022. (c). Spatial distribution of the Digitalization Index across European NUTS-1 regions in 2023. (d). Spatial distribution of the Digitalization Index across European NUTS-1 regions in 2024. (e). Spatial distribution of the Digitalization Index across European NUTS-1 regions in 2025.
Sustainability 18 04839 g0a1aSustainability 18 04839 g0a1bSustainability 18 04839 g0a1c
Figure A2. (a). LISA cluster map for regional digitalization in Europe (2021). (b). LISA cluster map for regional digitalization in Europe (2022). (c). LISA cluster map for regional digitalization in Europe (2023). (d). LISA cluster map for regional digitalization in Europe (2024). (e). LISA cluster map for regional digitalization in Europe (2025).
Sustainability 18 04839 g0a2aSustainability 18 04839 g0a2bSustainability 18 04839 g0a2c

Appendix B. Robustness Checks

Table A1. Full Robustness Results from Alternative Dynamic Spatial Panel Specifications.
ModelKControlsLLAICρAssessment
SAR Baseline5GDP, Training−1205.072426.130.0461Benchmark specification
SAR Baseline6GDP, Training−1205.212426.420.0442Stable under alternative K
Target SDM Baseline5GDP, Training−1201.972421.940.1005Strong candidate
Target SDM Baseline6GDP, Training−1201.962421.910.1063Preferred model
Target SDM
+ Population
6GDP, Training, Population−1200.822421.650.1070Results remain stable
Target SDM
+ Employment
6GDP, Training, Employment−1201.302422.590.1165Results remain stable
Target SDM Full8GDP, Training, Population, Employment−1199.392420.770.1322Best fit, less parsimonious
Note: K denotes the number of nearest neighbors used to construct the spatial weights matrix. LL is the log-likelihood statistic, and AIC is the Akaike Information Criterion; lower AIC values indicate better model fit. ρ represents the spatial autoregressive coefficient. All specifications are estimated using 440 observations. The preferred model balances goodness of fit and parsimony.

Appendix C. Supplementary Tables

Table A2. Significant LISA Cluster Members by Year (2021–2025).
YearHigh–High (HH)
Clusters
Low–Low (LL) ClustersHigh–Low (HL) OutliersLow–High (LH) Outliers
2021BE1, BE2, BE3, ES2, FI1, NL1, NL2, NL3, NL4, NO0, SE3BG3, BG4, EL3, EL4, EL5, EL6, MK0, RO1, RO2, RO3, RO4, RS2, TR2, TR7, TR9, TRA, TRB, TRCTR1PT1
2022BE1, BE2, BE3, FI1, NL1, NL2, NL3, NL4, NO0, SE3BG3, BG4, EL3, EL5, EL6, MK0, RO1, RO2, RO3, RO4, RS2, TR9, TRA, TRB, TRCTR1PT1
2023BE1, BE2, BE3, FI1, NL1, NL2, NL3, NL4, NO0, SE3BG4, DE3, EL3, EL5, EL6, ITI, MK0, RO1, RO2, RO3, RO4, RS2, TR9, TRA, TRB, TRCDK0, TR1PT1
2024BE1, BE2, BE3, FI1, LU0, NL1, NL2, NL3, NL4, NO0, SE3BG4, EL3, EL4, EL5, EL6, ITF, MK0, RO1, RO3, RO4, RS2, TR9, TRA, TRB, TRCDE3, TR1
2025BE2, BE3, DEA, ES2, FI1, NL1, NL2, NL3, NL4, NO0, SE3BG4, DE3, DE4, DED, EL3, EL5, EL6, ITF, ITI, MK0, RO1, RO3, RO4, RS2, TR9, TRA, TRB, TRCPL9, TR1BE1

References

  1. 2030 Digital Compass: The European Way for the Digital Decade—EU4Digital. Available online: https://eufordigital.eu/library/2030-digital-compass-the-european-way-for-the-digital-decade/ (accessed on 24 April 2026).
  2. Transforming Our World: The 2030 Agenda for Sustainable Development Department of Economic and Social Affairs. Available online: https://sdgs.un.org/2030agenda (accessed on 24 April 2026).
  3. Kustanto, A. Bridging the Digital Gap: Analysing the Impact of ICT Diffusion on Income Inequality in Indonesia. Econ. Thought J. 2024, 69, 323–352. [Google Scholar] [CrossRef]
  4. Consoli, D.; Castellacci, F.; Santoalha, A. E-Skills and Income Inequality within European Regions. Ind. Innov. 2023, 30, 919–946. [Google Scholar] [CrossRef]
  5. Özcan Alp, G.; Baycan, T. Digital Divide Reflections on Regional Development Disparities in Türkiye. Inf. Technol. Dev. 2024, 30, 608–625. [Google Scholar] [CrossRef]
  6. Hsu, J.-Y.; Liao, Y.-K. Path Dependence. In The International Encyclopedia of Geography; Richardson, D., Castree, N., Goodchild, M.F., Kobayashi, A., Liu, W., Marston, R.A., Eds.; John Wiley & Sons, Ltd.: Hoboken, NJ, USA, 2017; pp. 1–8. [Google Scholar]
  7. Schreyögg, G.; Sydow, J. Understanding Institutional and Organizational Path Dependencies. In The Hidden Dynamics of Path Dependence; Schreyögg, G., Sydow, J., Eds.; Palgrave Macmillan: London, UK, 2010; pp. 3–12. [Google Scholar]
  8. Lei, M.; Yang, X.; Hong, S.; Wang, D.; Zhang, W.; Chen, H. Sustainable Digital Rural Development: Measurements, Dynamic Evolutions, and Regional Disparities—A Case Study of China. Sustainability 2025, 17, 4250. [Google Scholar] [CrossRef]
  9. Barth, M.; Gossen, M.; Lang, D.J.; Santarius, T. Sustainable Digitalization-Fostering the Twin Transformation in a Transdisciplinary Way. GAIA-Ecol. Perspect. Sci. Soc. 2023, 32, 6–9. [Google Scholar] [CrossRef]
  10. Detemple, J.; Wicht, A. Uncovering Regional Inequalities in Digitalization: A Multifaceted Measurement for Germany. Meas. Instrum. Soc. Sci. 2024, 6, e13387. [Google Scholar] [CrossRef]
  11. Cricelli, L.; Strazzullo, S. The Economic Aspect of Digital Sustainability: A Systematic Review. Sustainability 2021, 13, 8241. [Google Scholar] [CrossRef]
  12. Barbero, M.; Potes, M.L.; Vancauwenberghe, G.; Vandenbroucke, D.; de Lima, V.N. The Role of Spatial Data Infrastructures in the Digital Government Transformation of Public Administrations; Publications Office of the European Union: Luxembourg, 2019. [Google Scholar]
  13. Hersperger, A.M.; Thurnheer-Wittenwiler, C.; Tobias, S.; Folvig, S.; Fertner, C. Digitalization in Land-Use Planning: Effects of Digital Plan Data on Efficiency, Transparency and Innovation. Eur. Plan. Stud. 2022, 30, 2537–2553. [Google Scholar] [CrossRef]
  14. Bruno, E.; Castellano, R.; Punzo, G.; Salvati, L. Innovation and Digitalisation in European Regions: Addressing Spatial Issues through GWR-SAR Approach. Ann. Oper. Res. 2025. [Google Scholar] [CrossRef]
  15. Kotsev, A.; Minghini, M.; Tomas, R.; Cetl, V.; Lutz, M. From Spatial Data Infrastructures to Data Spaces—A Technological Perspective on the Evolution of European SDIs. ISPRS Int. J. Geo-Inf. 2020, 9, 176. [Google Scholar] [CrossRef]
  16. Scerri, S.; Tuikka, T.; De Vallejo, I.L.; Curry, E. Common European Data Spaces: Challenges and Opportunities. In Data Spaces; Curry, E., Scerri, S., Tuikka, T., Eds.; Springer International Publishing: Cham, Switzerland, 2022; pp. 337–357. [Google Scholar]
  17. Nagel, L.; Lycklama, D. How to Build, Run, and Govern Data Spaces. In Designing Data Spaces; Otto, B., Ten Hompel, M., Wrobel, S., Eds.; Springer International Publishing: Cham, Switzerland, 2022; pp. 17–28. [Google Scholar]
  18. Conde, J.; Pozo, A.; Munoz-Arcentales, A.; Choque, J.; Alonso, Á. Fostering the Integration of European Open Data into Data Spaces through High-Quality Metadata. arXiv 2024, arXiv:2402.06693. [Google Scholar] [CrossRef]
  19. Denvil, S.; Gutierrez, M.; Dietrich, M.; Raczko, N.; Santoro, M.; Briese, C.; Chatzikyriakou, C. The European Green Deal Data Space Roadmap. In Proceedings of the European Geosciences Union General Assembly 2024 (EGU24), Vienna, Austria, 14–19 April 2024. EGU24-20830. [Google Scholar] [CrossRef]
  20. De Martino, M.; Martirano, G.; Quarati, A.; Varni, F.; Toscano Domínguez, M. Digital Transformation and Location Data Interoperability Skills for Small and Medium Enterprises. ISPRS Int. J. Geo-Inf. 2025, 14, 51. [Google Scholar] [CrossRef]
  21. Sipakoly, S. Digitalization and the Global Competitiveness of Exported Services. J. Econ. Manag. Sci. 2025, 7, 314–319. [Google Scholar] [CrossRef]
  22. Sui, X.; Jiao, S.; Wang, Y.; Wang, H. Digital Transformation and Manufacturing Company Competitiveness. Financ. Res. Lett. 2024, 59, 104683. [Google Scholar] [CrossRef]
  23. Kang, W. A Systematic Review: Bridging the Digital Divide in SME Digitalization. At. Acad. J. 2024, 5, 1–12. [Google Scholar]
  24. Rampaul, K. Digital Transformation and SME Growth in Emerging Markets. J. Emerg. Mark. Manag. 2025, 1, 15–25. [Google Scholar] [CrossRef]
  25. Khimani, M.; Singhal, A. From Digital Deserts to Tech Havens: The Role of Digital Infrastructure in MSME Competitiveness. EPRA Int. J. Econ. Bus. Rev. 2024, 12, 47–55. [Google Scholar] [CrossRef]
  26. Holl, A.; Rama, R. Spatial Patterns and Drivers of SME Digitalisation. J. Knowl. Econ. 2023, 15, 5625–5649. [Google Scholar] [CrossRef]
  27. Claudia, O.; Mihaela, H. Exploring Romania’s Digital Gap—What Is Under the Water, If This Is Only the Tip of the Iceberg? Stud. Bus. Econ. 2022, 17, 312–322. [Google Scholar] [CrossRef]
  28. Lucendo-Monedero, A.L.; Ruiz-Rodríguez, F.; González-Relaño, R. Measuring the Digital Divide at Regional Level. A Spatial Analysis of the Inequalities in Digital Development of Households and Individuals in Europe. Telemat. Inform. 2019, 41, 197–217. [Google Scholar] [CrossRef]
  29. Wójcik, M.; Dmochowska-Dudek, K.; Tobiasz-Lis, P. Boosting the Potential for GeoDesign: Digitalisation of the System of Spatial Planning as a Trigger for Smart Rural Development. Energies 2021, 14, 3895. [Google Scholar] [CrossRef]
  30. Nipo, D.T.; Lily, J.; Fabeil, N.F.; Jamil, I.A.A. Transforming Rural Entrepreneurship through Digital Innovation: A Review on Opportunities, Barriers and Challenges. J. Manag. Sustain. 2024, 14, 114. [Google Scholar] [CrossRef]
  31. Sekhar, K.S.V. Digital Infrastructure Challenges for Techno-Entrepreneurs in Rural Areas: The Need for Capacity Building. In Digital Transformation and Innovation in Emerging Markets; IGI Global Scientific Publishing: Hershey, PA, USA, 2025; pp. 127–156. [Google Scholar]
  32. Nnanna, U.A.; Mohammed, A.U.; Abubakar, T.T.; Yunus, J.; Eleke, U.P.; Sennuga, S.O. The Role of Technology in Transforming Rural Social Systems: An Insightful Review. J. Nutr. Food Process. 2025, 8, 1–8. [Google Scholar]
  33. Maucorps, A.; Römisch, R.; Schwab, T.; Vujanović, N. The Impact of the Green and Digital Transition on Regional Cohesion in Europe. Intereconomics 2023, 58, 102–110. [Google Scholar] [CrossRef]
  34. Borda, M.; Grishchenko, N.; Kowalczyk-Rólczyńska, P. Impact of Digital Inequality on the COVID-19 Pandemic: Evidence from European Union Countries. Sustainability 2022, 14, 2850. [Google Scholar] [CrossRef]
  35. Capello, R. Spatial Spillovers and Regional Growth: A Cognitive Approach. Eur. Plan. Stud. 2009, 17, 639–658. [Google Scholar] [CrossRef]
  36. Grasland, L.; Puel, G. The Diffusion of ICT and the Notion of the Digital Divide: Contributions from Francophone Geographers: Introductory Remarks. GeoJournal 2007, 68, 1–3. [Google Scholar] [CrossRef]
  37. Ertur, C.; Le Gallo, J.; Baumont, C. The European Regional Convergence Process, 1980–1995: Do Spatial Regimes and Spatial Dependence Matter? Int. Reg. Sci. Rev. 2006, 29, 3–34. [Google Scholar] [CrossRef]
  38. LeSage, J.; Pace, R.K. Introduction to Spatial Econometrics; Chapman and Hall/CRC: New York, NY, USA, 2009. [Google Scholar]
  39. Lolayekar, A.P.; Mukhopadhyay, P. Spatial Dependence and Regional Income Convergence in India (1981–2010). GeoJournal 2019, 84, 851–864. [Google Scholar] [CrossRef]
  40. Kovac, N.; Żmija, K.; Roy, J.K.; Kusa, R.; Duda, J. Digital Divide and Digitalization in Europe: A Bibliometric Analysis. Equilib. Q. J. Econ. Econ. Policy 2024, 19, 463–520. [Google Scholar] [CrossRef]
  41. ĐJorić, Ž. Digital Divide in European Union: State and Perspectives. Ekon. Pogl. 2022, 24, 157–198. [Google Scholar] [CrossRef]
  42. Korovkin, V.; Park, A.; Kaganer, E. Towards Conceptualization and Quantification of the Digital Divide. Inf. Commun. Soc. 2023, 26, 2268–2303. [Google Scholar] [CrossRef]
  43. DiMaggio, P.; Hargittai, E.; Neuman, W.R.; Robinson, J.P. Social Implications of the Internet. Annu. Rev. Sociol. 2001, 27, 307–336. [Google Scholar] [CrossRef]
  44. Apatov, E.; Chappell, N.; Grimes, A. Is Internet on the Right Track? The Digital Divide, Path Dependence, and the Rollout of New Zealand’s Ultra-Fast Broadband. In Motu Working Paper 2018, 18-04; Motu Economic and Public Policy Research: Wellington, New Zealand, 2018. [Google Scholar]
  45. Ihsaniyati, H.; Sarwoprasodjo, S.; Muljono, P.; Gandasari, D. Understanding the Impact and Driver of Digital Divide to Support Rural Development Policy: A Review. IOP Conf. Ser. Earth Environ. Sci. 2024, 1362, 012016. [Google Scholar] [CrossRef]
  46. Rosário, A.T.; Dias, J.C. Sustainability and the Digital Transition: A Literature Review. Sustainability 2022, 14, 4072. [Google Scholar] [CrossRef]
  47. Popa, I.; Ștefan, S.C.; Mircioiu, C.-E.; Vișan, D.A.-M. The Sustainable Perspective of Digitization, Digitalization and Digital Transformation. A Bibliometric Approach. AnnalsARSciEco 2023, 6, 63–78. [Google Scholar] [CrossRef]
  48. Laurent, B. Territorial Frictions of Digital Innovation. In Project Europe Remaking European Futures Through the Politics of Digital Innovation; Dratwa, J., Marelli, L., Eds.; Edward Elgar Publishing: Cheltenham, UK, 2025; pp. 1–21. [Google Scholar] [CrossRef]
  49. Caravella, S.; Cirillo, V.; Crespi, F.; Guarascio, D.; Menghini, M. The Diffusion of Digital Skills across EU Regions: Structural Drivers and Polarisation Dynamics. Reg. Stud. Reg. Sci. 2023, 10, 820–844. [Google Scholar] [CrossRef]
  50. Georgiadou, Y.; Bernard, L.; Sahay, S. Implementation of Spatial Data Infrastructures in Transitional Economies: Editorial Introduction to Part One of the Special Issue. Inf. Technol. Dev. 2006, 12, 247–253. [Google Scholar] [CrossRef]
  51. Masser, I.; Rajabifard, A.; Williamson, I. Spatially Enabling Governments through SDI Implementation. Int. J. Geogr. Inf. Sci. 2008, 22, 5–20. [Google Scholar] [CrossRef]
  52. Mihai, L.-S.; Sitnikov, V.V.; Sichigea, M.; Vasilescu, L.; Băndoi, A.; Sitnikov, C.; Mănescu, L.-G. A Bibliometric Analysis of the Role of Digitalization in Achieving Sustainability-Oriented Innovation. Sustainability 2025, 17, 5822. [Google Scholar] [CrossRef]
  53. Knox, H. Traversing the Infrastructures of Digital Life. In Digital Anthropology, 2nd ed.; Geismar, H., Knox, H., Eds.; Routledge: London, UK, 2021; pp. 178–196. [Google Scholar]
  54. Sacco, P.; Gargano, E.R.; Cornella, A. Sustainable Digitalization: A Systematic Literature Review to Identify How to Make Digitalization More Sustainable. In Creative Solutions for a Sustainable Development; Borgianni, Y., Brad, S., Cavallucci, D., Livotov, P., Eds.; IFIP Advances in Information and Communication Technology; Springer International Publishing: Cham, Switzerland, 2021; Volume 635, pp. 14–29. [Google Scholar]
  55. Eurostat. Regional Accounts—National Accounts. Available online: https://ec.europa.eu/eurostat/web/national-accounts/methodology/european-accounts/regional-accounts (accessed on 25 April 2026).
  56. Eurostat. Statistics. Available online: https://ec.europa.eu/eurostat/databrowser/explore/all/popul?lang=en&subtheme=labour.employ.lfso.lfso_his.lfso_02&display=list&sort=category&extractionId=hlth_db_emasne (accessed on 25 April 2026).
  57. OECD. Foundations for Growth and Competitiveness 2026. Available online: https://www.oecd.org/en/publications/foundations-for-growth-and-competitiveness-2026_40a7532f-en.html (accessed on 25 April 2026).
  58. Abdurakhmanova, G.; Khachaturov, A.; Isaeva, A.; Kostyuchenko, A. Do Human Capital and Economic Development Drive Adoption of Digital Technologies Across Countries? Some Correlational Evidence. In Proceedings of the 5th International Conference on Future Networks & Distributed Systems, (ICFNDS ’21); Association for Computing Machinery: New York, NY, USA, 2021; pp. 702–705. [Google Scholar] [CrossRef]
  59. Hair, J.F.; Black, W.C.; Babin, B.J.; Anderson, R.E. Multivariate Data Analysis, 8th ed.; Cengage Learning EMEA: Andover, UK, 2019. [Google Scholar]
  60. OECD. OECD Regions and Cities at a Glance 2024; OECD Publishing: Paris, France, 2024. [Google Scholar] [CrossRef]
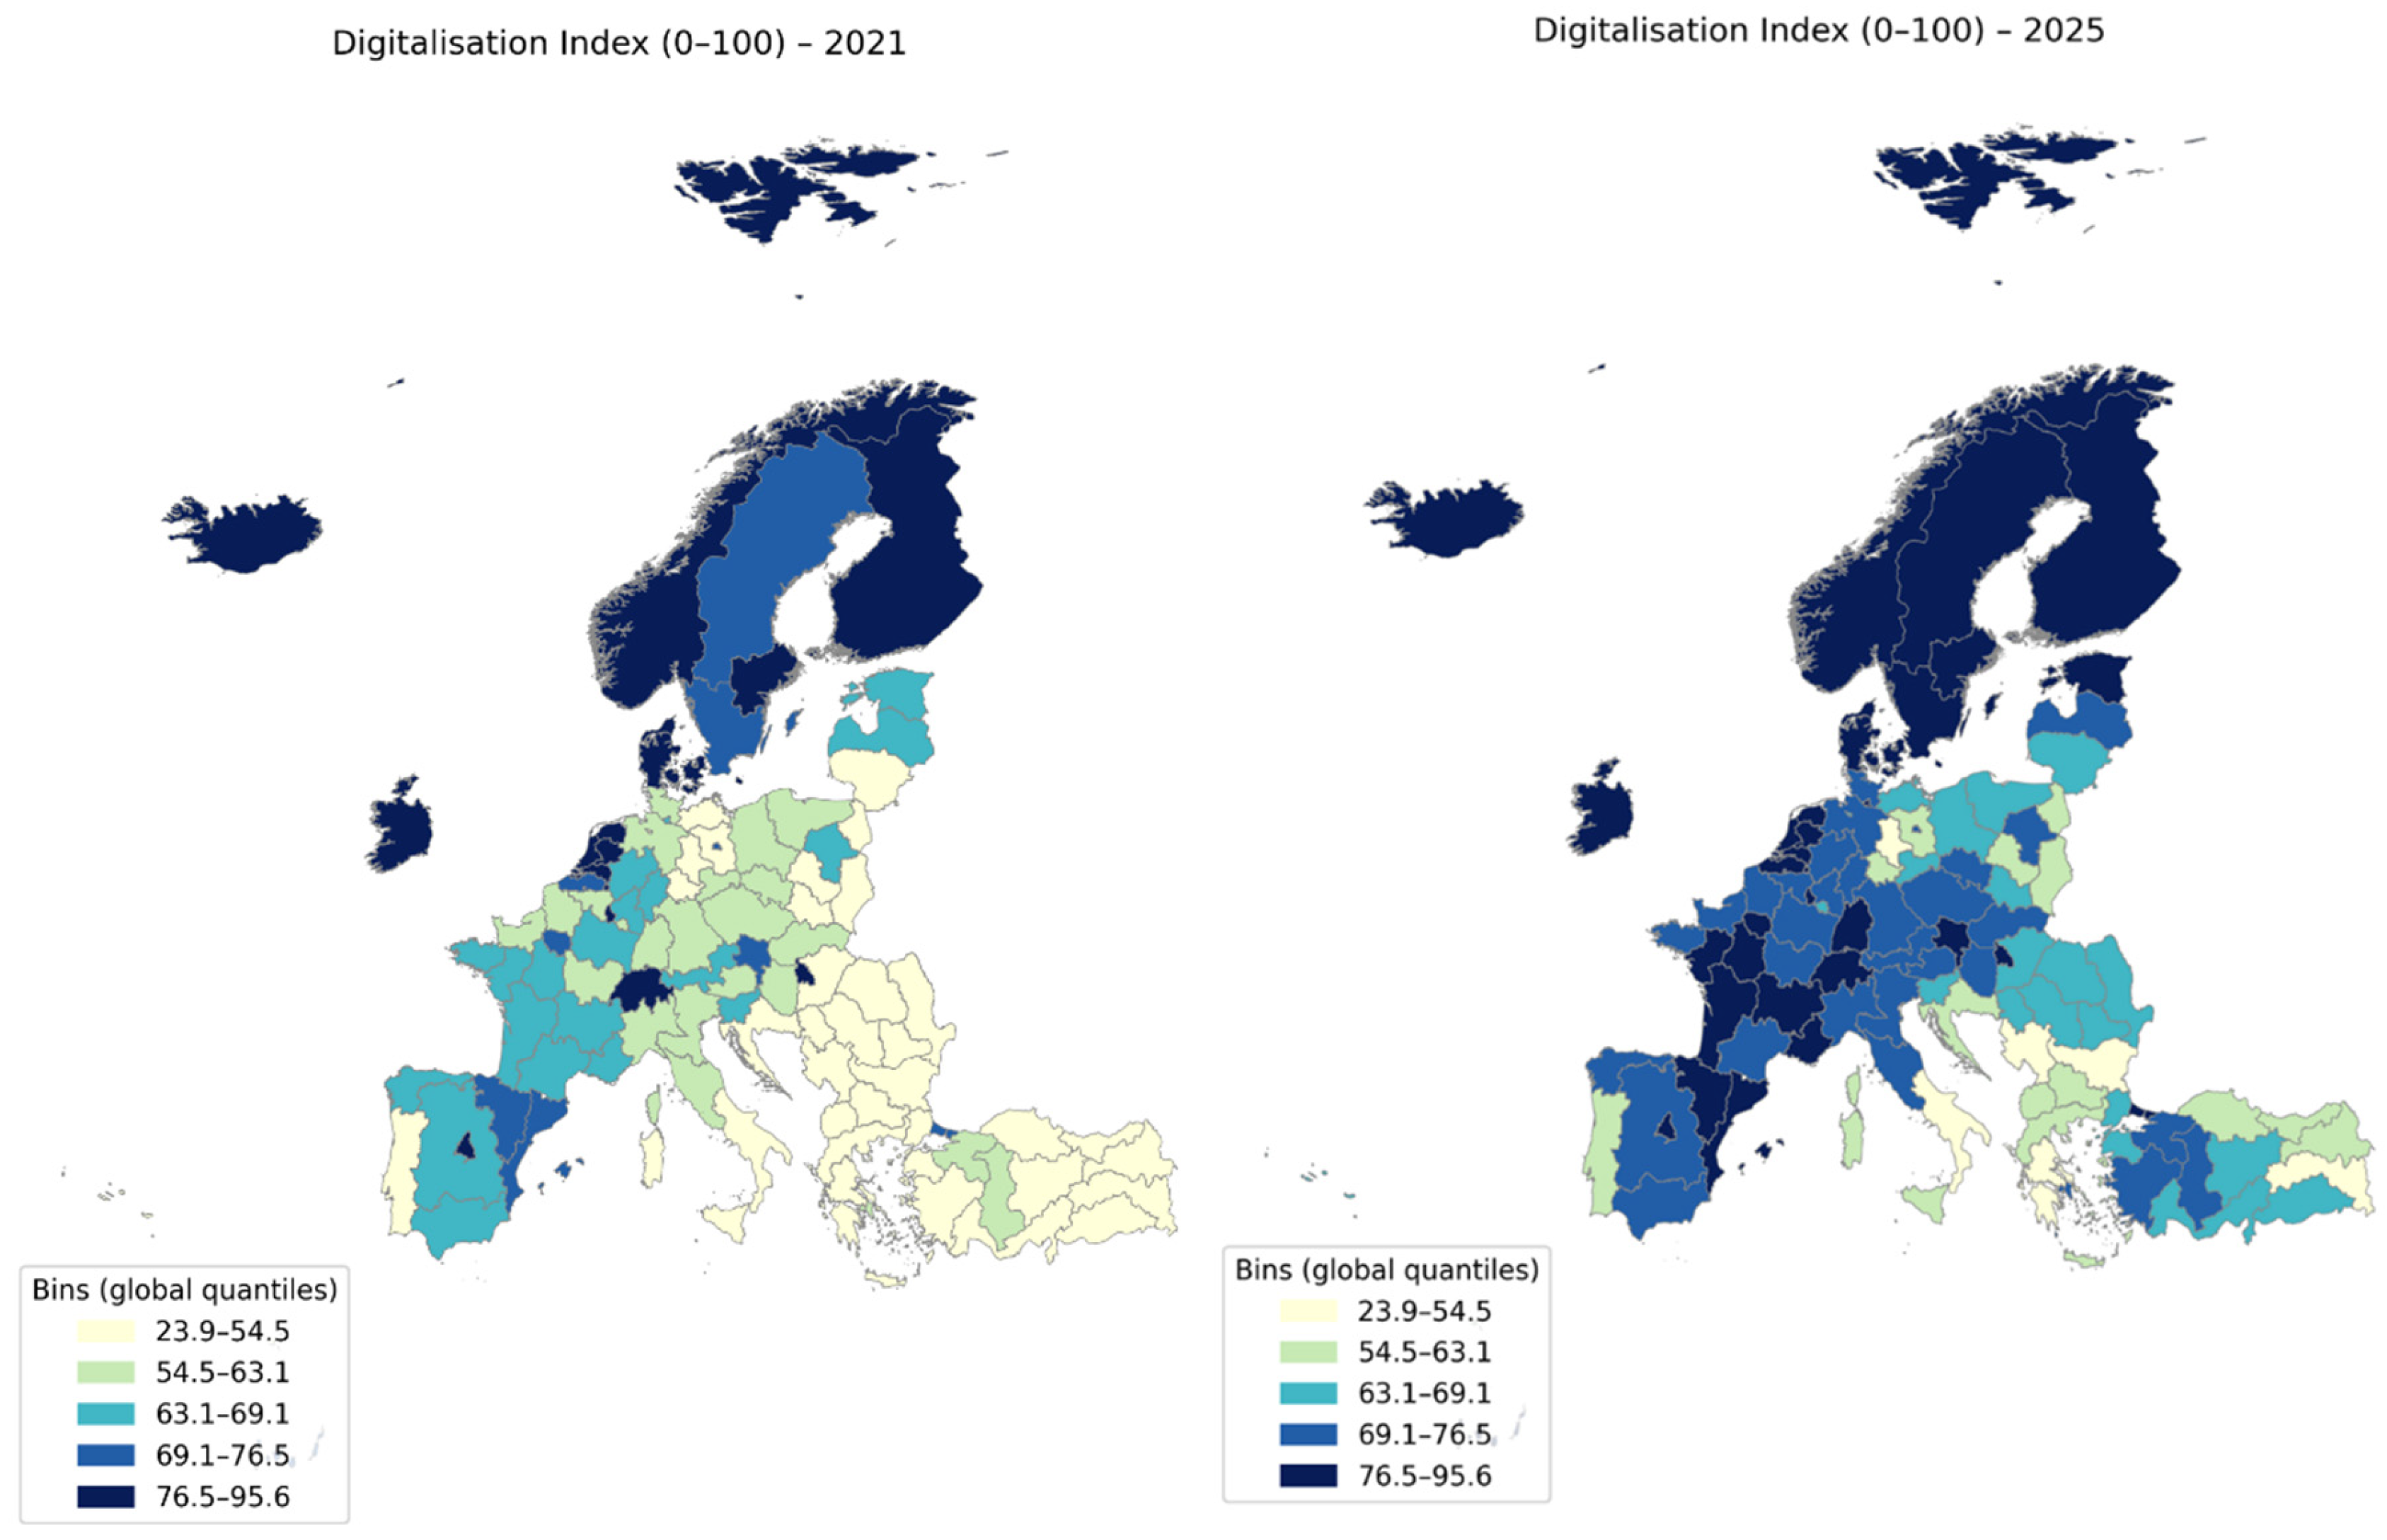
Figure 1. Spatial distribution of the Digitalization Index across European NUTS-1 regions (2021 and 2025). Note: Spatial distribution maps for all intermediate years covered in the sample are reported in Appendix A, Figure A1a–e.
Sustainability 18 04839 g001
Figure 2. Absolute changes in the Digitalization Index across European NUTS-1 regions, 2021–2025.
Sustainability 18 04839 g002
Figure 3. LISA cluster maps for regional digitalization in Europe (2021 and 2025).
Sustainability 18 04839 g003
Table 1. Digitalization Index components and their indicators.
Sub-IndexEurostat CodeDescription
Digital Accessisoc_r_iacc_hShare of households with access to the internet at home (%)
Digital UseI_IUSEShare of individuals using the internet at least once a week (%)
I_IDAYShare of individuals using the internet on a daily basis (%)
I_IU3Share of individuals who used the internet in the last 3 months (%)
Digital Services and EconomyI_BLT12Share of individuals who made an online purchase in the last 12 months (%)
I_IUBKShare of individuals using online banking services (%)
I_IUGOV1Share of individuals interacting online with public authorities (%)
I_IUSNETShare of individuals participating in social networking platforms (%)
I_IUSELLShare of individuals selling goods or services online (%)
Note: All indicators are expressed as percentages and refer to the regional level. Sub-indices were constructed by normalizing the indicators within each dimension and applying PCA. The final Digitalization Index was derived from a second-stage PCA that combines the three sub-indices.
Table 2. Global Moran’s I statistics for the Digitalization Index.
YearMoran’s Ip-Value
20210.4830.001
20220.4390.001
20230.4360.001
20240.4530.001
20250.4150.001
Table 3. Number of statistically significant LISA clusters by type, 2021–2025.
YearHHLLHLLH
2021111811
2022101511
2023101621
2024111520
2025111821
Note: HH = high–high clusters; LL = low–low clusters; HL = high–low spatial outliers; LH = low–high spatial outliers. Only statistically significant clusters are reported.
Table 4. Robustness checks and preferred model selection.
ModelSpecificationAICLog-Likelihoodρ (Spatial Lag)Interpretation
SAR BaselineGDP, Training2426.13−1205.070.0461Benchmark model
Target SDMGDP, Training2421.91−1201.960.1063Preferred specification
Target SDM + PopulationGDP, Training, Population2421.65−1200.820.1070Stable results
Target SDM + EmploymentGDP, Training, Employment2422.59−1201.300.1165Stable results
Target SDM FullGDP, Training, Population, Employment2420.77−1199.390.1322Better fit,
less parsimonious
Table 5. Dynamic spatial panel estimates (maximum likelihood).
VariableSAR (ML)Target SDM (ML)
Digitalization (t − 1)0.7642 ***0.7496 ***
GDP per capita (t − 1)1.1269 *2.2874 ***
Training participation (t − 1)0.1381 ***0.1369 ***
W·GDP per capita (t − 1)−2.8904 **
W·Digitalization0.04420.1063 ***
20031.0193 **0.9918 *
20041.7913 ***1.7314 ***
20050.80610.7834
Year fixed effectsYesYes
Observations440440
Regions110110
Log-likelihood−1205.21−1201.96
AIC2426.422421.91
Note: ***, **, and * denote significance at the 1%, 5%, and 10% levels, respectively.
Table 6. Direct, indirect, and total effects from the preferred SDM.
VariableDirect EffectIndirect EffectTotal Effect
Digitalization (t − 1)0.7508 ***0.0881 ***0.8388 ***
GDP per capita (t − 1)2.2908 ***0.2687 **2.5595 ***
Training participation (t − 1)0.1371 ***0.0161 ***0.1532 ***
W·GDP per capita (t − 1)−2.8947 **−0.3396 **−3.2343 ***
20230.9933 *0.11651.1098 **
20241.7340 ***0.2034 ***1.9374 ***
20250.78450.09200.8766
Note: Effects are computed following LeSage and Pace [38]. ***, **, and * denote significance at the 1%, 5%, and 10% levels, respectively.
Disclaimer/Publisher’s Note: The statements, opinions and data contained in all publications are solely those of the individual author(s) and contributor(s) and not of MDPI and/or the editor(s). MDPI and/or the editor(s) disclaim responsibility for any injury to people or property resulting from any ideas, methods, instructions or products referred to in the content.