Article

A Dempster-Shafer Theory-Based Multi-Criteria Decision Model for Evaluating Sustainable Third-Party Logistics Providers

1
Department of Industrial Engineering and Management, College of Management, National Taipei University of Technology, Taipei City 10608, Taiwan
2
Department of Health Care Management, National Taipei University of Nursing and Health Sciences, Taipei City 112303, Taiwan
*
Author to whom correspondence should be addressed.
Sustainability 2026, 18(10), 4643; https://doi.org/10.3390/su18104643
Submission received: 6 April 2026 / Revised: 26 April 2026 / Accepted: 6 May 2026 / Published: 7 May 2026
(This article belongs to the Collection Business Performance and Socio-environmental Sustainability)

Abstract

Selecting sustainable third-party logistics providers (3PLPs) is essential for enhancing competitiveness and sustainability performance. However, conventional approaches often fail to adequately capture sustainability dimensions and manage uncertainty arising from hesitant and incomplete information. To address these limitations, this study proposes a novel decision-making framework that extends the Triple Bottom Line by incorporating a technical dimension. The model integrates Dempster–Shafer theory for uncertainty modeling, Deng entropy for objective criteria weighting, Murphy’s combination rule for improved evidence aggregation, and the Combined Compromise Solution method for ranking. The core novelty lies in the unified integration of these techniques to simultaneously address uncertainty within a comprehensive evaluation framework. A case study, along with sensitivity and comparative analyses, demonstrates the effectiveness and robustness of the proposed approach, providing a reliable tool for sustainable 3PLP selection.

1. Introduction

Third-party logistics providers (3PLPs) are defined as independent companies engaged in administering, directing, and fulfilling logistics operations on behalf of the sender [1]. These providers have provided their clients with three key competitive advantages: cost reduction, accelerated delivery times, and enhanced reliability [2]. Recently, 3PLPs have taken on increasingly significant roles, such as streamlining supply chains, developing specialized services, adapting to customer needs, and driving customer development [3]. The logistics sector is one of the major drivers of worldwide greenhouse gas output [4]. Consequently, logistics firms are under mounting pressure to implement sustainability measures in response to tighter rules and rising stakeholder expectations. Therefore, 3PLPs are increasingly prioritizing environmental sustainability [5]. Sustainable 3PLPs contribute not only to operational efficiencies but also to the advancement of corporate sustainability objectives. Specifically, partnerships with sustainable 3PLPs help improve firms’ sustainability metrics [6,7]. Thus, choosing sustainable 3PLPs is no longer a peripheral concern but a strategic imperative that directly influences a company’s competitive advantage and brand reputation. The literature highlights the selection of sustainable 3PLPs as a key strategic consideration in supply chain management.
The literature identifies three main approaches for selecting 3PLPs: regression analysis [8,9], machine learning [10,11,12], and multiple-criteria decision-making (MCDM) methods. While regression models may overlook non-quantifiable factors, such as sustainable practices and struggle with uncertain data, machine learning methods require a large amount of data and often lack transparency [13]. MCDM methods are designed to incorporate subjective judgments, manage uncertainty, and offer intuitive decision-making. Therefore, MCDM techniques provide a more comprehensive and transparent solution for sustainability-driven 3PLP selection.
The literature review on MCDM applications in 3PLP selection reveals four key emerging trends. First, existing frameworks are insufficient for effectively evaluating the sustainability potential of 3PLPs. Prior studies mainly focused on the Triple Bottom Line (TBL) approach, including economic, social, and environmental dimensions, to assess sustainable 3PLPs [14,15]. Technical factors have emerged as critical drivers of both operational efficiency and sustainability performance within organizations [16,17]. Thus, they are important indicators to evaluate sustainable 3PLPs. Nonetheless, current frameworks inadequately incorporate the role of the technical dimension. Second, existing methodologies lack the capacity to concurrently model the hesitancy and incompleteness inherent in decision-makers’ (DMs’) evaluations. Due to limited and uncertain data, DMs may be unable to provide precise assessments with full confidence. Instead, they often express hesitancy among multiple evaluation levels. In this case, DM chose to use several values simultaneously to represent the performance of 3PLPs. Moreover, incomplete assessments arise when available data are insufficient to fully support their evaluations. The literature has proposed various approaches to address vagueness and uncertainty in subjective evaluations. Advanced fuzzy sets, such as Intuitionistic fuzzy sets [18], Pythagorean fuzzy sets [19], Fermatean fuzzy sets [20], q-Rung orthopair fuzzy sets [21], and single-valued neutrosophic sets [22] capture ambiguous and uncertain information through multiple membership components. Moreover, hesitancy between evaluation levels is modeled using dual hesitant fuzzy linguistic term sets [23] and the multi-granular probabilistic linguistic information model [24]. Cheng et al. [25] deals with incomplete assessments through triangular fuzzy multiplicative preference relations. However, these approaches offer limited capability in simultaneously managing hesitancy and incomplete judgment. Third, uncertainty can also lead to inconsistencies in DM’s evaluations; however, methods for addressing these issues remain underdeveloped. In human cognition, conflicting information can significantly undermine the reliability of the decision-making process [26]. Traditional decision-making models often average out conflicting information, which may result in the loss of valuable insights during the aggregation process [27]. Therefore, there is an urgent need to develop new methods to effectively address this challenge. Fourth, the use of objective criteria weighting methods becomes preferable under uncertain cases, as subjective approaches can introduce bias into the decision-making process [19,22]. Based on the aforementioned research gaps, this study proposes a novel model to address these issues, as described below.
This study proposes a model that integrates technological considerations into the traditional TBL approach to develop a more comprehensive assessment model. Moreover, the framework incorporates Dempster–Shafer theory to address uncertainties in DMs’ assessments. Dempster–Shafer theory addresses hesitancy and incomplete information through multiple subsets or the universal set of evaluation levels, respectively. Second, instead of averaging all evidence, the Dempster–Shafer combination rule explicitly captures the relationships and similarities among evaluations [28]. However, when DMs’ evaluations exhibit high levels of conflict, the standard Dempster–Shafer combination rule may produce counterintuitive results. To mitigate this issue, the study adopts Murphy’s modified combination method [29]. Furthermore, to objectively determine the weights of evaluation criteria, the model employs an innovative approach based on Deng entropy. This technique determines criteria weights based on the uncertainty of basic probability assignments (BPAs). Compared with Shannon entropy, the proposed technique demonstrates a superior ability to account for both sets and subsets, thus providing a more comprehensive assessment of uncertainty. Finally, the Combined Compromise Solution (CoCoSo) method is applied to select the best alternative. The CoCoSo method was chosen for its robustness to variations in alternatives and criteria, offering a reliable approach for handling uncertainty in decision-making contexts [30]. Accordingly, this study aims to make four key contributions. First, it enhances the sustainable 3PLP selection literature by introducing an additional dimension to the traditional triple TBL framework. This extension enables a more comprehensive assessment of sustainability potential. Second, it extends the MCDM literature by proposing a novel hybrid model that simultaneously addresses multiple forms of uncertainty. Third, it incorporates an objective weighting method to reduce human bias and improve the robustness of results under uncertain conditions. Finally, it provides a practical decision-making framework to support firms in effectively selecting sustainable 3PLPs.
This study begins with a comprehensive review of the relevant literature on sustainable 3PLP selection under uncertainty. It subsequently introduces the proposed method, which includes the Dempster–Shafer theory, the Deng entropy weighting method, Murphy’s combination rule and the CoCoSo technique. A real-world case study is provided to illustrate the practical applicability of the model. Key findings are summarized, followed by a comparative analysis and sensitivity testing. The study concludes by discussing the implications of the results and acknowledging current limitations.

2. Literature Review

This section provides a summary of the literature on sustainable 3PLP selection.

2.1. Sustainable 3PLPs

According to Hertz and Alfredsson [31], a 3PLP handles either the entirety or portions of logistics operations, with a minimum focus on managing and executing transport and warehousing tasks. Regarding the impact on firms’ performance, 3PLPs’ delivery systems enhance the efficiency and speed of firms’ supply chains. Companies can lower shipping costs by partnering with third-party logistics providers because operating an independent delivery system demands considerable resources [32]. With their specialized expertise, 3PLPs offer firms comprehensive logistics solutions while allowing them to focus on expanding their core operations [33]. Additionally, 3PLPs play crucial roles in both customer relations and service delivery by providing customized services and acting on behalf of their clients [3]. These advantages drive the third-party logistics industry to grow rapidly within the current unpredictable and highly competitive market environment [34].
The logistics industry confronts significant environmental challenges. Logistics operations account for around 7 percent of worldwide greenhouse gas emissions, primarily due to energy-intensive road and maritime transportation [4]. Consequently, these environmental challenges present particularly substantial threats to the logistics sector as government regulations have intensified to mitigate environmental impacts [33]. This compels 3PLPs to implement sustainable practices, including the adoption of renewable energy sources, the use of energy-efficient building materials, and route optimization strategies, to remain compliant with regulatory standards [7,35]. A prime example is DHL, a prominent logistics company that has replaced heavy oil with sustainable biofuels to power its container ships [36]. Similarly, Maersk has also designed a battery energy storage solution for ships aimed at improving marine efficiency and promoting sustainability [37].
Modern consumers are progressively prioritizing spending on products aligned with environmental, social, and governance values [38]. Governments worldwide are pressuring firms to prioritize environmental values in their business practices. Thus, environmental concerns such as heightened pollution and resource consumption compel firms to modify their operations to align with customers’ demands for sustainable practices and government regulations [39,40]. Albino et al. [41] and Yadav et al. [42] point out that collaborations with sustainable 3PLPs not only enhance a company’s competitiveness but also its overall environmental performance. In particular, 3PLPs are essential in lessening the environmental impact of the supply chain by reducing greenhouse gas emissions, waste disposal issues, and other environmental burdens [6]. Selecting the right sustainable 3PLPs is crucial for improving both a firm’s operational efficiency and sustainability performance. This selection process requires balancing several criteria, underscoring the need for a comprehensive MCDM approach.

2.2. Evaluation Framework for Sustainable 3PLP Selection

In the past, efficiency and capacity were the dominant factors in choosing logistics service providers [43,44]. In recent years, there has been a growing emphasis on environmental considerations. The TBL approach, which includes economic, social, and environmental aspects, has been widely employed in studies assessing sustainable 3PLPs, as demonstrated by Ercan et al. [45] and Nila and Roy [46]. Hofmann and Osterwalder [47] show that 3PLPs only focused on standard services, risk losing market share as digitalization enables customers and suppliers to integrate logistics services independently. Embracing technology in 3PLPs can boost competitiveness and enable tailored service offerings [17]. From a theoretical perspective, technological infrastructure and digital capabilities act as enablers of sustainable logistics practices [16]. For example, advanced technologies such as route optimization systems, real-time tracking, and energy-efficient logistics platforms improve operational efficiency, thereby reducing fuel consumption, emissions, and resource waste. Furthermore, digitalization enhances transparency and data availability, supporting sustainability monitoring and compliance with environmental standards. Consequently, technical capability is not merely an operational factor but a critical driver that mediates the relationship between logistics activities and sustainability performance. However, the traditional TBL model inadequately addresses technological factors, highlighting the need for a more comprehensive framework to assess sustainable 3PLPs.

2.3. Sustainable 3PLP Selection Under Uncertainty

According to Van Asselt and Rotmans [48], uncertainty arises from variability induced by natural changes, shifts in the social environment, and technological advancements, as well as from limited knowledge. Accordingly, in the context of selecting 3PLPs, uncertainties stem from changes in customers’ preferences and a lack of transparency regarding logistics providers’ operational practices. In sustainable 3PLP selection, these challenges are compounded by the need to evaluate providers’ environmental practices, such as green packaging and waste management. These criteria are both complex to measure and often constrained by limited data. Consequently, these uncertainties result in ambiguous and conflicting assessments. This highlights the need for a robust method to address these challenges effectively to select the most suitable sustainable providers.
Numerous studies have explored 3PLP selection through various MCDM methods to address ambiguity and uncertainty, but research specifically focused on selecting sustainable ones remains limited. To handle vague and uncertain assessments, various fuzzy sets are introduced. Intuitionistic fuzzy sets [49] introduce an extended structure incorporating membership, non-membership, and hesitation. For instance, a DM may assign degrees of 0.6 for membership, 0.2 for non-membership, and 0.2 for hesitation, reflecting both belief and doubt. Subsequent developments, such as Pythagorean fuzzy sets [19], Fermatean fuzzy sets [20], q-rung orthopair fuzzy sets [21], and single-valued neutrosophic fuzzy sets [22], relax the traditional mathematical constraints, allowing for greater flexibility in uncertainty modeling. However, these fuzzy sets often remain restricted to modeling uncertainty within a single linguistic descriptor. To explicitly capture hesitancy across varying levels of assessment, dual hesitant fuzzy linguistic term sets [23] enable DMs to articulate uncertainty using multiple linguistic terms simultaneously; for example, expressing performance as “between high and very high”. Similarly, the multi-granular probabilistic linguistic information model [24] allows assignment of probabilistic weights across various linguistic assessments, such as 60% for “good,” 30% for “very good,” and 10% for “excellent”. Moreover, DMs tend to provide incomplete assessments due to limited data to support their opinions. Cheng et al. [25] adopted incomplete triangular fuzzy multiplicative preference relations to handle the incomplete information, involving incomplete information, where available data is insufficient to support definitive evaluation levels. Furthermore, decision-making processes often involve multiple DMs with diverse perspectives. Thus, aggregating their inconsistent assessments without losing critical information remains a significant challenge, and methods to address this issue are still underdeveloped. A critical review of the current 3PLP selection literature reveals that frameworks capable of simultaneously capturing hesitancy, incomplete data, and conflicting information have received relatively little attention.
The recent literature increasingly favors objective weighting methods to address subjective errors. Nila and Roy [46] utilized the Logarithmic Percentage Change-Driven Objective Weighting method to assign criteria weights. Niu et al. [19] proposed a hybrid subjective-objective approach for selecting medicine cold chain logistics providers. Rong et al. [21] combined the Best Worst method and entropy to determine criteria weights for sustainable third-party reverse logistics providers. Additionally, the entropy method was used to obtain the criteria weights in studies by Liao et al. [24] and Chen et al. [50] and the Criteria Importance Through Intercriteria Correlation technique was adopted by Mishra and Rani [22] and Mishra et al. [20].
A thorough examination of the recent literature shows:
-
There is a notable gap in frameworks capable of simultaneously managing DMs’ hesitancy, conflicting assessments, and incomplete evaluations.
-
Adopting objective weighting methods for criteria is widely favored when evaluating 3PLPs under uncertainty.
To fulfill the research gaps above, we propose an extended TBL model and an innovative approach that combines Dempster–Shafer theory, Murphy’s combination rule, and Deng Entropy weighting method with the CoCoSo technique to support the selection of sustainable 3PLPs. In this approach, Dempster–Shafer theory is applied to handle uncertainty. Murphy’s combination rule is used to consolidate evaluations. A Deng entropy-based method determines criteria weights. CoCoSo is employed to rank these providers. The proposed model is described in the following section.

3. Proposed Models

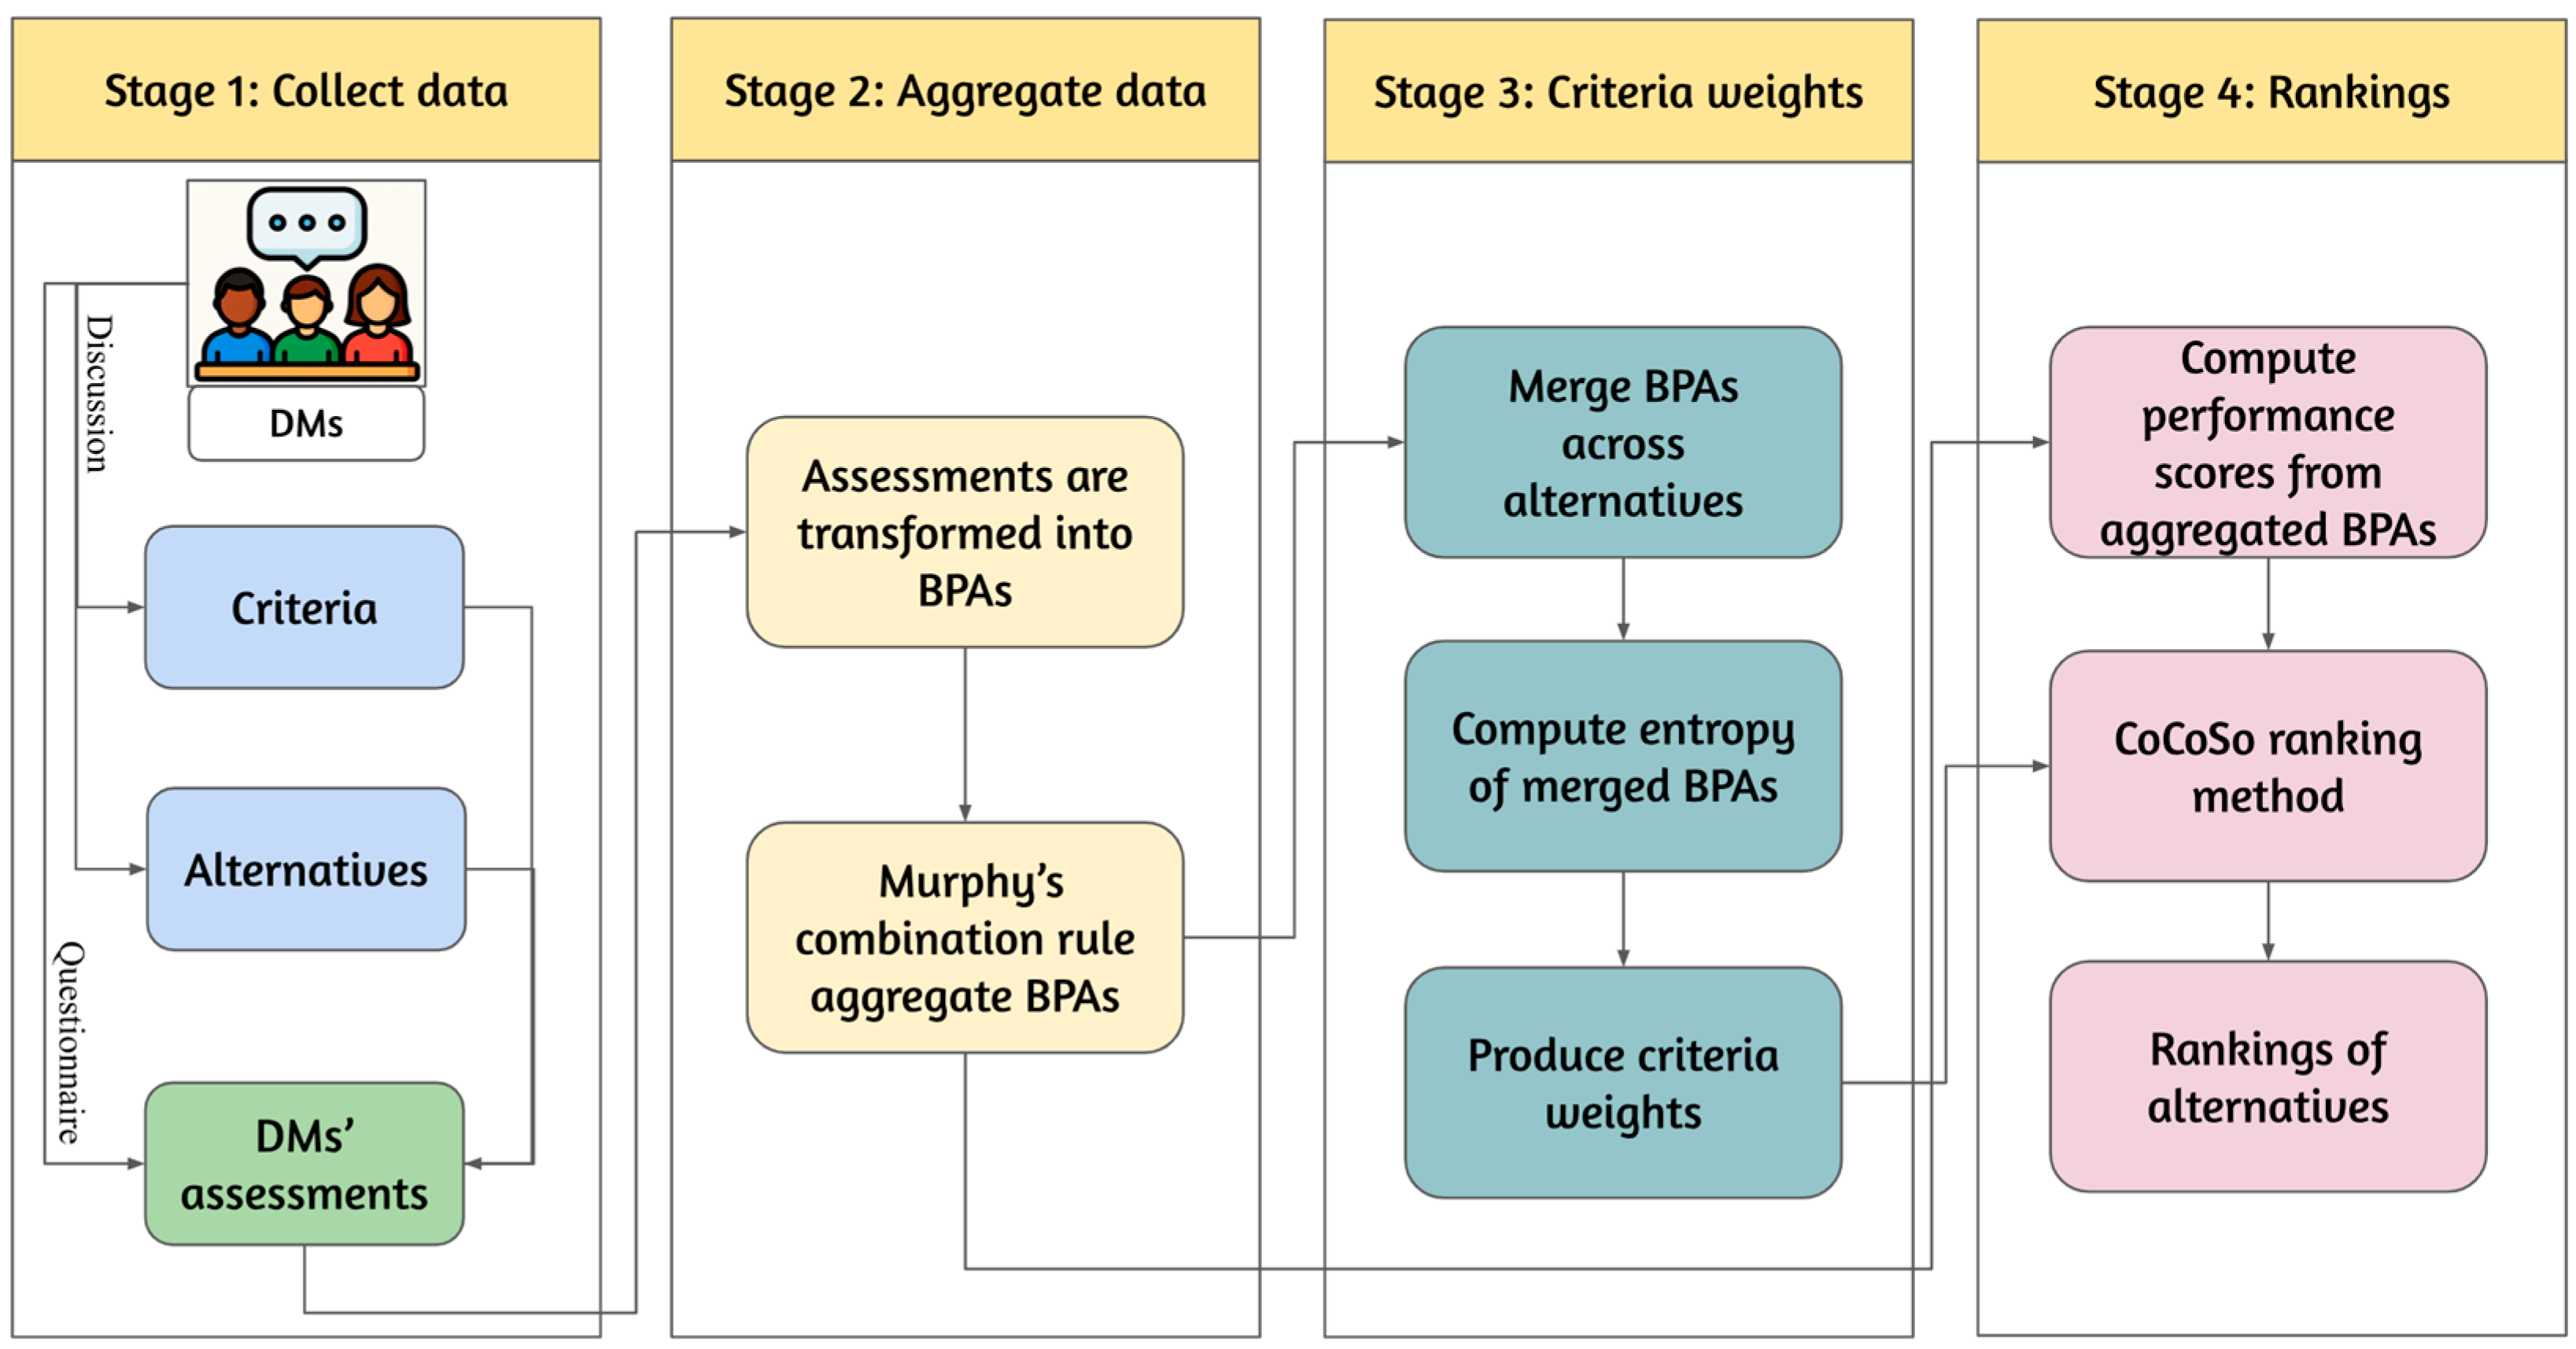
Our model includes four stages, as shown in Figure 1. First, criteria and alternatives are identified through the literature review and discussions with the DMs. Questionnaires are distributed to collect their evaluations. Second, the DMs’ evaluations are transformed into discounted BPAs and subsequently combined using Murphy’s rule. Third, a Deng entropy-based method is used to determine the criteria weights. Fourth, the Dempster–Shafer-based CoCoSo method is used to rank the alternatives.
Table 1 displays the notations and their corresponding meanings to facilitate the presentation of the methods.

3.1. Define Evaluation Criteria, Alternatives and Collect Data

The first step is to define a set of criteria and alternatives. Evaluation criteria are derived from the literature based on an extended TBL approach, including economic, social, environmental and technical dimensions. The criteria are initially selected from the literature and then refined to suit the context through discussions with DMs. The DMs also suggest potential providers based on their expertise.
Following the construction of criteria and alternatives, DMs are invited to provide their assessments through structured questionnaires, comprising two sections: an evaluation section and a confidence level section. In the evaluation section, DMs indicated their preferences by assigning ratio values to one or several subsets of linguistic scales in Table 2. There are five performance levels, denoted by θ = {e1, e2, e3, e4, e5}. In the confidence section, DMs expressed their confidence using the linguistic scales in Table 3.

3.2. Using the Dempster–Shafer Approach to Integrate the Data

After gathering DMs’ evaluations for each alternative with respect to each criterion, we transform and aggregate the data to produce performance scores. In the MCDM context, DMs’ evaluations serve as evidence, θ represents performance levels of alternatives and the power set 2 θ denotes all possible subsets of performance levels. This allows DMs to express their hesitancy. The mass belief of the entire frame of discernment, m θ , represents incompleteness when DMs lack sufficient evidence to support any specific ez. Thus, m θ denotes the missing part in the incomplete information. The process for aggregating DMs’ judgments based on Dempster–Shafer theory is outlined in the following steps.
  • Step 1: Convert evaluations into discounted BPAs
First, ratio values are normalized to the [0, 1] range. The normalized value p ¯ v is computed using Equation (1). The normalized values are then assigned to the corresponding subsets to generate initial BPAs.
p ¯ v = p v v = 1 d p v
Second, discounted BPAs are computed using Equations (2) and (3). Dempster–Shafer theory incorporates DMs’ confidence levels through this discounting method. The process is applied when DMs believe a BPA is reliable, with the confidence value of γ . Under this condition, the discounted BPA m γ is computed according to the value of γ as follows.
m γ N = γ × m N , N 2 θ
m γ θ = 1 γ + γ × m θ ,
  • Step 2: Aggregate evaluations
After discounted BPAs are generated, a combination rule is applied to aggregate the evaluations from DMs. According to the Dempster–Shafer combination rule, BPAs m1 and m2 from two different DMs are merged with the resulting combined mass function expressed as
m E = F G = E m 1 F m 2 G 1 H   ,
with
H = F G = m 1 F m 2 G .
However, the Dempster–Shafer combination rule has been criticized for producing unreasonable results when conflict levels are high [51]. Moreover, it becomes ineffective when the evidence is completely contradictory. Consequently, alternative rules—such as those proposed by Yager [52], Dubois and Prade [53], and Murphy [29] have been proposed. Yager’s rule is criticized for introducing high uncertainty in the outcomes, while Dubois and Prade’s rule is limited to cases with highly conflicting evidence, as explained by Yang and Xu [54]. Therefore, this study applies Murphy’s combination rule given in Equations (4)–(6) to combine data, as it consistently yields reasonable results [55,56,57]. A comparative example of the traditional Dempster–Shafer combination rule and Murphy’s rule is presented in Appendix A to verify its advantages. Murphy’s rule first averages k pieces of evidence from k DMs using
m ¯ N = 1 k w = 1 k m w N .
After that, it employs the Dempster–Shafer combination process k − 1 times using Equations (4) and (5). The results are performance scores, xij, expressed as BPAs.

3.3. Use Deng Entropy Weighting Technique to Calculate Criteria Weights

The Deng entropy-based weighting method is employed to derive objective weights for criteria [58]. Deng entropy extends the conventional Shannon entropy by enabling the quantification of uncertainty over subsets, thus offering a more comprehensive measure of information uncertainty [59]. When subsets are not present, Deng entropy reduces to the standard Shannon entropy. Thus, the Deng entropy weighting method is suitable for a Dempster–Shafer-Based MCDM method. The technique is presented as follows. First, performance scores with respect to criteria Cj are combined across alternatives using Murphy’s rule to produce a combined BPA, denoted by Pj. Next, the Deng entropy is used to measure the uncertainty associated with Pj through
D E j = N θ m N log 2 m N 2 N 1 ,
where DEj is the Deng entropy value of Pj.
The resulting Deng entropy value DEj is then normalized to a [0, 1] scale via
D E j norm = D E j j = 1 n D E j   ,
where n signifies the number of criteria.
The weight of criteria Cj, denoted by wj, is then calculated using Equation (9). Thus, criteria with higher entropy values are assigned lower weights due to their greater uncertainty, whereas criteria with lower entropy values receive higher weights, reflecting their lower levels of uncertainty.
w j = 1 D E j n o r m j = 1 n 1 D E j n o r m

3.4. Selecting the 3PLPs Using Dempster–Shafer-Based CoCoSo

The CoCoSo method is a novel ranking technique proposed by Yazdani et al. [60]. The approach incorporates a distance measure based on the gray relational coefficient, designed to improve the adaptability and precision of the results. Studies indicate that the CoCoSo method provides greater consistency and robustness than other decision-making techniques [61]. The proposed method is particularly suitable for decision-making under uncertain environments due to its stability when changes occur in the set of alternatives or criteria [30]. Moreover, although relatively new, the CoCoSo method has been applied across various domains, including supply chain management [62], risk management [63], and sustainable energy [64]. However, the CoCoSo method alone cannot adequately address uncertainty and therefore requires integration with complementary techniques. To this end, Dempster–Shafer theory is incorporated into the CoCoSo framework to account for uncertainties in the DMs’ evaluations prior to the ranking process. The detailed ranking procedure is described as follows.
Dempster–Shafer theory assigns belief to sets of possibilities rather than individual elements, which can complicate the decision-making process. To address this, the pignistic probability function [65] is employed to transform a BPA into a probability distribution, as shown below.
d l = e l N θ 1 N m N 1 m θ
where l = 1, 2, …, 5.
Let the performance score x i j be defined based on a discrete set of performance levels, denoted by θ = {e1, e2, e3, e4, e5} and their numerical values are defined as 1, 2, 3, 4 and 5, respectively. Additionally, the probability distributions over these performance levels are d1, d2, d3, d4, and d5, respectively. The expected value of x i j is then calculated as the weighted sum of the performance levels and their associated probabilities, as shown in Equation (11).
x i j = d 1 × 1 + d 2 × 2 + + d 5 × 5 .
The decision matrix is then defined as X = x i j m × n , where m and n denote the numbers of alternatives and criteria, respectively, as shown below
X i j = x 11 x 12 x 1 n x 21 x 22 x 2 n x m 1 x m 2 x m n , i = 1,2 , , m ; j = 1,2 , , n .
The values are normalized using Equation (13) for benefit criteria and Equation (14) for cost criteria.
f i j = x i j min i   x i j max i   x i j min j   x i j ,
f i j = max i   x i j x i j max i   x i j min i   x i j .
The total weighted compatibility sequence and the total power weight of compatibility sequence are calculated in Equations (15) and (16), respectively.
Q i = j = 1 n w j f i j ,
R i = j = 1 n f i j w j ,
where wj is the weight of the jth criteria.
Relative weights of alternatives are derived from three utility functions using
t i a = Q i + R i i = 1 m Q i + R i ,
t i b = Q i min i   Q i + R i min i   R i ,
t i c = α Q i + 1 α R i α   max i   Q i 1 α + max i   R i ; 0 α 1 .
The final ranking is determined based on the value ti (the larger the better), using
t i = t i a t i b t i c 1 3 + 1 3 t i a + t i b + t i c .

4. Empirical Example

The proposed methodology is demonstrated through the selection of sustainable 3PLPs for a textile enterprise. The company is a large-scale textile manufacturer and Tier-1 supplier for major international brands, including Europe, Japan, and Korea. The company employs over 5000 personnel to manage an extensive, multi-tiered supply chain. The firm operates in a highly seasonal and volatile environment and relies on complex multi-modal transportation systems. Consequently, seamless coordination with multiple 3PLPs is required to ensure just-in-time delivery and mitigate international shipping disruptions. Furthermore, as a participant in global sustainability initiatives, the enterprise adheres to strict environmental standards, such as ISO 14001 [66] and zero-discharge hazardous chemical policies, which mandate a rigorous evaluation of 3PLPs based not only on cost and speed but also on green performance and carbon footprint transparency. The study involved a panel of 10 DMs from relevant departments within the company, denoted by E = {E1, E2, …, E10}. This included three representatives from the procurement department, three from the import-export department, three from the sales department and one from the warehouse department. The panel comprised four males and six females, with many years of professional experience. The analysis results are presented as follows.

4.1. List of Criteria and Alternatives and Data Collection

Through an intensive literature review and discussions with DMs, 15 criteria are selected, denoted by C = {C1, C2, …, C15}, as shown in Table 4. The selected criteria encompass economic, social, environmental, and technical aspects. In comparison to the previous TBL approach, two additional technical criteria (C14 and C15) have been introduced and validated by DMs. Four potential logistics companies are also identified for the selection process, denoted by A1, A2, A3, and A4. Provider A1 is a large-scale industry leader with over 25 years of experience, prioritizing brand reputation and operational consistency. Provider A2 functions as a mid-sized specialist established about a decade ago, focusing on premium agility and technical expertise. Provider A3 is a small, lean market entrant founded within the last five years that competes primarily on cost and innovative green materials to gain a foothold. Finally, Provider A4 is a large, mature firm established nearly 20 years ago that centers its strategy on corporate governance, compliance, and service quality.
Subsequently, questionnaires were distributed to DMs to gather their assessments. Table 5 shows the evaluation of alternative A1 with respect to criterion C1. Consider the evaluation made by E1 of alternative A1 with respect to criterion C1. The evaluation indicates the DM believes performance levels of A1 fall into two subsets: “Low” or “Medium and High”. The belief associated with “Medium and High” is twice as strong as that for “Low”. The confidence level is between “Mostly certain” and “Completely certain”, which is 0.9.

4.2. Dempster–Shafer-Based Approach to Aggregate the DMs’ Judgements

After data is collected, it is transformed and aggregated. This process is divided into two main steps.
  • Step 1: Convert evaluations into discounted BPAs
Evaluations in Table 5 are first converted into initial BPAs using Equation (1) and then into discounted BPAs using Equations (2) and (3). Table 6 displays the results. Take the assessment of E1 for A1 under criterion C1 as an example to demonstrate the calculation process. First, the normalized values are computed as shown below. These numbers are used to generate initial BPAs (m{e2} = 0.333, m{e3, e4} = 0.667).
p 1 = 1 1 + 2 = 0.333
p 2 = 2 1 + 2 = 0.667
Second, discounted BPAs are computed as follows.
m { e 2 } = 0.9 × 0.333 = 0.3
m   { e 3 , e 4 } = 0.9 × 0.667 = 0.6
m { θ } = 1 0.9 + 0.9 × 0 = 0.1
  • Step 2: Aggregate evaluations
After discounted BPAs are generated, they are integrated using Murphy’s combination rule. First, the average BPAs m ¯ are calculated using Equation (6). Taking m{ θ } as an example, the calculation process is shown below.
m ¯ { θ } = 0.1 + 0 + + 0.2 10 = 0.24
Performance scores are computed by combining their corresponding average BPA m ¯ values nine times using Equations (4) and (5). Again, using the first iteration, A1 under C1 as an example, the results are shown in Table 7. Conflict level H and mass value for e2 are computed as shown below.
H = 0.03 ×   0.147 + 0.03 ×   0.023 + + 0.077 × 0.153 = 0.179
m { e 2 } = 0.03 × 0.03 + 0.03 × 0.077 + . . . + 0.077 × 0.08 0.179 = 0.045

4.3. Objective Criteria Weights

Similar to the previous combination process, the performance scores under each criterion are combined across four alternatives using Equations (4)–(6). The results are displayed in Table 8.
Deng entropy values for criteria are computed using Equation (7). For example, the Deng entropy weight for criteria C1 is as shown below.
D E 1 = 0.078 × log 2 0.078 2 1 1 + 0.920 × log 2 0.920 2 1 1 + 0.003 × log 2 0.003 2 1 1 = 0.421 .
Normalized Deng entropy values and criteria weights are determined using Equations (8) and (9), respectively. Table 9 shows the results.

4.4. Selecting the Alternative Using Dempster–Shafer-Based CoCoSo

Firstly, BPAs are converted into crisp values to facilitate the decision-making process. Secondly, the CoCoSo method is applied to rank alternatives.
Performance scores in BPA forms are transformed into probabilities of evaluation levels using Equation (10). The results are displayed in Table 10. Take performance e3 for alternative A1 with respect to C1 as an example, the calculation process is demonstrated as follows:
d 3 = 0.374 1 + 0.04 2 + 0.001 3 = 0.394 .
The comparison matrix X is determined based on the expected performance score xij using Equation (11). Table 11 displays the defined matrix. Take A1 to C1 as an example, the expected performance score is computed as follows.
x 11 = 0 × 1 + 0.002 × 2 + 0.394 × 3 + 0.590 × 4 + 0.014 × 5 = 3.614
The obtained matrix is used to rank sustainable 3PLPs through the CoCoSo method. First, the normalized matrix is computed using Equations (13) and (14). Second, Qi and Ri are determined through Equations (15) and (16). Three utility functions and ti, are computed using Equations (17)–(20). The results are shown in Table 12. Based on the values ti (with α = 0.5), company A4 is the best sustainable 3PLP, followed by A1, A2 and A3.

5. Discussion

This section is divided into two parts. First, we discuss the theoretical and managerial implications of the results. Then, we compare the proposed model with other existing models and conduct a sensitivity analysis.

5.1. Theoretical Contributions and Management Implications

This study makes several theoretical contributions to the field of sustainable 3PLP selection under uncertainty and the MCDM literature. By extending the conventional TBL framework to include technical infrastructure and technical manpower, the study addresses a significant gap in prior studies where the integration of technical capabilities into 3PLP evaluations has been insufficient. The inclusion of these criteria facilitates a more comprehensive framework for assessing sustainable 3PLPs, particularly as technology and sustainability converge within the context of Industry 5.0. Thus, this study can serve as a reference for future research on assessing sustainable 3PLPs. Moreover, the study advances the MCDM literature by incorporating Dempster–Shafer theory to effectively manage incomplete and uncertain data. For instance, Dempster–Shafer theory allows the representation of hesitancy among multiple evaluation levels, such as {e3, e4}, and enables the handling of incomplete information using { θ }. The application of Murphy’s combination rule within Dempster–Shafer theory preserves critical information while mitigating counterintuitive aggregation results. The application of the Deng entropy weighting method enables the objective determination of criteria weights, reducing dependence on subjective judgments and enhancing the transparency and reliability of the evaluation process. The results indicate that the criteria weights are generally similar, with slight variations attributable to the comparable quality of information across the criteria. Consequently, the findings are consistent with previous studies employing entropy-based methods, such as Liao et al. [24] and Chen et al. [50]. Moreover, similar criteria weights are also echoed by subjective methods. For instance, Yuan et al. [75] determined the criteria weights using the decision-making trial and evaluation laboratory method. However, the Analytical Hierarchy Process weighting approaches employed by Perçin [76] and Qureshi et al. [77] yield significant differences in the criteria weights.
From a managerial perspective, the proposed model offers a practical decision-support tool for logistics and procurement managers selecting sustainable 3PLPs under uncertain and conflicting information. By facilitating the balanced integration of economic, social, environmental, and technical perspectives, the framework aligns provider evaluations with the growing emphasis on sustainability and technological advancement. The framework provides a robust evaluation mechanism to enhance supplier selection processes, thereby mitigating the operational and reputational risks associated with unsustainable practices and supporting compliance with evolving environmental regulations. To implement this model operationally, firms can utilize Microsoft Excel to execute the computational steps. Excel is recommended due to its widespread availability and high interpretability, allowing managers to audit the logic behind each decision stage. By leveraging built-in logical and mathematical functions, all equations, including the BPA transformations and CoCoSo ranking, can be integrated into a dynamic template that facilitates real-time sensitivity analysis and group decision-making. The analysis results indicate that although company A4 is the best-performing option, its performance score for green packaging (C11) is significantly low compared to other companies. A4 can address this by executing a systematic packaging audit to identify material inefficiencies and volumetric excess, transitioning to recyclable or reusable substrates, and deploying targeted staff training for standardized recycling compliance. Moreover, it is important for 3PLPs to enhance sustainability to meet customers’ preferences as well as government regulations. Thus, 3PLPs need to improve not only economic criteria, such as cost efficiency and service quality, but also social and environmental criteria, including employee well-being, social responsibility, and waste management. Accordingly, firms should adopt sustainability strategies, such as green technologies, route optimization, employee welfare programs, and effective waste management practices.

5.2. Model Comparisons and Sensitivity Analysis

In this study, a novel framework is proposed for assessing sustainable 3PLPs, which considers incomplete assessments and refines the Dempster–Shafer rule using Murphy’s combination rule to ensure reasonable results. To evaluate its effectiveness, the proposed model is compared with two alternative models to examine differences in the resulting assessments:
-
Model 1: When DMs’ evaluations are assumed to be complete.
-
Model 2: When the conventional Dempster–Shafer combination is applied.
Table 13 summarizes the comparisons. The comparison reveals that the rankings of alternatives differ significantly between the proposed method and existing approaches. Notably, the most ideal 3PLP identified by the proposed model (A4) is ranked second by the other methods. Instead, A2 and A1 are considered the best options in alternative models. Specifically, neglecting to consider DMs’ incomplete judgments may result in misleading conclusions; for instance, incorrectly prioritizing alternative A1 over others. Moreover, through the integration of Murphy’s combination rule, the model avoids unreasonable results and prevents the selection of suboptimal alternatives such as option A2, as shown in Model 2.
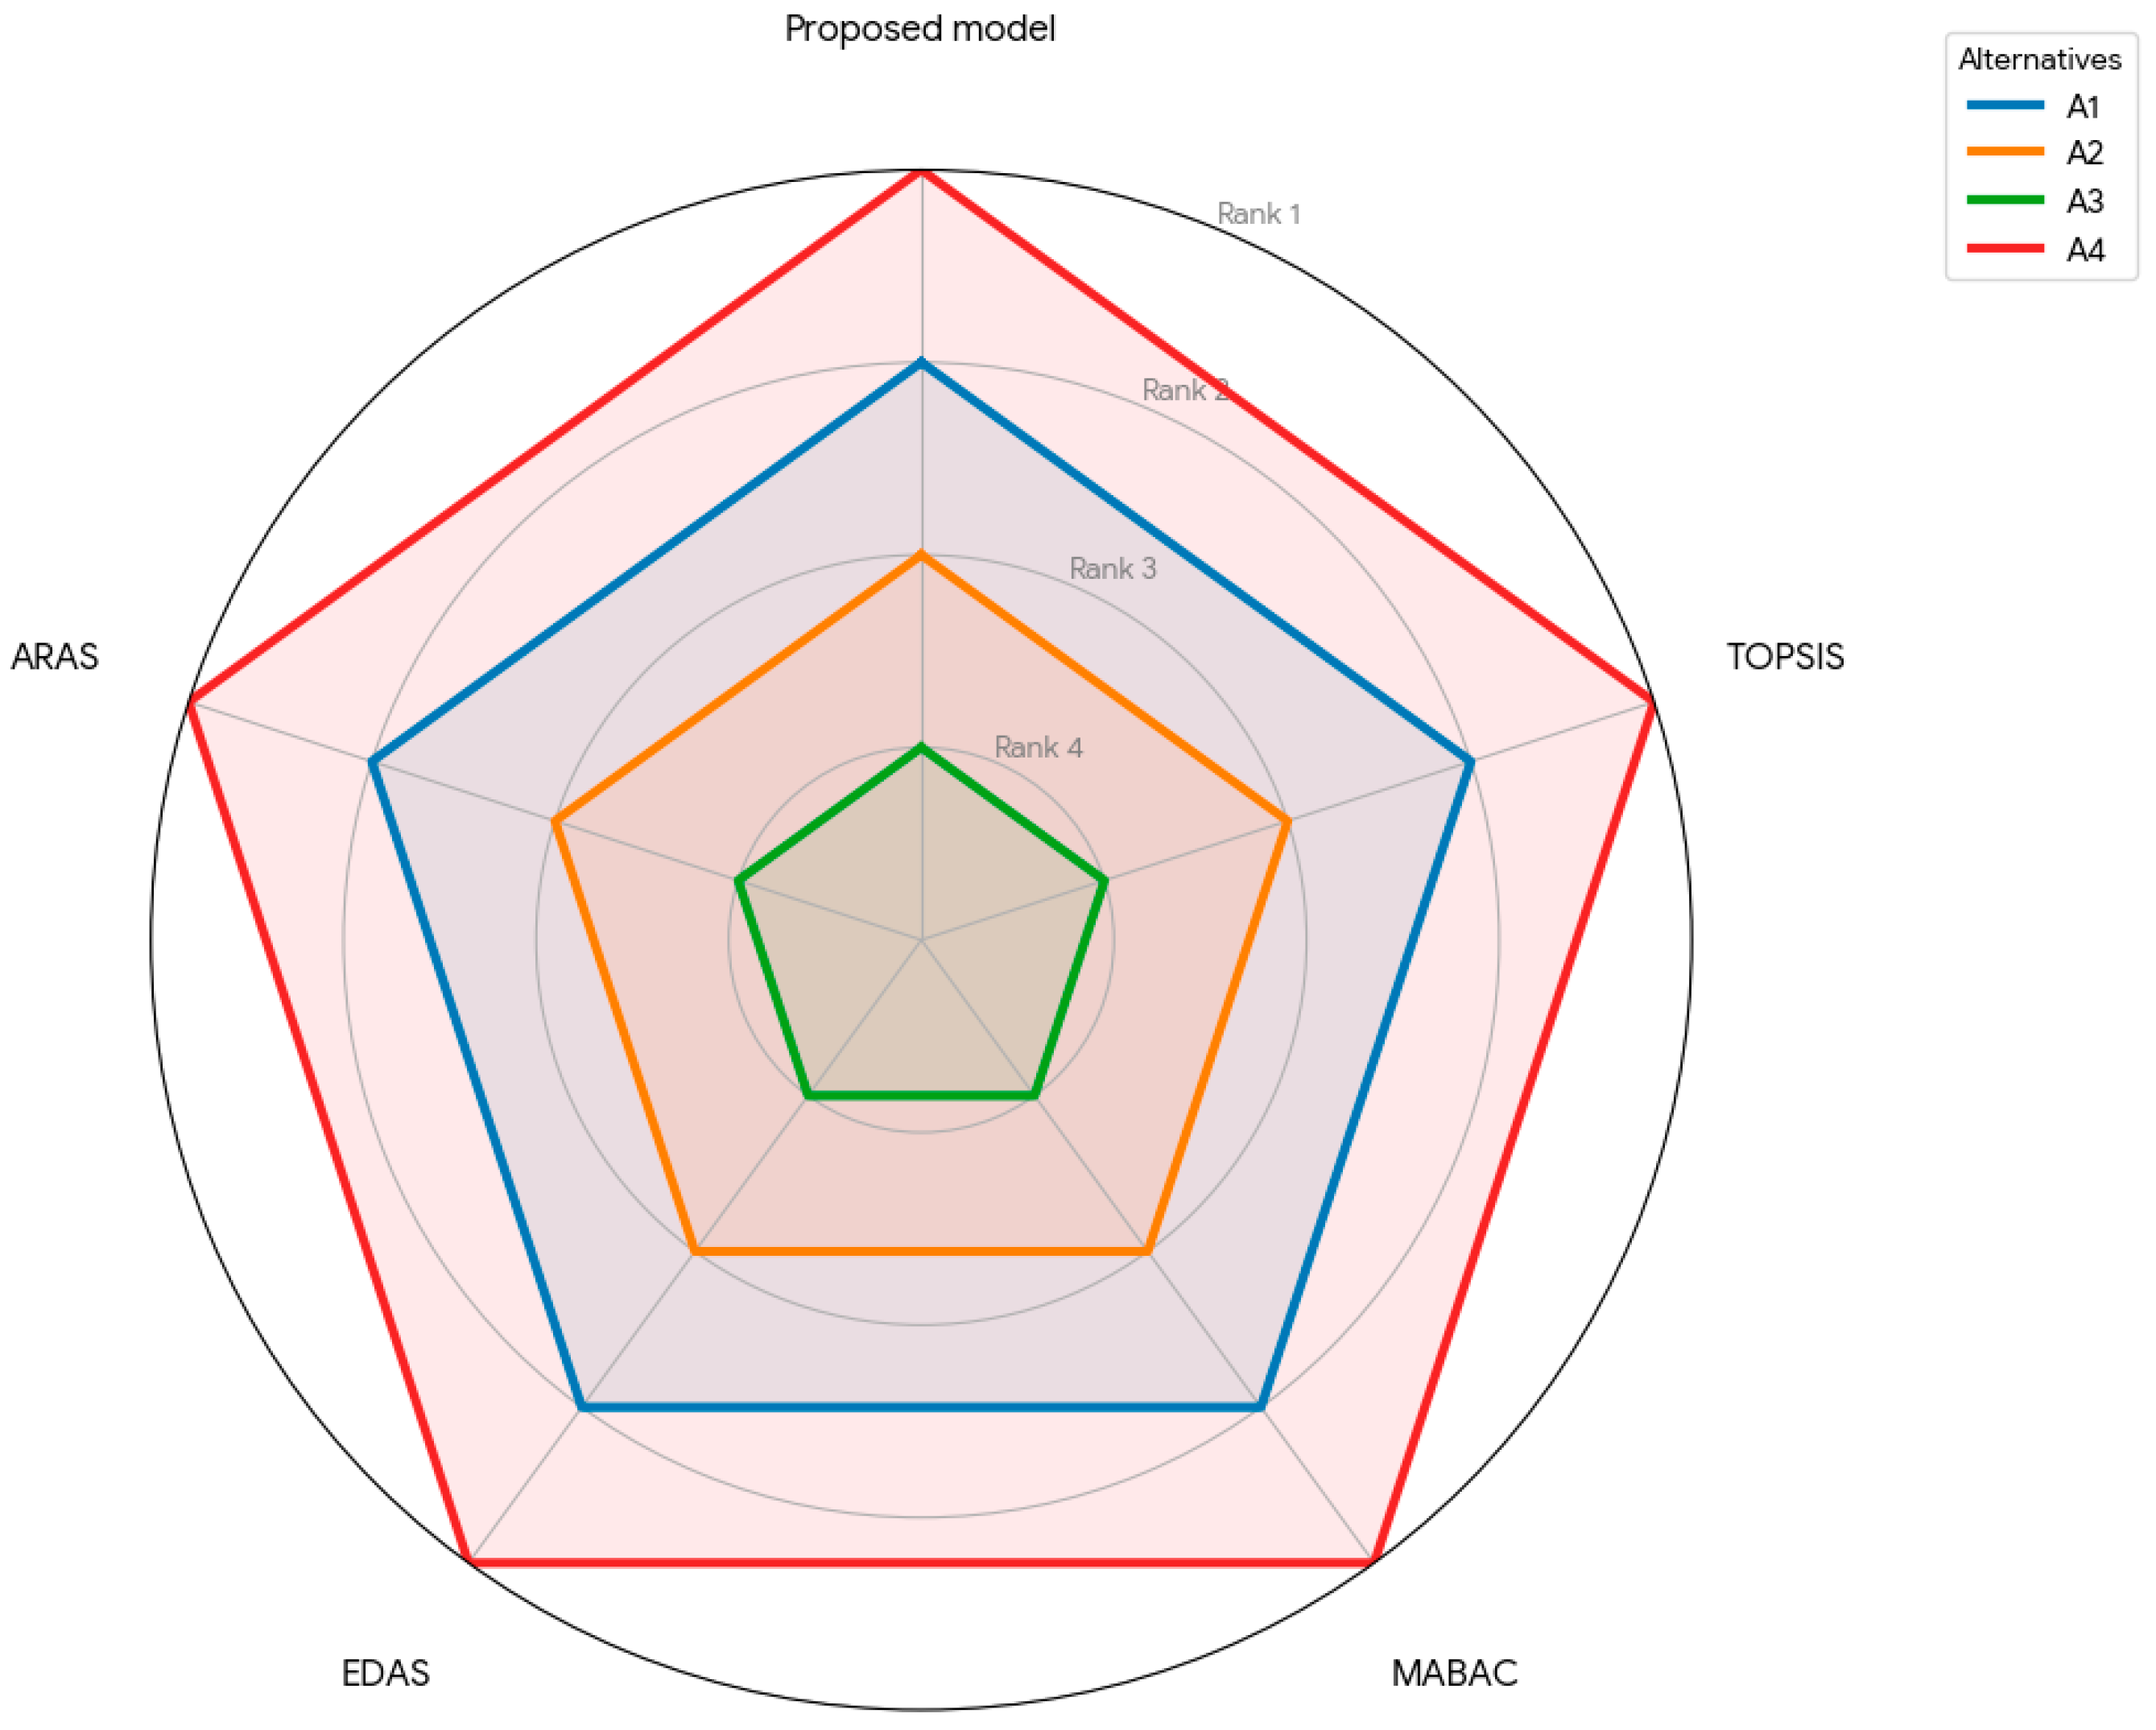
Moreover, to validate the reliability and robustness of the proposed model, it is compared with well-established ranking methods, including the Technique for Order Preference by Similarity to Ideal Solution (TOPSIS), Multi-Attributive Border Approximation Area Comparison (MABAC), Evaluation Based on Distance from Average Solution (EDAS), and Additive Ratio Assessment (ARAS), as illustrated in Figure 2. The results indicate that the proposed model produces rankings that are largely consistent with those obtained from these benchmark methods, thereby demonstrating its reliability and robustness.
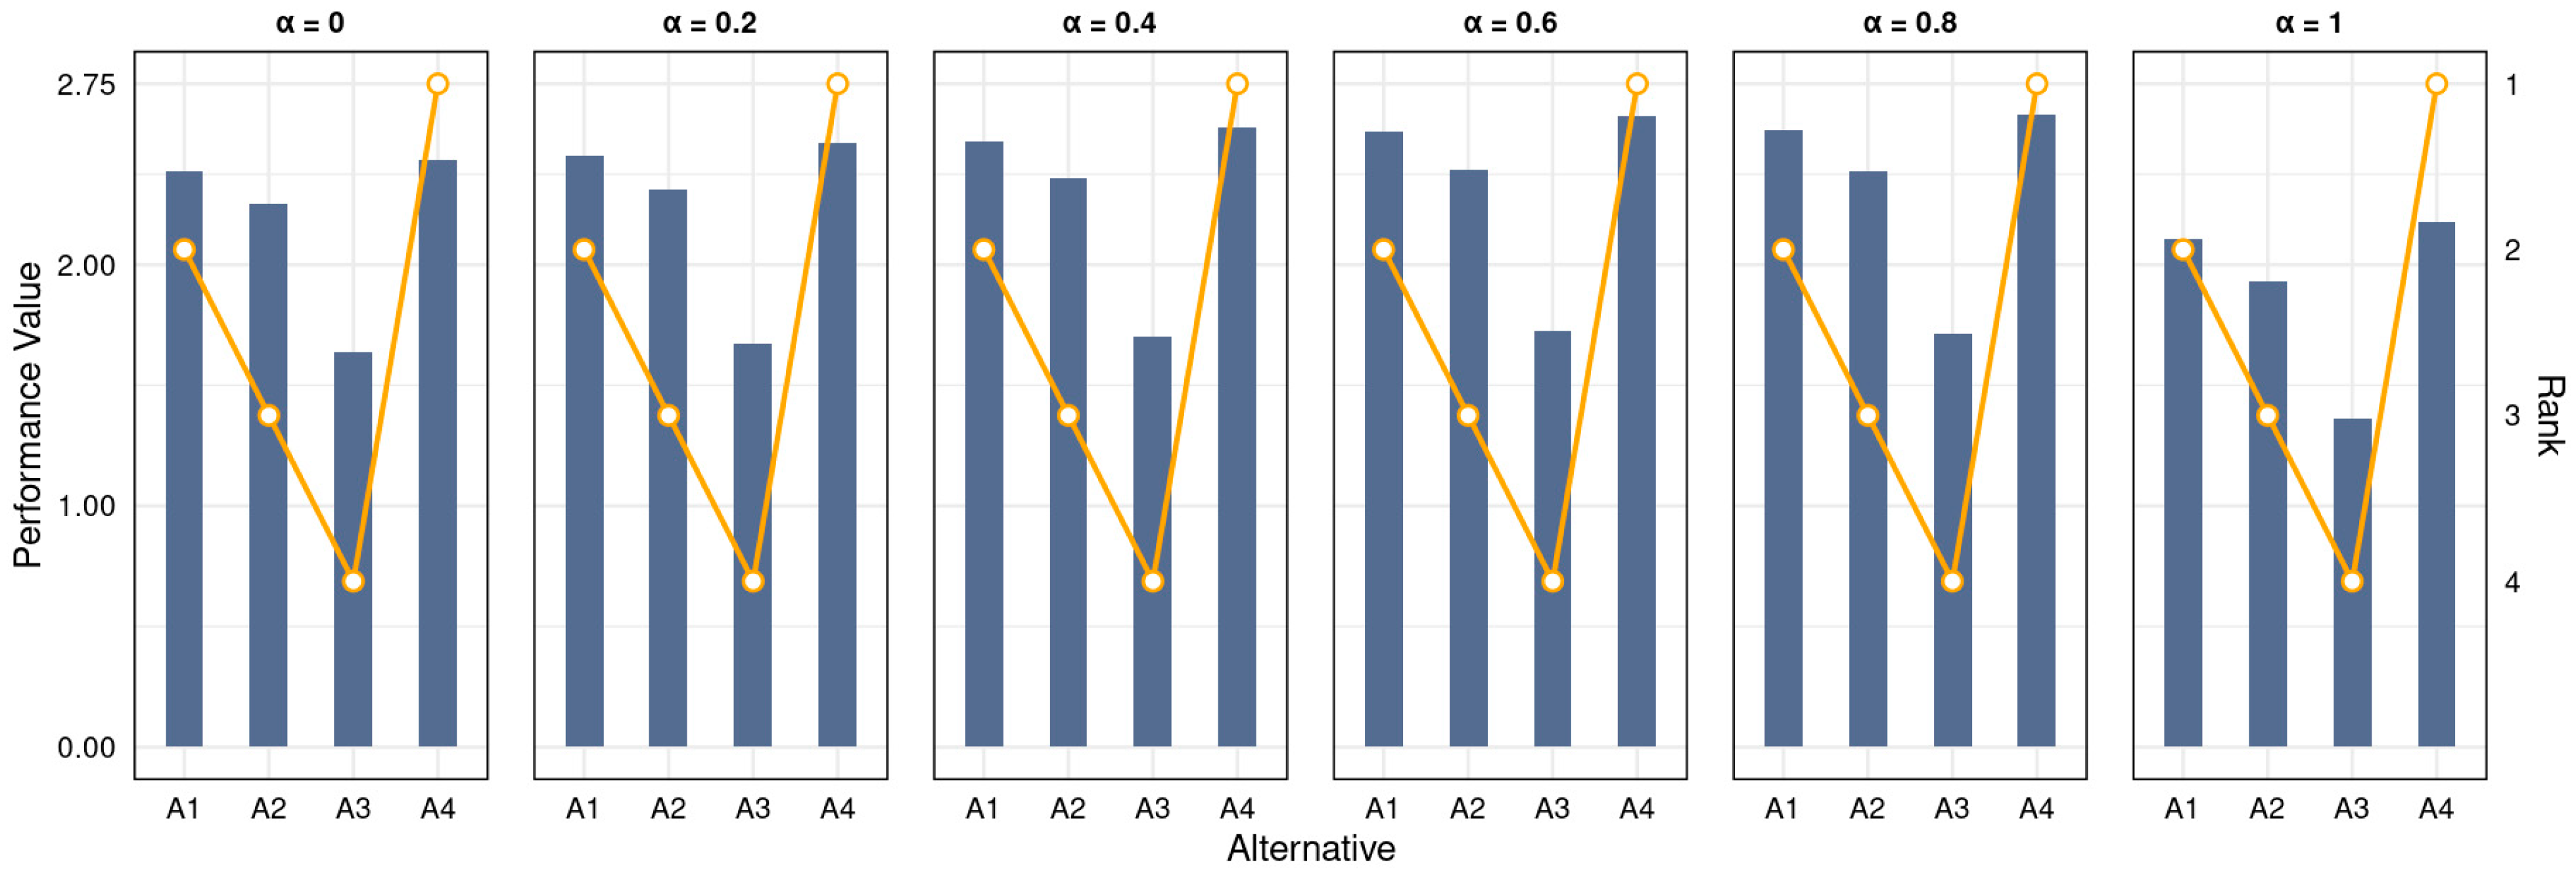
In addition to the model comparison, two sensitivity analyses were conducted. The first aimed to verify the robustness of the CoCoSo results by varying the α parameter in Equation (19). As illustrated in Figure 3, while the performance scores of the alternatives exhibit slight variations across different α values, their overall ranking order remains consistent, thereby affirming the robustness and stability of the proposed CoCoSo model.
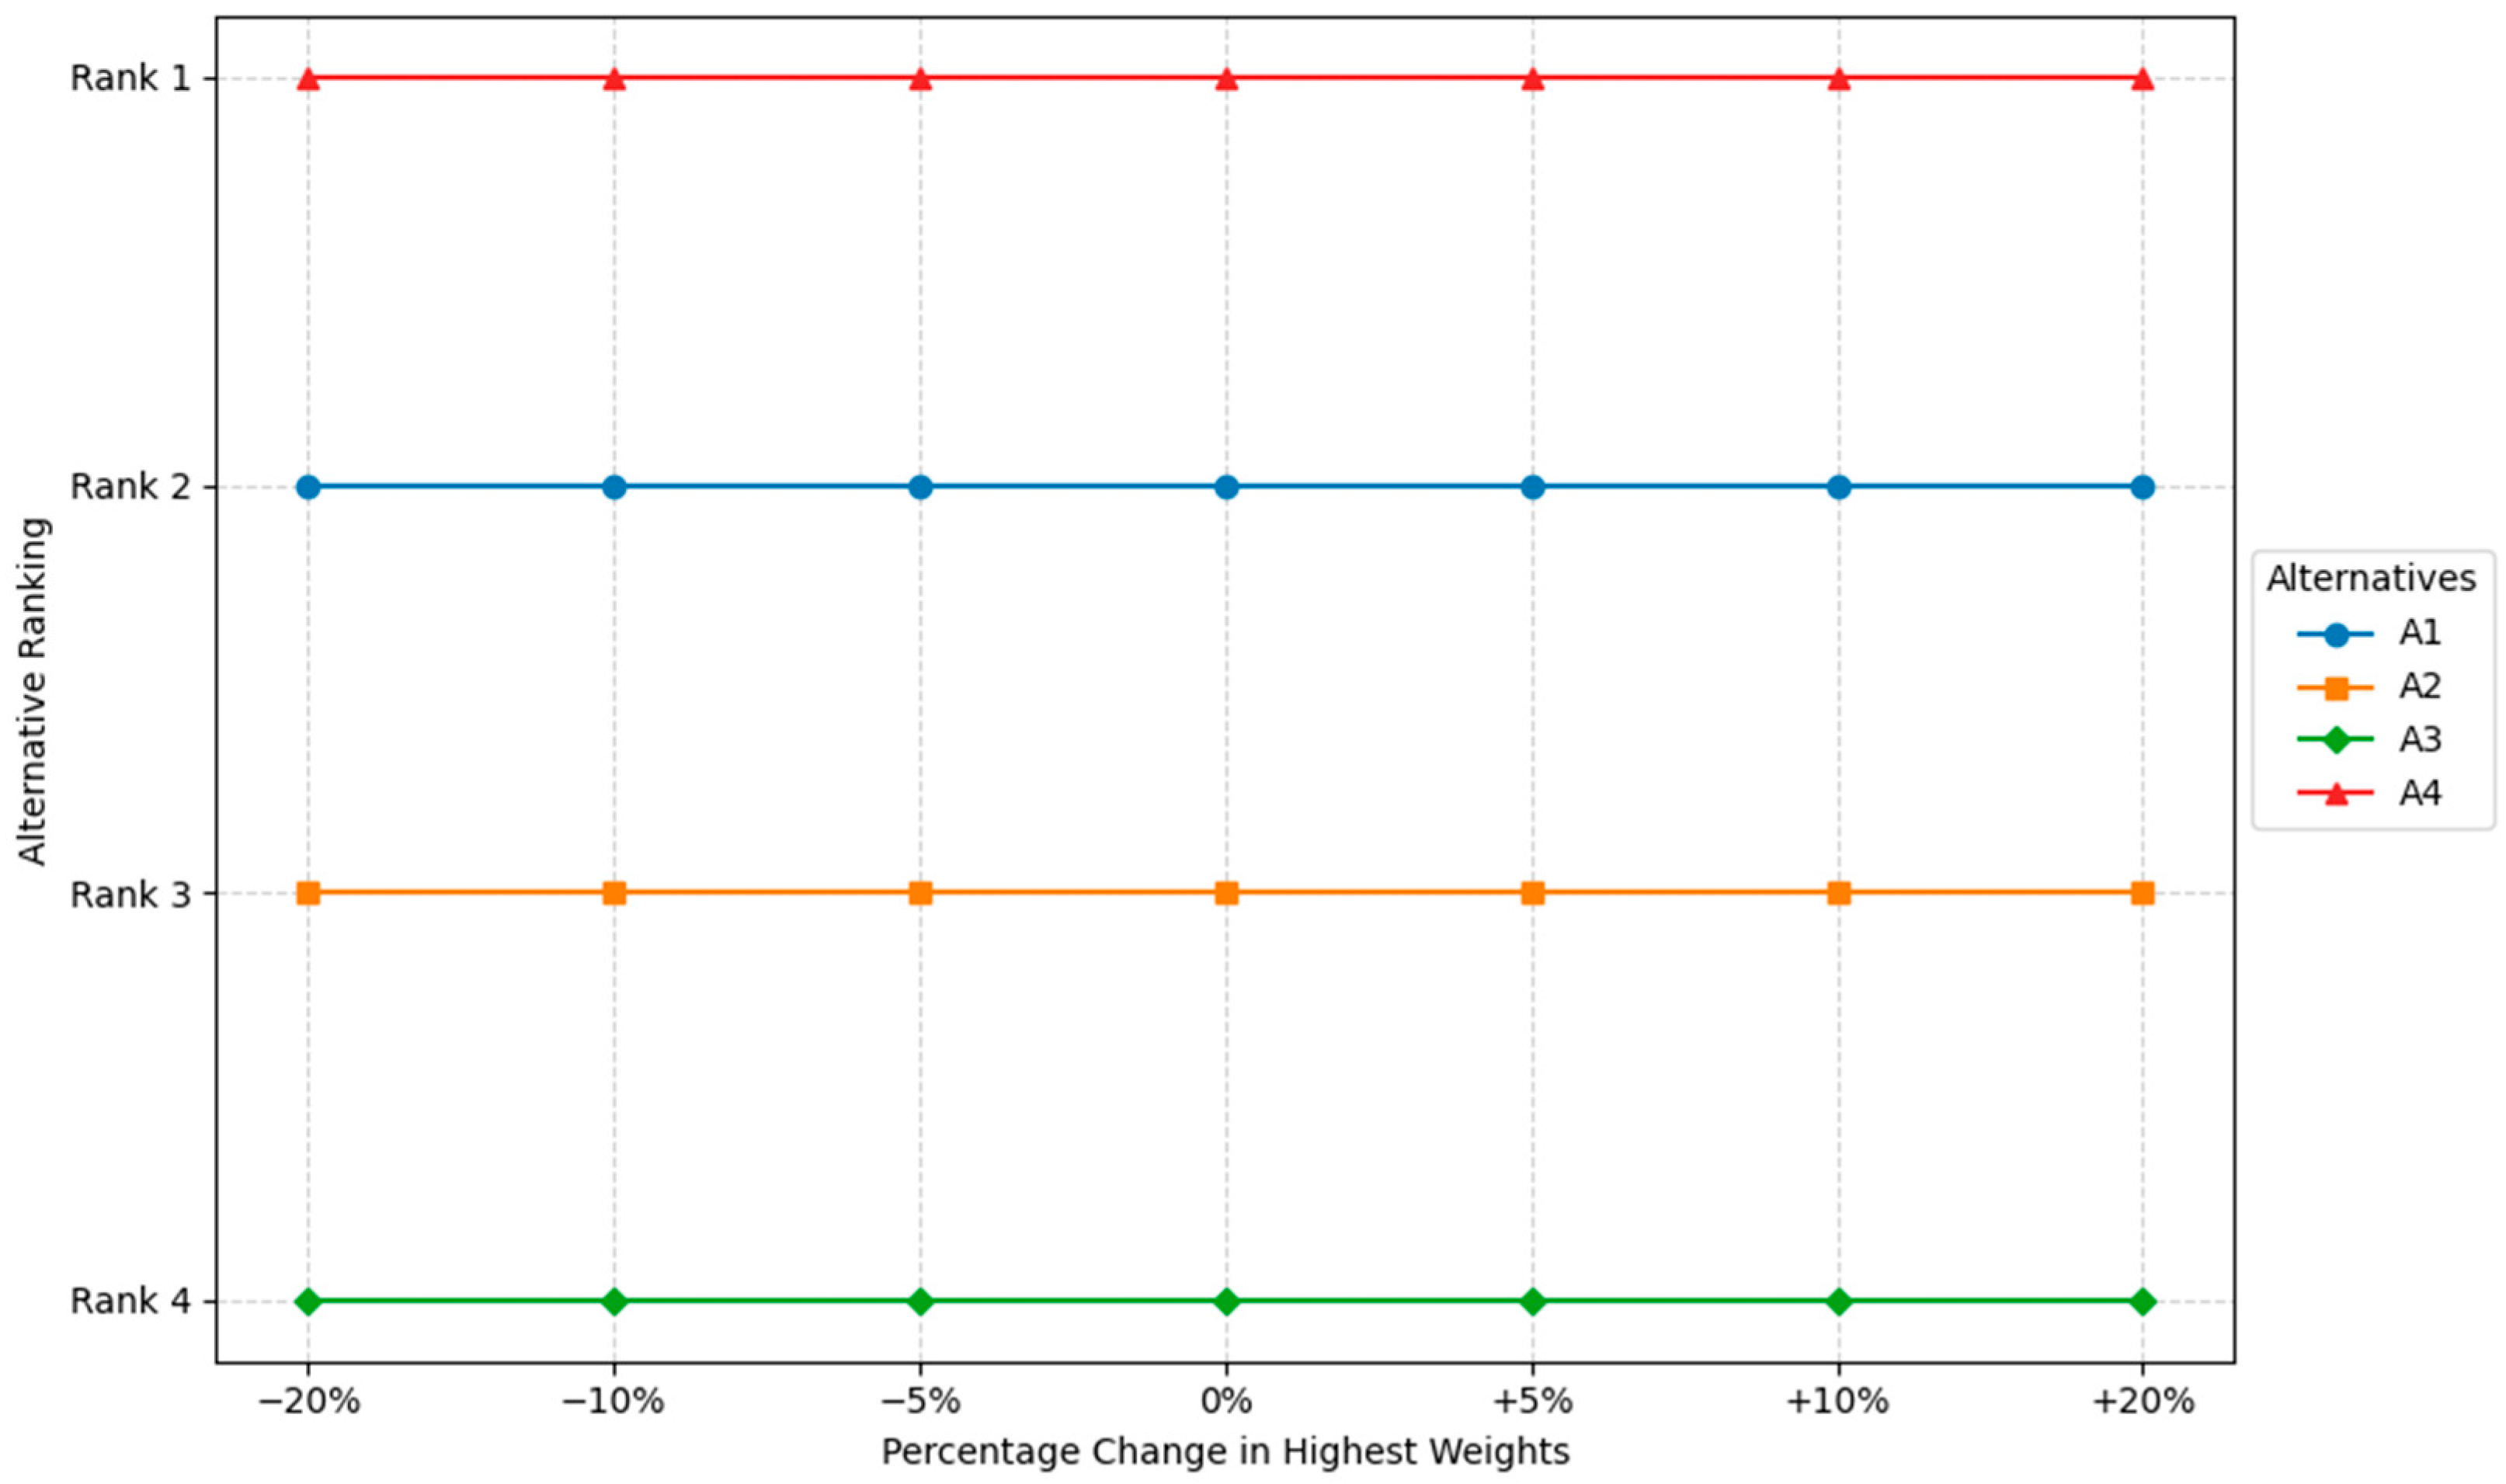
The second sensitivity analysis examines the impact of the criteria weights on the ranking outcomes, following the approach recommended by Sotoudeh-Anvari [78]. A total of six scenarios are considered and compared with the baseline ranking results. These scenarios involve different weight configurations, in which the weight of the most influential criterion is decreased by 5%, 10%, and 20%, and increased by 5%, 10%, and 20%, respectively. The results are summarized in Figure 4. As observed, the ranking results remain stable under variations in criteria weights, thereby demonstrating the robustness of the proposed model.

6. Conclusions and Remarks

The selection of sustainable 3PLPs is a complex and uncertain process. This study introduces an extended TBL framework and a novel decision-making model to address the limitations of traditional approaches, which often struggle with several critical uncertainty issues in sustainable 3PLP selection. The proposed model effectively addresses these challenges and enhances decision-making reliability by incorporating the Dempster–Shafer approach, Murphy’s combination rule, the Deng entropy weighting method, and the CoCoSo method. A case study involving a textile enterprise demonstrates the model’s practical applicability and its superiority over existing methods. This study provides valuable insights for companies to select sustainable 3PLPs under uncertainty with higher accuracy.
Although the proposed model addresses several limitations of prior studies, certain constraints remain and suggest directions for future research. First, although Dempster–Shafer theory is employed to incorporate DMs’ reliability, only subjective reliability is considered. This may introduce bias and potentially overemphasize less reliable judgments. Moreover, the mapping of qualitative reliability assessments into numerical values may further amplify this bias. Future research could integrate objective reliability measures based on DMs’ expertise to enhance the robustness and credibility of the model. Second, interrelationships among criteria, which are common in real-world decision-making, are not considered in this study. Future research could incorporate methods such as the CRITIC (Criteria Importance Through Intercriteria Correlation) technique to better capture these dependencies. Third, the computational complexity of Dempster–Shafer theory-based MCDM approaches remains relatively high. Therefore, developing more computationally efficient models would improve practical applicability. Fourth, the generalizability of the findings is limited as the study is based on a single case involving ten decision-makers and four alternatives. Future research should validate the model across diverse industries and larger samples. Fifth, the normalization techniques in the CoCoSo method assume linear relationships; in future studies, non-linear transformations could be incorporated to better capture diminishing returns, threshold effects, and more realistic preference structures among criteria. Finally, although this study considers four dimensions for evaluating sustainable 3PLPs, sustainability is a dynamic and evolving concept. Future studies could incorporate additional relevant dimensions and criteria to develop a more comprehensive evaluation framework.


Author Contributions

Conceptualization, T.T.V.; Methodology, T.T.V., J.J.H.L. and S.-W.H.; Software, H.-H.C.; Validation, J.J.H.L. and Y.-L.T.; Formal analysis, T.T.V.; Resources, Y.-L.T., H.R.T. and H.-H.C.; Data curation, T.T.V. and H.-H.C.; Writing—original draft, T.T.V. and H.-H.C.; Writing—review & editing, H.R.T. and S.-W.H.; Visualization, S.-W.H.; Supervision, J.J.H.L., Y.-L.T., H.R.T. and S.-W.H. All authors have read and agreed to the published version of the manuscript.

Funding

This research received no external funding.

Institutional Review Board Statement

As this is a non-biomedical study, ethics approval was not required under national regulations (Circular No. 43/2024/TT-BYT).

Informed Consent Statement

Informed consent for participation was obtained from all subjects involved in the study.

Data Availability Statement

Data will be made available on request.

Conflicts of Interest

The authors declare that they have no financial or personal interests that could be perceived as influencing the research presented in this paper.

Appendix A

  • Comparative example: High-conflict evaluation
  • Suppose two independent DMs are evaluating a 3PLP across three performance categories: Low (A), Medium (B), and High (C).
  • DM 1: Is almost certain the performance is Low: m1(A) = 0.99, m1(B) = 0.01, m1(C) = 0.
  • DM 2: Is almost certain the performance is High: m2(A) = 0, m2(B) = 0.01, m2(C) = 0.99.
  • Traditional Dempster’s rule analysis:
Dempster’s rule focuses on the intersection of beliefs. Since the DMs only agree” on the 1% chance for B, the rule normalizes the conflict (H = 0.9999) and produces:
  • Result: m12(B) = 1.0
  • Conclusion: The model is 100% certain the performance is Medium. This is a paradox because both DMs initially believed Medium was the least likely outcome.
b.
Murphy’s rule analysis:
Murphy’s rule first calculates the arithmetic mean of the mass functions:
  • mavg(A) = (0.99 + 0)/2 = 0.495
  • mavg(B) = (0.01 + 0.01)/2 = 0.01
  • mavg(C) = (0 + 0.99)/2 = 0.495
When combined, the mass remains distributed between the two primary DM opinions (A and C):
  • Result: m12(A) = 49.99%, m12(B) = 0.02%, m12(C) = 49.99%
  • Conclusion: The model correctly identifies that there is a significant conflict and preserves the integrity of both DMs’ primary assessments rather than forcing a false consensus on B.

References

  1. Borgström, B.; Hertz, S.; Jensen, L.-M. Strategic development of third-party logistics providers (TPLs): “Going under the floor” or “raising the roof”? Ind. Mark. Manag. 2021, 97, 183–192. [Google Scholar] [CrossRef]
  2. Anderson, E.J.; Coltman, T.; Devinney, T.M.; Keating, B. What drives the choice of a third-party logistics provider? J. Supply Chain Manag. 2011, 47, 97–115. [Google Scholar] [CrossRef]
  3. Vlachos, I.; Polichronidou, V. Multi-demand supply chain triads and the role of Third-Party Logistics Providers. Int. J. Logist. Manag. 2023, 35, 136–157. [Google Scholar] [CrossRef]
  4. Company, M. Share of Global Greenhouse Gas Emissions from Logistics in 2023. Available online: https://www.statista.com/statistics/1418701/share-of-global-greenhouse-gas-emissions-from-logistics/ (accessed on 14 June 2025).
  5. Evangelista, P.; Colicchia, C.; Creazza, A. Is environmental sustainability a strategic priority for logistics service providers? J. Environ. Manag. 2017, 198, 353–362. [Google Scholar] [CrossRef]
  6. Colicchia, C.; Marchet, G.; Melacini, M.; Perotti, S. Building environmental sustainability: Empirical evidence from Logistics Service Providers. J. Clean. Prod. 2013, 59, 197–209. [Google Scholar] [CrossRef]
  7. Gupta, A.; Singh, R.K.; Mangla, S.K. Evaluation of logistics providers for sustainable service quality: Analytics based decision making framework. Ann. Oper. Res. 2022, 315, 1617–1664. [Google Scholar] [CrossRef]
  8. Banomyong, R.; Supatn, N. Selecting logistics providers in Thailand: A shippers’ perspective. Eur. J. Mark. 2011, 45, 419–437. [Google Scholar] [CrossRef]
  9. Rodrigues, A.C.; Martins, R.S.; Wanke, P.F.; Siegler, J. Efficiency of specialized 3PL providers in an emerging economy. Int. J. Prod. Econ. 2018, 205, 163–178. [Google Scholar] [CrossRef]
  10. Raut, R.D.; Kamble, S.S.; Kharat, M.G.; Joshi, H.; Singhal, C.; Kamble, S.J. A hybrid approach using data envelopment analysis and artificial neural network for optimising 3PL supplier selection. Int. J. Logist. Syst. Manag. 2017, 26, 203–223. [Google Scholar] [CrossRef]
  11. Jauhar, S.K.; Singh, A.; Kamble, S.; Tiwari, S.; Belhadi, A. Reverse logistics for electric vehicles under uncertainty: An intelligent emergency management approach. Transp. Res. Part E Logist. Transp. Rev. 2024, 192, 103806. [Google Scholar] [CrossRef]
  12. Zeynali, F.R.; Parvin, M.; ForouzeshNejad, A.A.; Jeyzanibrahimzade, E.; Ghanavati-Nejad, M.; Tajally, A. A heuristic-based multi-stage machine learning-based model to design a sustainable, resilient, and agile reverse corn supply chain by considering third-party recycling. Appl. Soft Comput. 2025, 174, 113042. [Google Scholar] [CrossRef]
  13. Sokol, K.; Flach, P. One explanation does not fit all: The promise of interactive explanations for machine learning transparency. KI—Künstliche Intell. 2020, 34, 235–250. [Google Scholar] [CrossRef]
  14. Koc, E.; Celik, M.S.; Yildiz, R.O. Sustainability in third-party logistics provider selection: Criteria from an emerging market perspective using SLR and ANP. J. Glob. Oper. Strateg. Sourc. 2025, 19, 1–35. [Google Scholar] [CrossRef]
  15. Ateş, Ç.; Karadag, M.; Gul, M. Green third-party logistics service provider selection using the stratified BWM and ELECTRE. Int. J. Syst. Assur. Eng. Manag. 2026, 17, 478–497. [Google Scholar] [CrossRef]
  16. Centobelli, P.; Cerchione, R.; Esposito, E. Developing the WH2 framework for environmental sustainability in logistics service providers: A taxonomy of green initiatives. J. Clean. Prod. 2017, 165, 1063–1077. [Google Scholar] [CrossRef]
  17. Evangelista, P.; Sweeney, E. Technology usage in the supply chain: The case of small 3PLs. Int. J. Logist. Manag. 2006, 17, 55–74. [Google Scholar] [CrossRef]
  18. Bali, Ö.; Gümüş, S.; Kaya, I. A Multi-Period Decision Making Procedure Based on Intuitionistic Fuzzy Sets for Selection Among Third-Party Logistics Providers. J. Mult.-Valued Log. Soft Comput. 2015, 24, 1–23. [Google Scholar]
  19. Niu, W.; Rong, Y.; Yu, L. An integrated group decision support framework utilizing Pythagorean fuzzy DEMATEL–CoCoSo approach for medicine cold chain logistics provider selection. J. Enterp. Inf. Manag. 2024, 37, 1809–1838. [Google Scholar] [CrossRef]
  20. Mishra, A.R.; Rani, P.; Pandey, K. Fermatean fuzzy CRITIC-EDAS approach for the selection of sustainable third-party reverse logistics providers using improved generalized score function. J. Ambient Intell. Humaniz. Comput. 2022, 13, 295–311. [Google Scholar] [CrossRef]
  21. Rong, Y.; Yu, L.; Liu, Y.; Peng, X.; Garg, H. An integrated group decision-making framework for assessing S3PRLPs based on MULTIMOORA-WASPAS with q-rung orthopair fuzzy information. Artif. Intell. Rev. 2024, 57, 163. [Google Scholar] [CrossRef]
  22. Mishra, A.R.; Rani, P. Assessment of sustainable third party reverse logistic provider using the single-valued neutrosophic combined compromise solution framework. Clean. Responsible Consum. 2021, 2, 100011. [Google Scholar] [CrossRef]
  23. Liu, Z.; Wang, D.; Zhao, Y.; Zhang, X.; Liu, P. An improved ELECTRE II-based outranking method for MADM with double hierarchy hesitant fuzzy linguistic sets and its application to emergency logistics provider selection. Int. J. Fuzzy Syst. 2023, 25, 1495–1517. [Google Scholar] [CrossRef]
  24. Liao, C.; Yang, X.; Yang, D.; Liu, L. Third-Party Logistics Provider Selection in Relief Logistics: A Improved TODIM Method Based on Multi-Granularity Probabilistic Linguistic Assessment Information. In Applied Mathematics, Modeling and Computer Simulation; IOS Press: Amsterdam, The Netherlands, 2023; pp. 293–305. [Google Scholar]
  25. Cheng, X.; Chen, C.; Wan, S. Group decision making with incomplete triangular fuzzy multiplicative preference relations for evaluating third-party reverse logistics providers. Appl. Soft Comput. 2024, 160, 111688. [Google Scholar] [CrossRef]
  26. Carroll, M.B.; Sanchez, P.L. Decision making with conflicting information: Influencing factors and best practice guidelines. Theor. Issues Ergon. Sci. 2021, 22, 296–316. [Google Scholar] [CrossRef]
  27. Zhao, Q.; Liu, F.; Qiao, W. Evaluating industrial heritage value using cloud theory and Dempster–Shafer theory. J. Cult. Herit. 2024, 68, 364–374. [Google Scholar] [CrossRef]
  28. Ou, G.Z.; Jiao, Y.Y.; Zhang, G.H.; Zou, J.P.; Tan, F.; Zhang, W.S. Collapse risk assessment of deep-buried tunnel during construction and its application. Tunn. Undergr. Space Technol. 2021, 115, 104019. [Google Scholar] [CrossRef]
  29. Murphy, C.K. Combining belief functions when evidence conflicts. Decis. Support Syst. 2000, 29, 1–9. [Google Scholar] [CrossRef]
  30. Dhruva, S.; Krishankumar, R.; Pamucar, D.; Zavadskas, E.K.; Ravichandran, K.S. Demystifying the Stability and the Performance Aspects of CoCoSo Ranking Method under Uncertain Preferences. Informatica 2024, 35, 509–528. [Google Scholar] [CrossRef]
  31. Hertz, S.; Alfredsson, M. Strategic development of third party logistics providers. Ind. Mark. Manag. 2003, 32, 139–149. [Google Scholar] [CrossRef]
  32. Akhter, M.; Ahmed, A.; Momen, M.A.; Sultana, N.; Sultana, S.; Ferdousi, F. Determinants of online merchants’ satisfaction on third party logistics in a developing nation: A partial least square (PLS) approach. Cogent Bus. Manag. 2024, 11, 2382338. [Google Scholar] [CrossRef]
  33. Li, B.; Zhang, H.; Wang, M.; Han, S.; Peng, S. Cooperative strategies of emission reduction in the 3PL-led supply chain. IMA J. Manag. Math. 2024, 35, 595–614. [Google Scholar] [CrossRef]
  34. Raut, R.D.; Gardas, B.B.; Narwane, V.S.; Narkhede, B.E. Improvement in the food losses in fruits and vegetable supply chain-a perspective of cold third-party logistics approach. Oper. Res. Perspect. 2019, 6, 100117. [Google Scholar] [CrossRef]
  35. Aakko-Saksa, P.T.; Lehtoranta, K.; Kuittinen, N.; Järvinen, A.; Jalkanen, J.P.; Johnson, K.; Jung, H.; Ntziachristos, L.; Gagné, S.; Takahashi, C.; et al. Reduction in greenhouse gas and other emissions from ship engines: Current trends and future options. Prog. Energy Combust. Sci. 2023, 94, 101055. [Google Scholar] [CrossRef]
  36. DHL. DHL Takes Green Logistics to the Next Level with Formula 1® Launching a First Truck Fleet Powered by Biofuel to Reduce Carbon Footprint. Available online: https://group.dhl.com/en/media-relations/press-releases/2023/dhl-launching-a-first-truck-fleet-powered-by-biofuel.html (accessed on 14 June 2025).
  37. Maersk. Maersk to Pilot a Battery System to Improve Power Production. Available online: https://www.maersk.com/news/articles/2019/11/06/maersk-to-pilot-a-battery-system-to-improve-power-production (accessed on 14 June 2025).
  38. Hong, Z.; Guo, X. Green product supply chain contracts considering environmental responsibilities. Omega 2019, 83, 155–166. [Google Scholar] [CrossRef]
  39. Liu, X.; Li, M.-Y. Sustainable service product design method: Focus on customer demands and triple bottom line. J. Retail. Consum. Serv. 2024, 80, 103935. [Google Scholar] [CrossRef]
  40. Ahmed, Z.; Ahmad, M.; Rjoub, H.; Kalugina, O.A.; Hussain, N. Economic growth, renewable energy consumption, and ecological footprint: Exploring the role of environmental regulations and democracy in sustainable development. Sustain. Dev. 2022, 30, 595–605. [Google Scholar] [CrossRef]
  41. Albino, V.; Dangelico, R.M.; Pontrandolfo, P. Do inter-organizational collaborations enhance a firm’s environmental performance? A study of the largest US companies. J. Clean. Prod. 2012, 37, 304–315. [Google Scholar] [CrossRef]
  42. Yadav, S.; Garg, D.; Luthra, S. Selection of third-party logistics services for internet of things-based agriculture supply chain management. Int. J. Logist. Syst. Manag. 2020, 35, 204–230. [Google Scholar] [CrossRef]
  43. Jharkharia, S.; Shankar, R. Selection of logistics service provider: An analytic network process (ANP) approach. Omega 2007, 35, 274–289. [Google Scholar] [CrossRef]
  44. Liu, H.-T.; Wang, W.-K. An integrated fuzzy approach for provider evaluation and selection in third-party logistics. Expert Syst. Appl. 2009, 36, 4387–4398. [Google Scholar] [CrossRef]
  45. Ercan, E.N.; Jang, H.; Park, H. Toward a theoretical framework for sustainable third-party logistics provider selection: An exploratory study using AHP in the Turkish machinery industry. J. Int. Logist. Trade 2026, 1–22. [Google Scholar] [CrossRef]
  46. Nila, B.; Roy, J. A new hybrid MCDM framework for third-party logistics provider selection under sustainability perspectives. Expert Syst. Appl. 2023, 234, 121009. [Google Scholar] [CrossRef]
  47. Hofmann, E.; Osterwalder, F. Third-party logistics providers in the digital age: Towards a new competitive arena? Logistics 2017, 1, 9. [Google Scholar] [CrossRef]
  48. Van Asselt, M.B.; Rotmans, J. Uncertainty in integrated assessment modelling. Clim. Change 2002, 54, 75–105. [Google Scholar] [CrossRef]
  49. Kabir, G. Third party logistic service provider selection using fuzzy AHP and TOPSIS method. Int. J. Qual. Res. 2012, 6, 71. [Google Scholar]
  50. Chen, L.; Duan, D.; Mishra, A.R.; Alrasheedi, M. Sustainable third-party reverse logistics provider selection to promote circular economy using new uncertain interval-valued intuitionistic fuzzy-projection model. J. Enterp. Inf. Manag. 2022, 35, 955–987. [Google Scholar] [CrossRef]
  51. Zadeh, L.A. On the Validity of Dempster’s Rule of Combination of Evidence; Infinite Study: Paris, France, 1979. [Google Scholar]
  52. Yager, R.R. On the Dempster-Shafer framework and new combination rules. Inf. Sci. 1987, 41, 93–137. [Google Scholar] [CrossRef]
  53. Dubois, D.; Prade, H. Representation and combination of uncertainty with belief functions and possibility measures. Comput. Intell. 1988, 4, 244–264. [Google Scholar] [CrossRef]
  54. Yang, J.-B.; Xu, D.-L. Evidential reasoning rule for evidence combination. Artif. Intell. 2013, 205, 1–29. [Google Scholar] [CrossRef]
  55. Chen, L.; Diao, L.; Sang, J. Weighted evidence combination rule based on evidence distance and uncertainty measure: An application in fault diagnosis. Math. Probl. Eng. 2018, 2018, 5858272. [Google Scholar] [CrossRef]
  56. Zhang, W.; Deng, Y. Combining conflicting evidence using the DEMATEL method. Soft Comput. 2019, 23, 8207–8216. [Google Scholar] [CrossRef]
  57. Lin, Z.; Xie, J. Research on improved evidence theory based on multi-sensor information fusion. Sci. Rep. 2021, 11, 9267. [Google Scholar] [CrossRef]
  58. Fei, L.; Deng, Y.; Hu, Y. DS-VIKOR: A new multi-criteria decision-making method for supplier selection. Int. J. Fuzzy Syst. 2019, 21, 157–175. [Google Scholar] [CrossRef]
  59. Deng, Y. Deng entropy. Chaos Solitons Fractals 2016, 91, 549–553. [Google Scholar] [CrossRef]
  60. Yazdani, M.; Zarate, P.; Kazimieras Zavadskas, E.; Turskis, Z. A combined compromise solution (CoCoSo) method for multi-criteria decision-making problems. Manag. Decis. 2019, 57, 2501–2519. [Google Scholar] [CrossRef]
  61. Mandal, S.; Khan, D.A. Cloud-CoCoSo: Cloud model-based combined compromised solution model for trusted cloud service provider selection. Arab. J. Sci. Eng. 2022, 47, 10307–10332. [Google Scholar] [CrossRef]
  62. Zegai, R.; Khettabi, I.; Benyoucef, L.; Abbas, M. Enhancing Collaborative Multi-criteria Group Decision-Making in Supply Chains: A Probabilistic-Based Approach Using SFNs and CoCoSo. Int. J. Fuzzy Syst. 2025. [Google Scholar] [CrossRef]
  63. Duan, C.; Zhou, H.; Li, Y.; Ren, B.; Liu, X. A New FMEA-Based Risk Assessment Procedure for MES Criticality Analysis Integrating Cross-Entropy and Extended Fuzzy CoCoSo. Eng. Manag. J. 2025, 1–21. [Google Scholar] [CrossRef]
  64. Goswami, S.S.; Tapankumar, T.; Naik, N.C.K.; Gowrishankar, J.; Bhosle, N.; Singh, A.; Raju, G.S.; Nagesh, D.; Santhosh, A.J. Multi-model MCDM framework for sustainable renewable energy selection in India: Integrating CRITIC-EDAS-CODAS-CoCoSo. Discov. Sustain. 2025, 6, 500. [Google Scholar] [CrossRef]
  65. Smets, P. Decision making in the TBM: The necessity of the pignistic transformation. Int. J. Approx. Reason. 2005, 38, 133–147. [Google Scholar] [CrossRef]
  66. ISO 14001; Environmental Management Systems—Requirements with Guidance for Use. International Organization for Standardization (ISO): Geneva, Switzerland, 2015.
  67. Yang, Q.; Yan, W.M.; Liu, M.; Deveci, M.; Garg, H.; Chen, Z.S. A hybrid generalized TODIM approach for sustainable 3PRLP selection in electronic manufacturing industry. Adv. Eng. Inform. 2024, 59, 102298. [Google Scholar] [CrossRef]
  68. Zarbakhshnia, N.; Karimi, A. Enhancing third-party logistics providers partnerships: An approach through the DLARCS supply chain paradigm. Resour. Conserv. Recycl. 2024, 202, 107406. [Google Scholar] [CrossRef]
  69. Sari, I.U. Fermatean fuzzy Z-analytic hierarchy process: An application to third party logistics providers. Eng. Appl. Artif. Intell. 2024, 133, 108327. [Google Scholar] [CrossRef]
  70. Kannan, G.; Pokharel, S.; Kumar, P.S. A hybrid approach using ISM and fuzzy TOPSIS for the selection of reverse logistics provider. Resour. Conserv. Recycl. 2009, 54, 28–36. [Google Scholar] [CrossRef]
  71. Wang, C.-N.; Dang, T.-T. Third-party logistics provider selection in the industry 4.0 era by using a fuzzy AHP and fuzzy MARCOS methodology. IEEE Access 2024, 12, 67291–67313. [Google Scholar] [CrossRef]
  72. Mishra, A.R.; Rani, P.; Saha, A.; Pamucar, D.; Hezam, I.M. A q-rung orthopair fuzzy combined compromise solution approach for selecting sustainable third-party reverse logistics provider. Manag. Decis. 2022, 61, 1816–1853. [Google Scholar] [CrossRef]
  73. Sarabi, E.P.; Darestani, S.A. Developing a decision support system for logistics service provider selection employing fuzzy MULTIMOORA & BWM in mining equipment manufacturing. Appl. Soft Comput. 2021, 98, 106849. [Google Scholar] [CrossRef]
  74. Zarbakhshnia, N.; Soleimani, H.; Ghaderi, H. Sustainable third-party reverse logistics provider evaluation and selection using fuzzy SWARA and developed fuzzy COPRAS in the presence of risk criteria. Appl. Soft Comput. 2018, 65, 307–319. [Google Scholar] [CrossRef]
  75. Yuan, Y.; Xu, Z.; Zhang, Y. The DEMATEL–COPRAS hybrid method under probabilistic linguistic environment and its application in Third Party Logistics provider selection. Fuzzy Optim. Decis. Mak. 2022, 21, 137–156. [Google Scholar] [CrossRef]
  76. Perçin, S. Evaluation of third-party logistics (3PL) providers by using a two-phase AHP and TOPSIS methodology. Benchmarking Int. J. 2009, 16, 588–604. [Google Scholar] [CrossRef]
  77. Qureshi, M.; Kumar, D.; Kumar, P. Selection of potential 3PL services providers using TOPSIS with interval data. In Proceedings of the 2007 IEEE International Conference on Industrial Engineering and Engineering Management; IEEE: Piscataway, NJ, USA, 2007. [Google Scholar]
  78. Sotoudeh-Anvari, A. Root Assessment Method (RAM): A novel multi-criteria decision making method and its applications in sustainability challenges. J. Clean. Prod. 2023, 423, 138695. [Google Scholar] [CrossRef]
Figure 1. Proposed framework.
Sustainability 18 04643 g001
Figure 2. Model comparison.
Sustainability 18 04643 g002
Figure 3. Sensitive analysis based on α values.
Sustainability 18 04643 g003
Figure 4. Sensitivity analysis criteria weights.
Sustainability 18 04643 g004
Table 1. Notations and meanings.
NotationsMeanings
C = {C1, C2,…, Cn}A set of n criteria
A = {A1, A2, …, Am}A set of m alternatives
E = {E1, E2, …, Ek}A set of k DMs
x i j g An evaluation made by DMg (g = 1, 2, …, k) of Ai, (for i = 1, 2, …, m), with respect to Cj (for j = 1, 2, …, n)
x i j Aggregated performance score
XA decision matrix
θ = {e1, e2, e3, e4, e5}A set of performance levels
2 θ Power set of θ
N, E, F, G Non-empty subsets of θ , not necessarily distinct
mMass function
m ¯ N Average mass value of subset N
N Cardinality of subset N
r0, r1, r2, r3, r4, r5Confidence levels
γ Confidence value
m γ Discounted basic probability assignment with confidence value γ
p1:p2:…:pdRatio values assigned to d subsets
p v ¯ (v = 1, 2, …, d)Normalized ratio value of the vth subset
d1, d2, d3, d4, d5Probabilities over performance levels e1, e2, e3, e4, and e5 respectively
DEjDeng entropy value of the jth criteria
D E j n o r m Normalized Deng entropy value of the jth criteria
PjCombined BPA of the jth criteria
wjWeight of the jth criteria
fijNormalized performance score
QiWeighted compatibility sequence of the ith alternative
RiTotal power weight of compatibility of the ith alternative
tia, tib, ticUtility functions of the ith alternative
tiFinal utility function of the ith alternative
Table 2. Performance levels.
Linguistic ScalesCodesDescriptionPerformance Values
Very lowe1No recognition of performance1
Lowe2Low recognition of performance2
Mediume3Moderate recognition of performance3
Highe4High recognition of performance4
Very highe5Full recognition of performance5
Table 3. Confidence levels.
Linguistic ScalesCodesDescriptionConfidence Values
Completely certainr5Full confidence with no doubt1.0
Mostly certainr4High confidence with minimal doubt0.8
Fairly certainr3Moderate confidence with some doubt0.6
Somewhat certainr2Low confidence with noticeable doubt0.4
Barely certainr1Very low confidence with considerable doubt0.2
Not certain at allr0No confidence with complete doubt0.0
Note: Intermediate values between the defined levels (including 0.9, 0.7, 0.5, 0.3 and 0.1) may be used to represent subtle variations. The tilde symbol (~) denotes a value between two adjacent confidence levels.
Table 4. List of criteria.
AspectsCodeCriteriaDescriptionReferences
EconomicC1Service cost −The total expense charged by the 3PLP for providing logistics services[45,67]
C2Service quality +The reliability, accuracy, and timeliness of logistics services delivered[67,68,69,70]
C3Reputation +The provider’s market image, credibility, and trustworthiness among clients[15,23,46,68]
C4Flexibility +The ability to adapt operations to changes in demand, routes, or customer needs[15,68]
SocialC5Employee safety and well-being +The extent to which the provider ensures safe working conditions and supports employee health[68,71]
C6Data privacy +The level of protection given to customer and operational data against misuse or breaches.[68,71]
C7Social responsibility +The company’s commitment to ethical practices and community or social engagement.[67]
C8Employee development +Efforts made to enhance employee skills, training, and career growth[46,71]
EnvironmentalC9Energy efficiency +The effective use of energy resources to minimize waste and consumption[68,71]
C10Waste management +Practices for reducing, reusing, or recycling waste in operations[68,72]
C11Green packaging +Use of environmentally friendly packaging materials and methods[68,71]
C12Alignment with ISO specifications+Compliance with recognized ISO standards for quality and environmental management[46,73]
C13Greenhouse gas emission −The amount of carbon and related gases emitted from logistics operations[46,68]
TechnicalC14Technical infrastructure +The availability and quality of technology systems supporting logistics activities[69,70,74]
C15Technical manpower +The skill level and expertise of technical and IT staff supporting logistics operations[46,70]
+ signifies benefit criteria; − signifies cost criteria.
Table 5. DMs’ evaluations—A1 with respect to C1.
DMsPerformanceRatio ValuesConfidence Levels
E1{e2}:{e3, e4}1:2r4~r5
E2{e1, e2}:{e3, e4}1:1r5
E3{e3}:{e4, e5}1:1r3~r4
E4{e4}:{e5}3:1r1~r2
E5{e3}:{e4, e5}1:1r3~r4
E6{e3}:{e4, e5}2:1r3~r4
E7{e3}:{e4, e5}1:2r4~r5
E8{e1, e2}:{e3, e4, e5}1:2r4
E9{e3, e4, e5}1r4
E10{e2, e3, e4}1r4
Table 8. Combined BPAs of criteria.
CriteriaCombined BPAs (Pj)
C1m{e3} = 0.078, m{e4} = 0.920, m{e5} = 0.003
C2m{e3} = 0.009, m{e4} = 0.989, m{e5} = 0.002
C3m{e3} = 0.016, m{e4} = 0.977, m{e5} = 0.007
C4m = {e2} = 0.076, m{e3} = 0.575, m{e4} = 0.327, m{e5} = 0.014, m{e2. e3} = 0.008
C5m = {e2} = 0.009, m{e3} = 0.561, m{e4} = 0.418, m{e5} = 0.009, m{e3, e4} = 0.001, m{e4, e5} = 0.001
C6m{e1} = 0.004, m = {e2} = 0.008, m{e3} = 0.276, m{e4} = 0.335, m{e5} = 0.366, m{e1, e2} = 0.001, m{e4, e5} = 0.01
C7m{e2} = 0.1, m{e3} = 0.872, m{e4} = 0.024, m{e5} = 0.003
C8m{e1} = 0.08, m{e2} = 0.145, m{e3} = 0.289, m{e4} = 0.182, m{e5} = 0.261, m{e1, e2} = 0.013, m{e2, e3} = 0.004, m{e3, e4} = 0.006, m{e4, e5} = 0.015, m{e3, e4, e5} = 0.003, m{ θ } = 0.003
C9m{e1} = 0.03, m{e2} = 0.124, m{e3} = 0.627, m{e4} = 0.127, m{e5} = 0.015, m{e1, e2} = 0.013, m{e2, e3} = 0.021, m{e3, e4} = 0.016, m{e4, e5} = 0.015, m{e1, e2, e3} = 0.004, m{e2, e3, e4} = 0.001, m{e3, e4, e5} = 0.005, m{ θ } = 0.002
C10m{e1} = 0.002, m{e2} = 0.022, m{e3} = 0.092, m{e4} = 0.215, m{e5} = 0.652, m{e1, e2} = 0.003, m{e3, e4} = 0.001, m{e4, e5} = 0.011, m{e3, e4, e5} = 0.002
C11m{e1} = 0.005, m{e2} = 0.095, m{e3} = 0.176, m{e4} = 0.525, m{e5} = 0.193, m{e4, e5} = 0.005
C12m{e1} = 0.004, m{e2} = 0.058, m{e3} = 0.158, m{e4} = 0.740, m{e5} = 0.039, m{e1, e2} = 0.001
C13m{e1} = 0.003, m{e2} = 0.012, m{e3} = 0.709, m{e4} = 0.234, m{e5} = 0.0.035, m{e1, e2} = 0.001, m{e4, e5} = 0.005
C14m{e2} = 0.001, m{e3} = 0.102, m{e4} = 0.894, m{e5} = 0.003
C15m{e1} = 0.001, m{e2} = 0.020, m{e3} = 0.497, m{e4} = 0.462, m{e5} = 0.018, m{e4, e5} = 0.002
Note: Only values equal to or greater than 0.001 are displayed.
Table 6. Discounted BPAs—A1 with respect to C1.
DMNormalized ValuesInitial BPAsDiscounted BPAs
E10.333:0.667m{e2} = 0.333, m{e3, e4} = 0.667m{e2} = 0.3, m{e3, e4} = 0.6, m{ θ } = 0.1
E20.5:0.5m{e1, e2 } = 0.5, m{e3, e4} = 0.5m{e1, e2 } = 0.5, m{e3, e4} = 0.5
E30.5:0.5m{e3} = 0.5, m {e4, e5} = 0.5m{e3} = 0.35, m{e4, e5} = 0.35, m{ θ } = 0.3
E40.75:0.25m{e4} = 0.75, m{e5} = 0.25m{e4} = 0.225, m{e5} = 0.075, m{ θ } = 0.7
E50.5:0.5m{e3} = 0.5, m{e4, e5} = 0.5m{e3} = 0.35, m{e4, e5} = 0.35, m{ θ } = 0.3
E60.667:0.333m{e3} = 0.667, m{e4, e5} = 0.333m{e3} = 0.467, m{e4, e5} = 0.233, m{ θ } = 0.3
E70.333:0.667m{e3} = 0.333, m{e4, e5} = 0.667m{e3} = 0.3, m{e4, e5} = 0.6, m{ θ } = 0.1
E80.333:0.667m{e1, e2} = 0.333, m{e3, e4, e5} = 0.667m{e1, e2} = 0.267, m{e3, e4, e5} = 0.533, m{ θ } = 0.2
E91m{e3, e4, e5} = 1m{e3, e4, e5} = 0.8, m{ θ } = 0.2
E101m{e2, e3, e4} = 1 m{e2, e3, e4} = 0.8, m{ θ } = 0.2
Table 7. Performance scores—A1 to C1.
IterationsResulting BPAsConflict Level
0m{e2} = 0.03, m{ e3} = 0.147, m{e4} = 0.023, m{e5} = 0.008, m{e1, e2} = 0.077, m{e3, e4} = 0.011, m{e4, e5} = 0.153, m{e2, e3, e4} = 0.08, m{ e3, e4, e5} = 0.133, m{ θ } = 0.24Not defined
1m{e2} = 0.045, m{e3} = 0.228, m{e4} = 0.111, m{e5} = 0.010, m{e1, e2} = 0.052, m{e3, e4} = 0.162, m{e4, e5} = 0.168, m{e2, e3, e4} = 0.055, m{e3, e4, e5} = 0.1, m{ θ } = 0.070.179
2m{e2} = 0.043, m{e3} = 0.282, m{e4} = 0.207, m{e5} = 0.01, m{e1, e2} = 0.028, m{e3, e4} = 0.107, m{e4, e5} = 0.148, m{e2, e3, e4} = 0.03, m{e3, e4, e5} = 0.06, m{ θ } = 0.0220.227
3m{e2} = 0.033, m{e3} = 0.320, m{e4} = 0.293, m{e5} = 0.009, m{e1, e2} = 0.14, m{e3, e4} = 0.155, m{e4, e5} = 0.120, m{e2, e3, e4} = 0.015, m{e3, e4, e5} = 0.034, m{ θ } = 0.0070.245
4m{e2} = 0.023, m{e3} = 0.345, m{e4} = 0.365, m{e5} = 0.008, m{e1, e2} = 0.077, m{e3, e4} = 0.131, m{e4, e5} = 0.093, m{e2, e3, e4} = 0.007, m{e3, e4, e5} = 0.018, m{ θ } = 0.0020.252
5m{e2} = 0.016, m{e3} = 0.361, m{e4} = 0.423, m{e5} = 0.007, m{e1, e2} = 0.003, m{e3, e4} = 0.107, m{e4, e5} = 0.070, m{e2, e3, e4} = 0.003, m{e3, e4, e5} = 0.009, m{ θ } = 0.0010.257
6m{e2} = 0.01, m{e3} = 0.370, m{e4} = 0.469, m{e5} = 0.006, m{e1, e2} = 0.01, m{e3, e4} = 0.085, m{e4, e5} = 0.052, m{e2, e3, e4} = 0.002, m{e3, e4, e5} = 0.0050.260
7m{e2} = 0.006, m{e3} = 0.375, m{e4} = 0.506, m{e5} = 0.005, m{e1, e2} = 0.001, m{e3, e4} = 0.067, m{e4, e5} = 0.038, m{e2, e3, e4} = 0.001, m{e3, e4, e5} = 0.0030.262
8m{e2} = 0.004, m{e3} = 0.376, m{e4} = 0.535, m{e5} = 0.004, m{e3, e4} = 0.052, m{e4, e5} = 0.028, m{e3, e4, e5} = 0.0010.264
9m{e2} = 0.002, m{e3} = 0.374, m{e4} = 0.559, m{e5} = 0.003, m{e3, e4} = 0.04, m{e4, e5} = 0.02, m{e3, e4, e5} = 0.0010.266
Note: Only values equal to or greater than 0.001 are displayed.
Table 9. Weights of evaluating criteria.
CriteriaDeng Entropy Value (DEj) Normalized   Value   ( D E j n o r m ) Weights (wj)
C10.4210.0247.0%
C20.0950.0057.1%
C30.1770.0107.1%
C41.4170.0816.6%
C51.1430.0666.7%
C61.7390.1006.4%
C70.6620.0386.9%
C82.4630.1416.1%
C91.8990.1096.4%
C101.4590.0846.5%
C111.7900.1036.4%
C121.2010.0696.6%
C131.1680.0676.7%
C140.5170.0306.9%
C151.2630.0736.6%
Table 10. Probabilities of alternatives to criteria.
AlternativeCriteriaProbabilities
e1e2e3e4e5
A1C10.0000.0020.3940.5900.014
C20.0000.0000.0030.8300.167
C150.0070.0180.5920.2420.141
A2C10.0080.0080.1960.4550.332
C20.0250.0250.0720.6680.209
C150.0030.0220.0640.7010.210
A4C10.0000.0000.3030.6050.092
C20.0010.0010.1580.7420.097
C150.0850.3590.3900.1480.018
Table 11. Decision matrix.
C1C2C3C4C5C6C7C8C9C10C11C12C13C14C15
A13.6144.1644.2133.5583.2513.8383.1362.5383.3892.7813.7343.6553.5194.063.491
A24.0964.0124.0543.8163.4653.1952.0882.6462.8183.5843.2843.6122.9562.7444.093
A33.2943.0053.5022.5983.4152.9543.0923.0322.8633.8674.2272.2283.6543.6422.974
A43.7893.9333.9823.3883.2864.4094.0634.4342.7264.7472.0784.083.1214.0662.656
Table 12. Results of CoCoSo analysis.
QiRitiatibtictiRankings
A10.5969.7610.273.0751.2342.5342
A20.5179.5860.2632.8251.1792.3793
A30.3477.1880.19620.8631.7174
A40.6319.7880.2713.1821.2552.5971
Table 13. Comparison with alternative models.
AlternativesModel 1Model 2Proposed Model
tiRankingtiRankingtiRanking
A12.35712.10832.5342
A22.35742.26812.3793
A32.35731.70341.7174
A42.35722.17122.5971
Disclaimer/Publisher’s Note: The statements, opinions and data contained in all publications are solely those of the individual author(s) and contributor(s) and not of MDPI and/or the editor(s). MDPI and/or the editor(s) disclaim responsibility for any injury to people or property resulting from any ideas, methods, instructions or products referred to in the content.