Article

Intangible Capital and Sustainable Development: A Nonparametric Dynamic Analysis

by
Qing Li
1,
Tsun Se Cheong
2,3,4,* and
Shuaiyi Liu
2,*
1
SILC Business School, Shanghai University, Shanghai 201899, China
2
School of Business, The Hang Seng University of Hong Kong, Hong Kong, China
3
Australia-China Relations Institute, University of Technology Sydney, Sydney 2007, Australia
4
International Business School, Hainan University, Haikou 570228, China
*
Authors to whom correspondence should be addressed.
Sustainability 2026, 18(1), 545; https://doi.org/10.3390/su18010545
Submission received: 8 December 2025 / Revised: 27 December 2025 / Accepted: 2 January 2026 / Published: 5 January 2026
(This article belongs to the Section Economic and Business Aspects of Sustainability)

Abstract

The world has fully entered the era of the intangible economy, in which intangible capital serves as the primary driver for achieving sustainable development. This paper employs a nonparametric dynamic distribution approach to analyze the short-term transitional patterns and long-term steady-state trends of intangible capital investment across 30 developed economies, shedding light on pathways for national sustainable development from the perspective of intangible capital. Meanwhile, this paper examines the impact of industrial structure, income structure, and external-demand dependence on intangible capital investment. The results show that (1) intangible capital investment exhibits persistence, and its long-term development shows signs of unconditional convergence; (2) the tertiary industry significantly promotes the development of intangible capital, highlighting the crucial role of industrial structure upgrading in fostering intangible-driven sustainability; (3) the development of intangible capital does not necessarily substitute for human capital or reduce the labor income share; and (4) extremely high reliance on the external market may hinder the growth of intangible capital.

1. Introduction

Sustainability is classically defined as “development that meets the needs of the present without compromising the ability of future generations to meet their own needs” [1]. At present, this concept embodies three core principles: economic sustainability (fostering long-term, efficient, and resilient economic growth while avoiding resource-depleting expansion), environmental sustainability (preserving ecosystems and biodiversity to maintain natural capital for future use), and social sustainability (promoting inclusive growth that reduces inequality and ensures equitable access to basic needs). With the rise of the intangible economy, all three goals of sustainability are found to be increasingly intertwined with a rising force: intangible capital.
First, intangible capital is found to underpin economic sustainability by driving long-term productivity and strengthening systemic resilience. A well-established body of research recognizes computerized information as a general-purpose technology (GPT) that promotes global productivity [2]. Positive spillover effects and synergistic effects of a wide range of intangible capital are found to largely explain nations’ productivity gap [3]. At the micro-level, superior organizational capital and brand equity are also found to enhance firms’ operational resilience and achieve firms’ sustainable competitive advantages [4,5].
Second, intangible capital is suggested to contribute to environmental sustainability by mitigating the “resource curse” [6]. For example, the advancement of computerized information enables the real-time monitoring of complex production processes, which directly reduces raw material waste and energy consumption [7,8]. Research and development (R&D) generates new materials, processes, and product designs, facilitating the substitution of traditional resources with recyclable and biodegradable alternatives [9,10]. The enhancements in organizational processes and supply chain management effectively reduce inventory and logistics waste, thereby improving resource use efficiency and strengthening the decoupling of economic growth from resource depletion [8].
Finally, intangible capital is also demonstrated to promote social sustainability by eliminating barriers to knowledge and opportunities. The development of computerized information (internet, mobile platforms, and open-source software) is found to significantly eliminate the gap in knowledge and information [11]. Remote collaboration platforms and gig economy applications create more flexible forms of employment, thereby offering job opportunities for traditionally low-engagement groups [12]. Driven by R&D, technological progress has significantly enhanced the accessibility and quality of public services (telemedicine; smart education), thereby elevating social welfare and equity [13,14]. The investment in employee training directly enhances workers’ skills, productivity, and job security, enabling more individuals to access developmental opportunities [15,16].
Although the role of intangible capital in promoting economic, environmental, and social sustainability is widely acknowledged, due to the non-physical nature of intangible capital, our understanding of the relationship between intangible capital and sustainable development has long been limited. Given the importance of intangible capital in sustainable development, without a deeper and comprehensive grasp of intangible capital, it is impossible to fully achieve intangible-driven sustainable development.
Thanks to the pioneering work of Corrado, Hulten, and Sichel (hereafter CHS), a much wider range of intangible capital has come into the spotlight [17,18]. A strand of the literature has emerged to capitalize on intangibles and analyze its contributions to sustainable economic development. It has been widely confirmed that intangible capital can significantly promote labor productivity growth in advanced [19,20,21], developing [22,23], and emerging economies [24]. Nevertheless, it is also found that intangible capital development is highly heterogeneous and thus contributes unevenly across nations [25,26], industries [27,28], and firms [29,30].
Regarding the important but heterogeneous effects of intangible capital on sustainable development, some interesting questions emerge: Will intangible capital, the most critical driving force in contemporary economic development, enlarge or diminish the development gap between nations in the long run? Will the development of intangible capital across countries converge or diverge over time? What factors ultimately shape the trajectory of intangible asset development? An in-depth analysis of this new driving force will contribute to understanding and examining intangible-driven sustainable development.
Based on the intangible capital framework proposed by CHS, this study utilizes the EU KLEMS productivity database and the harmonized INTAN-Invest intangible asset database to analyze the dynamic transitional patterns of intangible capital, predict its long-term steady-state distribution, and examine its evolutionary trajectory across developed economies. Moreover, this paper explores the influence of several key structural economic factors—including industrial structure, income distribution, and the degree of external-demand dependence—on the long-term development of intangible capital. Departing from conventional growth accounting and regression-based empirical approaches, this study adopts a nonparametric dynamic distribution methodology. This approach does not impose predefined functional forms, allowing the data to reveal its inherent patterns and dynamics, therefore significantly mitigating endogeneity concerns that often plague traditional analytical methods.
This study contributes to the existing literature in two ways. First, it introduces a novel perspective for examining sustainable development through the lens of intangible capital. More importantly, rather than relying on traditional single indicators (such as patents or R&D expenditure) to measure intangible capital, this paper explores the dynamic evolution of intangible capital at a more aggregate level based on the CHS intangible capital framework. Second, this paper makes a methodological contribution to the existing studies of intangible capital. Prior studies of intangible capital have predominantly relied on growth accounting or conventional regression methods to analyze the contribution of intangible capital to economic development. These approaches often face challenges related to endogeneity, which become particularly pronounced when the analysis is conducted at the macro-aggregate level. By adopting a nonparametric dynamic distribution approach, this study eliminates the need to specify a predetermined production function. Instead, it allows the data—rather than model assumptions—to drive the analysis while also enabling an examination of the long-term dynamic distribution of intangible capital. This provides a meaningful technical complement to the existing body of research on intangible capital.
There are some interesting findings in this paper. First, this study finds that intangible capital investment exhibits strong persistence, indicating that countries with an early start and richer historical accumulation tend to maintain their advantage in intangible development. However, among developed economies, the long-term unconditional distribution of intangible capital displays club convergence, with most countries showing a trend toward convergence rather than divergence in their relative intangible capital investment levels. This suggests that, within developed economies, intangible capital does not significantly widen economic disparities between nations. Second, intangible capital investment is closely linked to several key structural economic factors. Countries with a higher share of the tertiary sector tend to achieve relatively high long-term development levels of intangible capital, underscoring the critical role of industrial upgrading in intangible-driven sustainable development. Moreover, in economies with both low and high labor income shares, we observe that intangible capital can converge to relatively high levels in the steady-state distribution. This confirms that the development of intangible capital does not necessarily substitute for labor or reduce the labor income share. Finally, among countries that excessively rely on the external market, the long-term steady-state distribution of intangible capital converges to relatively low levels. This indicates that excessive reliance on external markets is not always conducive to the development of intangible capital and may, in fact, hinder its growth.
The rest of this paper is organized as follows. Section 2 reviews the literature and presents theoretical background knowledge of the CHS framework. Section 3 describes the data source and provides an overview of intangible capital investment in the EU, the US, and Japan. Section 4 discusses the nonparametric approach of dynamic distribution analysis, and Section 5 reports and explains our main results. Section 6 concludes the paper.

2. Literature Review

2.1. Intangible Capital and CHS Framework

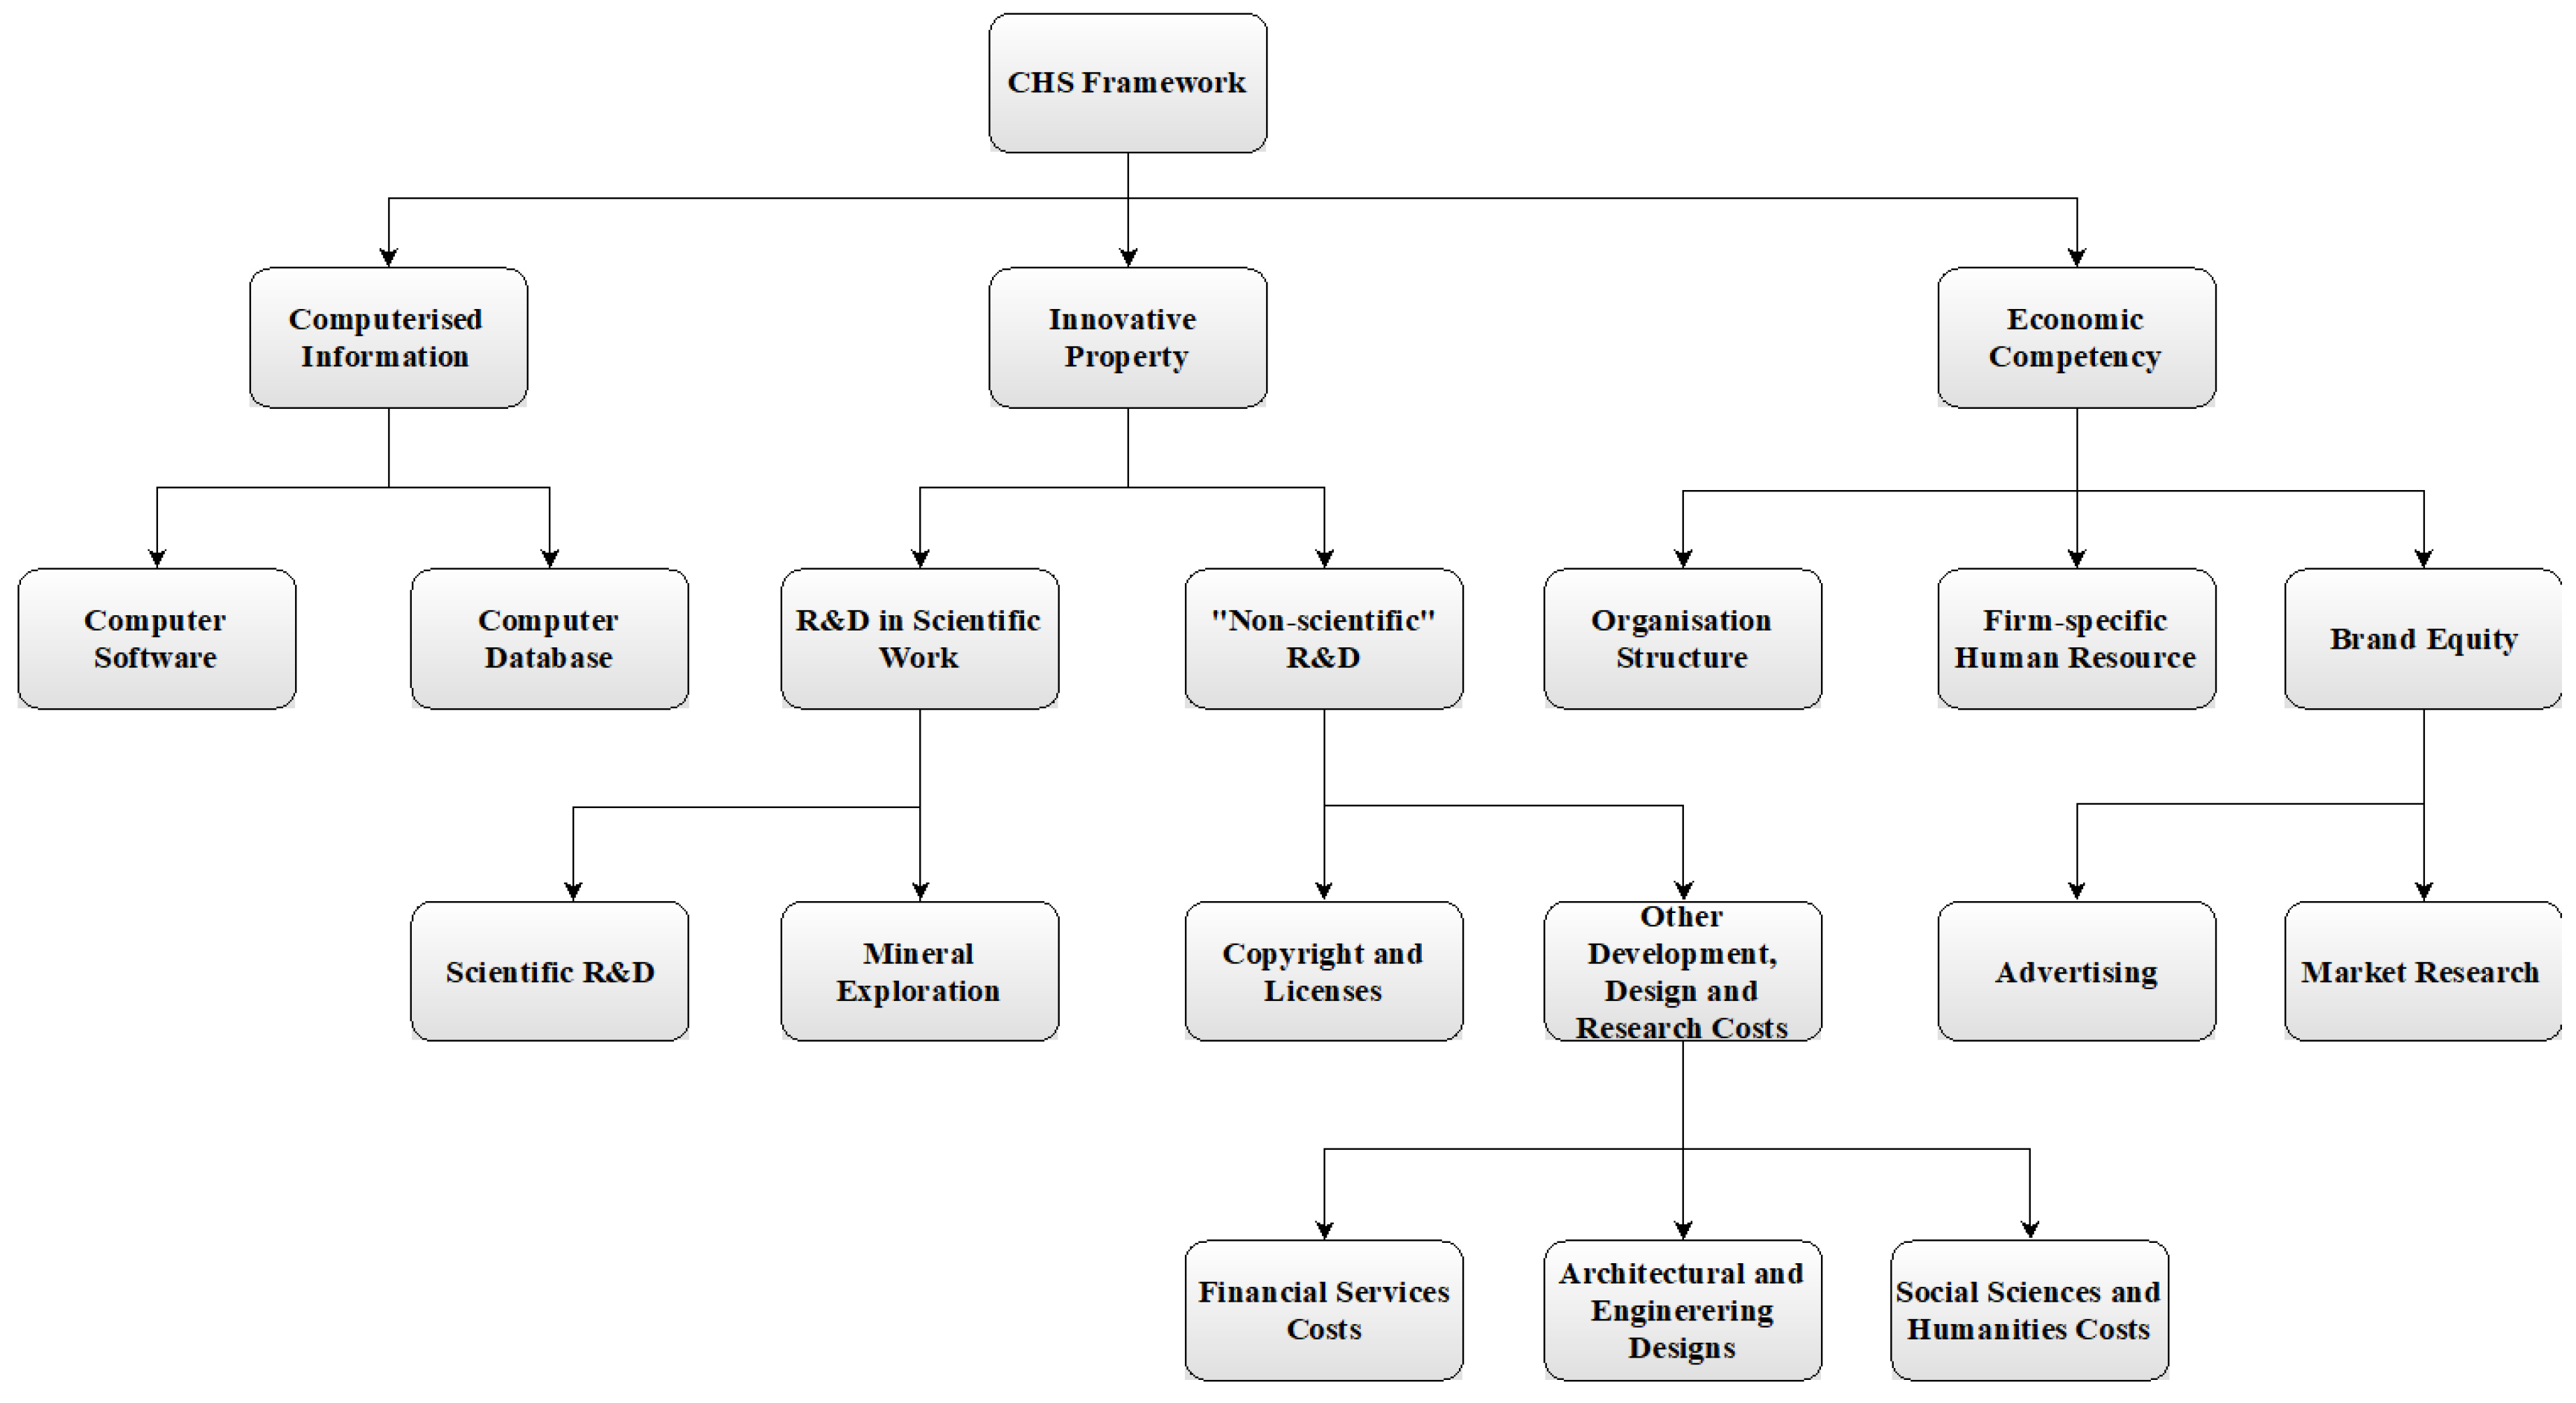
Intangible capital, due to its disembodiment and measurement impediments, has long been treated as an intermediate expenditure. Nakamura used an expenditure-based direct measurement, with the same cost-based accounting criteria used for physical capital, to evaluate types of intangible investment in the United States [31,32]. Corrado, Hulten, and Sichel extended the capital range in Nakamura’s work and established the globally accepted intangible capital framework [17,18]. Common business intangible capital is categorized into three broad groups, namely, computerized information, innovative property, and economic competency property (Figure 1). Among these, computerized information indicates knowledge embedded in computer software and databases, innovative property indicates knowledge formed in innovative processes and procedures, and economic competency property indicates knowledge accumulated in firm-specific human and organizational resources.
Intangible capitalization in the CHS framework has thus triggered worldwide source-of-growth analysis with this new input factor. Corrado and Hulten found that the omission of intangible capital accumulation resulted in an additional USD 4.1 trillion in capital stock beyond the conventional fixed asset measures for 2007 in the United States [33]. The growth rate of labor productivity rose by 10–20 percent after intangible capital was considered [34]. Goodridge et al. demonstrated that intangible capital can explain around 5 percentage points of the productivity puzzle in the UK, and the real growth of market sectors has been understated by 1.6 percent since the start of 2008 without considering intangibles [35]. Fukao suggested that intangible investment in Japan is far less than that in the US; the failure of the rapid increase in computerized information explains the productivity growth gap between Japan and the US [36]. Roth confirmed a positive and significant relationship between intangible capital and labor productivity in EU countries; tangible and intangible capital became the unambiguously dominant source of growth, and TFP effects diminished [37]. Similar evidence has also been collected from Australia [38], Canada [21], the Netherlands [39], Sweden [19], Finland [40], China [22,23], and Brazil [24], which collectively suggests that intangible capital is an important driving force for sustainable development.
However, although it has been widely confirmed that intangible capital contributes significantly to sustainable development, a heterogeneous investment pattern and an uneven economic distribution of intangible capital are also widely demonstrated. According to van Ark et al., Germany and France invested much more than other EU countries, such as Italy and Spain, in intangible capital [41]. The investment share of intangibles in national GDP was 7.1 and 8.8 percent in Germany and France, respectively, but only 5.2 percent in Italy and Spain in 2004. Roth and Thum confirmed that business intangible capital investments differ considerably across the 13 EU countries between 1998 and 2005 [42]. Sweden, followed by the UK and France, ranked as the leading places, while Italy and Spain held the two last positions in the distribution. Some countries, such as France, Sweden, the UK, the Netherlands, and Finland, have started to converge toward the US, for which intangible investment has become as large as tangible investment. In the transition countries, Slovenia and the Czech Republic, and the Mediterranean countries, Spain and Italy, however, tangible capital still dominates investment. Corrado et al. compared the diffusion of intangible investment across 18 European countries and the US over the years 2000–2013 [20]. Although tangible investment fell massively during the Great Recession and has hardly recovered on both sides of the Atlantic, intangible investment has been relatively resilient and recovered fast in the US compared to the EU countries. Li and Wu suggested that coastal regions in China are far leading ahead of the interior regions in terms of intangible investment, especially in computerized information; the great dispersion of intangible investment may further push up regional disparity and unbalanced economic development [23].

2.2. Structural Factors and Intangible Capital Development

A nation’s economic structural factors are mutually correlated with the uneven development of intangible capital among nations. First, many studies have found that intangible capital tends to cluster in certain specific industries, implying that industrial structure may be closely linked to the development of intangible capital. In Australia and Japan, for example, the manufacturing sector is more intangible-intensive than the service sector, while in EU nations, the service sector witnesses a much higher growth rate of intangibles than the manufacturing sector [20,38,43]. Meanwhile, Borgo et al. found a quite even distribution of intangible capital investment among sectors in the UK, while manufacturing sectors witness a much higher investment return [44]. It is suggested that the concentration of intangible capital investment evolves over time, and intangible-intensive sectors change, which requires long-run tracking [27].
Second, the national income structure may be closely linked to the development of intangible capital. Intangible capital is fundamentally driven by technology and knowledge innovation. The relationship between technology, knowledge, and labor input has long been debated. An optimistic view holds that technology and knowledge can complement labor, creating synergies and generating new professions and job opportunities in the labor market [45]. According to this perspective, the labor income share may remain stable or even increase. Conversely, a pessimistic view argues that technology and knowledge may displace human capital, inevitably disrupting the existing structure of the labor market [46]. From this standpoint, the development of intangible capital could further reduce the labor income share. Corrado et al. found that the income share of labor in the US is significantly lower and shows a downward trend, especially after 1980, after intangible capital is incorporated into the growth-accounting analysis [34]. Mitra incorporated intangible capital in the real business cycle model (RBC) and noted that the volatility of labor compensation can be largely explained by intangible capital development in the post-1984 period in the US [47]. Real wage volatility has risen since the marginal product of labor, and, therefore, the wage, internalizes the effect of building up intangible capital stock for future production. Koh et al. argued that the changes in the methodology implemented by the Bureau of Economic Analysis (BEA) attribute the entire rents of intellectual property products (IPPs) to capital income and lead to an apparent decline in the labor share [48]. O’Mahony et al. suggested that different intangible capital values have different impacts on labor share [49]. While economic competencies tend to reduce the labor share, other innovative properties are insignificant or lead to the opposite result. Garcia-Lazaro and Pearce also found that the heterogeneous effects of intangible capital on the labor share and growth regimes are found to mediate effects [50].
Finally, a nation’s reliance on external markets is closely related to the development of its intangible capital. On the one hand, economies that actively engage with global markets gain enhanced access to technological frontiers and high-skilled human capital, thereby accelerating the accumulation of intangible capital through cross-border knowledge and skill spillovers. The existing literature broadly supports a positive link between international economic exposure and knowledge innovation, with multinational corporations and cross-border collaboration often acting as conduits for such spillovers [51,52,53]. International competition is also recognized as a significant driver of firm-level knowledge capital and intangible capital accumulation [54,55]. On the other hand, an excessive dependence on external demand may exert structural pressure that discourages long-term, proprietary intangible investment. When firms operate in environments dominated by volatile global demand and intense international competition, they may prioritize short-term operational efficiency and cost-cutting over sustained innovation and intangible asset development. Micro-level studies indicate that while moderate competitive pressure can motivate innovation, extremely high levels of competition—often associated with deep external reliance—can suppress firms’ incentives to invest in intangible capital [56].
Grounded in existing evidence, this study extends the analysis of intangible capital by exploring both its unconditional dynamic distribution and its transitional patterns when conditioned on critical economic structural factors at the national level—specifically, industrial structure, income structure, and external-demand dependence. Detailed discussions are provided in the sections that follow.

3. Data and Preliminary Analysis

The main data source of this paper is EU KLEMS. EU KLEMS is the productivity database created by the European Union. It releases harmonized country- and industry-level data for capital (K), labor (L), energy (E), materials (M), and service input (S) and can be traced back to the 1990s. In its latest 2019 version, EU KLEMS released an “analytical database” to include supplementary intangible investments and capital stocks of the CHS framework for EU27 member states, the United Kingdom, Norway, Japan, and the United States. However, some types of intangible capital investment are missing for some countries in EU KLEMS. We thus merge EU KLEMS with another dataset, the INTAN-Invest dataset (version 2020), to incorporate as many countries as we can. The INTAN-Invest dataset was created by the 7th Framework Program of the European Commission. It provides harmonized, detailed, cross-country data on individual intangible investments in the CHS framework for 18 EU countries plus the UK and the US. Our final data consists of 27 EU nations plus the UK, Japan, and the US between 1998 and 2015.
To capture a nation’s economic structural factors, we focus on three dimensions: industrial structure, income structure, and external-demand dependence. These are proxied by the service sector share, the labor compensation share, and the export share of goods and services, respectively. All data are sourced from the World Bank.
To obtain the distribution of intangible capital investment among nations, a standardized indicator is necessary. A so-called relative intangible capital investment intensity (hereafter RICII) is constructed. First, we calculate the ratio of intangible capital investment to gross value added of a nation’s market sector. The market sector is defined as total industries excluding real estate activities (NACE section L), public administration (NACE section O), education (NACE section P), health and social work (NACE section Q), household service and activities (NACE section T), and activities of extraterritorial organizations and bodies (NACE section U). Next, we standardize the absolute ratio within the year to obtain the RICII. Specifically, let y i t denote intangible capital investment intensity of county i in year t, and y t ¯ = 1 N i = 1 N y i t be the overall average of y t . In our case, N = 30 is the number of countries in our sample. The variable to be analyzed in our study is, therefore,
R I C I I i t = y i t y t ¯
When y i t = y t ¯ , R I C I I i t = 1. That is, if the spatial dispersion of capital intensity from the total average is small, the values of R I C I I i t should be tightly distributed around 1. Before we move on to analyzing the dynamic transitional trends of RICII, it is of interest and necessity to depict the static distribution among nations. To avoid the over- or under-smoothing bias of the density estimation, we adopt an adaptive kernel function developed by Silverman [57]:
f x = ( 1 / i = 1 N w i ) i = 1 N ( w i / h i ) K [ ( x X i ) / h ]
where K ( · ) is the kernel function, N is the number of countries, X i is the RICII in country i , h is the selected bandwidth, and w i is the weight associated with the data point. h i is defined as h i = h × λ i , in which λ i is the parameter for adjusting the fixed bandwidth h to adapt the density at the data point [58].
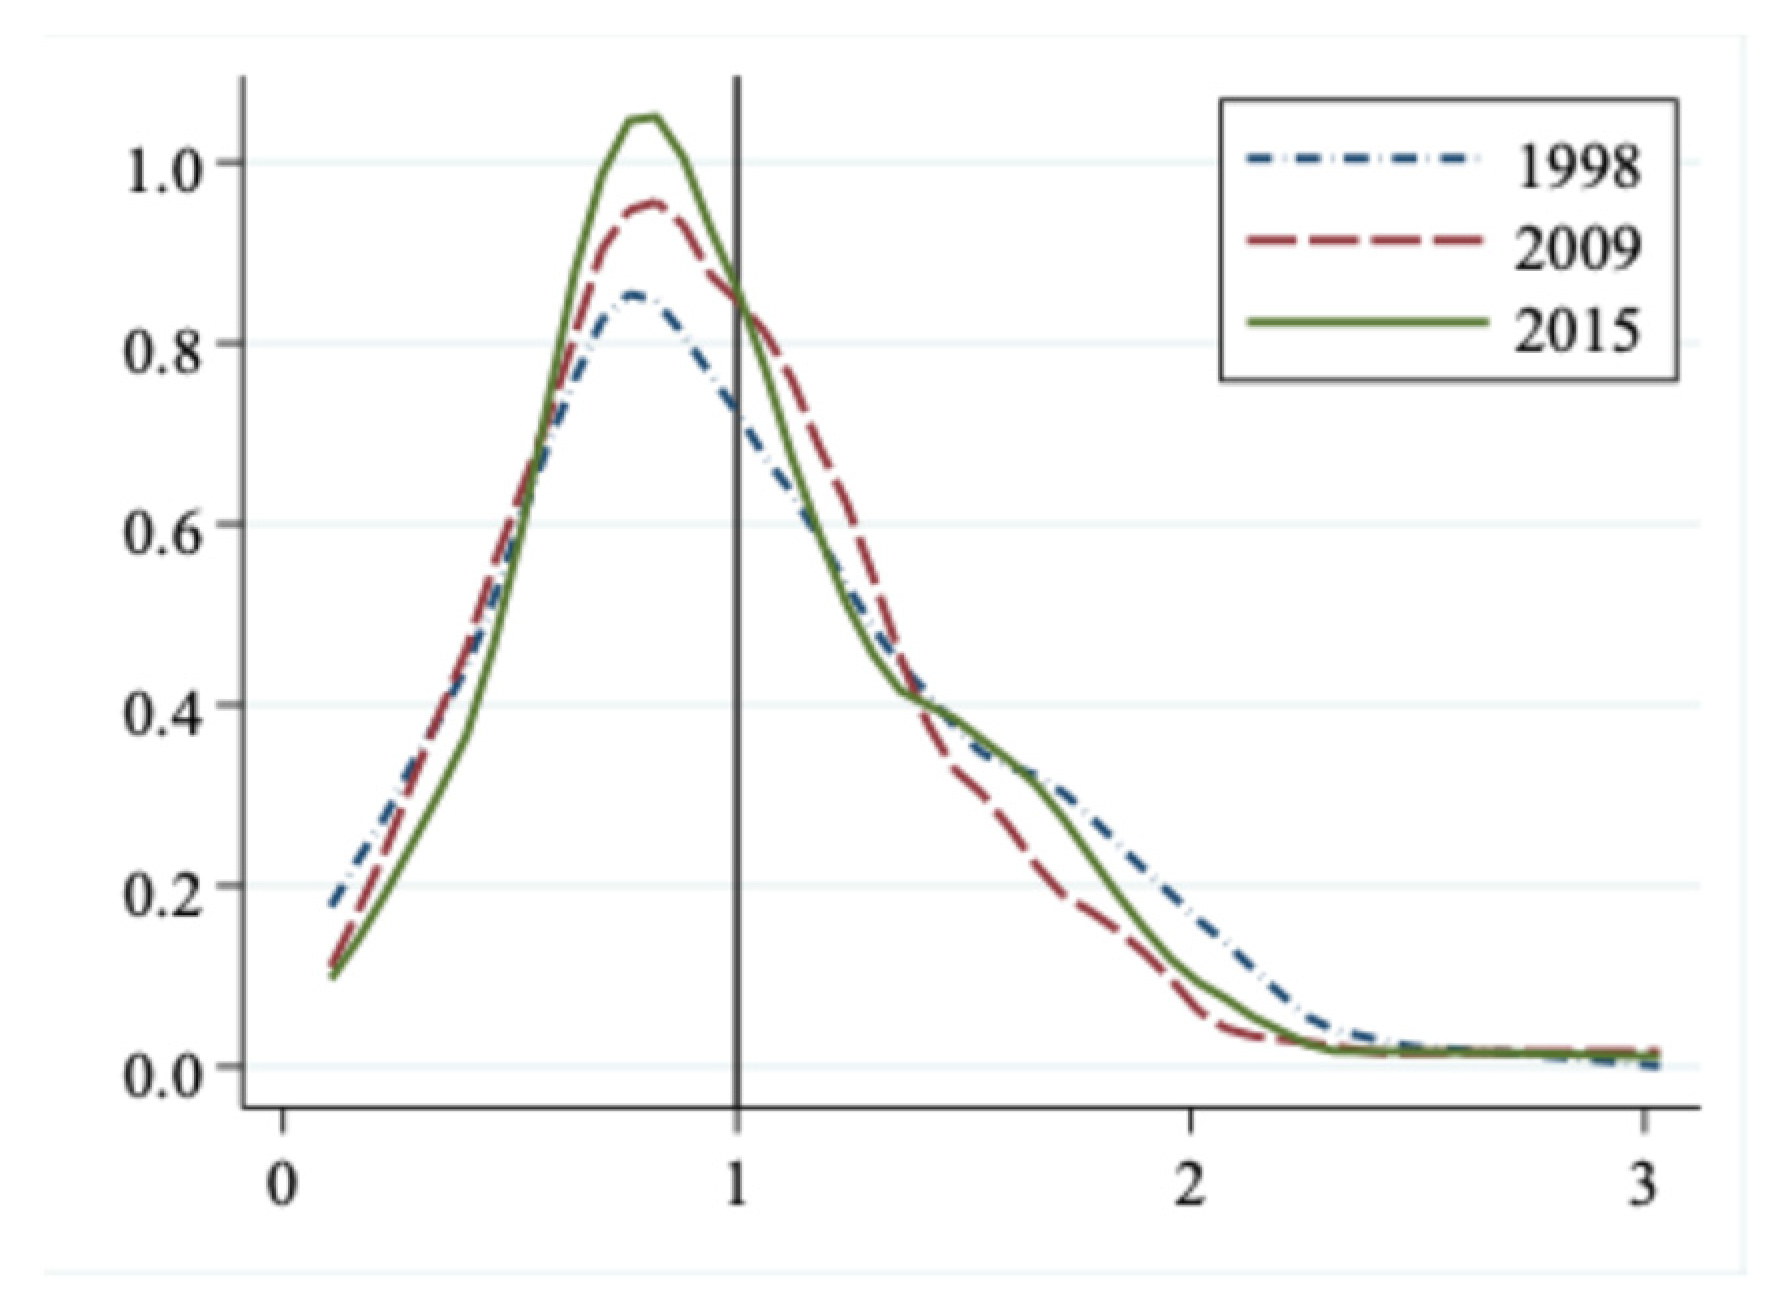
Figure 2 displays the specific-year density estimation of the RICII among the selected years. It is clear that the distributions in the selected years all show a roughly unimodal shape, but the tails turned out to be slimmer with the passage of time. The dispersion of intangible investment capital among nations became smaller. However, the peaks of the densities lay below one, implying that more countries exhibit lower-than-average intangible capital investment during the observed period. Meanwhile, it is suggested that some countries have always outperformed others in terms of intangible capital development. For example, the US, Sweden, and Ireland always lay above the 75th percentile during 1998–2015, while Cyprus, Greece, and Poland always lay below the 25th percentile. We now move on to the dynamic distribution analysis to gain more in-depth insights.

4. Method

The objective of this paper is to analyze the dynamic transitional patterns and long-term steady-state distribution of intangible capital at the national level, thereby examining whether intangible asset development converges or diverges across countries. Research into economic convergence has developed along several methodological paths [59,60]. Among the foundational mainstream methods is the β-convergence approach, named for the negative slope coefficient (β) typically estimated when regressing economic growth rates on initial income levels. The theoretical underpinning, based on diminishing returns to capital, posits that poorer economies with lower starting incomes will experience faster growth than richer ones with comparable savings rates, thereby enabling a “catching up” or convergence process. Consequently, empirical evidence of convergence is often sought through a significant negative relationship—a negative β coefficient—between initial income and subsequent growth. Substantial empirical research has employed this β-convergence framework [61,62,63]. Nonetheless, the findings remain mixed, with divergent conclusions often attributed to the analysis of different time periods or the inclusion of varying sets of control variables.
A principal critique of this approach is that convergence represents a complex, dynamic evolution of income levels and growth patterns, which may not be adequately captured by a single, all-encompassing metric like a negative β coefficient [64]. Stated differently, a negative β is a necessary but not sufficient condition for convergence, as it does not automatically imply a reduction in the cross-sectional dispersion of incomes. This limitation spurred the development of σ-convergence analysis, which directly examines the standard deviation (σ) of the income distribution over time. However, similar to β-convergence, this method relies on a single summary statistic of the distribution, which fails to reveal the full complexity of its underlying dynamics—such as shifts from a unimodal to a multimodal shape.
A significant methodological advancement was introduced in a series of seminal papers by Danny Quah, who proposed a nonparametric distributional analysis to study convergence [65,66,67]. This is fundamentally a data-driven approach that imposes no a priori assumptions or restrictions on the distribution function. Unlike methods focused on summary statistics, it analyzes the shape and evolution of the entire income distribution, thereby overcoming the key limitations of both β- and σ-convergence analyses [68]. This framework can be implemented via discrete Markov chains or stochastic kernel methods. A major drawback of the discrete Markov chain approach is the need for arbitrary discretization, where continuous income states must be divided into distinct categories [69]. To avoid this arbitrary demarcation, the present study employs the stochastic kernel approach, following the expositions in Cheong and Wu [70].
Formally, let f t ( x ) denote the distribution of a variable x at time t, and f t + τ ( z ) is the distribution of variable z at time t + τ . In our context, x represents the current RICII level, while z represents the level of τ periods ahead. Assuming the distributional evolution is time-invariant and that the future distribution depends only on the current one, the dynamic process from time t to t + τ can be described by the following integral equation:
f t + τ z = 0 g τ ( z | x ) f t ( x ) d x
where g τ ( z | x ) is the conditional probability transition kernel that maps the distribution from time t to t + τ . As a density function, the transition kernel integrates to unity over z: 0 g τ z x d z = 1 . To estimate g τ z x , we first obtain the bivariate joint density:
f t , t + τ x , z = 1 n h z h x i = 1 n K ( z Z i h z , x X i h x )
Here, K ( · ) denotes the Epanechnikov kernel function, n is the number of observations, and X i and Z i are the RICIIs for country i at times t and t + τ , respectively. The parameters h x and h z are the selected bandwidths for x and z . To mitigate potential under- or over-smoothing, we apply the two-step adaptive kernel method proposed by Silverman [57]. Given the constraints of our sample size, and following Quah, we use annual transition probability estimators to enhance the reliability of our results. The transition probability kernel density is then computed as [71]
g τ z x = f t , t + τ ( x , z ) f t ( x )
where f t x is the marginal kernel density of x as defined by Equation (2). Finally, under the assumption of a time-invariant kernel g τ ( z | x ) , the current distribution will converge to a long-run steady-state or ergodic distribution as τ approaches infinity. This ergodic distribution is given by
f z = 0 g τ ( z | x ) f ( x ) d x
In addition to the established methods, our analysis incorporates a more recent instrument from the transition dynamics literature: the Mobility Probability Plot (MPP), introduced by Cheong and Wu [70]. Relative to conventional graphical tools, such as kernel density plots, contour plots, and ergodic density plots, the MPP provides a clearer interpretive lens and a comprehensive perspective on transitional patterns. Specifically, for any given RICII level at time t , the net probability of upward mobility is defined as the difference between the cumulative probability of transitioning to higher RICII levels and the cumulative probability of transitioning to lower levels. This measure is formally expressed as
p x = x g τ z x d z 0 x g τ ( z | x ) d z

5. Results and Discussions

5.1. Unconditional Distribution Dynamics for the Full Sample

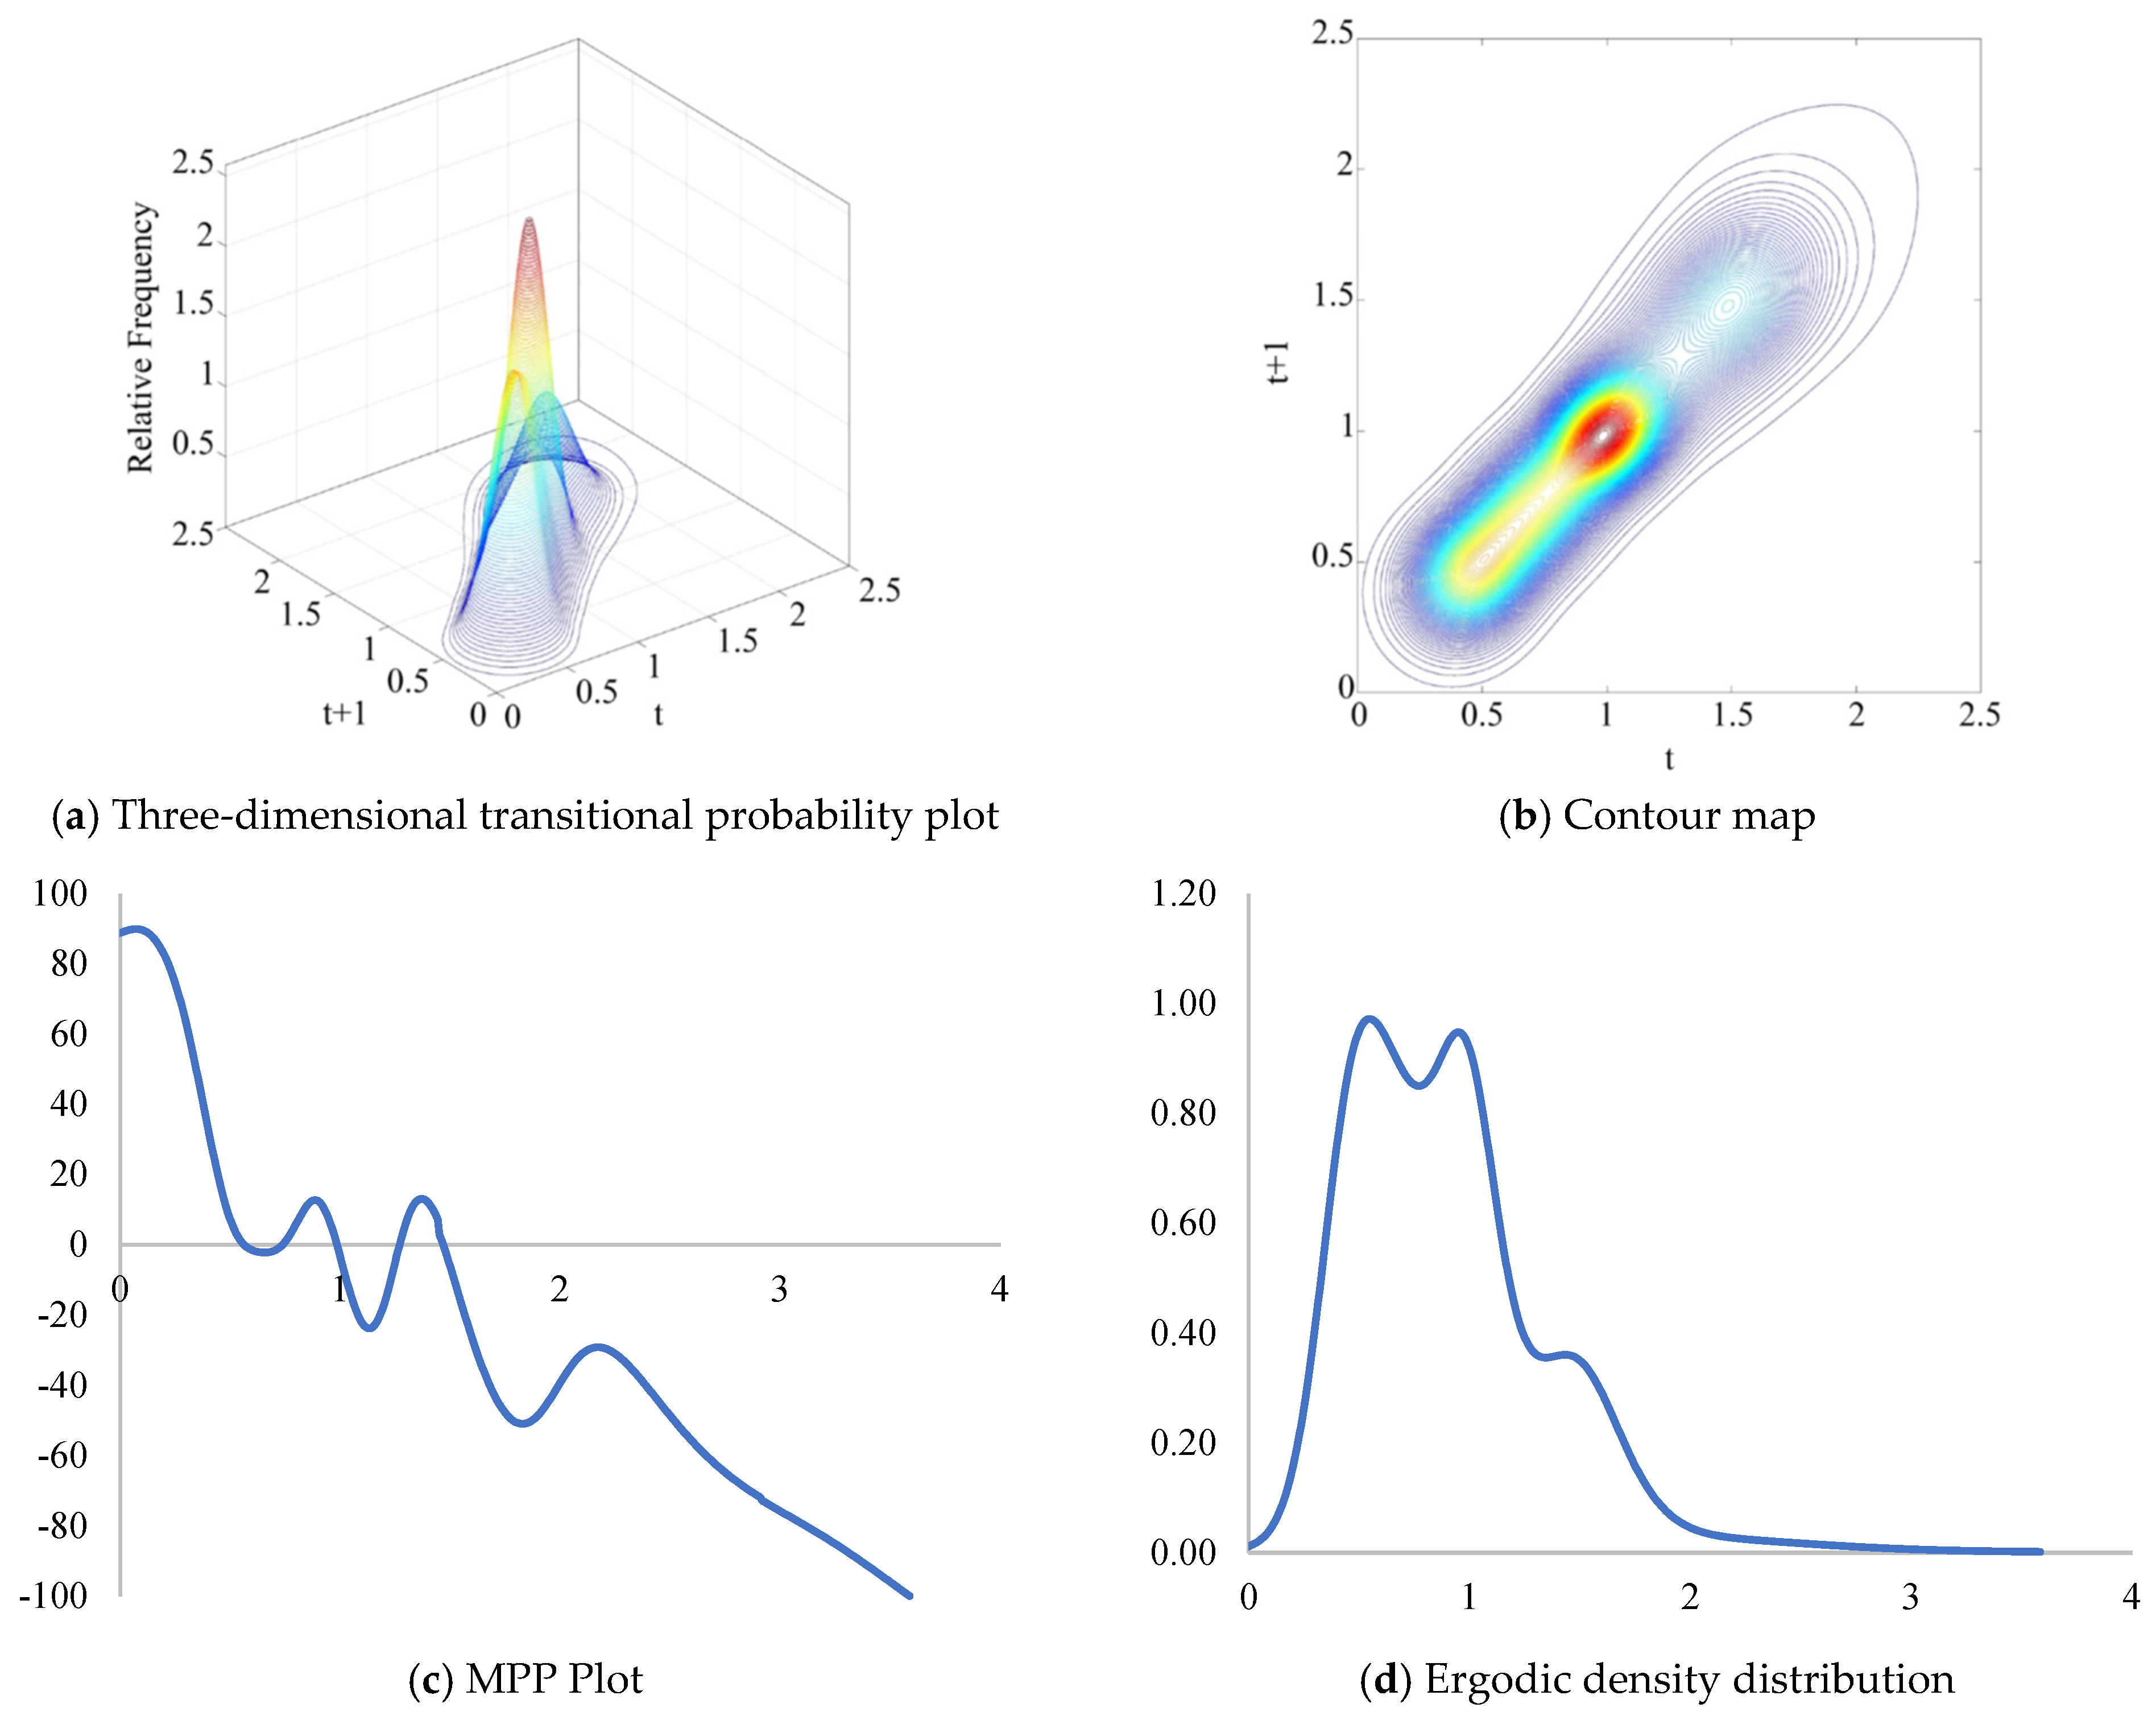
First, we focus on the unconditional distribution dynamics of the overall sample during the period 1998–2015. Figure 3a presents a three-dimensional distribution of the annual transitional probability of the RICII across all countries from 1998 to 2015. The horizontal axis represents the prior-period probability distribution at time t , while the vertical axis represents the posterior-period probability distribution at time t + 1 . For any given prior-period distribution, the cross-section tangent to the horizontal axis reflects the transitional probability between the two periods.
To analyze the transitional probability more intuitively, Figure 3b illustrates the corresponding density contour map. This provides a bird’s-eye view of the 3D plot, offering a clearer visualization of the distribution. If the probability mass is widely dispersed around the 45-degree line, it suggests that intangible asset investments are relatively scattered across countries. Conversely, if the probability mass is concentrated around the 45-degree line, it indicates that intangible capital may be more intensively invested in a subset of countries—implying that countries with high intangible asset investment in period t are likely to maintain their leading positions in period t + 1 .
From the 3D transitional probability density plot, it is evident that the distribution of intangible capital exhibits three distinct peaks. The highest peak is located around 1, a secondary peak appears near 0.5, and a third lower peak is situated around 1.5. The contour map aligns perfectly with the 3D distribution, confirming this pattern. These observations suggest the presence of investment clusters in intangible capital across the sample countries. A small subset of countries acts as frontrunners in intangible asset investment, while the majority remain at average or lower levels.
However, neither the 3D plot nor the contour map provides a clear indication of where most of the probability mass is located. Therefore, we further employ the MPP method to analyze the direction of transitional probabilities. The MPP plot is presented in Figure 3c. Accordingly, a positive net probability is observed for countries with an RICII smaller than 1. Since most countries’ intangible asset investment density clusters around the peaks near 1 and 0.5, the MPP findings suggest that countries with relatively low levels of intangible asset investment exhibit a tendency to catch up with their more developed counterparts.
This conclusion is fully consistent with the ergodic distribution plot shown in Figure 3d, which illustrates the steady-state distribution based on the current transition path. As observed in the figure, the long-run steady-state distribution exhibits an approximately bimodal shape, with the highest peaks located around 0.8 and secondary peaks clustered near the mean.
Our findings lead to two main conclusions. First, the dynamic transition probability distribution of intangible capital is relatively concentrated around the 45-degree line. This indicates that intangible capital investment exhibits persistence: countries with a relatively high initial RICII tend to maintain a relatively high RICII in the subsequent period. Second, based on the ergodic density distribution and the MPP plot, the unconditional steady-state distribution of intangible capital across developed economies shows signs of convergence. Although the steady-state distribution displays a bimodal pattern, the two peaks are relatively close to each other, suggesting a long-term trend toward convergence—rather than divergence—in the RICII among developed economies. In other words, the development of intangible capital is not expected to widen the developmental disparities between these economies.

5.2. Distribution Dynamics Conditional on Economic Structural Factors

As discussed earlier, a nation’s economic structural factors may significantly influence intangible capital investment. In this subsection, we incorporate the structural factors of the sampled countries and reconstruct the transition probability density function for intangible capital to predict their dynamic distribution. Specifically, we consider three dimensions of a country’s economic structure: industrial structure, proxied by the service sector share (%GDP); income structure, indicated by the labor compensation share (%GDP); and external-demand dependence, measured by the export share of goods and services (%GDP). Based on these three indicators, we rank the sampled countries from low to high and divide them into three equally sized groups: the low-level group, the medium-level group, and the high-level group. (For each indicator, we compute its time-series average for each country over the period 1998–2015. Countries are then clustered into three equally sized groups based on their respective average values.)
The conditional RICII of county i is the ratio of per capita intangible investment of y i t over the group average intangible investment density. Specifically, the conditional RICII can be expressed as
R I C I I i t = y i t y i t ~
where y i t ~ = 1 N g j g y j t is the average intangible investment density in group g , which is defined by the conditional variable. By comparing against the average level of homogenous groups with similar economic structures, we can filter out the interference caused by overall level differences between groups, thereby revealing how conditional variables shape the relative distribution pattern of the analyzed variable (RICII) within each group. Since the conditional distribution represents the impact of this conditioning factor on the distribution of the conditioned variable, the larger the distinction between unconditional and conditional distribution, the higher the explanatory power of the factor [72].

5.2.1. Conditional on Industrial Structure

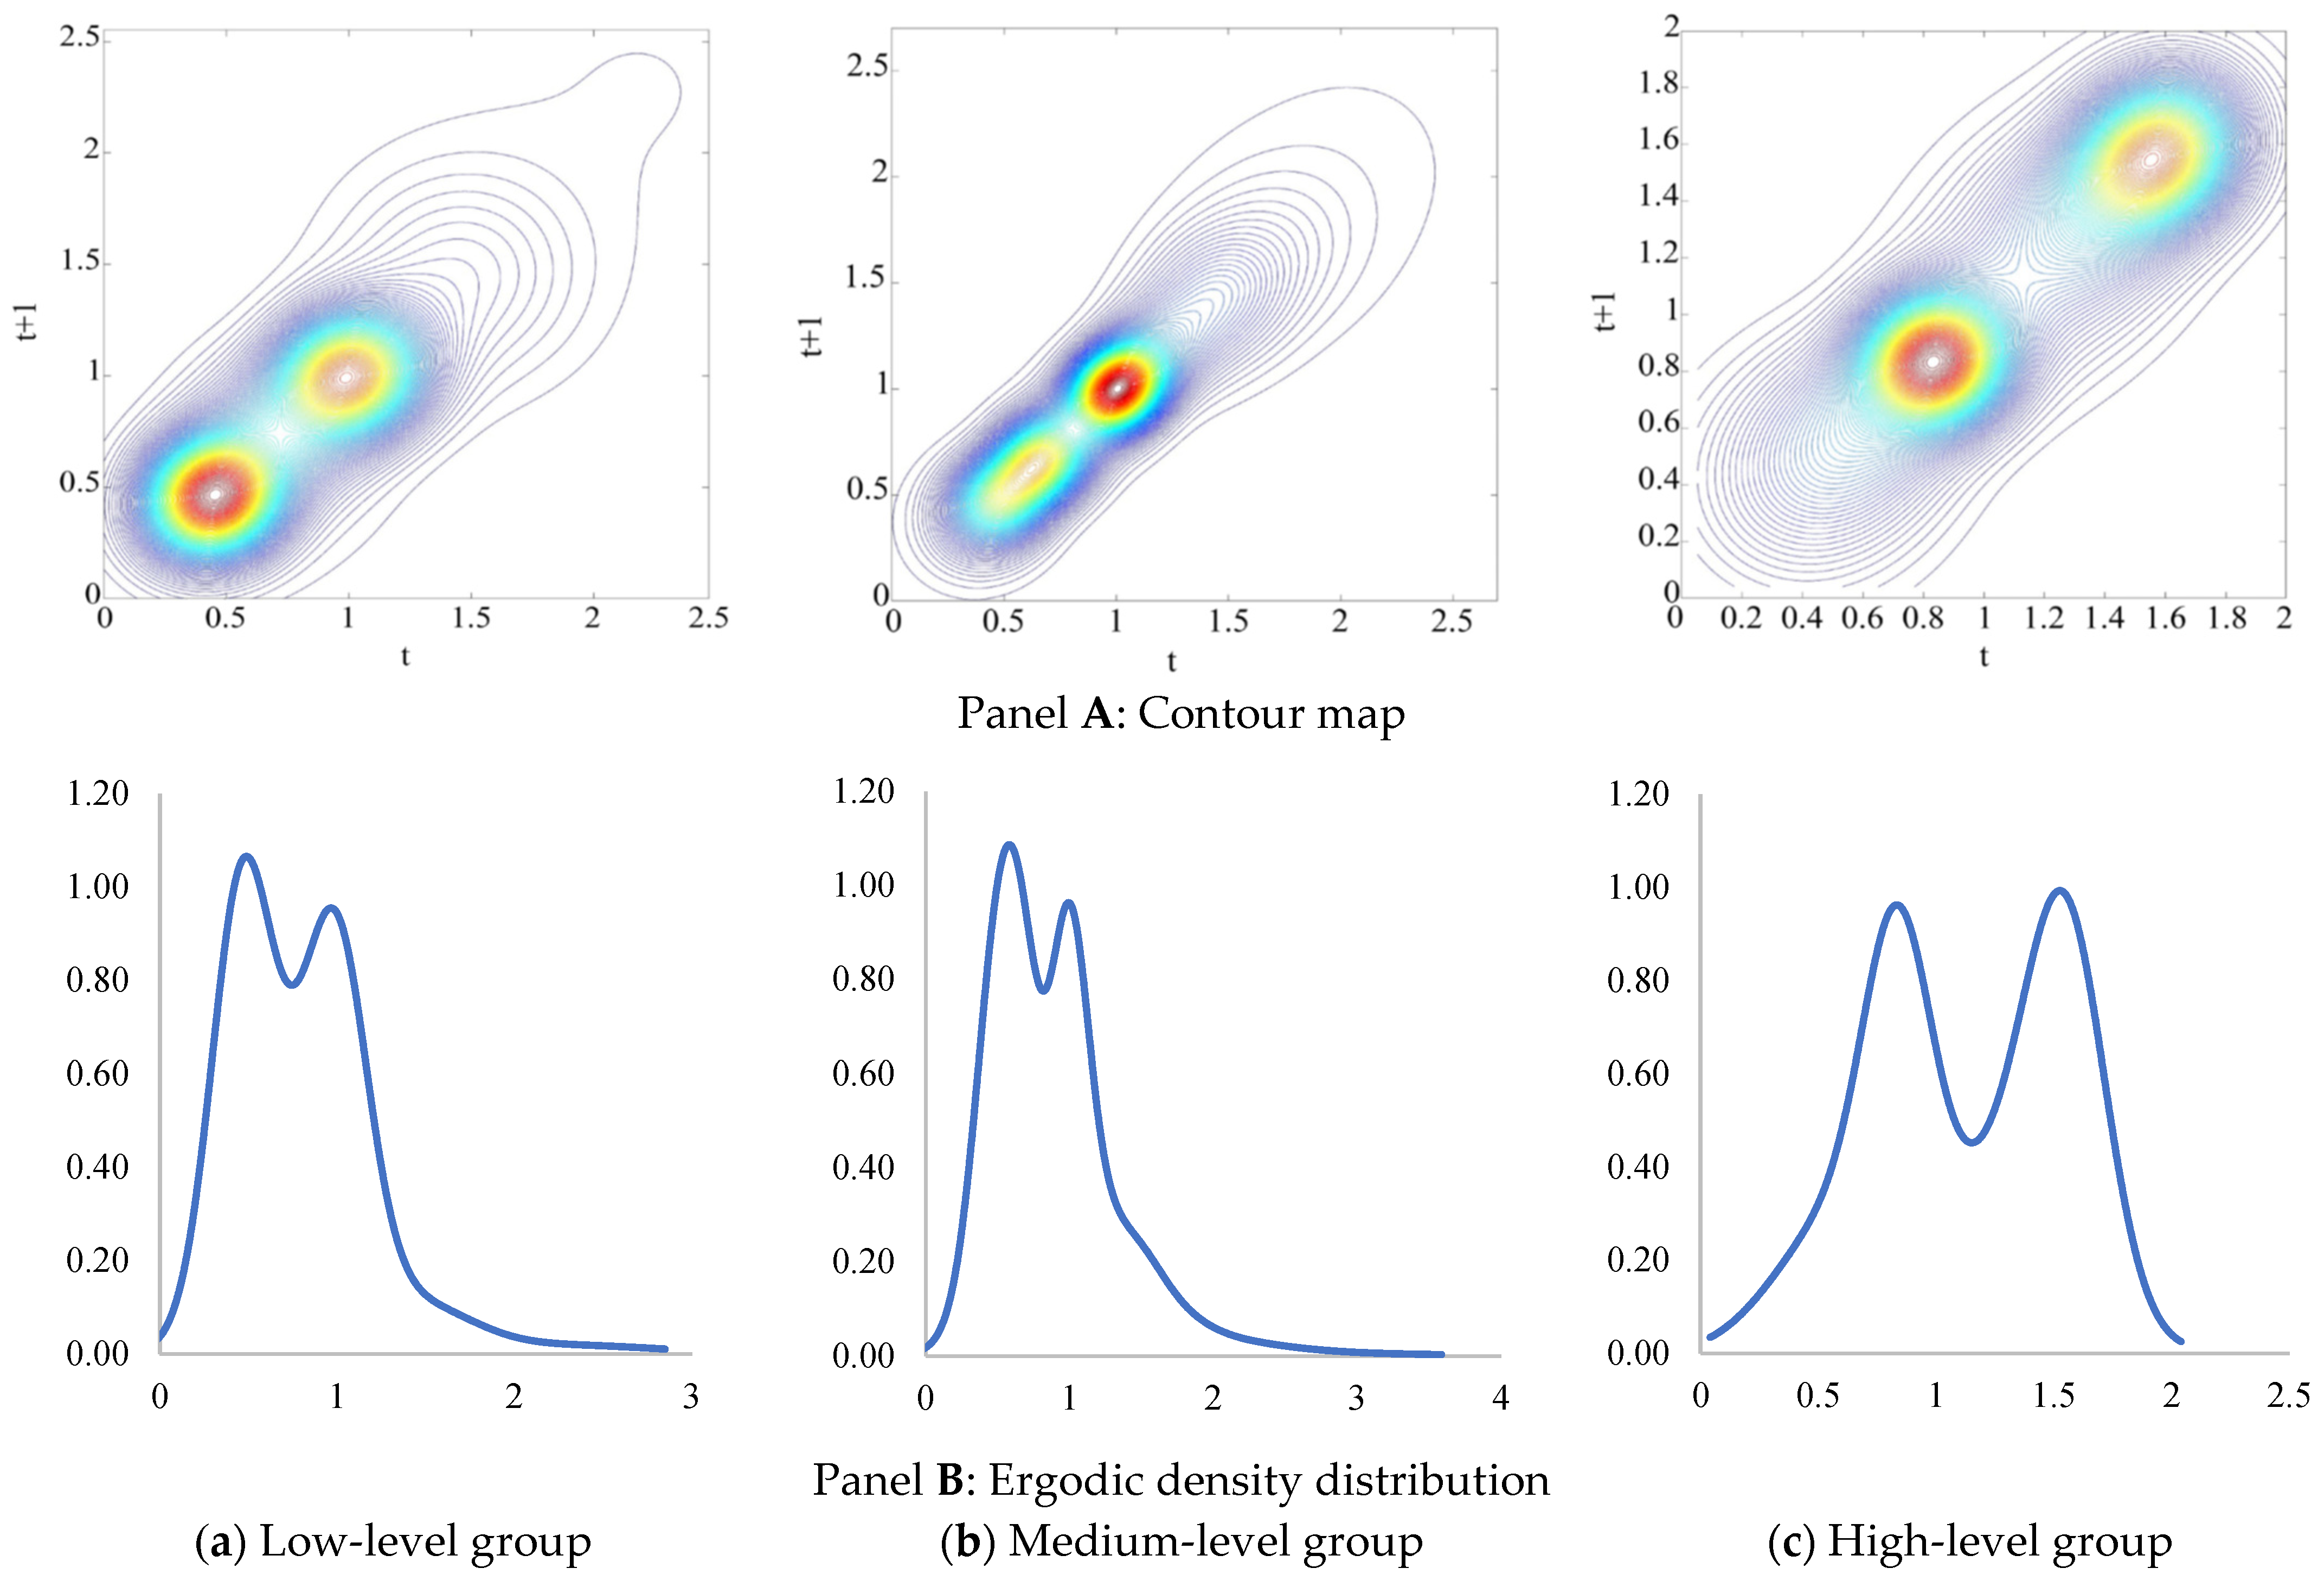
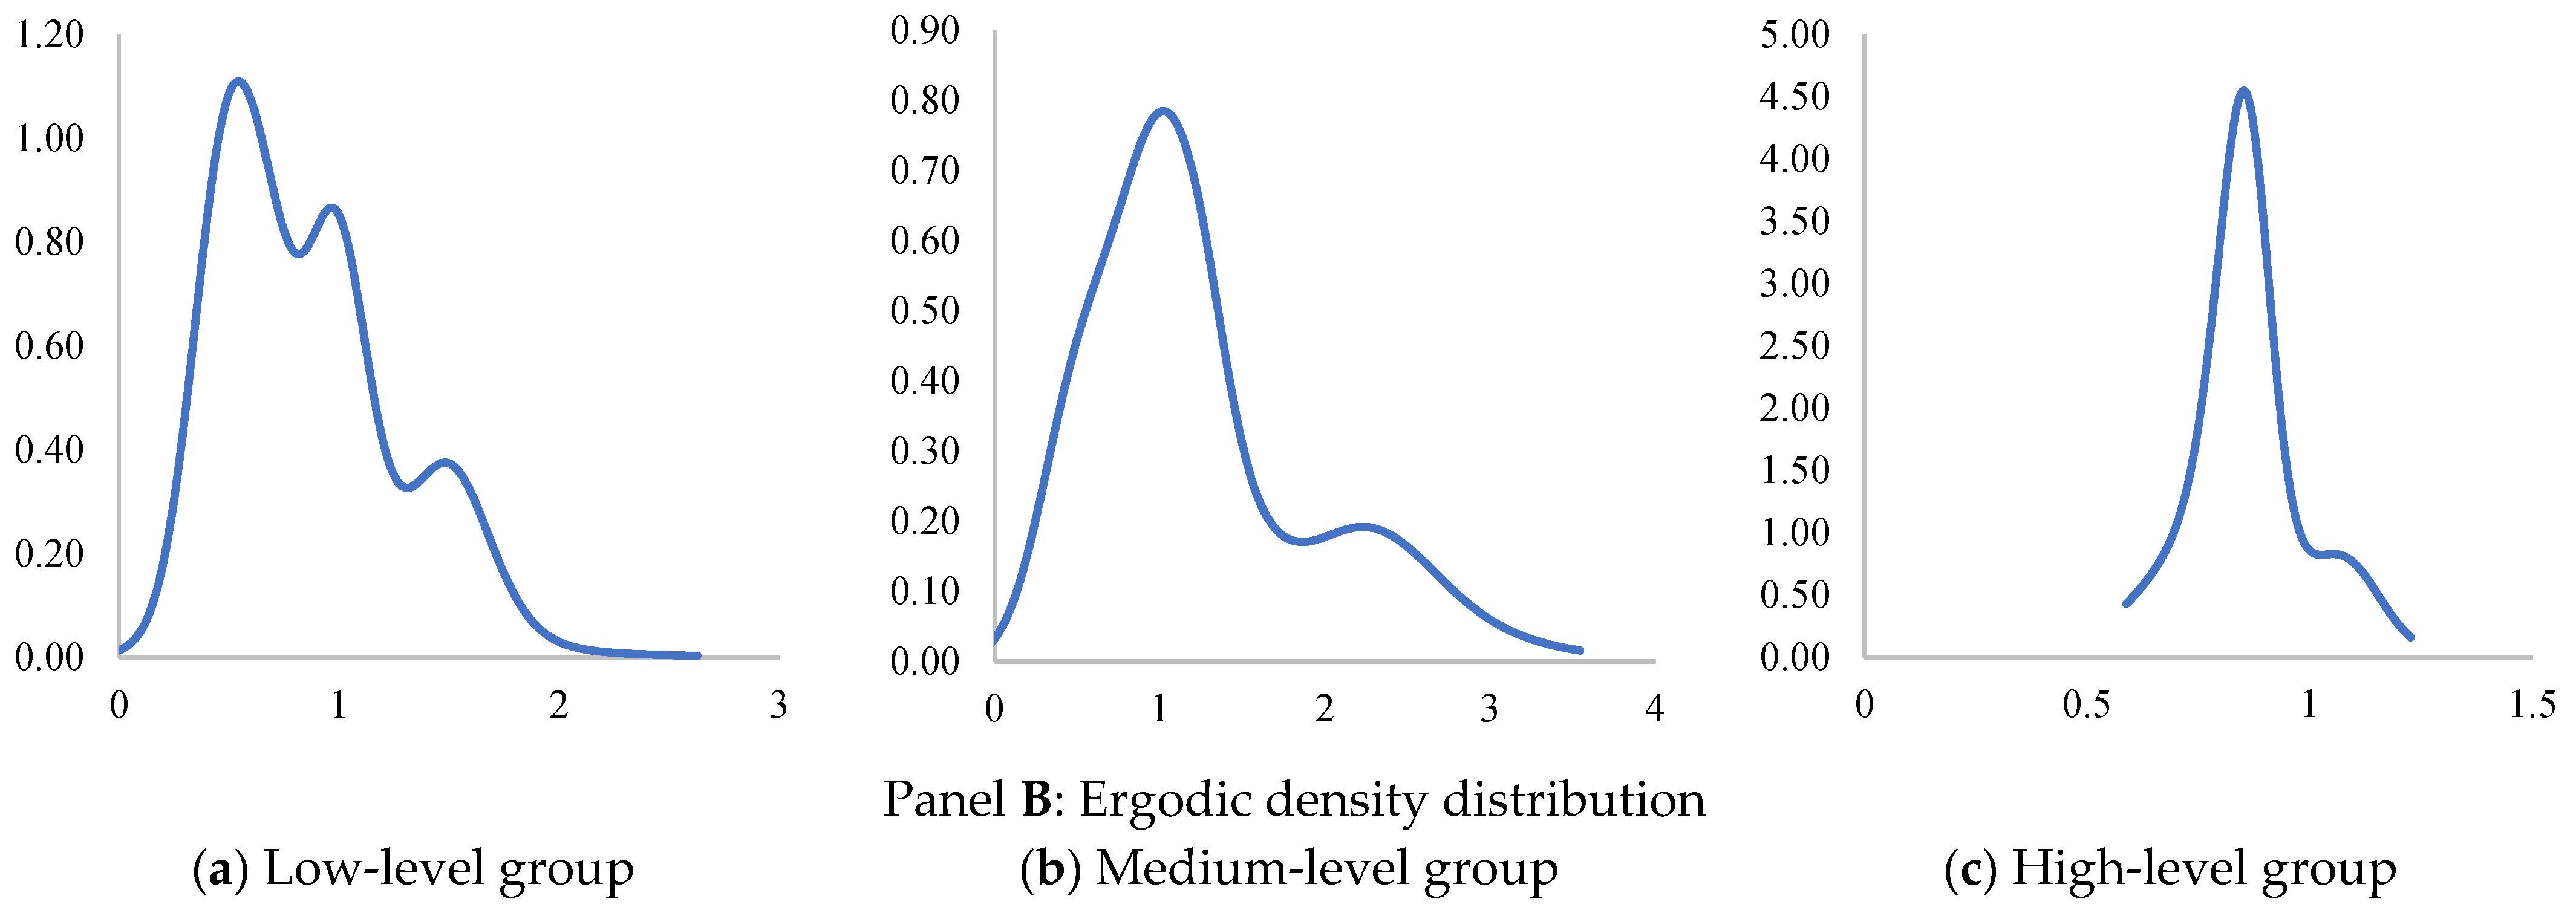
We re-conduct our analysis within the low-level, medium-level, and high-level groups. Typical countries in the low-level group include Romania, Slovenia, and Bulgaria, with average service shares between approximately 47% and 59%. The medium-level group comprises countries such as Italy, Spain, and Finland, where average values fall around 59% to 65%. The high-level group is represented by countries including the United States, the United Kingdom, and Japan, with average shares ranging from 67% to 75%. Figure 4 presents the contour map of the conditional probability kernel and the ergodic density distribution for each of the three groups. To save space, the 3D conditional probability kernel is not included in the following sections.
First, we clearly observe that the transitional probability kernel differs markedly from the unconditional one shown in Figure 3. Specifically, under the unconditional scenario, the probability mass of RICII lies within the range of [0.5, 1]. In the conditional case, for the group with the lowest tertiary sector share, the probability mass is concentrated in the interval [0.3, 0.6]. For the groups with medium and high shares, it falls within [0.8, 1.2]. Additionally, countries with the highest tertiary sector share exhibit the second probability mass in the approximate range of [1.4, 1.8] as well. This contrast strongly indicates that the tertiary sector serves as a key driving force behind intangible capital investment intensity in the sampled countries.
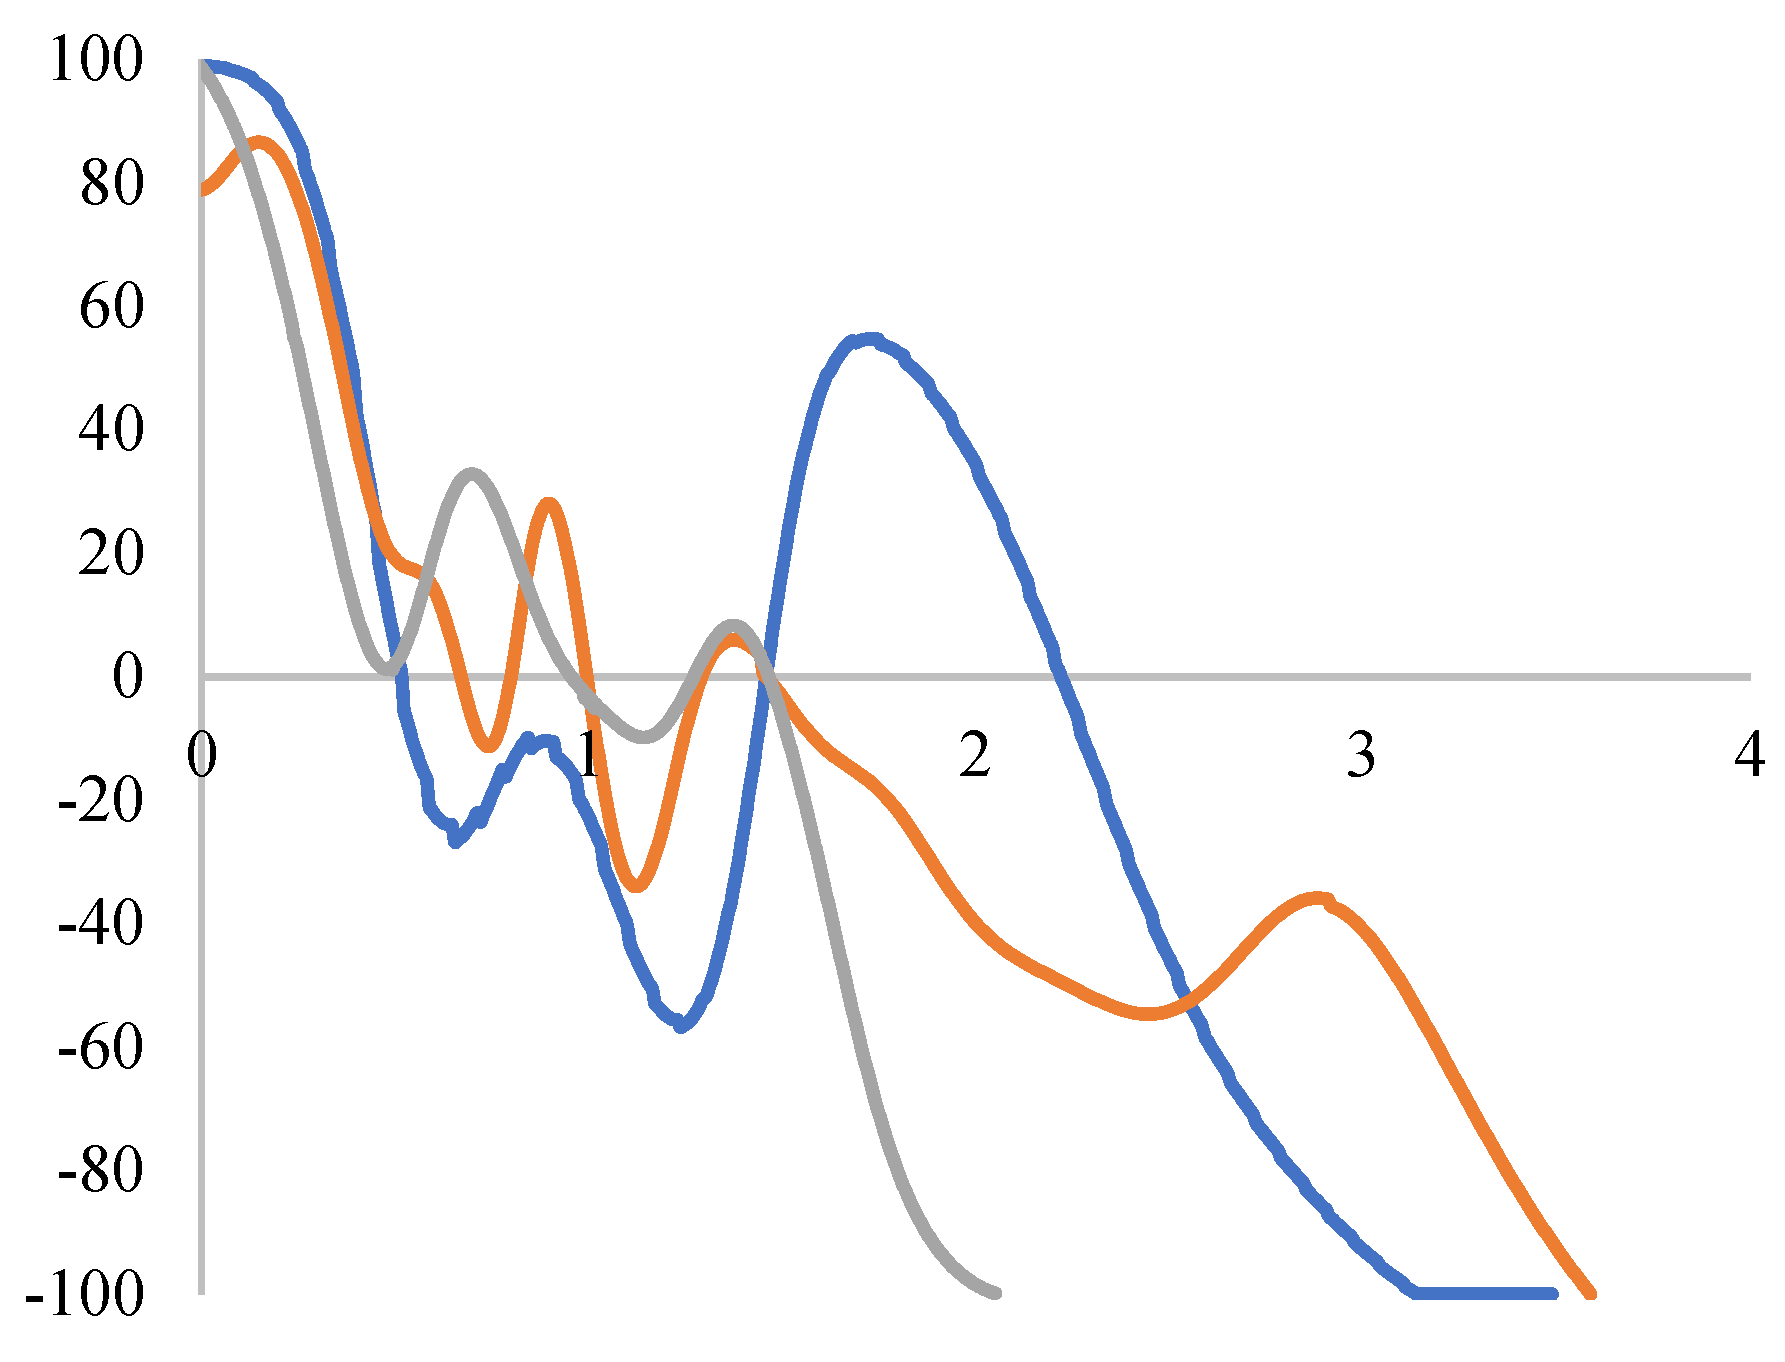
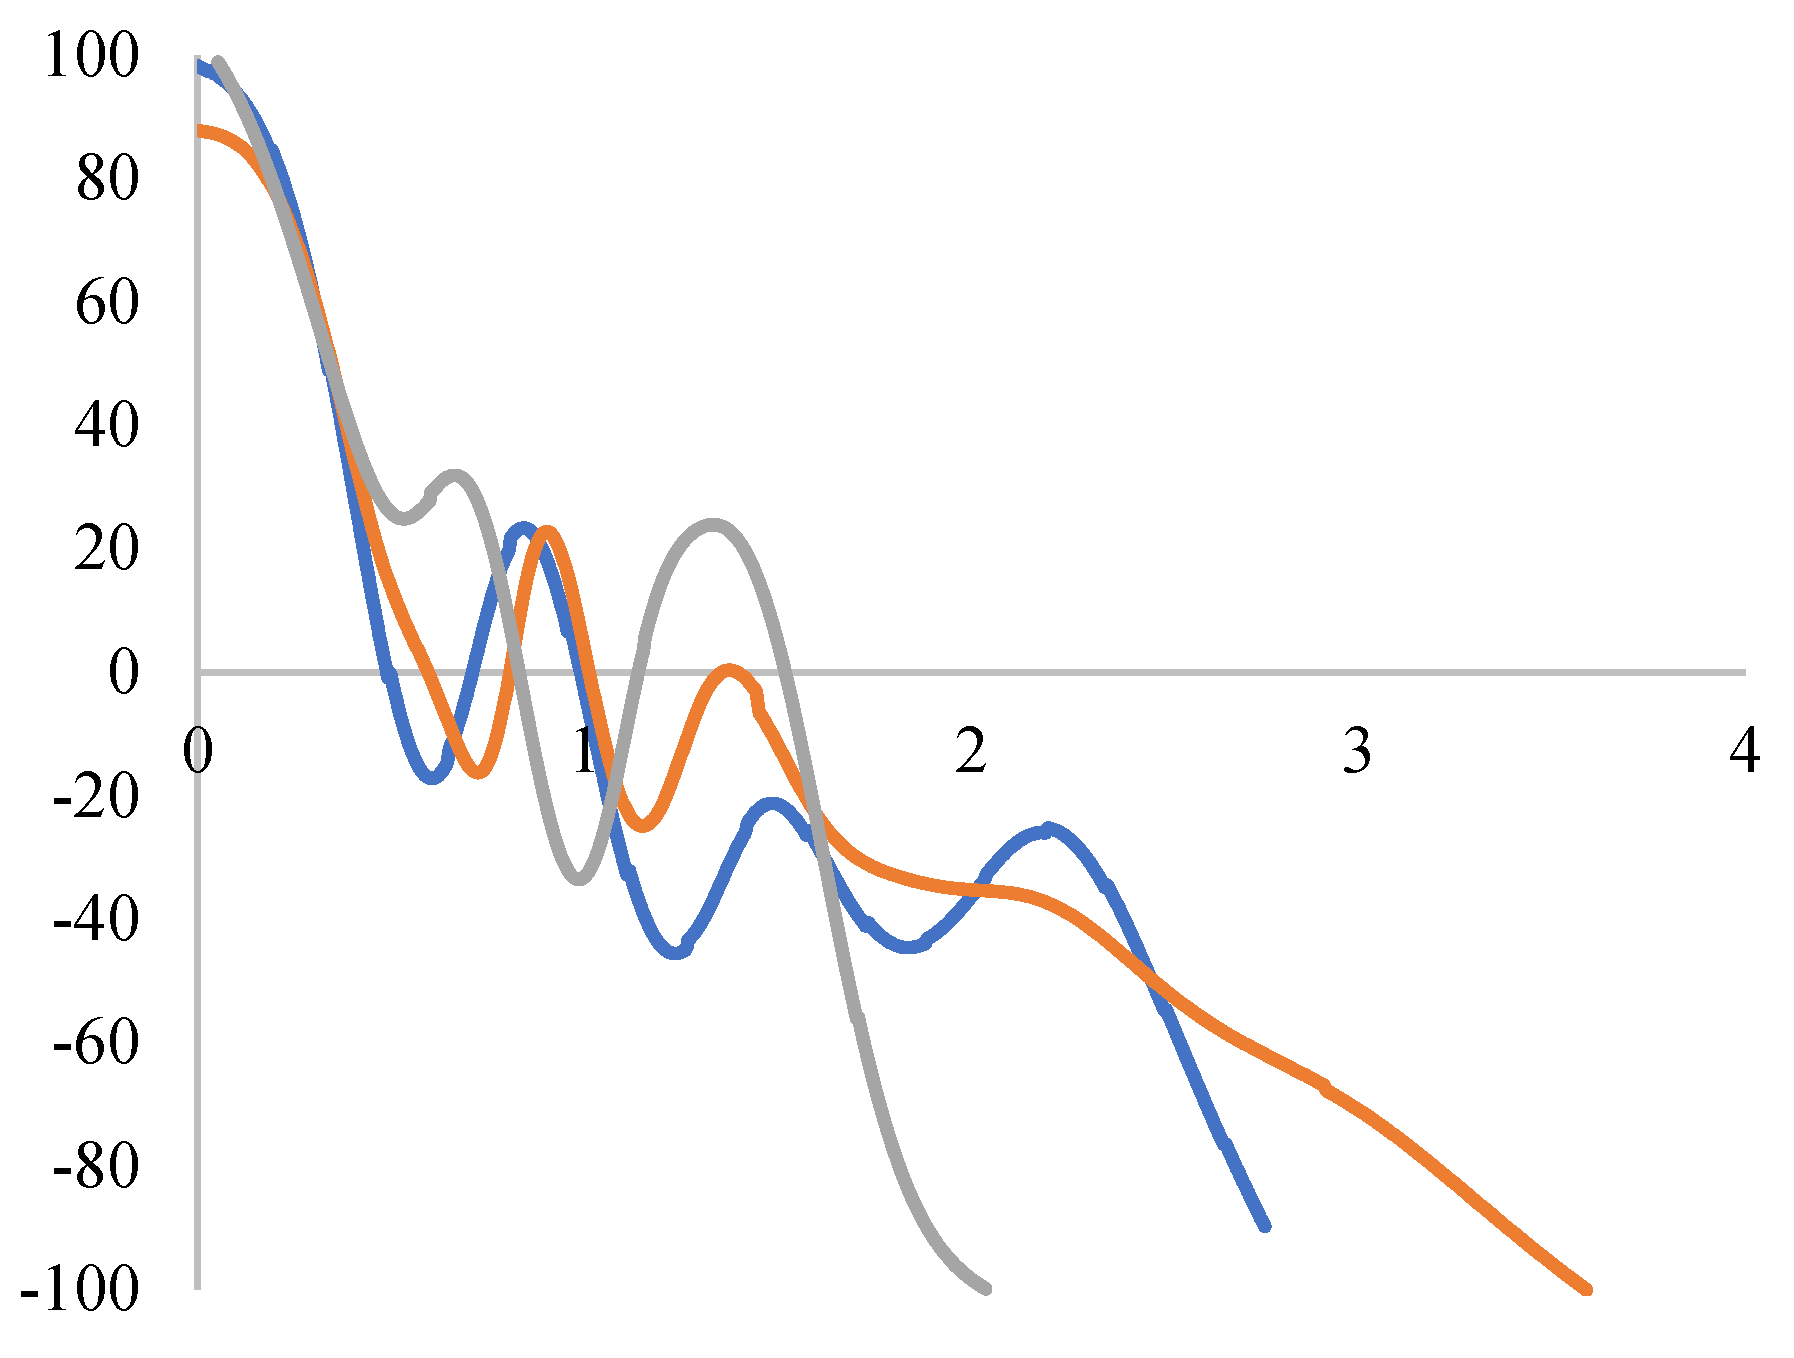
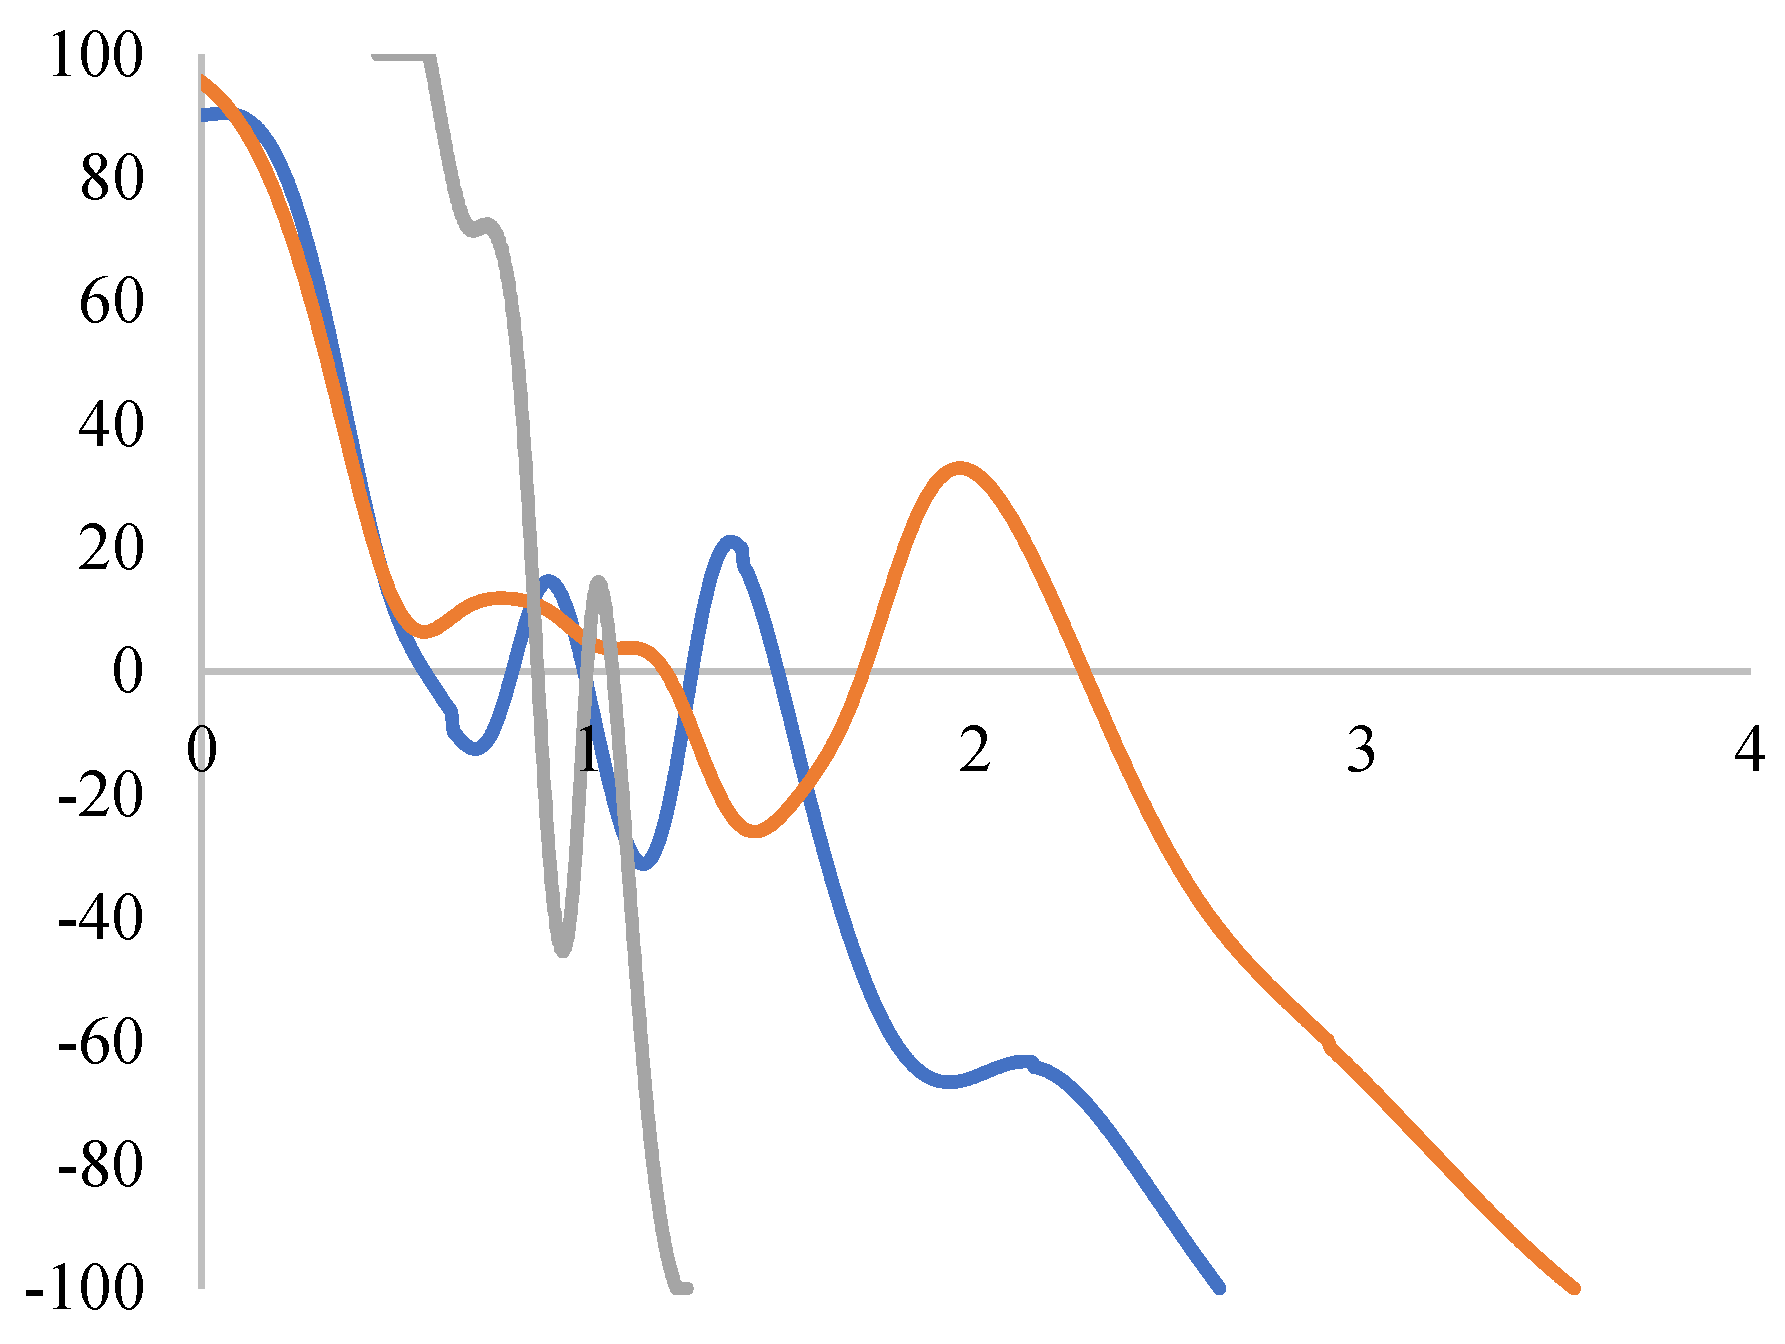
The MPP plot provides clearer validation of the above conclusions. According to Figure 5, for countries with the highest share of the tertiary sector (represented by the gray line), even when the RICII is already within the relatively high range of [1, 1.5], the net mobility probability remains positive. In contrast, for countries with low and medium tertiary sector shares, once the RICII exceeds 1, the net mobility probability shows a strictly negative value, implying a lack of upward momentum in intangible capital investment.
The findings derived from the annual transitional probability analysis are corroborated by the ergodic density distribution presented in Panel B of Figure 4. Accordingly, in the steady state, although all three groups exhibit a bimodal distribution, most countries in the low- and medium-level groups show intangible capital investment density below the average level. In contrast, the high-level group demonstrates club convergence. One of the clubs displays a probability density significantly exceeding the group’s average, centered around 1.5.
Unlike traditional manufacturing, tertiary industries—such as finance, business consulting, education, and culture—rely on professional knowledge and technological innovation as core inputs, while their outputs are predominantly intangible, such as solutions, intellectual property, and brand value. Consequently, industrial structure upgrading enables countries with a higher share of the tertiary sector to achieve relatively higher levels of intangible capital investment, reinforcing their comparative advantage in intangible-driven growth. However, this does not imply a widening of overall disparities in intangible capital across developed economies, as our unconditional convergence analysis indicates a long-term trend toward convergence in intangible capital investment. Rather, it highlights the role of industrial structure as a key factor shaping the relative positioning of countries within a converging trend. Given that intangible capital is a key driver of sustainable development in the intangible economy era, this finding underscores the importance of industrial upgrading in enhancing a nation’s capacity for sustainable growth.

5.2.2. Conditional on Income Structure

Based on the average share of employee compensation in GDP (1998–2015), the sampled countries are clustered into low-, medium-, and high-level groups. The low-level group (average shares: 42–53%) includes countries such as Poland, Ireland—notably affected by multinational profit shifting—and Romania. The medium-level group comprises Sweden, Japan, and Finland, with averages falling within the 53–59% range. The high-level group includes the United States, France, and Germany, where averages stand between 59% and 65%. Although inter-group differences in the labor income share appear numerically modest, this classification reveals distinct institutional and structural patterns. We subsequently conduct a within-group analysis to examine how this structural heterogeneity dynamically influences nations’ intangible capital development.
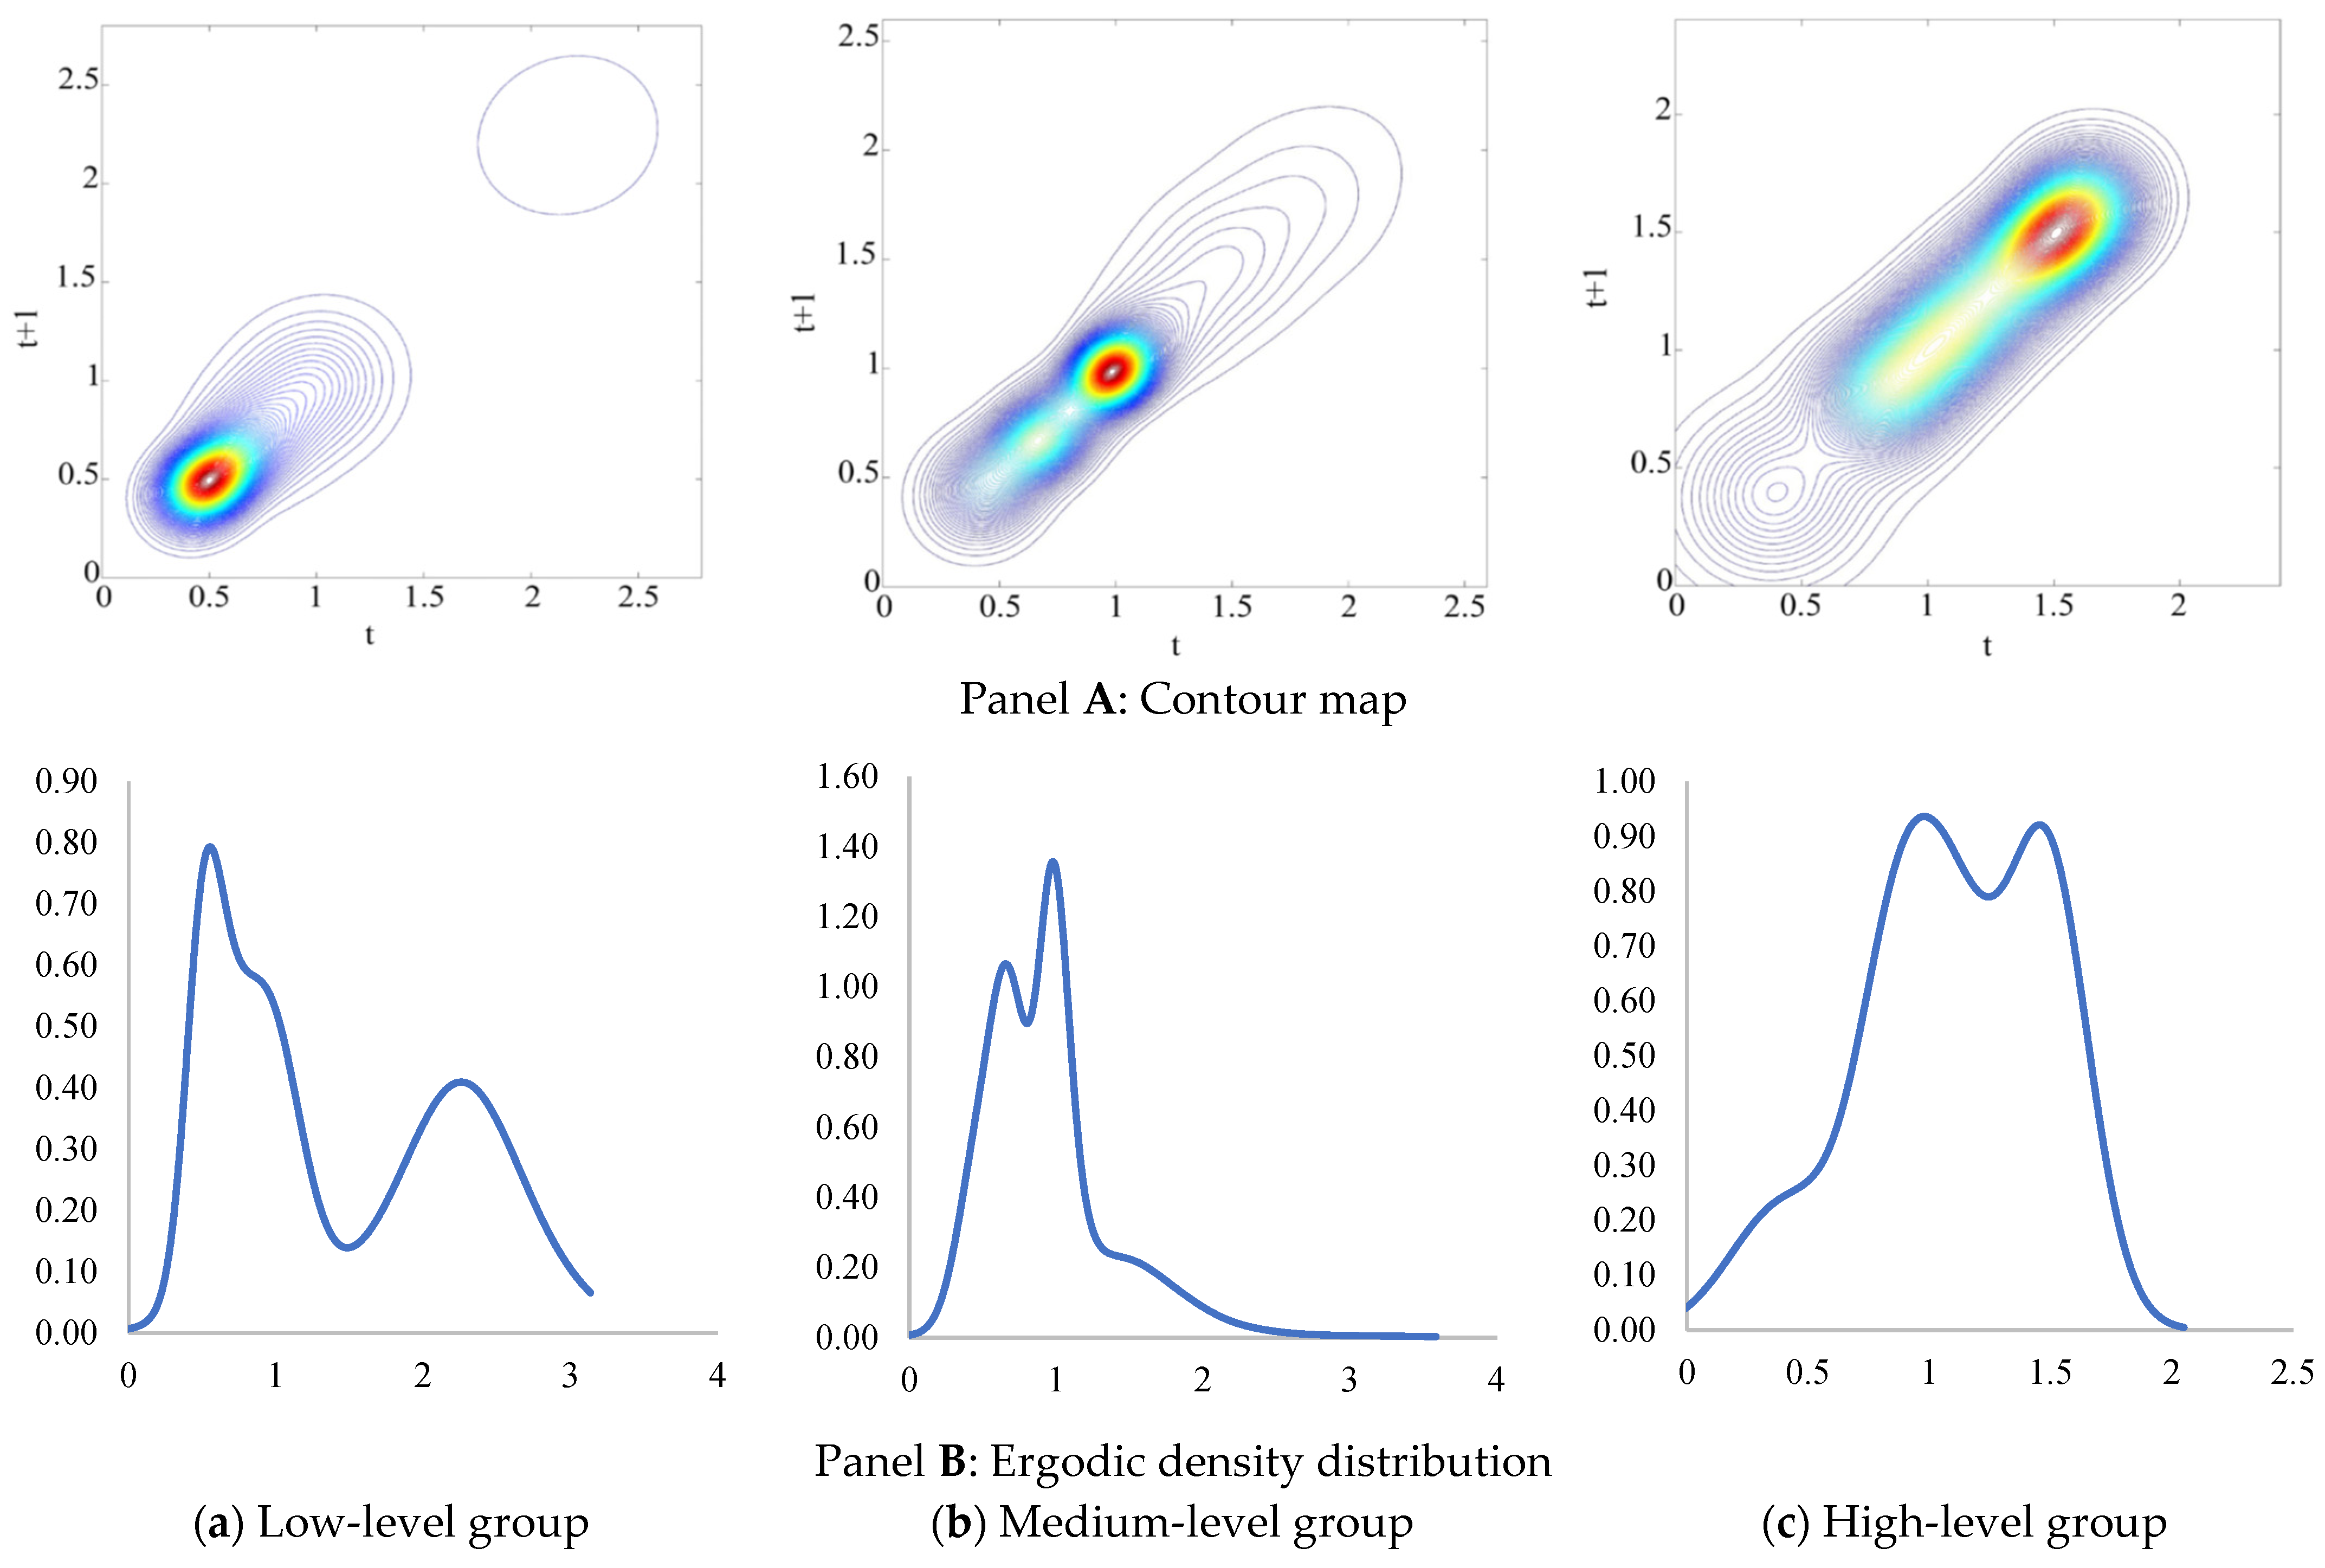
We have identified several interesting findings. First, in Panel A of Figure 6, the contours of the annual transitional probability of RICII are relatively concentrated around the 45-degree line across all groups. However, the probability mass is more dispersed in the groups with the lowest and highest labor income shares compared to the medium-share group, indicating higher mobility in intangible asset investment. All three contour maps show a single peak, and countries with higher labor income shares exhibit relatively high relative intangible asset investment density. However, a closer examination of the MPP plot reveals that for the group with the lowest labor income share, positive net probabilities of moving upward persist even within the relatively high RICII range of approximately [1.5, 2.3] (Figure 7). In contrast, this pattern does not hold for the medium- and high-income-share groups.
The conclusions from the MPP plot are highly consistent with the ergodic density distribution shown in Panel B of Figure 6. It can be observed that in countries with a low labor income share, RICII exhibits club convergence, with some countries ultimately converging to levels above the group average. Similarly, countries with a high labor income share show a comparable trend, whereas only those with a medium labor income share tend to converge around the group average.
This finding, therefore, suggests a more complex relationship between intangible capital development and income composition. In the CHS series of studies, it is demonstrated that capitalizing and incorporating intangibles into the growth accounting framework tends to reduce the labor income share and increase the income share of capital deepening. In contrast, our results do not fully corroborate this conclusion. On the one hand, intangible capital relies on knowledge and innovation. From this perspective, the development of intangible capital may be positively correlated with labor factor returns. This explains why countries with the highest labor income shares may still converge toward higher RICII in the steady state. On the other hand, intangible capital reshapes the trajectory of economic innovation and may exert a substitution effect on human capital. This accounts for why countries with the lowest labor income shares could also converge toward higher investment density in the long run.

5.2.3. Conditional on the External-Demand Dependence

The grouping based on external-demand dependence reveals a clear taxonomy of economic structures. The low-dependence tier comprises large, domestically oriented advanced economies (e.g., the United States and Japan), whose vast internal markets diminish the relative weight of exports. The average shares of exports in GDP range between 11% and 37%. The medium- and high-dependence tiers consist of export-reliant economies, which include both competitive industrial powers (e.g., Germany) and highly integrated trade hubs or value-chain specialists (e.g., Belgium, Ireland, and Slovakia), whose economic structures necessitate a high degree of engagement with external demand; the average shares of export in GDP fall within 37–59% and 59–156%, respectively.
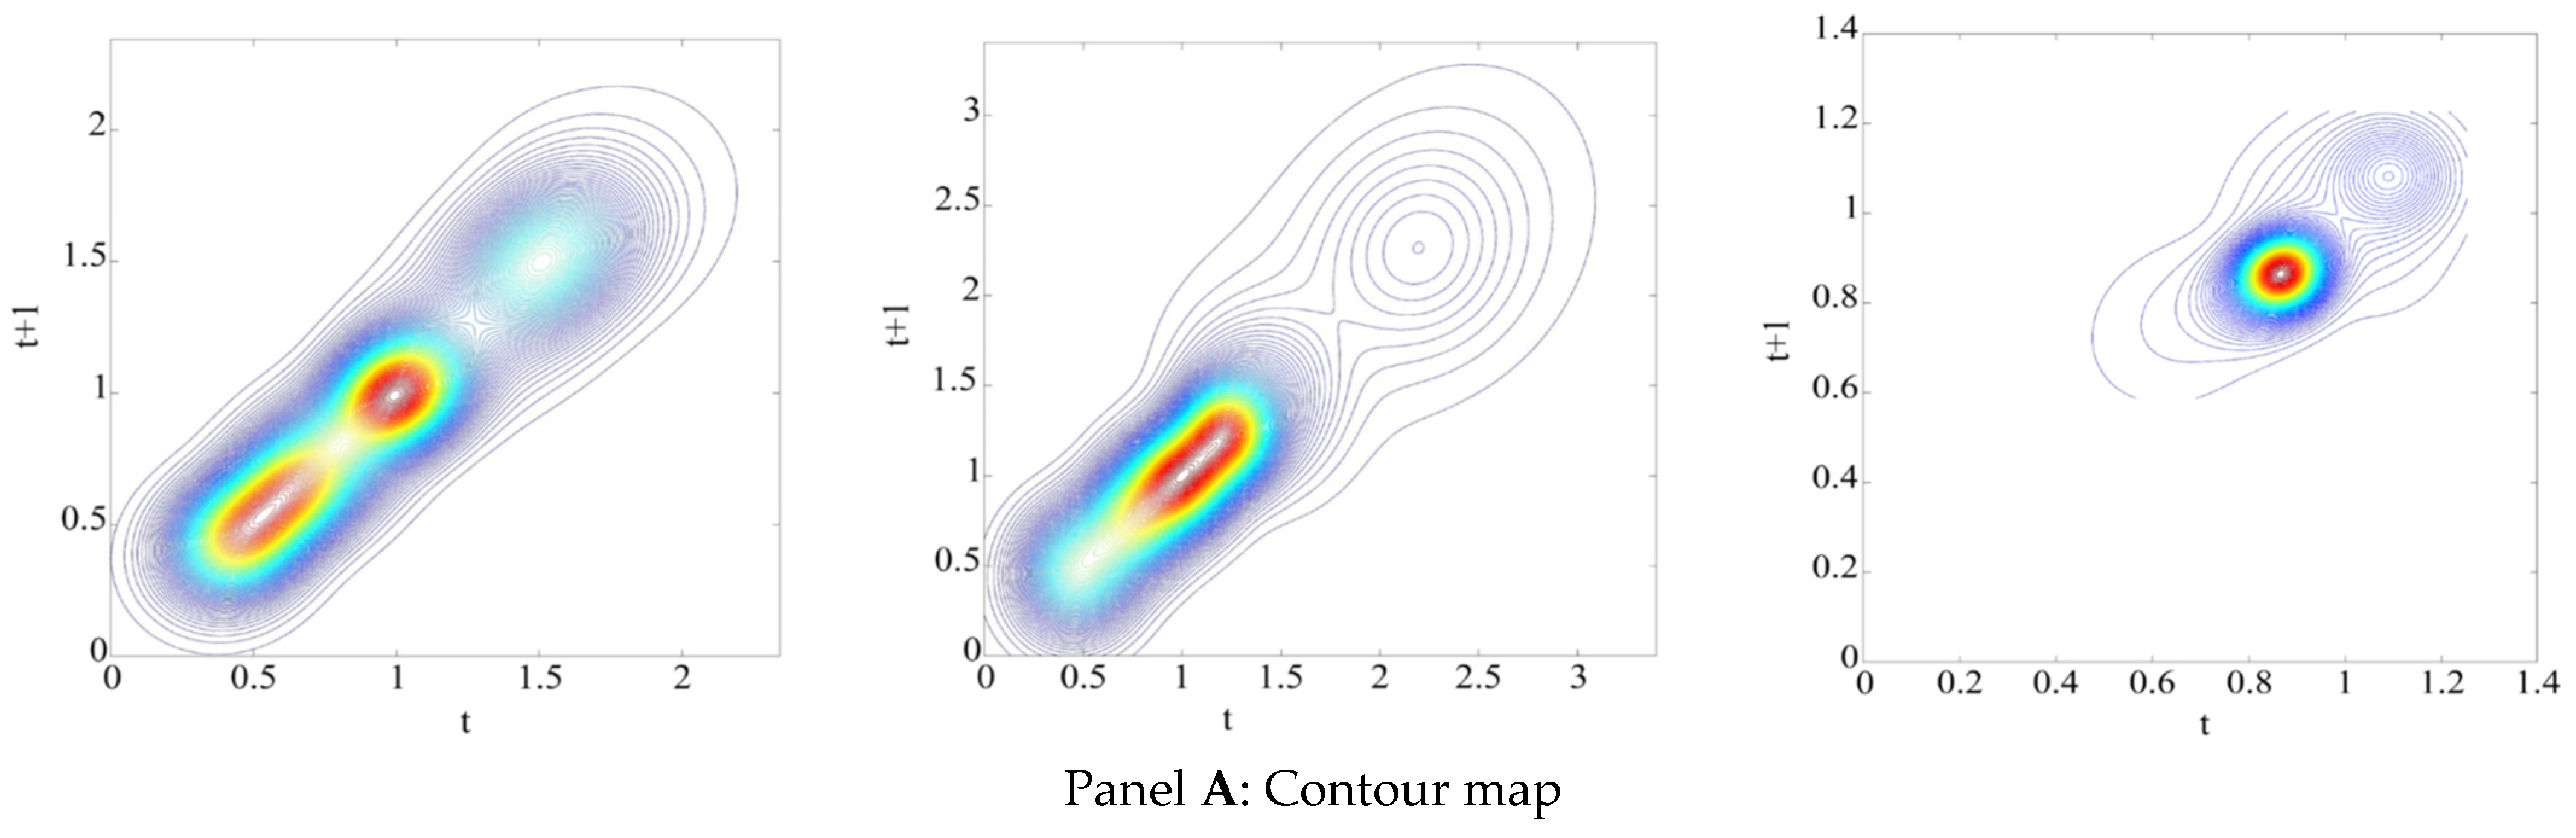
The contour maps and MPP plots conditional on external-demand dependence are presented in Figure 8. Panel A reveals a nonlinear, inverted-U-shaped relationship between a nation’s reliance on external demand and its intangible capital intensity. In the low-dependence group, the distribution is bimodal with peaks near 0.5 and 1.0. As dependence increases to a medium level, the dominant peak shifts rightward to the range of [1.0, 1.3], suggesting that a moderate degree of external engagement is conducive to intangible capital development. However, in the high-dependence group, the peak falls back to around 0.8, with most countries exhibiting below-average RICII. This indicates that an excessive structural reliance on external demand may ultimately hinder the accumulation of intangible capital.
These patterns are corroborated by the MPP plot in Figure 9. For countries with low and medium external-demand dependence, the net upward mobility probability remains persistently positive across RICII ranges of approximately [1.3, 1.5] and [1.8, 2.3], respectively. In stark contrast, for the high-dependence group, the probability of downward mobility converges to 100% once the RICII surpasses the group mean. This reinforces the conclusion that an excessively high reliance on external demand is inimical to the further accumulation of intangible capital at the national level.
The conclusions drawn from both the transitional probability density function and the MPP plot are ultimately reflected in the ergodic distribution as well. In Panel B in Figure 8, for groups with low to medium reliance on external demand, the ergodic distribution exhibits a typical multimodal pattern, with some countries eventually converging to a relatively high level of intangible asset development—above the group average. In contrast, for the high-dependence group, a unimodal pattern is more pronounced, and its peak is distinctly below 1, indicating that most countries in this group will ultimately fall below the group average in the long run.
Our macro-level finding—that an excessive reliance on external demand may hinder intangible capital development—resonates with micro-level evidence on firm behavior in competitive global markets. For instance, Yang et al. show that excessively intense (often global) competition can suppress corporate innovation and knowledge accumulation, thereby impeding firm-level intangible capital investment [56]. This aligns with our observation that economies with the highest external-demand dependence—often small, deeply integrated trade hubs or value-chain specialists—converge to lower steady-state levels of intangible capital. Their structural position, which necessitates constant responsiveness to volatile global demand, may pressure firms to prioritize short-run operational efficiency over long-term, strategic intangible capital investments.
Conversely, a moderate degree of integration into external demand—characteristic of our medium-dependence group—appears more conducive. It provides sufficient market scale and competitive pressure to stimulate innovation, while retaining enough domestic economic space and stability to support sustained investment in intangibles. Therefore, our results suggest that sustainable development policies should aim not for maximal export dependence or deep trade integration, per se, but for a balanced economic structure that combines external competitiveness with resilient domestic capabilities. This could be supported by policies that phase in trade liberalization, safeguard strategic innovation ecosystems during integration, and foster domestic demand—ensuring that engagement with global markets complements rather than crowds out the long-term accumulation of intangible capital.

6. Conclusions and Discussion

Since intangible capital markedly contributes to economic, environmental, and social sustainability, a comprehensive understanding of intangible capital development is crucial for achieving sustainability. This paper employs a nonparametric dynamic distribution approach, utilizing the EU KLEMs productivity database and the harmonized INTAN-Invest intangible capital database, to analyze both the short-run transitional patterns and the long-term trends of intangible capital investment across 30 developed economies. Furthermore, the study characterizes national economic structural dimensions—including industrial structure, income structure, and external-demand dependence—and examines their relationship with the development of intangible capital.
The findings of our study confirm that intangible capital investment exhibits persistence in developed economies, with countries demonstrating rapid intangible development in the current period continuing to show robust growth in the subsequent period. A promising finding is that intangible capital among developed economies displays a long-term convergence trend, suggesting that they do not appear to widen economic disparities in the intangible era among advanced economies.
However, structural factors play a crucial role in shaping intangible capital development. First, industrial structure upgrading significantly enhances the relative level of intangible capital development. The growth of modern service industries helps elevate intangible capital to higher relative levels, thereby supporting sustainable development at the national level. Second, the relationship between national income structure and intangible capital development is more complex. We find no conclusive evidence that intangible capital development consistently increases or decreases labor income share. Finally, excessive reliance on external demand may impede the accumulation of intangible capital. Instead, a balanced economic structure that integrates external competitiveness with resilient domestic capabilities appears most conducive to fostering the prosperity of intangible capital.
Our study also outlines several directions for future research. First, while intangible capital shows signs of convergence and does not appear to widen developmental disparities among developed economies, this conclusion may not extend to the global economy. There is an urgent need to examine the dynamics of intangible capital development in developing and emerging economies, to analyze its impact on their own sustainable development, and to investigate whether intangible capital may further widen the gap between these economies and advanced nations. Second, using a nonparametric approach, we demonstrate that the development of intangible capital does not necessarily reduce the labor income share. In fact, economies with both low and high labor income shares may converge toward relatively high levels of intangible capital development. This suggests that the relationship between intangible capital and labor markets may be more complex than previously thought, warranting further investigation with larger and more diverse samples. Finally, our findings confirm that excessive reliance on external markets can hinder intangible capital development. This naturally raises the question of what level of external-demand dependence is most conducive to fostering intangible capital and, more broadly, what constitutes an optimal economic structure that balances global integration with domestic innovative capacity. Determining this equilibrium remains a critical avenue for future research, potentially requiring context-specific analysis across different national settings.

Author Contributions

Conceptualization, Q.L.; methodology, T.S.C.; software, T.S.C.; validation, Q.L., S.L., and T.S.C.; formal analysis, T.S.C.; investigation, Q.L.; resources, Q.L.; data curation, Q.L.; writing—original draft preparation, S.L. and Q.L.; writing—review and editing, Q.L.; visualization, T.S.C.; supervision, Q.L. and S.L.; project administration, T.S.C. and S.L.; funding acquisition, Q.L. All authors have read and agreed to the published version of the manuscript.

Funding

This research was funded by the National Natural Science Foundation of China (72303145) and the Ministry of Human Resources and Social Security (H20250500).

Institutional Review Board Statement

Not applicable.

Informed Consent Statement

Not applicable.

Data Availability Statement

The EU KLEMS database can be found at https://economy-finance.ec.europa.eu/economic-research-and-databases/economic-databases/eu-klems-capital-labour-energy-materials-and-service_en (accessed on 28 May 2025); the INTAN-Invest database can be found at www.intaninvest.net (accessed on 13 April 2023).

Conflicts of Interest

The authors declare no conflicts of interest.

Abbreviations

The following abbreviations are used in this manuscript:
CHSIntangible capital framework proposed by Corrado, Hulten, and Sichel
RICIIRelative intangible capital investment intensity
RBCReal business cycle
BEABureau of Economic Analysis
IPPIntellectual property products

References

  1. World Commission on Environment and Development. Our Common Future; Oxford University Press: Oxford, UK, 1987. [Google Scholar]
  2. Basu, S.; Fernald, J. Information and communications technology as a general-purpose technology: Evidence from US industry data. Ger. Econ. Rev. 2007, 8, 146–173. [Google Scholar] [CrossRef]
  3. Corrado, C.; Haskel, J.; Jona-Lasinio, C. Knowledge spillovers, ICT and productivity growth. Oxf. Bull. Econ. Stat. 2017, 79, 592–618. [Google Scholar] [CrossRef]
  4. Hasan, M.M.; Cheung, A. Organization capital and firm life cycle. J. Corp. Financ. 2018, 48, 556–578. [Google Scholar] [CrossRef]
  5. Lev, B.; Radhakrishnan, S.; Zhang, W. Organization capital. Abacus 2009, 45, 275–298. [Google Scholar] [CrossRef]
  6. Muhammad, H.; Irfan, A.; Muhammad, K.; Latif, I.; Komal, B.; Chen, S. Understanding the dynamics of natural resources rents, environmental sustainability, and sustainable economic growth: New insights from China. Environ. Sci. Pollut. Res. 2022, 29, 58746–58761. [Google Scholar] [CrossRef] [PubMed]
  7. Xu, Q.; Zhong, M. Shared prosperity, energy-saving, and emission-reduction: Can ICT capital achieve a ‘ win-win-win ’ situation ? J. Environ. Manag. 2022, 319, 115710. [Google Scholar] [CrossRef] [PubMed]
  8. Omar, I.A.; Hasan, H.R.; Jayaraman, R.; Salah, K.; Omar, M. Using blockchain technology to achieve sustainability in the hospitality industry by reducing food waste. Comput. Ind. Eng. 2024, 197, 110586. [Google Scholar] [CrossRef]
  9. Acemoglu, B.D.; Aghion, P.; Bursztyn, L.; Hemous, D. The environment and directed technical change. Amer. Econ. Rev. 2012, 102, 131–166. [Google Scholar] [CrossRef] [PubMed]
  10. Khezri, M.; Heshmati, A.; Khodaei, M. The role of R&D in the effectiveness of renewable energy determinants: A spatial econometric analysis. Energy Econ. 2021, 99, 105287. [Google Scholar] [CrossRef]
  11. Lythreatis, S.; Singh, S.K.; El-Kassar, A.N. The digital divide: A review and future research agenda. Technol. Forecast. Soc. Chang. 2021, 175, 121359. [Google Scholar] [CrossRef]
  12. Harpur, P.; Blanck, P. Gig Workers with disabilities: Opportunities, challenges, and regulatory response. J. Occup. Rehabil. 2020, 30, 511–520. [Google Scholar] [CrossRef]
  13. Dunleavy, P.; Margetts, H.; Bastow, S.; Tinkler, J. Digital era Governance: IT Corporations, the State, and e-Government; Oxford University Press: Oxford, UK, 2006. [Google Scholar] [CrossRef]
  14. Haug, N.; Dan, S.; Mergel, I. Digitally-induced change in the public sector: A systematic review and research agenda. Public Manag. Rev. 2024, 26, 1963–1987. [Google Scholar] [CrossRef]
  15. Li, L. Reskilling and Upskilling the future-ready workforce for industry 4.0 and beyond. Inf. Syst. Front. 2024, 26, 1697–1712. [Google Scholar] [CrossRef]
  16. Sanchez, C.R.; Dıaz-Cabrera, D.; Hernandez-Fernaud, E. Does effectiveness in performance appraisal improve with rater training? PLoS ONE 2019, 14, e0222694. [Google Scholar]
  17. Corrado, C.; Hulten, C.; Sichel, D. Measuring capital and technology: An expanded framework. In Measuring Capital in the New Economy; Carrodo, C.A., Haltiwanger, J., Sichel, D.E., Eds.; University Chicago Press: Chicago, IL, USA, 2005; pp. 11–46. [Google Scholar]
  18. Corrado, C.; Hulten, C.; Sichel, D. Intangible Capital and Economic Growth. NBER Working Paper 11948. 2006. Available online: https://www.nber.org/papers/w11948 (accessed on 29 October 2016).
  19. Edquist, H. Can investment in intangibles explain the Swedish productivity boom in the 1990s? Rev. Income Wealth 2011, 57, 658–682. [Google Scholar] [CrossRef]
  20. Baldwin, J.R.; Gu, W.; MacDonald, R. Intangible capital and productivity growth in Canada. Can. Product. Rev. 2012, 29, 6–41. [Google Scholar] [CrossRef]
  21. Corrado, C.; Haskel, J.; Jona-Lasinio, C.; Iommi, M. Intangible investment in the EU and US before and since the Great Recession and its contribution to productivity growth. J. Infrastruct. Policy Dev. 2018, 2, 11–36. [Google Scholar] [CrossRef]
  22. Hulten, C.; Hao, J.X. The Role of Intangible Capital in the Transformation and Growth of the Chinese Economy. NBER Working Paper 18405. 2012. Available online: http://papers.nber.org/papers/w18405 (accessed on 19 May 2018).
  23. Li, Q.; Wu, Y. Intangible capital in Chinese regional economies: Measurement and analysis. China Econ. Rev. 2018, 51, 323–341. [Google Scholar] [CrossRef]
  24. Dutz, M.; Kannebley, S.; Scarpelli, M.; Sharma, S. Measuring Intangible Assets in an Emerging Market Economy: An application to Brazil. World Bank Policy Research Working Paper WPS6142. 2012. Available online: https://papers.ssrn.com/sol3/papers.cfm?abstract_id=2116140 (accessed on 20 July 2019).
  25. Chen, W. Cross-country income differences revisited: Accounting for the role of intangible capital. Rev. Income Wealth 2018, 64, 626–648. [Google Scholar] [CrossRef]
  26. Niebel, T.; O’Mahony, M.; Saam, M. The contribution of intangible assets to sectoral productivity growth in the EU. Rev. Income Wealth 2017, 63, S49–S67. [Google Scholar] [CrossRef]
  27. Chun, H.; Nadiri, M.I. Intangible investment and changing sources of growth in Korea. Jpn. Econ. Rev. 2016, 67, 50–76. [Google Scholar] [CrossRef]
  28. Crass, D.; Licht, G.; Peters, B. Intangible assets and investments at the sector level: Empirical evidence for Germany. In Intangibles, Market Failure and Innovation Performance; Bounfour, A., Miyagawa, T., Eds.; Springer International Publishing: Cham, Switzerland, 2015; pp. 57–111. [Google Scholar] [CrossRef]
  29. Arrighetti, A.; Landini, F.; Lasagni, A. Intangible assets and firm heterogeneity: Evidence from Italy. Res. Policy 2014, 43, 202–213. [Google Scholar] [CrossRef]
  30. Chappell, N.; Jaffe, A. Intangible investment and firm performance. Rev. Ind. Organ. 2018, 52, 509–559. [Google Scholar] [CrossRef]
  31. Nakamura, L. Intangibles: What Put the New in the New Economy? Federal Reserve Bank Philadelphia Bus. Rev. 1999. Available online: https://www.philadelphiafed.org/the-economy/macroeconomics/intangibles-what-put-the-new-in-the-new-economy (accessed on 8 July 2025).
  32. Nakamura, L. What Is the U.S. Gross Investment in Intangibles? (At Least) One Trillion Dollars a Year! Economic Research Division, Federal Reserve Bank of Philadelphia Working Paper. 2001. Available online: https://ideas.repec.org/p/fip/fedpwp/01-15.html (accessed on 18 May 2019).
  33. Corrado, C.; Hulten, C. How Do You Measure a ‘Technological Revolution’? Am. Econ. Rev. 2010, 100, 99–104. [Google Scholar] [CrossRef]
  34. Corrado, C.; Hulten, C.; Sichel, D. Intangible capital and U.S. economic growth. Rev. Income Wealth 2009, 55, 661–685. [Google Scholar] [CrossRef]
  35. Goodridge, P.; Haskel, J.; Wallis, G. Can intangible investment explain the UK productivity puzzle? Natl. Inst. Econ. Rev. 2013, 224, R48–R58. [Google Scholar] [CrossRef]
  36. Fukao, K.; Hamagata, S.; Miyagawa, T.; Tonogi, K. Intangible investment in Japan: Measurement and contribution to economic growth. Rev. Income Wealth 2009, 55, 717–736. [Google Scholar] [CrossRef]
  37. Roth, F. Revisiting intangible capital and labour productivity growth, 2000–2015: Accounting for the crisis and economic recovery in the EU. J. Intellect. Cap. 2020, 21, 671–690. [Google Scholar] [CrossRef]
  38. Barnes, P. Investments in Intangible Assets and Australia’s Productivity Growth: Sectoral Estimates. Productivity Commission Staff Working Paper. 2010. Available online: https://papers.ssrn.com/sol3/papers.cfm?abstract_id=1802854 (accessed on 4 April 2013).
  39. van Rooijen-Horsten, M.; van den Bergen, D.; Tanriseven, M. Intangible capital in the Netherlands: A Benchmark. Statistics Netherlands Discussion Paper 08001. 2008. Available online: https://www.cbs.nl/nl-nl/achtergrond/2008/05/intangible-capital-in-the-netherlands-a-benchmark (accessed on 19 September 2013).
  40. Jalava, L.; Aulin-Ahmavaara, P.; Alanen, A. Intangible Capital in the Finnish Business Sector, 1975–2005. ETLA Disccusion Papers No. 1103. 2007. Available online: https://www.econstor.eu/handle/10419/63632 (accessed on 6 May 2010).
  41. van Ark, B.; Hao, J.X.; Corrado, C.; Hulten, C. Measuring intangible capital and its contribution to economic growth in Europe. EIB Pap. 2009, 14, 170–195. [Google Scholar]
  42. Roth, F.; Thum, A.E. Intangible capital and labor productivity growth: Panel evidence for the EU from 1998–2005. Rev. Income Wealth 2013, 59, 486–508. [Google Scholar] [CrossRef]
  43. Miyagawa, T.; Hisa, S. Estimates of intangible investment by industry and productivity growth in Japan. Jpn. Econ. Rev. 2013, 64, 42–72. [Google Scholar] [CrossRef]
  44. Borgo, M.D.; Goodridge, P.; Haskel, J.; Pesole, A. Productivity and growth in UK industries: An intangible investment approach. Oxf. Bull. Econ. Stat. 2013, 75, 806–834. [Google Scholar] [CrossRef]
  45. Arntz, M.; Gregory, T.; Zierahn, U. Revisiting the risk of automation. Econ. Lett. 2017, 159, 157–160. [Google Scholar] [CrossRef]
  46. Frey, C.B.; Osborne, M.A. The future of employment: How susceptible are jobs to computerisation? Technol. Forecast. Soc. Change 2017, 114, 254–280. [Google Scholar] [CrossRef]
  47. Mitra, S. Intangible capital and the rise in wage and hours volatility. J. Econ. Dyn. Control. 2019, 100, 70–85. [Google Scholar] [CrossRef]
  48. Koh, D.; Santaeulàlia-Llopis, R.; Zheng, Y. Labor Share Decline and Intellectual Property Products Capital. Econometrica 2020, 88, 2609–2628. [Google Scholar] [CrossRef]
  49. O’Mahony, M.; Vecchi, M.; Venturini, F. Capital Heterogeneity and the Decline of the Labour Share. Economica 2021, 88, 271–296. [Google Scholar] [CrossRef]
  50. Garcia-Lazaro, A.; Pearce, N. Intangible capital, the labour share and national ‘growth regimes’. J. Comp. Econ. 2023, 51, 674–695. [Google Scholar] [CrossRef]
  51. Ramezan, M. Intellectual capital and organizational organic structure in knowledge society: How are these concepts related? Int. J. Inf. Manag. 2011, 31, 88–95. [Google Scholar] [CrossRef]
  52. Kramer, J.P.; Marinelli, E.; Iammarino, S.; Diez, J.R. Intangible assets as drivers of innovation: Empirical evidence on multinational enterprises in German and UK regional systems of innovation. Technovation 2011, 31, 447–458. [Google Scholar] [CrossRef]
  53. González-Loureiro, M.; Pita-Castelo, J. A model for assessing the contribution of innovative SMEs to economic growth: The intangible approach. Econ. Lett. 2012, 116, 312–315. [Google Scholar] [CrossRef]
  54. Falvey, R.; Foster, N.; Greenaway, D. North-South trade, knowledge spillovers and growth. J. Econ. Integr. 2002, 17, 650–670. [Google Scholar] [CrossRef]
  55. Keller, W. Knowledge spillovers, trade, and FDI. NBER Work. Pap. Ser. 2021. Available online: http://www.nber.org/papers/w28739 (accessed on 25 January 2023).
  56. Yang, S.; Zhou, Z.; Song, L. Determinants of intangible investment and its impacts on firms’ productivity: Evidence from Chinese private manufacturing firms. China World Econ. 2018, 26, 1–26. [Google Scholar] [CrossRef]
  57. Silverman, B.W. Density Estimation for Statistics and Data Analysis; Routledge: New York, NY, USA, 1986. [Google Scholar] [CrossRef]
  58. Van Kerm, P. Adaptive kernel density estimation. Stata J. 2003, 3, 148–156. [Google Scholar] [CrossRef]
  59. Islam, N. What have we learnt from the convergence debate? J. Econ. Surv. 2003, 17, 309–362. [Google Scholar] [CrossRef]
  60. Dhongde, S.; Silber, J. On distributional change, pro-poor growth and convergence. J. Econ. Inequal. 2016, 14, 249–267. [Google Scholar] [CrossRef]
  61. Gries, T.; Redlin, M. China’s provincial disparities and the determinants of provincial inequality. J. Chin. Econ. Bus. Stud. 2009, 2, 259–281. [Google Scholar] [CrossRef]
  62. Lau, C. New Evidence about regional income divergence in China. China Econ. Rev. 2010, 21, 293–309. [Google Scholar] [CrossRef]
  63. Pedroni, P.; Yao, J.Y. Regional income divergence in China. J. Asian Econ. 2006, 17, 294–315. [Google Scholar] [CrossRef]
  64. Johnson, P.; Papageorgiou, C. What remains of cross-country convergence. J. Econ. Liter. 2020, 58, 129–175. [Google Scholar] [CrossRef]
  65. Quah, D. Aggregate and regional disaggregate fluctuations. Empir. Econ. 1996, 21, 137–159. [Google Scholar] [CrossRef]
  66. Quah, D. Twin peaks: Growth and convergence in models of distribution dynamics. Econ. J. 1996, 106, 1045–1055. [Google Scholar] [CrossRef]
  67. Quah, D. Empirics for growth and distribution: Stratification, polarization, and convergence clubs. J. Econ. Growth 1997, 2, 27–59. [Google Scholar] [CrossRef]
  68. Quah, D. Empirical cross-section dynamics in economic growth. Eur. Econ. Rev. 1993, 37, 426–434. [Google Scholar] [CrossRef]
  69. Cheong, T.S.; Wu, Y. Convergence and transitional dynamics of China’s industrial output: A county-level study using a new framework of distribution dynamics analysis. China Econ. Rev. 2018, 48, 125–138. [Google Scholar] [CrossRef]
  70. Cheong, T.S.; Wu, Y. The impacts of structural transformation and industrial upgrading on regional inequality in China. China Econ. Rev. 2014, 31, 339–350. [Google Scholar] [CrossRef]
  71. Quah, D. Searching for prosperity a comment. Carnegie-Rochester Conf. Ser. Public Policy 2001, 55, 305–319. [Google Scholar] [CrossRef]
  72. Wu, J.; Wu, Y.; Cheong, T.S.; Yu, Y. Distribution dynamics of energy intensity in Chinese cities. Appl. Energy 2018, 211, 875–889. [Google Scholar] [CrossRef]
Figure 1. The scope of intangible capital in the CHS framework. Source: CHS framework [17,18].
Sustainability 18 00545 g001
Figure 2. Distribution of RICII in 1998, 2009, and 2015. Source: Authors’ own work.
Sustainability 18 00545 g002
Figure 3. Unconditional distribution dynamics for the whole sample over 1998–2015. Source: Authors’ own work.
Sustainability 18 00545 g003
Figure 4. Distribution dynamics of intangible capital conditional on industrial structure. Source: Authors’ own work.
Sustainability 18 00545 g004
Figure 5. MPP plot conditional on the industrial structure. Note: Low-level group (blue line), medium-level group (orange line), high-level group (gray line). Source: Authors’ own work.
Sustainability 18 00545 g005
Figure 6. Distribution dynamics of intangible capital conditional on income structure. Source: Authors’ own work.
Sustainability 18 00545 g006
Figure 7. MPP conditional on the income structure. Note: Low-level group (blue line), medium-level group (orange line), high-level group (gray line). Source: Authors’ own work.
Sustainability 18 00545 g007
Figure 8. Distribution dynamics of intangible capital conditional on external-demand dependence. Source: Authors’ own work.
Sustainability 18 00545 g008aSustainability 18 00545 g008b
Figure 9. MPP conditional on the external-demand dependence. Note: Low-level group (blue line), medium-level group (orange line), high-level group (gray line). Source: Authors’ own work.
Sustainability 18 00545 g009
Disclaimer/Publisher’s Note: The statements, opinions and data contained in all publications are solely those of the individual author(s) and contributor(s) and not of MDPI and/or the editor(s). MDPI and/or the editor(s) disclaim responsibility for any injury to people or property resulting from any ideas, methods, instructions or products referred to in the content.