Article

Does Customer Concentration Matter in Exploratory Innovation? The Moderating Effect of Board Interlocks and CEO Research Background


1
School of Economics and Management, Beijing University of Chemical Technology, Beijing 100044, China
2
School of Economics and Management, Beihang University, Beijing 100091, China
3
School of Business Administration, Chongqing Technology and Business University, Chongqing 400067, China
*
Author to whom correspondence should be addressed.
Sustainability 2026, 18(1), 203; https://doi.org/10.3390/su18010203
Submission received: 14 November 2025 / Revised: 21 December 2025 / Accepted: 22 December 2025 / Published: 24 December 2025
(This article belongs to the Section Sustainable Management)

Abstract

Both managers and researchers closely examine the factors that motivate firms to explore new domains and acquire new knowledge in pursuit of greater innovation. Considering the role of demand-side factors in innovation, in this study, we investigate how customer concentration influences exploratory innovation based on Chinese listed firms from 2009 to 2019. As the characteristics of the top management team (TMT) may affect the influential mechanism, we further investigated the moderating effects of board interlocks and the CEO’s research background. Our results demonstrate that with the increase in customer concentration, the exploratory innovation level shows an inverted U-shaped trend. The board interlocks strengthen the positive effects of customer concentration on exploratory innovation, while a CEO’s research background mitigates the negative effects. Our findings offer key insights and serve as a benchmark for companies that aim to achieve innovation in their approach to managing customer relationships and organizing their top management teams.

1. Introduction

Innovation—broadly defined as the combination of new or significantly improved products, processes, or business models that create value—is key to success in today’s fast-paced and ever-changing business environment [1]. To maintain a competitive edge, companies must continuously explore new ideas and approaches [2]. To characterize the exploratory behavior of innovation divisions, and drawing on organizational learning research, scholars define exploratory innovation as searching for and experimenting with novel knowledge and opportunities that deviate from a firm’s existing knowledge base—often toward emerging technologies or markets—and that involve risk-taking and new methods [2,3,4]. In contrast, exploitative innovation focuses on refinement, efficiency, and incremental improvements that leverage existing capabilities to serve current customers [2,3,4]. Thus, exploratory innovation is a specific form of innovation that emphasizes distant search and novel recombination; in comparison, innovation, in general, encompasses both exploratory and exploitative activities [5].
Over the years, several research groups have examined the antecedents and consequences of organizations’ exploratory innovation [3,6,7]. However, most of this work has focused on the supply-side perspective, emphasizing technological capabilities, R&D inputs, and internal processes [8,9,10], in comparison, the demand side, particularly how heterogeneity in customer needs and user involvement shape exploratory search and innovation outcomes, has been comparatively overlooked [11].
Over past two decades, the development of internet technology and the decreasing exploration costs for end users have made customers the primary drivers of innovation, prompting more firms to recognize their value and form innovation partnerships with customers [12,13]. Firms adopt different strategies for customer-driven innovation, with some focusing on deep collaboration with a few customers, whereas others engage a broader customer base, resulting in varying levels of customer concentration [14,15,16,17,18,19]. Customer concentration impacts firms in various manners. While a few major customers can provide stable revenue and enhance stability [20], over-reliance on them increases risks posed by shifts in customer preferences and strengthens their bargaining power [21,22]. This uncertainty can pose challenges for firms, making it crucial for stakeholders to understand the implications of customer dependence [23].
As firms focus on technological innovation, the impact of customer concentration on exploratory innovation deserves greater attention. The level of customer concentration influences a firm’s incentive to invest in new, untested ventures [24], making it a key factor in exploratory innovation—a topic largely overlooked in supply-side-focused research [19]. High customer concentration is common across many industries; however, firms with such a concentration are more vulnerable to disruptive changes [25]. Evidence suggests that these firms tend to allocate more resources to customer-specific projects, deprioritizing technological innovation, which can hinder technological progress and erode industry leadership [19,26]. Consequently, firms with high customer concentration face challenges in resource allocation and attention management during exploratory innovation [27]. The findings of existing studies on the relationship between customer concentration and exploratory innovation is inconclusive, with some studies showing a negative impact [19,28], whereas others suggest a positive relationship [29]. This inconsistency underscores the need for further research to more effectively understand how customer concentration specifically influences exploratory innovation.
Additionally, the CEO and top management team (TMT) members play a crucial role in shaping a firm’s relationship with customers and influencing its research and development investments [30]. In today’s business environment, board interlocks—where individuals serve on the boards of multiple firms—are increasingly common, broadening the scope and objectives of the TMT [31,32]. When firms share directors, they may exchange customer information, fostering synergies in operations and resource coordination. Furthermore, a CEO’s experience in R&D can significantly impact a firm’s innovation capacity [33]. Given the CEO’s critical role in innovation, understanding how their research background influences the relationship between customer concentration and exploratory innovation is vital for firms seeking to enhance their innovation capabilities [34,35]. From the above findings, it can thus be concluded that the impact of CEO-related factors on the customer concentration–exploratory innovation relationship warrants further investigation.
To explain how customer concentration shapes firms’ exploratory innovation, we adopt resource dependence theory and organizational learning theory as the core lenses, complemented by upper echelons theory to specify boundary conditions. Building on resource dependence theory, we argue that control over critical external resources simultaneously constitutes power and constraint: when customer concentration rises, a firm’s dependence on a few buyers deepens, bargaining power shifts, and the firm reallocates resources while adopting dependence-management strategies such as bridging and buffering. Simultaneously, organizational learning theory distinguishes exploration from exploitation, linking exploratory innovation to problematic search, slack, and risk taking—processes that are highly sensitive to the allocation of managerial attention and shaped by path dependence. Integrating these perspectives provides a demand-side explanatory framework that reconciles prior mixed findings on the customer concentration–innovation relationship and achieves a coherent context–mechanism–outcome alignment: buyer dependence as the context, resource control and attention allocation as the mechanisms, and exploratory innovation as the outcome. This integration employs a parsimonious theoretical framework that captures the core causal chain, using an auxiliary lens only to specify boundary conditions and avoiding unnecessary complication. It also yields clear and actionable managerial implications—particularly in industries with high customer concentration—by informing dependence management and the design of learning processes. Thus, this theoretical integration enhances the study’s explanatory power and external validity while ensuring parsimony, rigor, and practical applicability [36].
Through empirical analyses, we clarify whether, when, and how customer concentration shapes exploratory innovation and its contribution to firms’ innovative outcomes. To better define the research objectives, in this study, grounded in resource dependence theory and organizational learning theory, we pose the following research questions:
  • RQ1: What is the effect of customer concentration on firms’ exploratory innovation?
  • RQ2: How do board interlocks moderate the relationship between customer concentration and exploratory innovation?
  • RQ3: How does the CEO’s research background moderate the relationship between customer concentration and exploratory innovation?
The structure of this paper is as follows: In Section 1, we provide an introduction to the main purpose of this study. In Section 2, we present the theoretical hypotheses of this study. In Section 3, we describe the data and empirical methodology. In Section 4, we report the regression analysis results. Lastly, in Section 5, we present the discussion and conclusion.

2. Hypothesis Development

2.1. Influence of Customer Concentration on Exploratory Innovation

To investigate the influence of customer concentration on exploratory innovation, it is essential to determine whether the benefits from operational convenience outweigh the drawbacks of increased customer bargaining power at different concentration levels.
Customers contribute to innovation by providing ideas, assisting with exploration, or integrating existing products [37]. These interactions create varying degrees of impact depending on the level of customer concentration. Based on resource dependence theory, organizations are interdependent and influenced by others [38]. Customer participation in innovation activities fosters this interdependence, with its effects changing as customer concentration varies.
When customer concentration is low, firms serve numerous arm’s-length customers, resulting in loose coupling and minimal long-term interaction [39]. These factors limit the potential for special agreements and reduce knowledge sharing, thereby constraining investments in technological advancement [16,40]. Conversely, higher customer concentration enables for more targeted strategies and resource organization, improving operational flexibility [41]. In addition, more concentrated customers can reduce demand uncertainty, stabilize supply chains, and enhance information sharing, enabling firms to allocate surplus resources more effectively [42,43], which can foster closer relationships, enabling firms to access external resources such as knowledge sharing and valuable feedback, thus promoting exploratory innovation [44,45].
However, resource dependence theory also warns against over-reliance on specific resources, as it can constrain organizational development [38]. Increased bargaining power of major customers can shift a firm’s focus toward meeting immediate demands rather than pursuing broad innovation efforts, leading to myopic behavior and a potential loss of long-term competitive advantage [19,46].
As customer concentration increases, its impact on exploratory innovation changes. Initially, a higher concentration enhances resource coordination and innovation efficiency [47]. Once the concentration reaches a monopolistic level, the negative effects of customer bargaining power become significant, reducing adaptability and inhibiting innovation [48]. Therefore, the relationship between customer concentration and exploratory innovation is proposed to be an inverted U-shape, whereby moderate concentration levels promote innovation but excessive concentration inhibits it.
Based on the above inference, we propose the following hypotheses:
Hypothesis 1.
The effect of customer concentration on exploratory innovation shows an inverted U-shaped relationship.

2.2. The Moderating Effect of Board Interlocks

We theorize that the relationship between customer concentration and exploratory innovation is moderated by board interlocks. Based on upper echelons theory, a leader’s personal characteristics, background, and experience influence their cognition and decision-making, thereby impacting organizational decisions and performance [30]. These attributes are embedded within the TMT, which is crucial for strategic decision-making and innovation performance [49,50,51]. Given that TMT background consistency affects firm performance [52,53], we explore how TMT board interlocks relate to the inverted U-shaped relationship proposed in Hypothesis 1.
Board interlocks, whereby firms share directors, enhance adaptability by promoting private information sharing and collaboration, thereby improving the firm’s perception and understanding of the innovation environment [54]. In scenarios of low customer concentration, firms with board interlocks can better leverage innovation resources through their unique social networks, substituting for the stability typically provided by major customers [55]. This enhances the firm’s ability to discover new opportunities and maintain exploratory innovation.
However, at high levels of customer concentration, the dynamics change. Faced with resource concentration, board interlocks may serve as a conduit for innovation resources. According to Upper Echelons theory, TMT members’ strategic choices are driven by their cognitive foundations [30]. Interlocks imply that executives are inclined to solve internal problems using external resources [38]. While effective at low customer concentration, this approach becomes problematic at high concentration levels. Major customers can transmit negative signals to interlocked firms, and if these firms are key links in the service chain, the focal firm may incur significant costs if major customers are lost. In such cases, interlocks may gain bargaining power by relying on major customers, exacerbating the negative effects of high customer concentration on exploratory innovation.
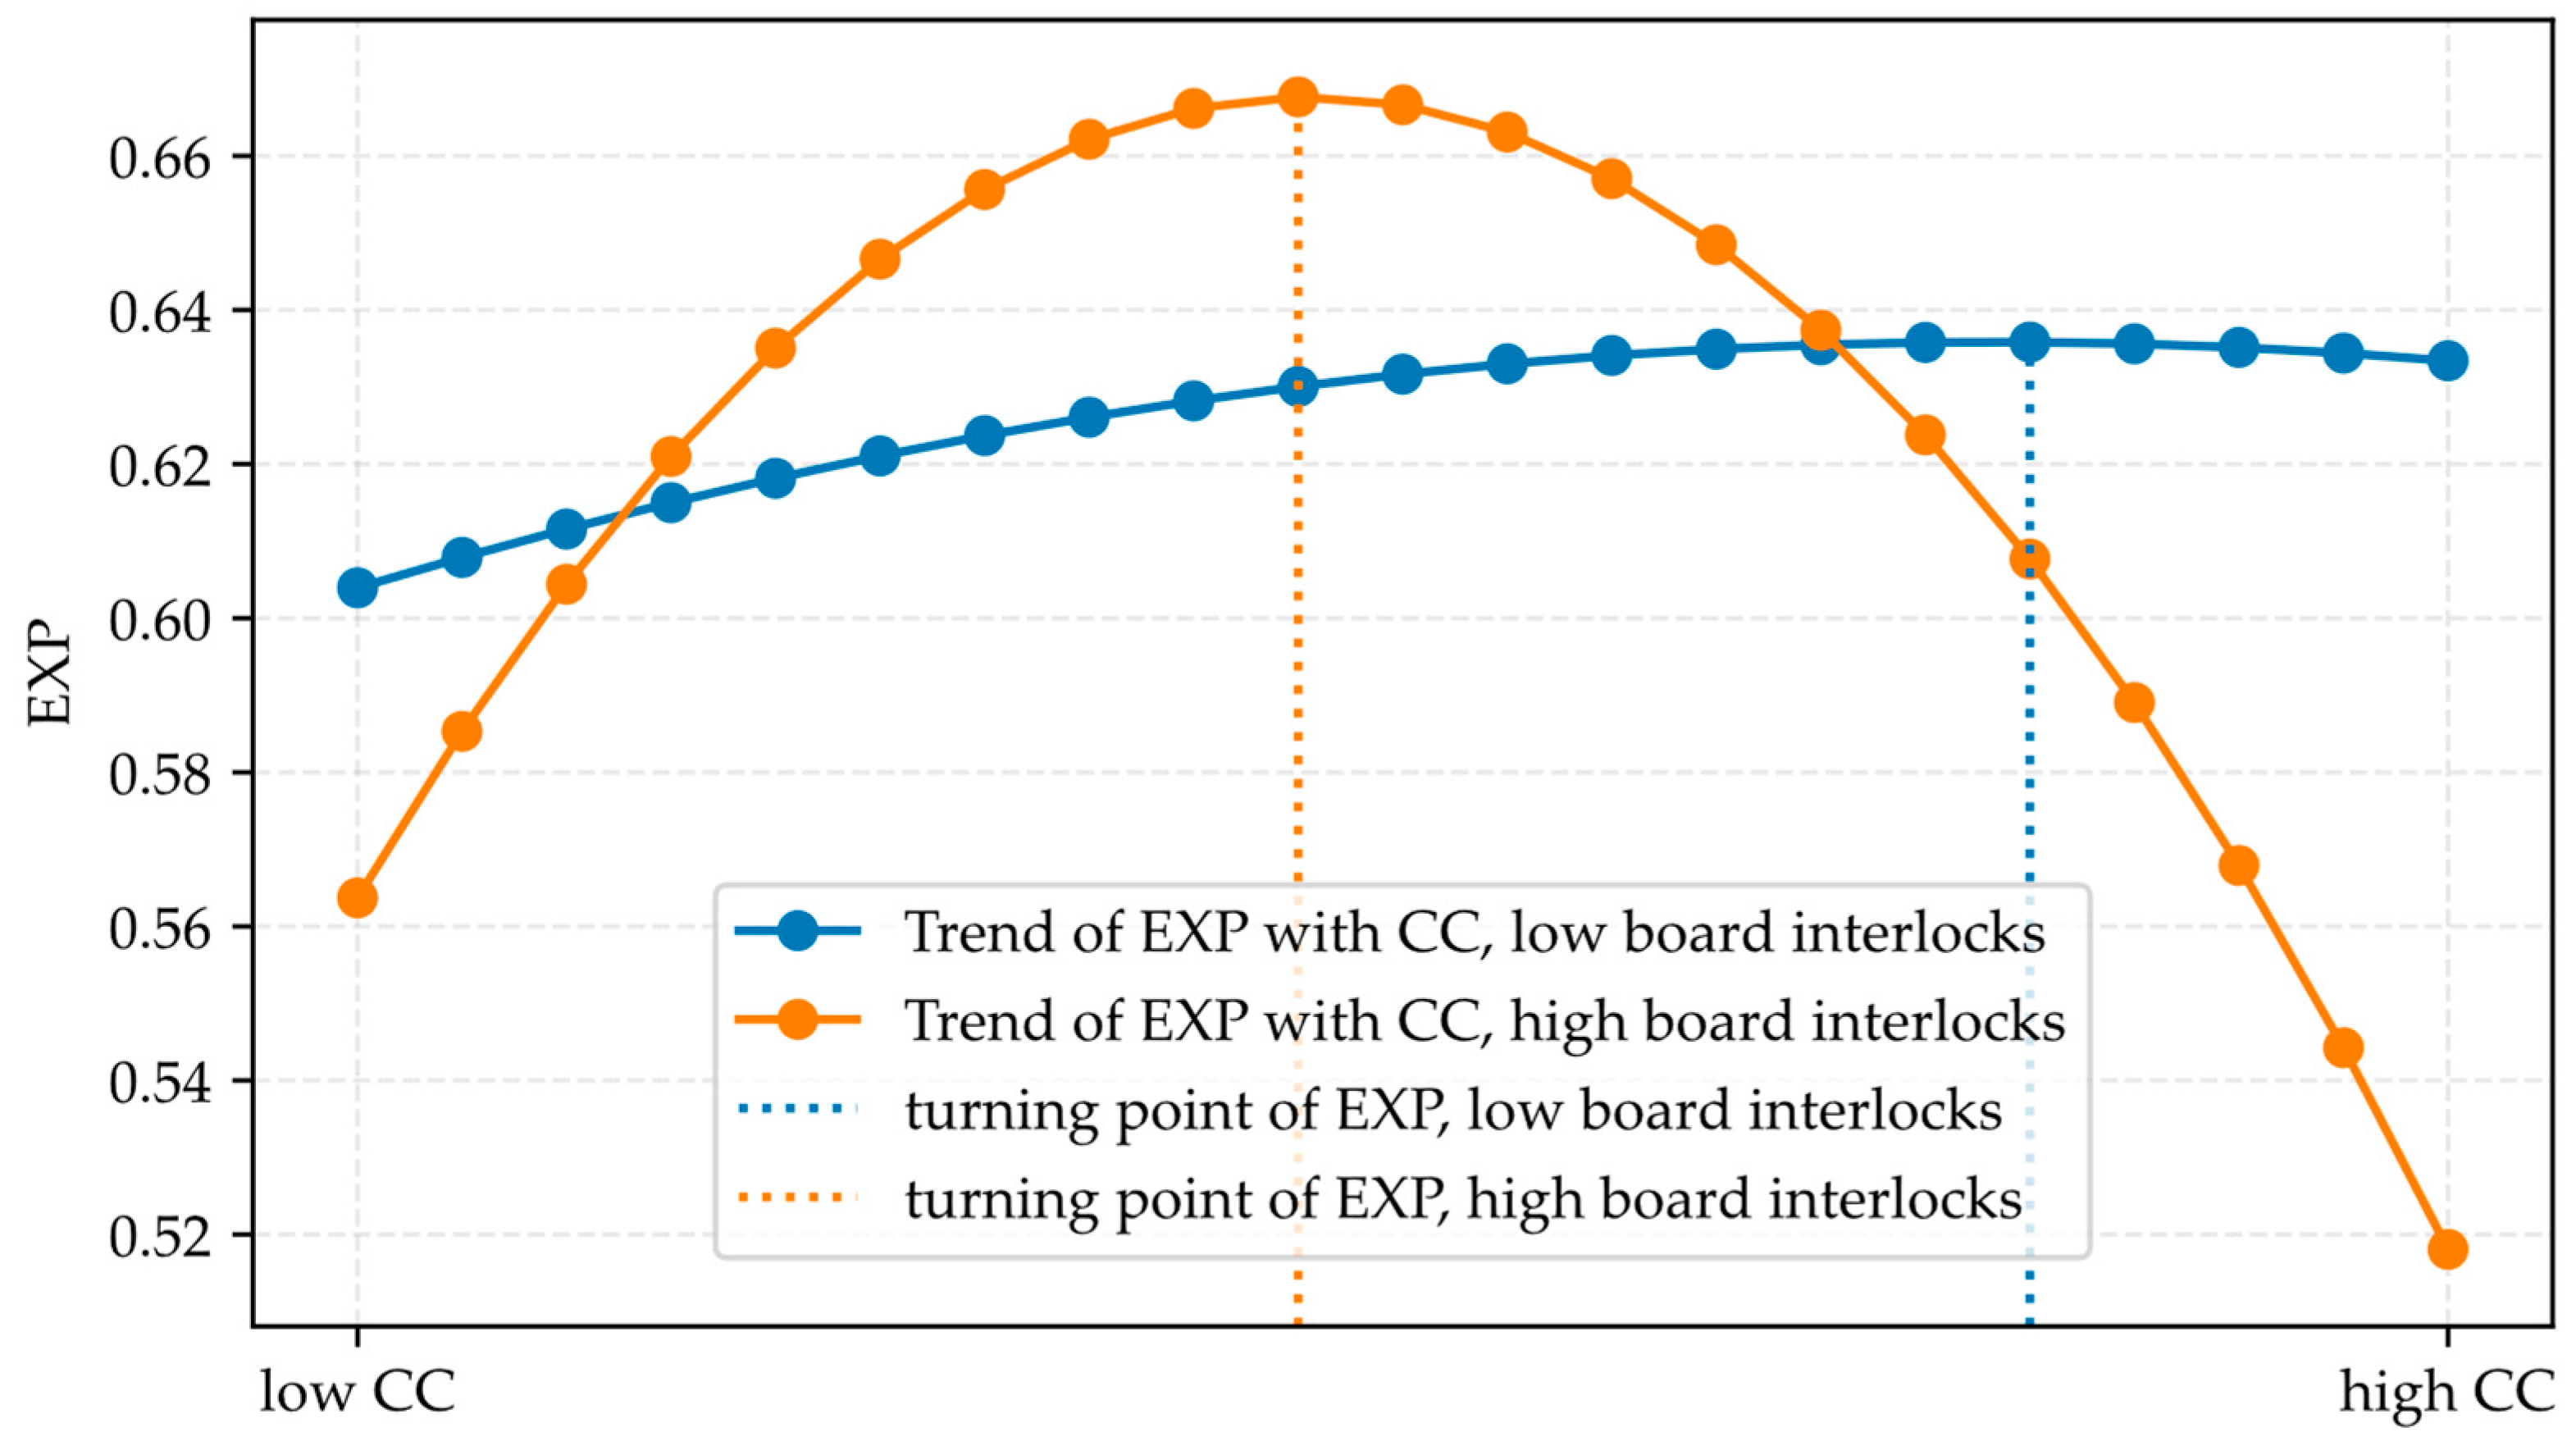
Based on this reasoning, we posit that board interlocks shift the inflection point of the inverted U-shaped curve to the left and make the curve steeper. Specifically, firms with more board interlocks will reach the peak of exploratory innovation at lower levels of customer concentration. However, as customer concentration increases further, the presence of board interlocks further weakens the firm’s adaptability, intensifying the inhibitory effect.
Hypothesis 2.
Board interlocks will moderate the relationship between customer concentration and exploratory innovation in that a higher level of board interlocks will shift the curve’s turning point to the left.
Hypothesis 3.
Board interlocks will moderate the relationship between customer concentration and exploratory innovation in that a higher level of board interlocks will steepen the curve.

2.3. Moderating Effect of the CEO’s Research Background

Lastly, we explore how the relationship between customer concentration and exploratory innovation is moderated by the CEO’s research background. TMT members are typically heterogeneous in terms of educational background, age, and experience [56]. Empirical research findings suggest that TMT background heterogeneity positively influences firm performance [52,53]. Based on upper echelons theory, such heterogeneity can be valuable for firms seeking to develop in multiple domains, thereby enhancing exploratory innovation.
However, the limitations of managerial perception, as suggested by upper echelons theory, must also be considered. Strategic decision-makers, including CEOs, have myopic tendencies and are often unable to fully grasp all aspects of the firm’s environment [2,30]. Given this limitation, CEOs with a research background—particularly in R&D—are more likely to have a deeper understanding of technological trends and innovation dynamics, which positively influences the firm’s innovation capacity.
A CEO with a research background brings two key advantages in fostering exploratory innovation. First, their expertise in R&D provides the confidence needed to drive the organization’s innovation efforts, particularly when faced with the pressures of customer concentration [57]. This confidence enables the firm to continue investing in R&D activities despite external pressures. Second, CEOs with research experience are typically better equipped to recognize the long-term benefits of exploratory innovation, allowing them to resist the myopic tendencies that may arise from the demands of major customers, which helps ensure that firms maintain investment in R&D, even under the pressure of high customer concentration.
However, similar to board interlocks, the positive effects of a CEO’s research background are not without constraints. In scenarios of low customer concentration, the scattered nature of demand-side resources limits the practical application of the CEO’s innovative ideas. The lack of concentrated customer demand makes it difficult to direct R&D efforts effectively. As customer concentration increases, the firm faces clearer technological goals and better access to innovation resources, which allows a CEO’s research background to be more fully leveraged [58]. In such cases, the CEO’s expertise can directly guide the integration of customer-side innovation resources, enhancing the firm’s ability to pursue exploratory innovation.
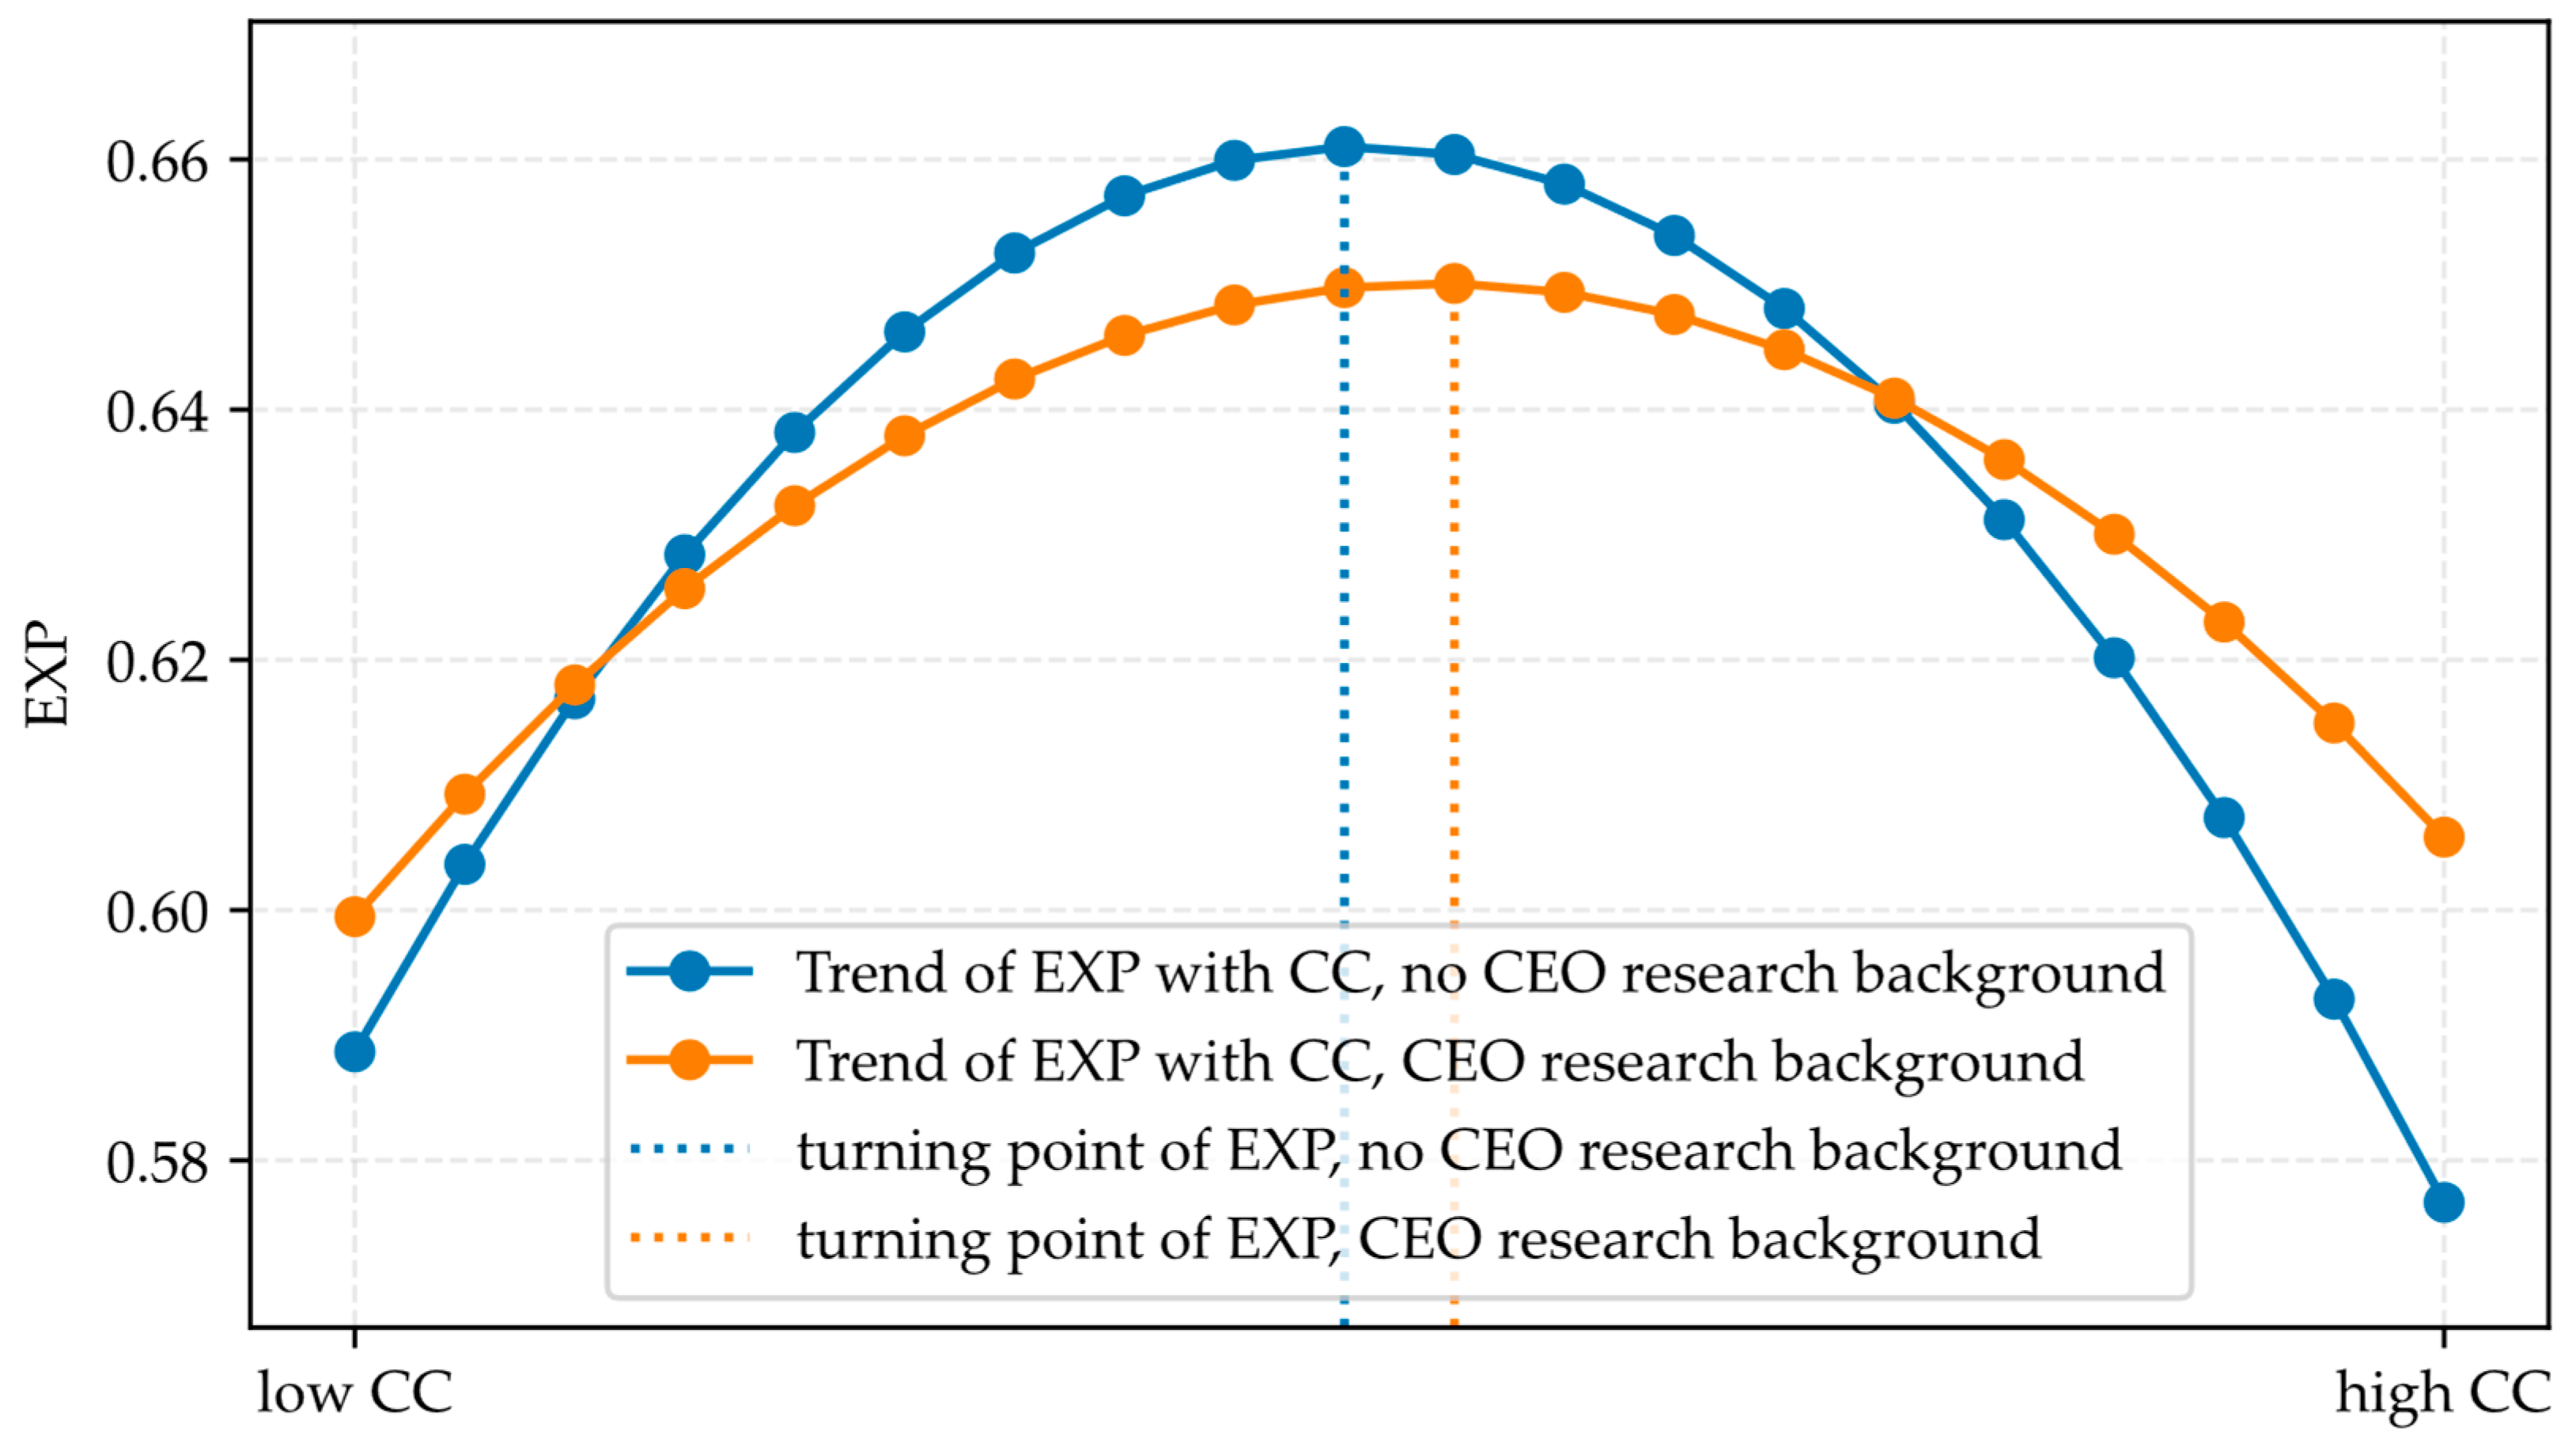
Based on this reasoning, we hypothesize that a CEO’s research background will shift the inflection point of the inverted U-shaped curve to the right and flatten the curve. Specifically, we propose that firms with low customer concentration will be less likely to engage in exploratory innovation, whereas those with higher customer concentration will see a greater likelihood of innovation, provided the CEO has a strong research background.
Hypothesis 4.
The CEO’s research background will moderate the relationship between customer concentration and exploratory innovation in that a CEO with a research background will shift the curve’s turning point to the right.
Hypothesis 5.
The CEO’s research background will moderate the relationship between customer concentration and exploratory innovation, in that the presence of a CEO with research background will flatten the curve.
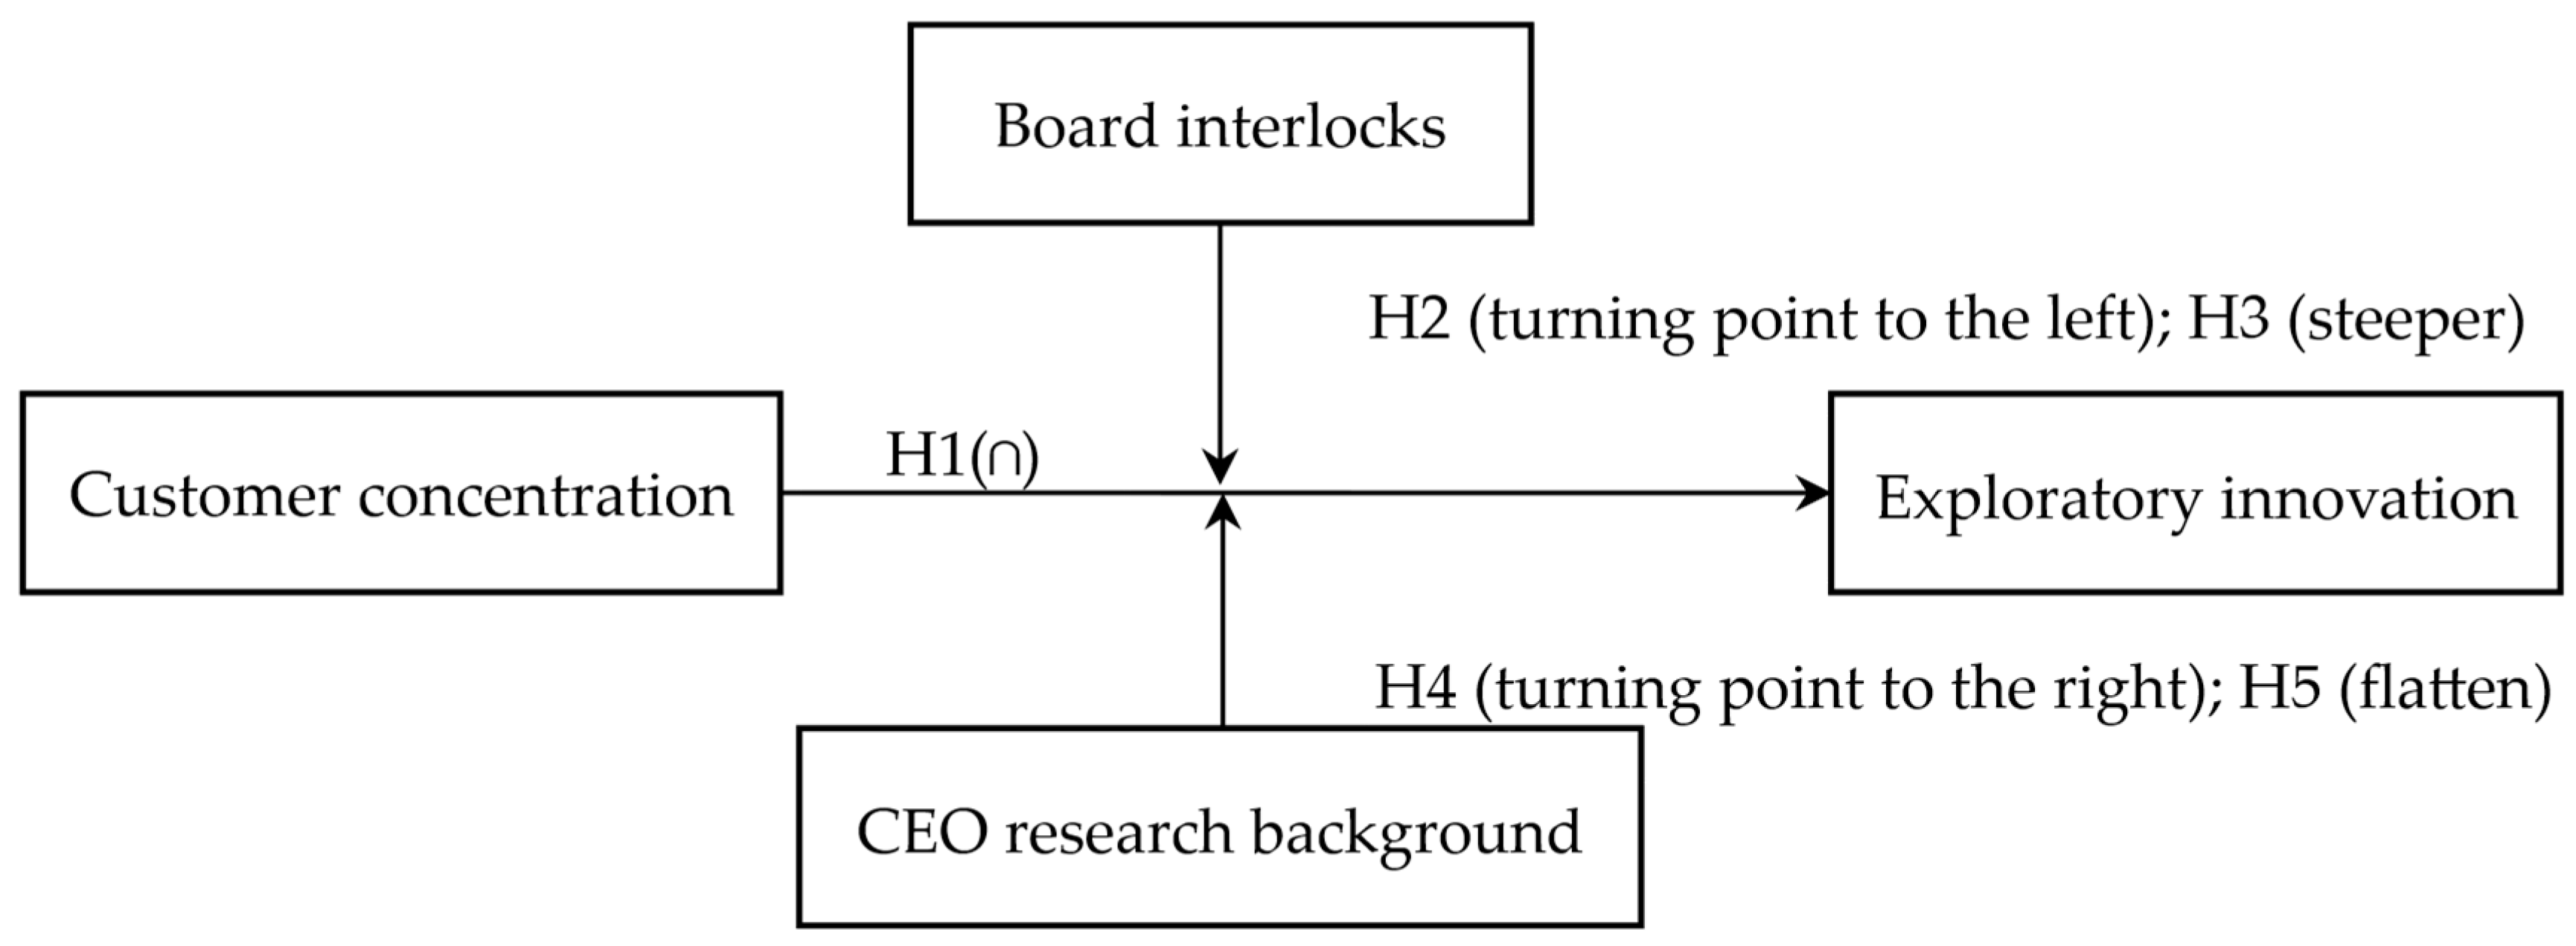
The overall theoretical framework is shown in Figure 1.

3. Methodology

3.1. Data Source

In our study, we focus on Chinese listed firms over the period from 2009 to 2019. The data on listed firms were sourced from the China Stock Market & Accounting Research (CSMAR) database, which provides detailed financial and innovation information, including data on firm employees, assets, liabilities, return on assets (ROA), and R&D investment. The CSMAR database is one of the leading providers of financial and market data for listed companies in China, offering a comprehensive range of information across various fields such as macroeconomics, securities, funds, futures, foreign exchange, bonds, trusts, and real estate. It spans nearly a decade of both domestic and international financial market history [59,60].
To measure exploratory innovation, we utilized patent data obtained from the Incopat Global Patent Database. Incopat is a leading global provider of patent and intellectual property (IP) data and analysis services. The database offers extensive coverage of millions of patent documents from over 100 countries, providing valuable insights into patent trends, technology developments, and competitive landscapes.
Given the potential distortion caused by abnormal listing status and industry-specific factors, we excluded samples with the “ST” and “PT” markers, which indicate special treatment and particular transfer, respectively [28]. Additionally, due to the distinct regulatory and market environment in the financial sector, where innovation modes and outcomes differ significantly from those in other industries [61], we treated financial industry firms, such as banks, securities firms, and insurance companies, separately and excluded them from our analysis.
To mitigate potential sample selection bias, we conducted a sample matching process to ensure that our final sample was representative of the population. After completing these data cleaning and filtering steps, we arrived at a final sample of 9123 observations from 2183 firms, values that are consistent with the study’s temporal scope and are free from the influence of sample-specific issues or missing values.

3.2. Measurement of Variables

3.2.1. Dependent Variable: Exploratory Innovation

In this study, we measure exploratory innovation using patent data, on the premise that novel patents indicate investment in new knowledge domains and technological breakthroughs, thereby reflecting a firm’s level of exploratory innovation. We identify whether a patent embodies novel knowledge by comparing its patent classification code with the codes that have appeared in the firm’s prior patents; if the code has not appeared before, the patent is classified as novel. We denote by newpatentst the number of such novel-knowledge patents achieved in year t, and by totalpatentst the total number of patents the firm files in year t. In the process of measurement, we extract the first four digits of each patent code, i.e., subclass code, and compare each code with all patent subclass codes in the previous five years. If the code is matched, it is considered an existing patent; otherwise, it is regarded as a new patent. Thereafter, the number of new patents in t year is summed to obtain newpatentst. In addition, if the number of patents of some firms in our database is too low, this will cause deviation in the calculation. We assumed that observations with fewer than two patents were balanced and assigned them a value of 0.5 to prevent deviation [62]. Exploratory innovation is then measured as the share of novel-knowledge patents among all patent applications filed by the focal firm in year t [63,64]. The corresponding formula is as follows:
E X P t = n e w p a t e n t s t t o t a l p a t e n t s t
where newpatentst is the number of patents with novel knowledge achieved by the focal firm in year t, and totalpatentst is the number of all patents achieved by the focal firm in year t. The value of the variable EXP ranges between 0 and 1. Considering patent achievements are formed earlier, we lagged the data for exploratory innovation by one year to measure the hysteresis effect of firm behavior on exploratory innovation.

3.2.2. Independent Variable: Customer Concentration

The Herfindahl-Hirschman Index (HHI)-based measure is widely used in recent research on customer concentration [14,16,19]. The corresponding formula is as follows:
C u s t o m e r   c o n c e n t r a t i o n = j = 1 n ( S a l e s i j S a l e s i ) 2
where S a l e s i j represents focal firm i’s sales to major customer j and Salesi represents firm i’s total sales. The variable Customer concentration ranges between 0 and 1. A higher value represents a more concentrated customer base [19].

3.2.3. Moderate Variables: Board Interlocks/CEO’s Research Background

To measure board interlocks, we used the number of listed firms with concurrent board directors. With reference to the methods used in a previous study [32], we identified TMT members from the data of Chinese listed firms and then merged the selected members’ ID numbers on the list of all firm directors through the unique ID number. When the same ID number is matched across the samples and the observations are derived from different listed firms, it can be confirmed that the corresponding individually concurrently serves on the board of other firms, meaning that interlocks exist in the corresponding enterprises. Lastly, the variable interlocks is calculated by summing up the number of interlocks grouped by business and year.
Another moderator variable, CEOR, is a dummy variable extracted based on whether the CEO has the identity mark of a research background.

3.2.4. Control Variables

Considering variables that may affect exploratory innovation, we introduced several control variables, which include firm age, firm size, R&D spending ratio, return on investment (ROA), financial leverage ratio, and tangible assets ratio in the model [19,65]. Firm age and employee number can reflect the company’s scale, experience, and capability of managing risk [66], in addition to the tendency toward exploration, which may affect its ability to engage in exploratory innovation. The R&D spending ratio can reflect the company’s level of investment in research and development, which has a direct impact on exploratory innovation [62]. ROA can reflect a firm’s profitability, while the financial leverage ratio and tangible assets ratio can reflect a firm’s financial condition and capital structure, which may also affect its ability to engage in exploratory innovation [35,60]. We also controlled for the financial leverage ratio and tangible assets ratio, as these indicators can also impact a firm’s daily operations and decision-making regarding innovation [29,35].
Variables adopted in model, as well as their measurements are shown in Table 1.

3.3. Model Specification

In this study, we estimated Models (3) and (4) to examine the relationship between customer concentration and exploratory innovation. After confirming the relationship between customer concentration and exploratory innovation, we estimated Models (5) and (6) to examine the moderating effect of board interlocks and the CEO’s research background.
E X P i , t = β 0 + β 1 C C i , t + β 2 C o n t r o l s i , t
E X P i , t = β 0 + β 1 C C i , t + β 2 C C i , t 2 + β 3 C o n t r o l s i , t
E X P i , t = β 0 + β 1 C C i , t + β 2 C C i , t 2 + β 3 C C i , t × I N T + β 4 C C i , t 2 × I N T + β 5 C o n t r o l s i , t
E X P i , t = β 0 + β 1 C C i , t + β 2 C C i , t 2 + β 3 C C i , t × C E O R + β 4 C C i , t 2 × C E O R + β 5 C o n t r o l s i , t
where i represents the firm and t represents the year. The dependent variable e x p l o r a t i o n i , t represents the exploratory innovation level of firm i in year t. The independent variable CCi,t is the exploratory innovation level of firm i in year t. Controls constitute all of the control variables listed in Table 1. To confirm whether fixed effects or random effects provide consistent estimates, we conducted the Hausman test [67]. Based on the p-value is 0.000, there is a significant difference in coefficient estimation between fixed effects and random effects. For the Hausman test, we adopted fixed effects, which are more appropriate in our model.

4. Results

4.1. Descriptive Statistics

The statistical description, including the sample size, mean, and standard deviation, in addition to the correlation matrix, is shown in Table 2. The correlation coefficient between the explanatory variables is low, with a maximum absolute value of 0.346. Furthermore, variance inflation factor (VIF) analysis was also performed on all explanatory variables. The result (mean = 1.11, max = 1.37) indicates that no serious multicollinearity problem exists. Thus, it is appropriate to proceed with further regression analysis.

4.2. Result of Regression

In Table 3, we present the results of the regression analysis. First, we explore the fundamental relationship between customer concentration and exploratory innovation by using linear and nonlinear least squares regression.
Hypothesis 1 posits that the effect of customer concentration on exploratory innovation shows an inverted U-shaped relationship. We first performed a linear regression of customer concentration on exploratory innovation in Model (1). The coefficient of the primary term of customer concentration is not significant (β = 0.044, p > 0.1), meaning that the effect of customer concentration on exploratory innovation is not a linear relationship. Model (2) shows the nonlinear regression results of customer concentration on exploratory innovation when the quadratic term of customer concentration is introduced. The coefficient of the first-degree term of customer concentration is significantly positive (β = 0.275, p < 0.05), and the coefficient of the second-degree term of customer concentration is significantly negative (β = −0.291, p < 0.05). The above test results show a potential inverted U shape between customer concentration and exploratory innovation. To confirm whether the results are genuinely U-shaped, we conducted a U-test [68]. As listed in Table 4, the test results show that the estimated extreme point is located at CC = 0.473, which is within the range of the independent variable (between 0 and 1). The slopes on both sides of this point are 0.2746 and −0.3066, respectively. The overall test of the presence of an inverse U shape shows p = 0.0364, indicating that the inverted U-shaped relationship between customer concentration and exploratory innovation is significant, in support of Hypothesis 1.
Hypotheses 2 and 3 posit that board interlocks will moderate the relationship between customer concentration and exploratory innovation in that a higher level of board interlocks will shift the curve’s turning point to the left and steepen the curve. To further explore the effect of board interlocks on this relationship, we added the interaction terms between board interlocks and customer concentration to the regression model. Model (3) in Table 3 shows the regression result when the interaction terms between board interlocks and customer concentration are introduced. The result shows that the coefficients of the interaction terms with the primary term and quadratic term are significantly positive (β = 1.112, p < 0.01) and significantly negative (β = −1.366, p < 0.01), respectively.
To clarify the exact rules of moderating effects, we plotted inverted U-shaped curves when moderating effects are introduced in Figure 2. Further comparison of the different levels of board interlocks shows that the inverted U-shaped curve becomes steeper and the turning point moves to the left when board interlocks are higher, which supports Hypotheses 2 and 3.
Hypotheses 4 and 5 posit that a CEO’s research background will moderate the relationship between customer concentration and exploratory innovation, in that a CEO with a research background will shift the curve’s turning point to the right and flatten the curve. We also incorporated the interaction terms between a CEO’s research background and customer concentration into the regression model to further explore the moderating effect of CEO research background on this relationship. Model (4) presented in Table 3 shows the regression result when the interaction term between CEOR and CC is introduced. The result indicates that the coefficients of the interaction terms with the primary term and the quadratic term are significantly negative (β = −0.402, p < 0.05) and significantly positive (β = 0.509, p < 0.05), respectively.
In Figure 3, the moderating effect of a CEO’s research background is shown. It can be seen that the inverted U-shaped curve flattens and the turning point moves to the right when a CEO’s research background is present, which supports Hypotheses 4 and 5.
Lastly, Model (5) presented in Table 3 shows the result when the interaction terms CC * interlocks, CC2 * interlocks, CC * CEOR, and CC2 * CEOR are introduced into Model (5). The coefficients of the independent variable and interaction terms are still significant.

4.3. Robustness Check

To ensure the robustness of our findings, additional tests were conducted and are reported in Table 5. First, we introduced the cubic term of customer concentration in the main regression results to verify whether the relationship is an S-shaped curve [69]. As shown in Model (1), the cubic term weakens the model fit, thereby excluding the possibility of an S-shaped relationship between customer concentration and exploratory innovation.
Second, we divided the data into two groups at the turning point and conducted linear regression analysis separately. For an inverted U-shaped curve, the regression on the subsample below the turning point should indicate a positive relationship between customer concentration and exploratory innovation, whereas the regression on the subsample above the turning point should indicate a negative relationship between customer concentration and exploratory innovation [69,70]. Models (2) and (3) show that the coefficient of customer concentration below the turning point is significantly positive (β = 0.142, p < 0.05) and the coefficient above the turning point is significantly negative (β = −0.177, p < 0.10). These results further confirm the regularity of the inverted U-shaped relationship between customer concentration and exploratory innovation.
Third, we adjusted the measurement method of exploratory innovation by regarding a patent as an existing patent when the full code is completely matched, instead of four digits in the prior measurement. The result shown in Model (4) indicates that the coefficients of CC and CC2 remain significant when the measurement of the dependent variable is adjusted (β1 = 0.341, p < 0.01, β2 = −0.398, p < 0.01), values that are consistent with the main regression results.
Lastly, we filtered out the manufacturing firms in the samples to clarify whether there are differences among different samples or groups. An additional regression analysis was conducted, with the results shown in Model (5), where the coefficients remain significant (β1 = 0.350, p < 0.01, β2 = −0.398, p < 0.01), indicating that our findings are less affected by industry type.

4.4. Endogeneity and Identification

In the empirical specification, firm and year fixed effects are included to absorb time-invariant firm characteristics and year-specific shocks. A comprehensive set of time-varying controls—firm size, firm age, profitability, leverage, R&D intensity, and asset structure—is also incorporated to mitigate omitted-variable bias.
For sample construction, ex ante, outcome-neutral selection rules are followed to ensure randomness and representativeness. Data availability serves as the sole screening criterion; the sample is not curated ex post based on customer concentration or innovation outcomes. In the baseline sample, only financial firms and clear data errors are excluded (with standard treatment of extreme values), and no selective deletions related to the study’s conclusions are undertaken.
Reverse causality is considered unlikely and is examined empirically. Exploratory innovation typically involves long development cycles and substantial uncertainty; both inputs and outputs (e.g., patent applications and technological breakthroughs) generally lag changes in customer structure, leaving limited scope for contemporaneous reverse causation. Consistent with this view, placebo lead tests indicate that future customer concentration does not significantly predict current exploratory innovation, alleviating concerns that the findings are driven by innovation anticipating changes in customer concentration.

5. Discussion

The purpose of this study is to investigate the impact of customer concentration on exploratory innovation. Through the regression analysis of 2183 Chinese listed firms, we discovered an inverted U-shape relationship between customer concentration and exploratory innovation. We uncovered the influence of customers on organizational innovation activities and the importance of keeping customer concentration at a moderate level.
Furthermore, we examined how board interlocks and a CEO’s research background moderate the relationship between customer concentration and exploratory innovation. Our findings show that the CEO’s research background helps mitigate the negative effects of high customer concentration, supporting long-term innovation goals. In contrast, board interlocks exacerbate these effects by aligning the firm more closely with the needs of major customers, limiting innovation.
These insights contribute to both theory and practice by highlighting the role of the top management team in balancing customer concentration for sustained innovation.

5.1. Theoretical Contributions

Through this study, we make three key contributions to the field of innovation management by providing new evidence on how customer concentration shapes exploratory innovation, an issue that is both theoretically salient and managerially relevant.
First, the study findings address the ongoing debate between the operational management view and the bargaining power view [16,19,21,22,25,60,71], revealing an inverted U-shaped relationship between customer concentration and exploratory innovation. While the authors of prior studies have reported conflicting effects, our analysis shows that the relative salience of these mechanisms shifts systematically as concentration increases, producing a nonlinear pattern rather than a uniform effect. This curvilinear specification resolves prior inconsistencies by demonstrating that both views are correct but at different ranges of concentration, thereby turning a “which mechanism” debate into a “when which mechanism” account. This finding also strengthens the specification of the focal relationship and helps reconcile competing views.
Second, the study findings contribute theoretically by integrating resource dependence theory and organizational learning theory to explain when and why customer concentration promotes or hinders exploratory innovation. From a resource dependence perspective, access to scarce innovation inputs and coordination with key buyers initially facilitate exploration; beyond a certain threshold; however, overdependence erodes bargaining power, constrains slack and attention, and hinders novel search [72,73]. Drawing on organization learning theory, we argue that short-term responsiveness to major customers can undermine distant search and long-horizon learning, echoing resource dependence theory’s warning against myopia and organizational learning theory’s emphasis on exploration under bounded attention [2,74]. This synthesis offers a parsimonious and conceptually rigorous account—mapping customer concentration to dependence and exploratory innovation to novel search, and specifying resource reallocation and attention constraints as mechanisms—while using auxiliary considerations only to delimit boundary conditions. It also yields empirically falsifiable predictions about the shape and contingencies of the effect, which we test in our study, and it informs dependence management and learning-process design in high-concentration industries.
Third, adopting an upper echelons lens, we articulate the boundary conditions and micro-foundations of the concentration–exploration relationship by showing that board interlocks and CEOs’ research backgrounds moderate this link, thereby enriching upper echelons theory in buyer-dependence contexts; the novelty lies in specifying who enables exploration under dependence and under what conditions, by connecting executive networks and expertise to the conversion of dependence into exploratory activity, and these contingencies turn executive characteristics into actionable governance levers while yielding testable, boundary-spanning propositions for the upper echelons literature [30].

5.2. Managerial Implications

Exploratory innovation in firms requires the acquisition and recombination of knowledge from diverse fields. In this process, customers can play various roles such as initiators, co-developers, sources of inspiration, providers of information, generators of new ideas, developers, users, and marketers [37]. We conclude that at low levels of customer concentration, the key factor that restricts a firm’s innovation is customer-level resource acquisition. To address this challenge, it is essential to establish long-term, stable collaborations with certain customers. However, maintaining a controllable level of customer concentration is critical. Firms with excessively high levels of customer concentration are more likely to face limitations in their exploratory activities due to the bargaining power of major customers. In contrast, firms with moderate levels of customer concentration are better positioned to engage in exploratory innovation. The power imbalance created by excessive dependence on customer resources is a key concern for managers [38], highlighting the need to maintain a balanced level of customer concentration. Such a balance aids in controlling the firm’s bargaining power and maintaining “less congestion” from customers, thereby ensuring a more effective acquisition of knowledge [75].
Additionally, our findings provide valuable guidance for business owners on how to structure their top management team by examining the role of the TMT in moderating the effect of customer concentration on exploratory innovation. The interlock background of the TMT can influence the relationship between customer concentration and exploratory innovation. Of particular note, the impact mechanism of the TMT varies under different levels of customer concentration. For firms without the burden of major customers, board interlocks can become a high-quality complementary resource and influential factor in affecting exploratory innovation [54]. However, the CEO’s research background appears to be caught in a dilemma of being unable to achieve the desired effect without sufficient resources. Until the bargaining power of customers increases, the CEO’s research background reflects its value in maintaining a long-term vision and distancing from the negative impact of major customer demands.
Overall, our study findings shed light on the importance of considering both TMT interlocks and a CEO’s research background in managing customer concentration and driving exploratory innovation. They highlight the need for firms to carefully consider their top management team’s composition and expertise to achieve long-term success. From the investigation of the two sets of moderating effects presented in this article, we can draw two main management insights. First, it is important to understand the behavior of board interlocks in actual business scenarios. From an organizational learning perspective, introducing board interlocks as external links in the TMT can motivate them to independently seek out learning resources and expand their own interests, which may influence their behavior and decision-making in the focal firm [76,77]. For the focal firm, it is essential to be aware of the joint influence of interlocked firms and major customers on the healthy development of the firm itself. Therefore, whether to introduce board interlocks requires an evaluation of the firm’s customer status to ensure a positive cooperative environment after their introduction. Second, the CEO’s research background plays a crucial role in fostering a long-term vision for innovation, showing that when the CEO pays attention to innovation itself, they can motivate the firm to overcome other obstacles that hinder innovation [78]. Additionally, sufficient resources to support the CEO’s innovative ideas and initiatives are also required. If a firm is led by a CEO with a research background, it should fully evaluate its resource allocation strategy and the level of customer concentration. A balanced approach that takes into account both the CEO’s research background and the level of customer concentration can help firms achieve sustainable innovation and long-term success [38].

5.3. Limitations and Further Research

This study has several limitations that suggest avenues for future research when considered against the prior literature. First, our sample comprises Chinese listed firms, which helps complement the predominantly U.S.- and Europe-based evidence on customer concentration and firm outcomes (often using Compustat and 10-K customer disclosures) [18,19]. However, China’s institutional context—state ownership, relationship-based governance, and financing structures—may amplify or dampen demand-side influence. The authors of future studies should conduct cross-country comparisons or multi-country panel analyses to test the external validity of our findings and examine how institutional features (e.g., legal protection of suppliers, IP regimes, and competition intensity) condition the customer concentration–innovation linkage.
Second, relative to previous studies in which innovation inputs/outputs are aggregated (e.g., R&D intensity and total patents) [79], we focus on exploratory innovation and a subset of upper echelons moderators (board interlocks and a CEO’s research background). Other theoretically salient moderators highlighted in the literature—governance and ownership (e.g., institutional investors and state ownership) [80,81], relational governance with customers (e.g., long-term contracts, technological integration) [82,83], industry structure (e.g., buyer power) [84], and ambidexterity at the firm level [85]—were not modeled. The authors of future studies could embed these multi-level contingencies and jointly analyze exploratory and exploitative innovation to reveal potential trade-offs.
Lastly, although we implement standard controls and robustness checks, endogeneity remains a concern in this stream of research. Building on identification strategies used in prior studies of supply-chain dependence, the authors of future studies could employ natural experiments or shift-share designs based on downstream demand to strengthen causal inference.

Supplementary Materials

The following supporting information can be downloaded at: https://www.mdpi.com/article/10.3390/su18010203/s1, Processing.do; Rawdata.dta.

Author Contributions

Conceptualization, F.C. and F.T.; methodology, F.C.; software, F.C.; validation, F.T., C.D. and Y.Z.; formal analysis, F.C.; investigation, F.C.; resources, F.T.; data curation, F.C.; writing—original draft preparation, F.C.; writing—review and editing, F.T.; visualization, F.C.; supervision, C.D.; project administration, F.T.; funding acquisition, F.T. All authors have read and agreed to the published version of the manuscript.

Funding

This research was funded by the National Natural Science Foundation of China (No.72072008), the National Natural Science Foundation of China (No.72504043), the Chongqing Natural Science Foundation (No. CSTB2025NSCQ-GPX1346), the Highlevel Talent Research Initiation Project of Chongqing Technology and Business University (No. 2555001).

Institutional Review Board Statement

Not applicable.

Informed Consent Statement

Not applicable.

Data Availability Statement

We collected the firms’ basic, financial, TMT, R&D, industrial, and family member information from CSMAR databases (https://data.csmar.com; accessed on 29 December 2020), and the data on patents used to construct the dependent variables were obtained from Incopat Databases (http://nmaly.sharepat.com.cn; accessed on 29 December 2020). The raw data used in this study and records of the data processing procedures have been uploaded as Supplementary Materials.

Conflicts of Interest

The authors declare no conflicts of interest.

References

  1. Schumpeter, J.A. The Theory of Economic Development: An Inquiry into Profits, Capital, Credit, Interest, and the Business Cycle; Harvard University Press: Cambridge, MA, USA, 1934. [Google Scholar]
  2. March, J.G. Exploration and Exploitation in Organizational Learning. Organ. Sci. 1991, 2, 71–87. [Google Scholar] [CrossRef]
  3. Benner, M.J.; Michael, T.L. Exploitation, Exploration, and Process Management: The Productivity Dilemma Revisited. Acad. Manag. Rev. 2003, 28, 238–256. [Google Scholar] [CrossRef]
  4. Jansen, J.J.P.; Van Den Bosch, F.A.J.; Volberda, H.W. Exploratory Innovation, Exploitative Innovation, and Performance: Effects of Organizational Antecedents and Environmental Moderators. Manag. Sci. 2006, 52, 1661–1674. [Google Scholar] [CrossRef]
  5. He, Z.-L.; Wong, P.-K. Exploration vs. Exploitation: An Empirical Test of the Ambidexterity Hypothesis. Organ. Sci. 2004, 15, 481–494. [Google Scholar] [CrossRef]
  6. Rosenkopf, L.; Nerkar, A. Beyond Local Search: Boundary-Spanning, Exploration, and Impact in the Optical Disk Industry. Strateg. Manag. J. 2001, 22, 287–306. [Google Scholar] [CrossRef]
  7. Sidhu, J.S.; Commandeur, H.R.; Volberda, H.W. The Multifaceted Nature of Exploration and Exploitation: Value of Supply, Demand, and Spatial Search for Innovation. Organ. Sci. 2007, 18, 20–38. [Google Scholar] [CrossRef]
  8. Markman, G.D.; Gianiodis, P.T.; Phan, P.H. Supply-Side Innovation and Technology Commercialization. J. Manag. Stud. 2009, 46, 625–649. [Google Scholar] [CrossRef]
  9. Kalcheva, I.; McLemore, P.; Pant, S. Innovation: The Interplay between Demand-Side Shock and Supply-Side Environment. Res. Policy 2018, 47, 440–461. [Google Scholar] [CrossRef]
  10. Yi, J.; Murphree, M.; Meng, S.; Li, S. The More the Merrier? Chinese Government R&D Subsidies, Dependence, and Firm Innovation Performance. J. Prod. Innov. Manag. 2021, 38, 289–310. [Google Scholar] [CrossRef]
  11. Priem, R.L.; Li, S.; Carr, J.C. Insights and New Directions from Demand-Side Approaches to Technology Innovation, Entrepreneurship, and Strategic Management Research. J. Manag. 2012, 38, 346–374. [Google Scholar] [CrossRef]
  12. Baldwin, C.; Hienerth, C.; Von Hippel, E. How User Innovations Become Commercial Products: A Theoretical Investigation and Case Study. Res. Policy 2006, 35, 1291–1313. [Google Scholar] [CrossRef]
  13. Ghasemzadeh, K.; Bortoluzzi, G.; Yordanova, Z. Collaborating with Users to Innovate: A Systematic Literature Review. Technovation 2022, 116, 102487. [Google Scholar] [CrossRef]
  14. Dhaliwal, D.; Judd, J.S.; Serfling, M.; Shaikh, S. Customer Concentration Risk and the Cost of Equity Capital. J. Account. Econ. 2016, 61, 23–48. [Google Scholar] [CrossRef]
  15. Huang, H.H.; Lobo, G.J.; Wang, C.; Xie, H. Customer Concentration and Corporate Tax Avoidance. J. Bank. Financ. 2016, 72, 184–200. [Google Scholar] [CrossRef]
  16. Korcan, A.B.; Patatoukas, P.N. Customer-Base Concentration and Inventory Efficiencies: Evidence from the Manufacturing Sector. Prod. Oper. Manag. 2016, 25, 258–272. [Google Scholar] [CrossRef]
  17. Campello, M.; Gao, J. Customer Concentration and Loan Contract Terms. J. Financ. Econ. 2017, 123, 108–136. [Google Scholar] [CrossRef]
  18. Hui, K.W.; Liang, C.; Yeung, P.E. The Effect of Major Customer Concentration on Firm Profitability: Competitive or Collaborative? Rev. Account. Stud. 2019, 24, 189–229. [Google Scholar] [CrossRef]
  19. Zhong, W.; Ma, Z.; Tong, T.W.; Zhang, Y.; Xie, L. Customer Concentration, Executive Attention, and Firm Search Behavior. Acad. Manag. J. 2021, 64, 1625–1647. [Google Scholar] [CrossRef]
  20. Saboo, A.R.; Kumar, V.; Anand, A. Assessing the Impact of Customer Concentration on Initial Public Offering and Balance Sheet–Based Outcomes. J. Mark. 2017, 81, 42–61. [Google Scholar] [CrossRef]
  21. Hui, K.W. Corporate Suppliers and Customers and Accounting Conservatism. J. Account. Econ. 2012, 53, 115–135. [Google Scholar] [CrossRef]
  22. Casalin, F.; Pang, G.; Maioli, S.; Cao, T. Inventories and the Concentration of Suppliers and Customers: Evidence from the Chinese Manufacturing Sector. Int. J. Prod. Econ. 2017, 193, 148–159. [Google Scholar] [CrossRef]
  23. Wang, J. Do Firms’ Relationships with Principal Customers/Suppliers Affect Shareholders’ Income? J. Corp. Financ. 2012, 18, 860–878. [Google Scholar] [CrossRef]
  24. Kaminski, J.; Hopp, C.; Tykvová, T. New Technology Assessment in Entrepreneurial Financing—Does Crowdfunding Predict Venture Capital Investments? Technol. Forecast. Soc. Change 2019, 139, 287–302. [Google Scholar] [CrossRef]
  25. Dong, Y.; Li, C.; Li, H. Customer Concentration and M&A Performance. J. Corp. Financ. 2021, 69, 102021. [Google Scholar] [CrossRef]
  26. Christensen, C.M.; Bower, J.L. Customer Power, Strategic Investment, and the Failure of Leading Firms. Strateg. Manag. J. 1996, 17, 197–218. [Google Scholar] [CrossRef]
  27. Corso, M.; Martini, A.; Pellegrini, L. Innovation at the Intersection between Exploration, Exploitation and Discontinuity. Int. J. Learn. Intellect. Cap. 2009, 6, 324–340. [Google Scholar] [CrossRef]
  28. Pan, J.; Yu, M.; Liu, J.; Fan, R. Customer Concentration and Corporate Innovation: Evidence from China. N. Am. J. Econ. Financ. 2020, 54, 101284. [Google Scholar] [CrossRef]
  29. Krolikowski, M.; Yuan, X. Friend or Foe: Customer-Supplier Relationships and Innovation. J. Bus. Res. 2017, 78, 53–68. [Google Scholar] [CrossRef]
  30. Hambrick, D.; Mason, P. Upper Echelons: The Organization as a Reflection of Its Top Managers. Acad. Manag. Rev. 1984, 9, 193–206. [Google Scholar] [CrossRef]
  31. Davis, G.F. The Significance of Board Interlocks for Corporate Governance. Corp. Gov. 1996, 4, 154–159. [Google Scholar] [CrossRef]
  32. Li, M. Diversity of Board Interlocks and the Impact on Technological Exploration: A Longitudinal Study. J. Prod. Innov. Manag. 2019, 36, 490–512. [Google Scholar] [CrossRef]
  33. Ye, P.; O’Brien, J.; Carnes, C.M.; Hasan, I. The Influence of Bondholder Concentration and Temporal Orientation on Investments in R&D. J. Manag. 2021, 47, 683–715. [Google Scholar] [CrossRef]
  34. Daft, R.L.; Weick, K.E. Toward a Model of Organizations as Interpretation Systems. Acad. Manag. Rev. 1984, 9, 284–295. [Google Scholar] [CrossRef]
  35. Zhao, W.; Wang, C.; Wan, L.; Wang, Q.; Luo, B. Customer Concentration and Exploratory Innovation: The Mediating Effect of Perceived Performance-Reducing Threats. J. Bus. Econ. Manag. 2021, 22, 940–957. [Google Scholar] [CrossRef]
  36. Hollebeek, L.D.; Kumar, V.; Srivastava, R.K.; Lim, W.M.; Urbonavicius, S. Guidelines for Theory Selection: The IMPACT Framework. Psychol. Mark. 2025, 42, 2789–2806. [Google Scholar] [CrossRef]
  37. Öberg, C. Customer Roles in Innovations. Int. J. Innov. Manag. 2010, 14, 989–1011. [Google Scholar] [CrossRef]
  38. Pfeffer, J.; Salancik, G.R. The External Control of Organizations: A Resource Dependence Perspective; Harper & Row: New York, NY, USA, 1978. [Google Scholar]
  39. Kapoor, R. Coordinating and Competing in Ecosystems: How Organizational Forms Shape New Technology Investments. Strateg. Manag. J. 2013, 34, 274–296. [Google Scholar] [CrossRef]
  40. Ceccagnoli, M.; Forman, C.; Huang, P.; Wu, D.J. Cocreation of Value in a Platform Ecosystem: The Case of Enterprise Software. MIS Q. 2012, 36, 263–290. [Google Scholar] [CrossRef]
  41. Payne, A.; Frow, P. A Strategic Framework for Customer Relationship Management. J. Mark. 2005, 69, 167–176. [Google Scholar] [CrossRef]
  42. Lin, F.; Huang, S.; Lin, S. Effects of Information Sharing on Supply Chain Performance in Electronic Commerce. IEEE Trans. Eng. Manage. 2002, 49, 258–268. [Google Scholar] [CrossRef]
  43. Tejeiro Koller, M.R. Exploring Adaptability in Organizations: Where Adaptive Advantage Comes from and What It Is Based Upon. J. Organ. Chang. Manag. 2016, 29, 837–854. [Google Scholar] [CrossRef]
  44. Patatoukas, P.N. Customer-Base Concentration: Implications for Firm Performance and Capital Markets. Account. Rev. 2012, 87, 363–392. [Google Scholar] [CrossRef]
  45. Reeves, M.; Deimler, M.; Nicol, R. Adaptive Advantage: Winning Strategies for Uncertain Times; The Boston Consulting Group Inc.: Boston, MA, USA, 2010. [Google Scholar]
  46. Manfredi Latilla, V.; Frattini, F.; Messeni Petruzzelli, A.; Berner, M. Knowledge Management, Knowledge Transfer and Organizational Performance in the Arts and Crafts Industry: A Literature Review. J. Knowl. Manag. 2018, 22, 1310–1331. [Google Scholar] [CrossRef]
  47. Homburg, C.; Workman, J.P. Fundamental Changes in Marketing Organization: The Movement toward a Customer-Focused Organizational Structure. J. Acad. Mark. Sci. 2000, 28, 459–478. [Google Scholar] [CrossRef]
  48. Covello, V.T.; Mumpower, J. Risk Analysis and Risk Management: An Historical Perspective. Risk Anal. 1985, 5, 103–120. [Google Scholar] [CrossRef]
  49. Wiersema, M.F. Top Management Team Demography and Corporate Strategic Change. Acad. Manag. J. 1992, 35, 91–121. [Google Scholar] [CrossRef]
  50. Srivastava, A.; Lee, H. Predicting Order and Timing of New Product Moves: The Role of Top Management in Corporate Entrepreneurship. J. Bus. Ventur. 2005, 20, 459–481. [Google Scholar] [CrossRef]
  51. Ling, Y.; Simsek, Z.; Lubatkin, M.H.; Veiga, J.F. Transformational Leadership’s Role in Promoting Corporate Entrepreneurship: Examining the CEO-TMT Interface. Acad. Manag. J. 2008, 51, 557–576. [Google Scholar] [CrossRef]
  52. Cannella, A.A.; Park, J.H.; Lee, H.U. Top Management Team Functional Background Diversity and Firm Performance: Examining the Roles of Team Member Colocation and Environmental Uncertainty. Acad. Manag. J. 2008, 51, 768–784. [Google Scholar] [CrossRef]
  53. Cai, L.; Liu, Q.; Yu, X. Effects of Top Management Team Heterogeneous Background and Behavioural Attributes on the Performance of New Ventures: TMT Heterogeneity and Behavioural Attributes on the Performance. Syst. Res. 2013, 30, 354–366. [Google Scholar] [CrossRef]
  54. Li, M. Exploring Novel Technologies through Board Interlocks: Spillover vs. Broad Exploration. Res. Policy 2021, 50, 104337. [Google Scholar] [CrossRef]
  55. Zona, F.; Gomez-Mejia, L.R.; Withers, M.C. Board Interlocks and Firm Performance: Toward a Combined Agency–Resource Dependence Perspective. J. Manag. 2018, 44, 589–618. [Google Scholar] [CrossRef]
  56. Xie, X.; Han, Y.; Hoang, T.T. Can Green Process Innovation Improve Both Financial and Environmental Performance? The Roles of TMT Heterogeneity and Ownership. Technol. Forecast. Soc. Change 2022, 184, 122018. [Google Scholar] [CrossRef]
  57. Zhong, X.; Song, T.; Chen, W. Persistent Innovation Underperformance and Firms’ R&D Internationalization: The Moderating Effects of Multidimensional TMT Human Capital. Ind. Mark. Manag. 2022, 102, 576–587. [Google Scholar] [CrossRef]
  58. Boon, W.; Edler, J. Demand, Challenges, and Innovation. Making Sense of New Trends in Innovation Policy. Sci. Public Policy 2018, 45, 435–447. [Google Scholar] [CrossRef]
  59. Qian, C.; Wang, H.; Geng, X.; Yu, Y. Rent Appropriation of Knowledge-Based Assets and Firm Performance When Institutions Are Weak: A Study of Chinese Publicly Listed Firms: Rent Appropriation of Knowledge-Based Assets and Firm Performance. Strateg. Manag. J. 2017, 38, 892–911. [Google Scholar] [CrossRef]
  60. Zhu, M.; Yeung, A.C.L.; Zhou, H. Diversify or Concentrate: The Impact of Customer Concentration on Corporate Social Responsibility. Int. J. Prod. Econ. 2021, 240, 108214. [Google Scholar] [CrossRef]
  61. Funk, R.J.; Hirschman, D. Derivatives and Deregulation: Financial Innovation and the Demise of Glass–Steagall. Adm. Sci. Q. 2014, 59, 669–704. [Google Scholar] [CrossRef]
  62. Duysters, G.; Lavie, D.; Sabidussi, A.; Stettner, U. What Drives Exploration? Convergence and Divergence of Exploration Tendencies among Alliance Partners and Competitors. Acad. Manag. J. 2020, 63, 1425–1454. [Google Scholar] [CrossRef]
  63. Gao, Y.; Hu, Y.; Liu, X.; Zhang, H. Can Public R&D Subsidy Facilitate Firms’ Exploratory Innovation? The Heterogeneous Effects between Central and Local Subsidy Programs. Res. Policy 2021, 50, 104221. [Google Scholar] [CrossRef]
  64. Jia, N.; Huang, K.G.; Zhang, C. Public Governance, Corporate Governance, and Firm Innovation: An Examination of State-Owned Enterprises. Acad. Manag. J. 2019, 62, 220–247. [Google Scholar] [CrossRef]
  65. Zhou, K.Z.; Wu, F. Technological Capability, Strategic Flexibility, and Product Innovation. Strateg. Manag. J. 2009, 31, 547–561. [Google Scholar] [CrossRef]
  66. Zhou, N.; Park, S.H. Growth or Profit? Strategic Orientations and Long-term Performance in China. Strateg. Manag. J. 2020, 41, 2050–2071. [Google Scholar] [CrossRef]
  67. Hausman, J.A. Specification Tests in Econometrics. Econom. J. Econom. Soc. 1978, 46, 1251–1271. [Google Scholar] [CrossRef]
  68. Lind, J.T.; Mehlum, H. With or without U? The Appropriate Test for a U-Shaped Relationship. Oxf. Bull. Econ. Stat. 2010, 72, 109–118. [Google Scholar] [CrossRef]
  69. Haans, R.F.J.; Pieters, C.; He, Z. Thinking about U: Theorizing and Testing U- and Inverted U-Shaped Relationships in Strategy Research: Theorizing and Testing U-Shaped Relationships. Strateg. Manag. J. 2016, 37, 1177–1195. [Google Scholar] [CrossRef]
  70. Qian, G.; Khoury, T.A.; Peng, M.W.; Qian, Z. The Performance Implications of Intra- and Inter-Regional Geographic Diversification. Strateg. Manag. J. 2010, 31, 1018–1030. [Google Scholar] [CrossRef]
  71. Kale, J.R.; Shahrur, H. Corporate Capital Structure and the Characteristics of Suppliers and Customers. J. Financ. Econ. 2007, 83, 321–365. [Google Scholar] [CrossRef]
  72. Adner, R.; Zemsky, P. A Demand-Based Perspective on Sustainable Competitive Advantage. Strateg. Manag. J. 2006, 27, 215–239. [Google Scholar] [CrossRef]
  73. Dodgson, M. Organizational Learning: A Review of Some Literatures. Organ. Stud. 1993, 14, 375–394. [Google Scholar] [CrossRef]
  74. Levinthal, D.A.; March, J.G. The Myopia of Learning. Strateg. Manag. J. 1993, 14, 95–112. [Google Scholar] [CrossRef]
  75. Osabutey, E.L.C.; Jin, Z. Factors Influencing Technology and Knowledge Transfer: Configurational Recipes for Sub-Saharan Africa. J. Bus. Res. 2016, 69, 5390–5395. [Google Scholar] [CrossRef]
  76. Huber, G.P. Organizational Learning: The Contributing Processes and the Literatures. Organ. Sci. 1991, 2, 88–115. [Google Scholar] [CrossRef]
  77. Crossan, M.M.; Lane, H.W.; White, R.E.; Djurfeldt, L. Organizational Learning: Dimensions for a Theory. Int. J. Organ. Anal. 1995, 3, 337–360. [Google Scholar] [CrossRef]
  78. Yadav, M.S.; Prabhu, J.C.; Chandy, R.K. Managing the Future: CEO Attention and Innovation Outcomes. J. Mark. 2007, 71, 84–101. [Google Scholar] [CrossRef]
  79. Bellstam, G.; Bhagat, S.; Cookson, J.A. A Text-Based Analysis of Corporate Innovation. Manag. Sci. 2021, 67, 4004–4031. [Google Scholar] [CrossRef]
  80. Aghion, P.; Van Reenen, J.; Zingales, L. Innovation and Institutional Ownership. Am. Econ. Rev. 2013, 103, 277–304. [Google Scholar] [CrossRef]
  81. He, J.; Tian, X. The Dark Side of Analyst Coverage: The Case of Innovation. J. Financ. Econ. 2013, 109, 856–878. [Google Scholar] [CrossRef]
  82. Poppo, L.; Zenger, T. Do Formal Contracts and Relational Governance Function as Substitutes or Complements? Strateg. Manag. J. 2002, 23, 707–725. [Google Scholar] [CrossRef]
  83. Dyer, J.H.; Singh, H. The Relational View: Cooperative Strategy and Sources of Interorganizational Competitive Advantage. Acad. Manag. Rev. 1998, 23, 660–679. [Google Scholar] [CrossRef]
  84. Chen, Z. Supplier Innovation in the Presence of Buyer Power. Int. Econ. Rev. 2019, 60, 329–353. [Google Scholar] [CrossRef]
  85. Ragatz, G.L.; Handfield, R.B.; Petersen, K.J. Benefits Associated with Supplier Integration into New Product Development under Conditions of Technology Uncertainty. J. Bus. Res. 2002, 55, 389–400. [Google Scholar] [CrossRef]
Figure 1. Theoretical framework.
Sustainability 18 00203 g001
Figure 2. Moderating effect of board interlocks.
Sustainability 18 00203 g002
Figure 3. Moderating effect of CEO research background.
Sustainability 18 00203 g003
Table 1. Variables measurement.
VariablesDefinition/MeasurementData Source
EXPExploration innovation levelIncopat Database
CCCustomer concentration measured by Herfindahl-Hirschman IndexCSMAR Database
INTTotal amount of interlocksCSMAR Database
CEORWhether the CEO has an R&D backgroundCSMAR Database
ESTAge of the firm since its establishmentCSMAR Database
EMThe number of employeesCSMAR Database
RDResearch and development spending ratioCSMAR Database
ROAReturn on assetsCSMAR Database
FINLFinancial leverage ratioCSMAR Database
TANTangible asset ratioCSMAR Database
Table 2. Descriptive statistics and correlation matrix.
VariablesEXPCCINTCEORESTEMRDROACRFINLTAN
EXP1.000
CC0.099 *1.000
INT−0.005−0.050 *1.000
CEOR−0.0200.072 *−0.025 *1.000
EST−0.018−0.064 *0.019−0.046 *1.000
EM−0.032 *−0.089 *0.081 *−0.021 *0.0011.000
RD−0.121 *0.039 *−0.035 *0.122 *−0.075 *−0.115 *1.000
ROA−0.044 *−0.076 *−0.0010.010−0.041 *0.004−0.029 *1.000
CR0.129 *0.057 *−0.013−0.075 *−0.025 *0.154 *−0.268 *−0.064 *1.000
FINL0.027 *−0.0170.035 *−0.067 *0.099 *0.257 *−0.285 *−0.346 *0.179 *1.000
TAN−0.0110.039 *−0.000−0.0170.0010.039 *−0.101 *0.031 *0.037 *0.097 *1.000
Count91239123912391239123912391239123912391239123
Mean0.310.290.030.317.820.660.050.040.490.410.92
S.D.0.340.190.180.465.361.830.050.070.190.190.09
Min000020.010−0.840.140.010.29
Max11316433.50.890.3811.261
Notes: * p < 0.10.
Table 3. Regression analysis.
VariablesModel (1)Model (2)Model (3)Model (4)Model (5)
CC0.0440.275 **0.251 **0.408 ***0.378 ***
(0.04)(0.12)(0.12)(0.13)(0.13)
CC2 −0.291 **−0.260 *−0.469 ***−0.430 ***
(0.14)(0.14)(0.16)(0.16)
INT −0.118 * −0.116 *
(0.06) (0.06)
CEOR 0.0390.037
(0.03)(0.03)
CC * INT 1.112 *** 1.087 ***
(0.41) (0.41)
CC2 & INT −1.366 *** −1.327 ***
(0.51) (0.51)
CC * CEOR −0.402 **−0.384 **
(0.18)(0.18)
CC2 * CEOR 0.509 **0.485 **
(0.21)(0.21)
EST−0.015 ***−0.015 ***−0.015 ***−0.015 ***−0.015 ***
(0.00)(0.00)(0.00)(0.00)(0.00)
EM−0.004−0.003−0.004−0.002−0.003
(0.01)(0.01)(0.01)(0.01)(0.01)
RD−0.099−0.086−0.087−0.078−0.080
(0.15)(0.15)(0.15)(0.15)(0.15)
ROA0.1040.110 *0.112 *0.115 *0.117 *
(0.07)(0.07)(0.07)(0.07)(0.07)
CR0.0020.0010.0040.0040.008
(0.06)(0.06)(0.06)(0.06)(0.06)
FINL−0.041−0.039−0.037−0.040−0.039
(0.04)(0.04)(0.04)(0.04)(0.04)
TAN−0.047−0.042−0.038−0.044−0.040
(0.07)(0.07)(0.07)(0.07)(0.07)
CONS0.628 ***0.589 ***0.586 ***0.580 ***0.578 ***
(0.08)(0.08)(0.08)(0.08)(0.08)
R20.0200.0210.0220.0220.023
F17.65016.19512.94112.78110.831
N91239123912391239123
Notes: Standard errors in parentheses. * p < 0.10; ** p < 0.05; *** p < 0.01.
Table 4. Test of the inverted U-shaped relationship between CC and EXP.
U-Test IndicatorsEXP
Test of joint significance of CC and CC2 (p-value)0.0364
Lower bound slope0.2746
Upper bound slope−0.3066
Estimated extreme point0.473
95% Fieller interval for extreme point(0.3057, 1.5358)
Table 5. Robustness check.
VariablesModel (1)Model (2)Model (3)Model (4)Model (5)
CC0.0500.142 **−0.177 *0.341 ***0.350 ***
(0.25)(0.07)(0.10)(0.11)(0.13)
CC20.336 −0.398 ***−0.398 ***
(0.63) (0.12)(0.15)
CC3−0.482
(0.47)
EST−0.015 ***−0.013 ***−0.027 ***−0.012 ***−0.014 ***
(0.00)(0.00)(0.00)(0.00)(0.00)
EM−0.003−0.002−0.012−0.007−0.007
(0.01)(0.01)(0.02)(0.01)(0.01)
RD−0.078−0.055−0.009−0.1920.086
(0.15)(0.21)(0.25)(0.14)(0.17)
ROA0.1090.1290.1270.0840.115
(0.07)(0.08)(0.14)(0.06)(0.07)
CR0.001−0.0400.0770.0300.002
(0.06)(0.07)(0.15)(0.05)(0.07)
FINL−0.039−0.0330.044−0.049−0.027
(0.04)(0.05)(0.10)(0.04)(0.05)
TAN−0.043−0.0780.138−0.021−0.060
(0.07)(0.08)(0.17)(0.06)(0.08)
CONS0.611 ***0.594 ***0.745 ***0.863 ***0.544 ***
(0.08)(0.09)(0.21)(0.07)(0.09)
R20.0210.0150.0460.0190.018
F14.68010.2167.59814.53511.589
N91237086203791237469
Notes: Standard errors in parentheses, * p < 0.10, ** p < 0.05, *** p < 0.01.
Disclaimer/Publisher’s Note: The statements, opinions and data contained in all publications are solely those of the individual author(s) and contributor(s) and not of MDPI and/or the editor(s). MDPI and/or the editor(s) disclaim responsibility for any injury to people or property resulting from any ideas, methods, instructions or products referred to in the content.