
CityAirQ—Pollution Tracking System

 ,
,
Abstract
1. Introduction
1.1. Air Pollution
1.2. Benefits of Air Quality Monitoring
1.3. Proposed Solution
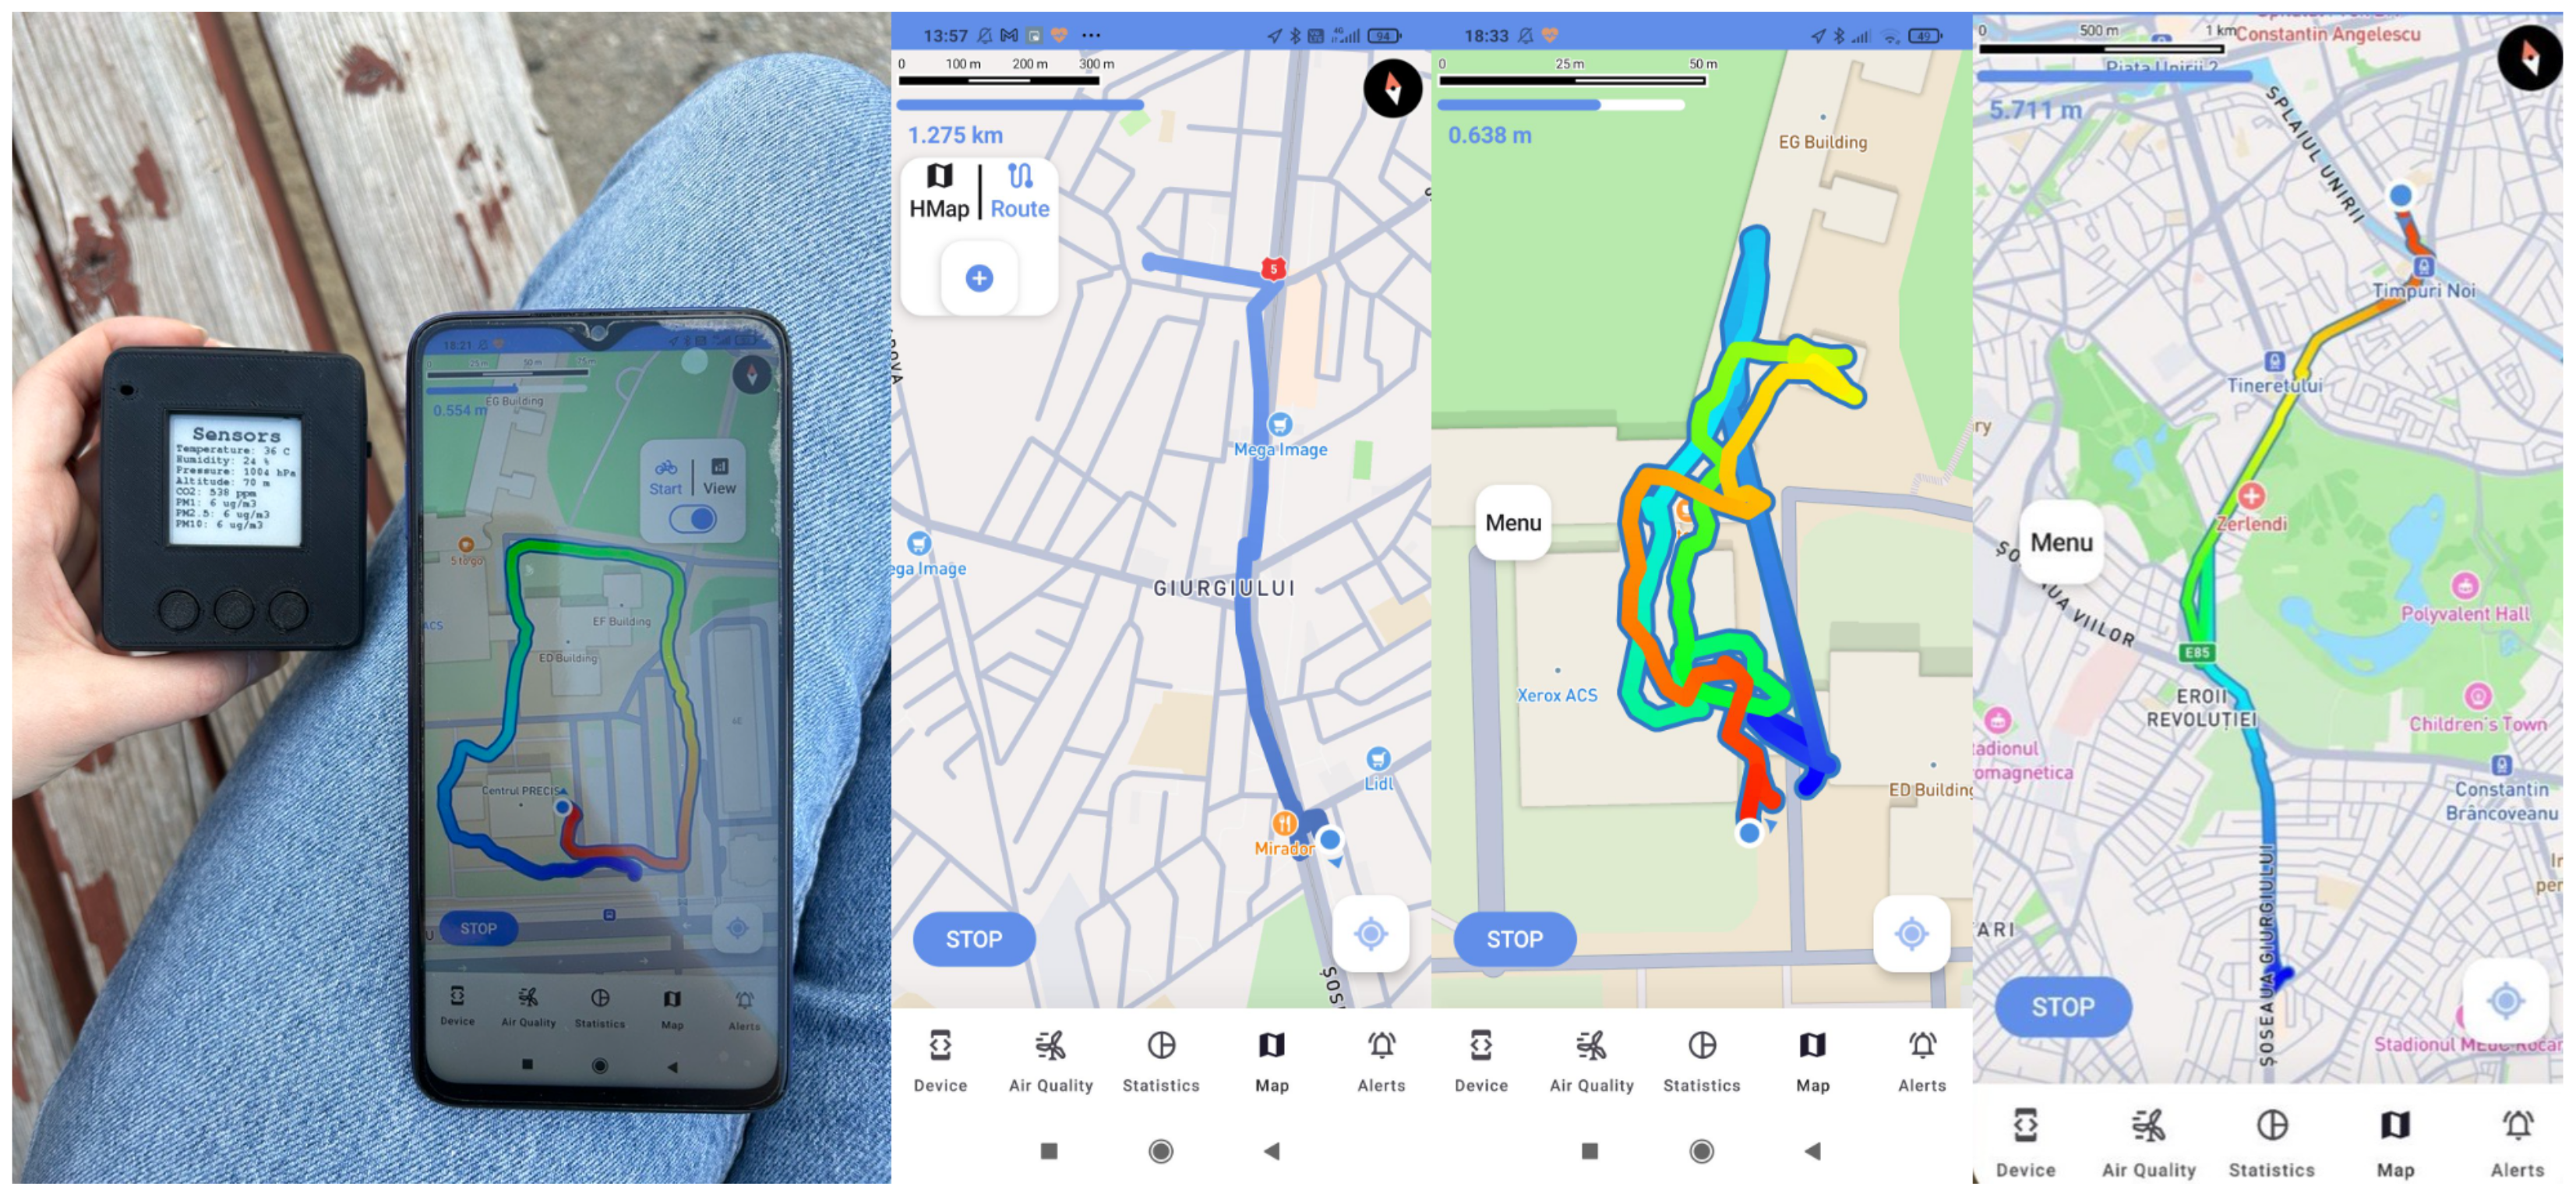
- Hardware device: A portable and energy efficient hardware device from scratch. It is small in size, attachable to bicycles and equipped with multiple sensors for air quality measurements. The device plays an essential role, as the only real time raw data source, which builds the foundation for further functionalities of the system.
- Data Pipeline: A Cloud-based pipeline for data processing. The real-time data from the previously mentioned device is further collected by the mobile application, then forwarded through an Application Programming Interface (API) to the Cloud-based system. The pipeline is responsible for data aggregation, analysis, storage, and dynamic map generation.
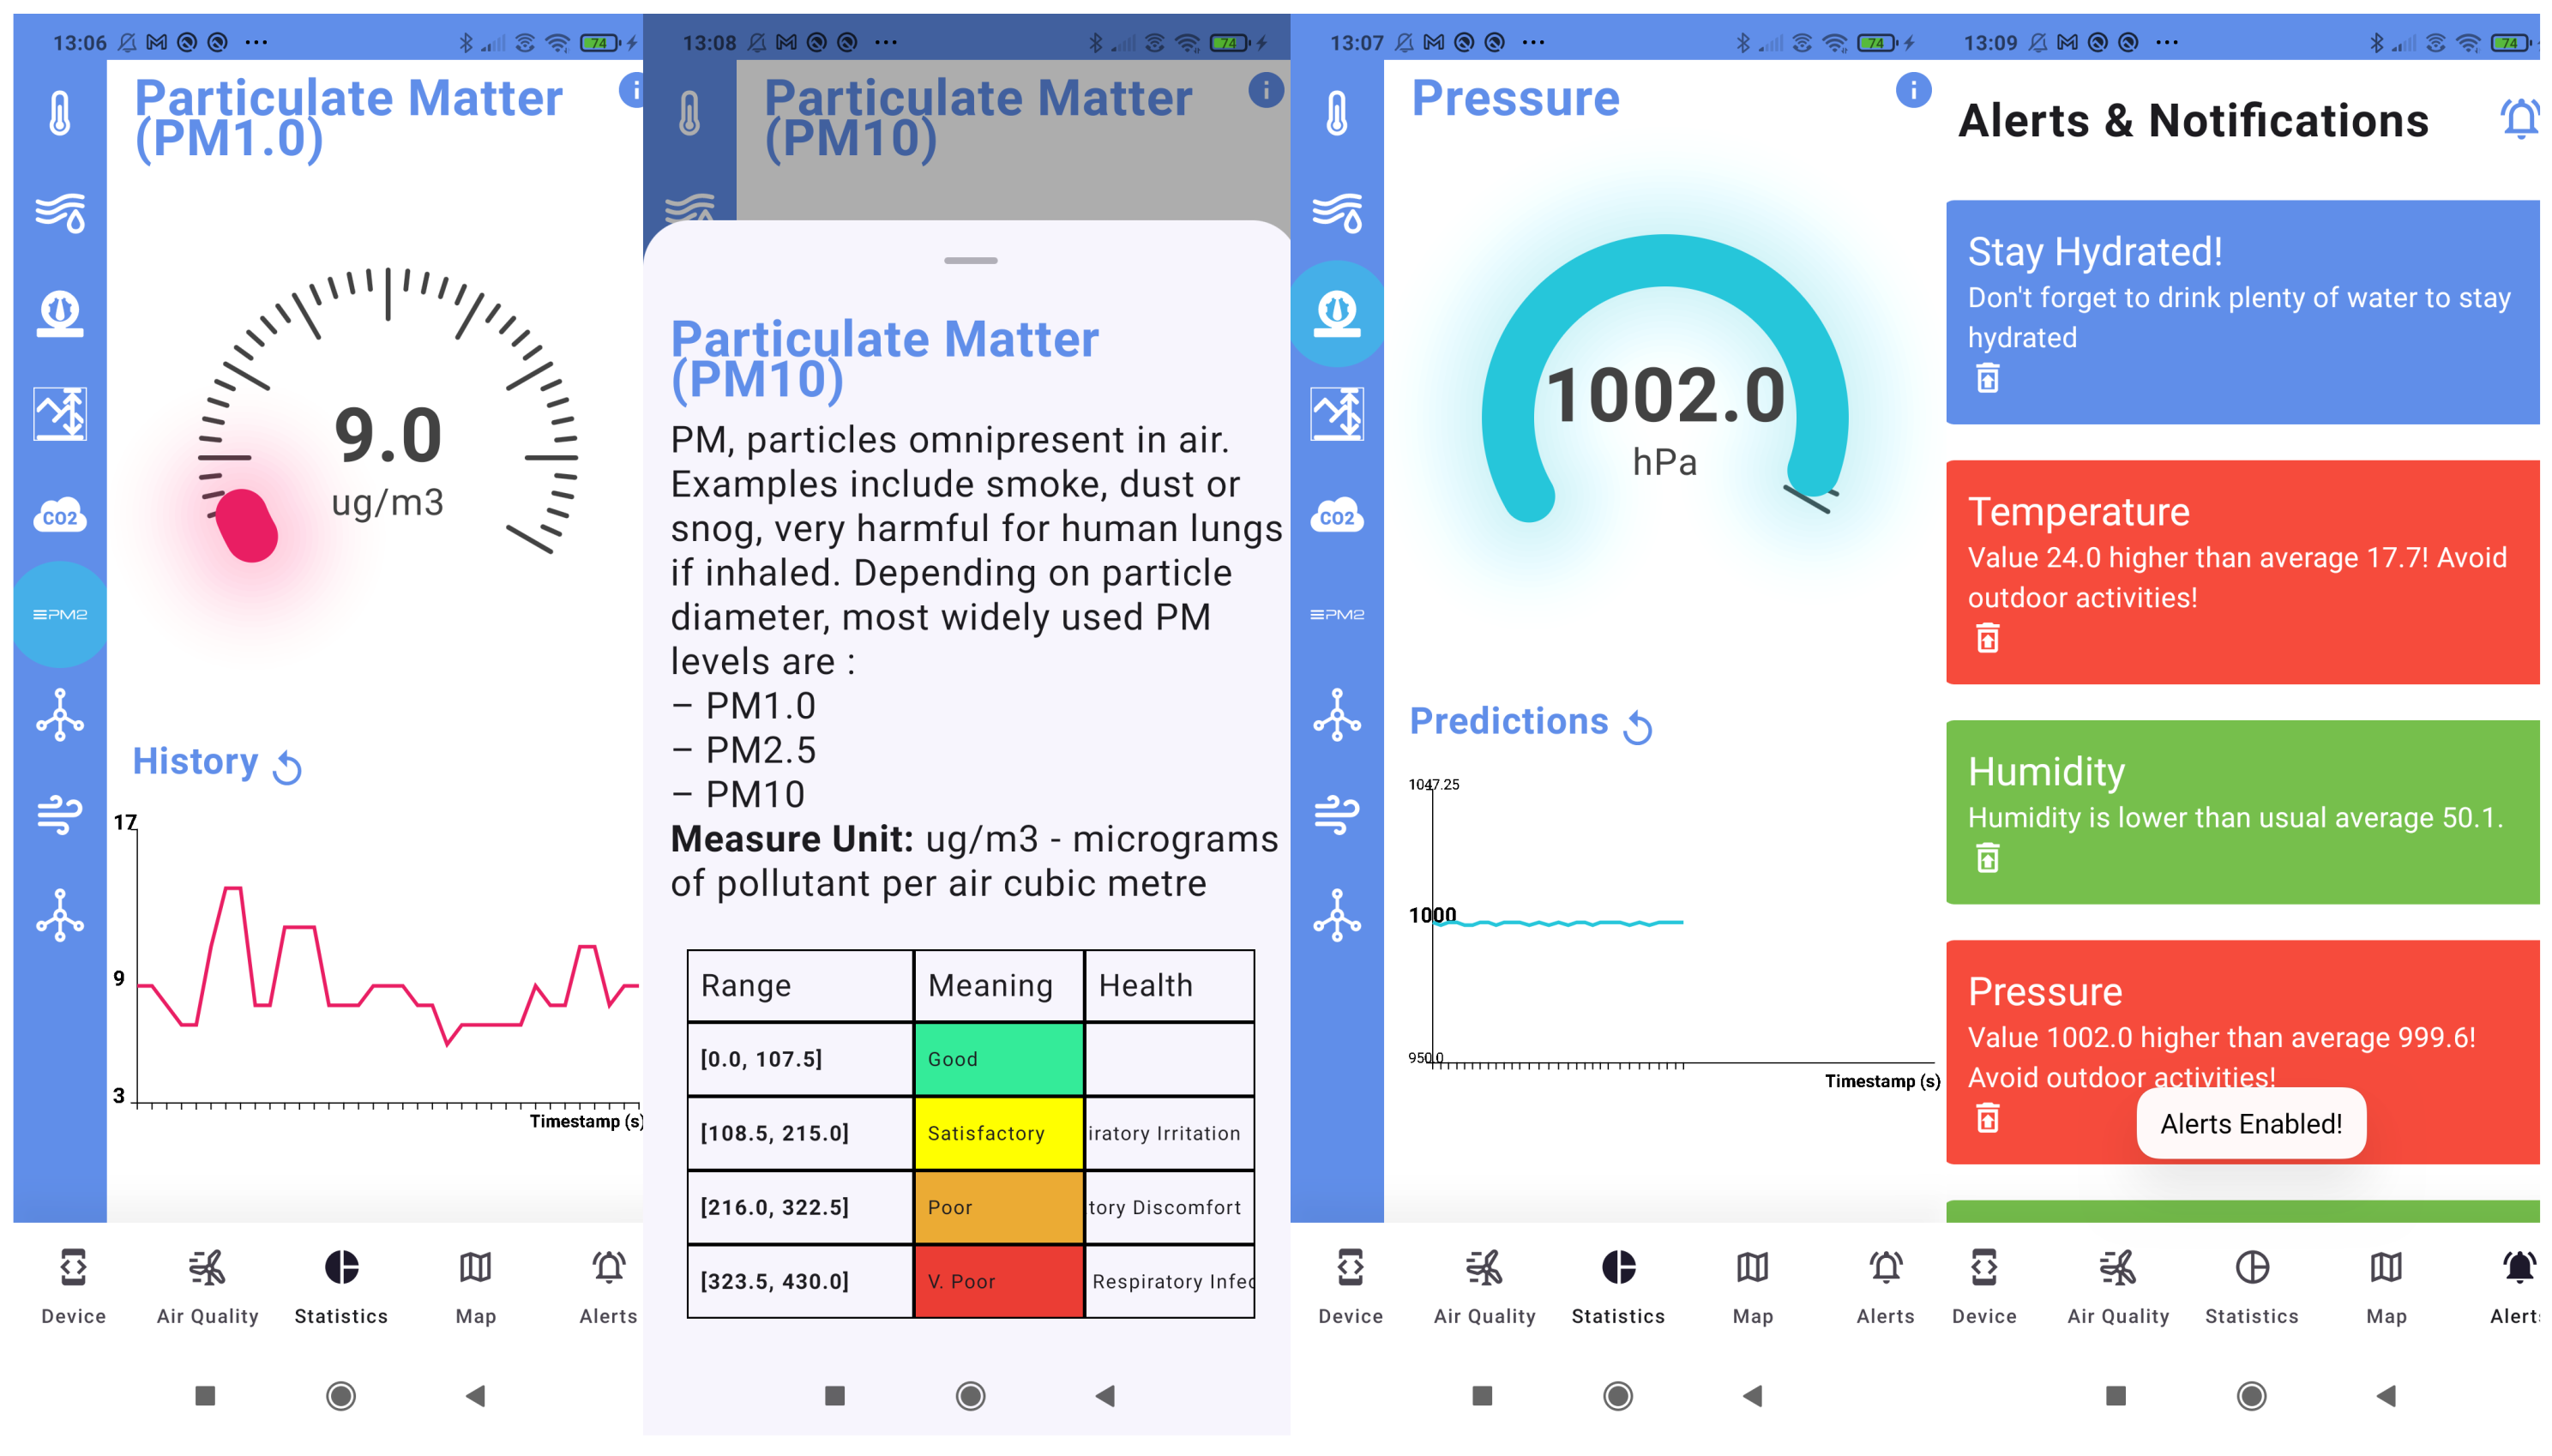
- Mobile Application: An user-friendly, energy-efficient mobile application, focusing on data visualization. It renders real-time sensor data and historical charts, but also displays dynamic maps and alerts. It also provides secure and fast communication with both endpoint peers: the hardware device and the pipeline API.
1.4. Key Research Gaps
- Spatial Coverage: Fixed air quality monitoring stations are sparse and cannot capture localized pollution hotspots. By attaching devices to bicycles, data can be collected across a wide range of locations, including narrow streets and residential areas. This fills the gap in spatial coverage and provides a more detailed understanding of air quality variations within a large city.
- Lack of Compact and Wearable Air Quality Monitoring Devices: Existing solutions like are either too large or lack the compactness required for easy wearability and portability. CityAirQ achieves an ultra-compact design through a custom PCB and optimized sensor placement, making it one of the smallest devices with comparable functionality.
- High Power Consumption in Existing Devices: Many commercial devices prioritize real-time sensing but suffer from high power consumption, leading to shorter battery life. CityAirQ implements selective sensor activation and duty cycling, reducing average power consumption by 30% and enabling extended battery life without compromising data reliability.
- High Cost of Existing Solutions: Similar commercial devices are expensive, limiting their accessibility to a broader audience. CityAirQ achieves a significantly lower cost (86) by carefully selecting and integrating cost-effective sensors without compromising functionality, making it more accessible.
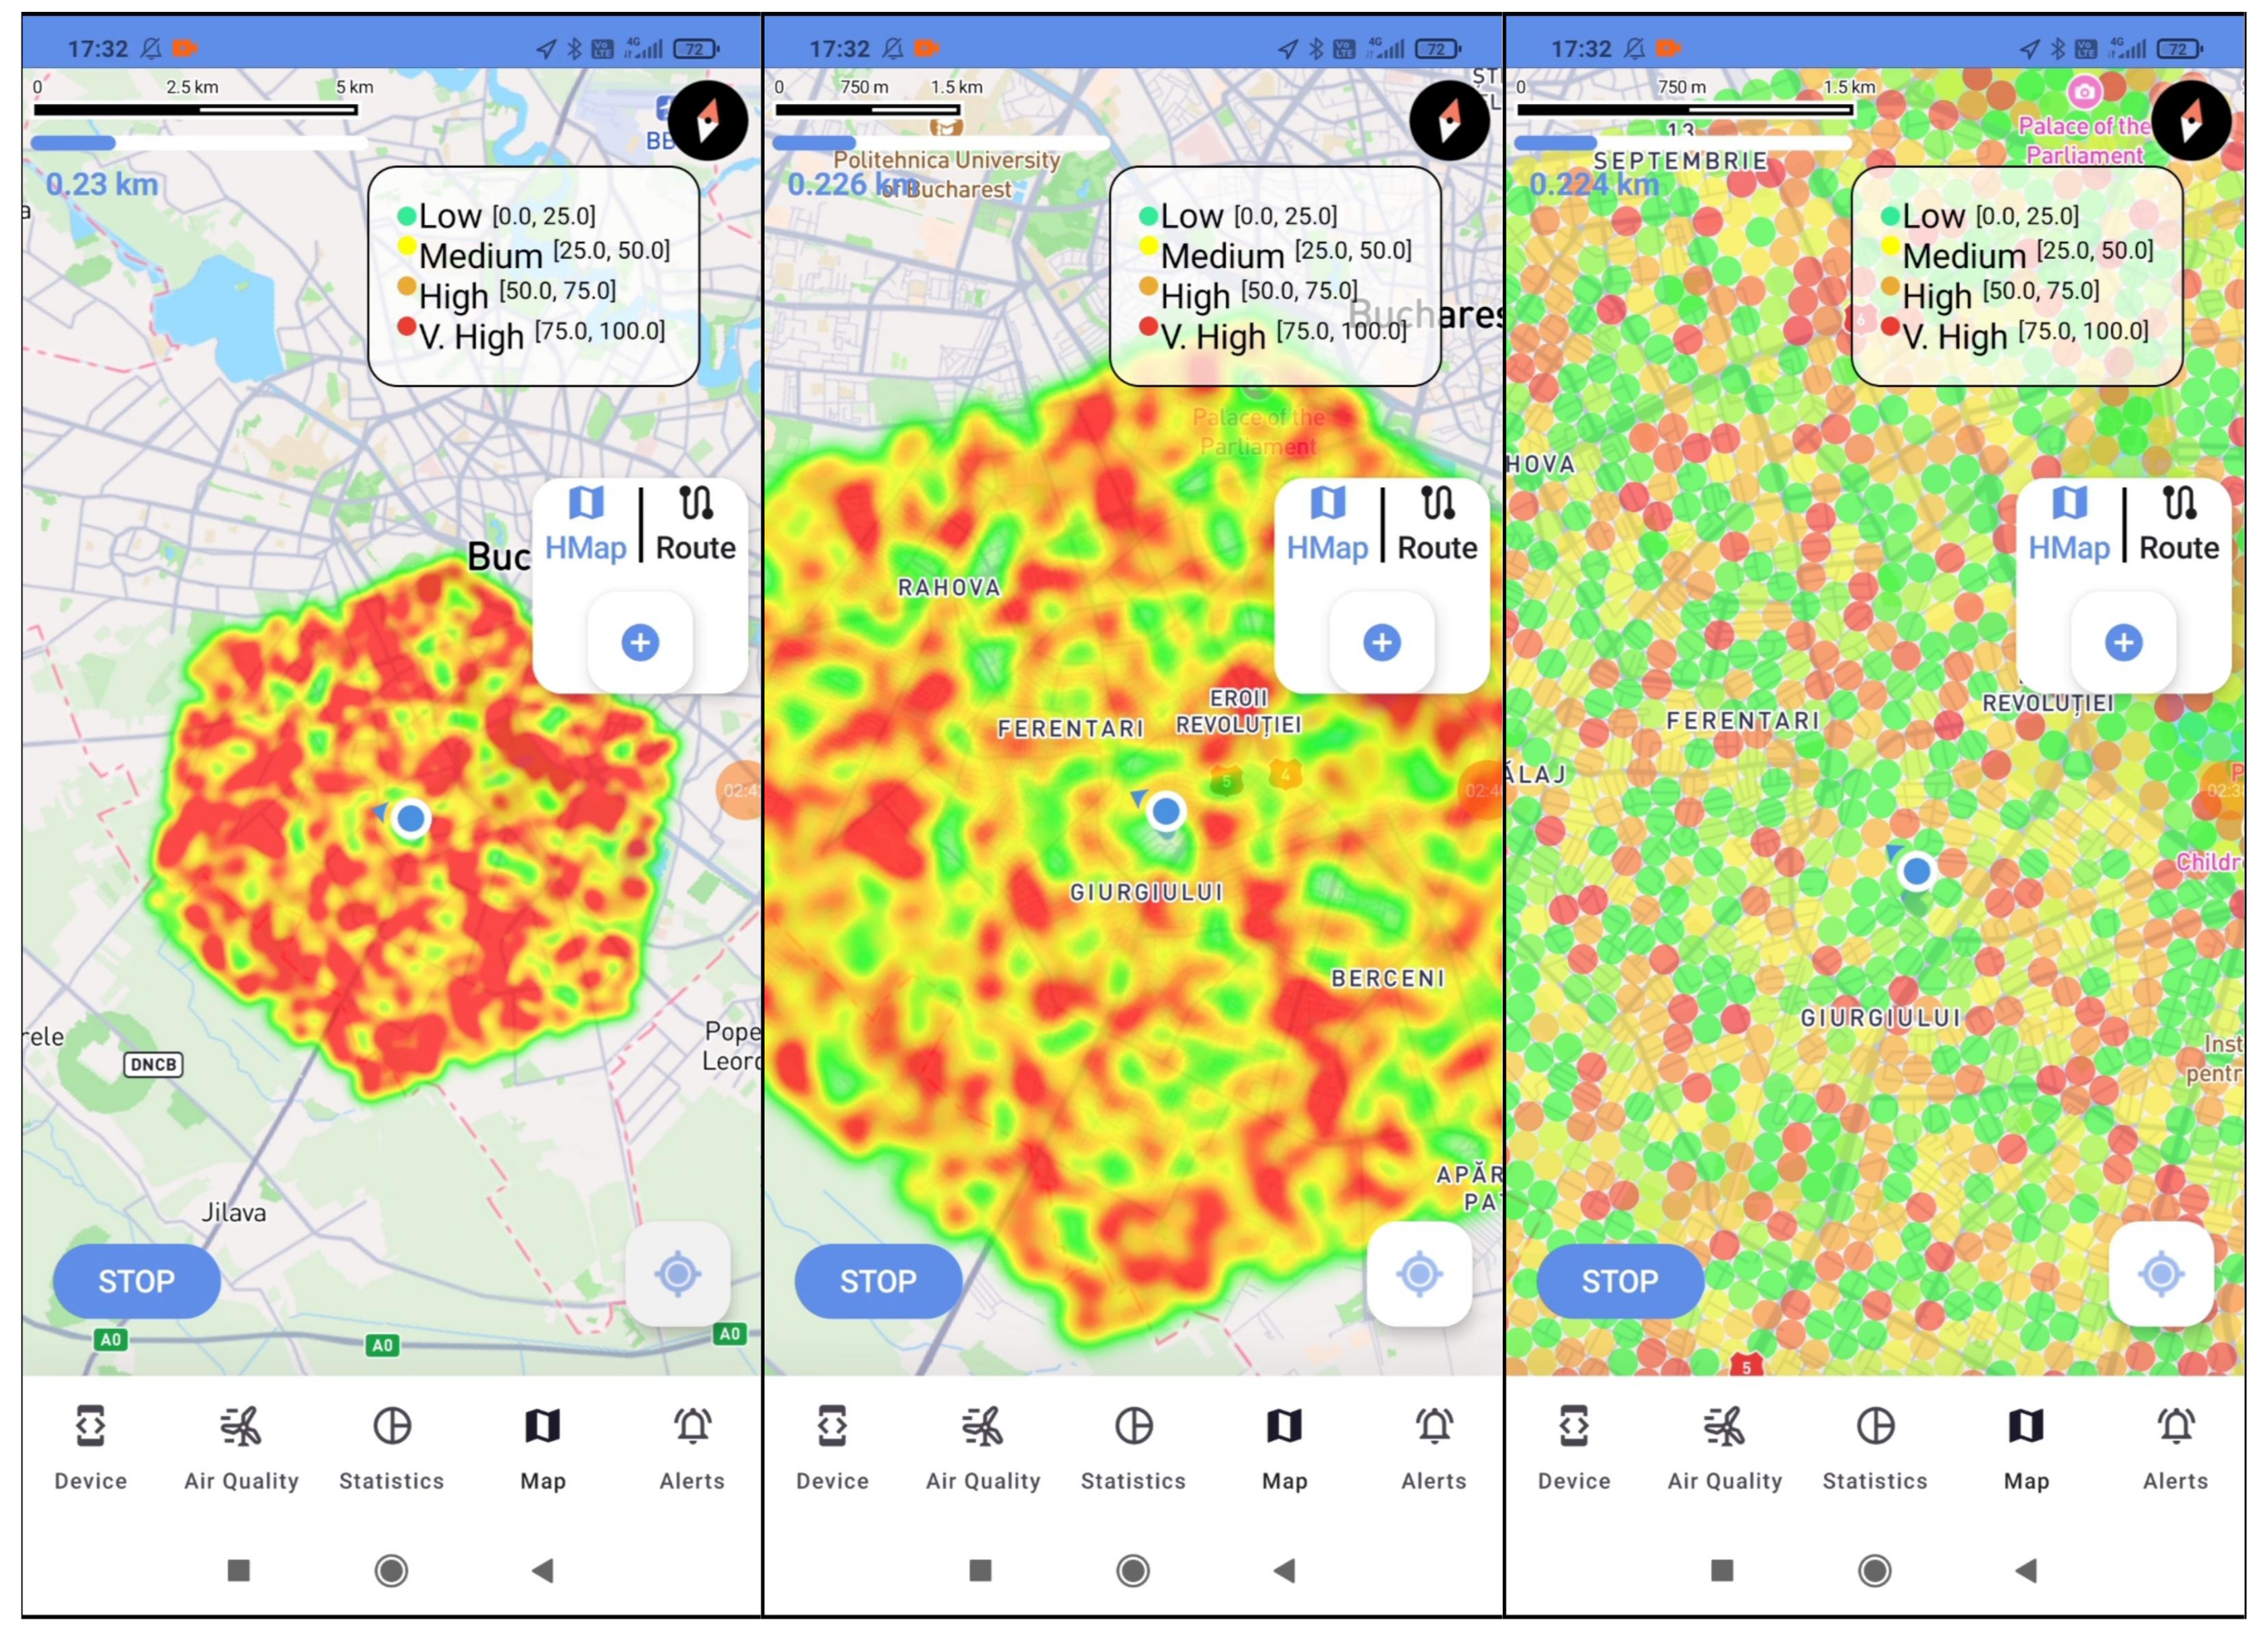
- Limited Mobile Integration and Dynamic Mapping: Some existing solutions lack dedicated mobile applications, while others rely on web-based dashboards, limiting real-time accessibility and user engagement. CityAirQ integrates real-time data visualization through a dedicated mobile application, offering interactive dynamic pollution maps, which provide insights into personal exposure and dynamic pollution patterns.
1.5. Urban Sustainability
1.6. Paper Structure
2. State of the Art
2.1. Industry Standards
2.2. Similar Projects
2.2.1. AirGradient
2.2.2. uRADMonitor
2.2.3. Sodaq Air
- Sodaq Air only keeps track of the PM pollutants, which is not sufficient for assessing a broader and more comprehensive pollution level tracking system
- It targets simplicity in being used as a semi-passive device, but it lacks on giving users detailed levels of the tracked air pollution and does not allow user interactions
- The service does not offer a mobile application and results can only be seen through accessing a web server [16], which diminishes mobility and accessibility
2.2.4. Airly
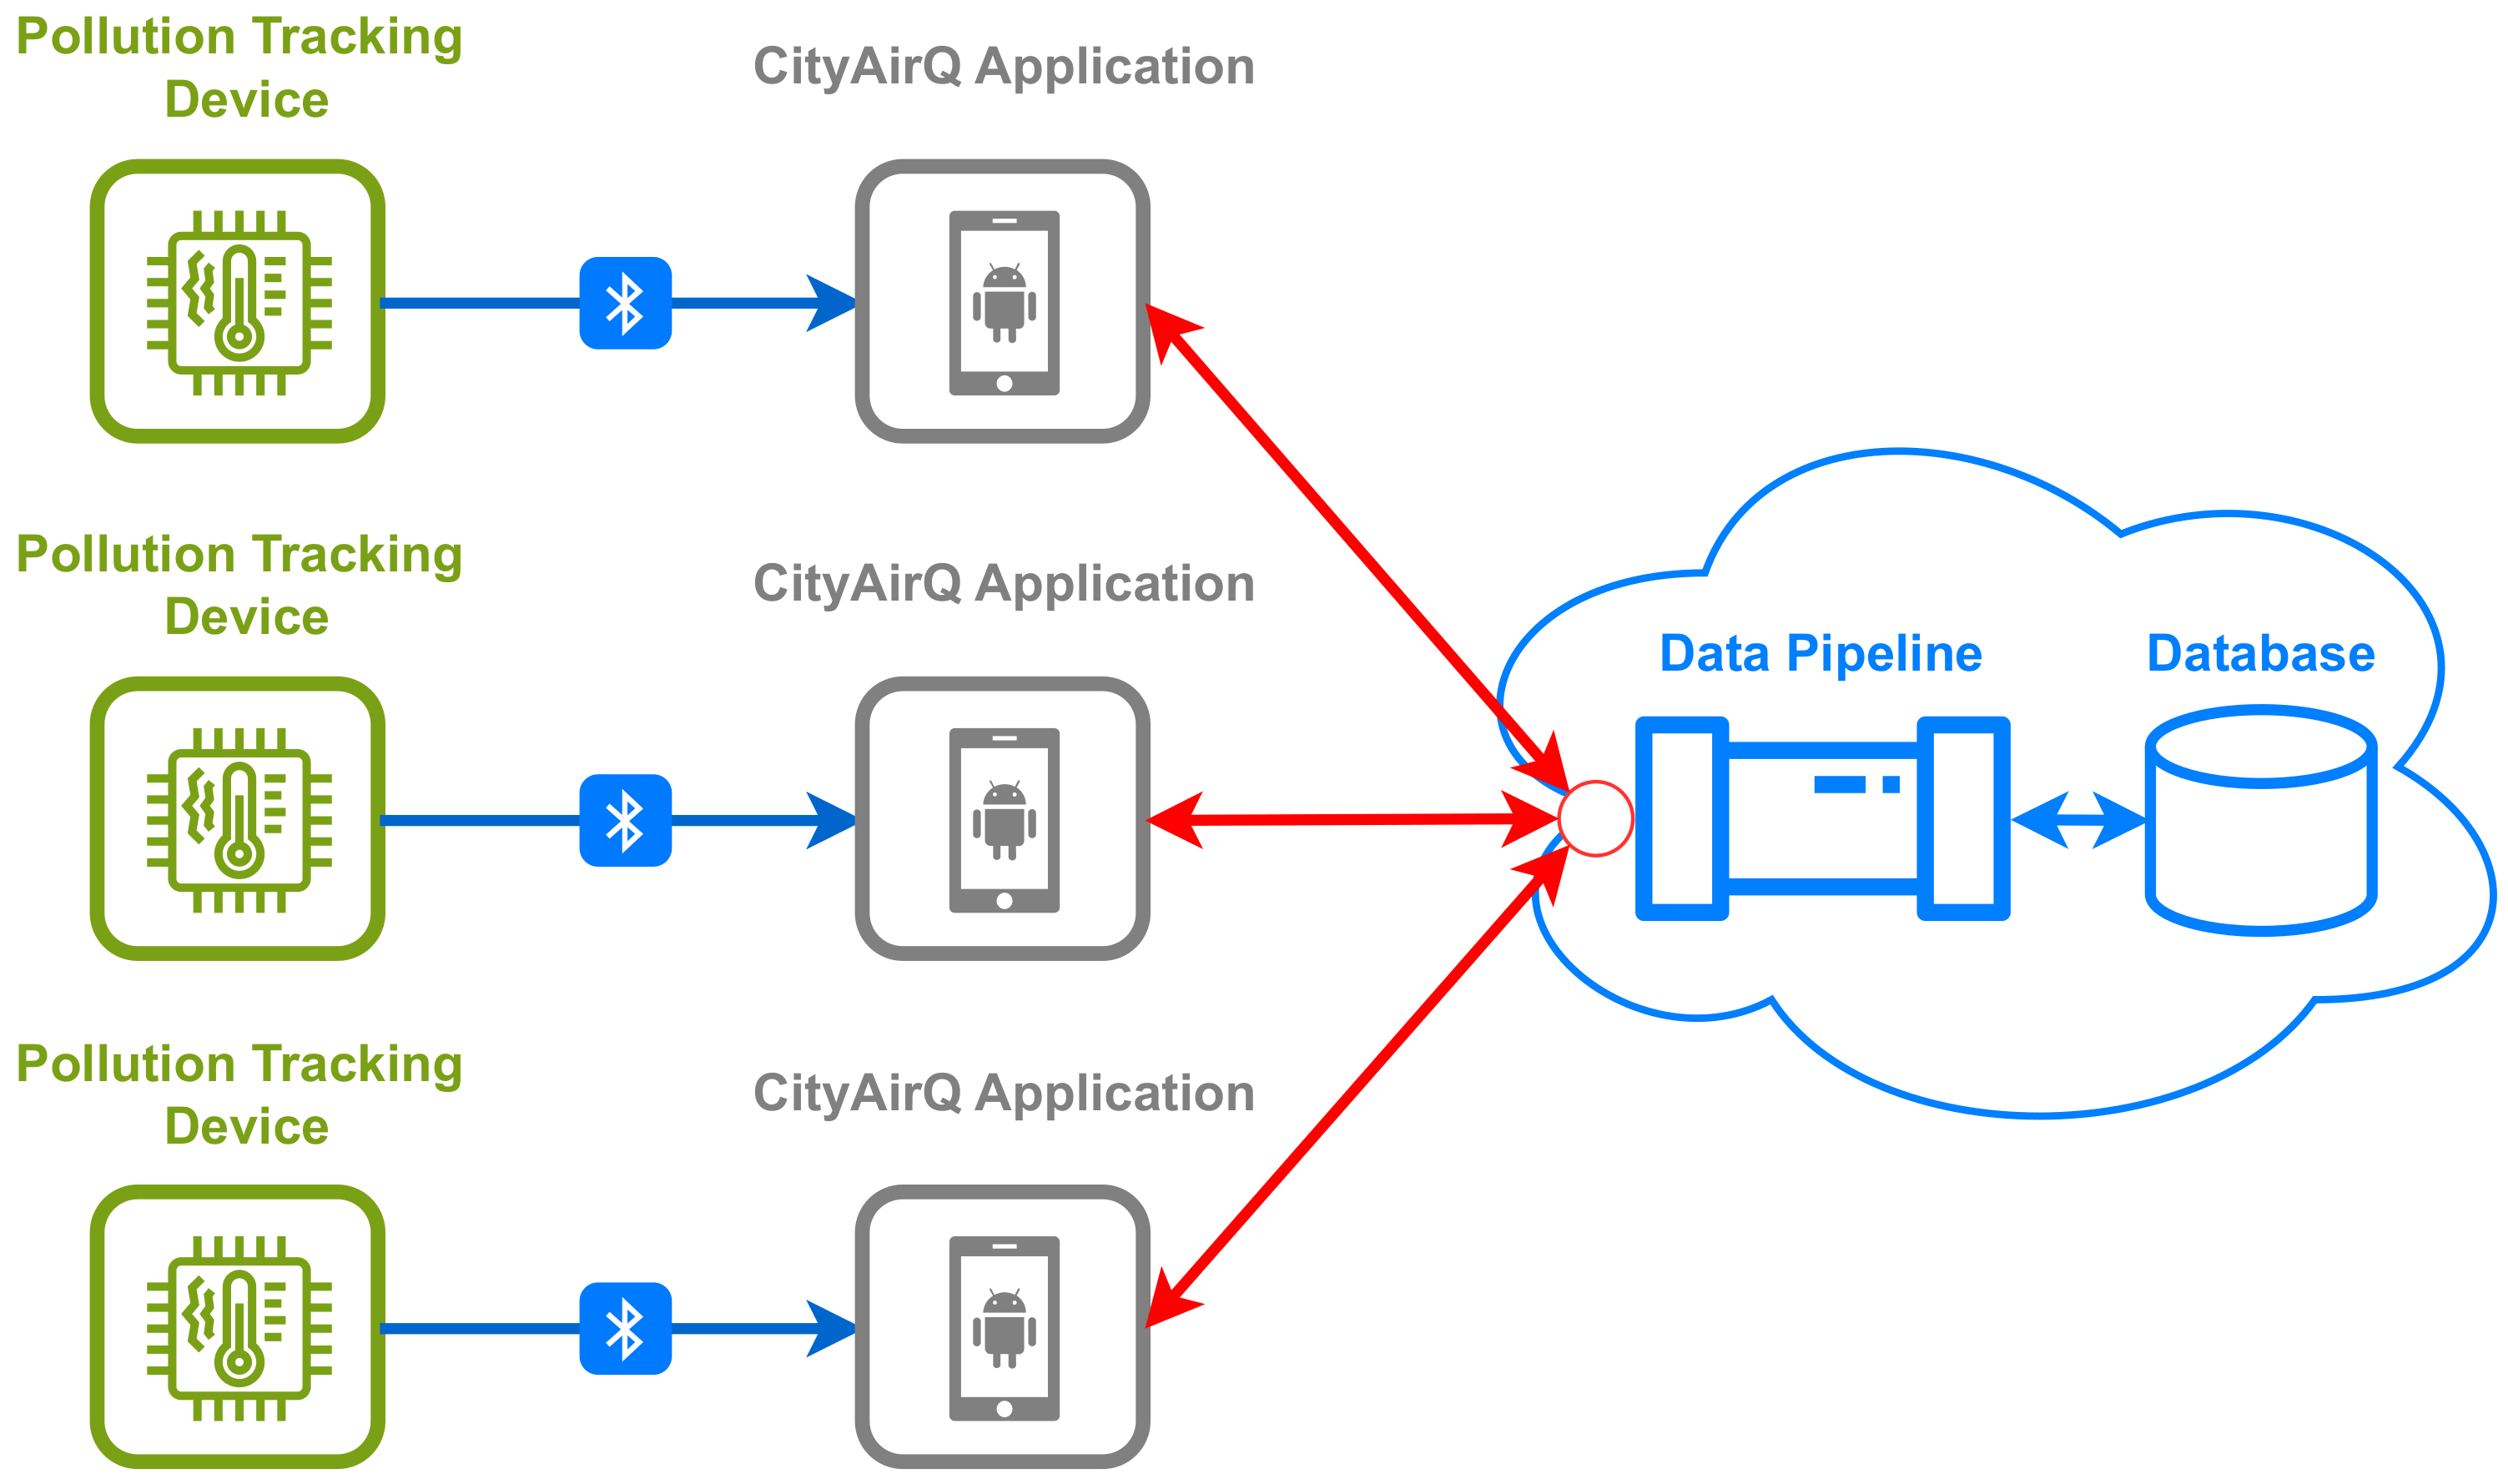
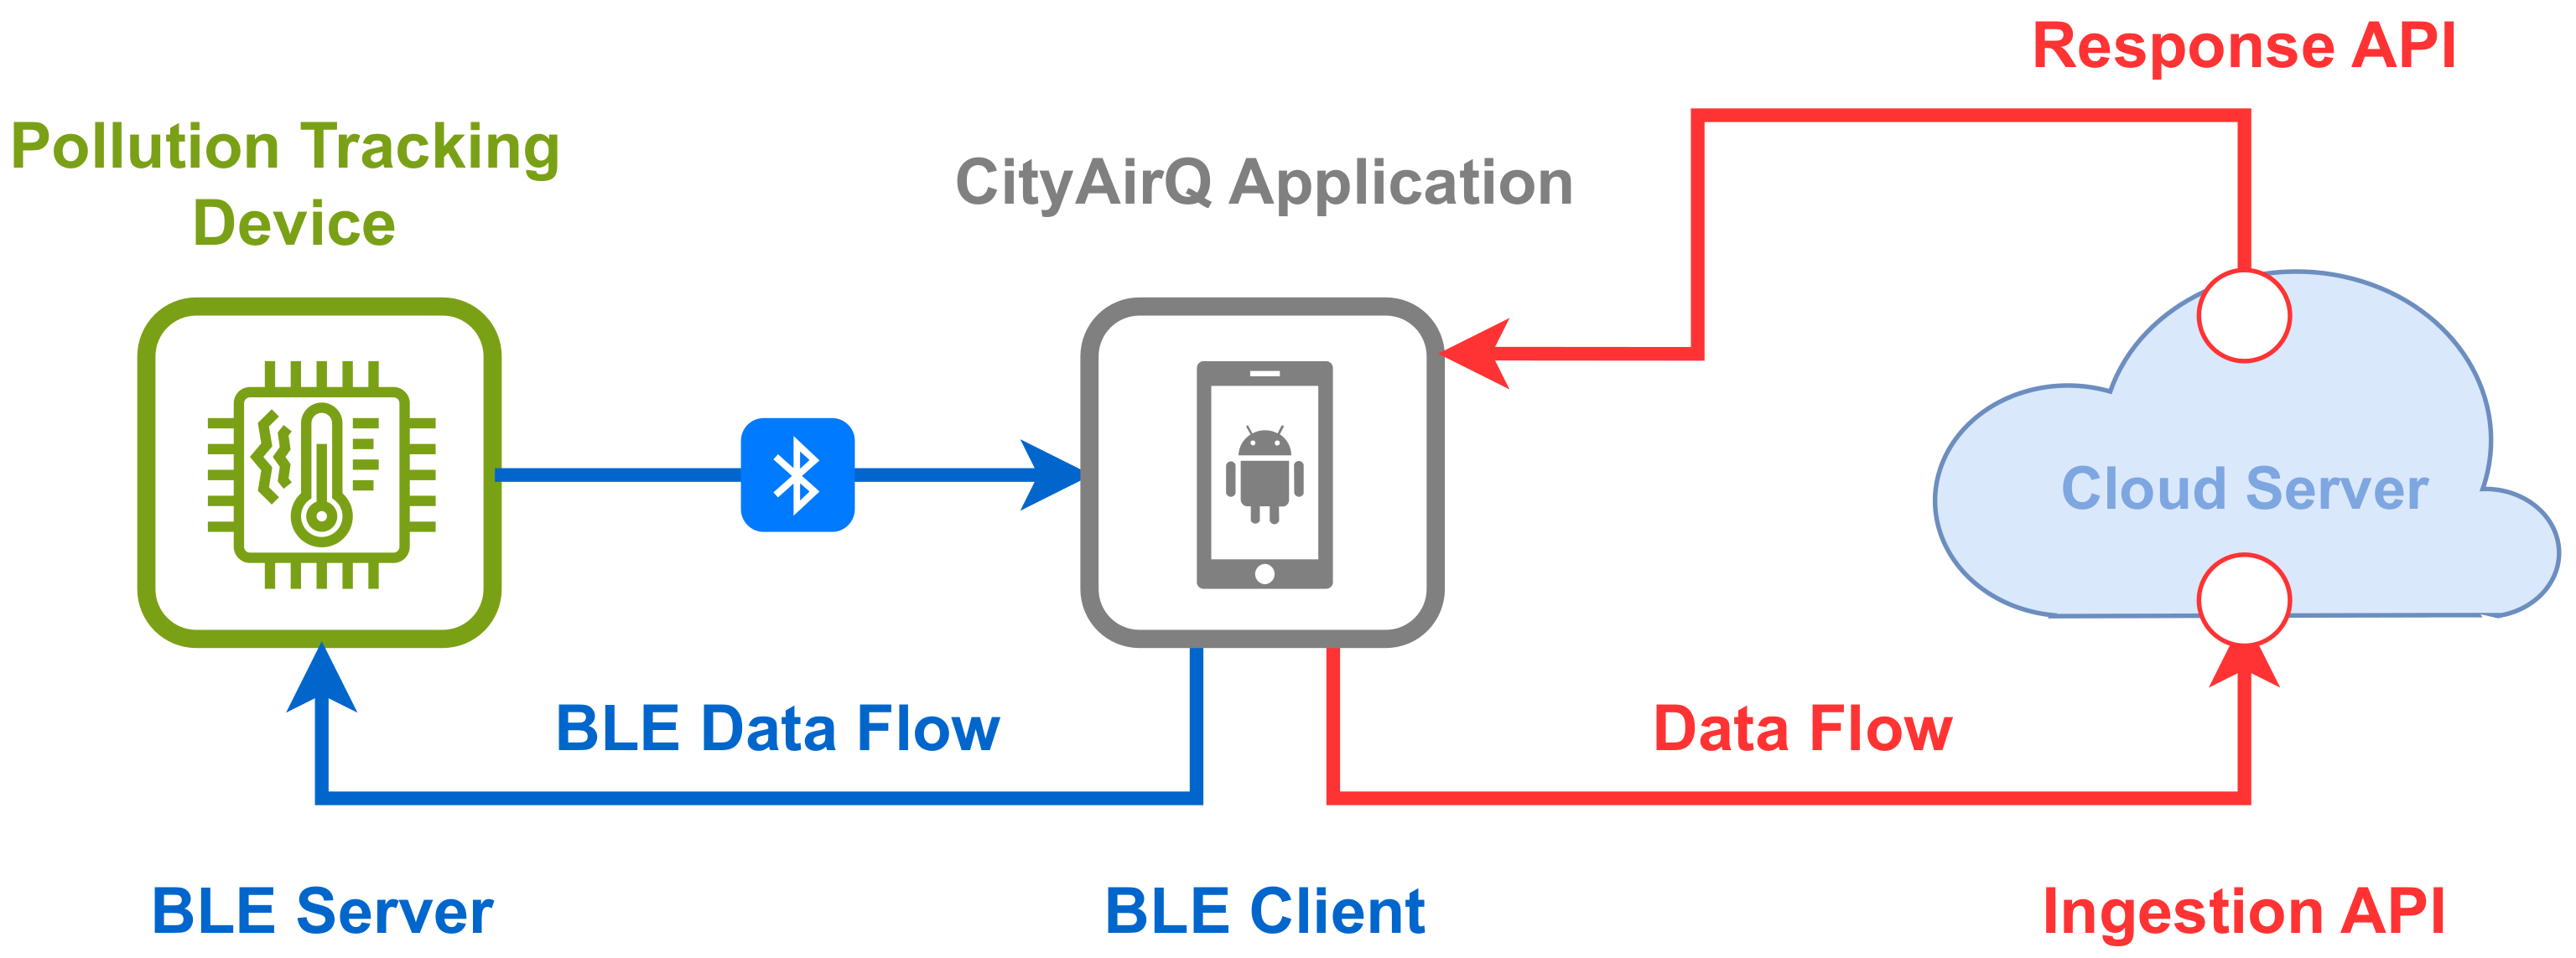
3. General Architecture
- Pollution Tracking Devices are ESP32-based portable devices equipped with various air monitoring and environmental sensors, inside an enclosure with special brackets for mounting on bicycles. ESP32 offers Bluetooth Low Energy (BLE) [17] for persistent communication with the mobile application, allowing the transmission of real-time and historical sensor readings. Historical data is stored locally on the SD card prior to transmission.
- The Mobile Application plays a critical role in the system, facilitating data transfer between components. It also provides data visualization, including real-time data, charts, warnings, and interactive maps. The application acts as a central hub which receives pollution indicators values from the tracking devices and renders the processed results from the cloud system.
- A Cloud-based Data Pipeline features a custom API architecture, which enables seamless data transmission from the application to the cloud. After data ingestion, the system utilizes a queue structure to initiate storage and processing. Once the data is processed, it is fed back to the mobile application to render dynamic maps in real-time.
4. Pollution Tracking Device
4.1. Hardware Architecture
- BME 680: this gas sensor is capable of measuring humidity, barometric pressure, temperature and volatile organic compounds (VOCs). It operates with exceptionally low power consumption, requiring only 3.7 A for humidity, pressure, and temperature measurements, and up to 12 mA when also assessing the gas parameter. This sensor was selected for its multi-functional capabilities, replacing separate dedicated sensors for each parameter, thus reducing component count and overall cost.
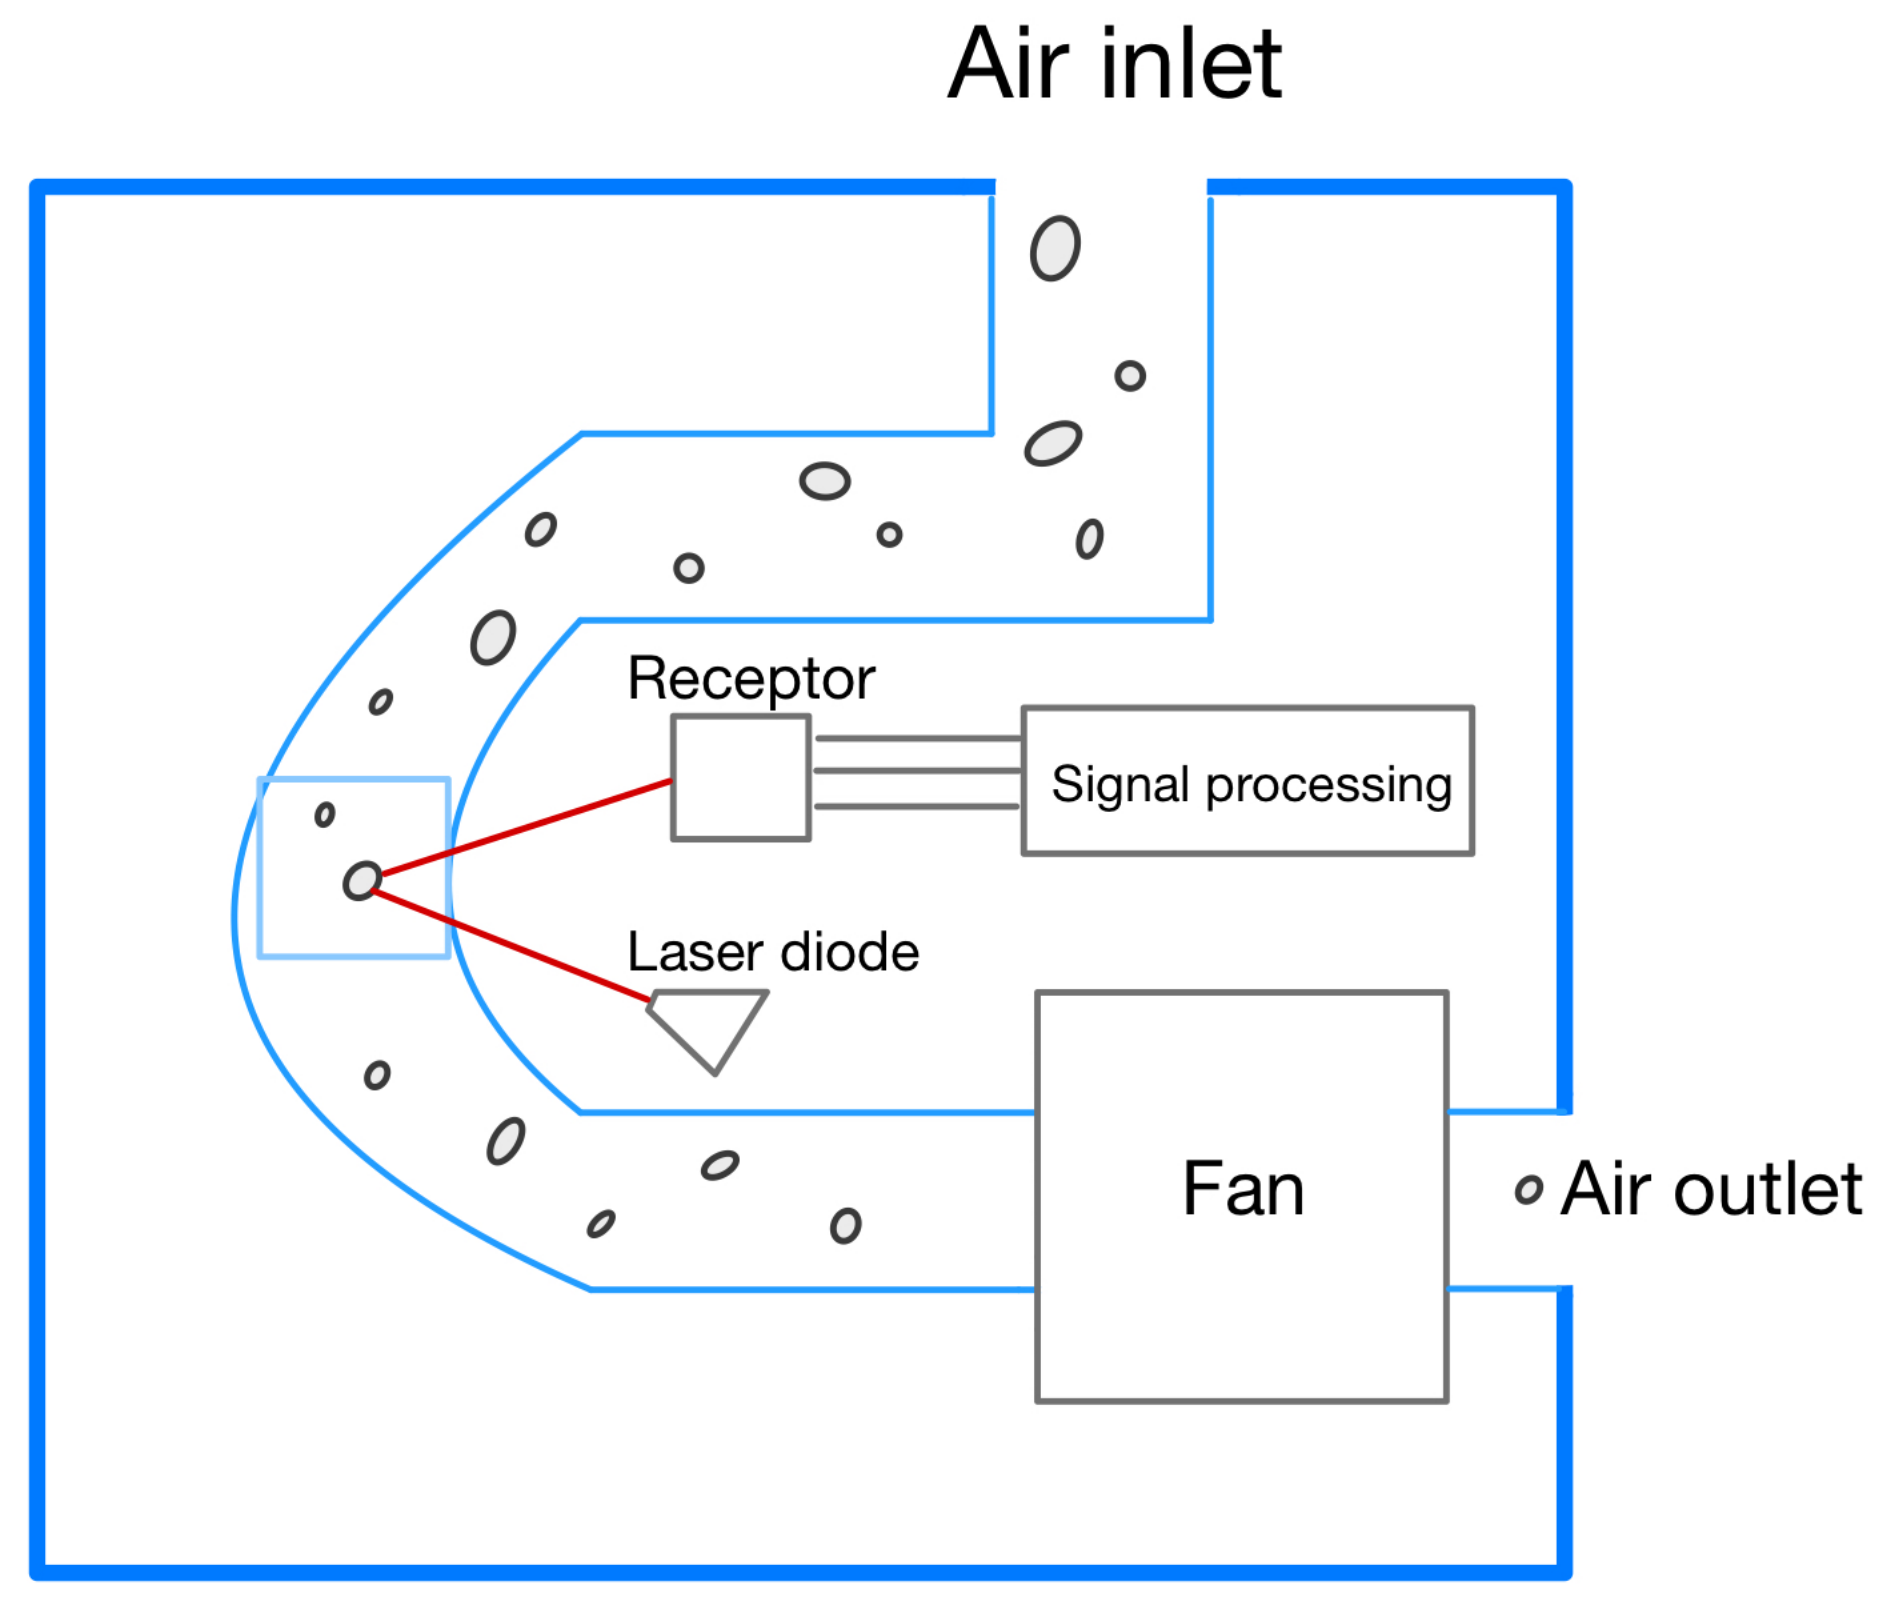
- PMSA003: this particulate matter sensor operates with a power consumption of up to 100 mA in active mode. The majority of its power consumption is attributed to the internal fan, which must run continuously to ensure adequate airflow within the measurement chamber. We opted for this choice due to its compact size, laser-based accuracy, and low power consumption, outperforming bulkier alternatives like the PMS5003T (used in AirGradient), which, while reliable, was significantly larger and consumed more power.
- MH-Z19B: this CO2 sensor is built with the modern non-dispersive infrared (NDIR) technology. It has an average power consumption of 60 mA, with peak demands reaching up to 150 mA. For accurate measurements, the sensor requires a preheating phase of 3 min. It was chosen over older metal oxide semiconductor (MOS) sensors, which are more sensitive to environmental conditions like temperature and humidity.
- ESP32 S3: this microprocessor is responsible for controlling and handling sensor data acquisition, coordinating BLE communication, and managing user input/output logic. It features a dual-core CPU operating at a frequency of 240 MHz, includes 45 GPIO pins, and is equipped with 512 KB of internal SRAM. It was preferred over STM32 and Raspberry Pi alternatives due to its BLE connectivity, low power consumption, and cost-effectiveness, making it ideal for mobile IoT applications.
- Other components used: E-Ink display, RV-3028-C7 (real-time clock - RTC), MCP73831 (battery charge management controller), XC6220A331MR (3.3V low-dropout voltage power source), TPS63060 (buck-boost converter), SD card module.
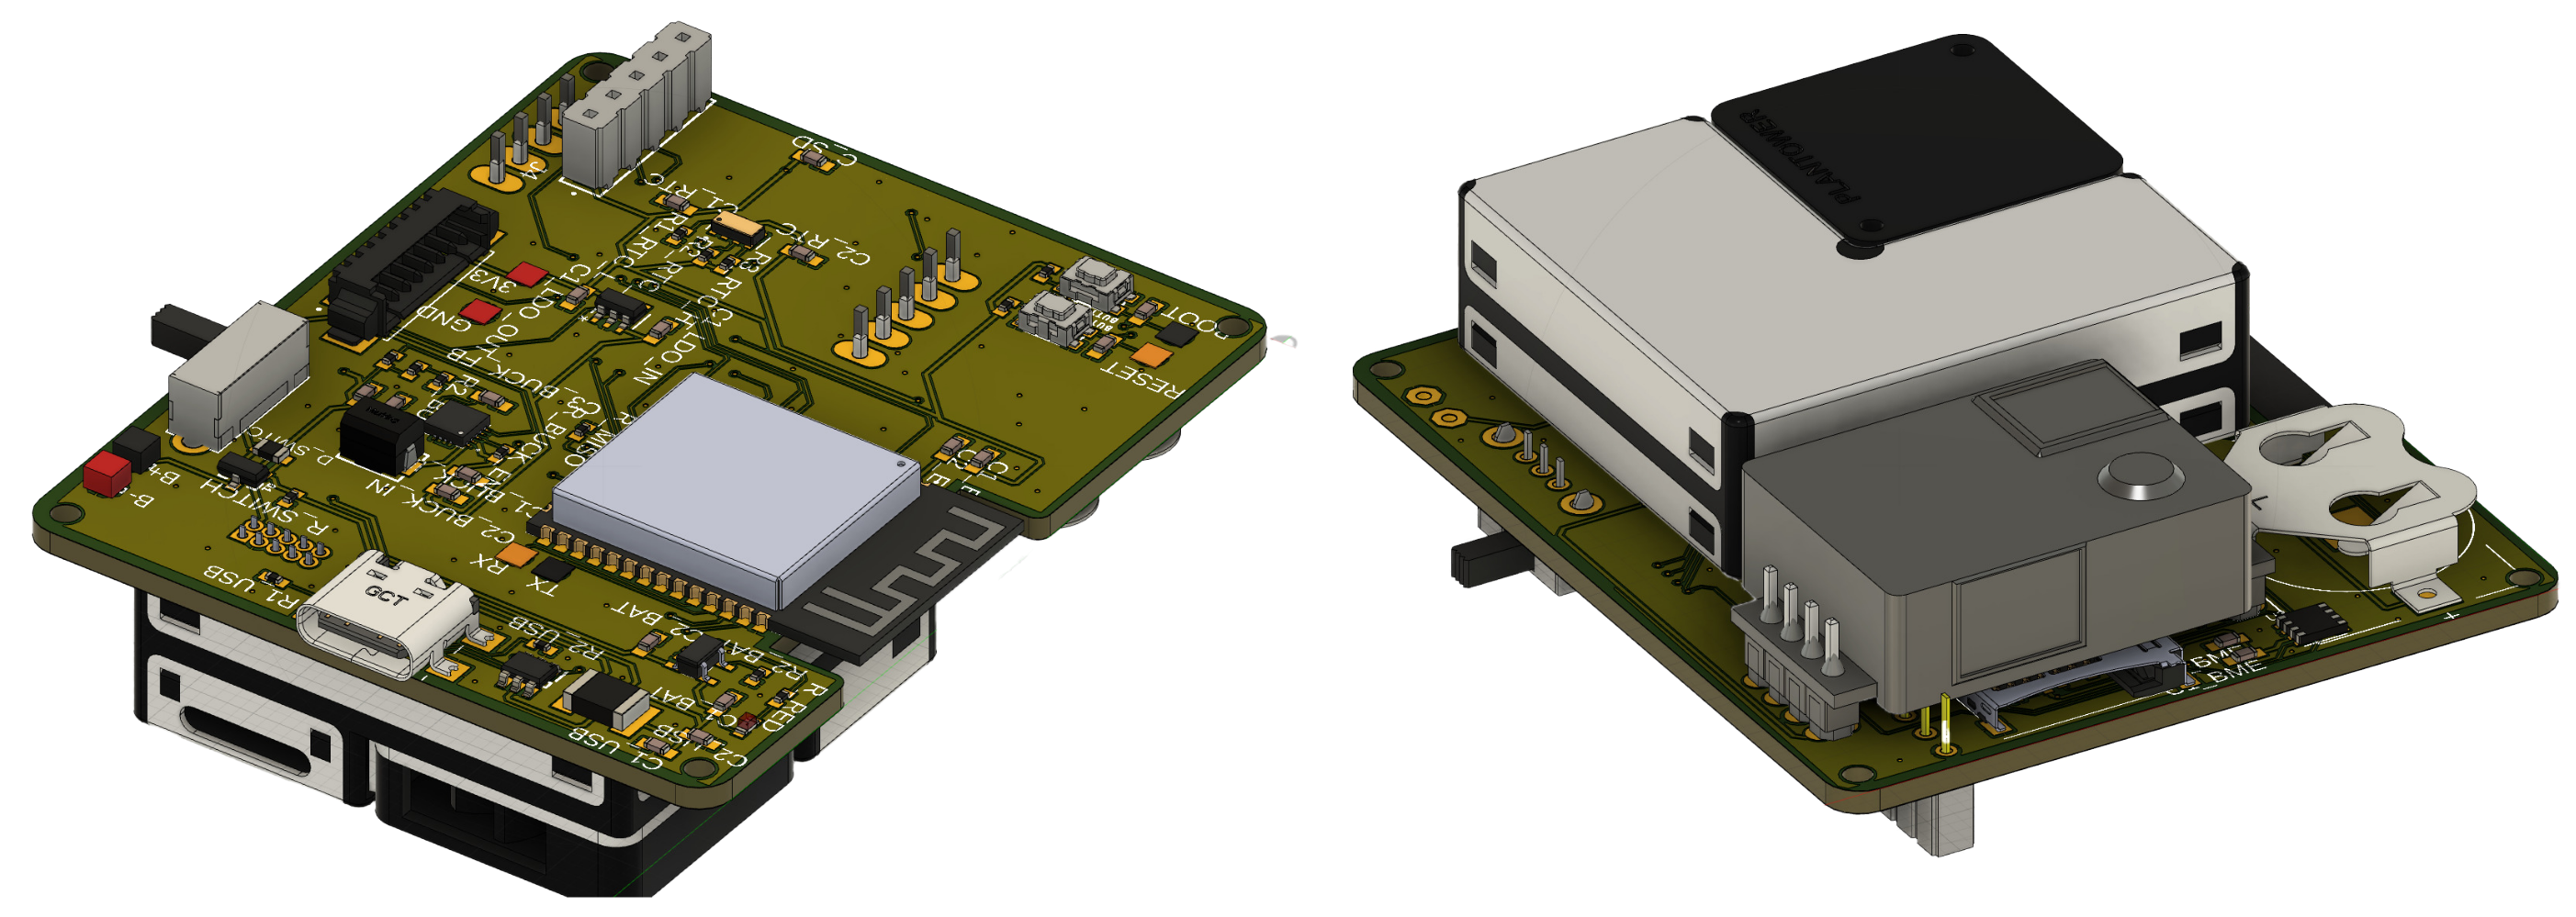
4.2. Hardware Implementation
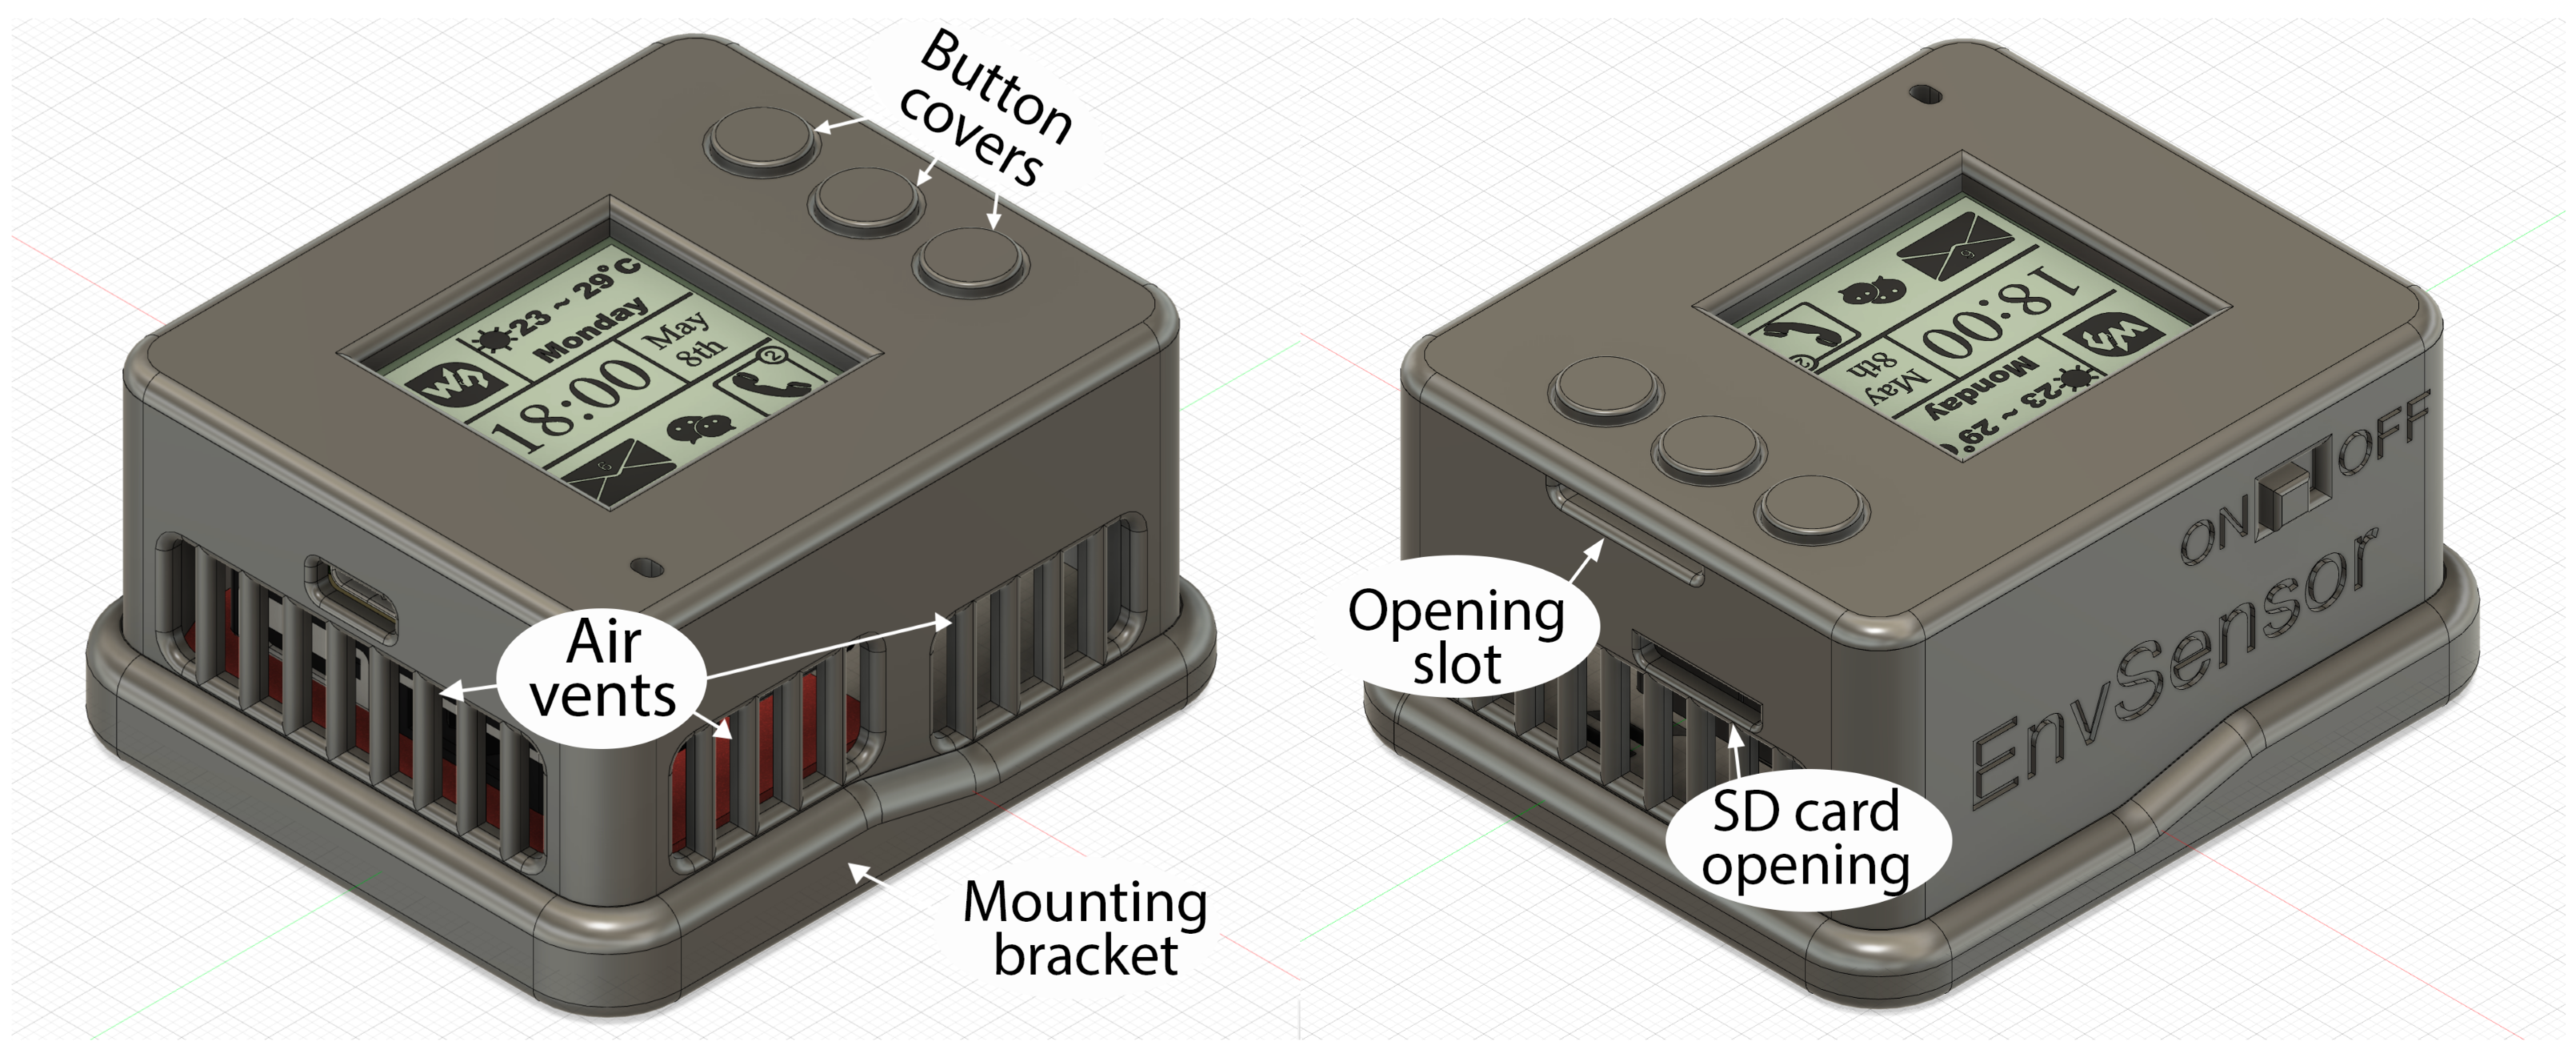
4.3. Enclosure Design
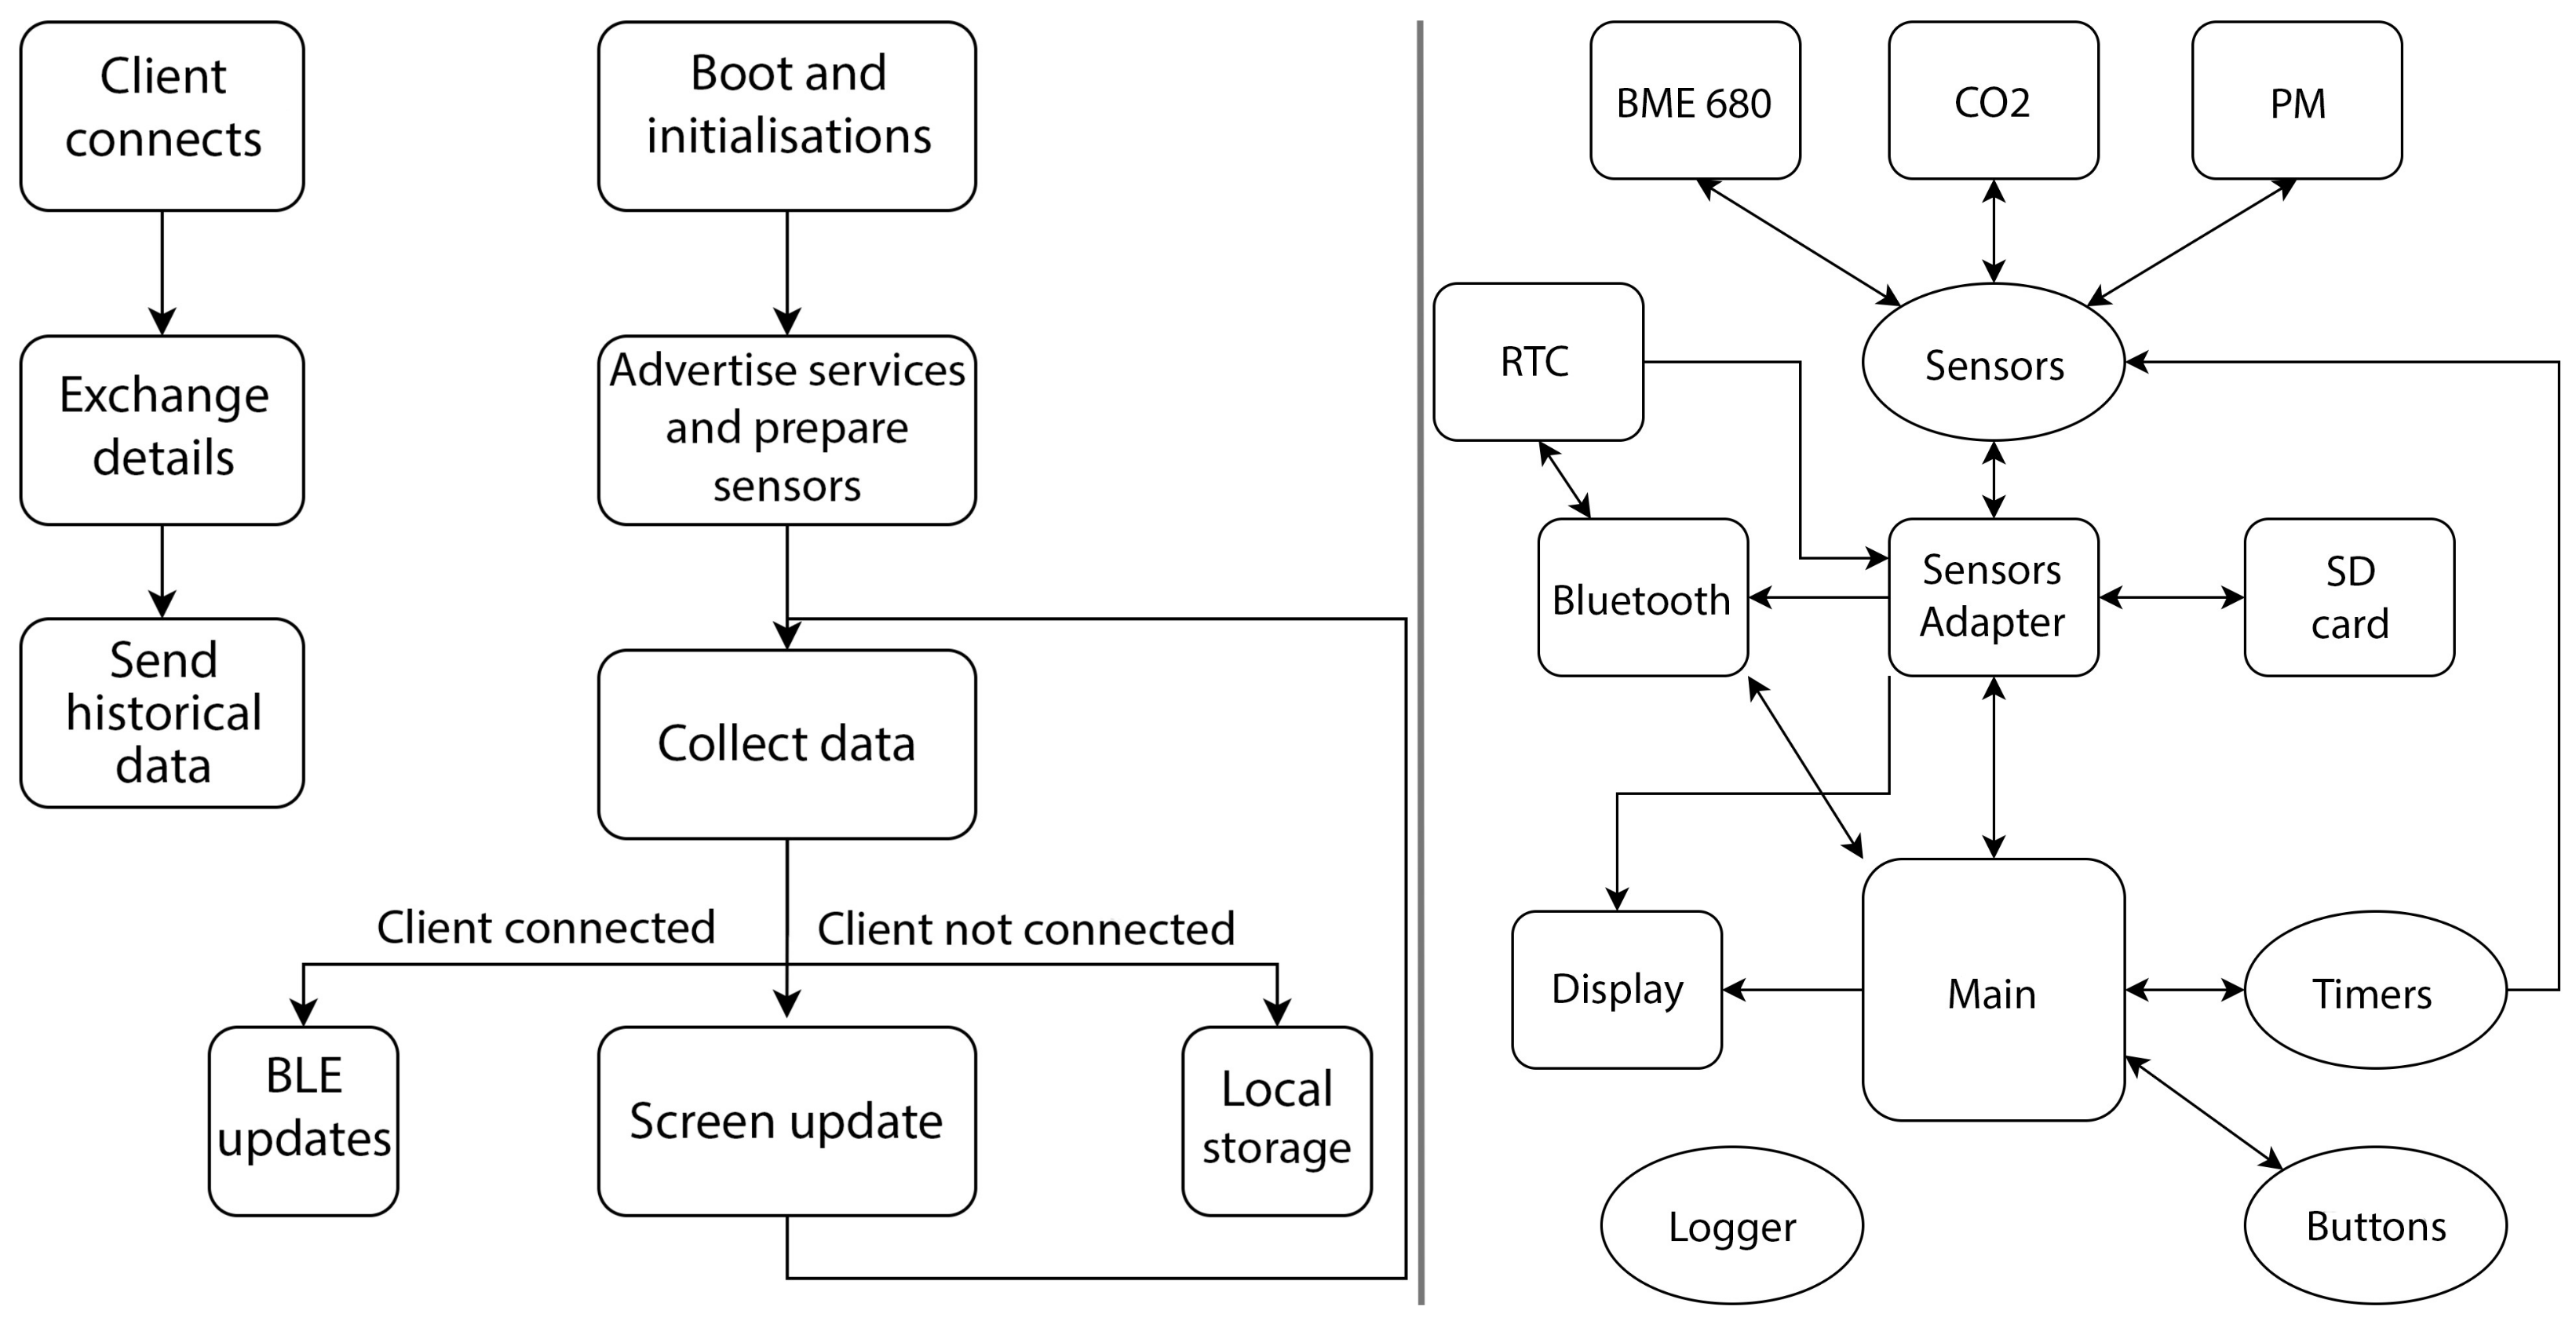
4.4. Software Architecture
4.5. Software Implementation
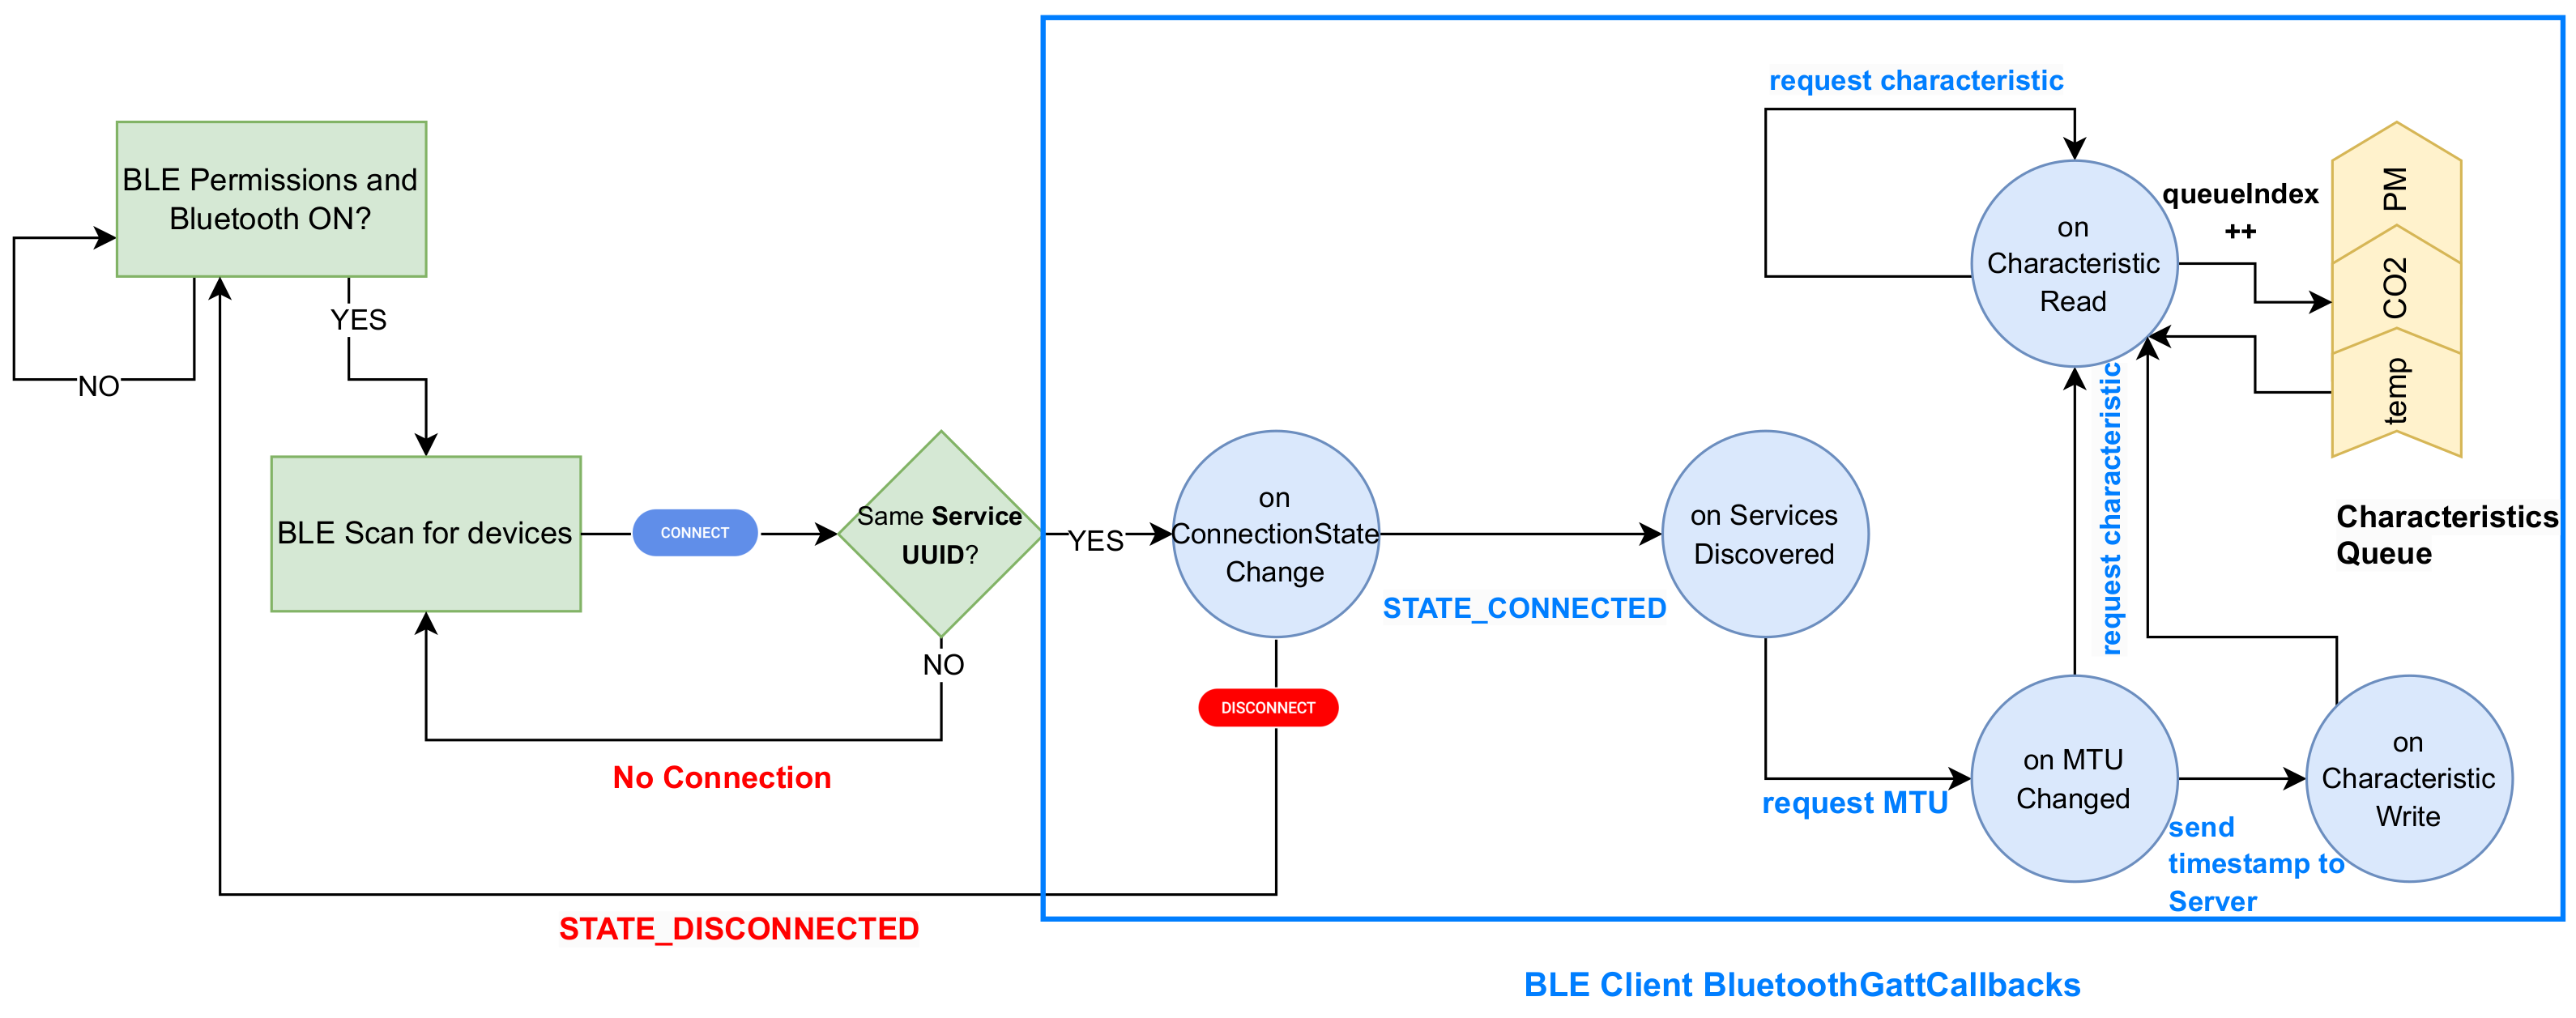
- BLE is enabled & client connected: the corresponding BLE characteristics are updated.
- No client is connected: data is saved on the SD card as a batch of historical data.
- Sensor Not Found Error: This error suggests a hardware connection issue (e.g., power failure) if the sensor cannot be detected prior to the initialization phase.
- Sensor Initialization Error: This occurs when the sensor’s physical connection is established, but initialization fails, potentially due to communication interference on the data lines.
- Sensor Read Error: This happens after successful initialization if issues arise during readings, such as false data, timeouts, or incorrect messages. False data is considered when the received values tend to be in the extremities of sensor’s allowed measuring range.
4.6. Innovation
- Ultra-Compact Custom PCB Design for Wearability: Unlike existing solutions such as AirGradient or uRADMonitor, which offer larger sensor modules, CityAirQ achieves one of the smallest possible footprints (63 by 53 mm on PCB, while the actual enclosure only adds 1 mm of tolerance all around, with a height of just over 3 cm). This is achieved by strategically integrating off-the-shelf sensors into a custom developed PCB, optimizing their placement to minimize space while ensuring proper airflow for accurate readings (more details offered at the end of Section 4.2). Competing systems such as Sodaq Air or Airly, while portable, do not achieve a comparable reduction in device dimensions, while maintaining the same functionalities (CO2 measurements, on-device display etc.).
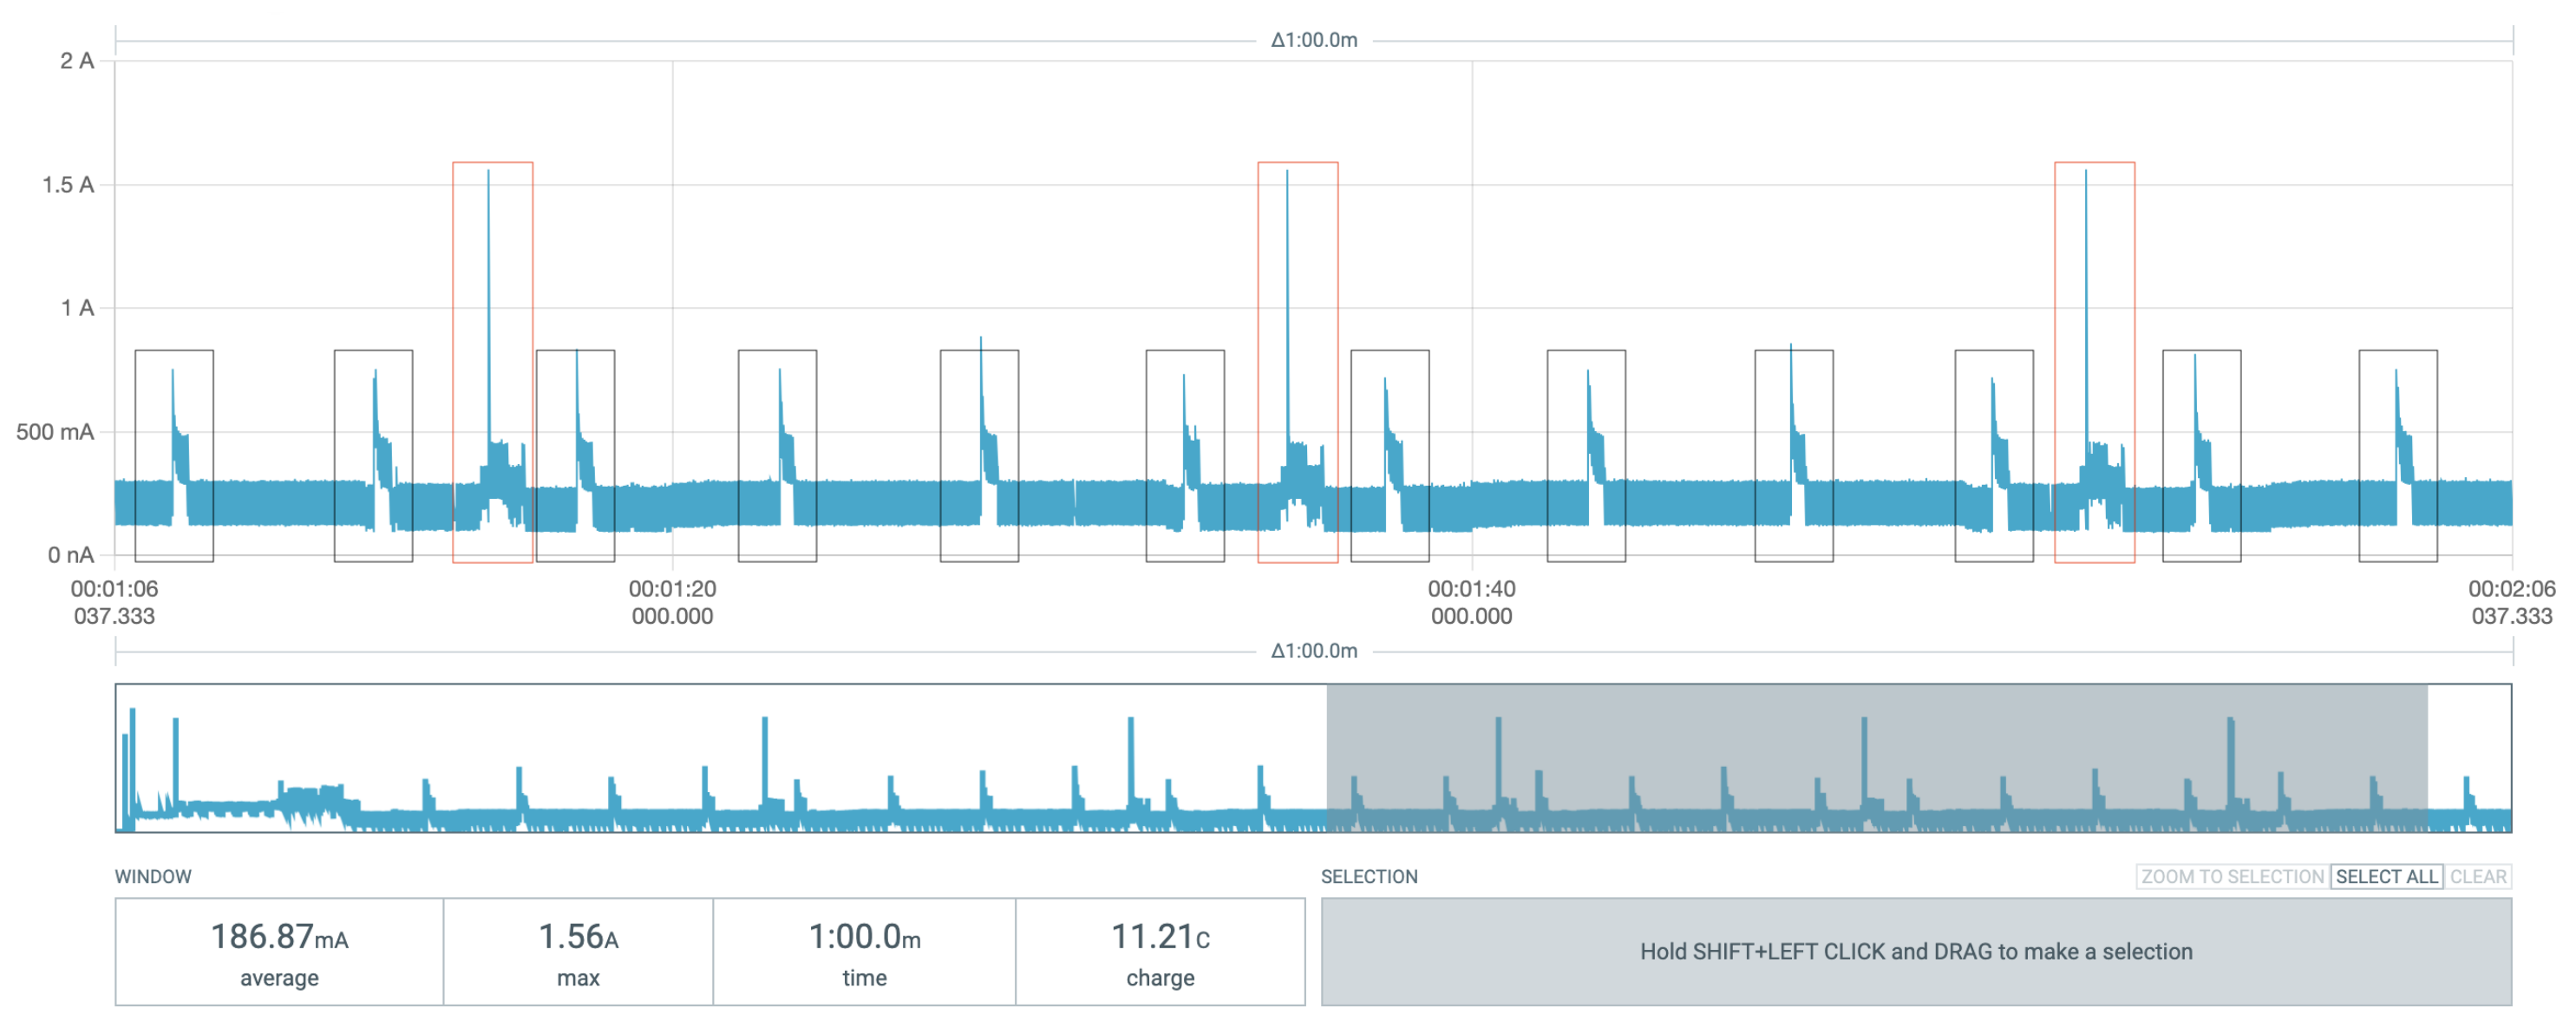
- Optimized Power Consumption for Extended Use: Building a custom device allows for direct control over power distribution and system behavior. Unlike commercial sensor modules that operate with fixed power requirements, CityAirQ implements selective activation and duty cycling of sensors, especially the PM and CO2 sensors, reducing average power consumption by 30% compared to continuous operation (detailed in Section 7.1.2). This results in longer battery life while maintaining reliable data collection, an advantage over devices such as AirBeam3 or Atmotube Pro, which prioritize real-time sensing but sacrifice battery efficiency.
- Seamless Mobile Integration with Dynamic Pollution Mapping: CityAirQ integrates real-time sensor data visualization on both the device itself as well as through the dedicated mobikle application, with a cloud-based pipeline that generates dynamic pollution maps. Unlike Sodaq Air, which only tracks PM pollutants and lacks a dedicated mobile application, CityAirQ provides detailed air quality insights (CO2, PM, temperature, humidity, pressure and more to be added) via a user-friendly Android application with interactive mapping and alerts. This enhances usability and accessibility beyond the web-based dashboards used by competitors like Airly and Oizom.
- Cost-Effectiveness Without Compromising Functionality: In comparison to existing solutions such as uRADMonitor (starting at 589 USD) or Airly (360 Euros per unit), CityAirQ offers a highly affordable alternative at approximately 86 USD, making it more accessible to a broader audience. This remarkably low cost achieved without sacrificing performance, primarily comes from having the ability to select, compare, and integrate the best price-to-performance sensors available on the market. Unlike pre-configured commercial solutions that often rely on fixed sensor modules with limited flexibility, our approach allowed for a meticulous selection process across multiple sensor categories, ensuring a great quality-to-price ratio for each component.
4.7. Sensors
4.7.1. Monitoring Ranges
- PMSA003:
- Particle range of measurement: 0.3–1.0 m (PM1), 1.0–2.5 m (PM2.5) and 2.5–10 m (PM10)
- Particle counting efficiency: 50% for 0.3 m particles and 98% for greater than 0.5 m particles
- Effective measuring range: 0–500 g/m3
- Accuracy: +− 10% for 100–500 g/m3 range and +− 10 g/m3 for 0–100 g/m3
- MH-Z19B:
- Effective measuring range: 0–5000 ppm
- Accuracy: +− 50 ppm + 3% of the reading value (if calibrated)
- BME680:
- Gas sensor: Accuracy is +− 15 % and Measuring range 0–500 IAQ index
- Humidity sensor: Accuracy is +− 10 % and Measuring range 0–100%
- Pressure sensor: Accuracy is +− 1 % and Measuring range 300–1100 hPa
- Temperature sensor: Accuracy is +− 1 °C and Measuring range is −40–85 °C
4.7.2. Calibration Procedures
- PMSA003 outperformed the Shinyei sensor, delivering more reliable readings.
- Factory calibration of PMSA003 is already highly accurate, with a Pearson correlation coefficient of 0.998 between two identical sensors placed in the same location, compared to 0.853 for the Shinyei sensor.
- While the study offers two potential calibration methods for PMSA003, they require long-term observational studies to adjust for specific environmental conditions (temperature, humidity, and PM levels). Since PMSA003 already provides consistent factory calibration, further tuning was not necessary at this stage, but will be addressed in future iterations.
- 0 point calibration: Enhances accuracy for lower-range readings (0–400 ppm) by calibrating the sensor in a sealed chamber with pure nitrogen or argon. While precise, this method is expensive and requires specialized calibration software. Given that typical outdoor CO2 levels exceed 400 ppm, this calibration was not necessary for CityAirQ.
- Rich CO2 mixture calibration: Achieved using a baking soda and vinegar controlled reaction. Although simpler, this method is less efficient and should be combined with other procedures.
- Fresh air calibration: Relies on exposing the sensor to ambient outdoor air, where CO2 levels naturally stabilize slightly above 400 ppm. This method is effective when high precision is not the primary goal.
- Auto-calibration: The sensor firmware includes a built-in self-correction mechanism that automatically adjusts the reference baseline every 24 h. This method, however assumes that the sensor will be in contact with fresh outdoor air, when it should measure its lowest readings, and use those to adjust its baseline.
- Exposing the sensor to a rich CO2 mixture in a hermetic container for 30 min to adjust its response range.
- Allowing self-calibration in outdoor air for 24 h to establish an accurate baseline.
- Enabling the sensor’s built-in auto-calibration function to maintain long-term stability.
4.8. Conclusions
- A highly compact form factor (63 × 53 mm PCB) was achieved through strategic sensor placement, ensuring that all components fit within the smallest possible footprint while maintaining adequate airflow for precise pollutant measurements. Unlike bulkier commercial alternatives, CityAirQ offers a wearable and bike-mounted form factor without compromising functionality.
- Power consumption was significantly optimized through the implementation of duty cycling, which selectively activates sensors only when necessary. This approach led to an extended battery life of approximately 5 h, striking a balance between continuous monitoring and energy efficiency, making it more practical for mobile applications.
- The affordable cost of CityAirQ was made possible by carefully selecting and comparing available sensors, ensuring that each component offered the best price-to-performance ratio. By avoiding pre-configured sensor modules with fixed specifications, the project achieved a low-cost yet highly functional pollution tracking system, making it accessible to a wider audience.
- Calibration procedures were applied to the CO2 sensor to ensure accurate readings in real-world conditions. A hybrid calibration strategy was implemented, combining rich CO2 mixture exposure, fresh air calibration, and auto-calibration. This method allowed the sensor to self-correct over time, reducing measurement drift and enhancing reliability.
4.9. Limitations & Challenges
- The range of tracked pollutants remains limited, as the current design does not include dedicated sensors for NO2, SO2, or additional VOCs. While this was primarily a result of space and cost constraints, future iterations could integrate additional sensors to improve coverage.
- The e-paper display, chosen for its low power consumption, has a slow refresh rate, which may result in a noticeable delay when updating real-time pollution readings. Although this helps conserve battery life, it slightly reduces the immediacy of displayed data.
- Temperature readings from the BME680 sensor were occasionally misleading due to its placement on the main PCB, where it was affected by heat dissipation from other electronic components. This resulted in higher-than-actual temperature readings, highlighting the need for a more thermally isolated placement in future versions.
- The PM sensor’s air vents were designed larger than ideal, which, under high-speed movement (e.g., cycling or riding in windy conditions), allowed excessive airflow through the sensor chamber. Since the sensor is calibrated for a specific air volume intake, this led to inconsistent PM readings at higher speeds. A more controlled air intake mechanism could mitigate this issue.
4.10. Future Work
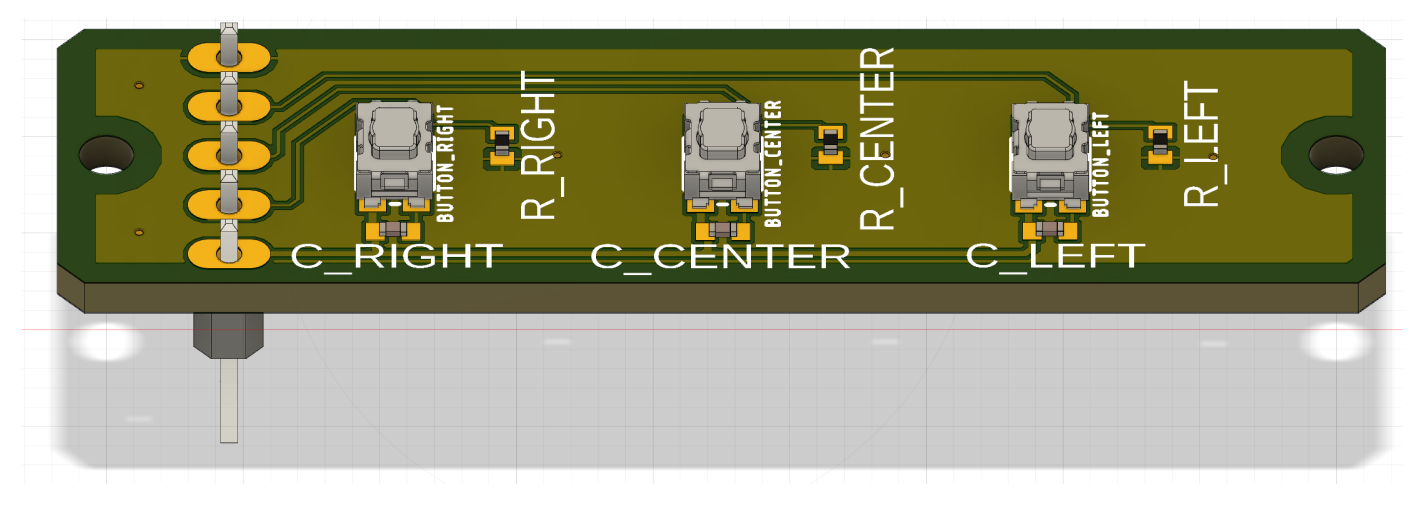
- Addressing the Temperature Sensor Issue: To eliminate the heat dissipation effect that influenced temperature readings, the BME680 sensor has been relocated to the external buttons PCB, where it is less affected by heat from the main board. Additionally, cutouts were made into the PCB design to further reduce thermal interference, ensuring more reliable environmental measurements.
- Expanding the Range of Tracked Pollutants: Future iterations will integrate the MICS-6814 sensor, which is capable of detecting a broader range of harmful gases such as NO2, NH3, and CH4. This addition will allow CityAirQ to provide a more comprehensive assessment of urban air quality, addressing a key limitation of the current design.
- Implementing On-Board Software Compensation Algorithms: To further increase measurement accuracy, software-based compensation techniques will be developed. These algorithms will focus particularly on PM sensor readings, adjusting values based on external conditions such as airflow variations, humidity, and temperature. This will help mitigate inconsistencies caused by high-speed movement and environmental fluctuations.
- Refining the Enclosure for Improved Aesthetics and Usability: While the current enclosure prioritizes functionality, future versions will undergo aesthetic refinements to enhance user experience and wearability while maintaining the device’s compact and ergonomic design. Improved airflow control will also be integrated to further stabilize sensor readings.
- Further Optimizing Power Consumption: While the current duty cycling strategy has already extended battery life, additional power optimizations will be explored. A key improvement will be the potential integration of the MH-Z1311A CO2 sensor, which offers an ultra-low power consumption of just 1 mA on average, compared to the current MH-Z19B sensor’s 60 mA average consumption. This upgrade could significantly enhance energy efficiency, further extending operational time on a single charge.
5. Mobile Application
5.1. General Architecture and Design Pattern
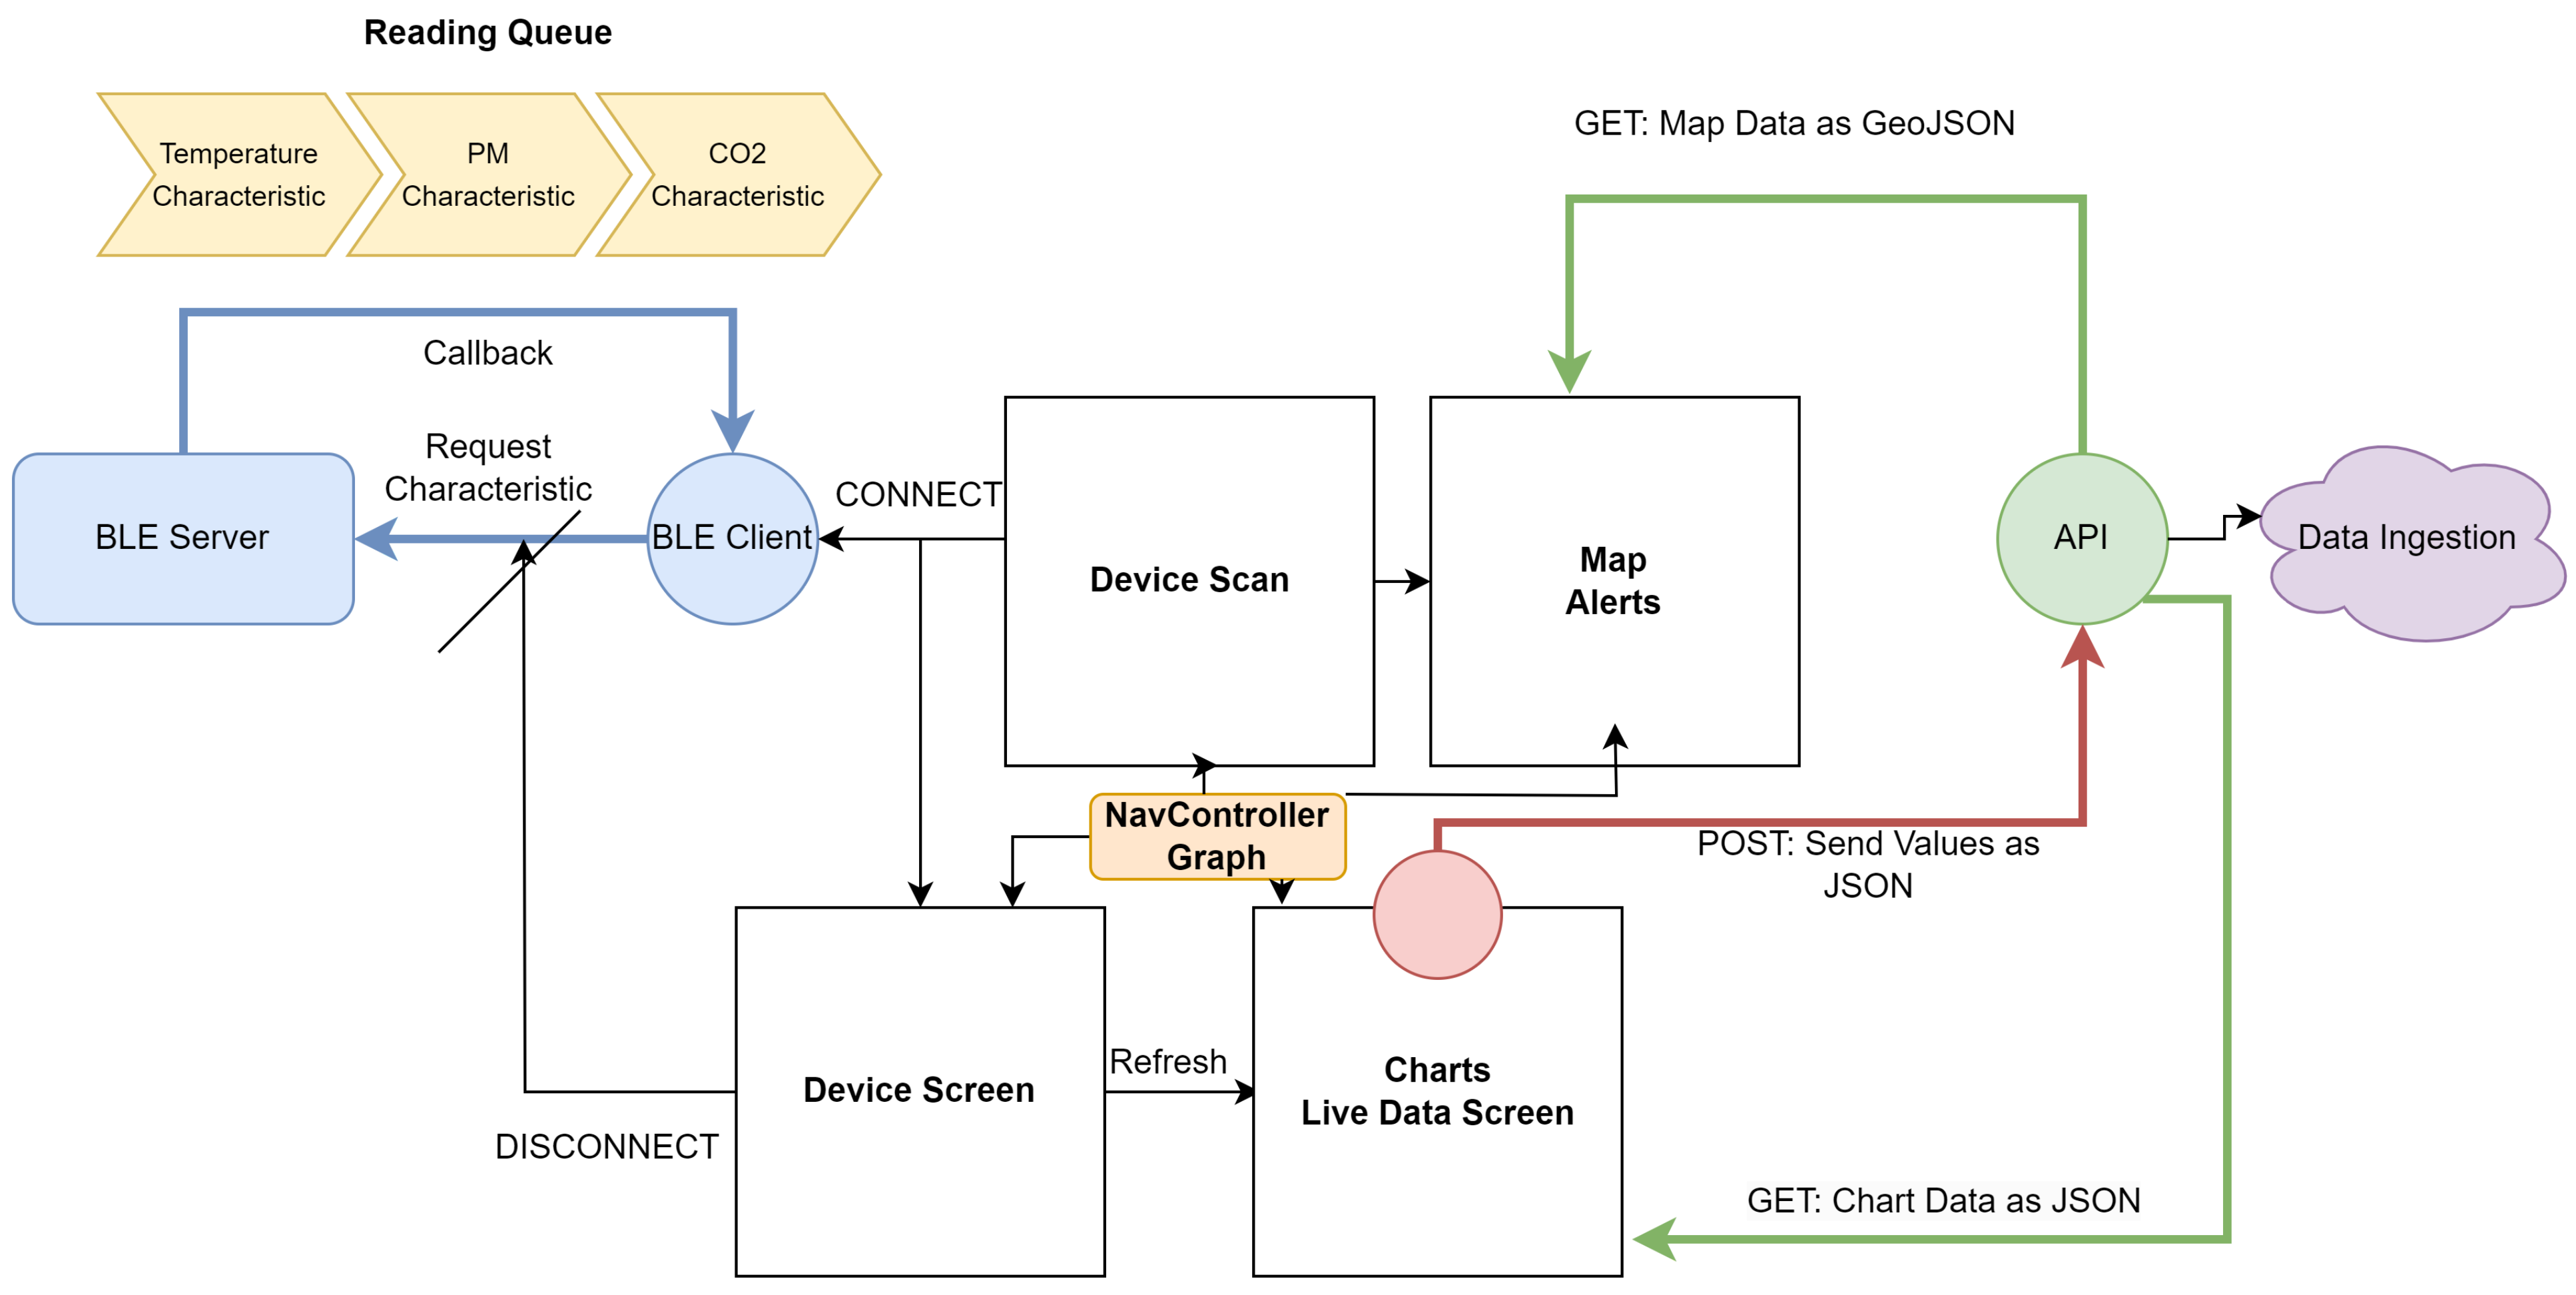
5.2. Communication with the Hardware Device
5.3. Communication with the Cloud System
| Listing 1: Request URL for Results API. |
|
5.4. Implementation and Libraries
6. Cloud-Based Data Pipeline
6.1. Pipeline Architecture
- A REST API connects edge devices to the back-end infrastructure, transferring data received from the mobile application into a message queue (Google Pub/Sub) for further processing.
- All data from the queue is then processed using the Apache Beam framework.
- The processed data is stored in a QuestDB database.
- In the final step, an additional API delivers the processed data from QuestDB to the mobile application.
- Deduplication: Streamlining deduplication using an open-source Apache Beam sink for QuestDB data storage.
- Validation: Ensuring that the data for each dimension falls within the correct boundaries.
- Transformation: Using the H3 algorithm, a geospatial indexing system with hexagons of varying resolutions to uniquely identify Earth’s surface zones. The transformation step includes normalizing data (e.g., setting correct data types) and converting GPS coordinates into H3 zones.
- Storage: Persisting the processed data in QuestDB.
6.2. Data Processing
6.3. Data Storage
7. Experimental Evaluation
7.1. Hardware Device Testing
7.1.1. Estimated Power Consumption
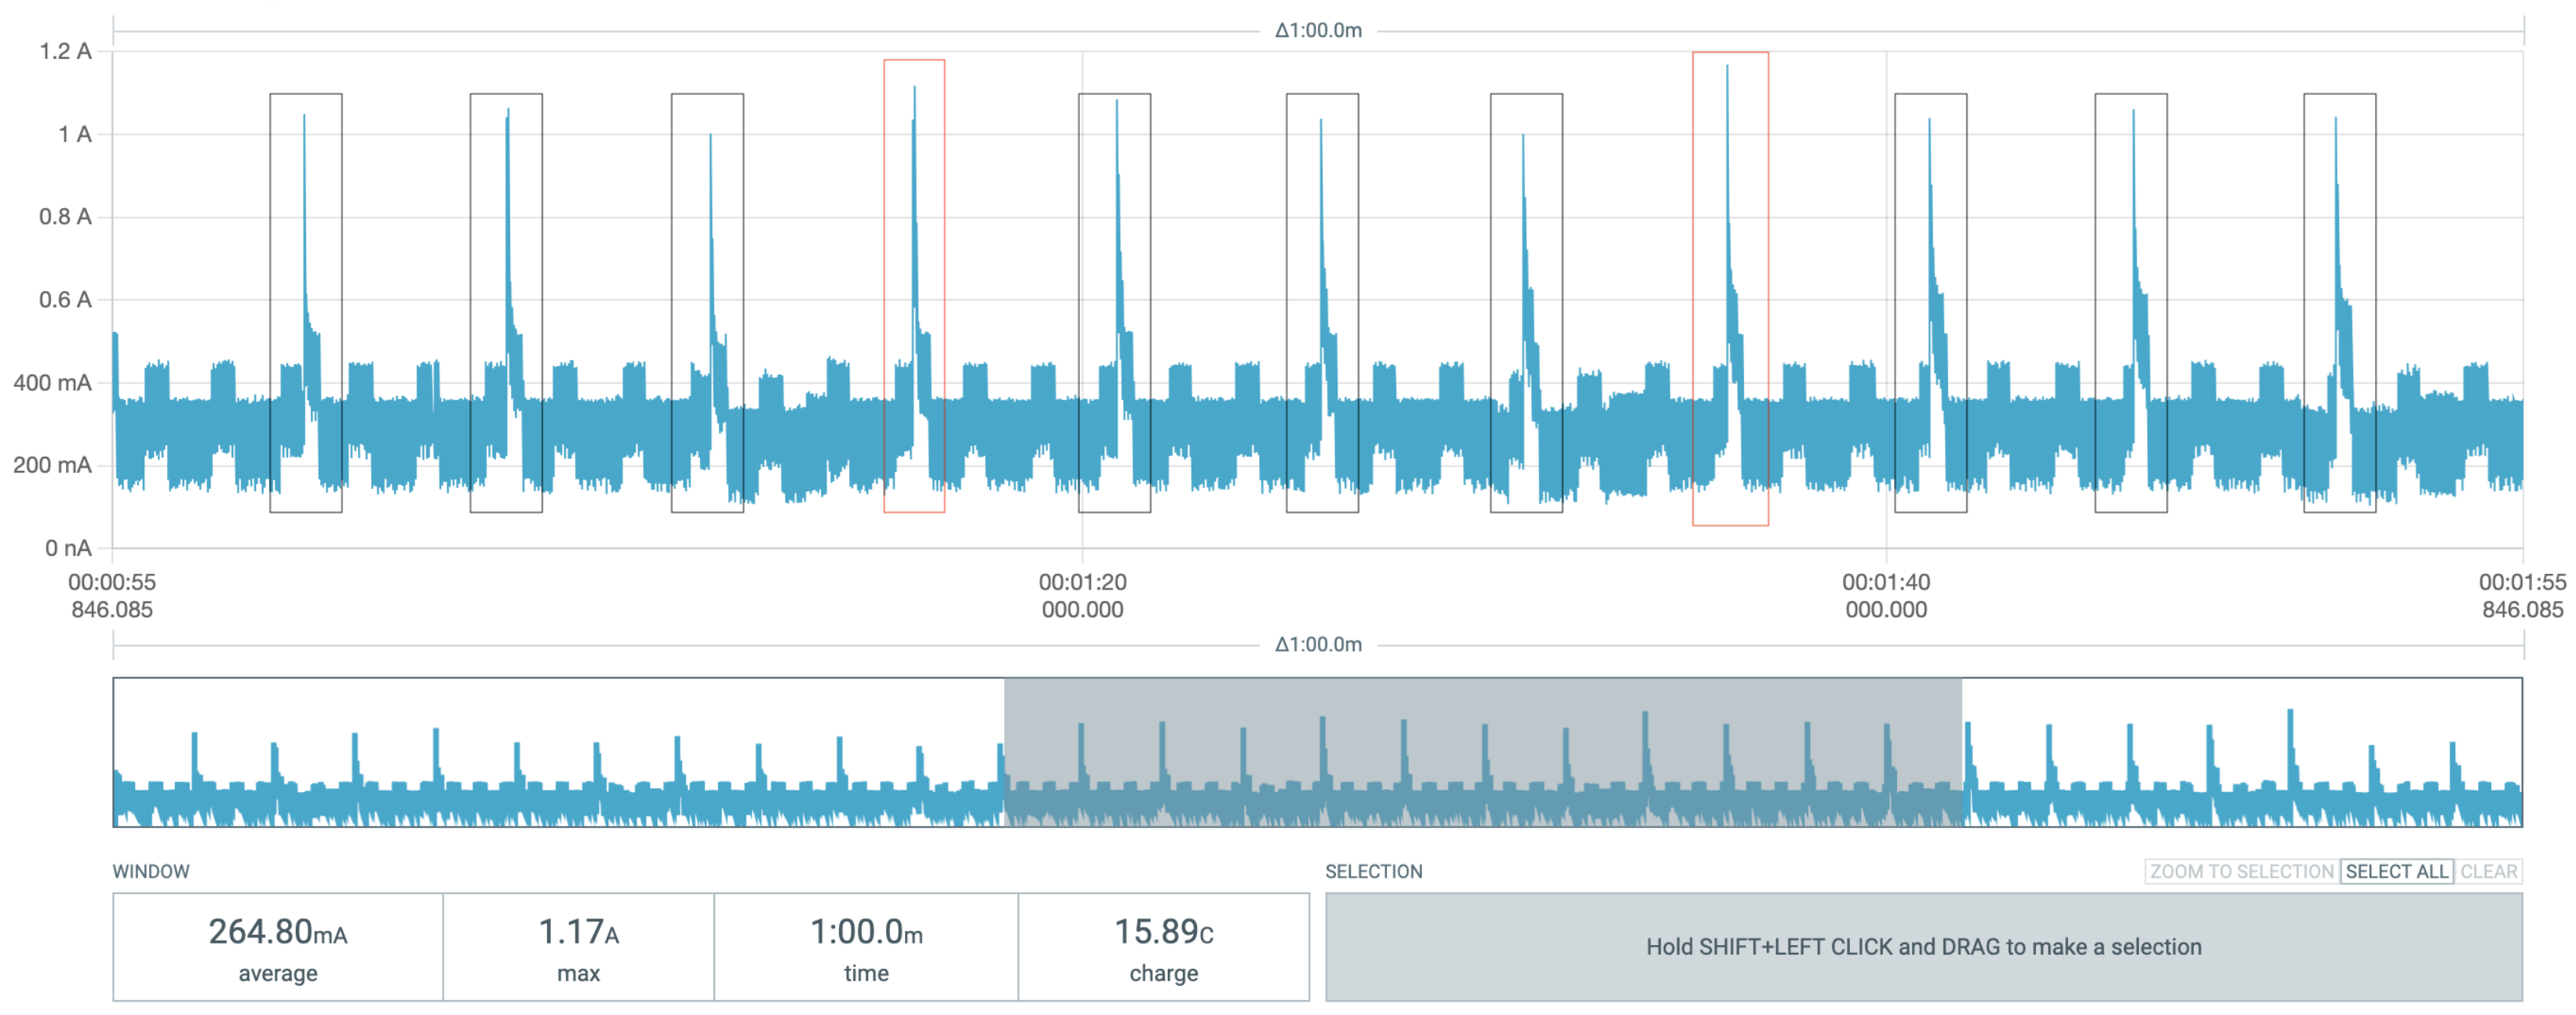
7.1.2. Actual Power Consumption
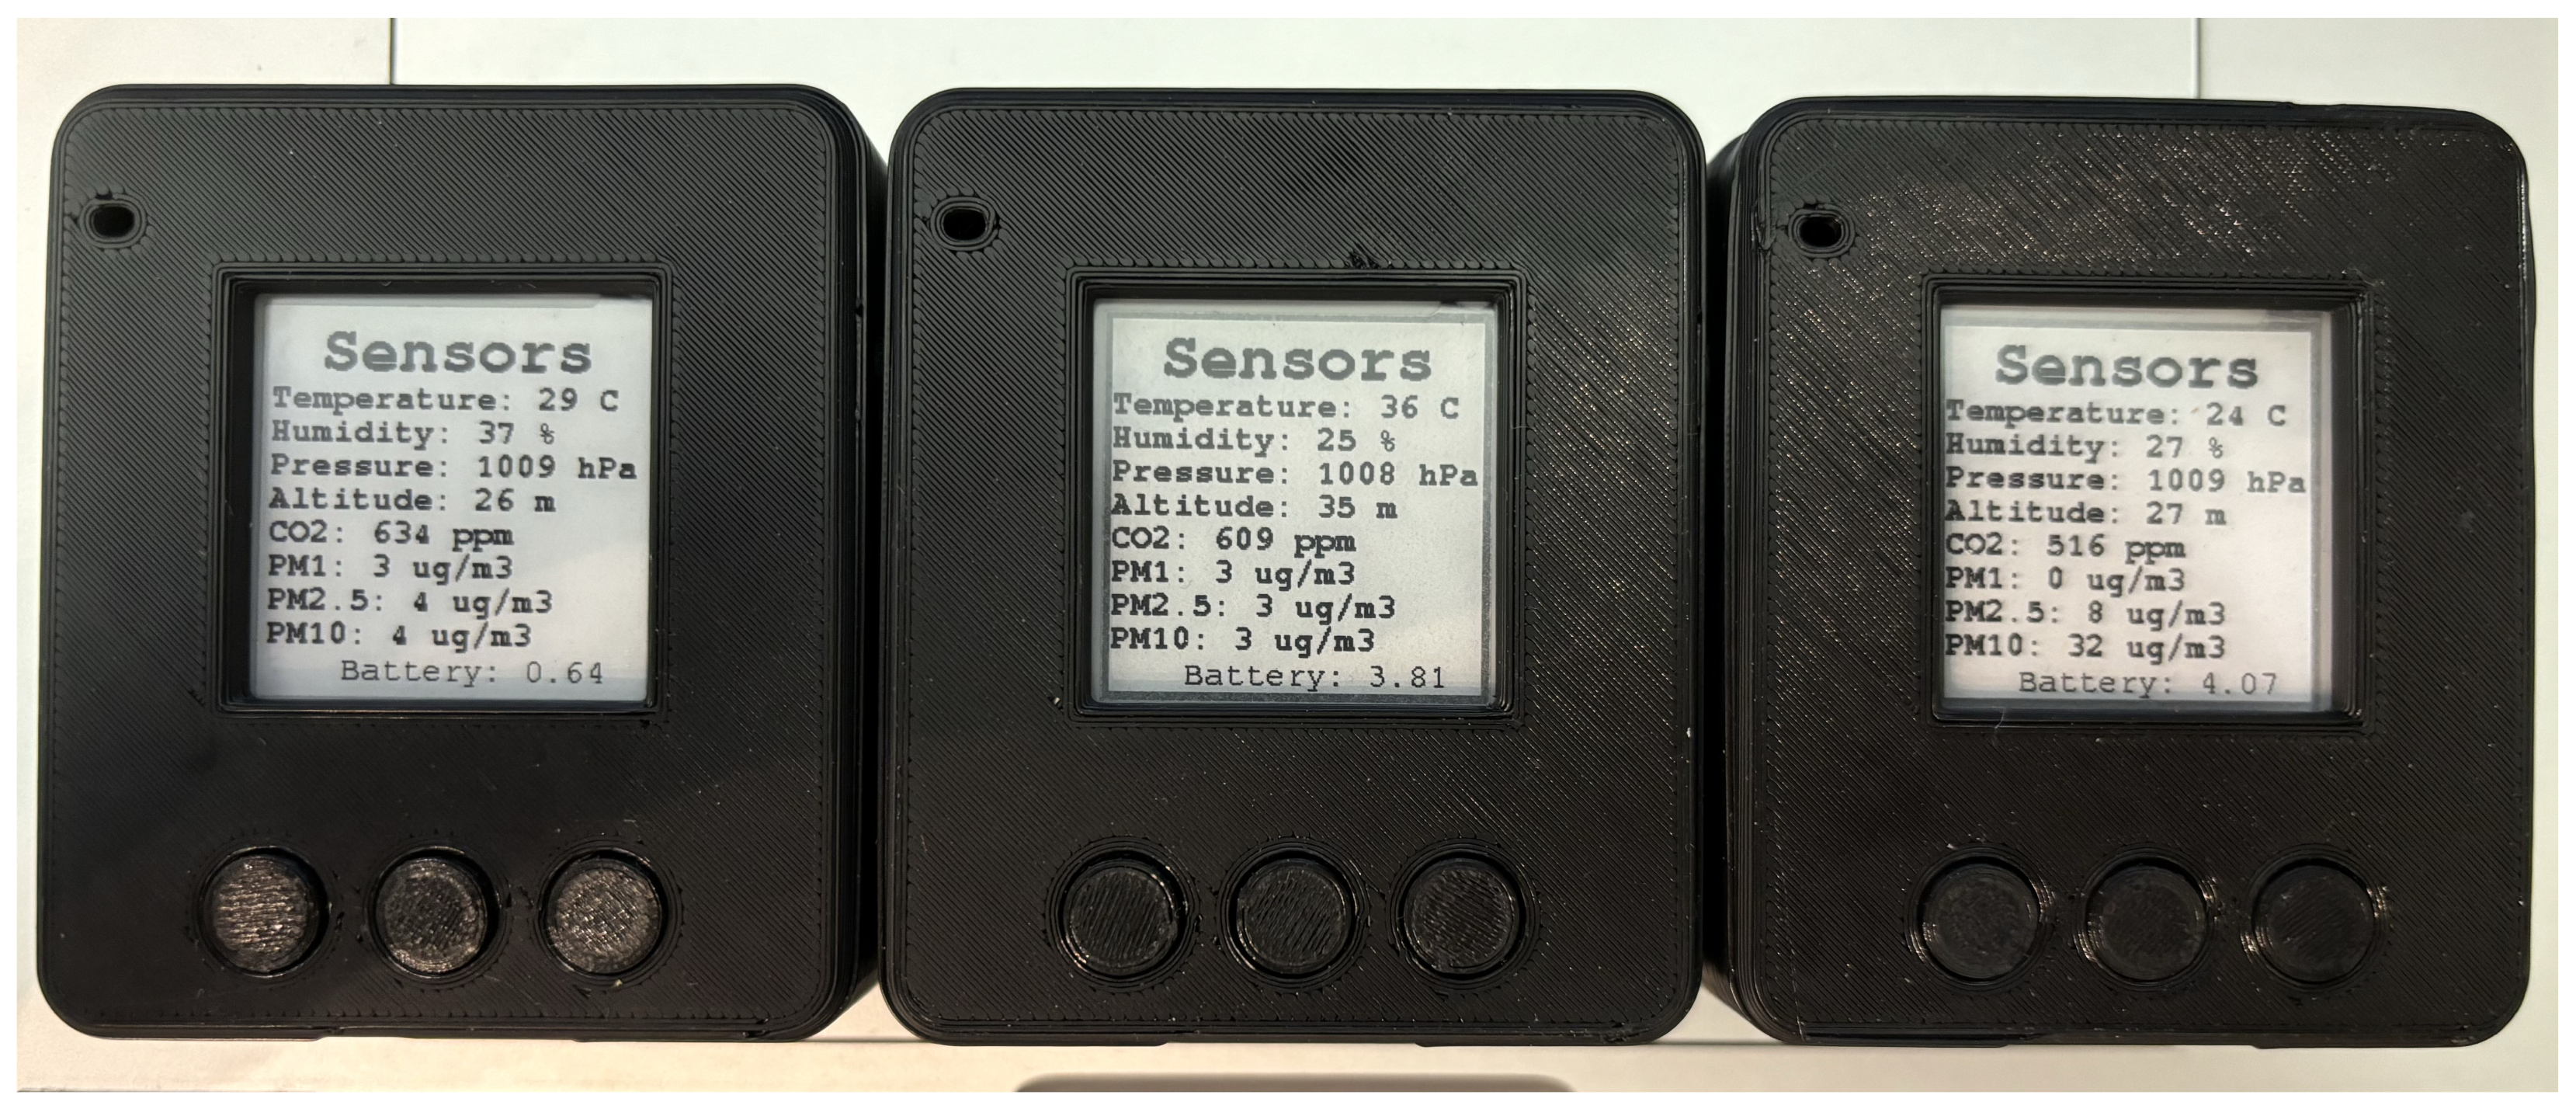
7.1.3. CO2 Accuracy
- The calibrated sensor (right) provided the most accurate reading at 516 ppm, closely matching the reference value.
- The two non-calibrated sensors (left and center) reported higher CO2 levels, at 634 ppm and 609 ppm, respectively. Despite this offset, both remained within an acceptable deviation of +− 100 ppm from the expected range.
- The rightmost sensor was running a different firmware version for testing purposes, which led to variations in temperature and PM readings. The temperature measurement appears more realistic, but PM data was inaccurate (this issue was later resolved).
- The battery level reading on the left sensor was arbitrary, as the reference pin was not connected to the ESP32 ADC.
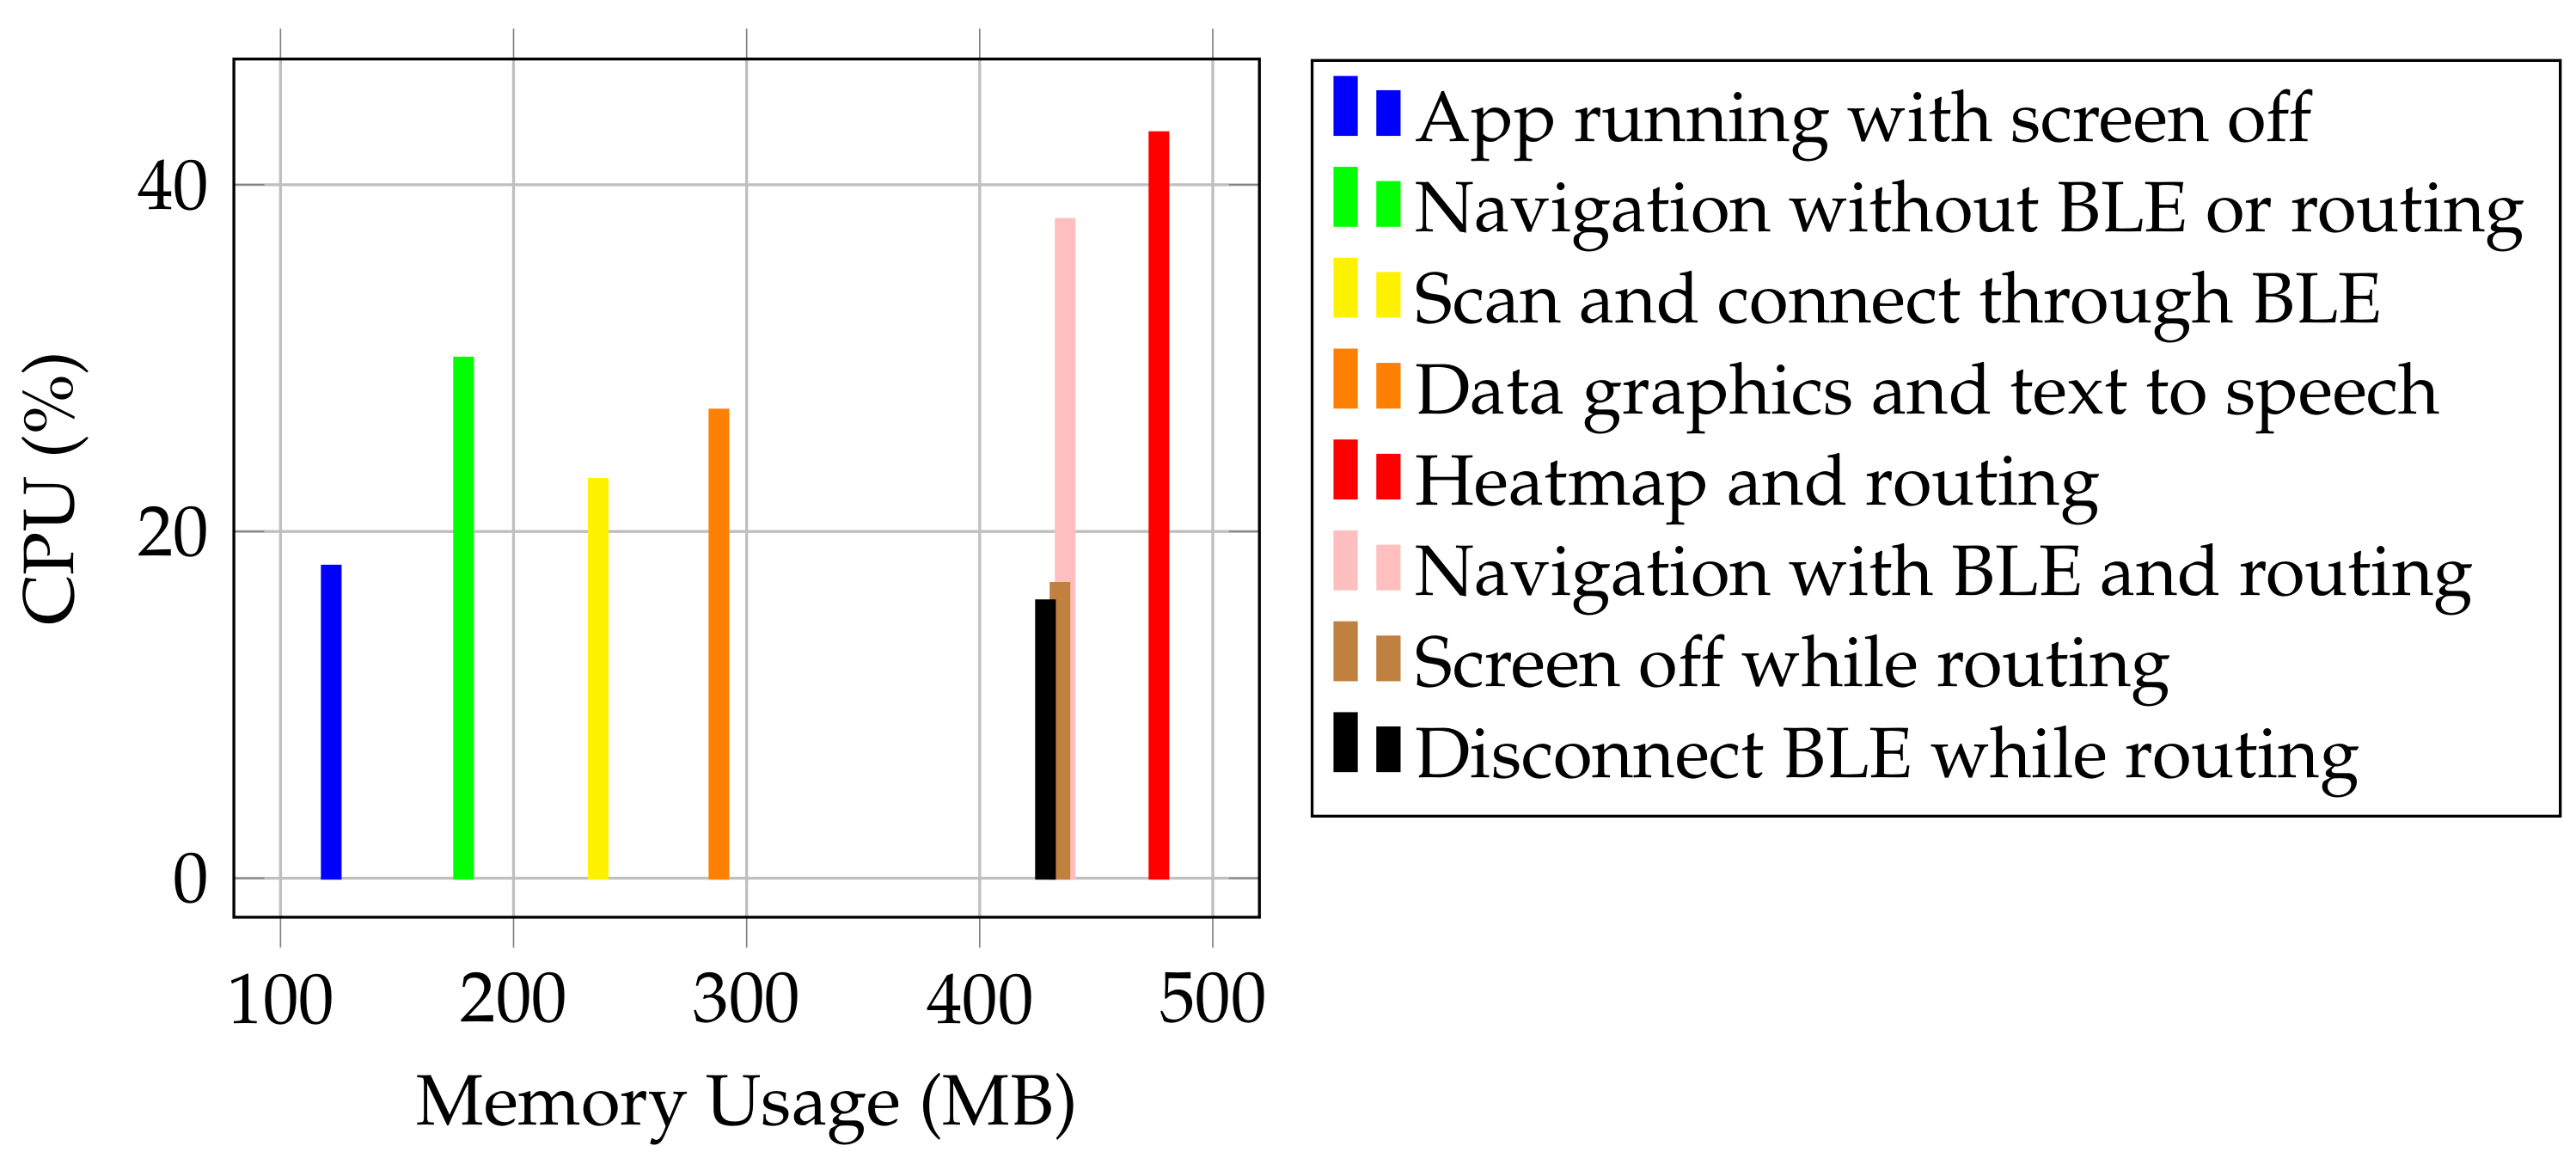
7.2. Application Deployment and Performance
7.3. Field Trial Evaluation
7.4. Monitored Pollution Impact
- Proximity to Traffic Emissions:
- Vehicles are the primary source of CO2 and particulate matter in urban areas.
- Sidewalks immediately adjacent to the roadway are directly exposed to exhaust emissions, tire wear particles, and resuspended road dust, leading to higher pollutant concentrations.
- Airflow and Dispersion:
- The absence of a buffer zone next to the university sidewalk limits air dispersion, trapping pollutants within the pedestrian zone.
- In contrast, the Drumul Taberei sidewalk, with its green buffer, allows for natural air dilution and pollutant dispersion, leading to significantly lower readings.
- Role of Green Space and Vegetation:
- Trees and grass act as natural air filters, capturing airborne PM and absorbing CO2 through photosynthesis, as vegetation intercepts and deposits PM while also influencing local air circulation.
- Street Canyon Effect vs. Open Space:
- The university sidewalk is part of a denser urban setting, where buildings and traffic lanes form a “street canyon” effect, trapping pollutants at pedestrian level.
- The Drumul Taberei avenue features a more open layout, which facilitates natural air exchange and pollutant dispersion, preventing pollutant accumulation near pedestrians.
7.5. Comparative Evaluation
7.6. Scientific Evaluation
8. Conclusions and Further Work
8.1. Conclusions
- Solving the Stated Problem: Based on results and user feedback, CityAirQ turns out to be a reliable system that fights air pollution through information. While collecting reliable data, cyclists have the possibility to be informed and alerted at all times, by visualizing the graphics, air pollutants and maps in the application and gives them the power to inform others, leading to a more cautious community.
- Generated a pollution dataset: By using the CityAirQ infrastructure, we managed to create a reliable pollution dataset. We collected by using more than 3 different hardware devices connected to mobile clients on different Android mobile phones. The main areas of interest were western, southern and north-central parts of Bucharest, Romania, on routes with distances raging from 0.5 to 7 km. Not only does this offer a relevant dataset for pollution renderings, but it also lays the foundation for future developments.
- CityAirQ as a Product: By combining the three main elements of the system together, we managed to create a reliable product, ready for use.
- Functionality: All wanted features work as expected and the communication stream successfully transports data from source to destination, with a minimal networking overhead.
- Performance: The performance metrics revealed by the hardware and software profilers are overall good and they prove that the system is low-power.
- Price: Compared to other competitors on the market, our device is by far the cheapest option, being 2 times less expensive than the next option in line. Most importantly, the application was fully created by using open source and public Android libraries, with no additional subscriptions needed, which makes CityAirQ overall low-cost compared to other products.
8.2. Technical Contributions
- Ultra-Compact Custom PCB Design: The development of a custom PCB that enables the integration of multiple pollution and environmental sensors into a compact, portable device, allowing for real-time tracking of a broad range of environmental parameters.
- Sensor Calibration and Data Validation: A hybrid calibration approach was applied to the CO2 sensor, combining rich CO2 mixture exposure, fresh air calibration, and auto-calibration to ensure long-term measurement stability. Additionally, data validation tests were performed by comparing readings against reference stations, confirming the accuracy and reliability of the collected pollution data
- Energy Efficiency and Portability: The system’s energy-efficient design ensures that the tracking devices can operate for extended periods without frequent recharging or maintenance, making them practical for continuous monitoring in urban environments.
- Wearable and Bike-Mounted Flexibility: The compact enclosure was designed for versatile deployment, making CityAirQ suitable for both personal exposure monitoring and urban pollution mapping.
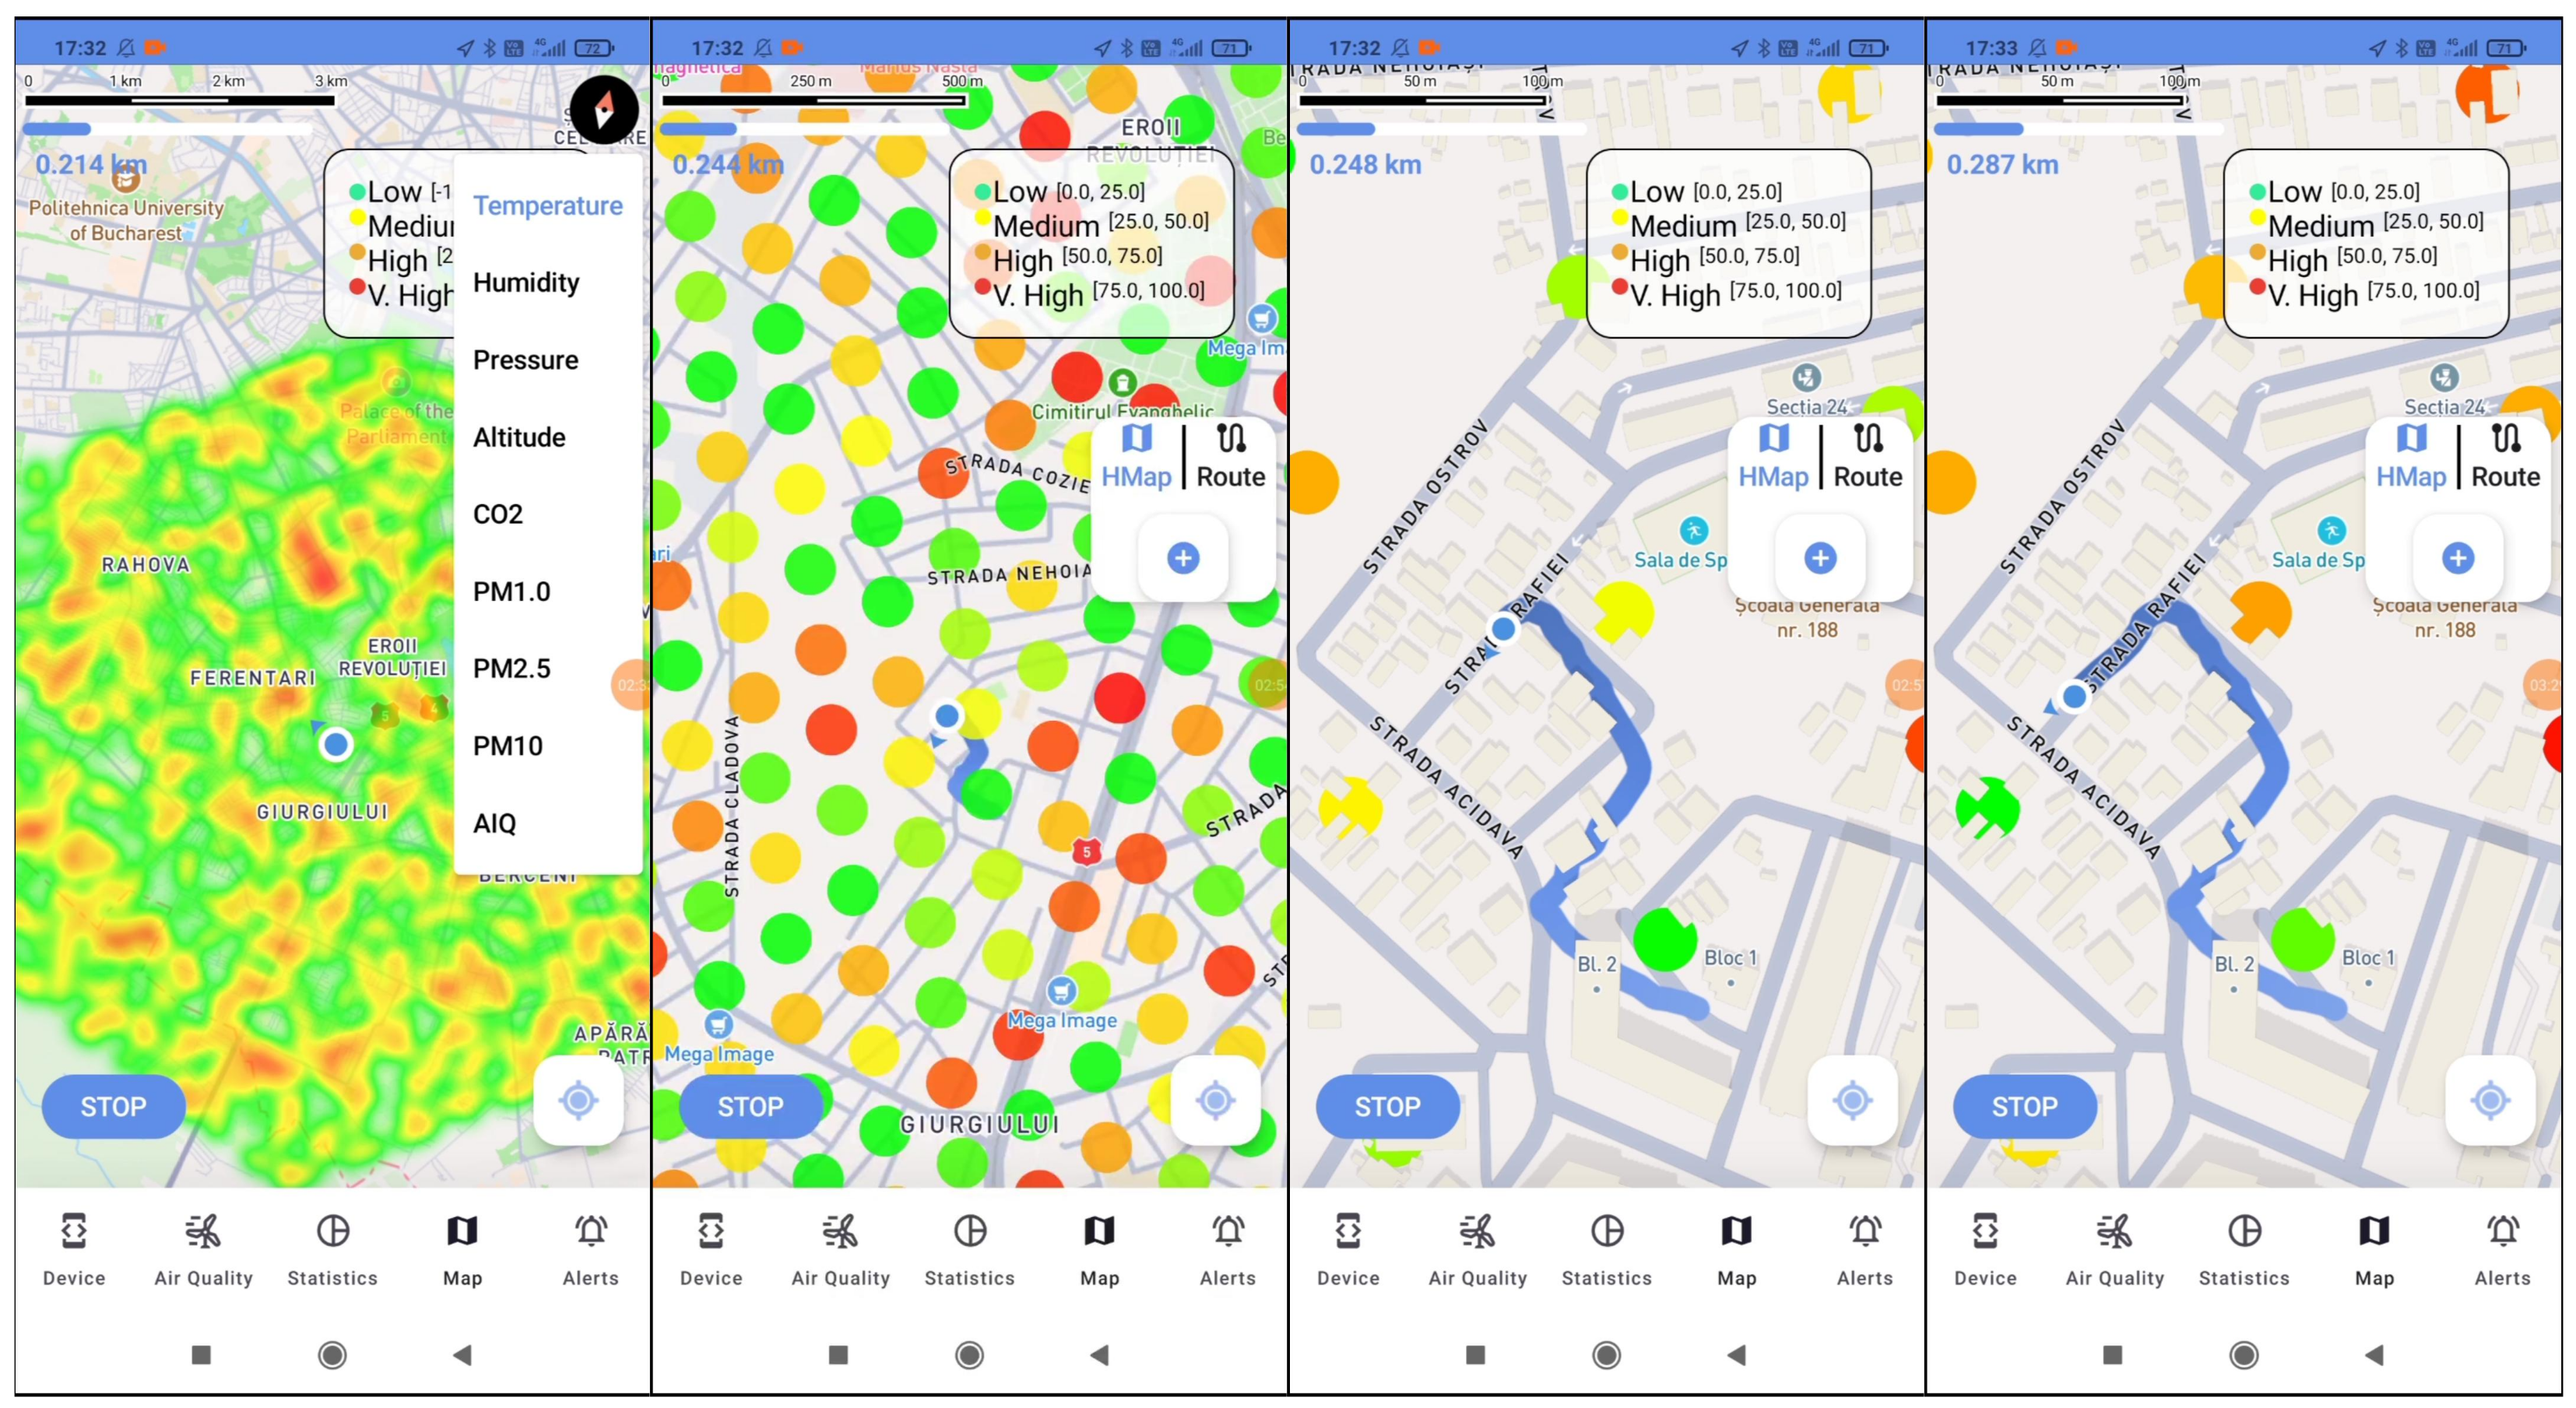
- Air Quality Dynamic Maps: The mobile application includes dynamic maps that transform raw sensor data into actionable insights. By combining real-time data integration, high-resolution visualization, cloud-based processing, and user-friendly design, these maps provide a powerful tool for understanding and addressing urban air pollution.
8.3. Practical Application Value
- Public Health Awareness and Decision-Making: CityAirQ provides real-time air quality data to citizens, enabling them to make informed decisions about their daily activities, such as choosing less polluted routes. Especially individuals with respiratory and cardiovascular diseases can benefit from our system in reducing their health risks.
- Community Engagement and Advocacy: Local communities and environmental groups can use the system to collect air quality data, in order to raise awareness and advocate for cleaner air policies.
- Supporting Urban Planning and Policy: CityAirQ’s detailed pollution maps allow officials to pinpoint pollution hotspots, prioritize interventions and evaluate the effectiveness of existing air quality policies.
- Enhancing Environmental Monitoring and Research: The system provides a high-resolution, real-time dataset that can be used by researchers to study the dynamics of urban air pollution.
8.4. Further Improvements
- BLE Improvements: Although it works at the moment, the BLE connection states are still sometimes unpredictable and can easily send the BLE Client to an unstable state, which is obviously dangerous to the system. The same can be said about the Bluetooth scanning logic, especially shortly after device disconnect. A more persistent and safe solution should be found in this direction.
- Memory Usage: Operations such as HeatMap renderings require a large volume of data, high CPU and can lead to higher memory values. As readings are necessary for data visualization, a more efficient way to store this big number of points needs to be studied, in order to avoid loading the application unnecessarily.
- New Functionalities: More exciting functionalities can further be incorporated. One interesting idea would be including sources of pollution in the map. Another take here would be comparing the pollution level on the map with number of smoked cigarettes per day, based on the study [30].
- Accessibility: One final improvement is to keep on making the application more suitable for usage while cycling, when the attention needs to be put into another direction. The charting system needs to offer more accessibility as well [20].
- Power consumption: While the device currently provides approximately 5 h of continuous battery operation, improvements are possible. Implementing a more power-efficient version of the CO2 sensor, such as the MH-Z1311A, could reduce its average power consumption from 60 mA to 1 mA.
- Pollution prediction: To further enhance our system, we will integrate trained machine learning algorithms into our data pipeline, through the use of Apache Beam, in order to create high-resolution predictive pollution maps, at a much larger scale than is currently available.
- Archived raw data: Future implementation will include cloud standard object storage, via Google Cloud Storage, for the archiving of raw data. This data will then be leveraged for the refinement of our predictive models and algorithms.
- Backend: Future efforts will focus on achieving complete automation and seamless integration of the backend components.
9. Supplementary Information
9.1. Air Pollution
9.2. Air Pollution Monitoring
9.3. Other Monitoring Solutions
9.4. Hardware Device
9.4.1. RTC Module Backup Power
9.4.2. Section Analysis
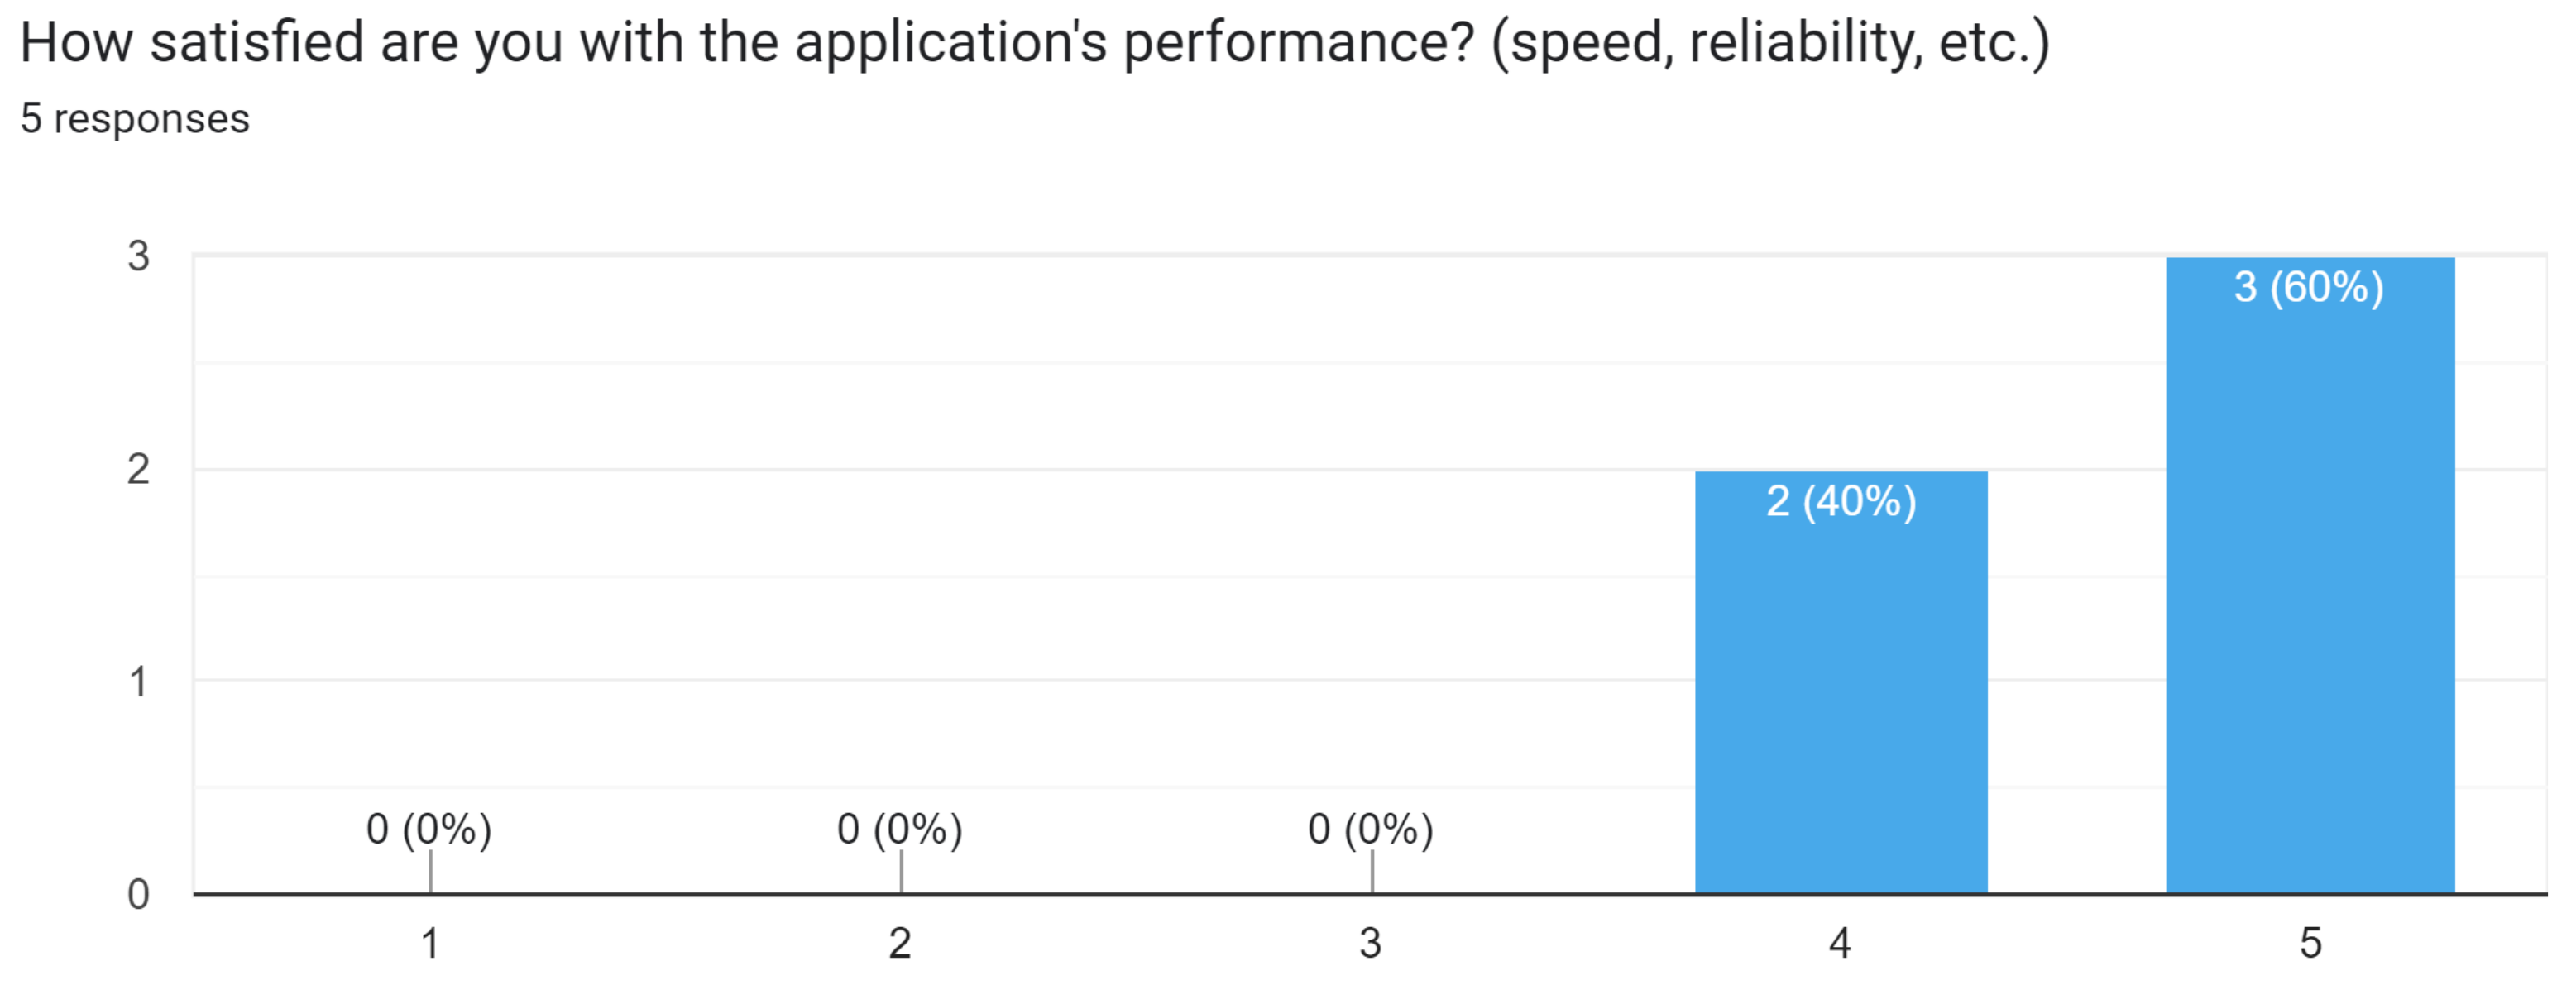
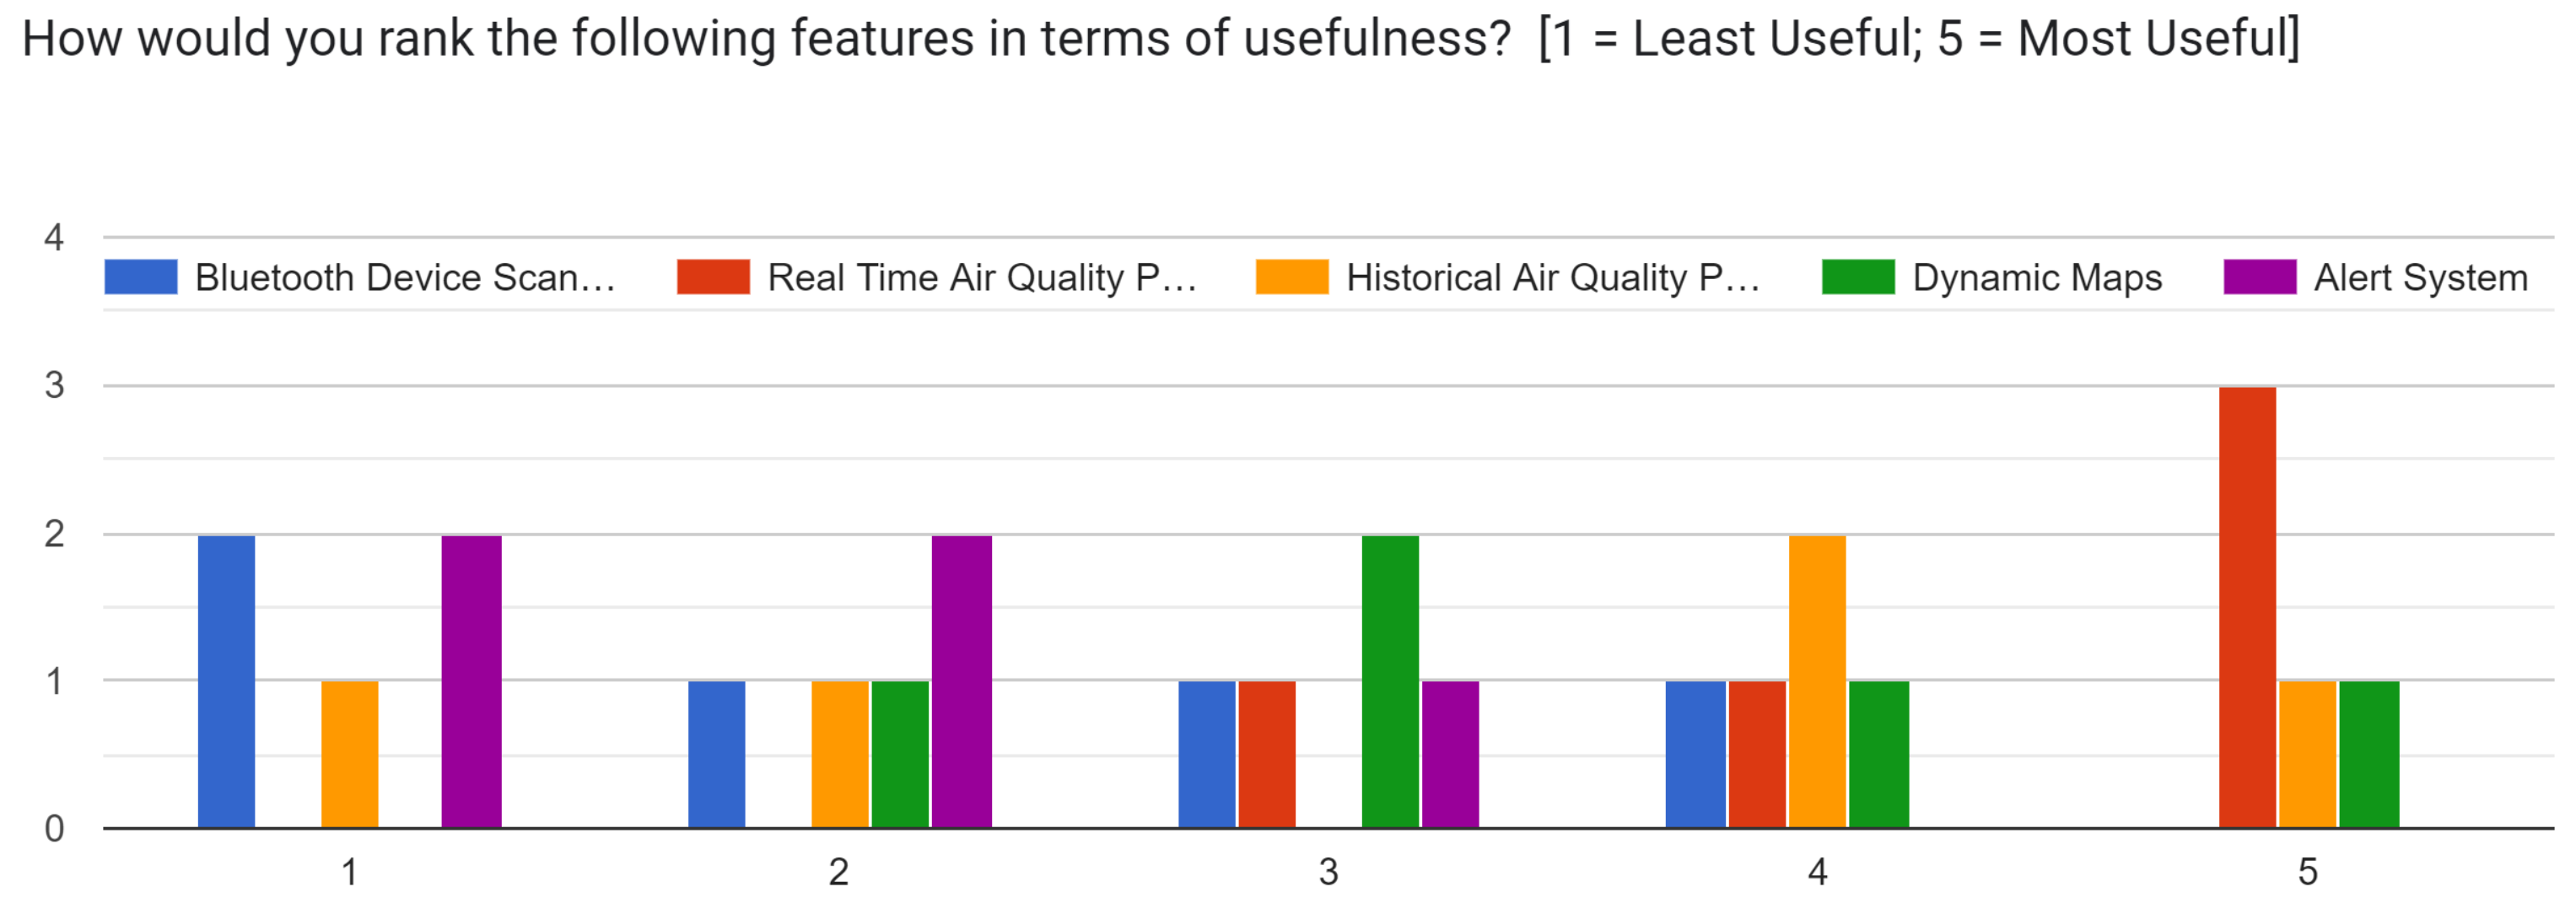
9.5. Application User Feedback
Author Contributions
Funding
Institutional Review Board Statement
Informed Consent Statement
Data Availability Statement
Conflicts of Interest
References
- Walters, R. Air Pollution and Invisible Violence. In Invisible Crimes and Social Harms; Davies, P., Francis, P., Wyatt, T., Eds.; Palgrave Macmillan UK: London, UK, 2014; pp. 142–160. [Google Scholar] [CrossRef]
- Fowler, D.; Brimblecombe, P.; Burrows, J.; Heal, M.R.; Grennfelt, P.; Stevenson, D.S.; Jowett, A.; Nemitz, E.; Coyle, M.; Liu, X.; et al. A chronology of global air quality. Philos. Trans. A Math. Phys. Eng. Sci. 2020, 378, 20190314. [Google Scholar] [CrossRef] [PubMed]
- Xu, X.; Zhong, Y.; Cai, S.; Lei, L.; Peng, J. Does Air Pollution Aggravate Health Problems in Low-Income Countries? Verification from Countries Along the Belt and Road. Sustainability 2025, 17, 1796. [Google Scholar] [CrossRef]
- Abadi, A.R.S.; Hamzeh, N.H.; Kaskaoutis, D.G.; Vuillaume, J.F.; Shukurov, K.A.; Gharibzadeh, M. Spatio-Temporal Distribution of PM2.5 and PM10 Concentrations and Assessment of Public Health Risk in the Three Most Polluted Provinces of Iran. Sustainability 2025, 17, 44. [Google Scholar] [CrossRef]
- Liu, L.; Zhao, J.; Li, Z. Sustainable Urban Development: A Comprehensive Model for Assessing Health Risks from Compounded Pollution in Xi’an. Sustainability 2024, 16, 9799. [Google Scholar] [CrossRef]
- Manisalidis, I.; Stavropoulou, E.; Stavropoulos, A.; Bezirtzoglou, E. Environmental and Health Impacts of Air Pollution: A Review. Front. Public Health 2020, 8, 13. [Google Scholar] [CrossRef] [PubMed]
- Li, Q.; Zheng, D.; Wang, Y.; Li, R.; Wu, H.; Xu, S.; Kang, Y.; Cao, Y.; Chen, X.; Zhu, Y.; et al. Association between exposure to airborne particulate matter less than 2.5 μm and human fecundity in CHINA. Environ. Int. 2021, 146, 106231. [Google Scholar] [CrossRef] [PubMed]
- Gauderman, W.; Avol, E.; Lurmann, F.; Kuenzli, N.; Gilliland, F.; Peters, J.; McConnell, R. Childhood asthma and exposure to traffic and nitrogen dioxide. Epidemiology 2005, 16, 737–743. [Google Scholar] [CrossRef] [PubMed]
- National Institute of Environmental Health Sciences. Air Pollution and Your Health. Available online: https://www.niehs.nih.gov/health/topics/agents/air-pollution (accessed on 21 February 2025).
- Bogdan, E. Promoting the Health and Social Inclusion of the Urban Population by endowing and improving the Quality of Leisure Facilities in the Parks in BUCHAREST. Qual. Access Success 2018, 19, 80–86. [Google Scholar]
- Rosen, Z.; Channing, B.; Scott, S. Visualizing the invisible: Visual-based design and efficacy in air quality messaging. Int. J. Environ. Res. Public Health 2021, 18, 18. [Google Scholar] [CrossRef] [PubMed]
- Tonne, C.; Adair, L.; Adlakha, D.; Anguelovski, I.; Belesova, K.; Berger, M.; Brelsford, C.; Dadvand, P.; Dimitrova, A.; Giles-Corti, B.; et al. Defining pathways to healthy sustainable urban development. Environ. Int. 2021, 146, 106236. [Google Scholar] [CrossRef] [PubMed]
- Levy Zamora, M.; Xiong, F.; Gentner, D.; Kerkez, B.; Kohrman-Glaser, J.; Koehler, K. Field and Laboratory Evaluations of the Low-Cost Plantower Particulate Matter Sensor. Environ. Sci. Technol. 2018, 53, 838–849. [Google Scholar] [CrossRef] [PubMed]
- Particulate Matter (PM) Sensors of Two Different Principles. Available online: https://www.winsen-sensor.com/knowledge/particulate-matter-sensors-of-two-different-principles.html (accessed on 21 February 2025).
- Kazdaridis, G.; Sidiropoulos, N.; Zografopoulos, I.; Symeonidis, P.; Korakis, T. Nano-things: Pushing sleep current consumption to the limits in IoT platforms. In Proceedings of the 10th International Conference on the Internet of Things, Malmö, Sweden, 6–9 October 2020. [Google Scholar] [CrossRef]
- Carlo, Z.; Carraro, M.; Marchi, M.; Pappalardo, S. Volunteered Geographic Information for Mapping Urban Climate and AIR Quality: Testing and Assessing ’Sniffer Bikes’ with Low-Cost Sensors. Int. Arch. Photogramm. Remote Sens. Spat. Inf. Sci. 2023, 48, 555–561. [Google Scholar] [CrossRef]
- Random Nerd Tutorials. ESP32 Web Bluetooth (BLE): Getting Started Guide. Available online: https://randomnerdtutorials.com/esp32-web-bluetooth/ (accessed on 21 February 2025).
- Yadav, S.; Jain, M. Variation in concentrations of particulate matter with various sizes in different weather conditions in mining zone. Int. J. Environ. Sci. Technol. 2020, 17, 695–708. [Google Scholar] [CrossRef]
- Zusman, M.; Schumacher, C.S.; Gassett, A.J.; Spalt, E.W.; Austin, E.; Larson, T.V.; Carvlin, G.; Seto, E.; Kaufman, J.D.; Sheppard, L. Calibration of low-cost particulate matter sensors: Model development for a multi-city epidemiological study. Environ. Int. 2020, 134, 105329. [Google Scholar] [CrossRef] [PubMed]
- Joshi, I.A. Unblind the charts: Towards Making Interactive Charts Accessible in Android Applications. arXiv 2021, arXiv:2109.12442. [Google Scholar]
- Daniel Lozano Valdés. iOS Architecture: MVVM-C, Introduction. Available online: https://medium.com/sudo-by-icalia-labs/ios-architecture-mvvm-c-introduction-1-6-815204248518 (accessed on 21 February 2025).
- Lou, T. A Comparison of Android Native App Architecture—MVC, MVP and MVVM. Master’s Thesis, Aalto University, Espoo, Finland, 2016. [Google Scholar]
- Random Nerd Tutorials. ESP32 BLE Peripheral (Server): Environmental Sensing Service. Available online: https://randomnerdtutorials.com/esp32-ble-server-environmental-sensing-service/#demonstration (accessed on 21 February 2025).
- Bluetooth SIG. Bluetooth Document Assigned Numbers. 2024. Available online: https://www.bluetooth.com/wp-content/uploads/Files/Specification/HTML/Assigned_Numbers/out/en/Assigned_Numbers.pdf?v=1718639667001 (accessed on 21 February 2025).
- Kent, S. Android Bluetooth Low Energy (BLE) Resources, 2018–2024. Available online: https://gist.github.com/stkent/a7f0d6b868e805da326b112d60a9f59b?permalink_comment_id=3592424 (accessed on 21 February 2025).
- Howarth, J. iPHONE vs ANDROID USER STATS (2024 Data). 2024. Available online: https://explodingtopics.com/blog/iphone-android-users (accessed on 21 February 2025).
- Noori, Z.; Eriksson, C. UI Performance Comparison of Jetpack Compose and XML in Native Android Applications. Bachelor’s Thesis, KTH Royal Institute of Technology, Stockholm, Sweden, 2023. [Google Scholar]
- Android Developers. Navigation. 2024. Available online: https://developer.android.com/guide/navigation (accessed on 21 February 2025).
- Mapbox. Mapbox Maps Compose Extension. 2024. Available online: https://github.com/mapbox/mapbox-maps-android/blob/main/extension-compose/README.md (accessed on 21 February 2025).
- Korunoski, M.; Stojkoska, B.R.; Trivodaliev, K. Internet of things solution for intelligent air pollution prediction and visualization. In Proceedings of the IEEE EUROCON 2019-18th International Conference on Smart Technologies, Novi Sad, Serbia, 1–4 July 2019; pp. 1–6. [Google Scholar]
- Leandro Vigna, J.F.; Damassa, T. The History of Carbon Dioxide Emissions. 2024. Available online: https://www.wri.org/insights/history-carbon-dioxide-emissions (accessed on 21 February 2025).
- Janarthanan, R.; Partheeban, P.; Somasundaram, K.; Elamparithi, P.N. A deep learning approach for prediction of air quality index in a metropolitan city. Sustain. Cities Soc. 2021, 67, 102720. [Google Scholar] [CrossRef]
- CityAirQ. CityAirQ Application Feedback. 2024. Available online: https://docs.google.com/forms/d/e/1FAIpQLSdpK44fr4BuOazFPr6ApJPl3RNfPHbSVvF_xr2Os_7TjzHZyw/viewform?usp=sharing (accessed on 21 February 2025).
- Khatoon, A.; Corcoran, P. Android permission system and user privacy—A review of concept and approaches. In Proceedings of the 2017 IEEE 7th International Conference on Consumer Electronics-Berlin (ICCE-Berlin), Berlin, Germany, 3–6 September 2017; pp. 153–158. [Google Scholar]


| Parameter | Range | Unit Measure |
|---|---|---|
| Temperature | [−15.0, 57.0] | °C—degrees Celsius |
| Humidity | [0.0, 100.0] | %—percentage |
| Pressure | [950.0, 1047.25] | hPa—Hectopascals |
| Altitude | [−420.0, 8848.0] | m—meters |
| CO2 | [400.0, 2100.0] | ppm—Parts Per Million |
| PM1 | [0.0, 250.0] | g/m3—micrograms of pollutant per air cubic metre |
| PM2.5 | [0.0, 250.0] | g/m3 |
| PM10 | [0.0, 430.0] | g/m3 |
| AQI | [0.0–500.0] | [18] |
| Component | Standby Current (mA) | Active Current (mA) | Standby Time in 1h (s) | Active Time in 1h (s) | Consumption (mAh) |
|---|---|---|---|---|---|
| Screen | 0.035 | 10 | 3000 | 600 | 1.69 |
| BME680 | 0.1 | 17 | 2460 | 1140 | 5.45 |
| microSD | 1 | 80 | 3350 | 250 | 6.48 |
| ESP32 | 1 | 24 | 0 | 3600 | 24 |
| PM sensor | 2 | 100 | 2400 | 1200 | 34.66 |
| CO2 sensor | 60 | 150 | 3000 | 600 | 75 |
| GPIO | 1 | 1 | 3570 | 30 | 1 |
| 3.3 V source | 5 | 10 | 1800 | 1800 | 7.5 |
| 5 V source | 0.1 | 2 | 0 | 3600 | 2 |
| Voltage divider | 0.2 | 0.2 | 0 | 3600 | 0.2 |
| Total | 157.8 |
| Product | Parameters | Device | Visualisation | Price Range |
|---|---|---|---|---|
| CityAirQ | temperature, humidity, pressure, altitude, C02, PM1.0, PM2.5, PM10 | small, low power BLE embedded gadgets attached to bikes | Android App with live data, historical charts, dynamic maps and alerts | 86$ |
| Sodaq Air | humidity, pressure, PM1.0, PM2.5, PM10 (reported overestimation) | similar device with super capacitor, lower data bandwidth | recorded data sent to “Know Your AIR” global air quality platform for mapping | 174€ |
| Oizom Polludrone | temperature, humidity, pressure, PM1.0, PM2.5, PM10, PM100, CO2, SO2, NO2, O3, H2S, ambient noise and light (data calibration) | 7.2 kg static, cutting edge device, weather resistant and solar powered | Separate Product (mobile and web) for real-time data, mapping and alerts | 3.9–9.0k€ |
| IQAir AirVisual Pro | temperature, humidity, pressure, altitude, C02, PM1.0, PM2.5, PM10, very reliable data | medium-sized device with LCD screen and Wi-Fi connectivity | #1 Rated Air Quality user-friendly App with real-time, historical, and forcasted air quality insights and alerts | 319€ |
| AirBeam3 | temperature, humidity, PM1.0, PM2.5, PM10 | palm-sized device with onboard GPS, SD card, can communicate via BLE, WiFi, or cellular 4G | BLE connection to AirCasting mobile app and web server, graphs and maps | 249€ |
| Atmotube Pro | temperature, humidity, pressure, PM1.0, PM2.5, PM10 | similar to AirBeam3, but smaller in size and equipped with LEDs | connected to mobile app, renders graphs and maps | 189€ |
| Compared Solution | Advantages of CityAirQ |
|---|---|
| Sodaq Air |
|
| Oizom Polludrone |
|
| IQAir AirVisual Pro |
|
| AirBeam3 |
|
| Atmotube Pro |
|
Disclaimer/Publisher’s Note: The statements, opinions and data contained in all publications are solely those of the individual author(s) and contributor(s) and not of MDPI and/or the editor(s). MDPI and/or the editor(s) disclaim responsibility for any injury to people or property resulting from any ideas, methods, instructions or products referred to in the content. |
© 2025 by the authors. Licensee MDPI, Basel, Switzerland. This article is an open access article distributed under the terms and conditions of the Creative Commons Attribution (CC BY) license (https://creativecommons.org/licenses/by/4.0/).
Share and Cite
Dinica, M.; Popescu, D.; Tudose, D.; Dumitru, B.; Ruse, L.; Pitale, A.; Preda, M. CityAirQ—Pollution Tracking System. Sustainability 2025, 17, 4062. https://doi.org/10.3390/su17094062
Dinica M, Popescu D, Tudose D, Dumitru B, Ruse L, Pitale A, Preda M. CityAirQ—Pollution Tracking System. Sustainability. 2025; 17(9):4062. https://doi.org/10.3390/su17094062
Chicago/Turabian StyleDinica, Mihnea, Denisa Popescu, Dan Tudose, Bianca Dumitru, Laura Ruse, Abhinuv Pitale, and Mihai Preda. 2025. "CityAirQ—Pollution Tracking System" Sustainability 17, no. 9: 4062. https://doi.org/10.3390/su17094062
APA StyleDinica, M., Popescu, D., Tudose, D., Dumitru, B., Ruse, L., Pitale, A., & Preda, M. (2025). CityAirQ—Pollution Tracking System. Sustainability, 17(9), 4062. https://doi.org/10.3390/su17094062