Article

Characteristics of the Water Environment and the Mechanism of Nitrogen Metabolism in the Xisha River

College of Heilongjiang River and Lake Chief, Heilongjiang University, Harbin 150080, China
*
Author to whom correspondence should be addressed.
Sustainability 2025, 17(9), 4060; https://doi.org/10.3390/su17094060
Submission received: 23 March 2025 / Revised: 24 April 2025 / Accepted: 28 April 2025 / Published: 30 April 2025

Abstract

:
The nitrogen cycle is the key to the healthy operation of river ecosystems and plays an important role in maintaining the ecological balance, purifying water quality, and promoting the circulation of material. The Xisha River was chosen as the research object to analyze the water quality condition from 2021 to 2023, and the microbial diversity of nitrogen metabolism, functional genes, and metabolic pathways in the water body were analyzed using macro-genomics technology. The results showed that total nitrogen (TN) was the main exceedance factor in the water body, and ammonia nitrogen (NH3-N), TN, and total phosphorus (TP) were the key factors affecting the water quality. The downstream station (W2) exhibited the most significant water quality changes, while the upstream station (W5) showed the highest biodiversity and abundance. The top five genera in abundance in the water body were unclassified__c__Actinomycetia, unclassified__p__Bacteroidota, Paenisporosarcina, Candidatus_Planktophila, and unclassified__c__Betaproteobacteria. The five most abundant nitrogen metabolism genes were K01915 (nitrate reductase), K00265 (nitrite reductase), K01673 (ammonium transporter), K00266 (nitrite reductase), and K02575 (nitrate reductase), each contributing to critical nitrogen cycling processes such as denitrification, nitrification, and nitrogen assimilation. The six major nitrogen metabolism pathways were denitrification (M00529), anisotropic nitrate reduction (M00528), anisotropic nitrate reduction (M00529). anisotropic nitrate reduction (M00530), complete nitrification (M00804), nitrate assimilation (M00615), methylaspartate cycling (M00740), and assimilatory nitrate reduction (M00531). TN was identified as the primary environmental factor influencing both microbial communities and nitrogen metabolism genes. Co-occurrence network analysis identified K01915 (nitrate reductase), K00459 (ammonium transporter), K01673 (ammonium transporter), and K00261 (nitrate reductase) as pivotal genes involved in nitrogen metabolism. This study reveals the microbial-driven nitrogen cycle and lays the foundation for mitigating nitrogen pollution in the Xisha River.

1. Introduction

Rivers are key components of the Earth’s ecosystem, assuming important functions such as water resource regulation, the cycling of materials, and the provision of biological habitats [1]. With the rapid development of industrialization and urbanization, the problem of water pollution is becoming more and more serious [2,3,4], especially nitrogen pollution, which has become a major environmental problem facing global water resource management [5,6,7]. Excessive nitrogen pollutants (e.g., nitrates and ammonium salts) not only lead to the eutrophication of water bodies and disrupt the ecological balance, but they may also affect water quality and water body health through biogeochemical cycles [8,9]. The nitrogen cycling process involves complex microbial metabolic pathways, and the microbial community plays a central role in the nitrogen metabolism of water bodies, especially in the processes of nitrification, denitrification, and nitrogen fixation [10,11]. As a typical watershed, the Xisha River is subject to multiple influences from agricultural surface pollution, urbanization process, and industrial discharge [12,13], and the water quality changes are complicated. Changes in water quality indicators reflect shifts in nitrogen cycling and water quality health, while the structure and function of the water body microbial community, especially key microbial species related to nitrogen metabolism, are directly related to the removal of nitrogen pollution and the improvement or deterioration in water quality [14].
In recent years, research on the nitrogen cycle in water bodies has received wide attention [15,16,17]. For example, Xia et al. found that human activities and climate change have a great influence on the source and transportation of nitrogen into the river system [18]. Zhang et al. found that the denitrification process plays a dominant role in the river nitrogen cycle through the study of the Qingliu River [19]. With the development of macro-genomics technology, researchers have been able to deeply analyze the composition of microbial communities in water bodies and their functional genes related to nitrogen metabolism. Lawson et al. found that among the heterotrophic bacteria, Chlorobiomorpha in especial play an important role in protein degradation and nitrogen cycling [20]. Deng et al. found that in the Yangtze River, organic nitrogen metabolism and nitrate reduction pathway functional genes are more diverse and abundant than other nitrogen cycle genes [21]. These findings provide an important foundation for the further understanding of the microbial response to nitrogen pollution. However, fewer studies have combined water quality monitoring, microbiomics, and functional genes to explore the dynamic changes and regulatory mechanisms of nitrogen metabolism.
The main objective of this study was to analyze the microbial community structure, nitrogen metabolism process, and water quality characteristics in the Xisha River water body, especially to explore the impact of river pollution on microbial diversity and the nitrogen cycle. First, the water quality characteristics of the Xisha River from 2021 to 2023 were systematically analyzed, especially the trends of key water quality indicators, such as total nitrogen, total phosphorus, and chemical oxygen demand (COD), to identify an intensification or improvement in pollution. By monitoring the spatial and temporal changes in water quality, we can further reveal the sources of nitrogen pollution and its impact on the health of water bodies. We analyze the diversity of water body microbial communities, especially the key genera related to nitrogen metabolism, using macro-genomics techniques to assess the impact of river pollution on microbial diversity and identify the key microbial genera related to nitrogen cycling. Combined with the analysis of functional genes and nitrogen metabolism pathways, we explore the association network between nitrogen metabolism genes and microbial communities, identify key genes and metabolic processes affecting nitrogen cycling in rivers, and propose possible regulatory approaches. Through these analyses, this study aims to provide a scientific basis for water quality management and pollution control, as well as theoretical support for future nitrogen pollution control strategies.

2. Materials and Methods

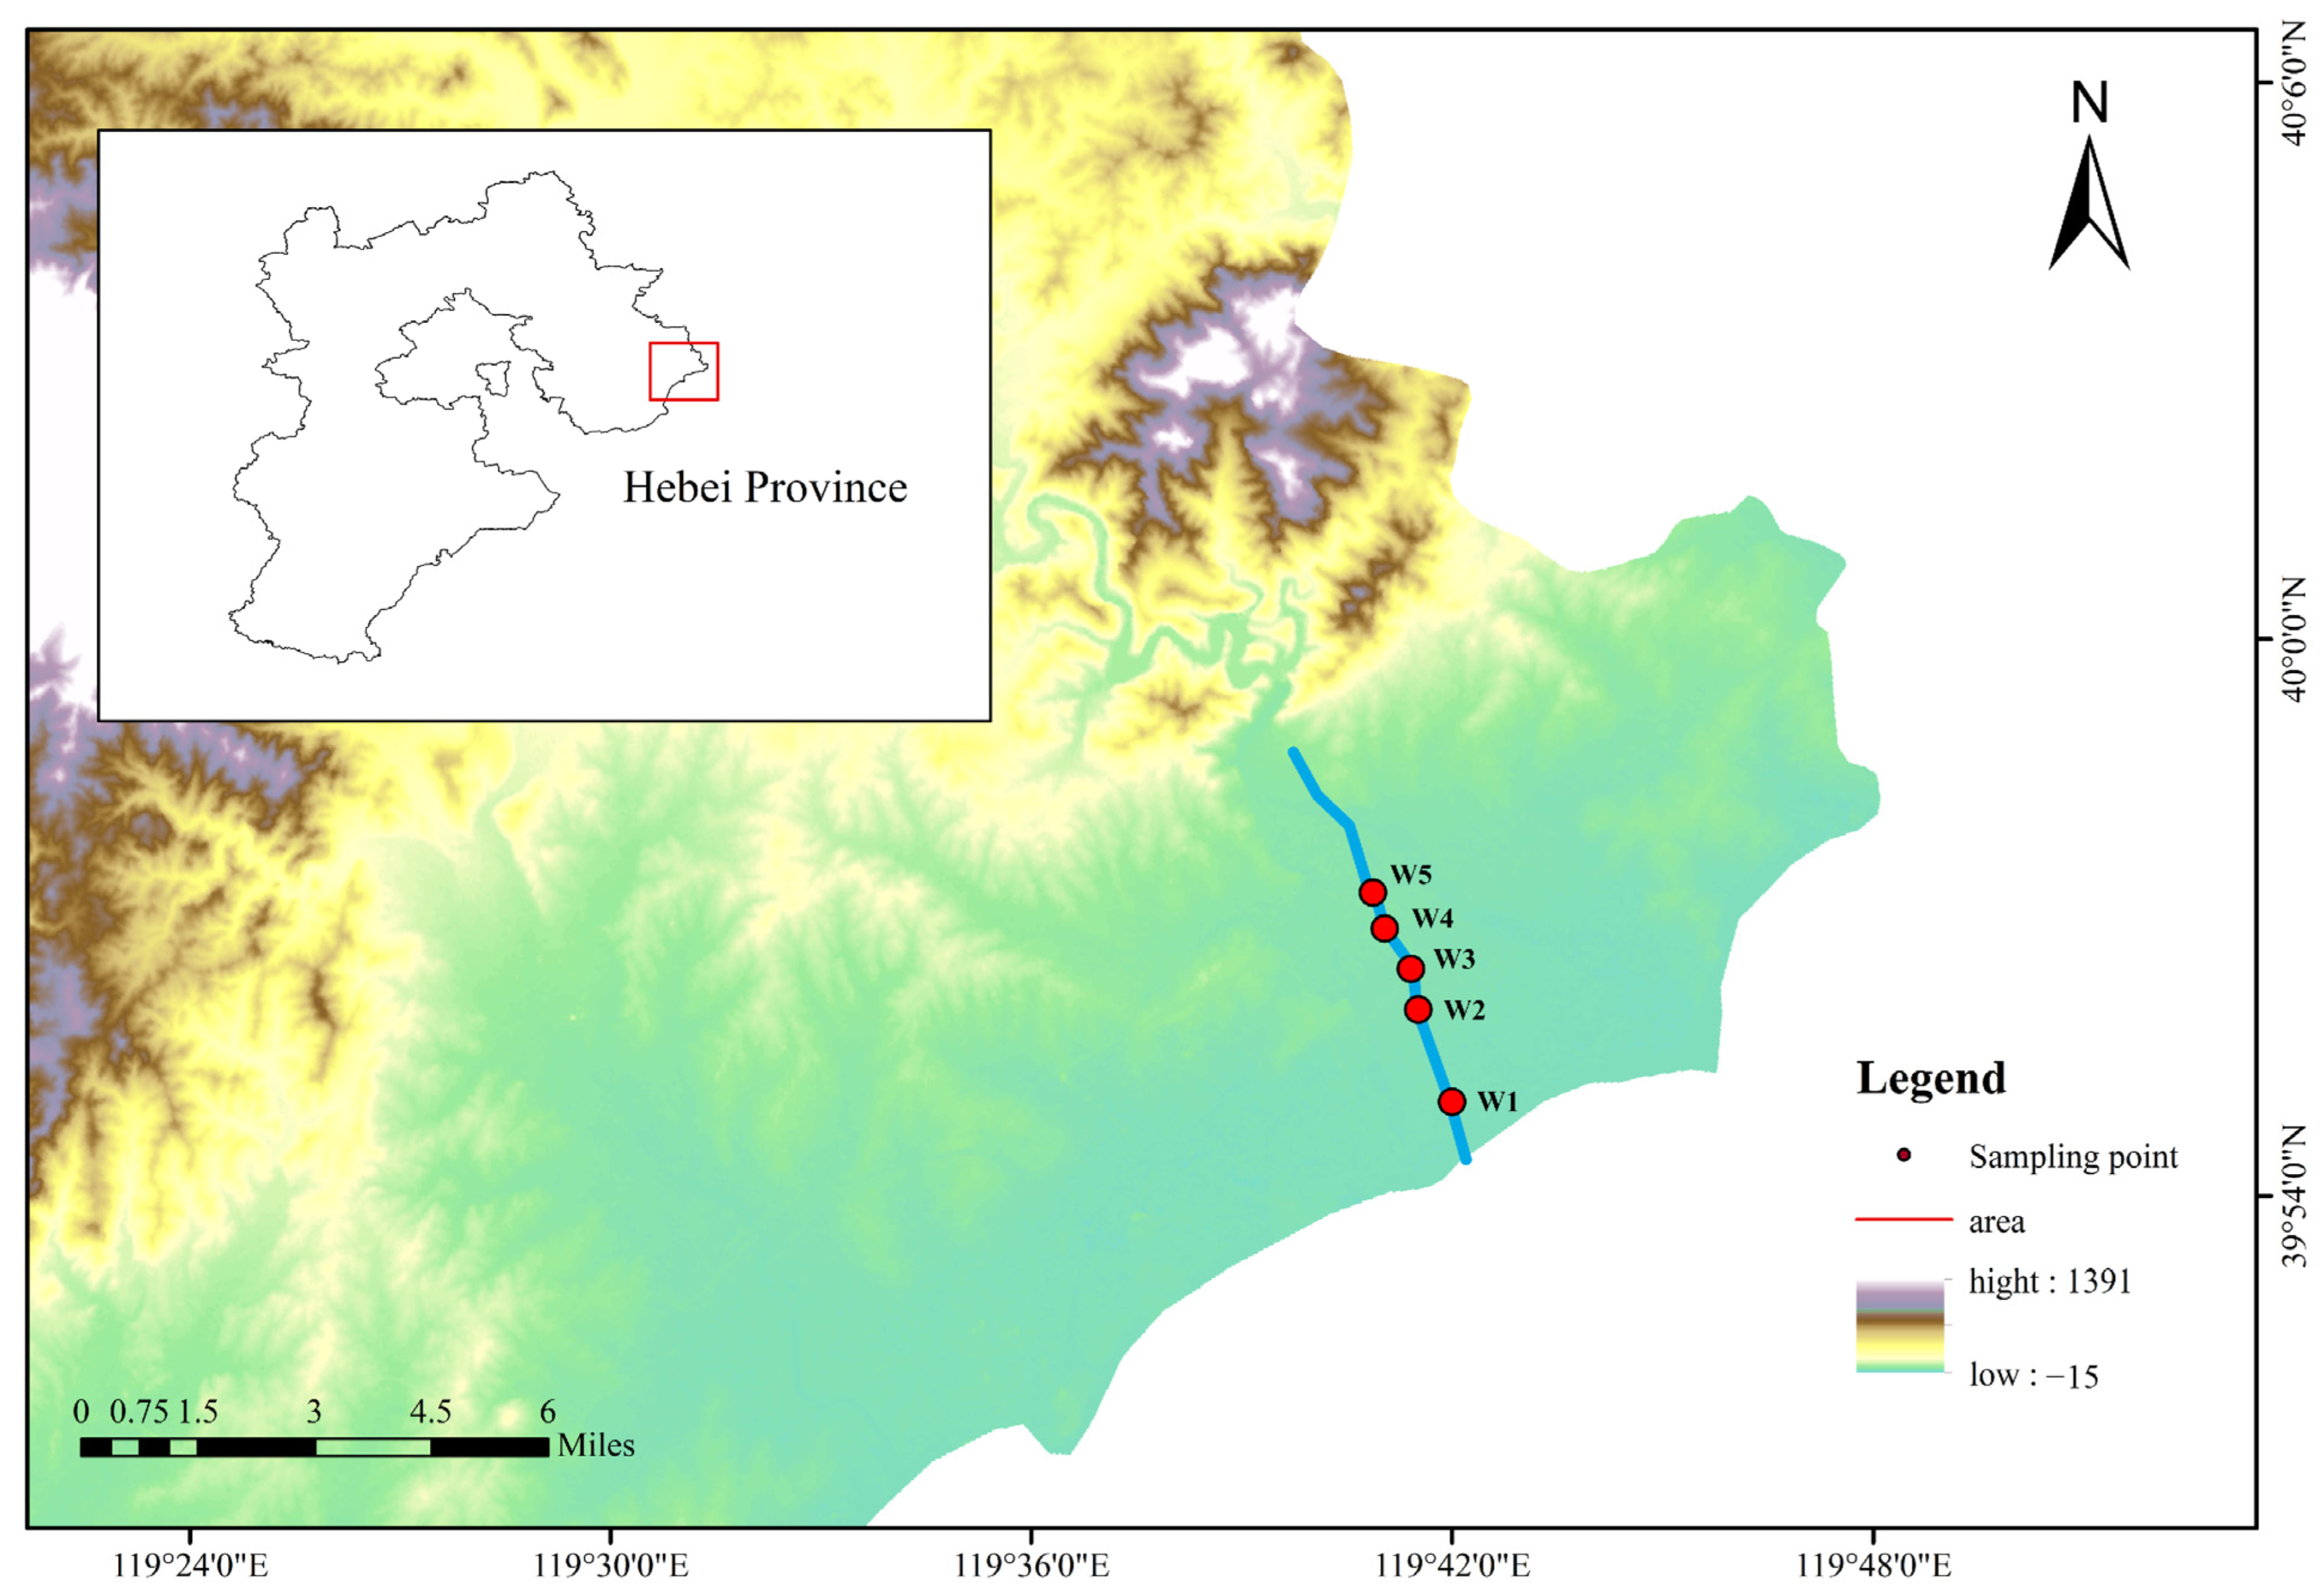
2.1. Sample Collection

The Xisha River is located at the junction of Shanhaiguan District and Harbor District in Qinhuangdao City, Hebei Province. The watershed covers an area of 62.5 square kilometers, with a length of 19 km. Water samples were collected at five stations (W1–W5) along the Xisha River according to the watershed. The first section was taken from the entrance of the Bohai Sea, and the samples were collected sequentially from south to north. The locations and coordinates of the sampling stations are shown in Figure 1 and Table 1. At each sampling stations, two 1-liter water samples were collected in sterile polyethylene bottles, mixed, and then divided into two portions. One mixed sample was stored at 4 °C and filtered through 0.22 μm hydrophilic microporous membranes (Millipore Corporation, Burlington, MA, USA) within 24 h to isolate the bacterial cells, and the filtered biomass was stored at −80 °C for macro-genomic analysis. The other copy was refrigerated and brought back to the laboratory for the routine analysis of physical and chemical indices.

2.2. Water Quality Analysis

2.2.1. Methods of Analysis of Physical and Chemical Indicators

The water samples were analyzed for a number of physical and chemical parameters to determine water quality. These parameters include pH, TP, TN, dissolved oxygen (DO), permanganate index (CODMn), NH3-N, and COD. All the indicators were measured according to national standard methods. Water quality parameters were measured using the following methods: pH by the electrode method [22] (HJ 1147-2020), TP by the ammonium molybdate spectrophotometric method [23] (GB 11893-89), TN by the alkaline potassium persulfate digestion UV spectrophotometric method [24] (HJ 636-2012), DO by the iodometric method [25] (GB 7489-87), CODMn by the potassium permanganate titration method [26] (GB 11892-89), NH3-N by the salicylic acid spectrophotometry [27] (HJ 536-2009), and COD by the dichromate reflux method [28] (GB/T 32208-2015).

2.2.2. PCA Analysis and Seasonal Statistical Analysis

Principal component analysis (PCA) was used to assess changes in water quality at five sampling stations (W1–W5) from 2021 to 2023. Water quality parameters (pH, TP, TN, DO, CODMn, NH3-N, COD) were measured once a month (January to October) at each sampling station. The PCA was conducted using Origin2021 v 10.2 (OriginLab, Northampton, MA, USA). The correlation matrix was used to calculate the principal components, and the principal components with eigenvalues greater than 1 were retained to identify the significant components. Load plots were generated to visualize the contribution of each water quality parameter to the principal components, with vectors indicating the strength and direction of the effect. Score plots were also generated showing the distribution and clustering of samples (W1–W5) in the top two principal components. The significance level for all analyses was p < 0.05.
For the seasonal statistical analysis, normality was assessed using the Shapiro–Wilk test, and variance homogeneity was tested with Levene’s test for each parameter by site and season. Due to prevalent non-normal distributions and heterogeneous variances, the non-parametric Kruskal–Wallis test was applied to detect significant seasonal differences for each parameter and site (α = 0.05). Where significant differences were identified, Dunn’s test with Bonferroni correction was used for post hoc pairwise comparisons to determine specific seasonal variations. All statistical analyses were performed using R v3.3.1.

2.3. Macro-Genomic Analysis

DNA extraction was performed using the E.Z.N.A.® Soil DNA Kit (Omega, Norcross, GA, USA), followed by the measurement of the DNA’s concentration and purity. DNA integrity was assessed via 1% agarose gel electrophoresis. DNA was fragmented using the Covaris M220 (Gene Company, Beijing China), and fragments around 350 bp were selected for PE library construction. The library was then constructed using NEXTFLEX Rapid DNA-Seq (Bioo Scientific, Austin, TX, USA), and metagenomic sequencing was conducted on the Illumina NovaSeq 6000 platform (Illumina, San Diego, CA, USA).

2.4. Methods of Analysis

The 3′ and 5′ adapter sequences of reads were trimmed using fastp (https://github.com/OpenGene/fastp, version 0.20.0) [29], followed by assembly with MEGAHIT (https://github.com/voutcn/megahit, version 1.1.2) to obtain contigs ≥ 300 bp [30]. These contigs were then subjected to ORF prediction using Prodigal (https://github.com/hyattpd/Prodigal, version 2.6.3) [31], and genes with a nucleotide length ≥ 100 bp were selected and translated into amino acid sequences. The predicted gene sequences from all the samples were clustered with CD-HIT (http://weizhongli-lab.org/cd-hit/, version 4.7) (90% identity, 90% coverage), and the longest gene from each cluster was used as the representative sequence to create a non-redundant gene set [32]. High-quality reads from each sample were aligned to this gene set using SOAPaligner (https://github.com/ShujiaHuang/SOAPaligner, version soap2.21 release) [33], with a 95% identity threshold, to determine the gene abundance in each sample. The amino acid sequences of the non-redundant gene set were aligned with the KEGG database using Diamond (https://github.com/bbuchfink/diamond, version 2.0.13) (BLASTP alignment with an e-value threshold of 1 × 10⁻⁵) to obtain the corresponding KEGG functions [34]. The sum of the corresponding gene abundances (KO, Pathway, Module, etc.) was then used to calculate the abundance of the corresponding functional category.

2.5. Correlation Heatmap Analysis

Correlation Heatmap analysis is performed by calculating the correlation coefficients (Spearman rank correlation coefficient, Pearson correlation coefficient, etc.) between the environmental factors and the selected species/functions, and the matrix of values obtained is visualized in a Heatmap diagram. In this study, a Spearman correlation analysis was used to correlate the magnitude of the ranks of the two sets of variables, in order to obtain the relationship between an independent variable and the dependent variable and the strength of the influence of the independent variable on the dependent variable. It firstly arranges the data of the two sets of variables in order of magnitude, then replaces the raw data with ranks and finally calculates the correlation between the ranks. After that, the correlation Heatmap is plotted using R v3.3.1.

2.6. Data Analysis

Data were analyzed through the Megibio Cloud platform (https://cloud.majorbio.com) and processed using Eccel 2019 software, based on the algorithms corresponding to the index analysis in Mothur v.1.30.2 (https://mothur.org/wiki/calculators/), including Shannon, Chao1, ACE and Simpson indices calculated using R v3.3.1 (R Statistical Computing Project, Vienna, Austria). Based on the corresponding taxonomic data tables, R v3.3.1 was used to draw genus-level community structure maps, Circos-0.67-7 (http://circos.ca/) software was used to draw nitrogen metabolism functional gene abundance maps, and Gephi v0.10.1 (https://gephi.org/) was used to map the network of genus level communities with nitrogen metabolism functional genes.

3. Results

3.1. Water Quality Characteristics Analysis

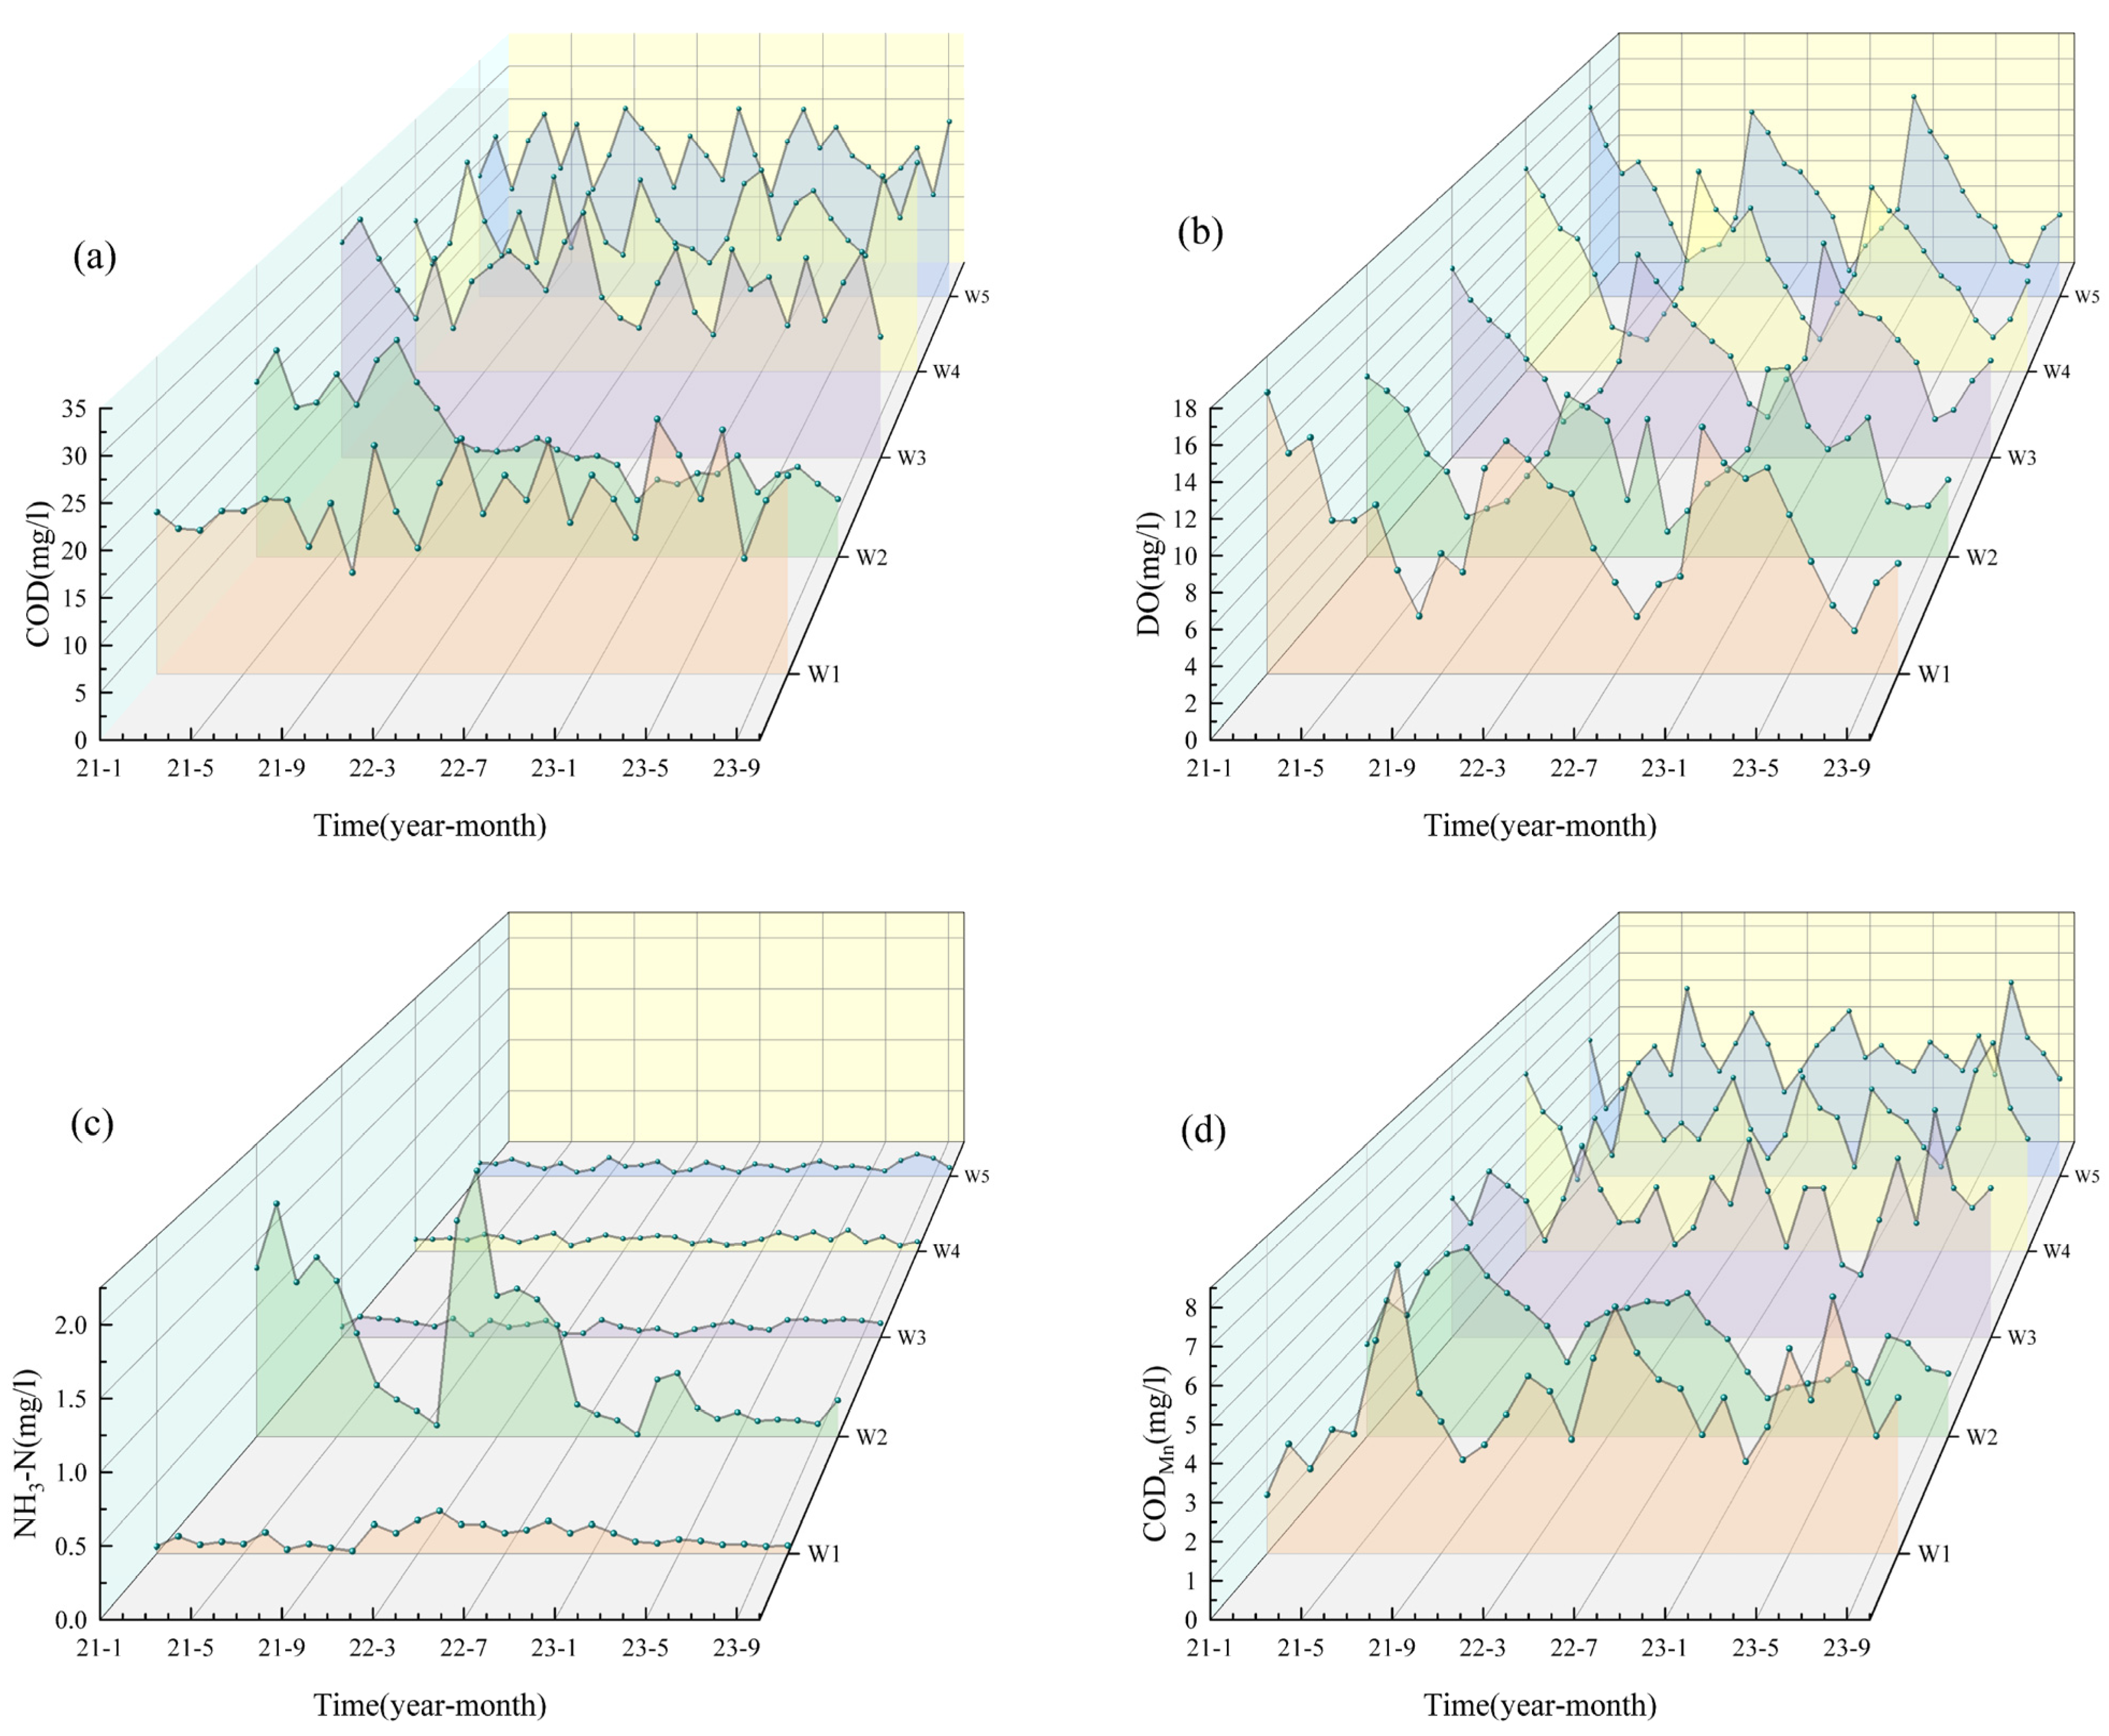
3.1.1. Water Quality Analysis from 2021 to 2023

This study investigated the water quality changes from 2021 to 2023 at five major cross-sections of the Xisha River and analyzed the fluctuation in water quality with time and geographic location (Figure 2). According to the Chinese Environmental Quality Standard for Surface Water [35] (GB3838-2002), the analysis of the water quality of the Xisha River showed that at all times and sections, TN seriously exceeded the Class V water standard (2 mg/L).
The COD concentration (Figure 2a) of the Xisha River showed large fluctuations in three years, in which the sampling stations W1, W3, W4, and W5 were basically between Class III and Class IV water, and sampling station W2 showed a significant decrease in COD concentration values after 2022, reaching the Class II water standard. DO (Figure 2b) concentrations were mostly within the Class III water quality standard, but the most significant decrease in dissolved oxygen was observed during the summer months (June to September) of each year, with values at some sampling stations falling close to the minimum requirement of the Class V water quality standard (2 mg/L). NH3-N concentrations (Figure 2c) showed a large difference. The W1, W3, W4, and W5 sampling stations were basically between Class I and Class II water, while the W2 sampling station NH3-N concentration was significantly higher than the other sampling stations’ and basically above Class III water in 2021 and 2022; the NH3-N concentration in 2023 showed a decreasing trend, and the concentration was similar to other sampling stations. The CODMn concentration (Figure 2d) was basically in Class II and Class III. TN concentrations (Figure 2e) were all more than Class V water standards (2 mg/L), from the finishing point of view; the W2 sampling station showed TN concentration fluctuations; the maximum concentration of 16.46 mg/L, reached the Class V water standards (2 mg/L) by 8 times, while in 2023, the TN concentration declined considerably, similar to the concentration of other sampling stations. TP concentrations (Figure 2f) fluctuated more markedly, with W2’s water body TP concentrations significantly higher than the other water bodies’. The overall pH of the Xisha River (Figure 2g) was within the normal range.

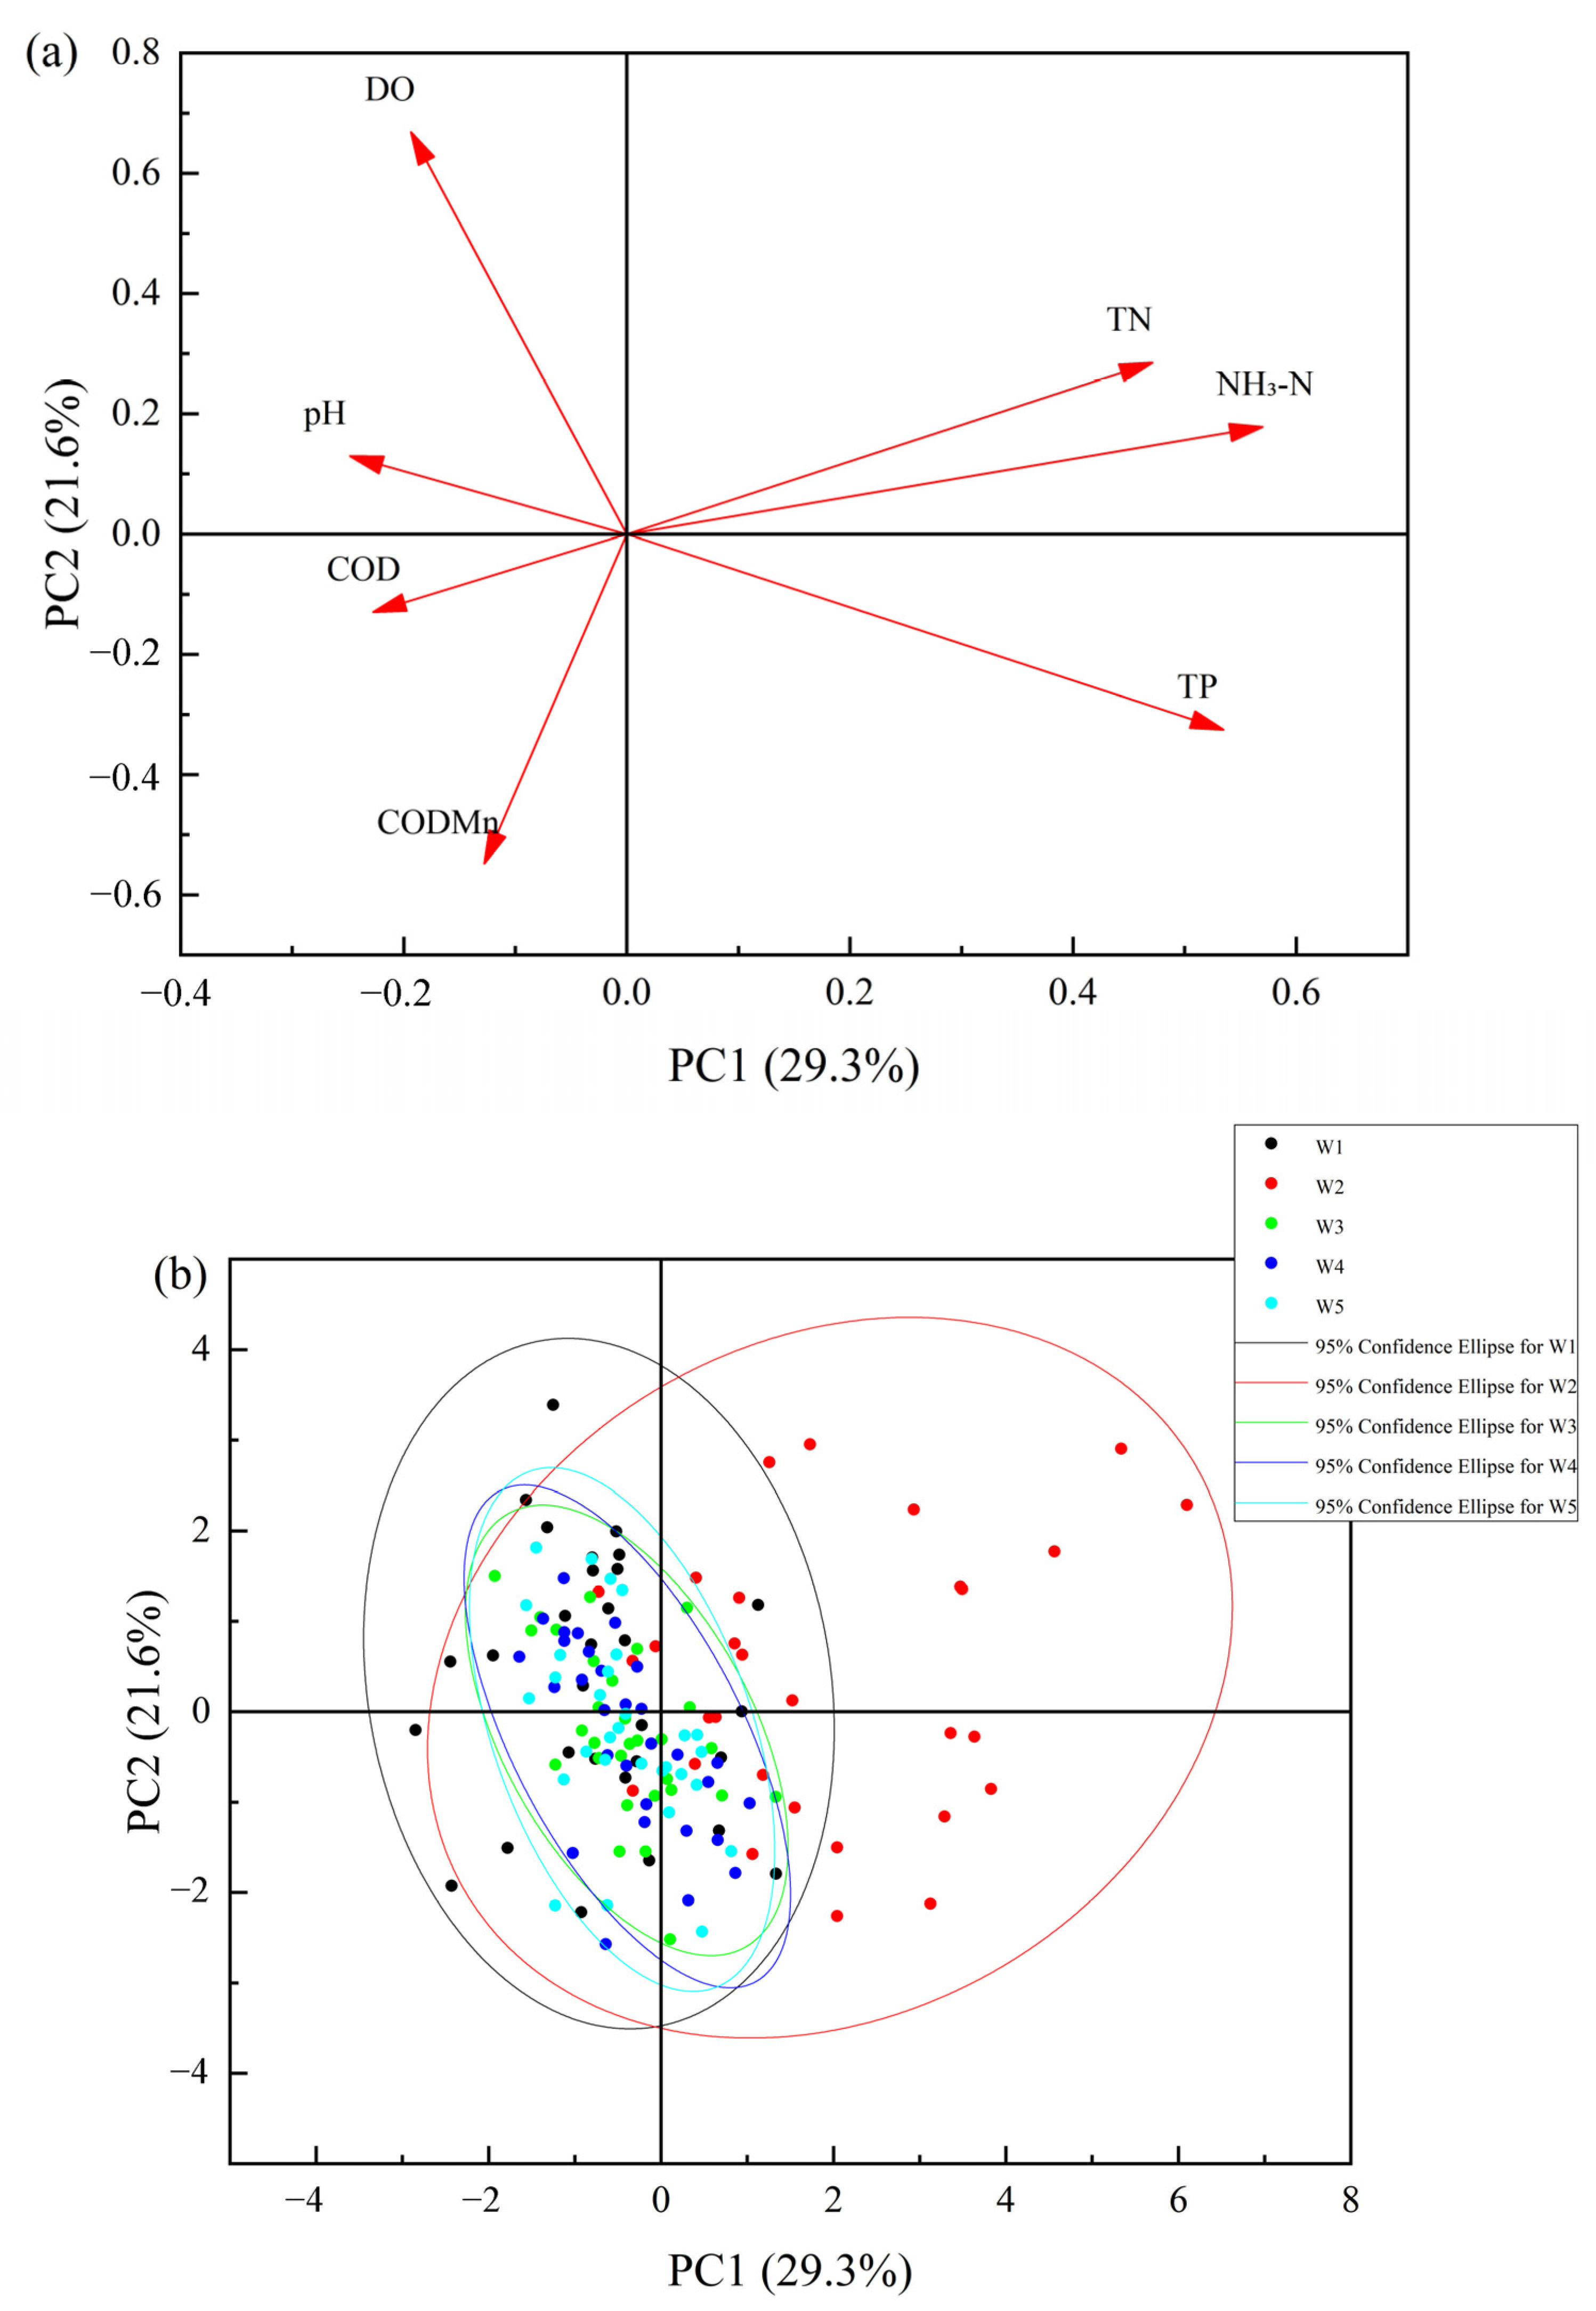
3.1.2. Analysis of the Main Factors of the Degree of Water Pollution

The PCA was used to analyze the pollution level and the main influencing factors of the Xisha River (Figure 3), and the order of the influence of each environmental factor on the water quality was NH3-N > TN > TP > DO > PH > CODMn under a total explanation degree of 50.9%, and the water quality of the sampling station W2 changed a lot, while the water quality of the rest of the sampling stations was stable. Seasonal statistical analyses showed significant seasonal differences in several water quality parameters, with significant differences at site W2.
Figure 3a shows the PCA loading plot of water quality parameters, with PC1 (29.3% variance) strongly associated with TN, NH3-N, and TP, and PC2 (21.6% variance) with DO and pH, together explaining 50.9% of the water quality variation. Figure 3b depicts the distribution of sampling stations (W1–W5) in PCA space, revealing significant variability at station W2, while W1 and W3–W5 exhibited lower water quality variations from 2021 to 2023.

3.2. Analysis of Microbial Diversity in the Xisha River

3.2.1. The Analysis of Alpha Diversity

Microbial diversity (Shannon, Chao1, ACE, and Simpson indices) was estimated based on the results of the OTU cluster analysis. Higher values of the Shannon’s index indicate the higher diversity of the community, reflecting a combination of species richness and evenness; higher values of the Chao1 and ACE indices indicate higher species richness of the community; higher values of the Simpson’s index indicate lower diversity [36].
The alpha diversity index (Table 2.) indicates that W5 has the highest microbial richness and species diversity. The ranking of the richness index was W5 > W3 > W4 > W2 > W1. The ranking of the diversity index was W5 > W4 > W3 > W2 > W1.

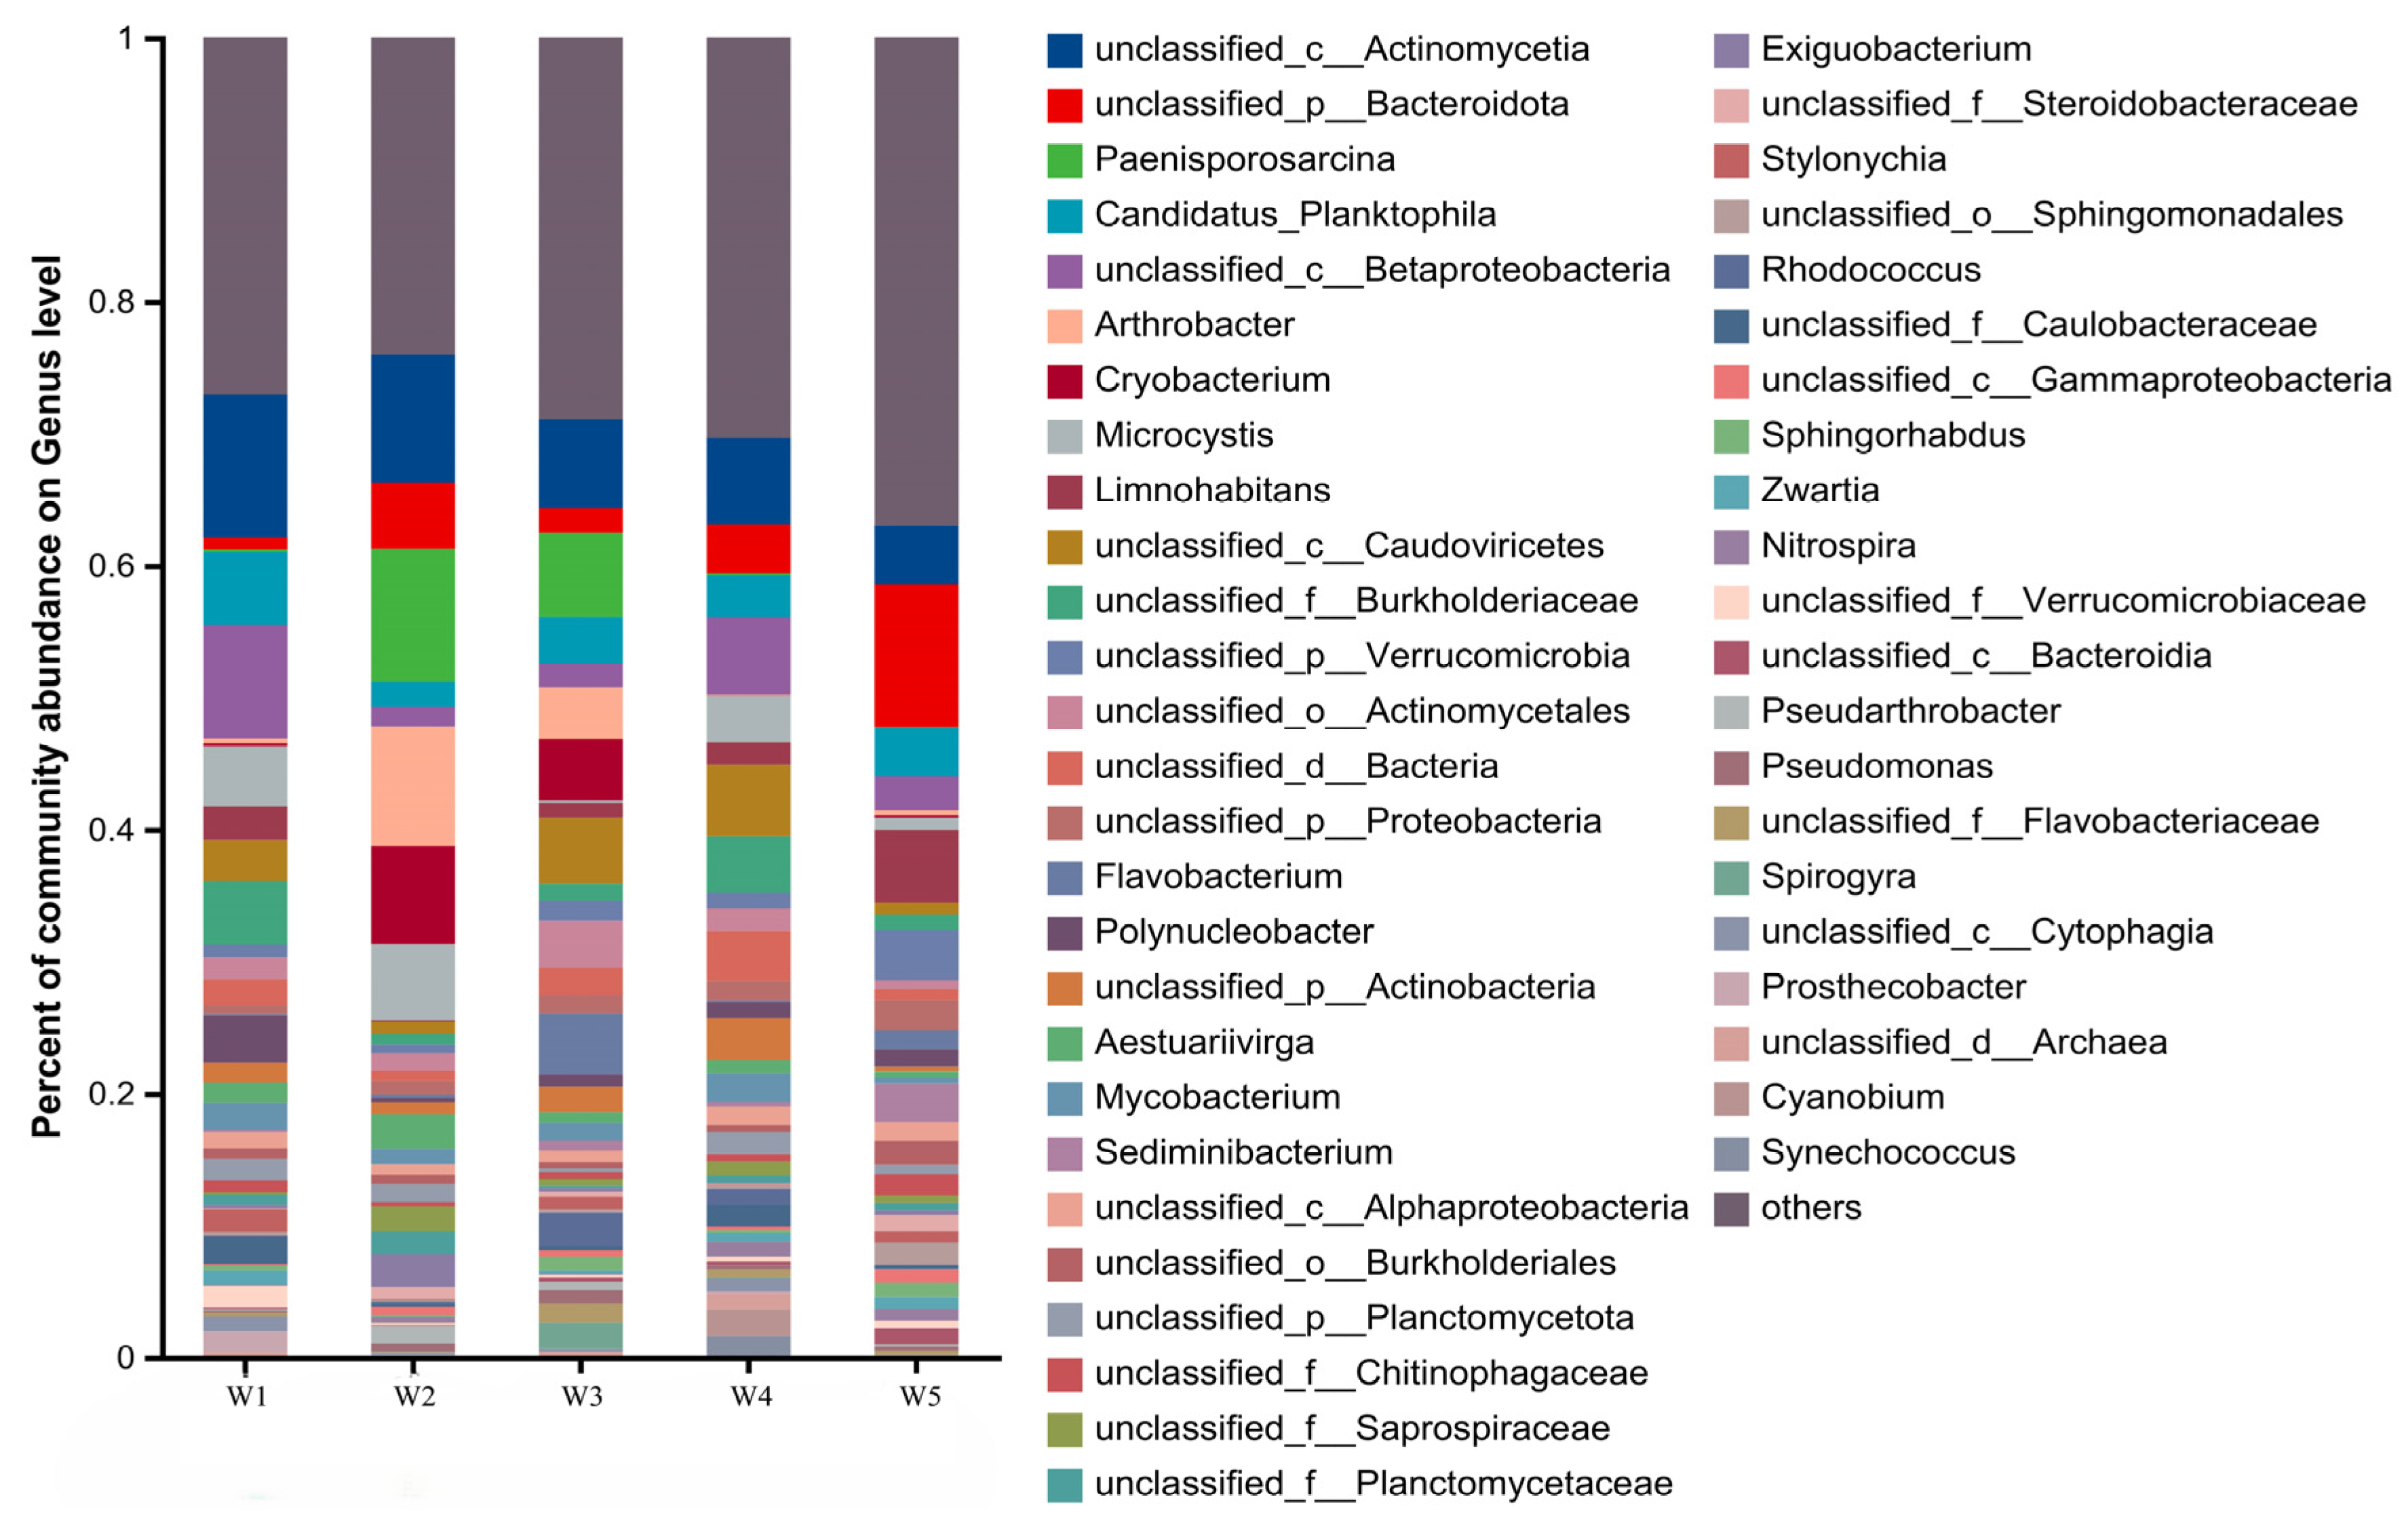
3.2.2. Analysis of Microbial Community Composition

The genus level of the microbial community (abundance > 1%) in the Xisha River (Figure 4) showed that there were 2590 bacterial genera in the water column, and the top five genera with high abundance were unclassified__c__Actinomycetia, unclassified__p__Bacteroidota, Paenisporosarcina, Candidatus_Planktophila, and unclassified__c__Betaproteobacteria.
The primary bacterial genera and their respective abundances in W1 are unclassified_c__Actinomycetia (10.8%), unclassified_c__Betaproteobacteria (8.6%), Candidatus_Planktophila (5.5%), unclassified_f__Burkholderiaceae (4.8%), and Microcystis (4.5%). In W2, they are Paenisporosarcina (10.1%), unclassified_c__Actinomycetia (9.7%), Arthrobacter (9.0%), Cryobacterium (7.4%), and Microcystis (5.8%). In W3, they are unclassified_c__Actinomycetia (6.7%), Paenisporosarcina (6.4%), unclassified_c__Caudoviricetes (5.0%), Cryobacterium (4.7%), and Arthrobacter (3.9%). In W4, they are unclassified_c__Actinomycetia (6.5%), unclassified_c__Betaproteobacteria (5.9%), unclassified_c__Caudoviricetes (5.4%), unclassified_f__Burkholderiaceae (4.3%), and unclassified_d__Bacteria (3.8%). In W5, they are unclassified_p__Bacteroidota (10.8%), Limnohabitans (5.5%), unclassified_c__Actinomycetia (4.5%), and unclassified_p__Verrucomicrobia (3.8%), Candidatus_Planktophila (3.7%).

3.3. Analysis of Key Control Factors of Nitrogen Pollution in Xisha River Water Body

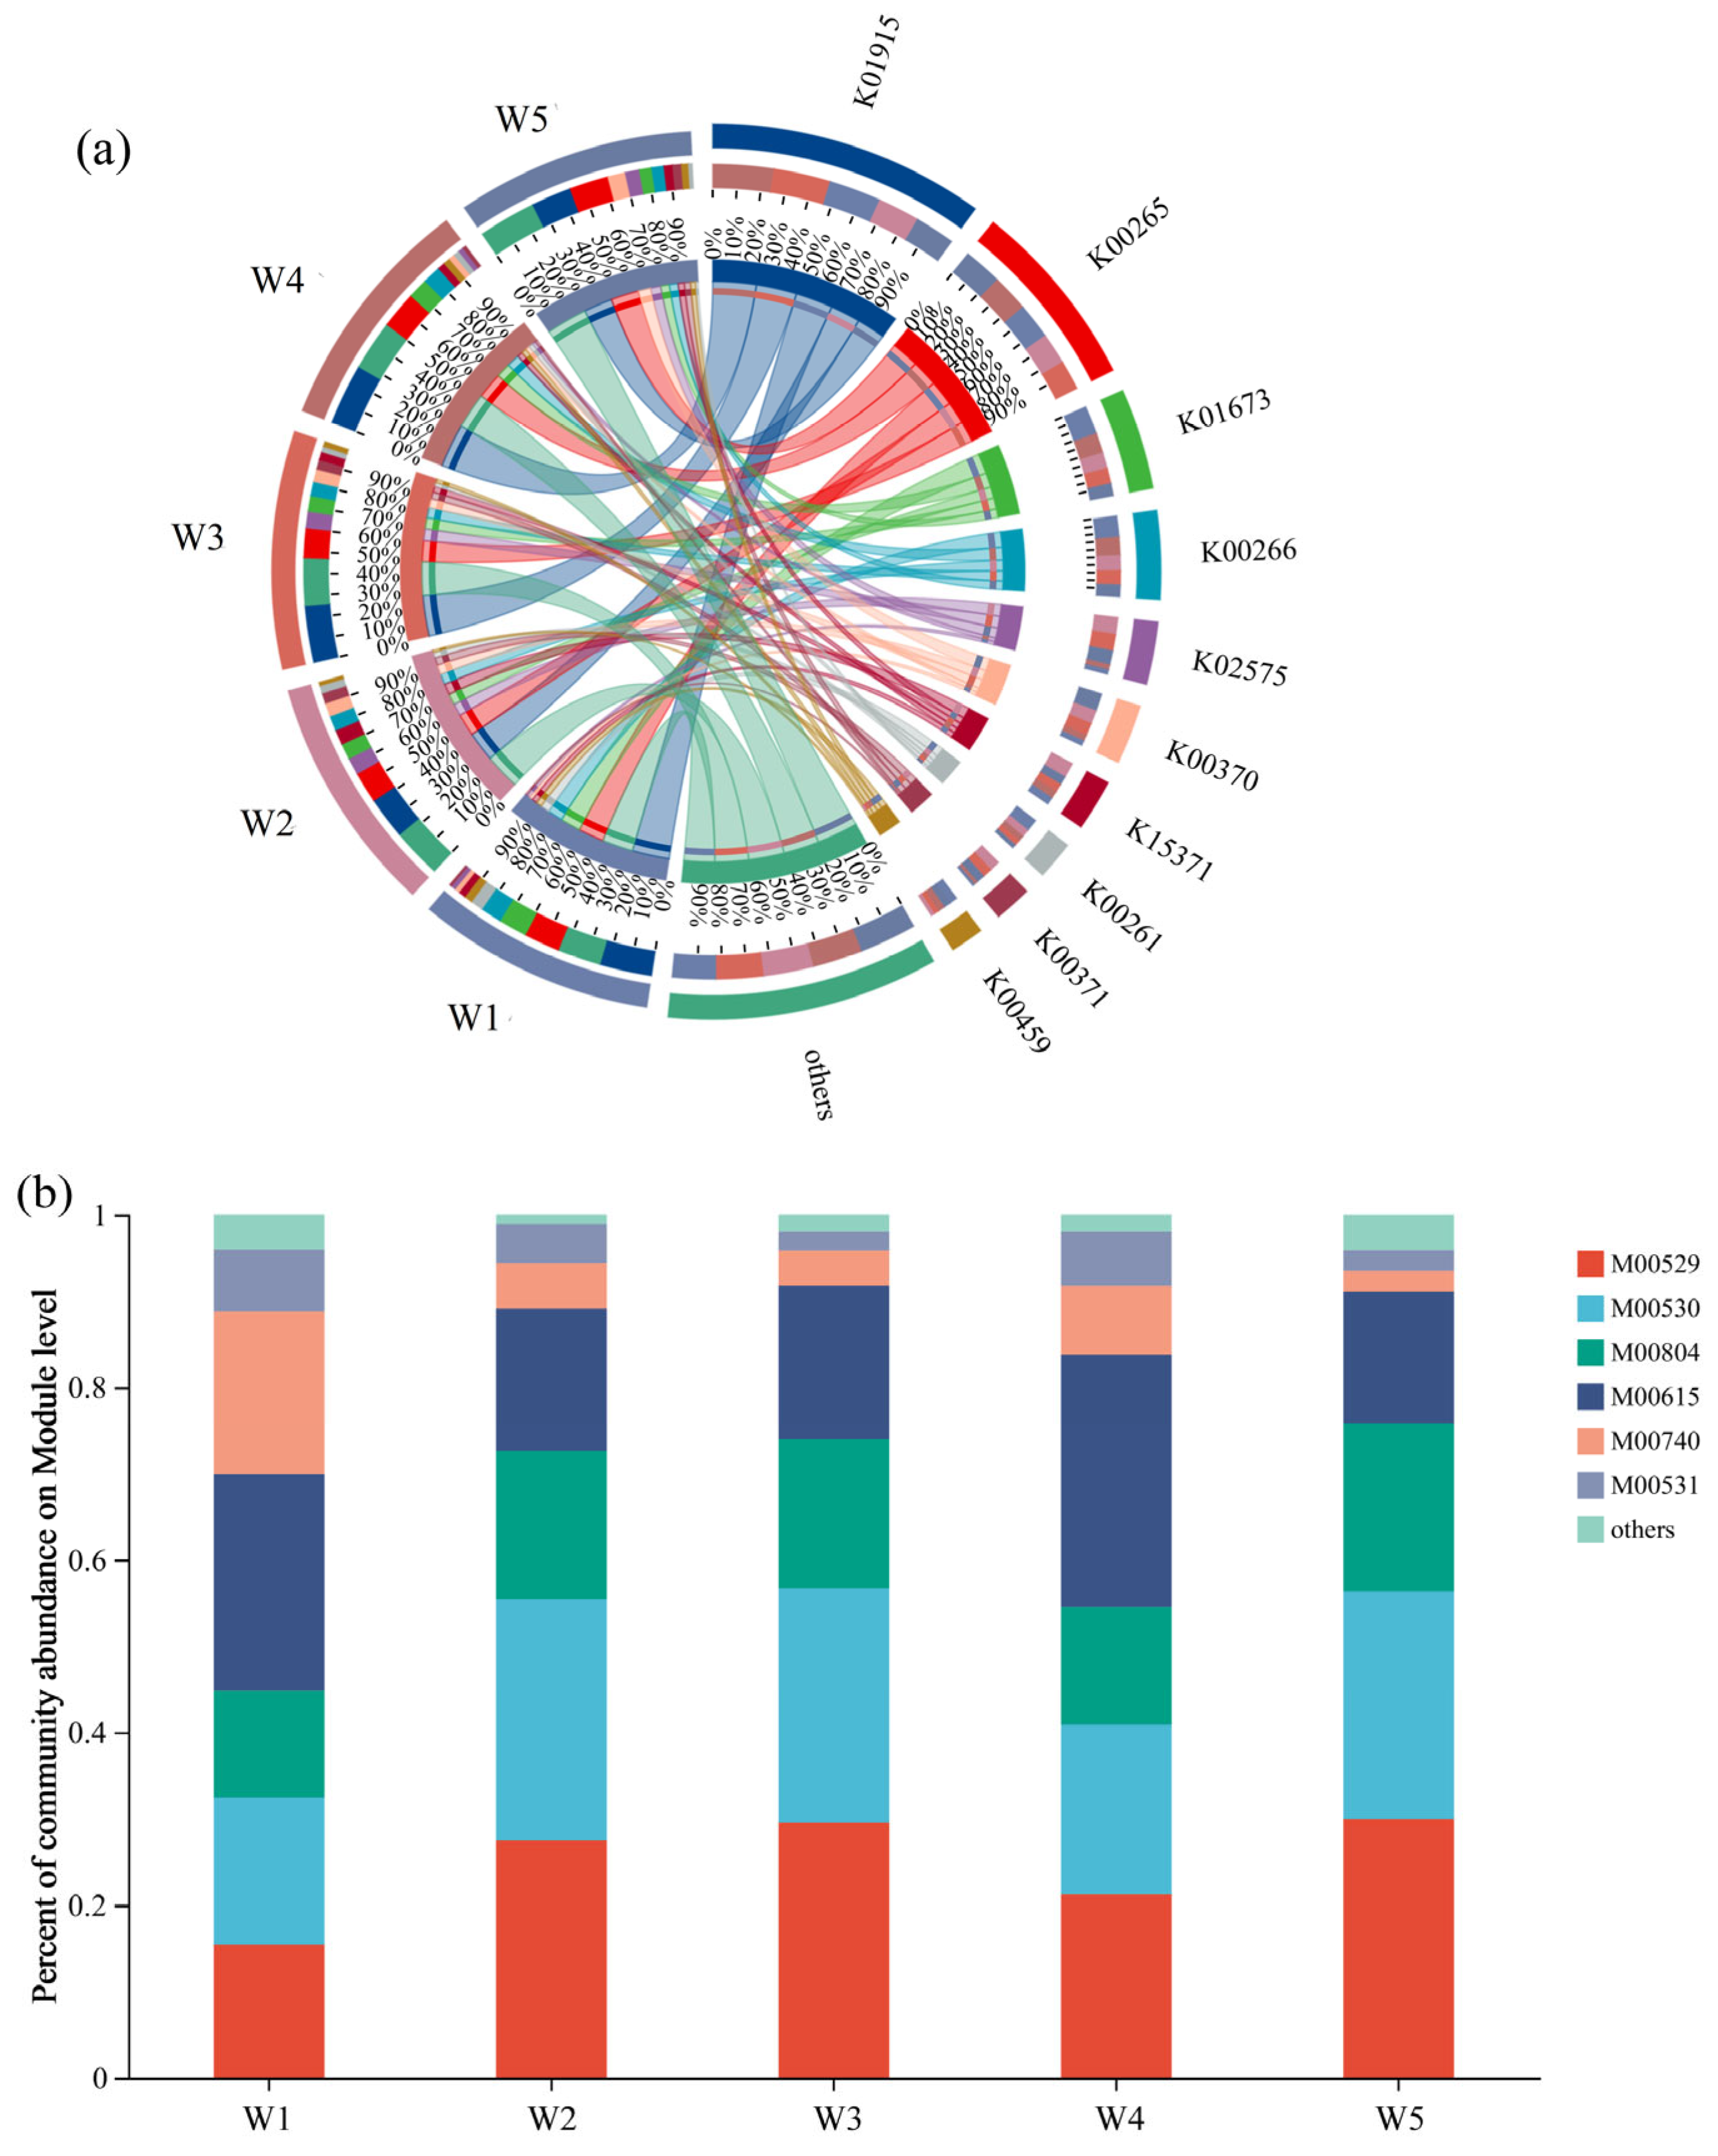
3.3.1. Analysis of Functional Genes and Pathways of Nitrogen Metabolism in the Xisha River

The analysis of the functional genes of nitrogen metabolism (Figure 5a) in the Xisha River showed that the top five genes with a high abundance in the sampling stations were K01915 (glnA), K00265 (gltB), K01673 (can), K00266 (gltD), and K02575 (nifK). These genes contribute to specific nitrogen metabolism pathways, which in turn drive broader nitrogen metabolism processes such as nitrogen fixation, ammonia assimilation, and denitrification [37]. Notably, K01915 (glnA, glutamine synthetase) and K00265 (gltB, glutamate synthase), both part of the ammonia assimilation pathway (M00530), were among the top two in abundance across all five sampling stations (W1–W5). These genes facilitate the ammonia assimilation process by converting NH3 into glutamine (K01915) and subsequently into glutamate (K00265), supporting nitrogen’s incorporation into biomass [38].
Six major nitrogen metabolism pathways were identified in the Xisha River (Figure 5b): denitrification (M00529), dissimilatory nitrate reduction to ammonia (DNRA, M00530), complete nitrification (M00804), nitrate assimilation (M00615), methylaspartate cycling (M00740), and assimilatory nitrate reduction (M00531). These pathways contribute to nitrogen metabolism processes, including the reduction (e.g., denitrification, DNRA), assimilation (e.g., nitrate assimilation), and oxidation (e.g., nitrification) of nitrogen compounds, thereby regulating nitrogen cycling in the water column. For instance, the denitrification pathway (M00529) supports the denitrification process by converting NO3 to N2, reducing nitrogen loads, while the DNRA pathway (M00530) contributes to the DNRA process, retaining nitrogen as NH3.

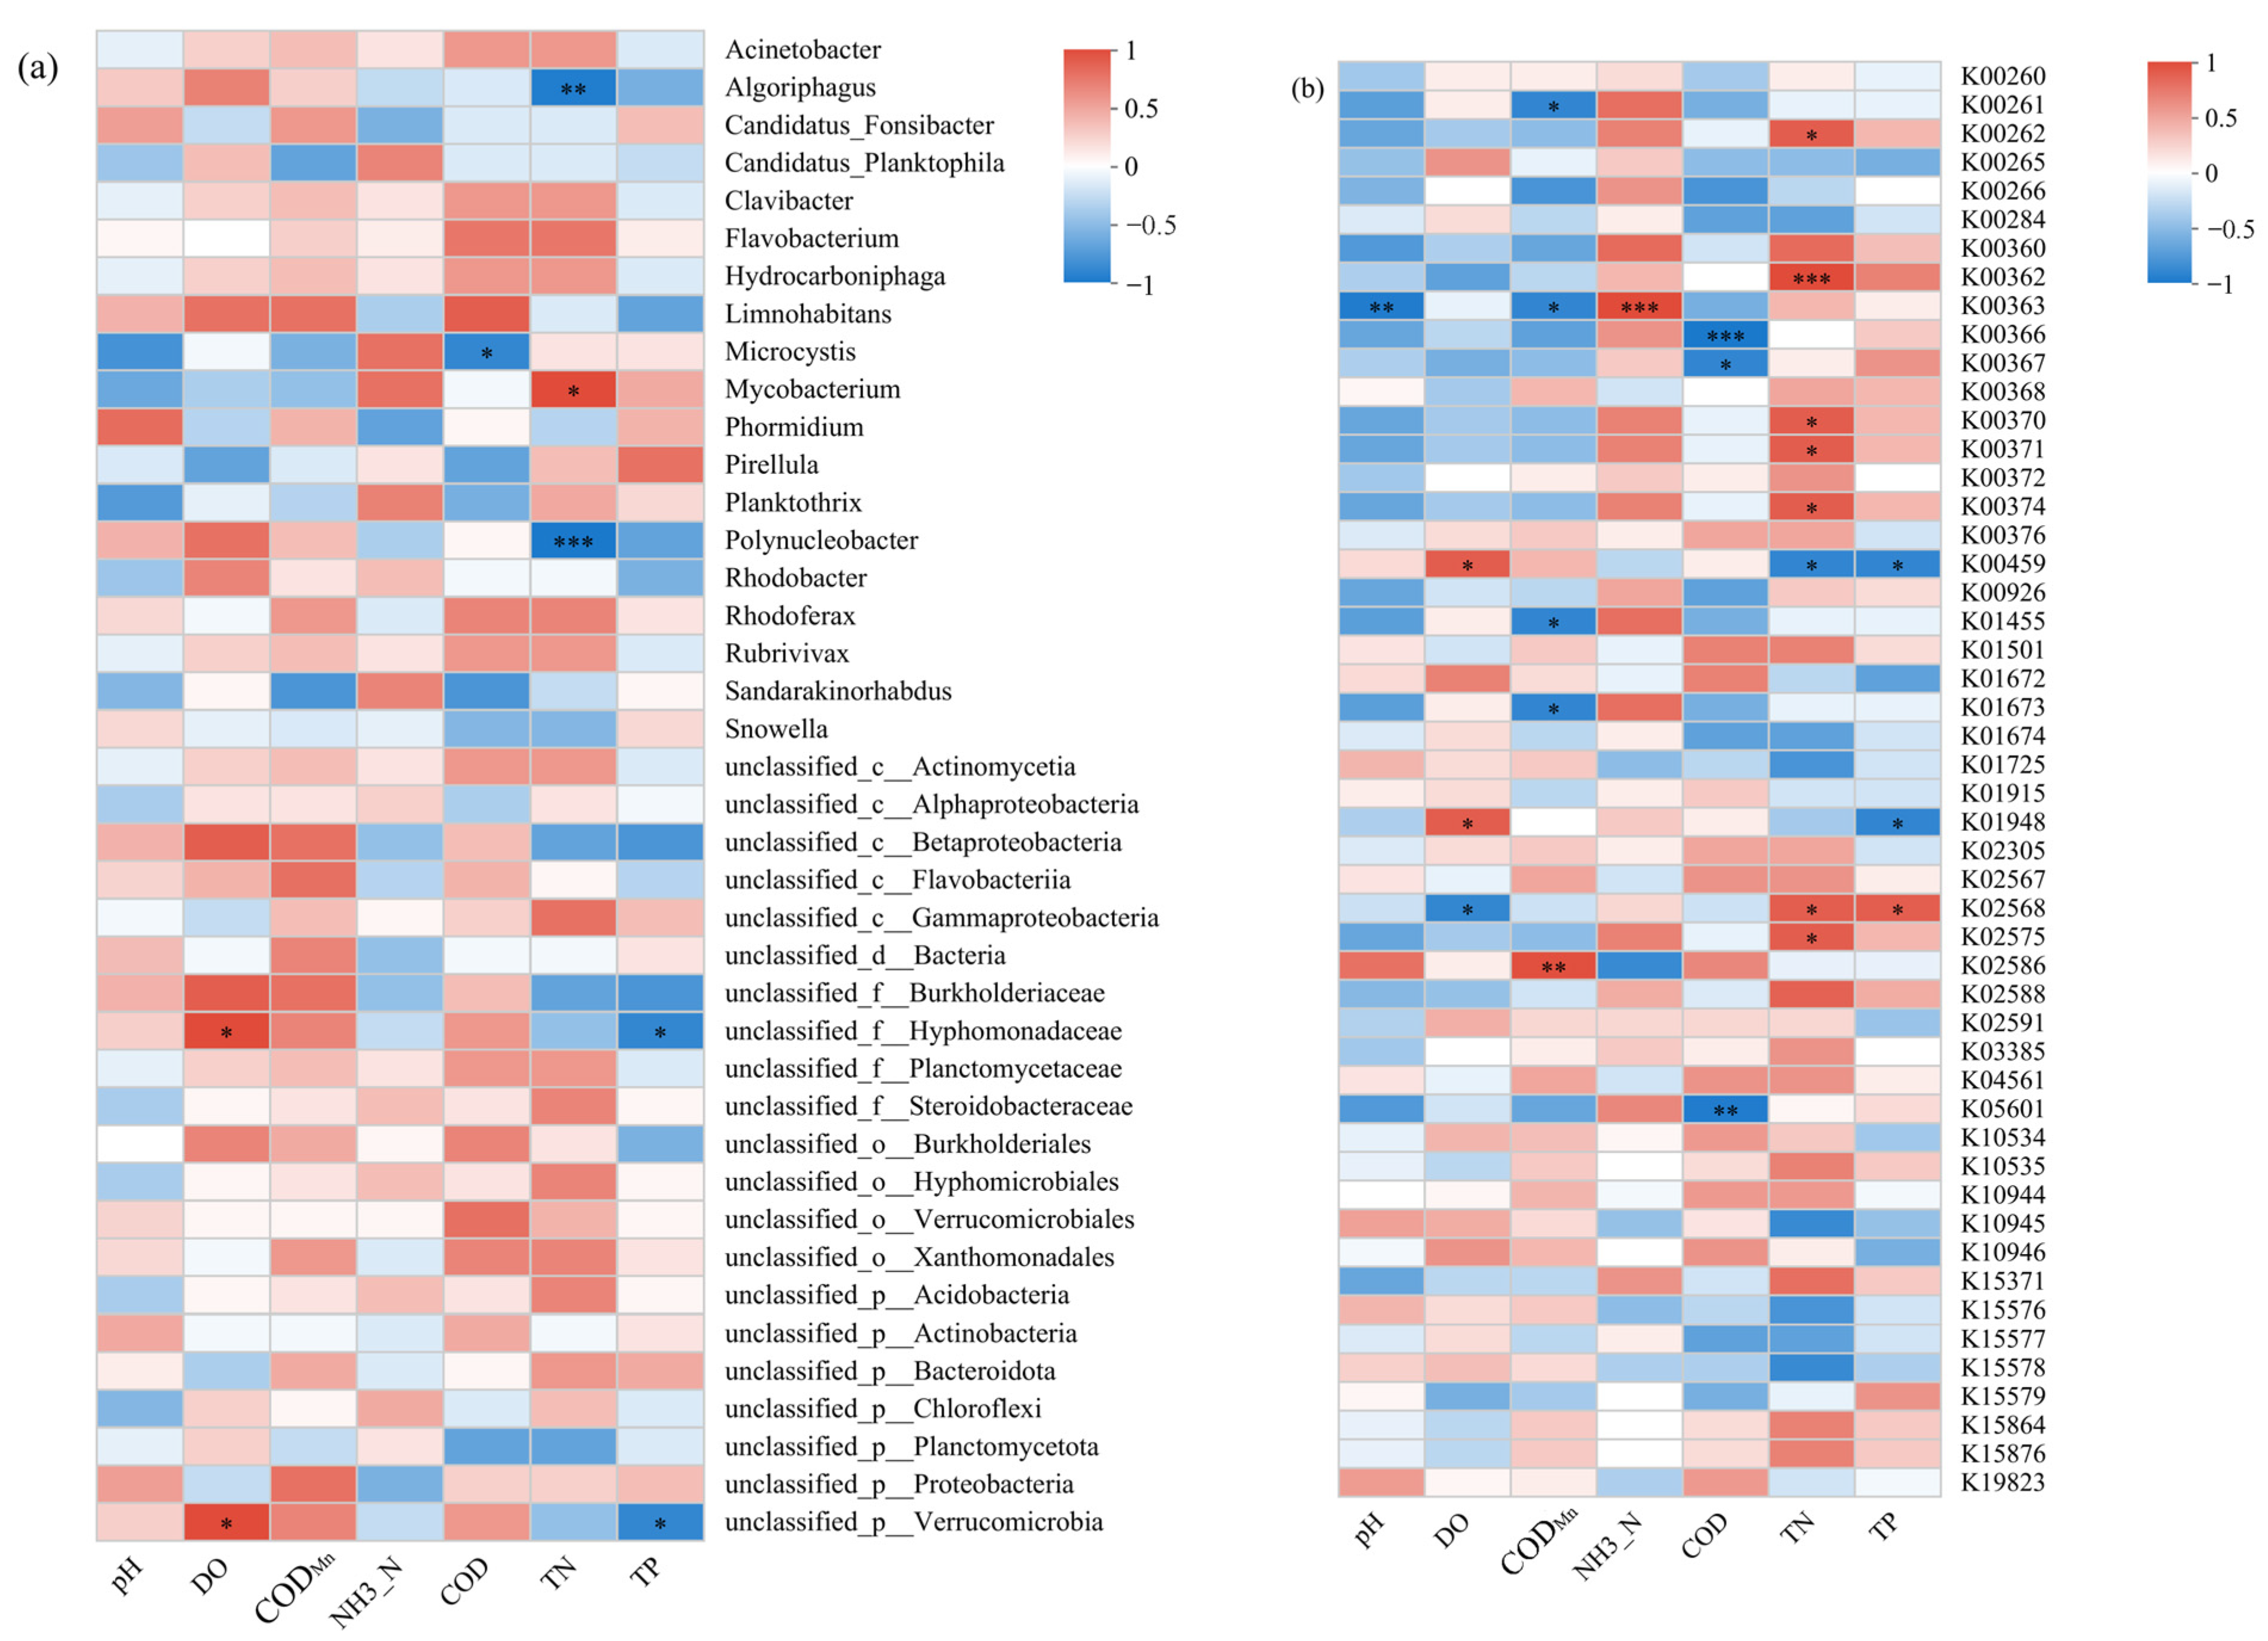
3.3.2. Correlations Between Physicochemical Factors, Bacterial Communities, and KEGG Metabolic Functions

The results of a correlation analysis (Figure 6a) between bacterial community and environmental factors in the Xisha River showed that the main environmental influences of bacterial community were TP, TN, and DO, and the results of a correlation analysis (Figure 6b) between nitrogen metabolism functional genes and environmental factors showed that the main environmental influences of nitrogen metabolism functional genes were CODMn and TN.
In the bacterial community (Figure 6a), DO was positively correlated with unclassified__p__Verrucomicrobia and unclassified__f__Hyphomonadaceae (p < 0.05). TP was negatively correlated with unclassified__p__Verrucomicrobia and unclassified__f__Hyphomonadaceae (p < 0.05). TN was significantly negatively correlated with Polynucleobacter (p < 0.001), positively correlated with Mycobacterium (p < 0.05), and significantly negatively correlated with Algoriphagus (p < 0.01). COD was negatively correlated with Microcystis (p < 0.05).
Among the nitrogen metabolism genes (Figure 6b), pH was significantly negatively correlated with K00363 (nirB, p < 0.01), a gene encoding nitrite reductase involved in denitrification by reducing nitrite (NO2) to nitric oxide (NO). DO was positively correlated with K01948 (glnK, p < 0.05), which regulates ammonia assimilation, and K00459 (narI, p < 0.05), a subunit of nitrate reductase involved in the initial step of denitrification (NO3 to NO2); however, DO was negatively correlated with K02568 (napA, p < 0.05), a periplasmic nitrate reductase gene also involved in denitrification. CODMn was significantly positively correlated with K02586 (nifH, p < 0.01), a nitrogenase gene responsible for nitrogen fixation (N2 to NH3), but negatively correlated with K01673 (can, carbonic anhydrase indirectly affecting nitrogen metabolism via pH regulation), K01455 (hmp, nitric oxide reductase in denitrification), K00363 (nirB), and K00261 (gdhA, glutamate dehydrogenase in ammonia assimilation) (p < 0.05). NH3-N was significantly positively correlated with K00363 (nirB, p < 0.001). COD was negatively correlated with K00367 (nirD, p < 0.05), K05601 (nosZ, p < 0.01), and K00366 (narG, p < 0.001), all involved in denitrification (NO2 to NO, N2O to N2, and NO3 to NO2, respectively). TN was positively correlated with K02575 (nifK, nitrogen fixation), K02568 (napA, denitrification), K00374 (norB, denitrification), K00371 (narH, denitrification), K00370 (narJ, denitrification), and K00262 (gdhB, ammonia assimilation) (p < 0.05) and significantly positively correlated with K00362 (nirK, denitrification, p < 0.001). TP was positively correlated with K02568 (napA, p < 0.05), potentially enhancing denitrification by supporting microbial growth, but negatively correlated with K01948 (glnK) and K00459 (narI) (p < 0.05).

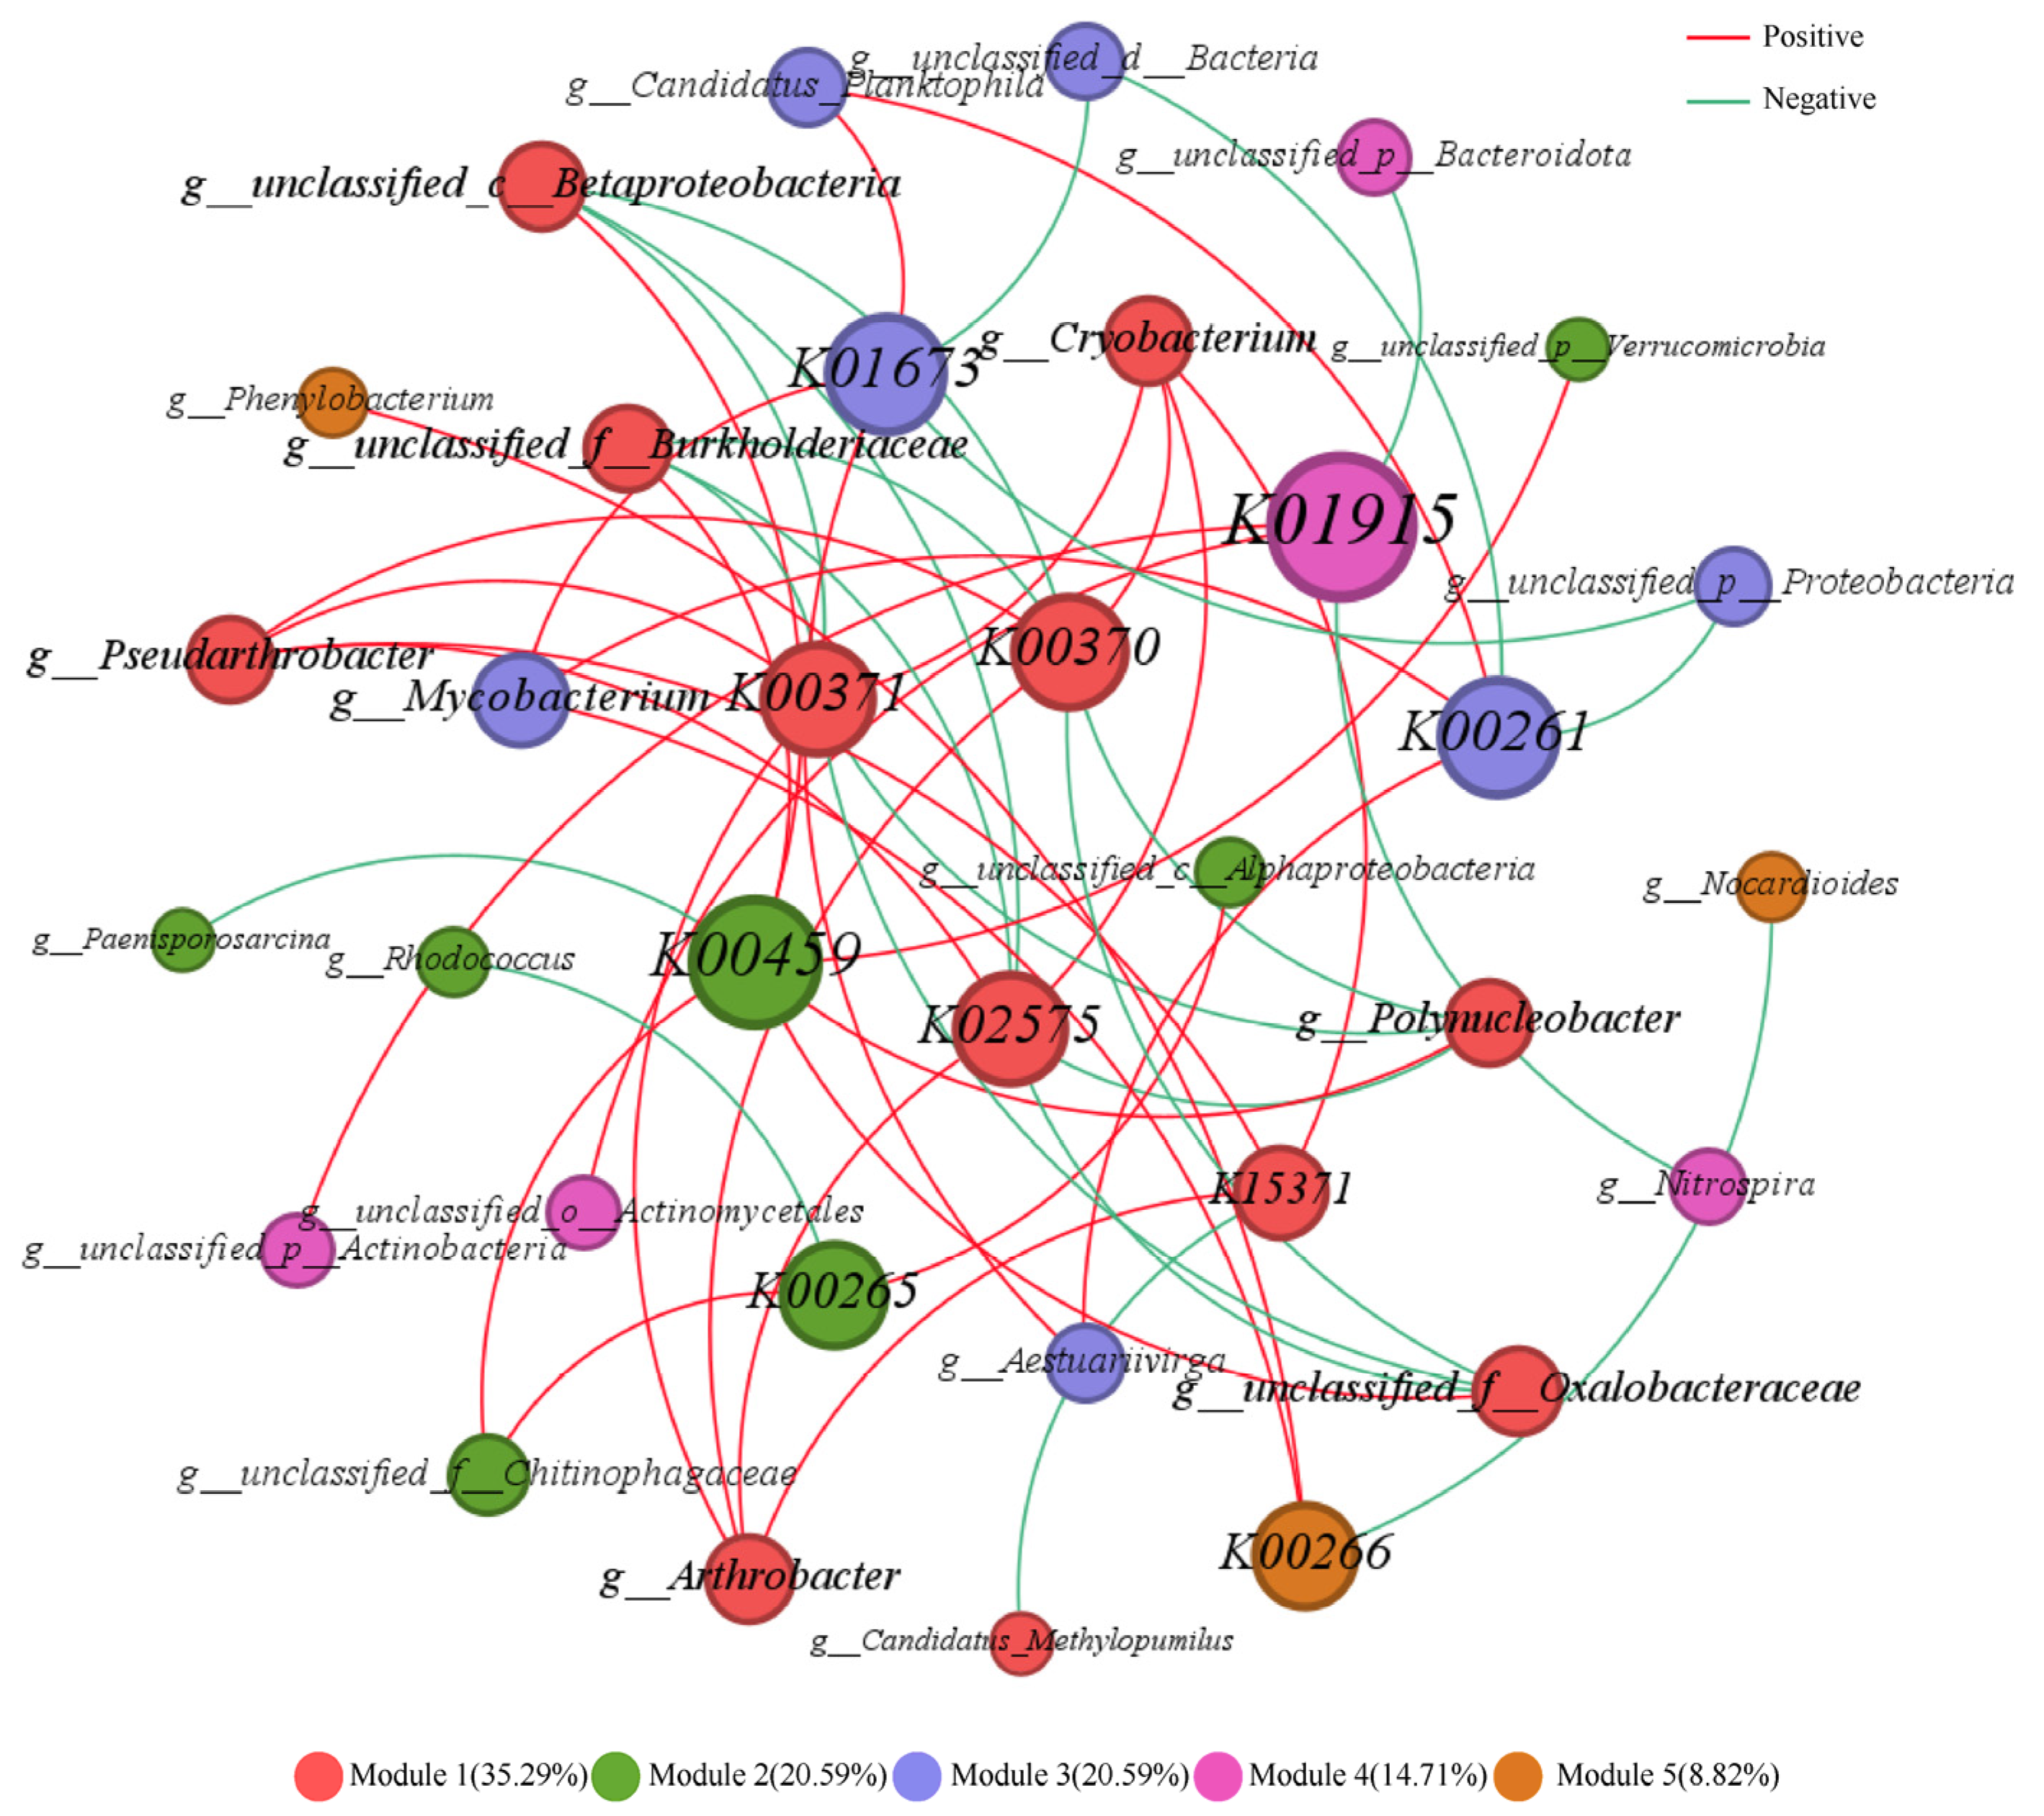
3.3.3. Analysis of Co-Occurrence Networks Between Microorganisms and Nitrogen Metabolism Functional Genes

Covariance network analysis (Figure 7) showed that the percentage of positive correlation (57.69%) between functional genes of nitrogen metabolism and microorganisms was slightly larger than that of negative correlation (42.31%). The co-occurrence network consisted of 34 nodes and 52 edges, and the average weightedness was 3.059, and the density was 0.09 and modularity index 0.562. It showed that there was a significant correlation between functional genes and different microbial genera. The key genes identified by the PageRank algorithm were K01915 (glnA), K00459 (narI), K01673 (can), and K00261 (gdhA), of which K01915 (glnA) and K01673 (can) were the genes with higher abundance in the water column.

4. Discussion

4.1. Water Quality Analysis of the Xisha River

Water quality factors in the Xisha River show some seasonal variation and annual differences in both time and space. Overall, water quality in 2022 was relatively poor, with high concentrations of major pollutants such as nitrogen and phosphorus, while water quality in 2023 showed signs of improvement. These outcomes are likely attributable to enhanced WWTP efficiencies and reduced industrial discharges following stricter permit regulations, aligning with national trends where point-source nutrient pollution has declined due to regulatory reforms. Variations in water quality in the Xisha River show that the pattern is seasonal. Concentrations of TN and NH3-N are higher in winter (January to March). In summer (June to August), the concentrations of TP and CODMn are higher. Studies have shown that rainfall is one of the factors affecting the changes in TN and TP; precipitation and runoff in summer dilute TN levels but exacerbate surface pollution [39]. Other studies have shown that agricultural activities in summer, and the high level of anthropogenic activities, also contribute to the increase in the concentrations of some of the factors [40]. TN and NH3-N are the major pollutants in the Xisha River. Especially in the W2 sampling station, the concentrations of TN and NH3-N were significantly higher compared with other sampling stations. This study showed that agricultural runoff, domestic sewage, and industrial wastewater discharges were the main causes of N enrichment [41,42]. Principal component analysis (PCA) further confirmed the conclusion that NH3-N and TN were the main drivers of water quality changes in the Xisha River. In addition, the spatial distribution of W2 in the PCA space was more dispersed, suggesting that water quality fluctuates more at this station, which is consistent with the results of the above analyses. In summary, the observed seasonal and annual variations in water quality, particularly in TN and NH3-N, highlight the persistence of nitrogen pollution in the Xisha River, particularly in the W2 reach. The observed improvement in water quality in 2023 suggests that pollution control measures may be having a positive impact, but that continued management efforts are needed to reduce nitrogen and phosphorus pollution, particularly in hotspot areas such as W2.
Moving forward, we plan to include temperature and flow rate in our analyses to gain a deeper understanding of the microbial community’s composition and their responses to nitrogen metabolism.

4.2. Microbiological Diversity of the Xisha River

In our study, compared with other sections, the species richness and diversity of the W5 section are at a relatively high level, indicating that the water quality of the section had a more stable ecosystem [41]. The Shannon and Simpson indices of W1 and W2 are lower, which may indicate that these sampling stations are affected by certain external environmental pressures, such as pollution or human activities. These pressures may cause a decline in the diversity and evenness of microbial communities, thereby lowering the functional and stability of ecosystems.

4.3. Microbial Community Composition of the Xisha River

The microbial communities in the Xisha River water bodies revealed that several dominant genera—including Betaproteobacteria, Microcystis, Bacteroidota, Limnohabitans, and Burkholderiaceae—play key roles in nitrogen cycling and water quality dynamics. These genera participate extensively in the nitrogen metabolism processes that influence water pollution status and ecological health [43,44]. Betaproteobacteria primarily drive nitrification by oxidizing ammonium (NH4+) to nitrite (NO2) and subsequently to nitrate (NO3), which then serves as a substrate for denitrification, yielding nitrogen gas (N2) and thereby reducing nitrogen pollution [45,46]. The high abundance of Microcystis is closely linked to eutrophication; its nitrogen-fixing ability may further exacerbate nitrogen pollution and heighten the risk of cyanobacterial blooms [47]. Bacteroidota specialize in degrading complex organic nitrogen compounds and releasing ammonia (NH3) to support nitrification [48], whereas Limnohabitans are closely associated with nitrogen and phosphorus cycling in eutrophic waters; their high abundance often indicates a nutrient accumulation from agricultural runoff or domestic wastewater [49]. The detection of Burkholderiaceae (e.g., Burkholderia cepacia) indicates potential sewage contamination and suggests that some species may be pathogenic, posing health risks to aquatic ecosystems and public health [50].
Importantly, the high relative abundance and functional diversity of these nitrogen-metabolizing bacteria in the study areas (W1 to W5) reflect the varying degrees of nutrient pollution and nitrogen enrichment among the water samples. These observations imply that human activities, such as agricultural runoff or wastewater discharge, might significantly affect the cycling of nitrogen in these aquatic environments, resulting in excess nitrogen that is introduced into these ecosystems. Understanding the diversity and function of these nitrogen-metabolizing bacteria is, therefore, essential in assessing the capacity for nitrogen removal and the overall quality of these water bodies.
Moving forward, we intend to incorporate direct measurements of microcystin toxin in future studies to provide a more comprehensive understanding of its production and ecological importance.

4.4. Analysis of Nitrogen Metabolism in the Xisha River

In the Xisha River water, the distribution of nitrogen metabolism gene abundances reveals the key role of the microbial community in the nitrogen cycle. The dominant presence of key ammonia assimilation genes (K01915, K00265, K00266) and denitrification genes (K01673, K02575) in the Xisha River microbiome indicates the dual capacity of the microbial community for nitrogen retention and removal. The high abundance of K01915 (glnA) and K00265 suggests that microorganisms efficiently convert inorganic nitrogen into organic compounds, which may be closely related to the abundant nitrogen sources in the water (such as agricultural runoff or domestic sewage discharge). This also indicates a strong nitrogen assimilation capacity and a potential risk of eutrophication in the water body [51,52].
The dominant pathways in W2, W3, and W5 are denitrification (M00529) and DNRA (M00530). Relevant studies have shown that denitrification is a key process for controlling nitrogen loading, which is able to convert nitrate accumulated in the water column into gaseous nitrogen through a microbial reduction process [53]. DNRA retains nitrogen as ammonium ions (NH4+), preventing nitrogen loss and allowing microbial communities to retain nitrogen. Despite the overall aerobic nature of the Xisha River, the presence of hypoxic or suboxic environments in micro-ecological niches such as biofilms and sediment particles provides conditions for denitrification (M00529) and DNRA (M00530). At the same time, nitrification oxidizes NH4+ to NO3 in the aerobic zone, which is subsequently reduced by denitrification in the immediately adjacent hypoxic microcosms, resulting in an effective ‘nitrification–denitrification coupling’ process. Thus, these two pathways, which require anoxia, can still dominate in aerobic waters [54]. The primary nitrogen metabolism pathways at sampling station W1 are nitrate assimilation (M00615) and the methyl aspartate cycle (M00740). Nitrate assimilation, which is the process of reducing nitrate to catabolism and ultimately synthesizing its own organic nitrogen, usually occurs in an oxygen-rich environment, suggesting that the W1 sampling station may be in a higher oxygen concentration or oxidizing environment. The methylaspartate cycle mainly involves ammonia assimilation, which helps microorganisms to maintain nitrogen assimilation when the nitrogen source is insufficient by using methylaspartate to convert ammonia into bioavailable organic nitrogen [55].The main dominant pathways in W4 are nitrate assimilation (M00615) and denitrification (M00529), and the combination of nitrate assimilation and denitrification suggests that the water body may have alternating oxidizing and anoxic environments that are suitable for the coexistence of two different metabolic pathways.
Moving forward, we intend to integrate metatranscriptomic analyses in future studies to directly quantify the gene expression and verify the functional activity of these pathways. This will enhance our understanding of their contributions to microbial community dynamics and environmental processes in the Xisha River.

4.5. Correlation Analysis of Environmental Factors with Microbial Communities and Nitrogen Metabolism Genes in Xisha River

The microbial community structure and nitrogen metabolism functional genes in aquatic ecosystems are significantly shaped by various environmental conditions [56].
In the bacterial community, we found that an increase in dissolved oxygen (DO) concentration promoted the relative abundance of unclassified__p__Verrucomicrobia and unclassified__f__Hyphomonadaceae. This may be due to the availability of more oxygen as an electron acceptor for aerobic bacteria, enhancing their energy production through oxidative phosphorylation. The additional energy is then utilized for polysaccharide degradation, significantly boosting the growth rate of these two bacterial genera, which ultimately leads to an increase in their abundance in the community composition [57,58]. Meanwhile, we found that elevated TP suppressed the abundance of these two bacterial genera, which may originate from the changes in nutrient levels caused by elevated phosphorus concentrations, which inhibit the growth of microorganisms adapted to low nutrient states, and thus lead to changes in community structure [59]. Polynucleobacter is usually found in nutrient-poor waters and is very sensitive to nitrogen pollution. Algoriphagus has the ability to degrade organic matter, and its reduced abundance means that elevated TN may have reduced the potential for organic matter degradation in the water column. Mycobacterium tends to eutrophize or pollute the environment.
In terms of functional genes for nitrogen metabolism, CODMn and TN concentrations behaved as key drivers. CODMn represents the concentration of readily oxidizable organic matter in the water column, which significantly affects a variety of nitrogen metabolism-related genes (e.g., K02586, K01673, K01455, K00363, and K00261), suggesting that variations in the concentration of organic matter can significantly modulate microbial nitrogen metabolism pathways. In addition, elevated TN significantly promoted denitrification (e.g., K02575, K02568, K00374, etc.) and the increased abundance of genes key to the nitrification process (e.g., K00362) [60]. This is consistent with existing research that anelevated TN promotes the expression of nitrifying and denitrifying microbial activity and functional genes, which in turn affects the rate of nitrogen cycling [61].
In addition, other environmental factors, such as pH, NH3-N, and COD, had significant effects on individual nitrogen metabolism genes, suggesting that changes in nitrogen cycle function are the result of synergistic effects of multiple environmental factors. These results indicate that nitrogen metabolism in water bodies is regulated by a combination of environmental factors, especially the concentrations of nitrogen sources, oxygen and phosphorus, which significantly affect the microbial communities and the expression of their nitrogen metabolism functional genes, and they provide a theoretical basis for further research on water quality management and nitrogen pollution control.

4.6. Co-Occurrence of Bacterial Communities with Nitrogen Metabolism Genes

This study revealed the interrelationships between functional genes for nitrogen metabolism and microbial communities through a covariate network analysis.
K01915 (glnA) showed a significant positive correlation with g__unclassified__p__Actinobacteria and g__unclassified__o_Actinomycetales. This finding suggests that Actinobacteria may promote the expression of nitrogen metabolism-related genes through its nitrogen fixation and organic nitrogen degradation functions. Actinobacteria are widely distributed in soil and are known to play an important role in nitrogen fixation and organic nitrogen degradation [62]. The correlation between K01915 (glnA) and these microbial groups in this study further validates its potential role in the nitrogen cycle in aquatic environments. Furthermore, K00459 showed a significant correlation with g__unclassified__f__Burkholderiaceae and g__unclassified__f__Chitinophagaceae. These microbial groups play important roles in denitrification and nitrogen fixation processes. K01673 (can) and K00261 (gdhA) were significantly positively correlated with some denitrifying bacteria (such as Burkholderiaceae), suggesting their involvement in nitrogen reduction and transformation processes.
This study also found a significant negative correlation between certain microbial groups (such as unclassified_p__Bacteroidota, and Paenisporosarcina) and nitrogen metabolism-related genes (such as K01915 and K00459). This may suggest that these microbial groups inhibit the expression of nitrogen metabolism genes through competitive effects or possibly suppress the function of these genes through certain metabolic products. Bacteroidota are commonly found in aquatic environments and are usually associated with the degradation of organic matter. They may affect the activity of nitrogen metabolism genes in water through resource competition.
Based on these studies, for the Xisha River, we recommend increasing the DO concentration in the water, optimizing the activity of K00459 and K01915 genes, and promoting ammonia oxidation and nitrate reduction reactions to enhance nitrogen removal efficiency. Low weirs and upstream wastewater treatment are proposed to increase DO. Additionally, using aquatic plants (such as reeds, duckweed, etc.) to promote the expression of K01673 (can) and K00261 (gdhA) can enhance the conversion of nitrogen to organic nitrogen and improve nitrogen bioavailability, which will help mitigate nitrogen pollution in the water and enhance the self-repair capacity of the aquatic ecosystem.

5. Conclusions

This study comprehensively assessed the water quality, microbial community structure, functional genes for nitrogen metabolism, and nitrogen metabolism pathways in the Xisha River, revealing the ecological status and pollution dynamics of the river. The relevant results are as follows: The water quality analysis indicated that TN was the primary pollutants, exceeding the Class V standards of the Chinese Environmental Quality Standard for Surface Water [35] (GB3838-2002), highlighting the severe nitrogen pollution in the river. PCA analysis further identified NH3-N and TN as the most influential factors affecting water quality, with the sampling station W2 exhibiting a notable variability compared to the relatively stable conditions at the other stations. The microbial community analysis demonstrated that W5 had the highest microbial richness and species diversity, suggesting a more complex and resilient ecosystem at this station. The top 5 dominant bacteria in relative abundance in the Xisha River were unclassified__c__Actinomycetia, unclassified__p__Bacteroidota, Paenisporosarcina, Candidatus_Planktophila, and unclassified__c__Betaproteobacteria. Functional gene analyses revealed that the top 5 nitrogen metabolism genes in relative abundance were K01915 (glnA), K00265 (gltB), K01673 (can), K00266 (gltD), and K02575 (nifK), which play key roles in nitrogen transformations, including nitrogen assimilation, nitrification, and denitrification. Nitrogen metabolism pathway analysis showed that the six main nitrogen metabolism pathways in the Xisha River water body were denitrification (M00529), anisotropic nitrate reduction (M00530), complete nitrification (M00804), nitrate assimilation (M00615), methylaspartate cycling (M00740), and assimilatory nitrate reduction (M00531). Denitrification and anisotropic nitrate reduction are the major nitrogen metabolism pathways in the water column. The main environmental influences on the bacterial community were TP, TN, and DO, and the main environmental influences on the functional genes of nitrogen metabolism were CODMn and TN. Co-occurrence network analyses indicated that K01915 (glnA), K00459 (narI), K01673 (can), and K00261 (gdhA) were the pivotal genes in nitrogen metabolism.

Author Contributions

Conceptualization, S.Y. and W.Z.; methodology, W.Z.; software, S.Y. and R.W.; validation, S.Y. and W.Z.; writing—original draft preparation, S.Y.; writing—review and editing, S.Y., R.W. and W.Z.; data curation, S.Y.; project administration, W.Z.; funding acquisition, W.Z. All authors have read and agreed to the published version of the manuscript.

Funding

This research is funded by the Research Grants of Nature Scientific Foundation of Heilongjiang Province, grant number LH2022C098; the 2022 Open Fund of the National Key Laboratory of Urban Water Resources and Water Environment, grant number ES202217; and Basic Research Business Fees for Provincial Higher Education Institutions in Heilongjiang Province, grant number 2023-KYYWF-1495.

Institutional Review Board Statement

Not applicable.

Informed Consent Statement

Not applicable.

Data Availability Statement

The datasets generated and/or analyzed during the current study are available from the corresponding author on request.

Acknowledgments

We thank Heilongjiang University and the State Key Laboratory of Urban Water Resource and Environment, School of Environment, Harbin Institute of Technology, for providing the test platform.

Conflicts of Interest

The authors declare no conflicts of interest.

References

  1. Wang, H.; He, G. Rivers: Linking nature, life, and civilization. River 2022, 1, 25–36. [Google Scholar] [CrossRef]
  2. Strokal, M.; Bai, Z.; Franssen, W.; Hofstra, N.; Koelmans, A.A.; Ludwig, F.; Ma, L.; van Puijenbroek, P.; Spanier, J.E.; Vermeulen, L.C.; et al. Urbanization: An increasing source of multiple pollutants to rivers in the 21st century. Npj Urban Sustain. 2021, 1, 24. [Google Scholar] [CrossRef]
  3. Liang, L.; Wang, Z.; Li, J. The effect of urbanization on environmental pollution in rapidly developing urban agglomerations. J. Clean. Prod. 2019, 237, 117649. [Google Scholar] [CrossRef]
  4. Hu, Y.; Cheng, H. Water pollution during China’s industrial transition. Environ. Dev. 2013, 8, 57–73. [Google Scholar] [CrossRef]
  5. Smith, V.H.; Tilman, G.D.; Nekola, J.C. Eutrophication: Impacts of excess nutrient inputs on freshwater, marine, and terrestrial ecosystems. Environ. Pollut. 1999, 100, 179–196. [Google Scholar] [CrossRef] [PubMed]
  6. Usman, M.; Sanaullah, M.; Ullah, A.; Li, S.; Farooq, M. Nitrogen Pollution Originating from Wastewater and Agriculture: Advances in Treatment and Management. Rev. Environ. Contam. Toxicol. 2022, 260, 9. [Google Scholar] [CrossRef]
  7. Wang, H.; He, W.; Zhang, Z.; Liu, X.; Yang, Y.; Xue, H.; Xu, T.; Liu, K.; Xian, Y.; Liu, S.; et al. Spatio-temporal evolution mechanism and dynamic simulation of nitrogen and phosphorus pollution of the Yangtze River economic Belt in China. Environ. Pollut. 2024, 357, 124402. [Google Scholar] [CrossRef]
  8. Bijay, S.; Craswell, E. Fertilizers and nitrate pollution of surface and ground water: An increasingly pervasive global problem. SN Appl. Sci. 2021, 3, 518. [Google Scholar] [CrossRef]
  9. Zhang, X.; Zhang, Y.; Shi, P.; Bi, Z.; Shan, Z.; Ren, L. The deep challenge of nitrate pollution in river water of China. Sci. Total Environ. 2021, 770, 144674. [Google Scholar] [CrossRef]
  10. Kim, H.; Bae, H.-S.; Reddy, K.R.; Ogram, A. Distributions, abundances and activities of microbes associated with the nitrogen cycle in riparian and stream sediments of a river tributary. Water Res. 2016, 106, 51–61. [Google Scholar] [CrossRef]
  11. Yang, N.; Zhang, C.; Wang, L.; Li, Y.; Zhang, W.; Niu, L.; Zhang, H.; Wang, L. Nitrogen cycling processes and the role of multi-trophic microbiota in dam-induced river-reservoir systems. Water Res. 2021, 206, 117730. [Google Scholar] [CrossRef] [PubMed]
  12. Shi, P.; Zhang, Y.; Song, J.; Li, P.; Wang, Y.; Zhang, X.; Li, Z.; Bi, Z.; Zhang, X.; Qin, Y.; et al. Response of nitrogen pollution in surface water to land use and social-economic factors in the Weihe River watershed, northwest China. Sustain. Cities Soc. 2019, 50, 101658. [Google Scholar] [CrossRef]
  13. Wang, H.; Liu, C.; Xiong, L.; Wang, F. The spatial spillover effect and impact paths of agricultural industry agglomeration on agricultural non-point source pollution: A case study in Yangtze River Delta, China. J. Clean. Prod. 2023, 401, 136600. [Google Scholar] [CrossRef]
  14. Mattoo, R.; Suman, B.M. Microbial roles in the terrestrial and aquatic nitrogen cycle—Implications in climate change. FEMS Microbiol. Lett. 2023, 370, fnad061. [Google Scholar] [CrossRef]
  15. Jiang, J.; Su, C.; Geng, H.; Wang, Y.; Ge, W.; Pan, H.; Xie, X.; Feng, G. Novel insights into the DOM-driven processes affecting nitrogen cycling in shallow aquifers of the West Liao River Plain: Evidence from FT-ICR MS and isotope analyses. J. Hydrol. 2025, 655, 132969. [Google Scholar] [CrossRef]
  16. Wang, J.; Bouwman, A.F.; Vilmin, L.; Beusen, A.H.W.; van Hoek, W.J.; Liu, X.; Middelburg, J.J. Global inland-water nitrogen cycling has accelerated in the Anthropocene. Nat. Water 2024, 2, 729–740. [Google Scholar] [CrossRef]
  17. Wang, Z.; Ruan, X.; Le, F.; Chen, S.; Chen, T. Multi-element coupling effect of nitrogen cycling in an intensively dam-controlled river system. J. Hydrol. 2025, 651, 132648. [Google Scholar] [CrossRef]
  18. Xia, X.H.; Zhang, S.B.; Li, S.L.; Zhang, L.W.; Wang, G.Q.; Zhang, L.; Wang, J.F.; Li, Z.H. The cycle of nitrogen in river systems: Sources, transformation, and flux. Environ. Sci.-Process. IMPACTS 2018, 20, 863–891. [Google Scholar] [CrossRef]
  19. Zhang, L.; Li, X.; Fang, W.; Cheng, Y.; Cai, H.; Zhang, S. Impact of different types of anthropogenic pollution on bacterial community and metabolic genes in urban river sediments. Sci. Total Environ. 2021, 793, 148475. [Google Scholar] [CrossRef]
  20. Lawson, C.E.; Wu, S.; Bhattacharjee, A.S.; Hamilton, J.J.; McMahon, K.D.; Goel, R.; Noguera, D.R. Metabolic network analysis reveals microbial community interactions in anammox granules. Nat. Commun. 2017, 8, 15416. [Google Scholar] [CrossRef]
  21. Deng, D.; Yang, Z.; Yang, Y.; Wan, W.; Liu, W.; Xiong, X. Metagenomic insights into nitrogen-cycling microbial communities and their relationships with nitrogen removal potential in the Yangtze River. Water Res. 2024, 265, 122229. [Google Scholar] [CrossRef]
  22. HJ 1147-2020; Water Quality—Determination of pH Value—Electrode Method. China Environmental Publishing Group Co., Ltd.: Beijing, China, 2020.
  23. GB 11893-89; Water Quality—Determination of Dissolved Oxygen—Iodometric Method. Standards Press of China: Beijing, China, 1989.
  24. HJ 636-2012; Water Quality—Determination of Petroleum Hydrocarbons—Infrared Absorption Method. China Environmental Publishing Group Co., Ltd.: Beijing, China, 2012.
  25. GB 7489-87; Water Quality—Determination of Fluoride—Ion Selective Electrode Method. Standards Press of China: Beijing, China, 1987.
  26. GB 11892-89; Water Quality—Determination of Total Phosphorus—Molybdenum Blue Colorimetric Method. Standards Press of China: Beijing, China, 1989.
  27. HJ 536-2009; Water Quality—Determination of Ammonia Nitrogen—Nessler Reagent Spectrophotometric Method. China Environmental Publishing Group Co., Ltd.: Beijing, China, 2009.
  28. GB/T 32208-2015; Water Quality—Determination of Total Nitrogen—Persulfate Digestion-UV Spectrophotometric Method. Standards Press of China: Beijing, China, 2015.
  29. Chen, S.; Zhou, Y.; Chen, Y.; Gu, J. fastp: An ultra-fast all-in-one FASTQ preprocessor. Bioinformatics 2018, 34, i884–i890. [Google Scholar] [CrossRef] [PubMed]
  30. Li, D.; Liu, C.M.; Luo, R.; Sadakane, K.; Lam, T.W. MEGAHIT: An ultra-fast single-node solution for large and complex metagenomics assembly via succinct de Bruijn graph. Bioinformatics 2015, 31, 1674–1676. [Google Scholar] [CrossRef]
  31. Hyatt, D.; Chen, G.L.; Locascio, P.F.; Land, M.L.; Larimer, F.W.; Hauser, L.J. Prodigal: Prokaryotic gene recognition and translation initiation site identification. BMC Bioinform. 2010, 11, 119. [Google Scholar] [CrossRef] [PubMed]
  32. Fu, L.; Niu, B.; Zhu, Z.; Wu, S.; Li, W. CD-HIT: Accelerated for clustering the next-generation sequencing data. Bioinformatics 2012, 28, 3150–3152. [Google Scholar] [CrossRef]
  33. Li, R.; Li, Y.; Kristiansen, K.; Wang, J. SOAP: Short oligonucleotide alignment program. Bioinformatics 2008, 24, 713–714. [Google Scholar] [CrossRef] [PubMed]
  34. Buchfink, B.; Xie, C.; Huson, D.H. Fast and sensitive protein alignment using DIAMOND. Nat. Methods 2015, 12, 59–60. [Google Scholar] [CrossRef]
  35. GB 3838-2002; Environmental Quality—Standard for Surface Water. Standards Press of China: Beijing, China, 2002.
  36. Wang, D.; Zheng, Q.C.; Lv, Q.; Cai, Y.Q.; Zheng, Y.; Chen, H.D.; Zhang, W.M. Analysis of Community Composition of Bacterioplankton in Changle Seawater in China by Illumina Sequencing Combined with Bacteria Culture. Orthop. Surg. 2022, 14, 139–148. [Google Scholar] [CrossRef]
  37. Tian, J.; Li, P.; Luo, Y.; Yan, H.; Liu, J.; Pan, Z.; Chen, Y.; Wang, R.; Cheng, Y.; Zhou, H.; et al. Insights of microalgal municipal wastewater treatment at low temperatures: Performance, microbiota patterns, and cold-adaptation of tubular and aeration column photobioreactors. Chemosphere 2023, 340, 139910. [Google Scholar] [CrossRef]
  38. Nie, S.; Zhang, Z.; Mo, S.; Li, J.; He, S.; Kashif, M.; Liang, Z.; Shen, P.; Yan, B.; Jiang, C. Desulfobacterales stimulates nitrate reduction in the mangrove ecosystem of a subtropical gulf. Sci. Total Environ. 2021, 769, 144562. [Google Scholar] [CrossRef]
  39. Li, J.; He, Y.; Xie, T.; Song, Z.; Bai, S.; Zhang, X.; Wang, C. Seasonal Variations and Drivers of Total Nitrogen and Phosphorus in China’s Surface Waters. Water 2025, 17, 512. [Google Scholar] [CrossRef]
  40. Yang, S.; Liang, M.; Qin, Z.; Qian, Y.; Li, M.; Cao, Y. A novel assessment considering spatial and temporal variations of water quality to identify pollution sources in urban rivers. Sci. Rep. 2021, 11, 8714. [Google Scholar] [CrossRef]
  41. Shang, Y.; Wu, X.; Wang, X.; Wei, Q.; Ma, S.; Sun, G.; Zhang, H.; Wang, L.; Dou, H.; Zhang, H. Factors affecting seasonal variation of microbial community structure in Hulun Lake, China. Sci. Total Environ. 2022, 805, 150294. [Google Scholar] [CrossRef]
  42. Mishra, S.; Singh, V.; Cheng, L.; Hussain, A.; Ormeci, B. Nitrogen removal from wastewater: A comprehensive review of biological nitrogen removal processes, critical operation parameters and bioreactor design. J. Environ. Chem. Eng. 2022, 10, 107387. [Google Scholar] [CrossRef]
  43. Liu, Y.; Ren, Z.; Qu, X.; Zhang, M.; Yu, Y.; Zhang, Y.; Peng, W. Microbial community structure and functional properties in permanently and seasonally flooded areas in Poyang Lake. Sci. Rep. 2020, 10, 4819. [Google Scholar] [CrossRef]
  44. Huang, X.; Yang, X.; Zhu, J.; Yu, J. Microbial interspecific interaction and nitrogen metabolism pathway for the treatment of municipal wastewater by iron carbon based constructed wetland. Bioresour. Technol. 2020, 315, 123814. [Google Scholar] [CrossRef] [PubMed]
  45. Sun, H.; Narihiro, T.; Ma, X.; Zhang, X.-X.; Ren, H.; Ye, L. Diverse aromatic-degrading bacteria present in a highly enriched autotrophic nitrifying sludge. Sci. Total Environ. 2019, 666, 245–251. [Google Scholar] [CrossRef]
  46. Xia, S.; Li, J.; Wang, R.; Li, J.; Zhang, Z. Tracking composition and dynamics of nitrification and denitrification microbial community in a biofilm reactor by PCR-DGGE and combining FISH with flow cytometry. Biochem. Eng. J. 2010, 49, 370–378. [Google Scholar] [CrossRef]
  47. Song, G.; Jiang, Y.; Yu, G.; Li, R. Genotypes of ITS region of rRNA in Microcystis (Cyanobacteria) populations in Erhai Lake (China) and their correlation with eutrophication level. J. Basic Microbiol. 2015, 55, 1203–1211. [Google Scholar] [CrossRef]
  48. Pan, X.; Raaijmakers, J.M.; Carrión, V.J. Importance of Bacteroidetes in host–microbe interactions and ecosystem functioning. Trends Microbiol. 2023, 31, 959–971. [Google Scholar] [CrossRef]
  49. Zheng, L.; Xing, Y.; Ding, A.; Sun, S.; Cheng, H.; Bian, Z.; Yang, K.; Wang, S.; Zhu, G. Brownification of freshwater promotes nitrogen-cycling microorganism growth following terrestrial material increase and ultraviolet radiation reduction. Sci. Total Environ. 2022, 853, 158556. [Google Scholar] [CrossRef]
  50. Kumaresan, M.; Manoharan, M.; Sugumar, M.; Sistla, S. Species distribution and antimicrobial susceptibility of Burkholderia cepacia complex isolates in clinical infections: Experience from a tertiary care hospital, Southern India. Indian J. Med. Microbiol. 2024, 49, 100613. [Google Scholar] [CrossRef] [PubMed]
  51. Zhou, Q.; Xie, X.; Feng, F.; Huang, S.; Sun, Y. Impact of acyl-homoserine lactones on the response of nitrogen cycling in sediment to florfenicol stress. Sci. Total Environ. 2021, 785, 147294. [Google Scholar] [CrossRef] [PubMed]
  52. Shan, G.; Li, W.; Liu, J.; Tan, W.; Bao, S.; Wang, S.; Zhu, L.; Hu, X.; Xi, B. Macrogenomic analysis of the effects of aqueous-phase from hydrothermal carbonation of sewage sludge on nitrogen metabolism pathways and associated bacterial communities during composting. Bioresour. Technol. 2023, 389, 129811. [Google Scholar] [CrossRef] [PubMed]
  53. Jiang, X.; Liu, C.; Cai, J.; Hu, Y.; Shao, K.; Tang, X.; Gong, Y.; Yao, X.; Xu, Q.; Gao, G. Relationships between environmental factors and N-cycling microbes reveal the indirect effect of further eutrophication on denitrification and DNRA in shallow lakes. Water Res. 2023, 245, 120572. [Google Scholar] [CrossRef]
  54. Marchant, H.K.; Holtappels, M.; Lavik, G.; Ahmerkamp, S.; Winter, C.; Kuypers, M.M.M. Coupled nitrification–denitrification leads to extensive N loss in subtidal permeable sediments. Limnol. Oceanogr. 2016, 61, 1033–1048. [Google Scholar] [CrossRef]
  55. Huang, X.; Wang, B.; Li, P.; Chen, A.; Cui, J.; Chen, Y.; Gao, W. Organic management promotes nitrogen transformation in tea plantations soil: A case study from southwestern China. Appl. Soil Ecol. 2025, 206, 105878. [Google Scholar] [CrossRef]
  56. Liu, Q.; Chen, X.; Li, Y.-C.; He, Y.-H.; Li, J. Functional Genes and Metabolic Pathways of Nitrogen Metabolism Microorganisms in Lake Sediments:A Case Study of Hongfeng Lake, Guizhou Province. Environ. Sci. Pollut. Res. 2024, 45, 6086–6095. [Google Scholar] [CrossRef]
  57. Abraham, W.-R.; Rohde, M. The Family Hyphomonadaceae. In The Prokaryotes: Alphaproteobacteria and Betaproteobacteria; Rosenberg, E., DeLong, E.F., Lory, S., Stackebrandt, E., Thompson, F., Eds.; Springer: Berlin/Heidelberg, Germany, 2014; pp. 283–299. [Google Scholar]
  58. He, S.; Stevens, S.L.R.; Chan, L.K.; Bertilsson, S.; Glavina Del Rio, T.; Tringe, S.G.; Malmstrom, R.R.; McMahon, K.D. Ecophysiology of Freshwater Verrucomicrobia Inferred from Metagenome-Assembled Genomes. Msphere 2017, 2, 10–1128. [Google Scholar] [CrossRef]
  59. Fuerst, J.A. Phylum Verrucomicrobia. In Encyclopedia of Microbiology, 4th ed.; Schmidt, T.M., Ed.; Academic Press: Oxford, UK, 2019; pp. 551–563. [Google Scholar]
  60. Tan, X.; Yang, Y.-L.; Liu, Y.-W.; Li, X.; Zhu, W.-B. Quantitative ecology associations between heterotrophic nitrification-aerobic denitrification, nitrogen-metabolism genes, and key bacteria in a tidal flow constructed wetland. Bioresour. Technol. 2021, 337, 125449. [Google Scholar] [CrossRef]
  61. Sun, Q.; Zhang, Z.; Ping, Q.; Wang, L.; Li, Y. Insight into using multi-omics analysis to elucidate nitrogen removal mechanisms in a novel improved constructed rapid infiltration system: Functional gene and metabolite signatures. Water Res. 2024, 267, 122502. [Google Scholar] [CrossRef] [PubMed]
  62. Guo, X.; Du, S.; Guo, H.; Min, W. Long-term saline water drip irrigation alters soil physicochemical properties, bacterial community structure, and nitrogen transformations in cotton. Appl. Soil Ecol. 2023, 182, 104719. [Google Scholar] [CrossRef]
Figure 1. Position of the research area and sampling stations.
Sustainability 17 04060 g001
Figure 2. Water quality changes in the five main sections of the Xisha River. (a) COD. (b) DO. (c) NH3-N. (d) CODMn. (e) TN. (f) TP. (g) PH.
Sustainability 17 04060 g002aSustainability 17 04060 g002b
Figure 3. PCA analysis plot: (a) Loading plot. (b) Score plot.
Sustainability 17 04060 g003
Figure 4. Analyzing the structure of the microbial community at the genus level in the Xisha River.
Sustainability 17 04060 g004
Figure 5. (a) Abundance of functional genes for meso-nitrogen metabolism in Xisha River. (b) Analysis of major nitrogen metabolism pathways in Xisha River.
Sustainability 17 04060 g005
Figure 6. (a) Heatmap between bacterial community and all physicochemical factors. (b) Heatmap between functional genes of nitrogen metabolism and all physicochemical factors. * indicates p < 0.05, ** indicates p < 0.01, and *** indicates p < 0.001.
Sustainability 17 04060 g006
Figure 7. Network analysis of the relationship between microbial communities and functional genes of nitrogen metabolism at the genus level.
Sustainability 17 04060 g007
Table 1. Sample location in Xisha River.
Sampling PositionSample NumberLongitudeLatitude
XSH-1W1119°43′22.468″39°57′9.652″
XSH-2W2119°43′11.683″39°58′14.829″
XSH-3W3119°43′13.429″39°58′42.198″
XSH-4W4119°42′59.135″39°59′12.550″
XSH-5W5119°42′56.160″39°59′37.625″
Table 2. Alpha diversity index.
SampleAceChaoShannonSimpson
W13073073.8075410.053817
W24274273.8135370.062374
W34424424.13180.047394
W43213214.3217870.028587
W54964964.6598830.024094
Disclaimer/Publisher’s Note: The statements, opinions and data contained in all publications are solely those of the individual author(s) and contributor(s) and not of MDPI and/or the editor(s). MDPI and/or the editor(s) disclaim responsibility for any injury to people or property resulting from any ideas, methods, instructions or products referred to in the content.

