
Irrigation Performance Evaluation for Sustainable Water Management: A Study of Karacabey Water Users Association, Türkiye (2006–2023)


Abstract
1. Introduction
2. Materials and Methods
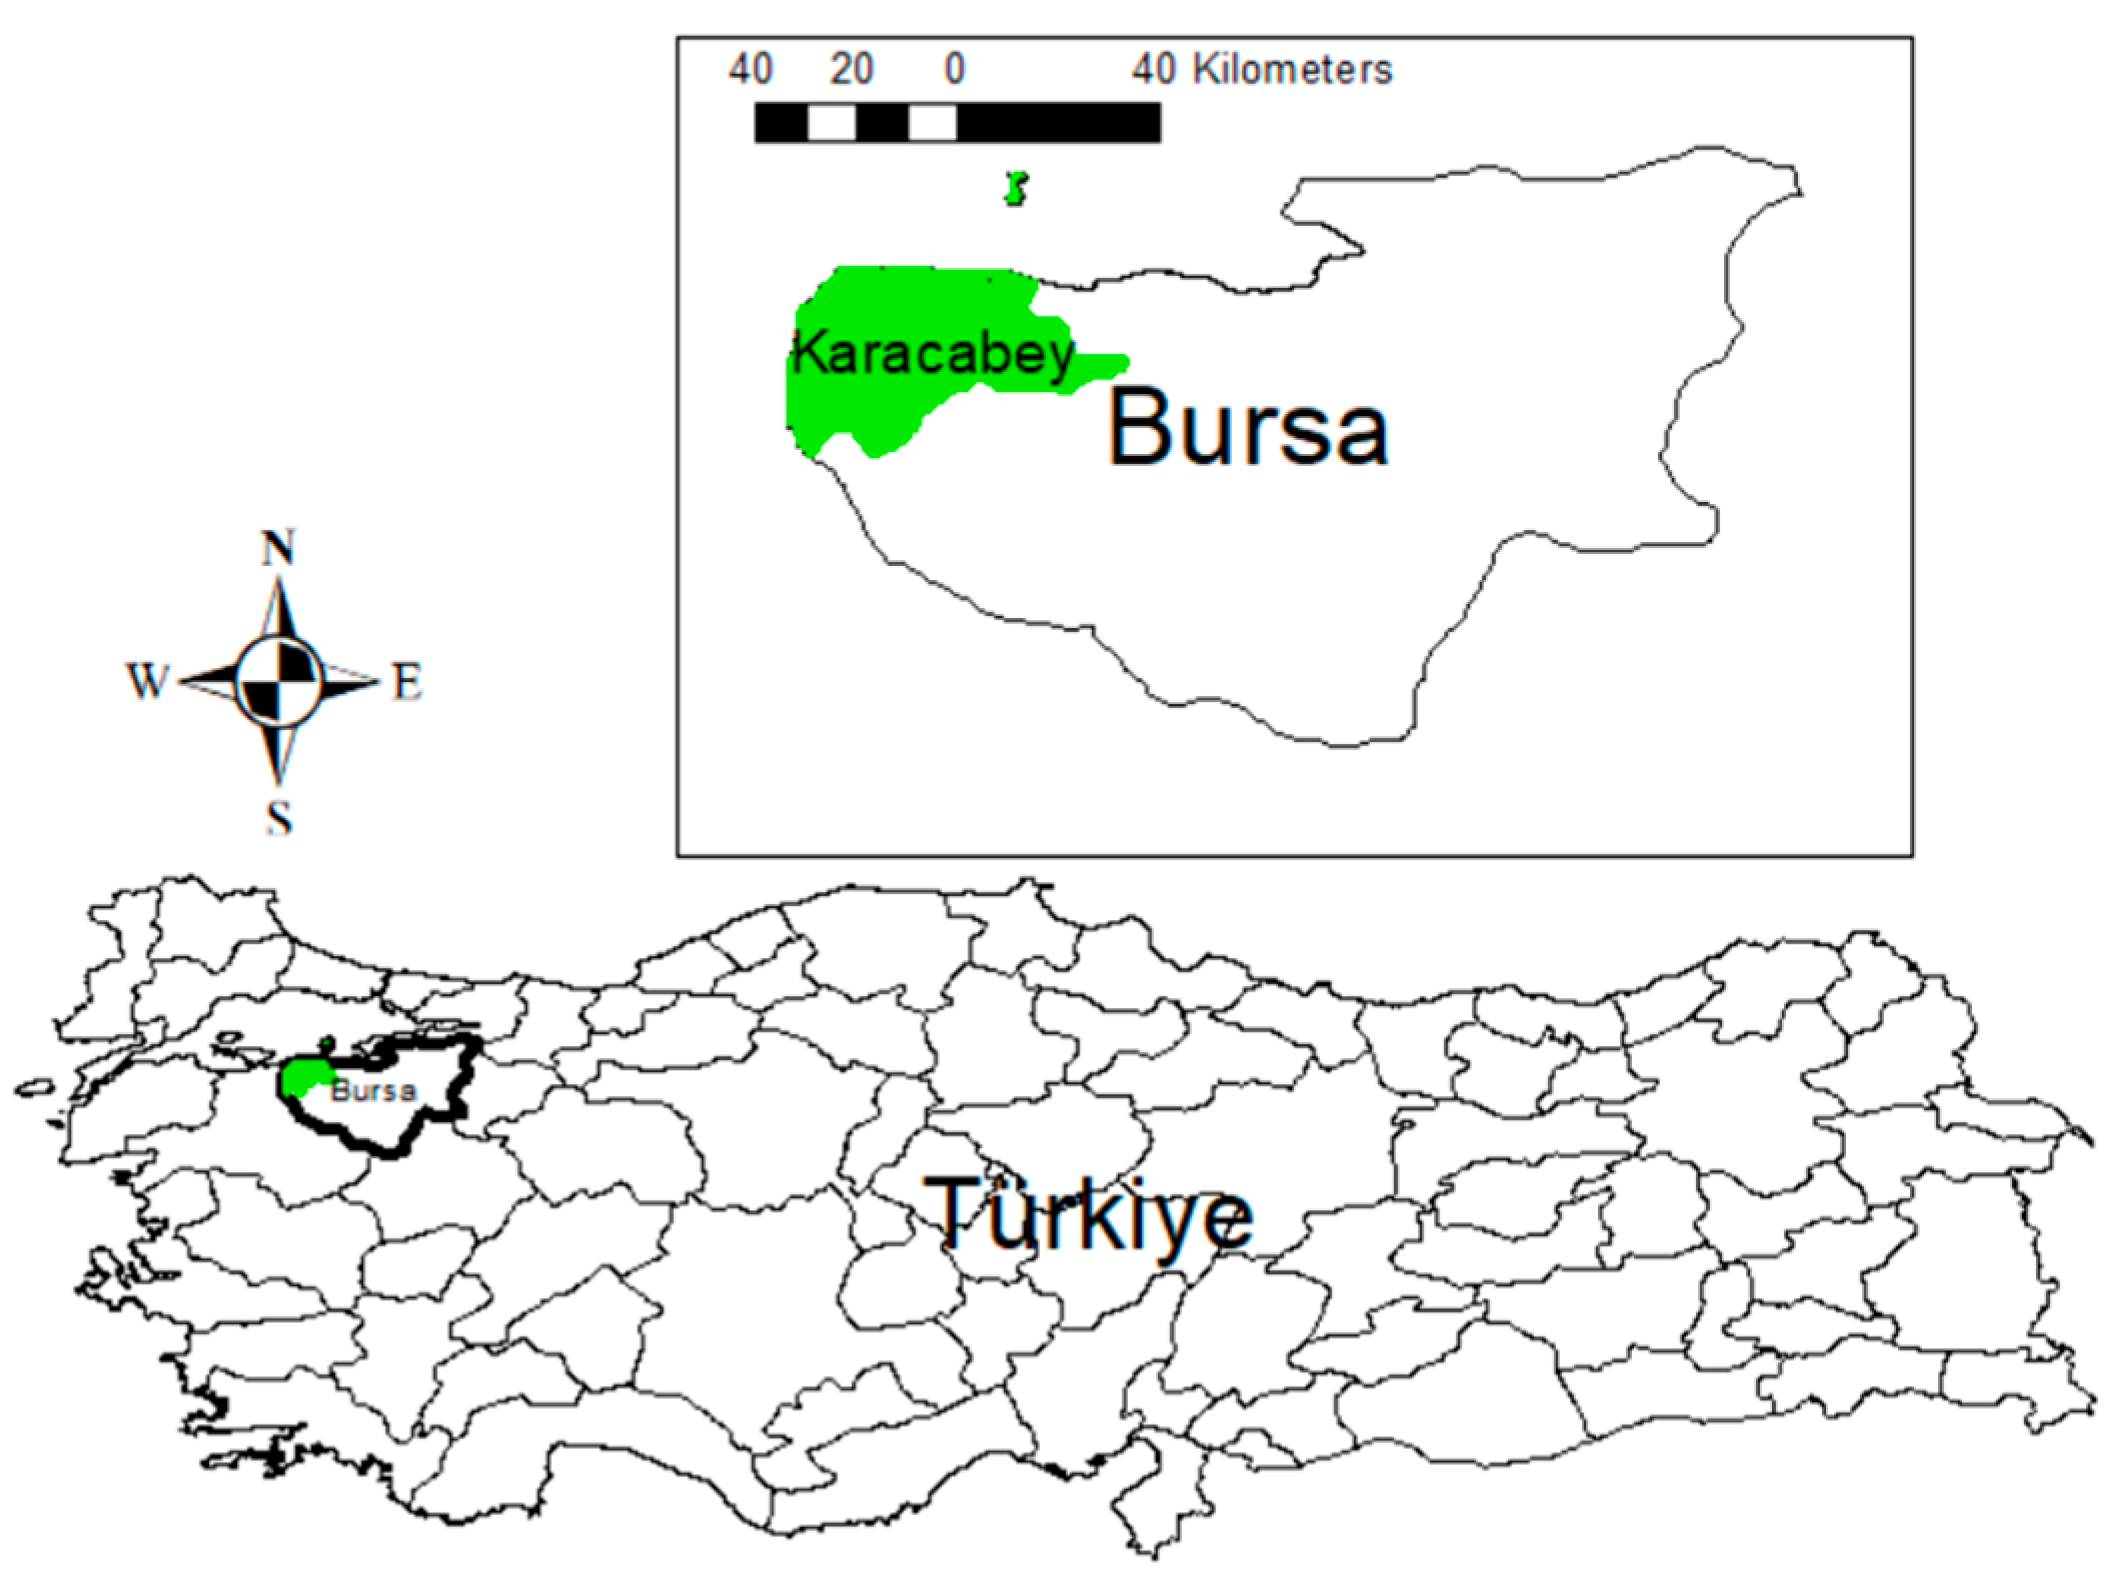
2.1. Study Area
2.2. Data Collection
2.3. Calculation of Performance Indicators
2.4. Statistical Evaluation
3. Results and Discussion
4. Conclusions
5. Suggestions
Funding
Institutional Review Board Statement
Informed Consent Statement
Data Availability Statement
Conflicts of Interest
References
- Çakmak, B.; Torun, E. Konya kapalı havzası sulama şebekelerinde tarımsal su ayak izinin değerlendirilmesi. Harran Tarım Gıda Bilim. Derg. 2023, 27, 239–252. [Google Scholar] [CrossRef]
- Koberinski, J. Towards a Regenerative Agriculture. Peace Mag. 2020, 36, 20. [Google Scholar]
- Li, L.; Huang, Y. Sustainable Agriculture in the Face of Climate Change: Exploring Farmers’ Risk Perception, Low-Carbon Technology Adoption, and Productivity in the Guanzhong Plain of China. Water 2023, 15, 2228. [Google Scholar] [CrossRef]
- Balasundram, S.K.; Shamshiri, R.R.; Sridhara, S.; Rizan, N. The Role of Digital Agriculture in Mitigating Climate Change and Ensuring Food Security: An Overview. Sustainability 2023, 15, 5325. [Google Scholar] [CrossRef]
- Ahmed, A.A.A.; Zahar, M.; Gribkova, V.; Nikolaeva, N.; Dwijendra, N.K.A.; Suksatan, W.; Atiyah, K.K.; Jalil, A.T.; Aravindhan, S. Effects of global warming on insect behaviour in agriculture. J. Water Land Dev. 2022, 54, 150–153. [Google Scholar] [CrossRef]
- Eğilmez, S.; Kaman, H. Arazi Toplulaştırmasının Sulama Altyapısı Açısından İncelenmesi. Cukurova Univ. Agric. Fac. 2022, 37, 171–178. [Google Scholar] [CrossRef]
- Sönmezyıldız, E.; Çakmak, B. Eskişehir Beyazaltın köyü arazi toplulaştırma alanında sulama performansının değerlendirilmesi. Akdeniz Üniversitesi Ziraat Fakültesi Derg. 2013, 26, 33–40. [Google Scholar]
- Arslan, F. Production-water user association performance nexus in mediterranean irrigated agriculture: The case of banana in Türkiye. Agric Water Manag. 2024, 292, 108650. [Google Scholar] [CrossRef]
- Seckler, D.; Barker, R.; Amarasinghe, U. Water scarcity in the twenty-first century. Int. J. Water Resour. Dev. 1999, 15, 29–42. [Google Scholar]
- Moriondo, M.; Bindi, M.; Brilli, L.; Costafreda-Aumedes, S.; Dibari, C.; Leolini, L.; Padovan, G.; Trombi, G.; Karali, A.; Varotsos, K.V.; et al. Assessing climate change impacts on crops by adopting a set of crop performance indicators. EuroMediterr. J. Env. Integr. 2021, 6, 45. [Google Scholar] [CrossRef]
- Arslan, F.; Zema, D.A. Performance Indicators for Improving Irrigation Management in Aegean District. Black Sea J. Agric. 2024, 7, 703–709. [Google Scholar] [CrossRef]
- Dominguez-Bohorquez, J.D.; Wittling, C.; Cheviron, B.; Bouarfa, S.; Urruty, N.; Lopez, J.M.; Dejean, C. Early-Stage Impacts of Irrigated Conservation Agriculture on Soil Physical Properties and Crop Performance in a French Mediterranean System. Agronomy 2025, 15, 299. [Google Scholar] [CrossRef]
- Anvari, S.; Mousavi, S.J.; Morid, S. Stochastic Dynamic Programming-Based Approach for Optimal Irrigation Scheduling under Restricted Water Availability Conditions. Irrig. Drain. 2017, 66, 492–500. [Google Scholar] [CrossRef]
- Jin, L.; Huang, G.; Fan, Y.; Nie, X.; Cheng, G. A Hybrid Dynamic Dual Interval Programming for Irrigation Water Allocation under Uncertainty. Water Resour. Manag. 2012, 26, 1183–1200. [Google Scholar] [CrossRef]
- Imron, F.; Murtiningrum. Optimization of irrigation water allocation by using linear programming: Case study on Belitang irrigation system. In IOP Conference Series: Earth and Environmental Science; IOP Publishing: Bristol, UK, 2021. [Google Scholar] [CrossRef]
- Azamathulla, H.M.; Ab Ghani, A.; Zakaria, N.A.; Chang, C.K. Linear Programming Approach for Irrigation Scheduling—A case Study. In Proceedings of the 14th MANCID Annual Conference, Sofia, Bulgaria, 5–8 November 2009. [Google Scholar]
- Azamathulla, H.M. Linear programming for irrigation scheduling—A case study. In Linear Programming: New Frontiers in Theory and Applications; Nova Science Publisher Inc.: Hauppauge, NY, USA, 2012. [Google Scholar]
- Difallah, W.; Benahmed, K.; Draoui, B.; Bounaama, F. Linear Optimization Model for Efficient Use of Irrigation Water. Int. J. Agron. 2017, 2017, 5353648. [Google Scholar] [CrossRef]
- Lei, H.; Lian, Y.; Du, J.; Pan, H.; Li, X.; Li, D.; Jin, C.; Xiao, Z.; Hou, Y. Dynamic Optimization of Greenhouse Tomato Irrigation Schedule Based on Water, Fertilizer and Air Coupled Production Function. Agronomy 2023, 13, 776. [Google Scholar] [CrossRef]
- Fernández García, I.; Lecina, S.; Ruiz-Sánchez, M.C.; Vera, J.; Conejero, W.; Conesa, M.R.; Domínguez, A.; Pardo, J.J.; Léllis, B.C.; Montesinos, P. Trends and challenges in irrigation scheduling in the semi-arid area of Spain. Water 2020, 12, 785. [Google Scholar] [CrossRef]
- Arslan, H.; Tunca, E. Arazi Toplulaştırmasının Sulama Projelerinin Performansı Üzerine Etkileri. Anadolu Tarım Bilim. Derg. 2013, 28, 126–133. [Google Scholar] [CrossRef]
- Arslan, F.; Sawassi, A.; Derardja, B.; Değirmenci, H.; Lamaddalena, N. The effects of land consolidation projects on pressurized irrigation system design and the cost: A case study from Türkiye. Ecohydrol. Hydrobiol. 2024, 24, 608–616. [Google Scholar] [CrossRef]
- Abu-Zeid, K.M. Recent trends and developments: Reuse of wastewater in agriculture. Environ. Manag. Health 1998, 9, 79–89. [Google Scholar] [CrossRef]
- Awais, M.; Li, W.; Yang, Y.F.; Ji, L.L. Detection of plant water stress using UAV thermal images for precision farming application. Appl. Ecol. Environ. Res. 2020, 18, 4087. [Google Scholar] [CrossRef]
- Ricart, S.; Olcina, J.; Rico, A.M. Introductory Chapter: Addressing Past Claims and Oncoming Challenges for Irrigation Systems. In Irrigation—Water Productivity and Operation, Sustainability and Climate Change; Intechopen: London, UK, 2019. [Google Scholar] [CrossRef]
- Zema, D.A.; Filianoti, P.; D’Agostino, D.; Labate, A.; Lucas-Borja, M.E.; Nicotra, A.; Zimbone, S.M. Analyzing the performances of water user associations to increase the irrigation sustainability: An application of multivariate statistics to a case study in Italy. Sustainability 2020, 12, 6327. [Google Scholar] [CrossRef]
- González-Pavón, C.; Arviza-Valverde, J.; Balbastre-Peralta, I.; Sierra, J.M.C.; Palau-Salvador, G. Are water user associations prepared for a second-generation modernization? The case of the valencian community (Spain). Water 2020, 12, 2136. [Google Scholar] [CrossRef]
- Alcon, F.; Zabala, J.A.; Martínez-García, V.; Albaladejo, J.A.; López-Becerra, E.I.; De-Miguel, M.D.; Martínez-Paz, J.M. The social wellbeing of irrigation water. A demand-side integrated valuation in a Mediterranean agroecosystem. Agric Water Manag. 2022, 262, 107400. [Google Scholar] [CrossRef]
- Arslan, F.; Kartal, S. Water Management Effect on Tropical Fruits: Case Study Of Alanya, Turkey. In Engineering for Rural Development; Latvia University of Life Sciences and Technologies: Jelgava, Latvia, 2023. [Google Scholar] [CrossRef]
- Bastiaanssen, W.G.M.; Bos, M.G. Irrigation performance indicators based on remotely sensed data: A review of literature. Irrig. Drain. Syst. 1999, 13, 291–311. [Google Scholar] [CrossRef]
- Rodríguez-Díaz, J.A.; Camacho-Poyato, E.; López-Luque, R.; Pérez-Urrestarazu, L. Benchmarking and multivariate data analysis techniques for improving the efficiency of irrigation districts: An application in Spain. Agric. Syst. 2008, 96, 250–259. [Google Scholar] [CrossRef]
- Ntantos, P.N.; Karpouzos, D.K. Application of data envelopment analysis and performance indicators to irrigation systems in Thessaloniki Plain (Greece). World Acad. Sci. Eng. Technol. 2010, 46, 56–62. [Google Scholar]
- Seyedzadeh, A.; Khazaee, P.; Siosemardeh, A.; Maroufpoor, E. Irrigation management evaluation of multiple irrigation methods using performance indicators. ISH J. Hydraul. Eng. 2022, 28, 312. [Google Scholar] [CrossRef]
- Uçar, Y.; Kara, M. Arazi Toplulaştırmasının Su İletim ve Dağıtım Performansına Etkisi. KSÜ Fen Mühendislik Derg. 2006, 9, 117–124. [Google Scholar]
- Bahar, S.K.; Kirmikil, M. The evaluation of agricultural landowner inputs before and after land consolidation: The Kesik Village example. Land Use Policy 2021, 109, 105605. [Google Scholar] [CrossRef]
- Kirmikil, M.; Arici, I. The role of land consolidation in the development of rural areas in irrigation areas. J. Food Agric. Environ. 2013, 11, 1150–1155. [Google Scholar]
- Fao. The Design of Land Consolidation Pilot Projects in Central and Eastern Europe; Food and Agriculture Organization of the United Nations (FAO): Rome, Italy, 2003. [Google Scholar]
- Yağanoğlu, A.V.; Fayrap, A.; Yanık, R. Sulama Projelerinde Arazi Toplulaştırmasının Gerekliliği: Daphan Sulaması Örneği. Bursa Uludag Üniv. Ziraat Fak. Derg. 2018, 32, 55–67. [Google Scholar]
- Moradinejad, A.; Eslampour, S. Increasing Water Productivity by Modifying the Pattern of Irrigation and Land Consolidation. Water Manag. Agric. 2018, 5, 59–70. [Google Scholar]
- Sarıyıldız, T. Bursa, Karacabey subasar ormanı kızılağaç meşcerelerinde yıllık döküm miktarı ve bu yolla ekosisteme giren karbon ve besin maddesi. Türkiye Orman. Derg. Turk. J. For. 2024, 25, 156–165. [Google Scholar] [CrossRef]
- Yaslıoğlu, E.; Arıcı, I.; Kuşçu, H.; Gündoğdu, K.S.; Akkaya Aslan, T.; Kirmikil, M. Adoption factors of irrigation systems whose projects are synchronized with land consolidation. Kuwait J. Sci. Eng. 2008, 35, 71–80. [Google Scholar]
- Kirmikil, M. The Evaluation of a Land Consolidation Project by Water Managers In a Rural Area: A Case Study In Karacabey. Fresenius Env. Bull 2019, 28, 3097–3103. [Google Scholar]
- DSI. DSI’ce İşletilen ve Devredilen Sulama Tesisleri Değerlendirme Raporu; T.C. Tarım ve Orman Bakanlığı; Devlet Su İşleri Genel Müdürlüğü, ; İşletme ve Bakım Dairesi Başkanlığı: Ankara, Turkey, 2024; 796p. [Google Scholar]
- FAO. The State of Food and Agriculture 2023; FAO: Rome, Italy, 2023. [Google Scholar] [CrossRef]
- UNESCO. The United Nations World Water Development Report 2023; UNESCO: Paris, France, 2023. [Google Scholar]
- Pointet, T. The United Nations World Water Development Report 2022 on groundwater, a synthesis. LHB Hydrosci. J. 2022, 108, 2090867. [Google Scholar] [CrossRef]
- Molden, D. Water for Food Water for Life: A Comprehensive Assessment of Water Management in Agriculture; Routledge: London, UK, 2013. [Google Scholar] [CrossRef]
- Viala, E. Water for food, water for life a comprehensive assessment of water management in agriculture. Irrig. Drain. Syst. 2008, 22, 127–129. [Google Scholar] [CrossRef]
- Kartal, S.; Değirmenci, H.; Arslan, F. Ranking irrigation schemes based on principle component analysis in the arid regions of Turkey. Agron. Res. 2019, 17, 456–465. [Google Scholar] [CrossRef]
- Kukul, Y.S.; Akçay, S.; Anaç, S.; Yeşilirmak, E. Temporal irrigation performance assessment in Turkey: Menemen case study. Agric. Water Manag. 2008, 95, 1090–1098. [Google Scholar] [CrossRef]
- Carrillo-Cobo, M.T.; Rodriguez-Diaz, J.A.; Camacho-Poyato, E. The role of energy audits in irrigated areas. The case of ‘Fuente Palmera’ irrigation district (Spain). Span. J. Agric. Res. 2010, 8, 152–161. [Google Scholar] [CrossRef]
- Raju, K.S.; Pillai, C.R.S. Multicriterion decision making in performance evaluation of an irrigation system. Eur. J. Oper. Res. 1999, 112, 479–488. [Google Scholar] [CrossRef]
- Elshaikh, A.E.; Jiao, X.; Yang, S.H. Performance evaluation of irrigation projects: Theories, methods, and techniques. Agric. Water Manag. 2018, 203, 87–96. [Google Scholar] [CrossRef]
- Abadia, R.; Rocamora, M.C.; Corcoles, J.I.; Ruiz-Canales, A.; Martinez-Romero, A.; Moreno, M.A. Comparative analysis of energy efficiency in water users associations. Span. J. Agric. Res. 2010, 8, 134–142. [Google Scholar] [CrossRef]
- Alcon, F.; García-Bastida, P.A.; Soto-García, M.; Martínez-Alvarez, V.; Martin-Gorriz, B.; Baille, A. Explaining the performance of irrigation communities in a water-scarce region. Irrig. Sci. 2017, 35, 193–203. [Google Scholar] [CrossRef]
- Kartal, S.; Değirmenci, H.; Arslan, F.; Gizlenci, İ. Evaluation of some Water, Energy and Financial Indicators: A Case Study of Esenli Water User Association in Yozgat, Türkiye. Tarim Bilim. Derg. 2023, 29, 643–654. [Google Scholar] [CrossRef]
- Zema, D.A.; Nicotra, A.; Mateos, L.; Zimbone, S.M. Improvement of the irrigation performance in Water Users Associations integrating data envelopment analysis and multi-regression models. Agric. Water Manag. 2018, 205, 38–49. [Google Scholar] [CrossRef]
- Molden, D.; Sakthivadivel, R.; Perry, C.J.; De Fraiture, C.; Kloezen, W.H. Indicators for Comparing Performance of Irrigated Agricultural Systems; Iwmi: Colombo, Sri Lanka, 1998; Volume 20. [Google Scholar]
- Arslan, F.; Córcoles Tendero, J.I.; Rodríguez Díaz, J.A.; Zema, D.A. Comparison of Irrigation Management in Water User Associations of Italy, Spain and Turkey Using Benchmarking Techniques. Water Resour. Manag. 2023, 37, 55–74. [Google Scholar] [CrossRef]
- Malano, H.; Burton, M. Guidelines for Benchmarking Performance in the Irrigation and Drainage Sector; International Programme for Technology and Research in Irrigation and Drainage (IPTRID): Rome, Italy, 2001. [Google Scholar]
- Kartal, S.; Değirmenci, H. Antalya bölgesi sulama şebekelerinin değerlendirilmesi. Mediterr. Agric. Sci. 2020, 33, 381–388. [Google Scholar] [CrossRef]
- Schober, P.; Schwarte, L.A. Correlation coefficients: Appropriate use and interpretation. Anesth. Analg. 2018, 126, 1763–1768. [Google Scholar] [CrossRef]
- Aytaç, M. Korelasyon katsayılarının genelleştirilmesi. Uludağ Üniversitesi İktisadi İdari Bilim. Fakültesi Derg. 1983, 4, 209–221. [Google Scholar]
- Dufera, A.G.; Liu, T.; Xu, J. Regression models of Pearson correlation coefficient. Stat. Theory Relat. Fields 2023, 7, 97–106. [Google Scholar] [CrossRef]
- Kartal, S.; Değirmenci, H.; Arslan, F. Assessment of irrigation schemes with performance indicators in southeastern irrigation district of Turkey. J. Agric. Sci. 2020, 26, 138–146. [Google Scholar] [CrossRef]
- Caixabank Research. The Use of Water in Agriculture: Making Progress in Modernising Irrigation and Efficient Water Management. Available online: https://www.caixabankresearch.com (accessed on 7 November 2024).
- Arslan, F.; Değirmenci, H.; Kartal, S.; Alcon, F. Mapping performance of irrigation schemes in turkey. Agron. Res. 2020, 18, 2303–2316. [Google Scholar] [CrossRef]
- Gençoğlu, M.; Değirmenci, H. Sulama Performansının Değerlendirilmesi: Kırıkhan Sulama Birliği Örneği. KSU J. Agric. Nat. 2019, 22, 436–443. [Google Scholar] [CrossRef]
- Eliçabuk, C.; Toprak, R. Gevrekli Sulama Birliği’nde Sulama Performansının Değerlendirilmesi. Selçuk Tarım Bilim. Derg. 2017, 3, 191–199. [Google Scholar]
- Uçar, Y. Performance assessment irrigation schemes according to comparative indicators: A case study of Isparta, Turkey. Eur. J. Sci. Res. 2011, 52, 82–90. [Google Scholar]
- Puerto, H.; Mora, M.; Roig-Merino, B.; Abadía-Sánchez, R.; Cámara-Zapata, J.M.; Suay, R.; Rocamora, C. Orchard level assessment of irrigation performance and water productivity of an irrigation community in eastern spain. Agronomy 2021, 11, 1829. [Google Scholar] [CrossRef]
- Lorite, I.J.; Mateos, L.; Fereres, E. Evaluating irrigation performance in a Mediterranean environment. Irrig. Sci. 2004, 23, 85–92. [Google Scholar] [CrossRef]
- Dechmi, F.; Playán, E.; Faci, J.M.; Tejero, M. Analysis of an irrigation district in northeastern Spain I. Characterisation and water use assessment. Agric. Water Manag. 2003, 61, 75–92. [Google Scholar] [CrossRef]
- Parra, L.; Botella-Campos, M.; Puerto, H.; Roig-Merino, B.; Lloret, J. Evaluating irrigation efficiency with performance indicators: A case study of citrus in the east of spain. Agronomy 2020, 10, 1359. [Google Scholar] [CrossRef]
- Değirmenci, H.; Arslan, F. Sulama Birliklerine Devredilen Sulama Şebekelerinde İşletme ve Bakım Giderlerinin Analizi. Su Kaynakları 2008, 3, 16–23. [Google Scholar]
- Zema, D.A.; Nicotra, A.; Tamburino, V.; Zimbone, S.M. Performance Assessment Of Collective Irrigation In Water Users’ Associations Of Calabria (Southern Italy). Irrig. Drain. 2015, 64, 314–325. [Google Scholar] [CrossRef]
- Çifçi, Ş.; Değirmenci, H. Sulama Performans Göstergeleri ve TOPSİS Yöntemi ile Asi Havzası Sulama Birliklerinin Analizi. J. Agric. Nat. 2022, 25, 169–180. [Google Scholar] [CrossRef]
- Molden, D.; Oweis, T.; Steduto, P.; Bindraban, P.; Hanjra, M.A.; Kijne, J. Improving agricultural water productivity: Between optimism and caution. Agric. Water Manag. 2010, 97, 528–535. [Google Scholar] [CrossRef]
- Zwart, S.J.; Bastiaanssen, W.G.M. Review of measured crop water productivity values for irrigated wheat, rice, cotton and maize. Agric. Water Manag. 2004, 69, 115–133. [Google Scholar] [CrossRef]
- Steduto, P.; Hsiao, T.C.; Fereres, E. On the conservative behavior of biomass water productivity. Irrig. Sci. 2007, 25, 189–207. [Google Scholar] [CrossRef]
- Fereres, E.; Soriano, M.A. Deficit irrigation for reducing agricultural water use. J. Exp. Bot. 2007, 58, 147–159. [Google Scholar] [CrossRef]
- Howell, T.A. Enhancing water use efficiency in irrigated agriculture. Agron. J. 2001, 93, 281–289. [Google Scholar] [CrossRef]
- Bouman, B.A.M.; Humphreys, E.; Tuong, T.P.; Barker, R. Rice and Water. Adv. Agron. 2007, 92, 187–237. [Google Scholar] [CrossRef]
- Fernández, J.E.; Alcon, F.; Diaz-Espejo, A.; Hernandez-Santana, V.; Cuevas, M.V. Water use indicators and economic analysis for on-farm irrigation decision: A case study of a super high density olive tree orchard. Agric. Water Manag. 2020, 237, 106074. [Google Scholar] [CrossRef]
- Perry, C.; Steduto, P.; Allen, R.G.; Burt, C.M. Increasing productivity in irrigated agriculture: Agronomic constraints and hydrological realities. Agric. Water Manag. 2009, 96, 1517–1524. [Google Scholar] [CrossRef]
- Rogers, P.; Bhatia, R.; Huber, A. Water as a Social and Economic Good: How to Put the Principle into Practice (TAC Background Papers No.2); Global Water Partnership/Swedish International: Stockholm, Sweden, 1998. [Google Scholar]
- Frederiksen, H.D.; Berkoff, J.; Barber, W. Water Resources Management in Asia; The World Bank: Washington, DC, USA, 1993. [Google Scholar]

| Service Area (ha) | 15,863 |
|---|---|
| Main crops | Corn (46%), vegetables (34%), paddy and sugarcane (11%) |
| Water source | B.Karadere River and Manyas Lake |
| Water supply | Pumped (100%) |
| Water distribution | Canalette (100%) |
| Irrigation methods used by farmers | Surface (14%), sprinkler (5%), drip (80%) |
| Indicators | Formula | Unit | Optimum Value |
|---|---|---|---|
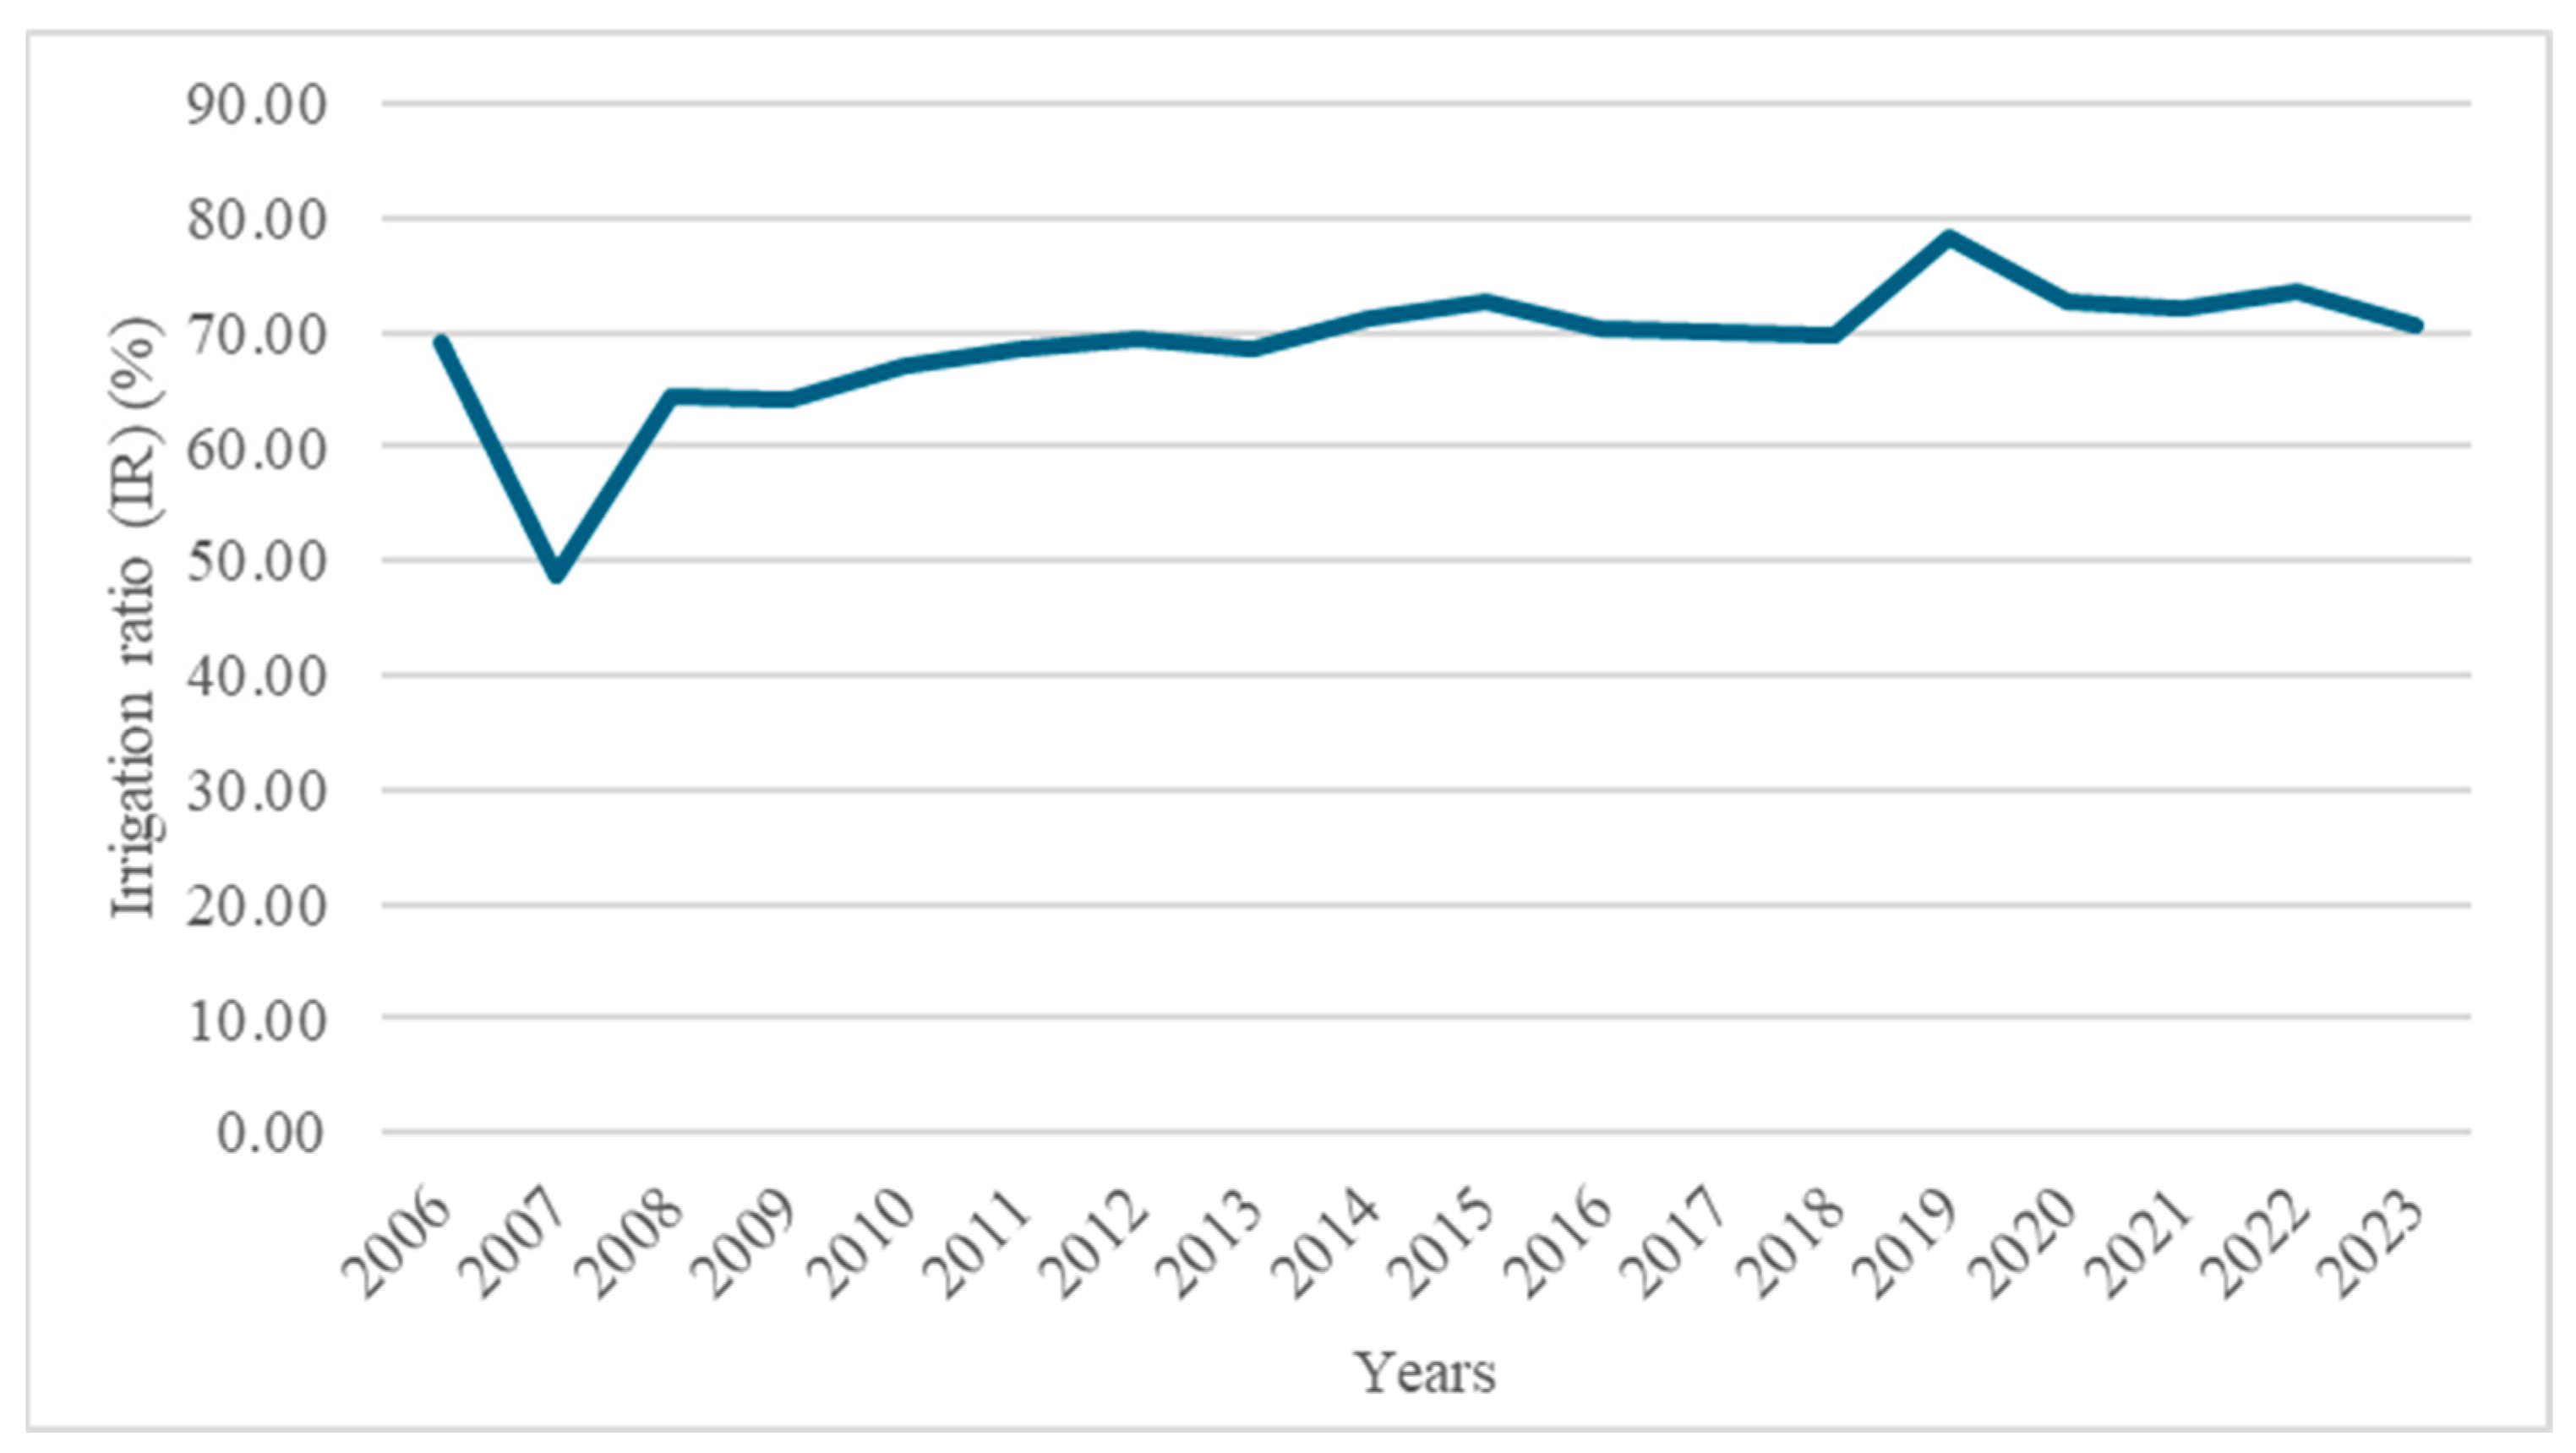
| Irrigation ratio (IR) | % | 100 | |
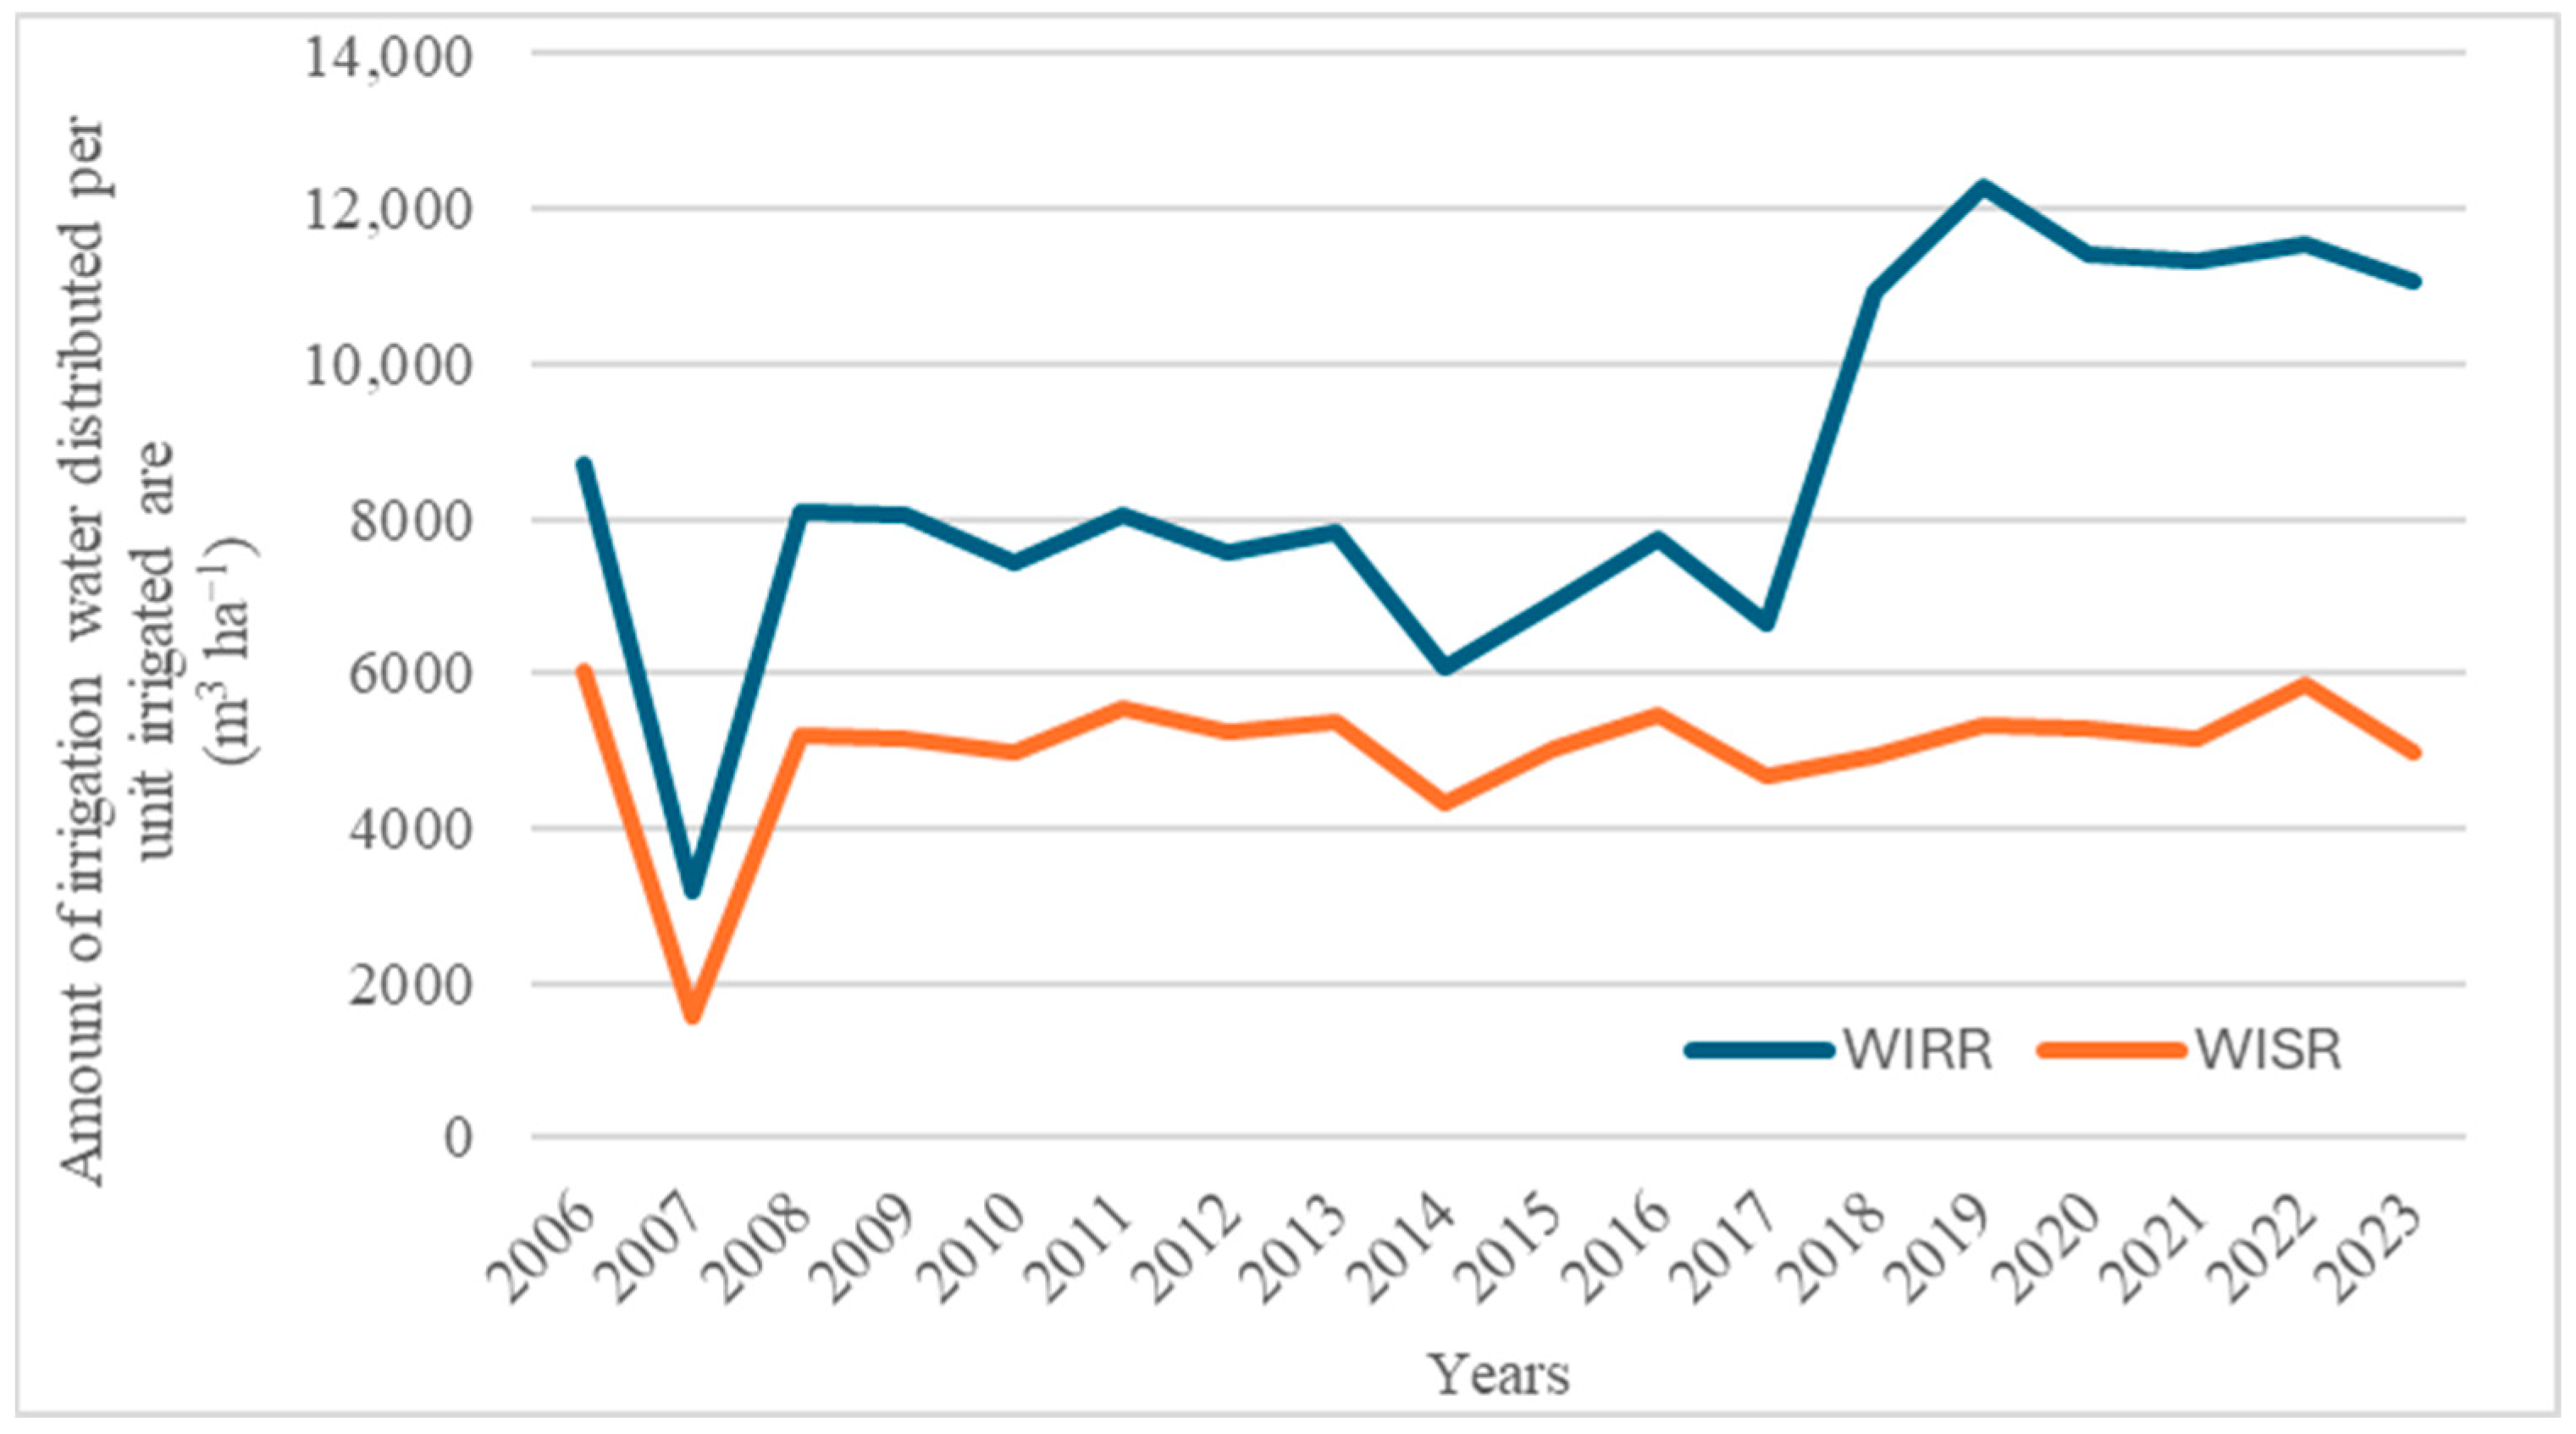
| Annual amount of water used per unit of irrigated area (WIRR) | m3 ha−1 | - | |
| Annual amount of water used per unit service area (WISR) | m3 ha−1 | - | |
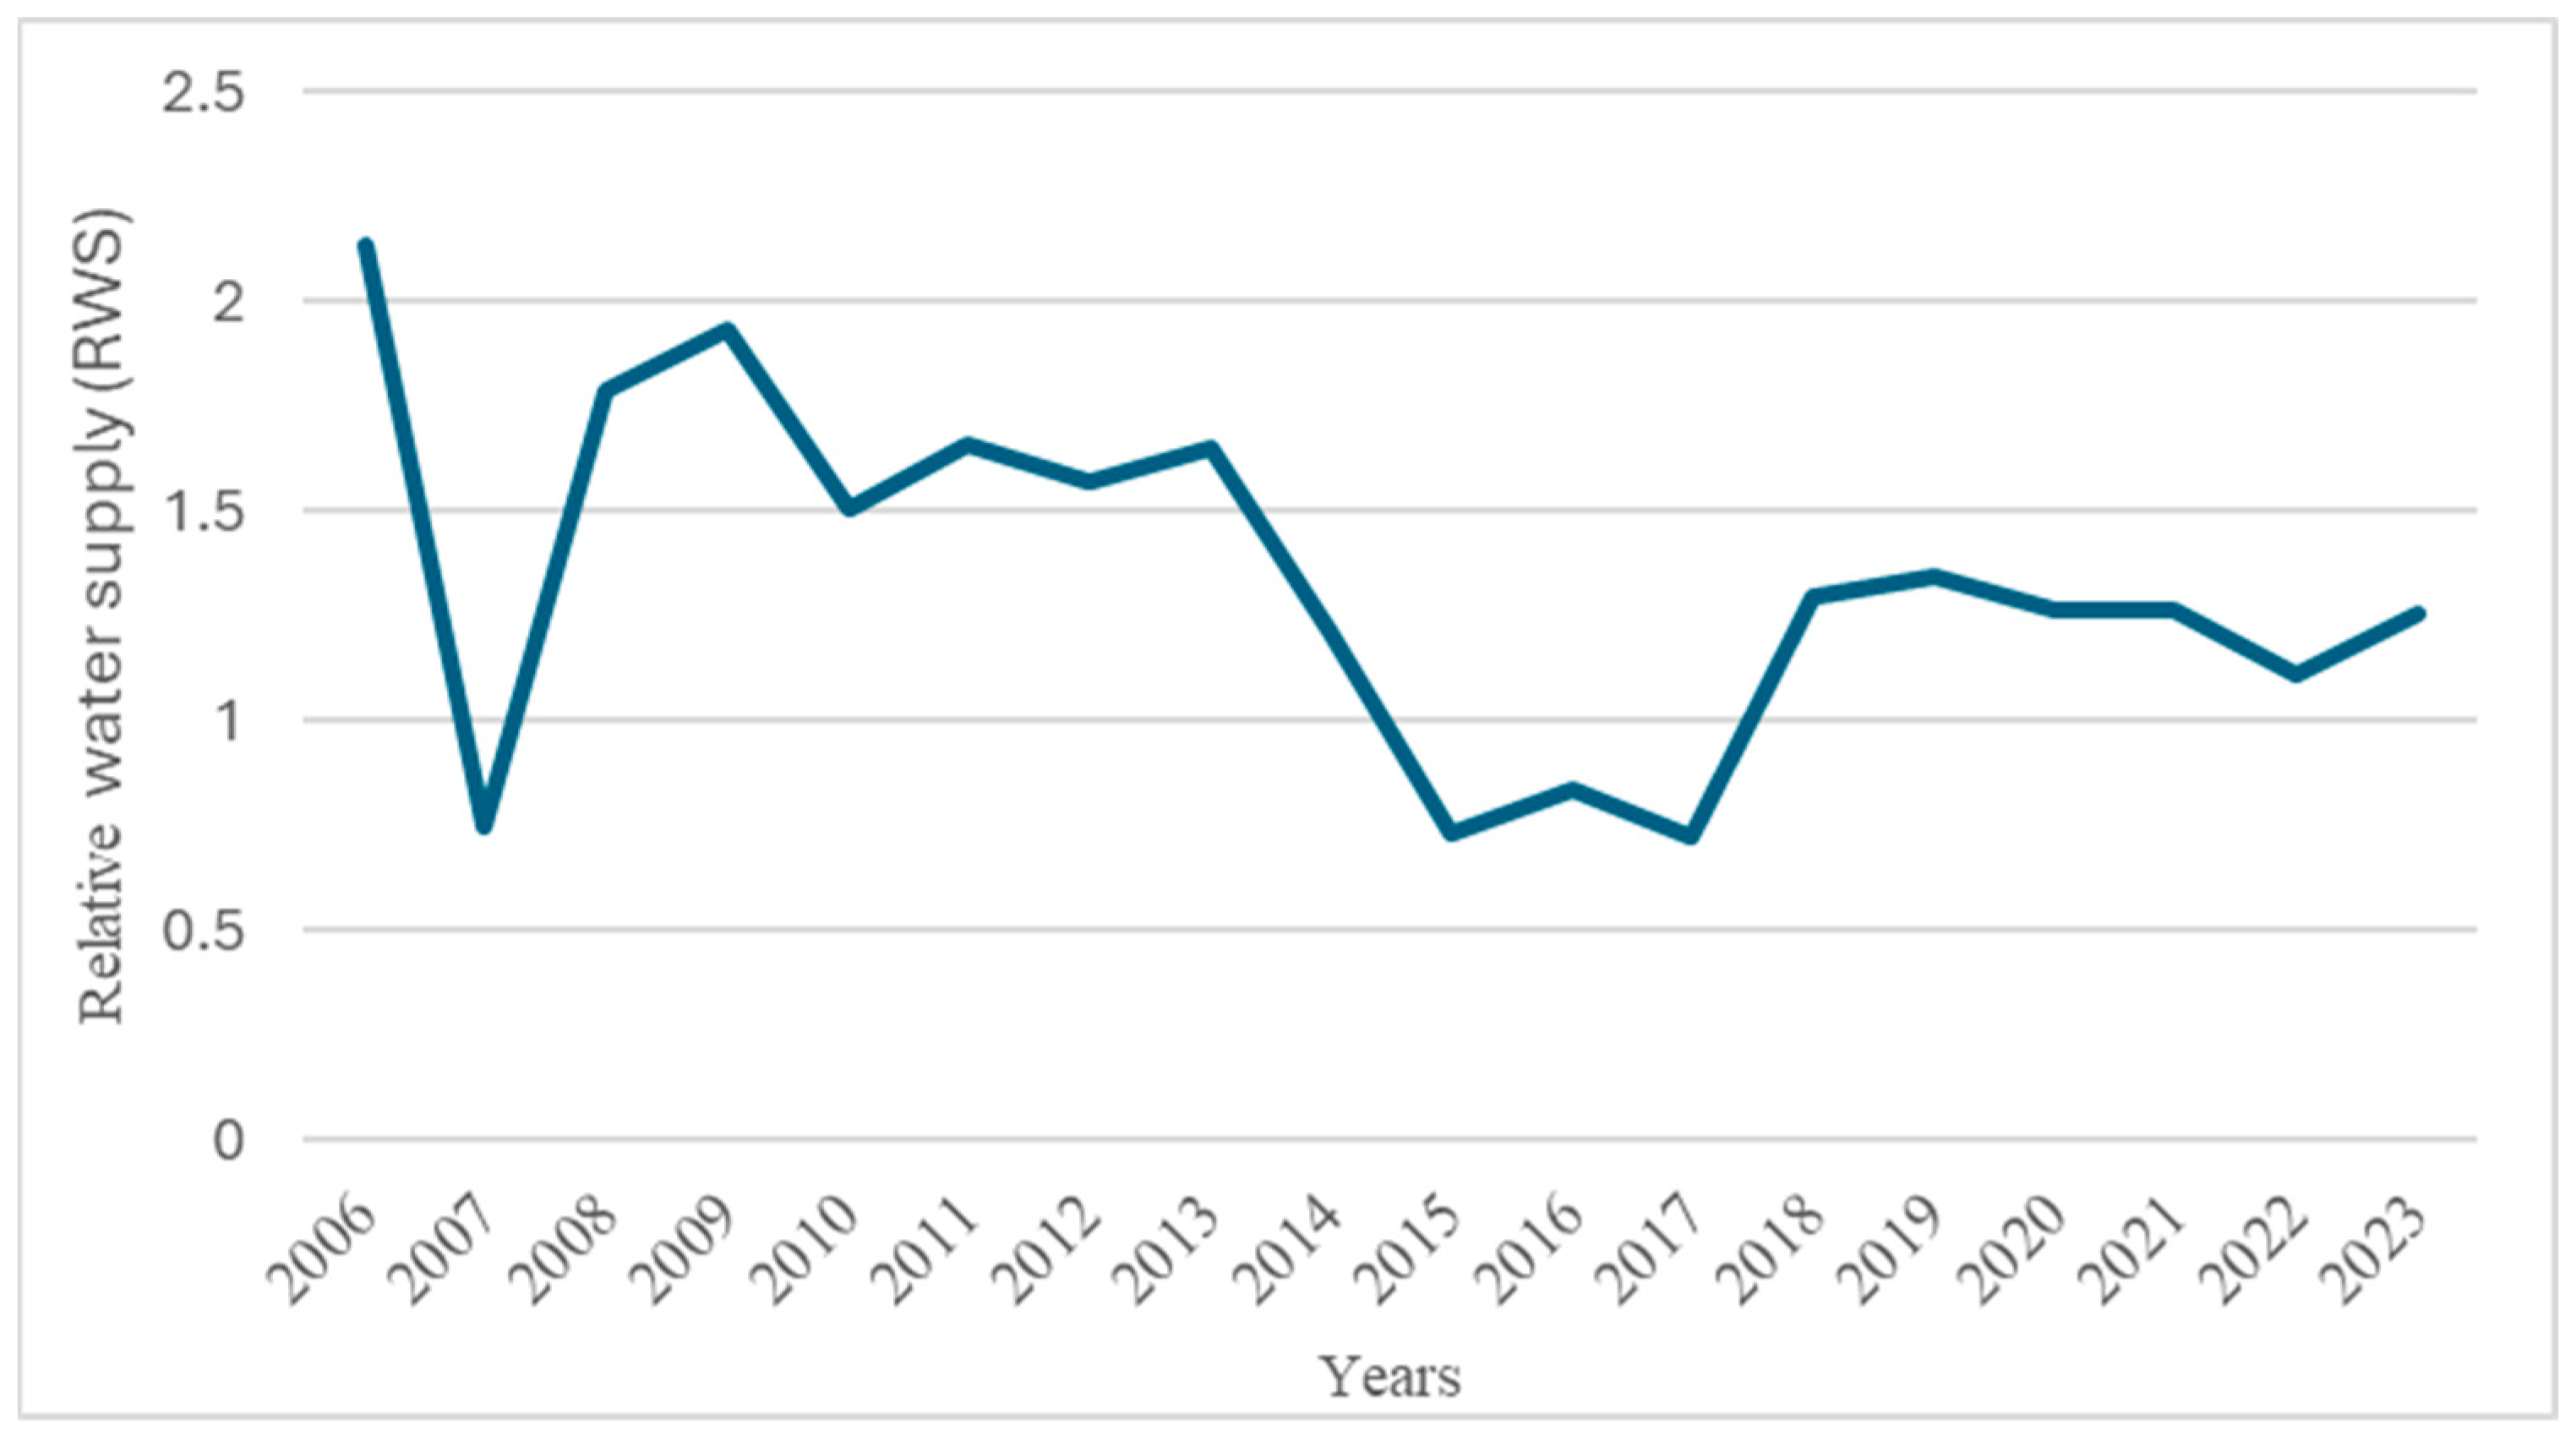
| Relative water supply (RWS) | no unit | 1 | |
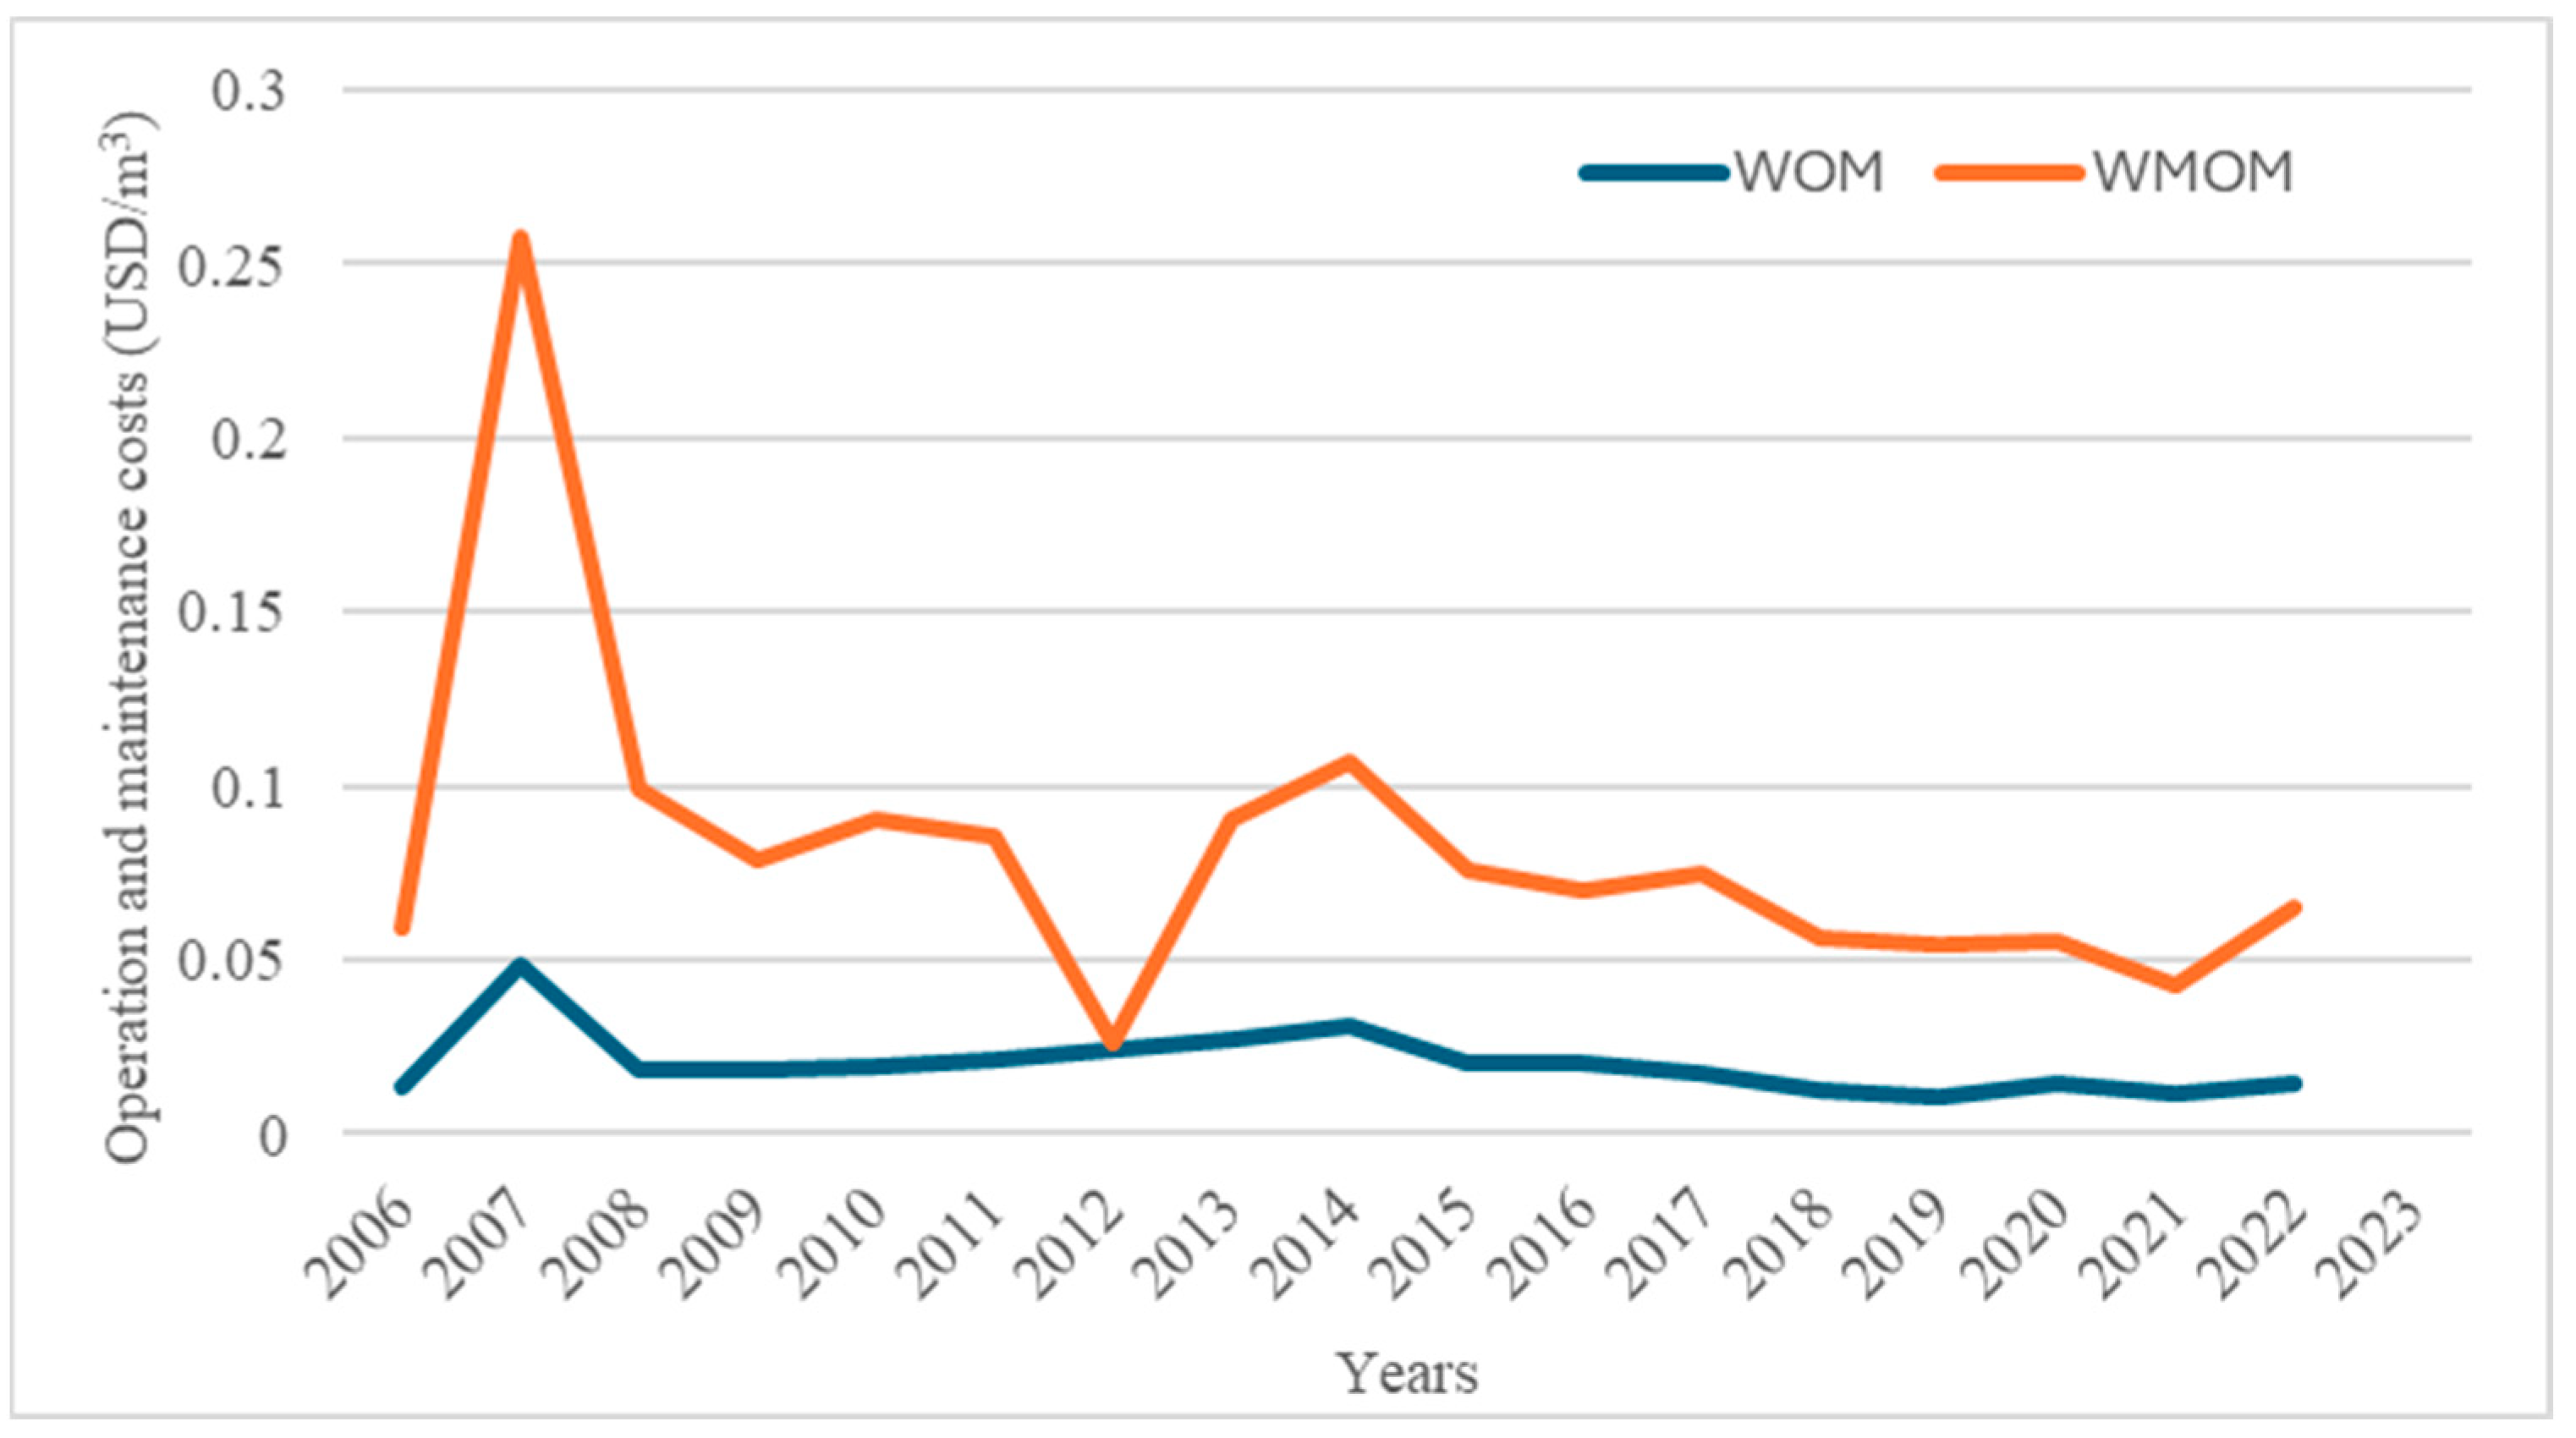
| Operation and maintenance cost per unit of irrigation water (WOM) | USDm−3 | - | |
| Management, operations and maintenance cost per unit of irrigation water (WMOM) | USDm−3 | - | |
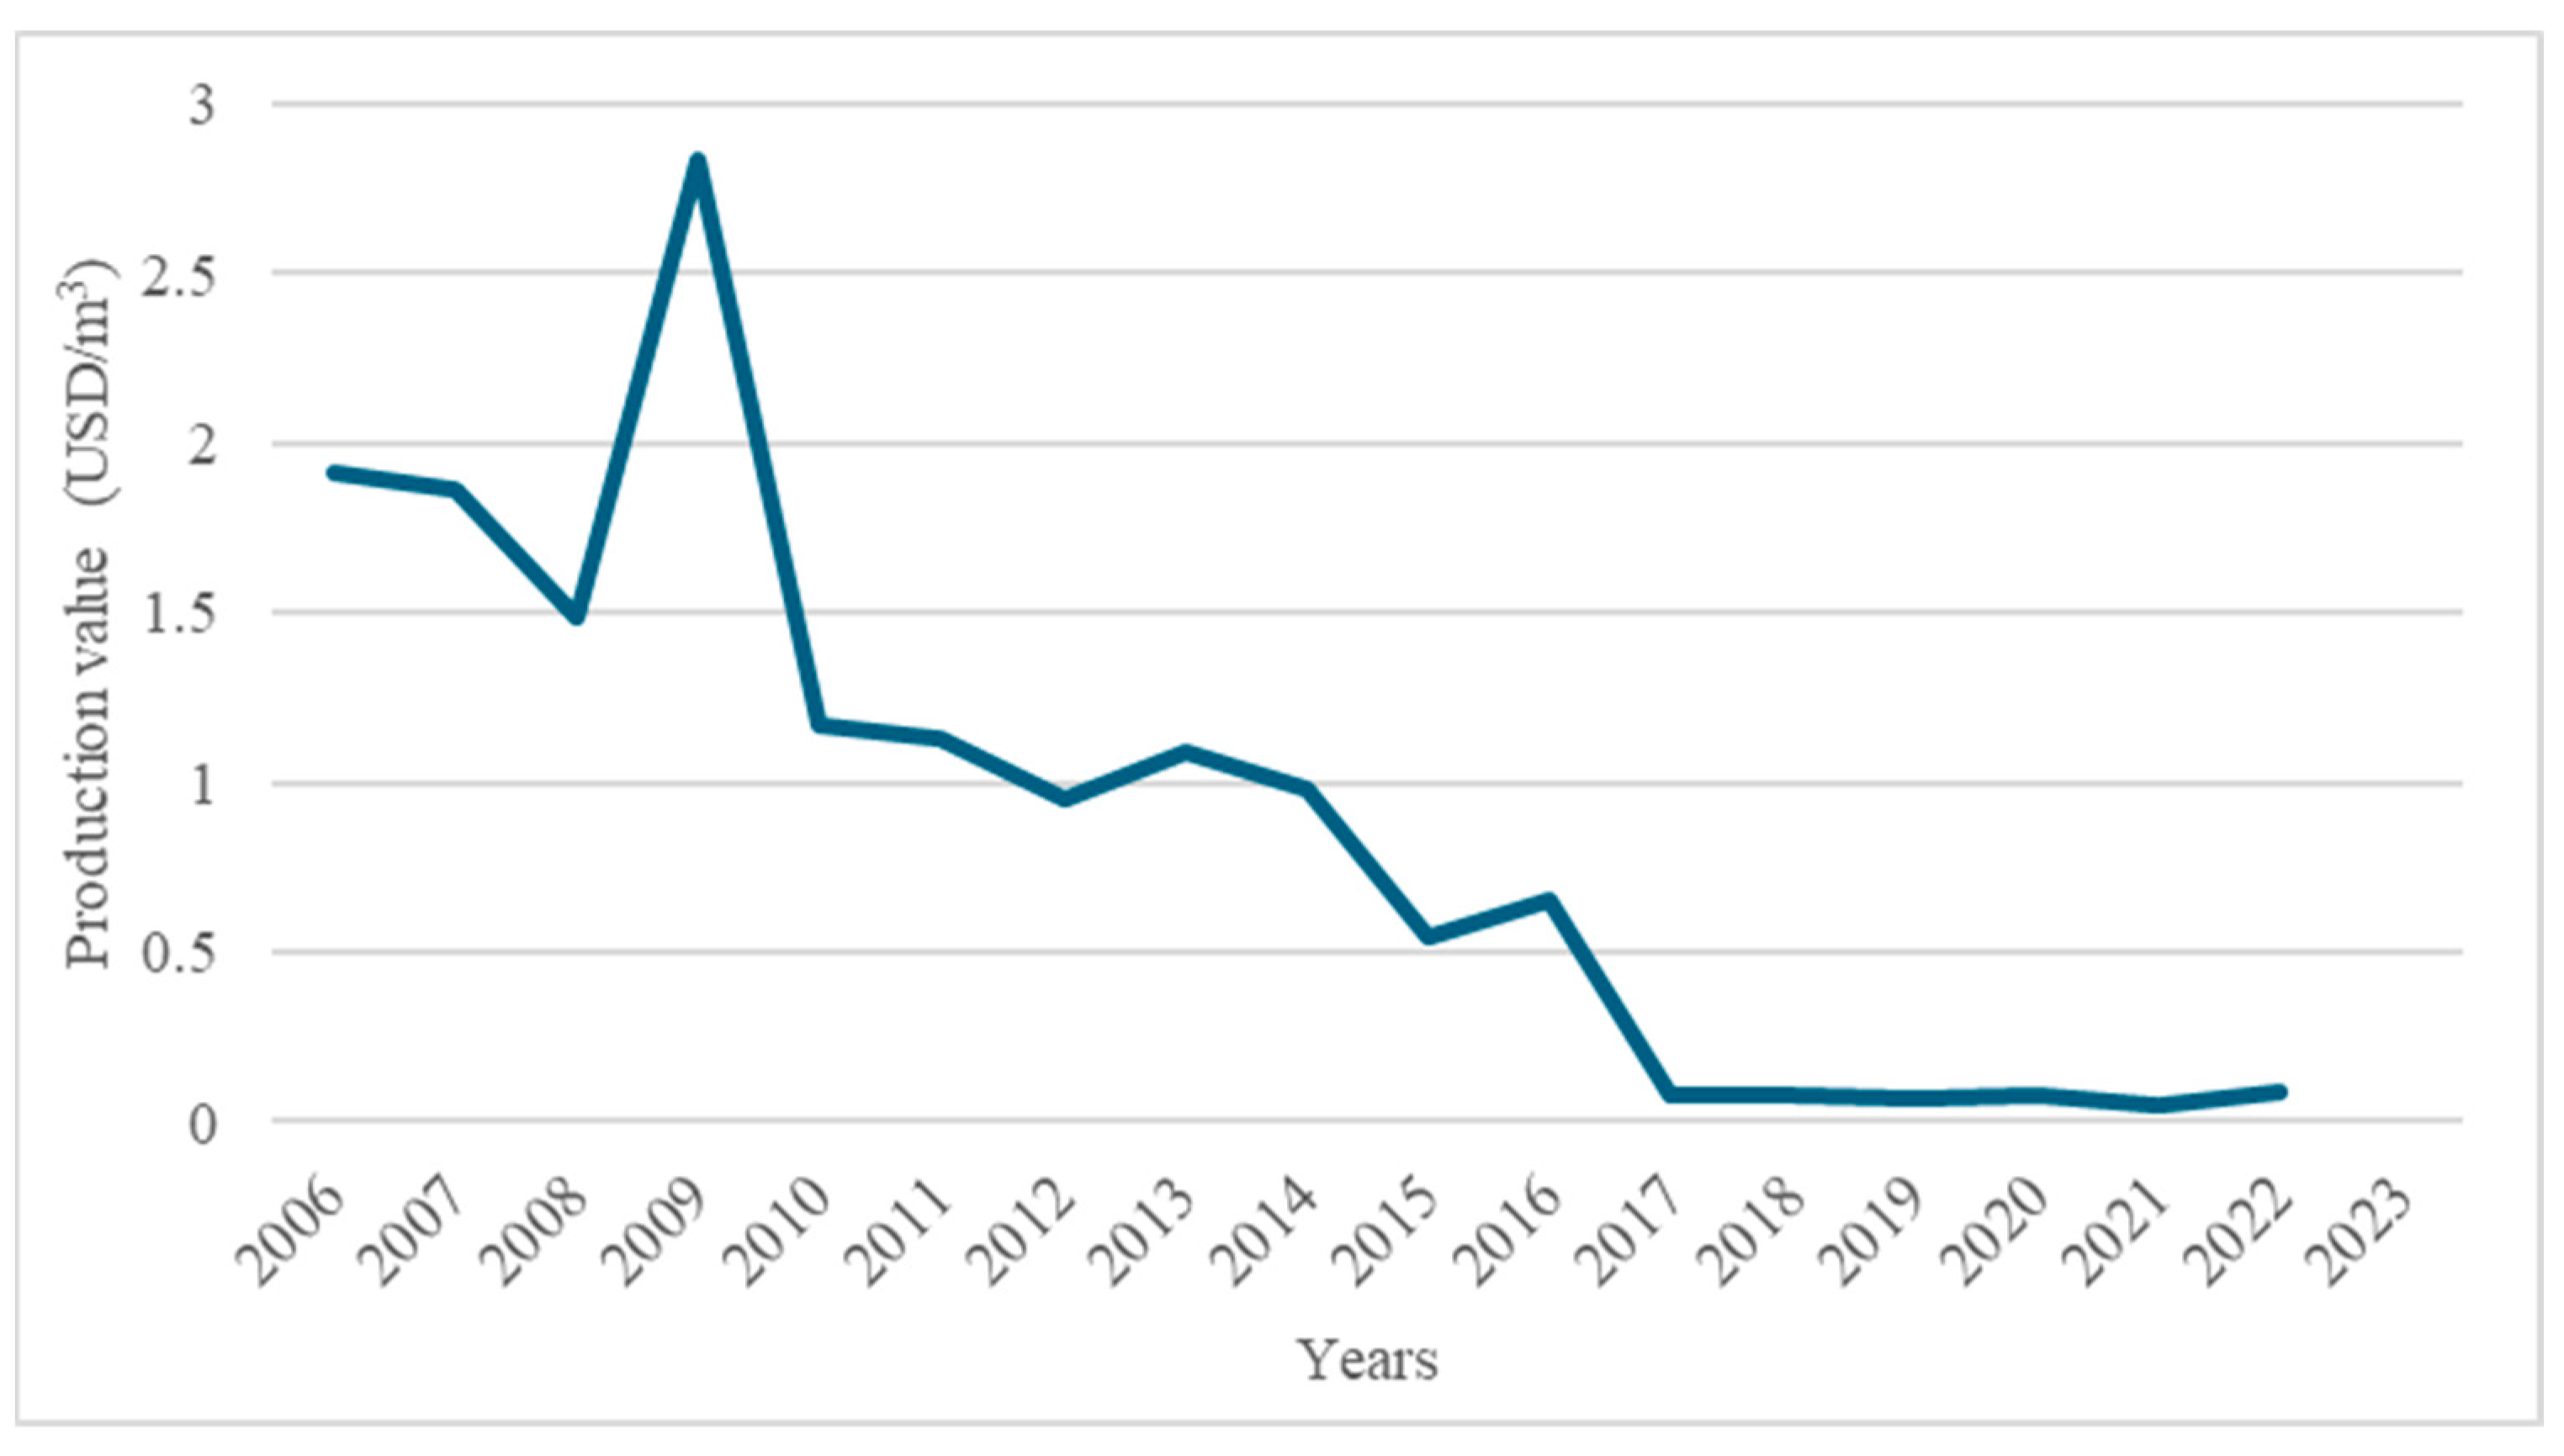
| Production per unit of irrigation water (WP) | USDm−3 | - |
| IR (%) | WIRR (m3 ha−1) | WISR (m3 ha−1) | RWS | WOM ($m−3) | WMOM ($m−3) | WP ($m−3) | |
|---|---|---|---|---|---|---|---|
| Max | 78.24 | 12,271.00 | 6010.52 | 2.14 | 0.05 | 0.26 | 2.83 |
| Min | 48.87 | 3196.76 | 1562.20 | 0.73 | 0.01 | 0.03 | 0.05 |
| Average | 69.02 | 8602.04 | 5004.24 | 1.33 | 0.02 | 0.08 | 0.89 |
| St. Dev. | 5.98 | 2376.40 | 943.34 | 0.41 | 0.01 | 0.05 | 0.81 |
| IR | WIRR | WISR | RWS | WOM | WOM | WP | |
|---|---|---|---|---|---|---|---|
| IR | 1 | 0.719 ** | 0.780 ** | 0.028 | −0.784 ** | −0.860 ** | −0.651 ** |
| WIRR | 1 | 0.637 ** | 0.208 | −0.848 ** | −0.710 ** | −0.552 * | |
| WISR | 1 | 0.484 * | −0.826 ** | −0.886 ** | −0.219 | ||
| RWS | 1 | −0.286 | −0.305 | 0.547 * | |||
| WOM | 1 | 0.861 ** | 0.436 | ||||
| WOM | 1 | 0.429 | |||||
| WP | 1 |
| Model | R | R Square | Adjusted R Square | Std. Error of the Estimate |
|---|---|---|---|---|
| 1 | 0.915 a | 0.837 | 0.740 | 1206.6058399 |
| ANOVA | ||||||
|---|---|---|---|---|---|---|
| Model a | Sum of Squares | df | Mean Square | F | Shallow | |
| 1 | Regression | 74,922,207.376 | 6 | 12,487,034.563 | 8577 | 0.002 b |
| Residual | 14,558,976.530 | 10 | 1,455,897.653 | |||
| Total | 89,481,183.906 | 16 | ||||
| Model | Unstandardized Coefficients | Standardized Coefficients | t | Shallow | ||
|---|---|---|---|---|---|---|
| B | Std. Error | Beta | ||||
| 1 | (Constant) | 6393.826 | 9907.313 | 0.645 | 0.533 | |
| IR | 60.732 | 137.155 | 0.158 | 0.443 | 0.667 | |
| WISR | −0.349 | 0.895 | −0.144 | −0.390 | 0.704 | |
| RWS | 2751.029 | 1307.161 | 0.495 | 2.105 | 0.062 | |
| WOM | −187,957.203 | 70,960.554 | −0.730 | −2.649 | 0.024 | |
| WOM | 15,298.723 | 17,290.844 | 0.323 | 0.885 | 0.397 | |
| WP | −1666.664 | 799.828 | −0.571 | −2.084 | 0.064 | |
| Model | R2 | p-Value |
|---|---|---|
| 0.84 | 0.02 |
Disclaimer/Publisher’s Note: The statements, opinions and data contained in all publications are solely those of the individual author(s) and contributor(s) and not of MDPI and/or the editor(s). MDPI and/or the editor(s) disclaim responsibility for any injury to people or property resulting from any ideas, methods, instructions or products referred to in the content. |
© 2025 by the author. Licensee MDPI, Basel, Switzerland. This article is an open access article distributed under the terms and conditions of the Creative Commons Attribution (CC BY) license (https://creativecommons.org/licenses/by/4.0/).
Share and Cite
Kirmikil, M. Irrigation Performance Evaluation for Sustainable Water Management: A Study of Karacabey Water Users Association, Türkiye (2006–2023). Sustainability 2025, 17, 4059. https://doi.org/10.3390/su17094059
Kirmikil M. Irrigation Performance Evaluation for Sustainable Water Management: A Study of Karacabey Water Users Association, Türkiye (2006–2023). Sustainability. 2025; 17(9):4059. https://doi.org/10.3390/su17094059
Chicago/Turabian StyleKirmikil, Müge. 2025. "Irrigation Performance Evaluation for Sustainable Water Management: A Study of Karacabey Water Users Association, Türkiye (2006–2023)" Sustainability 17, no. 9: 4059. https://doi.org/10.3390/su17094059
APA StyleKirmikil, M. (2025). Irrigation Performance Evaluation for Sustainable Water Management: A Study of Karacabey Water Users Association, Türkiye (2006–2023). Sustainability, 17(9), 4059. https://doi.org/10.3390/su17094059