Article

What Role Does “Great Heritage Site” Conservation Play in Shaping Sustainable Urban Intensity Patterns? An Empirical Study from Luoyang

by
Daxi Kang
1,
Jinlong Cheng
1,*,
Jie Yin
2 and
Huanhuan Li
1
1
School of Geography and Tourism, Luoyang Normal University, Luoyang 471000, China
2
College of Landscape Architecture, Nanjing Forestry University, Nanjing 210037, China
*
Author to whom correspondence should be addressed.
Sustainability 2025, 17(9), 3882; https://doi.org/10.3390/su17093882
Submission received: 15 January 2025 / Revised: 16 April 2025 / Accepted: 23 April 2025 / Published: 25 April 2025
(This article belongs to the Collection Sustainable Conservation of Urban and Cultural Heritage)

Abstract

:
Ancient capital cities generally boast long urban histories, with their ancient city sites overlapping significantly with modern urban areas, thereby subjecting urban development to the dual pressures of cultural heritage conservation and extreme land resource constraints. Taking the Great Heritage Site of the Sui and Tang dynasties within the ancient capital Luoyang as an example, this study adopts indicators of urban development intensity and utilizes spatial correlation analysis, kernel density analysis, and other methods to quantify the distribution characteristics of the urban plot development intensity. It identifies the factors influencing urban sustainable development and construction due to the conservation of the Great Heritage Site and proposes optimization strategies for urban construction regulation based on this analysis. The research findings indicate that the types and areas of urban planning and construction land within and outside the conservation area of the Great Heritage Site are similar, with no significant distinctions in the indicators or the spatial distribution of the plot ratio. The main factor affecting the intensity of urban development under the conservation of the Great Heritage Site is building height. Methods such as compensating, transferring, and rewarding the plot ratio and building height beyond the influence range of the Great Heritage Site conservation overflow effect can be employed to moderately enhance the development intensity and capacity control of urban areas, thus elevating urban development levels and providing guidance for sustainable urban growth under Great Heritage Site conservation.

1. Introduction

In the past two decades, the global urban population has increased from 1.5 billion to 3.6 billion, with 80% of global economic activity concentrated in urban development [1]. Urbanization and globalization are driving significant changes in the world as we know it [2]. The growth in urban populations and urban development activities continuously impacts urban culture and the urban environment [3,4,5]. Urban construction is a continuous historical process, resulting from the cumulative evolution of cities over continuous time and space [6,7]. In the ongoing process of urban sustainability construction, the conservation and development of heritage sites representing historical and cultural heritage in cities have become dual challenges for urban development and heritage conservation [8]. China, as an ancient civilization, has a long history of urban construction characterized by sedimentary and continuous development [9,10], especially in ancient capital cities, which have developed into comprehensive historical and cultural ancient cities with modern urban elements superimposed on ancient city ruins [11]. China’s system for conserving historical and cultural cities has been implemented for nearly 40 years, and the development planning of historical urban areas has always adhered to a conservation strategy prioritizing historical and cultural elements. However, in the context of new urbanization development in territorial spatial planning, the conservation and development of Great Heritage Sites, which integrate layered historical environments and current urban development conditions, have become key factors affecting urban construction intensity and important issues in territorial spatial planning management.
The concept of the Great Heritage Site, a unique cultural heritage concept in China, has emerged in recent years. Currently, there is no fully corresponding expression in relevant international charters and documents. The Great Heritage Site concept arises from the scale characteristics of Chinese cultural heritage and the actual situation of site conservation, specifically referring to cultural heritage sites with large spatial scales and prominent historical value. Great Heritage Sites refer to large-scale sites involving political, religious, military, technological, industrial, agricultural, architectural, transportation, and water conservancy aspects of China’s ancient historical development. These sites are characterized by their grand scale, significant value, and far-reaching influence. They include large settlements, city sites, palaces, tombs, and other sites, as well as site clusters and cultural landscapes. The Great Heritage Site of the Sui and Tang dynasties’ Luoyang City is a typical example of such sites [12]. As an important factor influencing urban construction and development within urban areas, the conservation of the Great Heritage Site in urban areas has increasingly become a contentious issue [13]. Research on the conservation of the Great Heritage Site in urban areas mainly focuses on the development and improvement of concepts for their utilization [14,15,16,17], the exploration of conservation and utilization models [18,19,20], and the display and dissemination of the cultural significance of these sites [21,22,23]. Currently, Chinese scholars are actively exploring effective pathways for the development of Great Heritage Site conservation within urban areas. They have preliminarily formulated a referable “Shaanxi model” based on a research and practice system encompassing the entire chain of “site value–protection planning–site display–improvement of livelihoods–regional development” [24], aiming to integrate Great Heritage Site conservation into urban development and construction planning. Research outcomes related to the utilization of Great Heritage Sites in China are abundant [14,15,16,17,18]. Development plans for Great Heritage Sites in urban areas are often based on archaeological and tourism research, exploring conservation, cultural dissemination, and the integration of culture and tourism. However, there is still insufficient research on effectively integrating Great Heritage Sites into unified territorial spatial planning layouts, urban functional zoning, and the detailed planning and construction of surrounding facilities for various functional purposes.
Great Heritage Sites, characterized by their large areas and numerous quantity, are bound to exert significant impacts on urban sustainable development and city construction due to the projects related to their conservation and cultural display [13]. Seeking solutions to the challenges of balancing the conservation of Great Heritage Sites and urban sustainable development has long been the focus of exploration for heritage conservation departments, urban construction departments, and the academic community [17,24,25]. Currently, the academic community is actively exploring symbiotic development approaches for the conservation of Great Heritage Sites and urban construction. The proposed approaches include the realization of multi-dimensional values in urban site conservation and utilization [26], the natural pathway of linking Great Heritage Site conservation with urban development [25], and coordinated strategies between Great Heritage Site conservation and urban planning [27]. However, these conceptual frameworks are still at the stage of idea transmission or conceptual exploration, without practical implementation plans. There is an urgent need for quantifiable indicators with strong operationality to accurately measure the impact of Great Heritage Site conservation on urban development. This will enable the implementation of coordinated symbiosis between Great Heritage Site conservation and urban development through practical indicator regulation.
The level of urban land development and its economic scale benefits are generally measured through the urban land development intensity [28,29,30]. Urban land development intensity is an important research focus in disciplines such as land management and urban planning. Depending on the purposes and requirements of human construction activities, the conceptual connotations of land development intensity have different descriptive angles, including the land resource development intensity, urban land development intensity, construction land development intensity, and urban development intensity. There are differences in the construction of indicators for land development intensity due to inconsistent connotations. For example, Ellis et al. [29] used population density and land use as parameters when mapping the global land use intensity. Erb et al. [31] constructed a conceptual framework for land use intensity based on the input intensity, output intensity, and ecosystem characteristics related to land production. Gong et al. [32] constructed an evaluation index system for urban land development intensity from four aspects: land use structure, land use efficiency, land investment, and land sustainability. There are also cases of using remote sensing data for land use intensity analyses [33,34]. There is no absolute unified standard for measuring urban land development intensity. Generally, the development and control of urban land are carried out by urban land management and planning departments. In the process of urban land development planning, the use of land is mainly determined from two dimensions: the nature of urban land use and the development intensity. Among them, the nature of use determines the purpose of the land, while the development intensity is controlled by indicators such as the height (number of floors), building density (coverage rate), and open space ratio of buildings on the land relative to the surrounding spatial environment [35]. The “Floor Area Ratio” (FAR) index has been widely accepted and used by most urban planning and management agencies worldwide for many years, and has become one of the core indicators for evaluating the rationality of urban land development and utilization [36,37].
China has a history of millions of years of human civilization, ten thousand years of cultural history, and five thousand years of continuous civilization. Great Heritage Sites are powerful evidence of these historical core cultural resources, among which a significant proportion are located within the built-up areas of modern towns and cities. In 2014, the State Council of China issued the “National New Urbanization Plan 2014–2020”, which put forward new requirements for the conservation and utilization of Great Heritage Sites in urban areas. The interconnection between the national historical context of urban areas and the future trajectory of cities has grown ever more intimate, with the preservation, presentation, and integrated utilization of historical heritage emerging as key components of the new urbanization progress. The spatial convergence of Great Heritage Sites with contemporary urban expanses, or their concentrated presence within modern metropolises, subjects cities to a dual predicament of conserving their cultural heritage and grappling with acute land resource tensions. On the other hand, due to the requirements of cultural heritage conservation, original residents within Great Heritage Site areas are severely constrained by economic development and lifestyle changes, deviating from the requirements of the “human urbanization” development concept of new urbanization [38]. Hence, to surmount the “isolation” of cultural heritage within urban confines, alleviate the living challenges of residents in Great Heritage Site areas, and actualize the construction of new sustainable urbanization within the national territorial framework, there is an urgent demand for scientific urban construction planning methods and quantifiable indicators of a reasonable urban development intensity to guide the conservation of urban Great Heritage Sites and the development of land space in a sustainable direction. Based on this, the objectives of this study are as follows: (1) to construct a dataset of construction land types in a Great Heritage Site area and quantify the urban development intensity within the Great Heritage Site’s range; (2) to identify the influencing factors of Great Heritage Site conservation on urban development construction and recognize the dominant indicators affecting the development intensity; (3) to propose optimized urban construction regulation strategies based on urban development intensity indicators, providing reference for the coordinated development of Great Heritage Site conservation and urban development construction in Chinese urban areas.

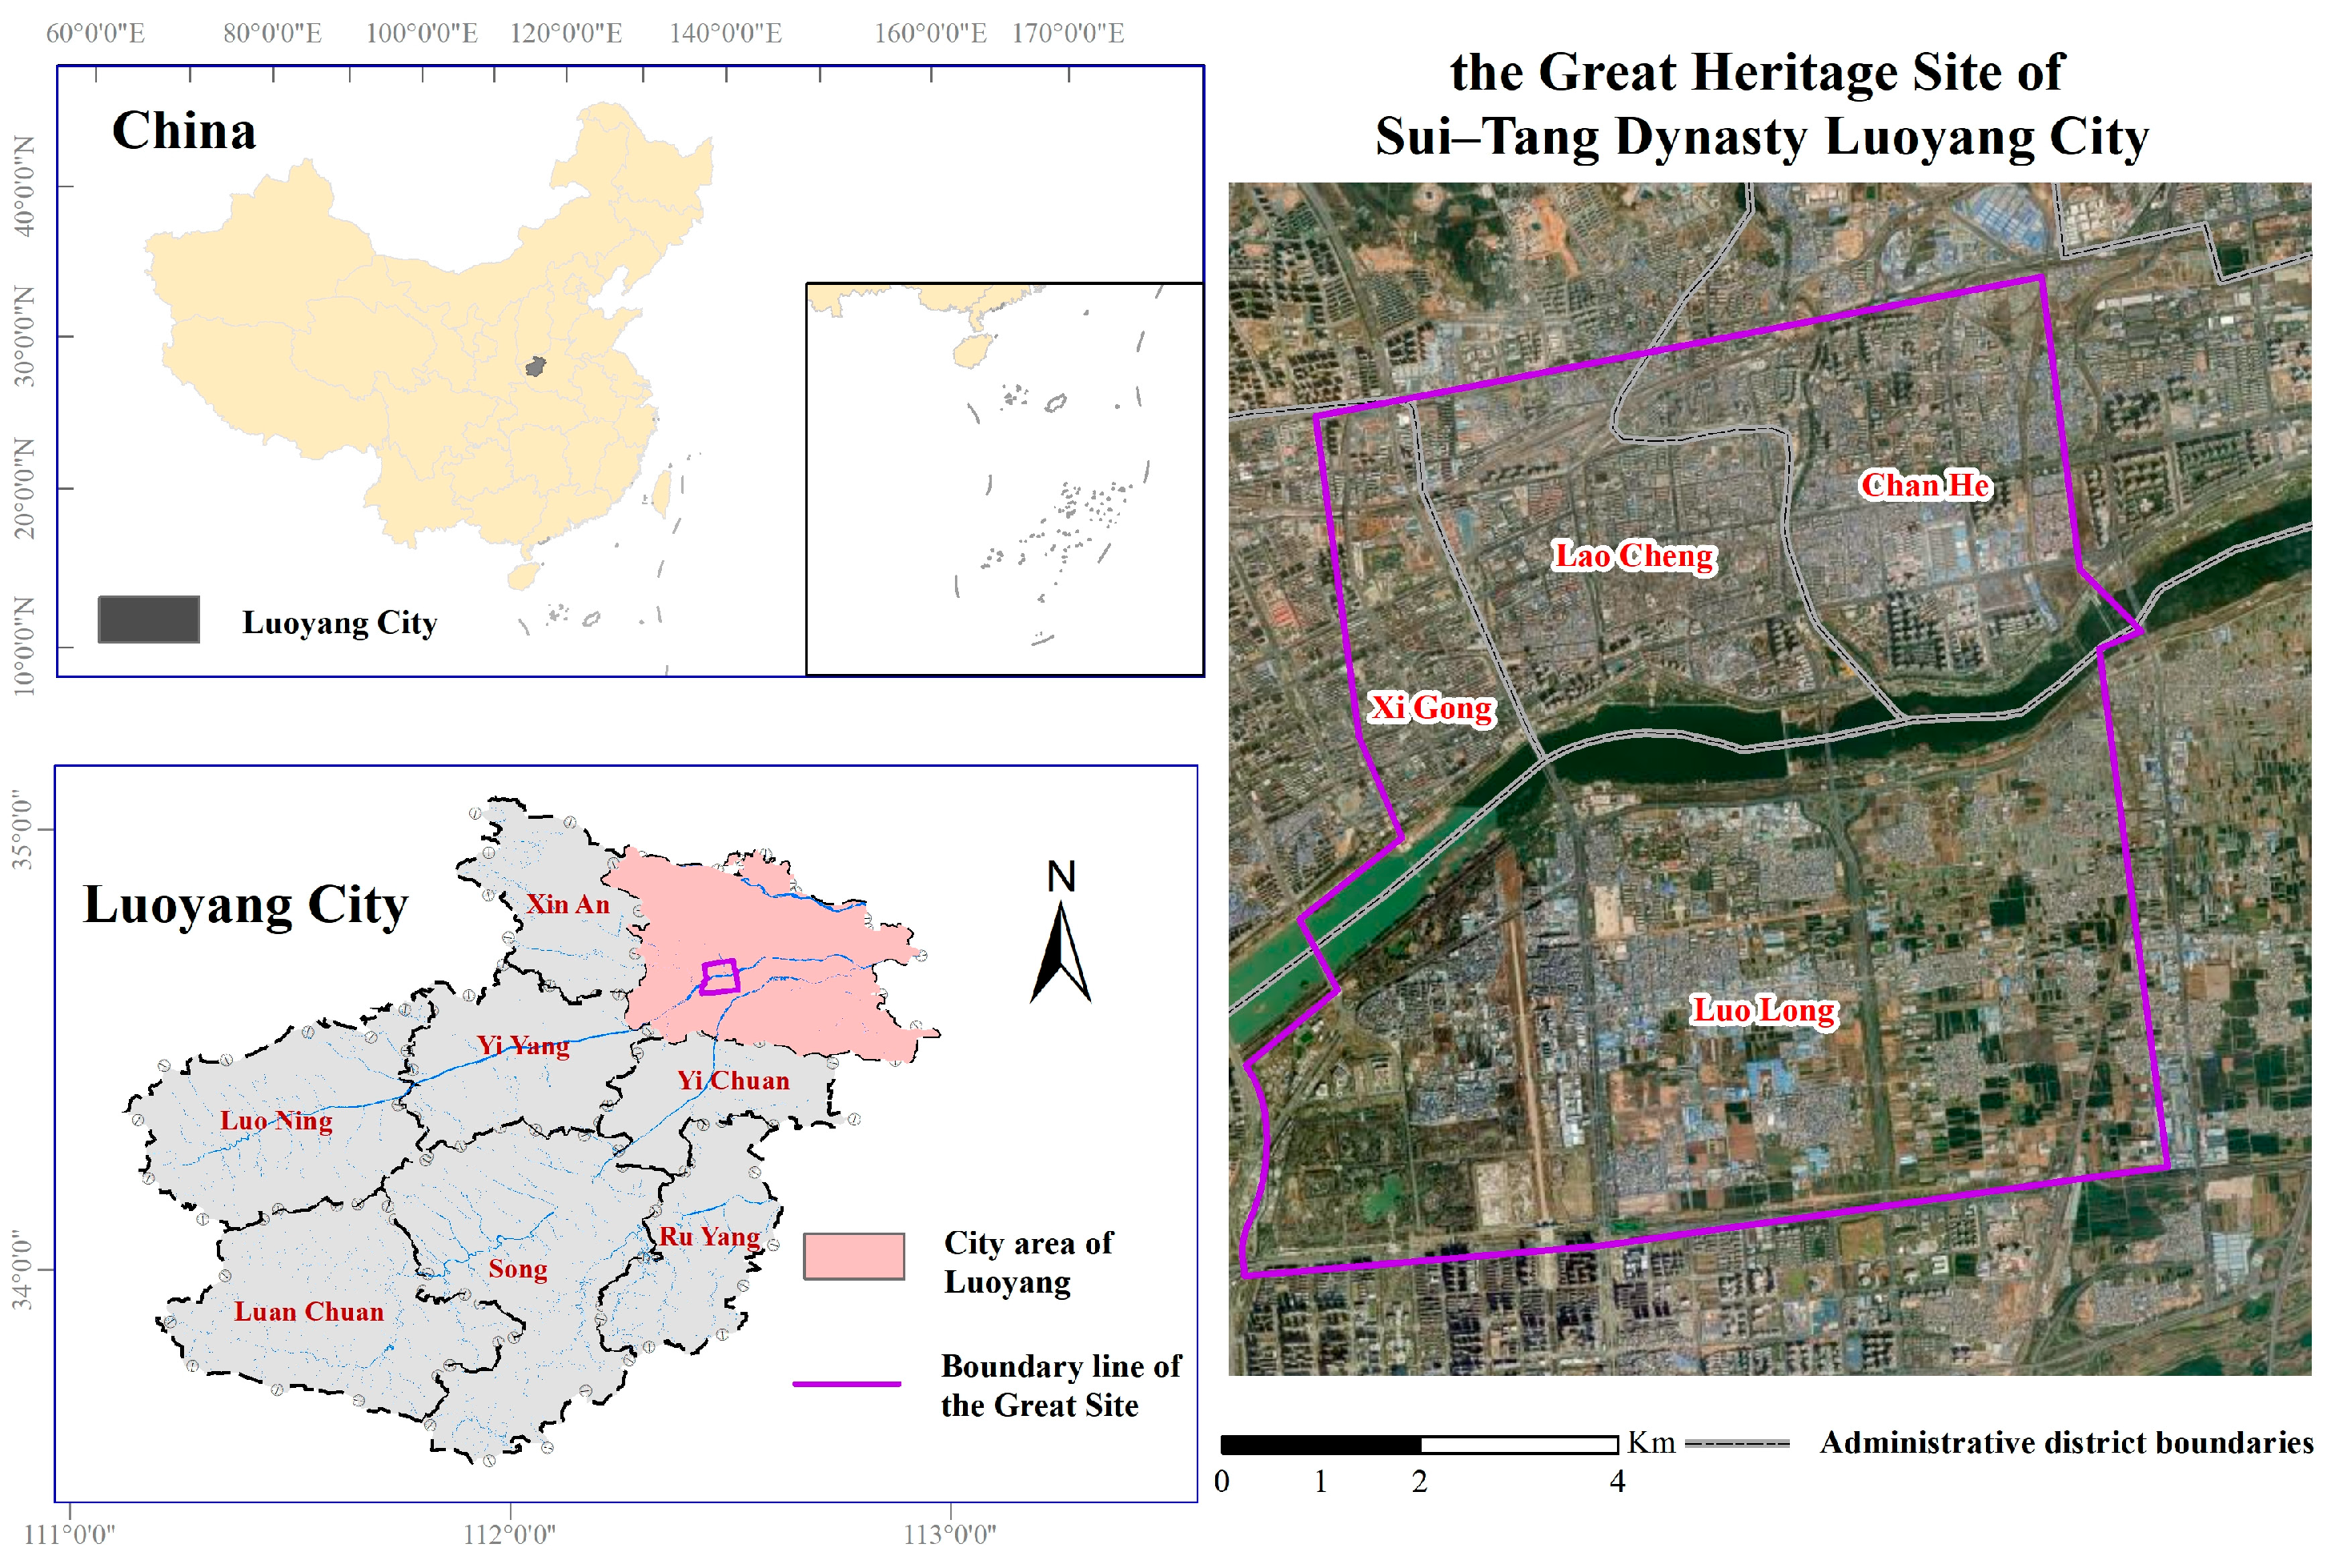
2. An Introduction of the Study Area

Luoyang City, located in Henan Province, China, is renowned as one of the country’s most famous ancient capitals. It possesses characteristics such as early establishment, multiple dynastic periods as the capital, and a long history of urban development. The Great Heritage Sites distributed throughout Luoyang City are aligned along the Luo River from west to east, forming seven large-scale sites. Among them, Sui–Tang Dynasty Luoyang City, established in 605 AD, served as the imperial capital during the Sui and Tang dynasties. It was the most prosperous international metropolis of its time, serving as a global political, economic, and cultural center and acting as the eastern starting point of the Silk Road and the central hub of the Sui–Tang Dynasty Grand Canal.
Since the initiation of systematic archaeological work in 1954, the Ministry of Culture of China and the Institute of Archaeology of the Chinese Academy of Social Sciences have conducted over 70 years of continuous exploration and excavation. This extensive research has defined the boundaries of the sites, the locations of city gates, and the layout of streets and neighborhoods, providing a scientific basis for their preservation and display. In 1988, the site was designated as a National Key Cultural Heritage Site, further underscoring its importance and the commitment to its protection. The present-day Sui–Tang Dynasty Luoyang City ruins cover an area of 47 square kilometers (Figure 1), consisting of the outer city, imperial city, palace city, as well as smaller cities, such as Dongcheng, Hanjia Cangcheng, Yuanbi Cheng, and Yao Yi Cheng. Sui–Tang Dynasty Luoyang City is situated within the administrative jurisdiction of Luoyang City, spanning four administrative districts and involving 50 subdistrict offices, with 265,000 people residing within the conservation area of the Great Heritage Site. The region is traversed by the Luo River from east to west, with a roughly equal area of construction and non-construction land within the region. Its current construction environment is complex, with noticeable disparities in development among different regions, leading to differences in urban spatial and functional conservation and development strategies.

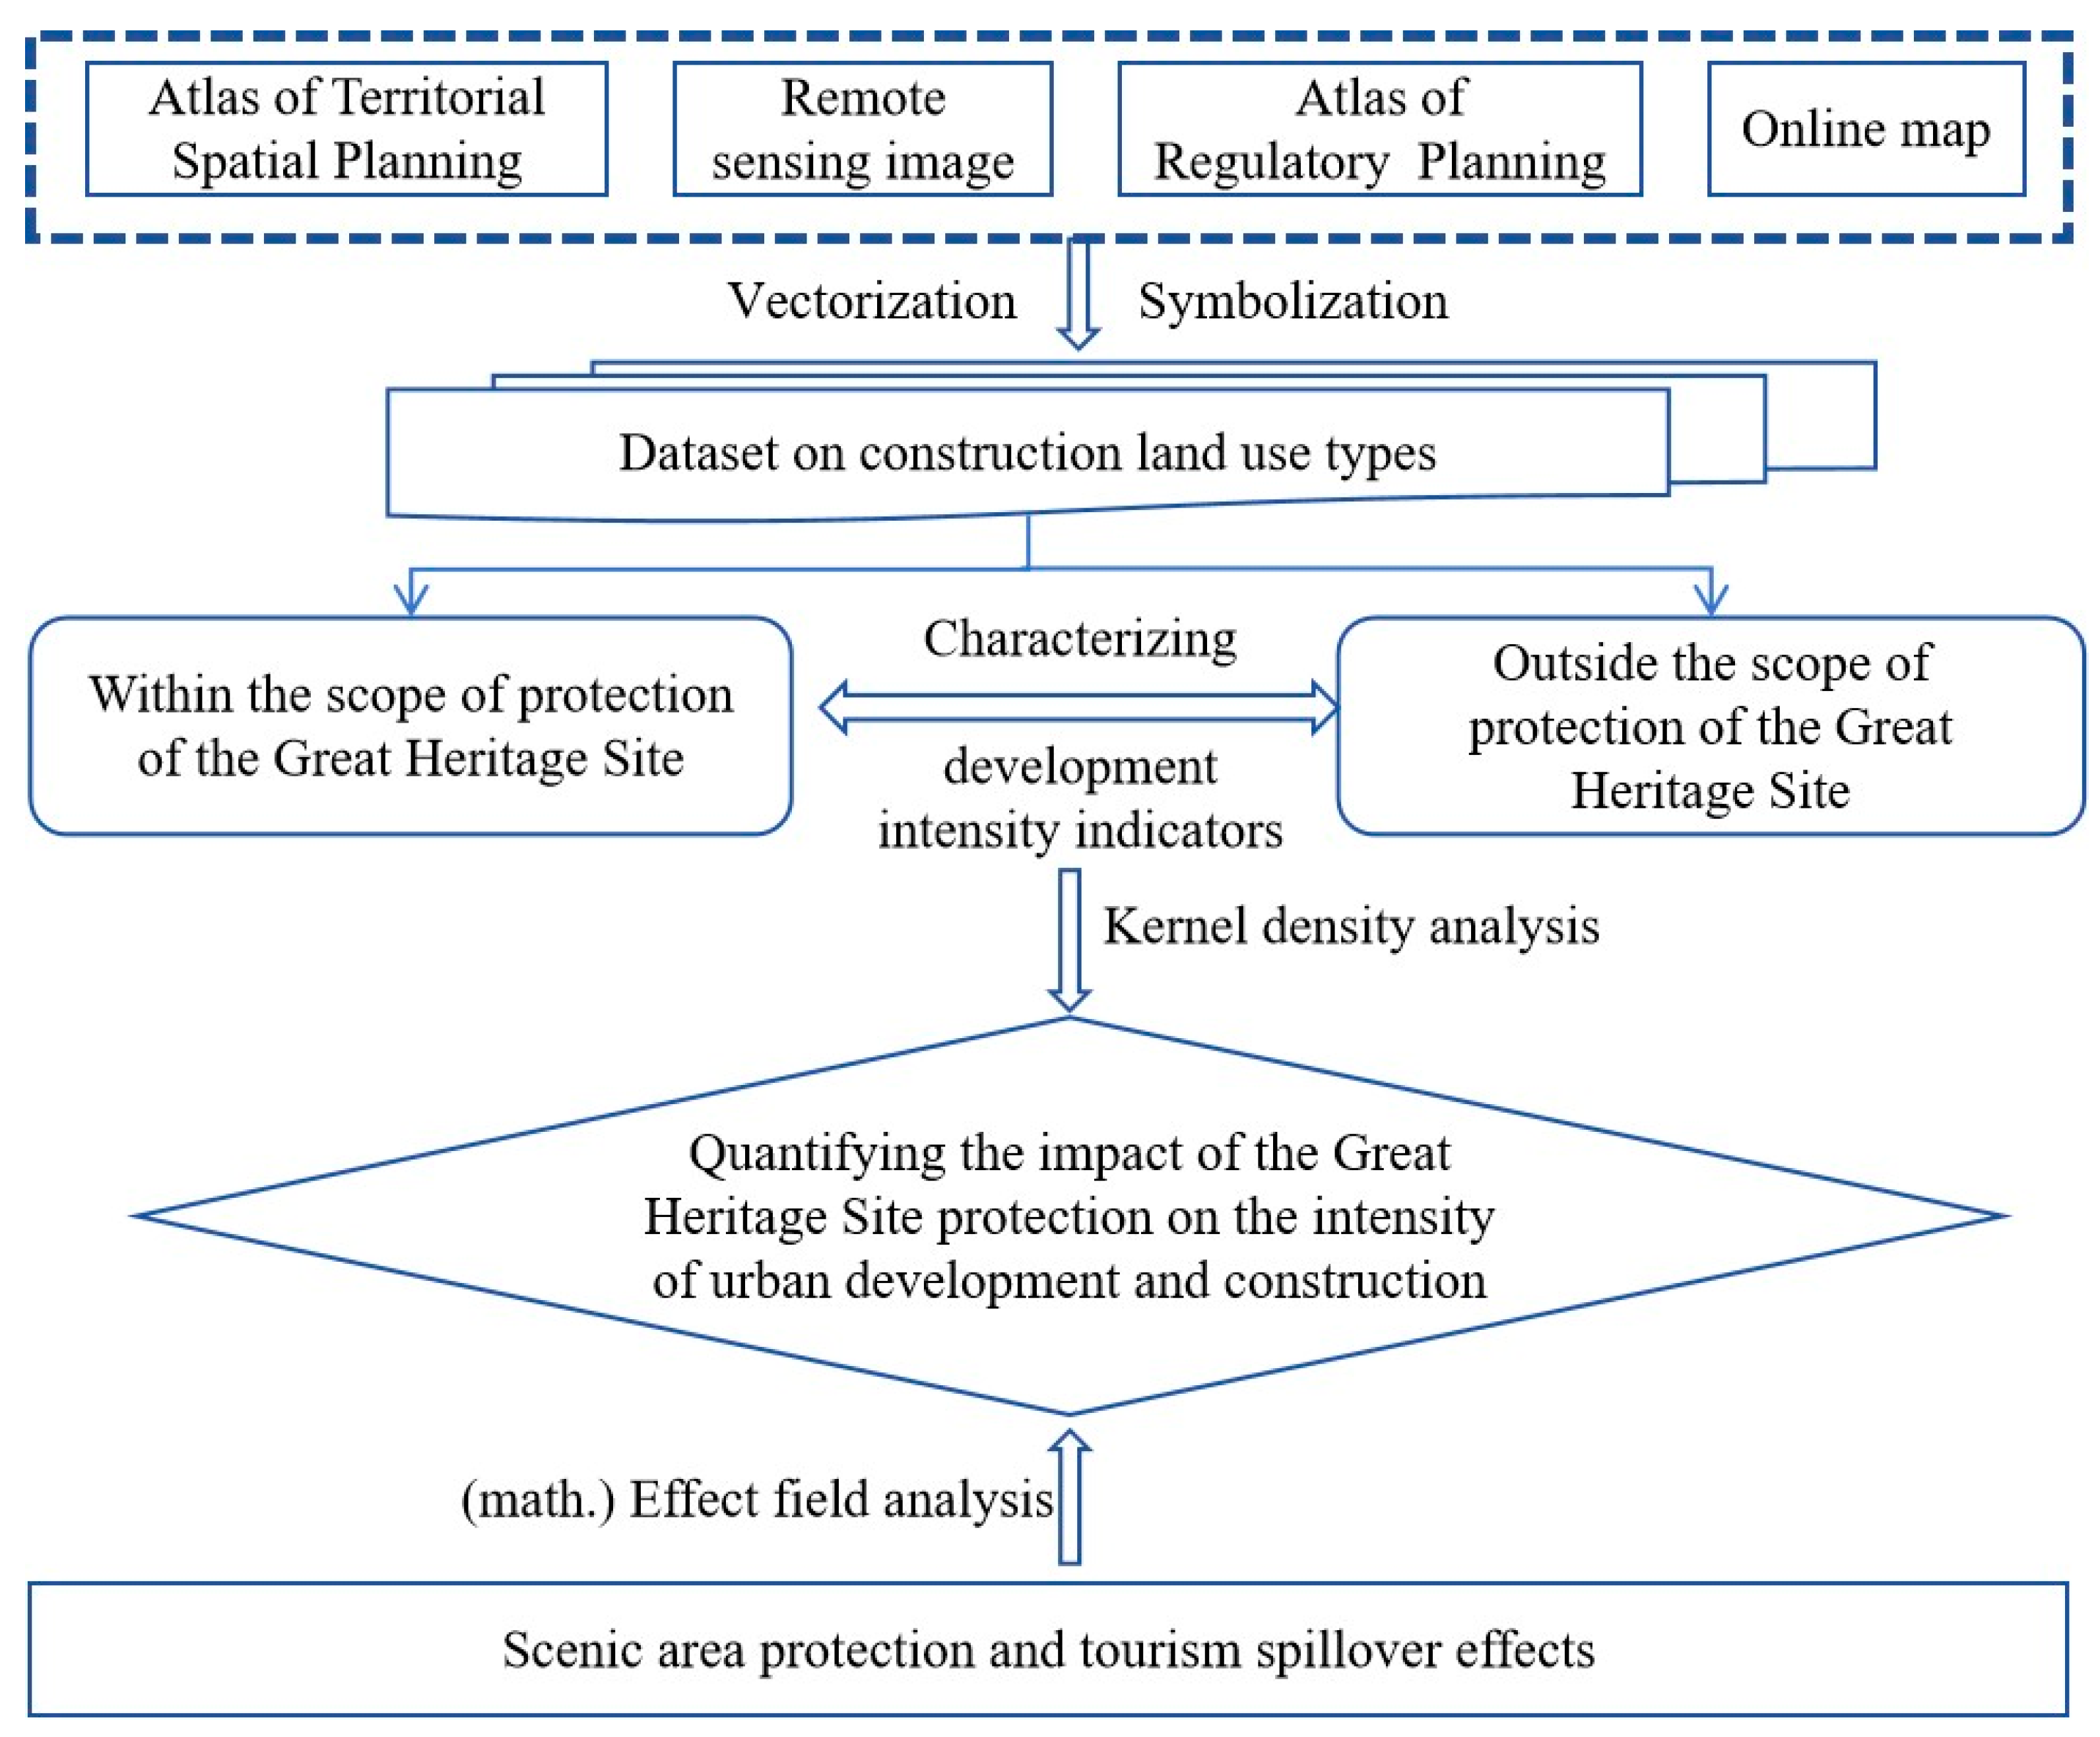
3. Data Sources and Research Methods

3.1. Data Sources

The data used in this study include the land use status map of Luoyang City, the detailed control planning maps of land parcels in various regions of Luoyang City, the administrative division map of Luoyang City, remote sensing images of Luoyang City, and relevant socio-economic data. The land use status map of Luoyang City within the urban area is sourced from the Natural Resources and Planning Bureau of Luoyang City and obtained through the Third National Land Survey, a significant national survey conducted in China. The detailed control planning maps of land parcels in various regions of Luoyang City are sourced from the Urban and Rural Planning Bureau of Luoyang City and are used by planning authorities to control the nature of construction land, usage intensity, and spatial environment according to the requirements of urban and town master plans. The administrative division map of Luoyang City is sourced from the Resource and Environment Science Data Center of the Chinese Academy of Sciences [39]. The remote sensing images of Luoyang City are obtained from the Geographic Spatial Data Cloud Platform [40], specifically high-resolution data products from the GF-2 PMS satellite with a resolution of sub-meter level, covering the central urban area of Luoyang City in 2021. The socio-economic data are sourced from the Luoyang Municipal People’s Government and the Luoyang Statistical Yearbook, among other documents.

3.2. Research Methods

The impact of Great Heritage Site preservation within urban areas on urban development and construction is manifested in the intensity of urban land development, as well as in aspects such as the compatibility of urban land types, constraints on architectural styles, and environmental aesthetics. Based on this, this study utilizes the land parcel properties delineated by the detailed control planning of various regions in Luoyang City and the construction development intensity indicators specified in the planning to vectorize the land within the conservation scope of the Sui–Tang Dynasty Luoyang City Great Heritage Site, determining the land attributes parcel by parcel, constructing a dataset of land use types within the heritage area, and visually expressing the indicators representing land development intensity to clarify the development intensity of construction land within the Great Heritage Site conservation scope. The construction planning of the urban development zone outside the Great Heritage Site conservation scope (the core development zone of Luolong District) was selected as a comparative group. Urban land patches were vectorized parcel by parcel, quantifying the urban land development intensity in different areas within and outside the Great Heritage Site conservation scope, to discern the impact of Great Heritage Site preservation on urban development intensity. Figure 2 depicts the methodological flow adopted in this study.

3.2.1. Development Intensity Index Representation

Development intensity refers to the proportion of total developed land area to the administrative area [28,41]. Meanwhile, the development intensity of construction land is a comprehensive measure of the breadth, depth, and frequency of the utilization of construction land [32,42]. In this study, the floor area ratio and building height were selected as indicators to measure the development intensity of urban construction land [43].
  • Floor Area Ratio (FAR)
According to the Chinese Urban Planning Basic Terminology Standards [44], building density reflects the size of the two-dimensional development scale or the intensity of land use; building height reflects the degree of the three-dimensional spatial development of land; and the floor area ratio is the ratio of the total floor area to the building land area. The total floor area is the sum of the floor area of all the floors in the building. Therefore, fundamentally, the floor area per unit of land is the core measure of the development intensity of a piece of land. If land resources are considered as a three-dimensional space, the building density and building height of a plot of land jointly determine the size of its floor area ratio, which can directly represent the intensity of land development. Hence, this paper selects the floor area ratio index to characterize the magnitude of urban development intensity within and outside the Great Heritage Site area. The calculation formula is as follows:
R = A T / A L
In the formula, R represents the plot ratio, AT denotes the total building area on a specific plot, and AL represents the area of that plot.
2.
Building height
To preserve the integrity and historical ambiance of a heritage site and prevent damage to the site, building heights are generally subject to specific regulations. However, due to variations in geographical location, historical and cultural significance, and development needs, there may be differences in building height restrictions across different areas. This study selected the building height indicator to assess the restrictions imposed by the conservation of the Sui–Tang Dynasty Luoyang City Great Heritage Site on the process of urban development and construction.

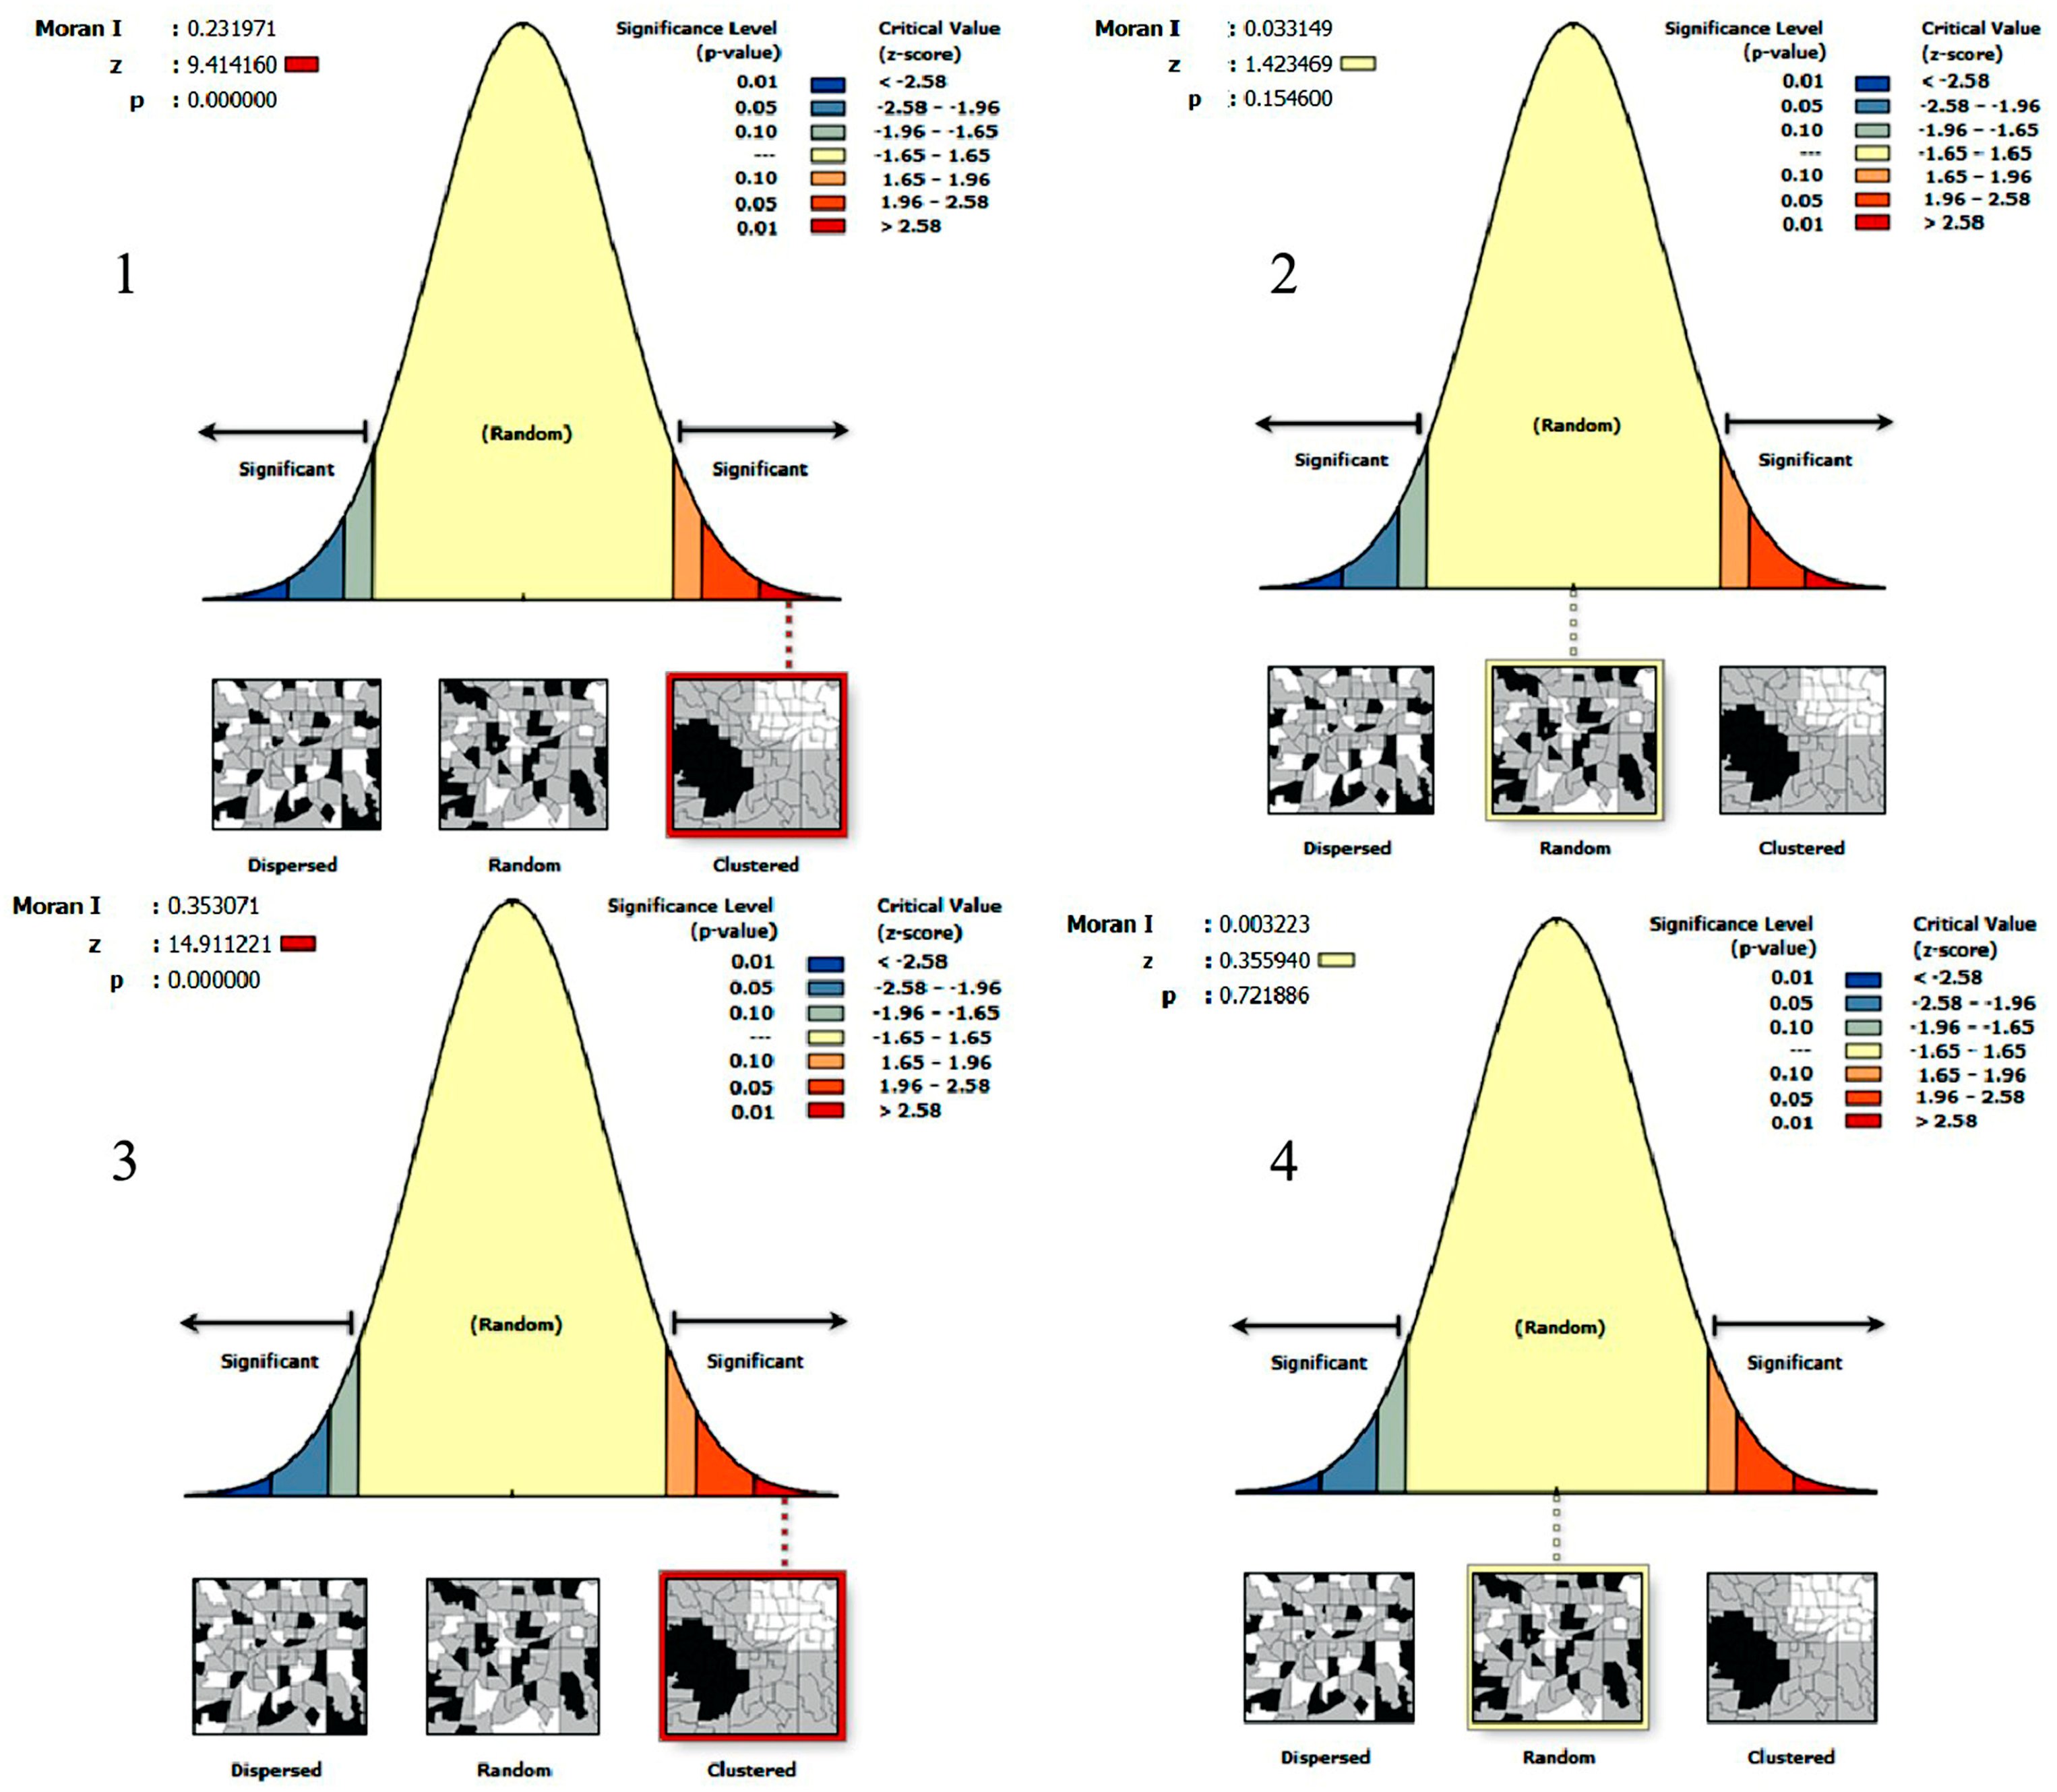
3.2.2. Spatial Correlation Analysis

A spatial correlation analysis of the distribution of development intensity indicators can help assess the rationality of urban planning and construction. In this study, a spatial autocorrelation analysis and a kernel density analysis were conducted to measure the spatial distribution of development intensity indicator values.
Spatial autocorrelation reflects the degree of correlation between a geographic phenomenon or the attribute value of a spatial unit and the same phenomenon or attribute value in neighboring spatial units [45,46]. It includes a global spatial autocorrelation analysis and a local spatial autocorrelation analysis [47]. The global spatial autocorrelation analysis describes the spatial characteristics of variable observations across the entire area and tests whether spatial phenomena exhibit clustering effects across the entire area [48]. In this study, Moran’s I index was used for the global spatial autocorrelation analysis, and its calculation formula is as follows:
I = n i = 1 n j = 1 n w i j z i z j ( i = 1 n j = 1 n w i j ) i = 1 n z i 2
In the formula, zi and zj represent the deviations of attributes of features i and j from their mean value (xi-), respectively, and wij is the spatial weight between feature i and feature j. n is the total number of all the features.
The Moran’s I index ranges from −1 to 1. At a significance level, when Moran’s I < 0, it indicates a spatial negative correlation, and the smaller the value, the greater the spatial difference. When Moran’s I > 0, it indicates a spatial positive correlation, and the larger the value, the more significant the spatial correlation. When Moran’s I = 0, spatial randomness is observed.

3.2.3. Kernel Density Analysis

A kernel density analysis was conducted to further examine the clustering distribution characteristics of the development intensity indicators. This method was utilized to compute the density of point features around each output raster cell. The fundamental principle entails that the density is highest at the location of the point, gradually decreasing with increasing distance and reaching zero at a distance equal to the search radius from the point. The density of each output raster cell is the sum of all the kernel surface values superimposed at the center of that raster cell. Through the kernel density analysis, continuous density surfaces could be generated from measured points, enabling the identification of concentrated point areas to determine the clustering status of the dataset [49]. The formula for the kernel density calculation is as follows:
f ( s ) = i = 1 n 1 h 2 k ( s c i h )
In the formula, f(s) represents the kernel density calculation function at spatial location s; h is the distance decay threshold; n is the number of feature points within a distance less than or equal to h from location s; and k denotes the spatial weighting function.

3.2.4. Viewshed Analysis

To quantify the impact of large-scale heritage site protection on urban visual landscapes, a GIS-based viewshed analysis was employed. Core heritage points or representative scenic areas were selected both within and outside the Great Heritage Site of Sui–Tang Dynasty Luoyang City. The visible areas under current building obstructions were calculated and compared with the theoretical viewshed without obstructions to determine the visual loss caused by high-rise buildings. This analysis revealed the influence of cultural heritage preservation on urban construction. The viewshed analysis was conducted using the digital elevation model (DEM) and building height data. The visibility between observation points and target points was determined pixel by pixel using line-of-sight equations (Equation (4)), generating a binary visibility raster (Equation (5)) [50]. Parameters such as observer height (hobserver) and target height (htarget) were used to simulate real-world visual obstruction effects. For an observation point, O(x0, y0, z0), and a target point, T(xt, yt, zt), the specific formulas are as follows:
z ( s ) = z 0 + ( z t z 0 d ) s
In this process, d = ( x t x o ) 2 + ( y t y o ) 2 represents the horizontal distance, and s [ 0 , d ] denotes the step along the line of sight. The elevation value of each grid point along the line of sight, zactual(s), is evaluated as follows:
If s [ 0 , d ] and zactual(s) ≤ z(s), the target point is considered visible. If there exists any s where zactual(s) > z(s), the target point is considered obstructed.
By traversing all the grid cells within the study area and applying the above visibility criteria to each, a binary visibility raster is generated:
V ( x , y ) = 1 , ( v i s i b l e ) 0 , ( i n v i s i b l e )

4. Results

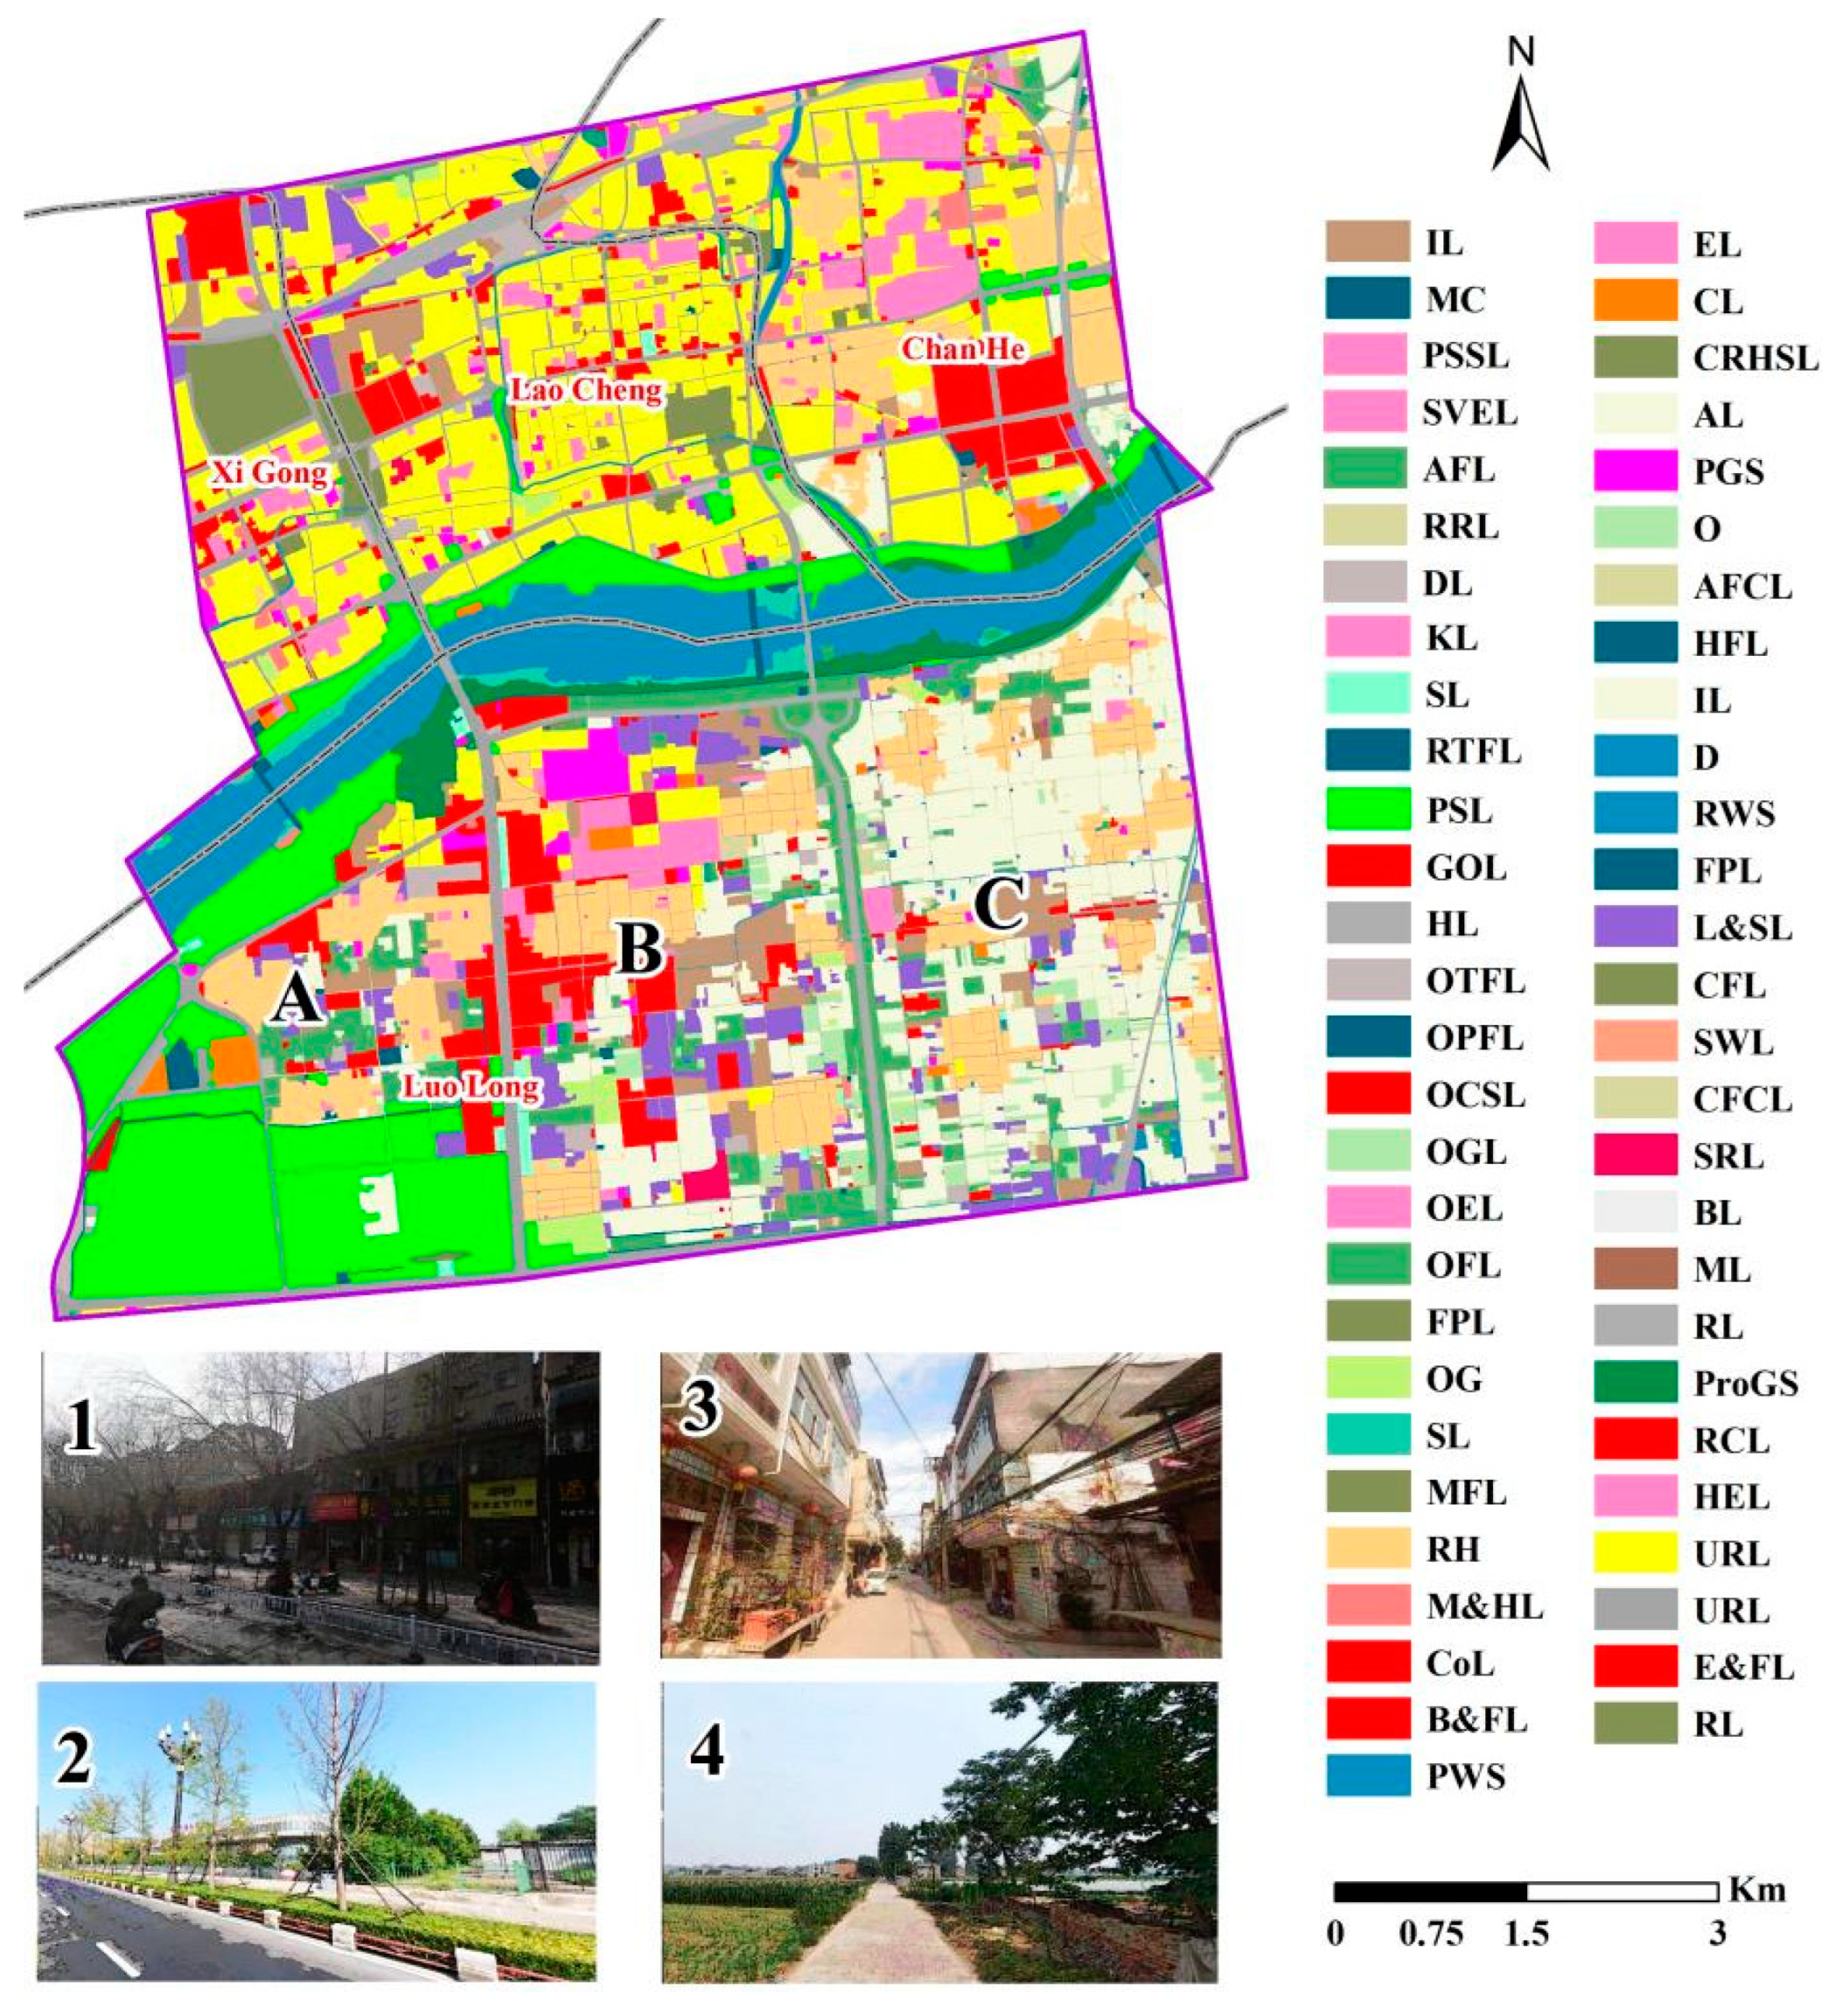
4.1. Land Use Types and Area Proportions for Planned Construction

Based on the current land use types within the scope of the Sui–Tang Dynasty Luoyang City Great Heritage Site, the entire site can be divided into four distinct parts (Figure 3). Among them, the area north of the Luo River represents a typical urban space, with urban construction land accounting for 86.65% of the total land in this area. The predominant land use types here are urban residential and urban road areas (constituting 55.34% of the total construction land), with a distribution of public management and public service land, as well as commercial service land.
The land use types in the area south of the Luo River show significant differences. Based on the proportions of different types of land use, it can be divided into three distinct regions (corresponding to areas A, B, and C in Figure 3). Area A is primarily ecological green space, such as protective green belts, park green spaces, garden areas, and forest land, accounting for 53.00% of the total land area in this region. Rural residential land and urban commercial land are distributed within this area. Area C represents a typical rural space, with land use types mainly consisting of arable land and rural residential land, accounting for 58.41% of the total land area in this region, with forest land and industrial land interspersed. Area B represents a state between the land use types of areas A and C, where urban construction space coexists with rural construction space.
Currently, within the scope of the Great Heritage Site of Sui–Tang Dynasty Luoyang City, the areas where detailed construction planning have been drawn up are mainly distributed in the urban space north of the Luo River, covering an area of 1829.55 hectares. A comparison between the land use types and their respective proportions determined by the controlling detailed plans and those of the Luolong District outside the Great Heritage Site area is presented in Table 1. It is found that there is no significant difference in the compatibility of urban construction land types between the area within the Great Heritage Site boundary and the Luolong District outside the Great Heritage Site boundary, and there is also no significant difference in the proportions of various land use types.

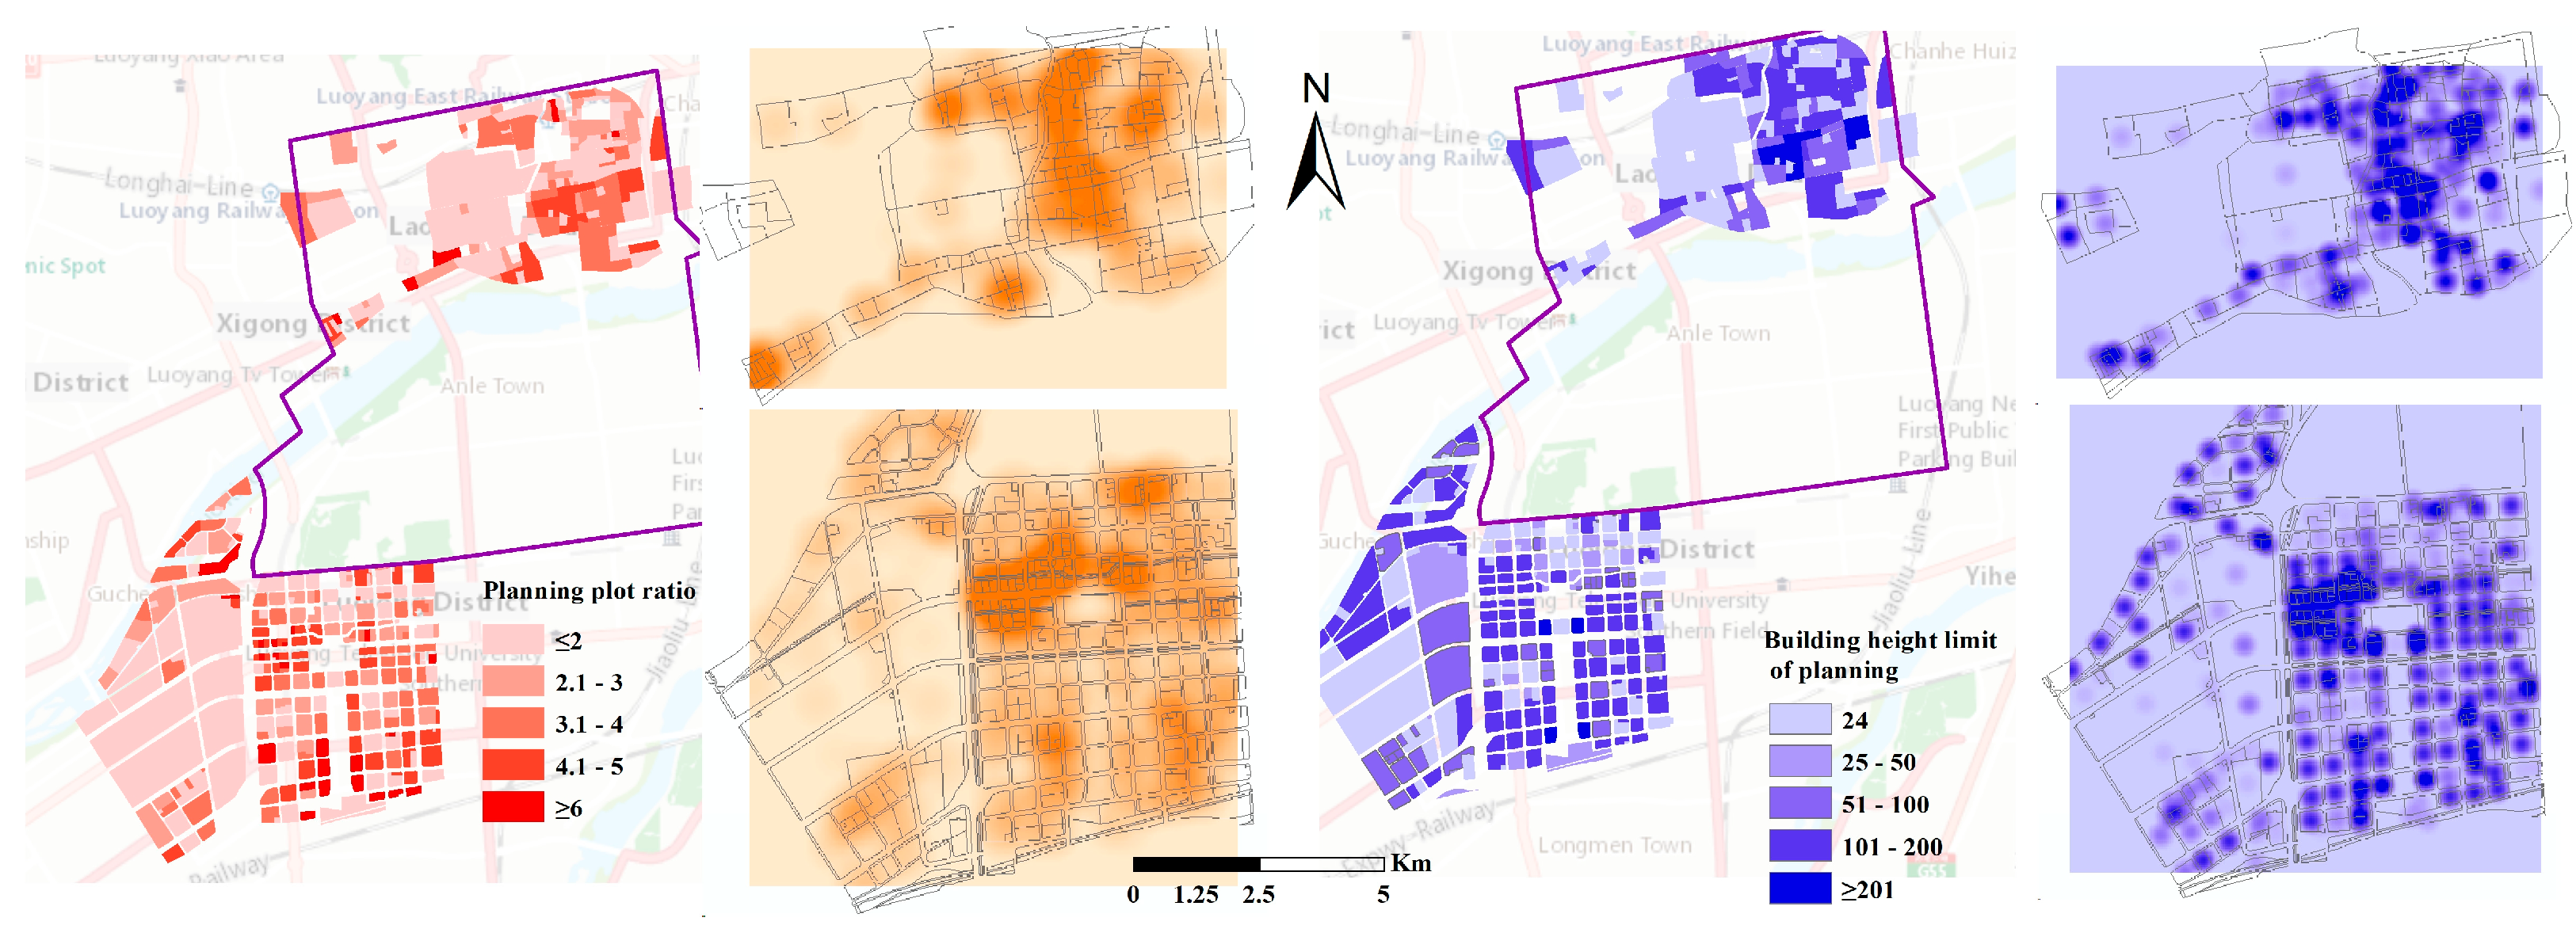
4.2. Characterization of Planned Construction Development Intensity Indicators

The planned construction development intensity indicators, including the floor area ratio (FAR) and building height, are classified into five levels both within and outside the Great Heritage Site area (Table 2). Within the Great Heritage Site area, the FAR ranges from 0.3 to 7.4. An FAR of less than two characterizes 43.92% of the whole area, representing the highest proportion among the five levels. Moreover, over half of the total area (55%) is covered by plots with planned FAR values of below three, whereas the proportion of plots with FAR values exceeding six is the lowest, accounting for only 4.89% of the total area. In comparison, within the reference area of Luolong District, the planned FAR ranges from one to six. Similarly, the proportion of plots with planned FAR values of below two is the highest among the five levels, covering 58.65% of the total area. Additionally, over half of the area (58.65%) is covered by plots with FAR values of below three, while the proportion of plots with an FAR exceeding six is the lowest, at 4.36%. Based solely on the planned FAR values, there is no substantial difference in the construction development intensity between the Great Heritage Site area and areas outside the site.
In terms of building height (Table 2), the proportion of land parcels with heights of below 24 m is the largest among the five levels within the Great Heritage Site area, reaching 42.69%. In contrast, within the planned area of Luolong District, the proportion of land parcels with planned building heights in the range of 101–200 m is the largest (33.55%). The maximum planned building height within the Great Heritage Site area is 140 m, while in the comparison area of Luolong District, the maximum planned building height exceeds 300 m. From the perspective of building height indicators, there is a substantial difference between the planned building heights within the Great Heritage Site area and those outside the site, with noticeable height restrictions imposed within the Great Heritage Site area.

4.3. The Spatial Distribution of Planned Development Intensity

The Moran’s index values for both the planned FAR and building height within and outside the Great Heritage Site area are greater than zero (Figure 4), indicating a spatial positive correlation of the FAR and building height within the planned area. However, the Moran’s index values for the FAR (IFAR = 0.033) and building height (Ibuilding height = 0.003) within the Great Heritage Site area are lower than those of the reference group in Luolong District (IFAR = 0.232, Ibuilding height = 0.353), suggesting a less pronounced spatial correlation in the distribution of the urban development planning FAR and building height within the Great Heritage Site area.
Based on the results of the spatial correlation analysis, in the reference group of Luolong District, the p-value of the spatial correlation analysis for plot ratio is much less than 0.01, with a z-score of 9.414. Similarly, for the analysis of the spatial correlation of building height, the p-value is also much less than 0.01, with a z-score of 14.911. This indicates a significant spatial clustering feature in the urban spatial planning of the plot ratio and building height in Luolong District. However, within the scope of the Great Heritage Site area, both the p-values for the plot ratio and building height in the spatial correlation analysis are greater than 0.1, and the z-scores fall within the range of a random spatial distribution. This suggests that there is no significant spatial clustering feature in the urban spatial planning of the plot ratio and building height within the Great Heritage Site area, and the distribution of indicator values is relatively random.
Visual representations of the planned plot ratio and building height are depicted, further elucidating the spatial distribution and clustering characteristics of the development intensity within and outside the Great Heritage Site area through the kernel density analysis (Figure 5). Within the Great Heritage Site area, the kernel density values of the planned plot ratio exhibit pronounced nucleation characteristics, whereas the kernel density values of building height do not show distinct nucleation features, which differs from the results of the spatial correlation analysis. Among the areas with high kernel density values for the plot ratio, one is densely populated with land parcels and exhibits a high density of plot ratio values. Upon comparison with numerical values, this area represents a dense area with an average plot ratio of 2–3, rather than being high due to high kernel density values of land parcels. Another area with high kernel density values is an outlier with a plot ratio of 7.4, located in the northern part of the Great Heritage Site area in the Xinghelan Bay community of the Chanhe District. In the Luolong District reference group, there are clustering areas with high values of the planned plot ratio and building height, consistent with the results of the spatial correlation analysis. The high-value concentration areas for both indicators are consistent, distributed in the area north of KaiYuan Avenue, south of Gu Cheng Road, east of Wang Cheng Avenue, and west of Long Men Avenue.

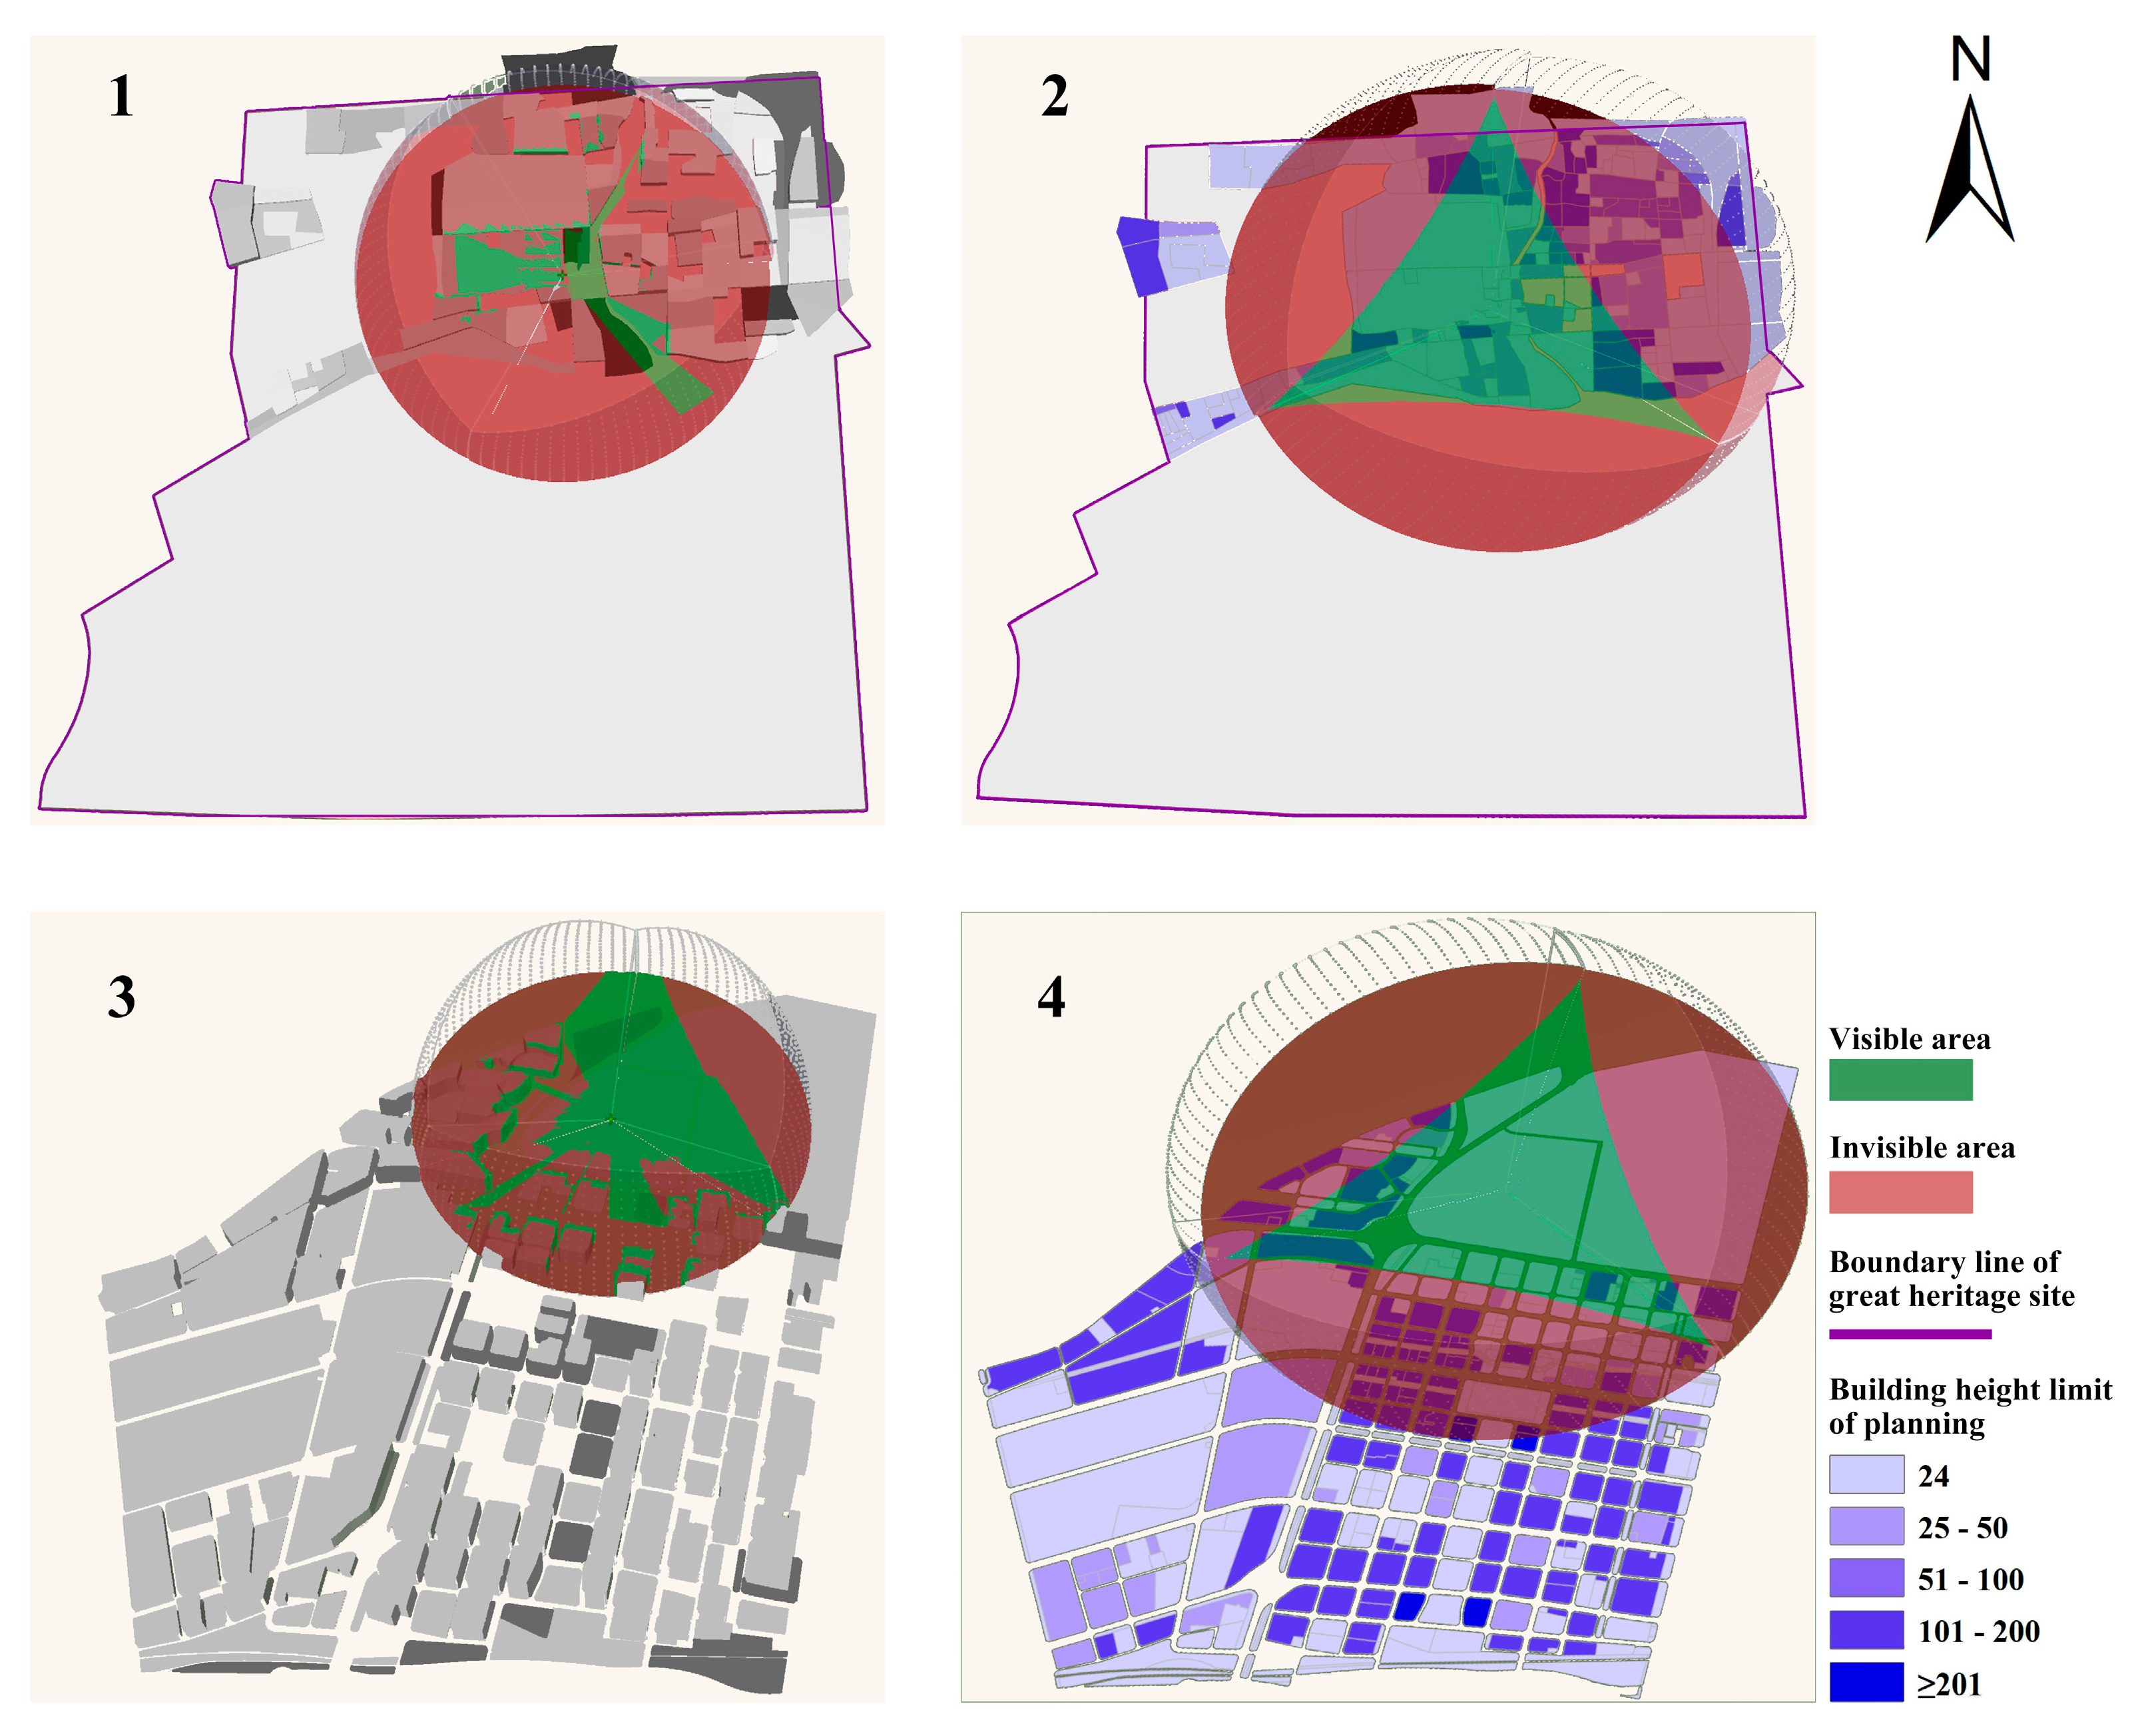
4.4. Viewshed Loss in Heritage Protection Planning

The viewshed analysis results indicate that the visible areas of core heritage sites and core scenic areas both within and outside the Great Heritage Site of Sui–Tang Dynasty Luoyang City have experienced viewshed loss due to building obstructions. Within the heritage site, the representative site of Luoyi Ancient City has suffered a viewshed loss of over 50% (Figure 6). Outside the heritage site, the representative scenic area of Luolong District (the Sui–Tang Dynasty site’s Botanical Garden) has experienced a viewshed loss of 34%. Further analysis and calculations of other sites or scenic areas have yielded similar results.

5. Discussion

5.1. Linking the Conservation of the Great Heritage Site with the Intensity of Urban Development

Great Heritage Sites located within urban construction areas impose impacts on urban land development intensity due to the necessity of their conservation efforts. Comparative studies on the urban land development intensity both within and outside the Great Heritage Site of Sui–Tang Dynasty Luoyang City have revealed that the primary reason for the impact of heritage site protection on urban development intensity is the restriction on building height.
Building height restrictions contribute to the loss of intensity to urban construction. In the detailed planning texts of urban area land plots, the content related to the conservation of the Great Heritage Site is mainly reflected through restrictions on building height. For example, in the detailed planning text of the conservation area adjacent to the outer wall of Sui–Tang Dynasty Luoyang City, it states that “Buildings adjacent to the conservation range on both sides of the outer wall of Sui–Tang Luoyang City should not be too high, and the height of buildings to the south and north can gradually increase”. This refers to the conservation range of the outer city wall of the Great Heritage Site. There are also requirements for protective planning and construction in areas within the Great Heritage Site range where point or area relics exist. For instance, “Areas with a height of 7 m are mainly concentrated in the Jin Yuan Ancient City. In such areas, construction must strictly control height, focus on low-rise buildings, and maintain the original characteristic style”. Additionally, “Do not construct or conduct minimal low-rise and low-density construction in the sightline corridor, mainly controlling building height, facade, and roof forms”. Excessively tall or modern buildings may visually impact cultural relics and monuments, compromising the authenticity of historical buildings and the integrity of historical and cultural landscapes. Therefore, in the process of urban construction, restrictions on building height around cultural relics and monuments are necessary to ensure that new buildings do not obscure, block, or alter the appearance of cultural relics and monuments. This helps to preserve the integrity of cultural relics and monuments and maintain the continuity of the historical environment.
Building height restrictions also reflect the protection of cultural heritage visual integrity in urban construction. The viewshed analysis in this study showed that building height restrictions within the Great Heritage Site of Sui–Tang Dynasty Luoyang City significantly reduce visual loss rates. This conservation strategy preserves the historical landscape continuity of the site, thereby enhancing visitors’ positive tourism experiences, indirectly driving regional economic development. This also demonstrates the economic transformation effect of “cultural capital” under low-intensity development models [51,52,53]. This “protection-benefit” synergy aligns with international heritage city experiences, such as Rome’s historical center, where building height restrictions preserve the Colosseum’s visual corridor, making it a global model for cultural heritage tourism. The Luoyang case shows that the visual integrity of cultural heritage is not only a conservation goal but also a core competitive advantage for sustainable urban development.

5.2. Cultural Heritage Tourism Overload Risks and Impacts on Urban Construction

As a cultural tourism resource, the Great Heritage Site of Sui–Tang Dynasty Luoyang City, with its unique historical, artistic, and aesthetic values, has secured a significant position in the tourism market. Accurately assessing the tourist capacity of the heritage area and determining the minimum social and environmental impacts caused by tourists are vital for addressing the challenge of balancing heritage conservation with urban development. According to the “2023 Luoyang Cultural Tourism Development Report” issued by the Luoyang Municipal Bureau of Culture and Tourism, the heritage area of the Great Heritage Site of Sui–Tang Dynasty Luoyang City received four million visitors in 2023, with a tourist density of 8.5 people per hectare. This exceeds the comfort standard recommended by the International Council on Monuments and Sites (ICOMOS) for heritage sites of five people per hectare. Despite the absence of real-time capacity monitoring, these data indicate a significant risk of tourism overload in the Great Heritage Site of Sui–Tang Dynasty Luoyang City. Unlike the Colosseum in Rome, which limits visitor numbers to below 80% of its maximum capacity through time-slot reservations, no systematic visitor flow regulation mechanism has been established for the Great Heritage Site of Sui–Tang Dynasty Luoyang City. This management gap could lead to the overuse of cultural heritage and exacerbate environmental degradation.
The “Regulations on the Protection of the Heritage Area of the Great Heritage Site of Sui and Tang Dynasty Luoyang City” mandates strict control over commercial activities within the heritage area. In contrast, the “Luoyang Tourism Development Plan for the 14th Five-Year Plan Period” proposes receiving three million inbound tourists by the end of the plan period. This contradiction between heritage protection and tourism development is likely to cause an imbalance between conservation and exploitation, worsening socio-environmental issues such as waste disposal and traffic congestion. Currently, roads and transportation land account for 23.35% of the Great Heritage Site of Sui–Tang Dynasty Luoyang City. These primarily serve daily residential commuting rather than large-scale tourist flows, leading to a 30–40% surge in traffic congestion indices during holidays. Restrictions on road expansion due to heritage protection policies make it difficult to relieve pressure through additional transportation land, necessitating reliance on external area diversion, though no internal–external linkage mechanism has been established. Additionally, public service land in the heritage area accounts for only 9.45%, with few and unevenly distributed tourist facilities, such as restrooms and visitor centers. During peak tourist days with over 50,000 visitors, restroom waiting times can exceed 20 min, causing strong visitor dissatisfaction. Female restrooms, in particular, face frequent complaints about long queues during peak periods, while residents experience the dual pressures of space and cost due to tourists’ use of daily public utilities and infrastructure. These issues urgently need to be addressed in the development of urban construction and sustainable management strategies.

5.3. Comparison with Other Studies

The dialectical relationship between the conservation of historical sites and urban development has been extensively studied [54,55,56]. However, the concept of the “Great Heritage Site”, being a unique historical site specific to China, has few international research cases for reference. Among the limited studies available, Lv [57] defined the outward radiation effect of the Great Heritage Site located in the ancient city of Xi’an as the “site effect” and classified the site’s effect into four levels: strong, balanced, weak, and virtual, based on spatiality. The principles by which the heritage site in this study impacts urban construction are similar to those in international cases. The findings of this research echo Beijing’s “skyline management” policy, where the capital preserves the visual permeability of historical districts through legally mandated height restrictions. Unlike Beijing, Luoyang faces the challenge of a higher overlap between the Great Heritage Site and modern urban areas. To balance conservation and development, flexible policies such as “floor area ratio transfer” are needed.

5.4. Policy Recommendations

In 2021, the State Administration of Cultural Heritage of China issued the “Special Plan for the conservation and Utilization of Great heritage sites in the 14th Five-Year Plan”, proposing to improve the planning system for Great Heritage Sites within the national land spatial planning framework and enhance the regulation of the spatial use of Great Heritage Sites. In 2023, the People’s Government of Luoyang City released the draft of the “Overall Land Spatial Plan of Luoyang City (2021–2035)”, which specifically requires promoting the coordination between the conservation of Great Heritage Sites and land spatial planning. There are seven Great Heritage Sites of ancient capitals surrounding the urban area of Luoyang City, which account for a significant proportion of Luoyang’s land spatial area. Therefore, it is necessary to improve the methods and means of land spatial detailed planning to achieve the coordinated development between the conservation of Great Heritage Sites and regional urban areas, and explore the development path of historical urban land spatial based on the conservation of Great Heritage Sites.
Based on the characteristics of urban land development intensity within the scope of the Great Heritage Site of Sui–Tang Dynasty Luoyang City, maintaining the conservation of the Great Heritage Site while promoting development activities requires the strict control of the plot ratio of surrounding buildings. Particularly, strict control over building heights based on sightlines and landscape corridor requirements is essential. A “graded compensation-dynamic linkage” policy framework can achieve the goal of compensating for the impact of typical scenic area construction on visual loss and ensuring that tourism benefits support urban construction. Specifically, areas with over 50% visual loss due to scenic area construction should be designated as “absolute conservation zones”. Developers can purchase quotas outside these zones through a “floor area ratio bank”, with funds directed to site maintenance and community welfare. Additionally, a “cultural heritage visual integrity” indicator should be added to the national land spatial “double evaluation” process. New district plans must verify their impact on site landscapes through visual simulation. Projects that fail to meet standards must adjust their designs or pay cultural compensation fees to ensure coordinated development between cultural heritage protection and urban construction. Considering tourism overload risks, core heritage zones should implement a reservation system to limit daily visitor flow, and establish “commercial expansion restriction zones” to guide visitor consumption to buffer zones.

6. Conclusions

This study uses the Great Heritage Site of Sui–Tang Dynasty Luoyang City in Luoyang, China, as a case to explore the impact of heritage protection on urban development intensity. By integrating a spatial autocorrelation analysis, kernel density estimation, and GIS-based viewshed analysis, it quantified the constraining effects of urban development indicators under heritage protection policies on urban construction. The results show that building height restrictions, as a core policy tool for protecting cultural heritage visual integrity, have significantly shaped urban development patterns. Although the difference in the floor area ratio between protected and non-protected areas is small, building heights are strictly limited within protected areas (42.69% of plots are below 24 m, compared to 33.55% of plots exceeding 100 m in non-protected areas). The GIS-based viewshed analysis further indicated that the visual obstruction rate in core heritage areas exceeds 50%, significantly higher than in peripheral areas, confirming the effectiveness of height restrictions in maintaining historical landscape continuity. This continuity is essential for sustainable cultural tourism and urban identity. Based on these findings, this study proposes a “graded compensation-dynamic linkage” policy framework. It suggests introducing a floor area ratio bank in “absolute conservation zones” where visual loss exceeds 50%, allowing developers to trade quotas to support site maintenance. It also recommends incorporating “cultural heritage visual integrity” into the national land spatial “double evaluation” system, requiring new district plans to verify landscape impacts through viewshed simulations. Projects that fail to meet the standards must adjust their designs or pay compensation fees.
Unlike previous studies, this study innovatively integrated a GIS-based viewshed analysis into research on Great Heritage Site protection and urban development intensity. It moves beyond traditional static indicator comparisons to quantify, for the first time, the constraining effects of the cultural heritage value on the urban spatial form from a visual integrity perspective. By constructing a “current viewshed–theoretical viewshed” difference model, it reveals the important role of building height restrictions in landscape maintenance and provides a quantifiable decision-making tool for the “protective development” of historical cities.

Author Contributions

Conceptualization, J.C. and J.Y.; data curation, H.L.; formal analysis, J.Y.; funding acquisition, J.C. and H.L.; investigation, D.K.; methodology, D.K. and J.Y.; resources, J.Y.; software, D.K. and H.L.; supervision, J.C. and H.L.; validation, J.Y.; visualization, D.K.; writing—original draft, D.K.; writing—review and editing, D.K., J.Y. and H.L. All authors have read and agreed to the published version of the manuscript.

Funding

The Key R&D and Promotion Projects in Henan Province_Key projects of soft science research (grant number 232400411024); the Scientific and Technological Project of Henan Province of China (grant number 242102321181, 232102321011); the General Research Project on Humanities and Social Sciences in High Schools in Henan Province (grant number 2024-ZZJH-420).

Institutional Review Board Statement

Not applicable.

Informed Consent Statement

Not applicable.

Data Availability Statement

Data are contained within the article.

Conflicts of Interest

The authors declare no conflicts of interest.

References

  1. World Bank; International Monetary Fund. Global Monitoring Report 2013: Rural-Urban Dynamics and the Millennium Development Goals; The World Bank: Washington, DC, USA, 2013. [Google Scholar]
  2. Yang, C.; Zeng, W.; Yang, X. Coupling coordination evaluation and sustainable development pattern of geo-ecological environment and urbanization in Chongqing municipality, China. Sustain. Cities Soc. 2020, 61, 102271. [Google Scholar] [CrossRef]
  3. Zhang, X.; Han, L.; Wei, H.; Tan, X.; Zhou, W.; Li, W.; Qian, Y. Linking urbanization and air quality together: A review and a perspective on the future sustainable urban development. J. Clean. Prod. 2022, 346, 130988. [Google Scholar] [CrossRef]
  4. Almulhim, A.I.; Cobbinah, P.B. Can rapid urbanization be sustainable? The case of Saudi Arabian cities. Habitat Int. 2023, 139, 102884. [Google Scholar] [CrossRef]
  5. Balsalobre-Lorente, D.; Abbas, J.; He, C.; Pilař, L.; Shah, S.A.R. Tourism, urbanization and natural resources rents matter for environmental sustainability: The leading role of AI and ICT on sustainable development goals in the digital era. Resour. Policy 2023, 82, 103445. [Google Scholar] [CrossRef]
  6. Zhang, X.; Zhang, Q.; Zhang, X.; Gu, R. Spatial-temporal evolution pattern of multidimensional urban shrinkage in China and its impact on urban form. Appl. Geogr. 2023, 159, 103062. [Google Scholar] [CrossRef]
  7. Wang, Y.; Feng, D. History, modernity, and city branding in China: A multimodal critical discourse analysis of Xi’an’s promotional videos on social media. Soc. Semiot. 2023, 33, 402–425. [Google Scholar] [CrossRef]
  8. Barnett, J. An Introduction to Urban Design; HarperCollins Publishers: New York, NY, USA, 1982. [Google Scholar]
  9. Brunn, S.D.; Williams, J.F.; Zeigler, D.J. Cities of the World: World Regional Urban Development; Rowman & Littlefield: Lanham, MD, USA, 2003. [Google Scholar]
  10. Pincetl, S. Nature, urban development and sustainability–what new elements are needed for a more comprehensive understanding? Cities 2012, 29, S32–S37. [Google Scholar] [CrossRef]
  11. Smith, M.E. Form and meaning in the earliest cities: A new approach to ancient urban planning. J. Plan. Hist. 2007, 6, 3–47. [Google Scholar] [CrossRef]
  12. The State Council of the People’s Republic of China, the National Cultural Heritage Administration, Notice on Issuing the “14th Five-Year Special Plan for the Protection and Utilization of Major Heritage Sites”. 12 October 2021. Available online: https://www.gov.cn/zhengce/zhengceku/2021-11/19/content_5651816.htm (accessed on 12 January 2024).
  13. Liu, J.; Liu, H.; Xue, L. Research on management and control of the complex site space in territorial space planning. Urban Dev. Studies 2022, 29, 1–5. [Google Scholar]
  14. Meng, X. Dream glory: Construction of our large site protection display system and park—Discussion on the protection ideas of large sites in china. Southeast Cult. 2001, 1, 6–15. [Google Scholar]
  15. Lu, J. The big cultural sites in china: Protection cases, existing problems and suggestions. Fudan J. Soc. Sci. Ed. 2005, 6, 120–126. [Google Scholar]
  16. Zhu, H.; Quan, D. The channel of the great relics protection and the region economic harmony development: To develop the great relics cultural industrial cluster. Econ. Geogr. 2007, 27, 747–752. [Google Scholar]
  17. Liu, W.; Tian, R. Study on the construction of theoretical approaches and research frameworks for the protection of complex site. J. Northwest Univ. (Philos. Soc. Sci. Ed.) 2021, 51, 54–62. [Google Scholar]
  18. Fang, L.; Chen, L. An innovative study on urban large sites under perspective of TEEB. Environ. Prot. 2016, 44, 26–29. [Google Scholar]
  19. Zhu, M. Discussion on the Conservation and Utilization Mode of Earthen Sites: A Case Study of Xi’an Area. Southeast Cult. 2011, 18–24. [Google Scholar]
  20. Wang, X.; Fu, X.; Zhang, P. Research Progress and Trend of Archaeological Site Park. Chin. Landsc. Archit. 2019, 35, 93. [Google Scholar]
  21. Liu, K. Interpretation of the overall planning for Daming Palace National Relics Protection and Demonstration Park and Relics Park. China Cult. Herit. 2009, 4, 112–119. [Google Scholar]
  22. Wang, X.; Bi, J.; Lv, Z. A sustainable development research based on the overall protection of city big site area—Taking Xi’an Daming palace ruins for example. Archit. Cult. 2014, 8, 61–65. [Google Scholar]
  23. Xiao, J. Protection and Display of Large Urban Sites: A Case Study of the Practice in Sui-Tang Luoyang City. Archit. J. 2012, 6, 69–73. [Google Scholar]
  24. Liu, C.; Zhang, Y. Analysis and Reflection on the Status Quo of the Studies on Conservation and Use of Largescale Sites:Based on Knowledge Mapping Based on CSSCI Literature. China Cult. Herit. 2022, 4, 52–62. [Google Scholar]
  25. Wu, C.; Xiao, J.; Kuang, X.; Zhang, S. The “Nature-based Solutions” of Linking City Development with the Preservation of Great Sites Urban Planning Forum. Urban Plan. Forum 2021, 1, 104–110. [Google Scholar]
  26. Zhang, D.; Zhao, Y.; Zhu, S. Multi-Value Paths of Urban Heritage Site Conservation and Utilization: A Case Study of Xi’an City. Mod. Urban Res. 2022, 7, 120–126. [Google Scholar]
  27. Wang, D. A Research on Heritage Preservation Strategies Based on City Planning. J. Chifeng Univ. (Philos. Soc. Sci. Chin. Ed.) 2022, 43, 58–61. [Google Scholar]
  28. Zhang, P.; Yang, D.; Qin, M.; Jing, W. Spatial heterogeneity analysis and driving forces exploring of built-up land development intensity in Chinese prefecture-level cities and implications for future Urban Land intensive use. Land Use Policy 2020, 99, 104958. [Google Scholar] [CrossRef]
  29. Ellis, E.C.; Ramankutty, N. Putting people in the map: Anthropogenic biomes of the world. Front. Ecol. Environ. 2008, 6, 439–447. [Google Scholar] [CrossRef]
  30. Liu, F.; Yan, H.; Liu, J.; Xiao, X.; Qin, Y. Spatial pattern of land use intensity in China in 2000. Acta Geogr. Sin. 2016, 71, 1130–1143. [Google Scholar]
  31. Erb, K.-H.; Haberl, H.; Jepsen, M.R.; Kuemmerle, T.; Lindner, M.; Müller, D.; Verburg, P.H.; Reenberg, A. A conceptual framework for analysing and measuring land-use intensity. Curr. Opin. Environ. Sustain. 2013, 5, 464–470. [Google Scholar] [CrossRef]
  32. Gong, J.; Chen, W.; Liu, Y.; Wang, J. The intensity change of urban development land: Implications for the city master plan of Guangzhou, China. Land Use Policy 2014, 40, 91–100. [Google Scholar] [CrossRef]
  33. Walz, U.; Stein, C. Indicators of hemeroby for the monitoring of landscapes in Germany. J. Nat. Conserv. 2014, 22, 279–289. [Google Scholar] [CrossRef]
  34. Wellmann, T.; Haase, D.; Knapp, S.; Salbach, C.; Selsam, P.; Lausch, A. Urban land use intensity assessment: The potential of spatio-temporal spectral traits with remote sensing. Ecol. Indic. 2018, 85, 190–203. [Google Scholar] [CrossRef]
  35. Fainstein, S.S. Planning theory and the city. J. Plan. Educ. Res. 2005, 25, 121–130. [Google Scholar] [CrossRef]
  36. Pont, M.B.; Haupt, P.A. Spacematrix. Space, Density and Urban Form; NAi Publishers: Rotterdam, The Netherlands, 2010. [Google Scholar]
  37. Maas, W.; Rijs, J.V.; Koek, R. Farmax: Excursions on Density; 010 Uitgeverij Publishers: Rotterdam, The Netherlands, 1998. [Google Scholar]
  38. Li, H.; Song, W. Evolution of rural settlements in the Tongzhou District of Beijing under the new-type urbanization policies. Habitat Int. 2020, 101, 102198. [Google Scholar] [CrossRef]
  39. The Resource and Environmental Science Information Center of the Chinese Academy of Sciences. Available online: https://www.resdc.cn/ (accessed on 1 January 2023).
  40. Geospatial Data Cloud Platform. Available online: https://www.gscloud.cn/ (accessed on 22 April 2025).
  41. Tan, S.; Liu, Q.; Han, S. Spatial-temporal evolution of coupling relationship between land development intensity and resources environment carrying capacity in China. J. Environ. Manag. 2022, 301, 113778. [Google Scholar] [CrossRef] [PubMed]
  42. Tang, J.; Gao, H.; Song, X.; Xu, H. Convergence or divergence between small towns and villages: A perspective from changes in built-up land development intensity. Habitat Int. 2023, 138, 102874. [Google Scholar] [CrossRef]
  43. GB 50137-2011; Ministry of Housing and Urban-Rural Development of the People’s Republic of China, Code for Classification of Urban Land Use and Planning Standards of Development Land. Ministry of Housing and Urban-Rural Development of the People’s Republic of China: Beijing, China, 2012.
  44. GBT50280-98; Ministry of Construction of the People’s Republic of China. Standard of Basic Urban Planning Terminology. Ministry of Construction of the People’s Republic of China: Beijing, China, 1999.
  45. Anselin, L. An Introduction to Spatial Autocorrelation Analysis with GeoDa Spatial Analysis Laboratory; University of Illinois: Champagne-Urbana, IL, USA, 2003. [Google Scholar]
  46. Dormann, C.F.; McPherson, J.M.; Araújo, M.B.; Bivand, R.; Bolliger, J.; Carl, G.; Davies, R.G.; Hirzel, A.; Jetz, W.; Daniel Kissling, W. Methods to account for spatial autocorrelation in the analysis of species distributional data: A review. Ecography 2007, 30, 609–628. [Google Scholar] [CrossRef]
  47. Boots, B.; Tiefelsdorf, M. Global and local spatial autocorrelation in bounded regular tessellations. J. Geogr. Syst. 2000, 2, 319–348. [Google Scholar] [CrossRef]
  48. Ord, J.K.; Getis, A. Testing for local spatial autocorrelation in the presence of global autocorrelation. J. Reg. Sci. 2001, 41, 411–432. [Google Scholar] [CrossRef]
  49. Zambom, A.Z.; Ronaldo, D. A review of kernel density estimation with applications to econometrics. Int. Econom. Rev. 2013, 5, 20–42. [Google Scholar]
  50. De Smith, M.; Goodchild, M.; Longley, P. Geospatial Analysis: A Comprehensive Guide to Principles, Techniques and Software Tools; Troubador: London, UK, 2008. [Google Scholar]
  51. Throsby, D. Economics and Culture; Cambridge University Press: Cambridge, UK, 2001. [Google Scholar]
  52. Niu, F.; Xin, Z.; Sun, D. Urban land use effects of high-speed railway network in China: A spatial spillover perspective. Land Use Policy 2021, 105, 105417. [Google Scholar] [CrossRef]
  53. Zheng, L.; Long, F.; Chang, Z.; Ye, J. Ghost town or city of hope? The spatial spillover effects of high-speed railway stations in China. Transp. Policy 2019, 81, 230–241. [Google Scholar] [CrossRef]
  54. Kinahan, K.L. Historic preservation as a community development tool in legacy city neighbourhoods. Community Dev. J. 2019, 54, 581–604. [Google Scholar] [CrossRef]
  55. Ecemis Kilic, S. Preservation plan applications for the historical city centre, Kemeralti (Izmir, Turkey). Eur. Plan. Stud. 2008, 16, 253–276. [Google Scholar] [CrossRef]
  56. Strange, I. Planning for change, conserving the past: Towards sustainable development policy in historic cities? Cities 1997, 14, 227–233. [Google Scholar] [CrossRef]
  57. Lv, L. Research on Conservation and Construction to the Surrounding Spatial Setting of Xi’an Great Heritage Sites; Tsinghua University Press: Bejing, China, 2016. [Google Scholar]
Figure 1. A location map of the Great Heritage Site of Sui–Tang Dynasty Luoyang City.
Sustainability 17 03882 g001
Figure 2. Methodology flowchart.
Sustainability 17 03882 g002
Figure 3. A map of the current land use situation within the Great Heritage Site of Sui–Tang Dynasty Luoyang City. Note: In the above image, the photos labeled 1, 2, 3, and 4 depict typical street architectural styles in the areas north of the Luo River, and Areas A, B, and C south of the Luo River within the Great Heritage Site of Sui–Tang Dynasty Luoyang City. In the map above, the abbreviations of the corresponding land use type names and the full names are listed below: Industrial land (IL). Main canal (MC). Kindergarten land (KL). Primary and secondary school land (PSSL). Square land (SL). Secondary vocational education land (SVEL). Radio and television facility land (RTFL). Arbor forest land (AFL). arid land (AL). Rural road land (RRL). Transportation station land (TSL). Educational land (EL). Cultural land (CL). Cultural relics and historical sites land (CRHSL). Park green space (PGS). Government and organization land (GOL). Orchard (O). Highway land (HL). Other transportation facility land (OTFL). Aquaculture facility construction land (AFCL). Hydraulic facility land (HFL). Other commercial service land (OCSL). Irrigated land (IL). Other garden land (OGL). Ditch (D). Other educational land (OEL). River water surface (RWS). Other forest land (OFL). Fire protection land (FPL). Other special land (OSL). Logistics and storage land (L&SL). Other grassland (OG). Inland marsh (IM). Military facility land (MFL). Correctional facility land (CFL). Rural homestead (RH). Social welfare land (SWL). Medical and health land (MHL). Commercial land (CoL). Scientific research land (SRL). Business and finance land (B&FL). Bare land (BL). Pond water surface (PWS). Mining land (ML). Railway land (RL). Urban residential land (URL). Protective green space (ProGS). Urban road land (URL). Retail commercial land (RCL). Entertainment and fitness land (E&FL). Higher education land (HEL). Religious land (RL).
Sustainability 17 03882 g003
Figure 4. The results of the spatial autocorrelation analysis. Note: the photos labeled 1, 2, 3, and 4 in the figure represent the spatial autocorrelation analysis results of the floor area ratio (FAR) in Luolong District, the spatial autocorrelation analysis results of the FAR in the Great Heritage Site area, the spatial autocorrelation analysis results of building height in Luolong District, and the spatial autocorrelation analysis results of building height in the Great Heritage Site area, respectively.
Sustainability 17 03882 g004
Figure 5. A visualization of the contrasting development intensity within and outside the Great Heritage Site area.
Sustainability 17 03882 g005
Figure 6. A visualization of the contrasting development intensity within and outside the Great Heritage Site area. Note: in the figure, 1, 2, 3, and 4 indicate the current viewshed range of typical scenic areas within the Great Heritage Site of Sui–Tang Dynasty Luoyang City; the theoretical viewshed range of typical scenic areas without building obstructions within the site; the current viewshed range of typical scenic areas outside the Great Heritage Site of Sui–Tang Dynasty Luoyang City; and the theoretical viewshed range of typical scenic areas without building obstructions outside the site.
Sustainability 17 03882 g006
Table 1. Types of planned construction land and their area proportions.
Land Use TypeWithin the Scope of the Great Heritage SiteOutside the Scope of the Great Heritage Site
Area (Hectares)PercentageArea (Hectares)Percentage
Residential657.8935.96%772.6627.91%
Administration and public services172.919.45%608.8821.99%
Commercial and business facilities169.59.26%146.065.28%
Industrial and manufacturing00.00%00.00%
Logistics and warehouse4.010.22%00.00%
Road, street, and transportation427.2123.35%650.6923.50%
Municipal utilities44.712.44%15.910.57%
Green space and square339.2118.54%486.4417.57%
Water and other land14.110.77%87.733.17%
Total1829.55100.00%2768.37100.00%
Table 2. Comparison of planned construction area development intensity indicators.
Development Intensity IndicatorsWithin the Great Heritage Site AreaLuolong District (Outside the Great Heritage Site Area)
Plot Size (Hectares)ProportionsPlot Size (Hectares)Proportions
FAR≤2803.543.92%1264.4645.68%
2.1–3202.6911.08%359.0312.97%
3.1–4301.9616.50%339.1812.25%
4.1–5163.148.92%243.948.81%
≥689.554.89%120.664.36%
Building height2478142.69%782.4928.27%
25–50292.0615.96%273.259.87%
51–100454.7224.85%415.114.99%
101–20077.994.26%928.7333.55%
≥20100.00%30.791.11%
Disclaimer/Publisher’s Note: The statements, opinions and data contained in all publications are solely those of the individual author(s) and contributor(s) and not of MDPI and/or the editor(s). MDPI and/or the editor(s) disclaim responsibility for any injury to people or property resulting from any ideas, methods, instructions or products referred to in the content.

