Article

An Environmental Life-Cycle Assessment of End-of-Life Vehicles Management in Romania

Department of Environmental Engineering and Management, “Cristofor Simionescu” Faculty of Chemical Engineering and Environmental Protection, “Gheorghe Asachi” Technical University of Iasi, 73 Prof. D. Mangeron Blvd., 700050 Iasi, Romania
*
Authors to whom correspondence should be addressed.
Sustainability 2025, 17(8), 3691; https://doi.org/10.3390/su17083691
Submission received: 6 March 2025 / Revised: 9 April 2025 / Accepted: 16 April 2025 / Published: 18 April 2025

Abstract

:
This study evaluates the environmental impacts of end-of-life vehicle (ELV) management in Romania using a life-cycle assessment (LCA). It focuses on the current scenario of ELV waste generation and models current ELV practices like reuse, recycling, energy recovery, and final disposal with the goal of understanding the environmental impacts and benefits of the ELV recycling system and the trade-offs needed to improve its environmental performance. The investigation is based on a statistical analysis of retired cars in 2020 and Eurostat data on ELV waste composition. The results indicate that current practices meet the 85% recovery target, with recycling being the dominant method. The environmental analysis shows that recycling provides the greatest net environmental benefits, while landfilling has negative impacts, especially in climate change and marine eco-toxicity categories. An optimized scenario, which minimizes landfilling and increases recycling, leads to significant improvements in air- and resource-related categories and shows that improving the ELV waste management practices for better dismantling, separation, and recycling is crucial for enhancing the ELV management performance.

Graphical Abstract

1. Introduction

Currently, end-of-life vehicles (ELV) represent one of the most important waste streams because they raise complex problems in multiple perspectives: the generated volumes are increasing [1], and their composition and complexity are changing [2]. These two issues raise several types of challenges for their sustainable management: environmental burdens [1,3,4], waste mining opportunities, legal issues, economic aspects [5], and policy and regulation needs for change [6]. There are several research topics that are relevant to ELV management and its sustainability and performance. These include the impact of regulatory frameworks and policies on waste generation [7], recycling and closed-loop supply chains’ performance [1], waste management practices and technologies and their progress towards a better ELV management performance [7,8], and an environmental impact assessment [9].
The End-of-Life Vehicles Directive (2000/53/EC) [10] has been implemented in the European Union (EU) member states in order to set out clear targets for ELV reuse, recycling, and recovery and to prevent and limit waste from ELVs. It is also intended to improve the environmental performance in the vehicle’s life cycle, thus contributing to a more circular economy. The ELV directive has been in place since 2002, it has received several amendments and currently is under review to be brought in line with the European green deal prospects and with the circular economy action plan [11]. This new European proposal is to have a regulation replacing the former ELV directive as the motor vehicles type-approval directive [12] to cover aspects relating to vehicle reusability, recyclability, and recoverability [7,13]. The new document will focus on improving vehicles’ circular design, minimum recycled content targets (e.g., at least 25% secondary plastic inputs), better critical raw materials (CRMs), aluminum and steel recovery, and intra-European ELV tracing and management.
ELV management in Romania is organized through Law 212/2015 which transposes the EU Directive 2000/53/EC on End-of-Life Vehicles into national legislation. This internalizes the EU targets in this sector which mandate that 85% of ELVs. must be reused or recycled and 95% must be reused or recovered. Furthermore, this legislation establishes technical requirements for ELV treatment facilities, including depollution, dismantling, shredding, and recycling processes. Facilities must obtain permits from competent authorities and are subject to inspections to ensure compliance with environmental standards. In 2024, in Romania, around 800 businesses operated that were accredited for waste ELV management operations. The majority of these (705) work in ELV waste collection and treatment (but treatment mainly means depollution and dismantling) and only four companies are accredited for shredding operations. However, the data reported in Eurostat and discussed in Section 2.2 shows that Romania ensures that it meets the European targets for ELV recycling and recovery (85.35% vs. 85%) and it very close to meeting the reuse and recovery target (91.6 vs. 95%).
With regard to the ELV management environmental performance, there are many relevant research approach topics like the development and optimization of ELV management systems [9], the identification of drivers and barriers for ELV development [14], and sustainability and efficiency in ELV recycling [8]. In an extensive review, Karagoz et al. [9] identified a number of recurrent topics related to ELVs: specific material flow analyses (shredder residue treatment, automotive plastics, rare metals, batteries, tires, etc.), disassemblability, management practices, or reverse logistics as relevant research topics in this area. The same authors cite the life-cycle assessment (LCA) as the most used environmental performance assessment tool in this field.
LCA is usually used in the automotive industry and ELV management to compare the environmental performances of different components or technologies or with a focus on materials or recovery [15]. In this respect, a growing trend in LCA research is to compare, for example, the performance of internal combustion engine vehicles (ICEVs) with different electric–power configurations: battery electric vehicles (BEV) [16], plug-in hybrid electric vehicles (PHEV) [17,18], and fuel cell electric vehicles (FCEV) [19,20]. With respect to the post-use phase of vehicles, life-cycle assessment studies are usually performed to evaluate the environmental impacts or the economic viability of different ELV management practices [9,21]. Most notably, the impacts associated with various vehicle components like end-of-life management batteries [22,23,24] and tires [25] are usually approached from an LCA perspective. The environmental performance evaluation of the ELV management system as a whole is not so often approached in research studies, but relatively recently, aspects like data flow analysis for post-use phase evaluation [26] and multi-criteria decision support methods and systems [27,28] were studied. There are some studies that approach this topic from an economic perspective [29,30], but our research here focuses on the environmental performance of the Romanian ELV management system in its entirety, highlighting the impacts and benefits of the various ELV valorization routes.
In Romania, according to the official data from the National Registration Department [31], the passenger car fleet is rapidly expanding and growing old at the same time, as presented in Table S1 (available in the Supplementary Material). In 2024, the national car fleet of Romania increased by 4.32% to more than 8.44 million passenger cars. The share of vehicles older than 20 years has gone up dramatically from 20.4% in 2019 to close to 36% at the end of 2024. Only around 3.8% of cars are new (0–2 years old). With respect to the engine types, the same table shows a balanced distribution of petrol- and diesel-powered passenger cars and the exponential growth of electric and hybrid vehicles, albeit their numbers are very small compared to the ICEV models (0.59% for EV and 3.16% for hybrids). The rather large annual growth rates compared to the European ones mainly come from imports of used cars from across Europe, while new registrations have a minor share. It should be noted that alternative fueled vehicles have an important share (approx. 23% in 2023) in these newly registered vehicles. This is due to a national program which subsidizes with fixed value vouchers the decommissioning of old vehicles and the purchase of new ones. This program (ubiquitously called “Rabla” in Romanian—Wreck) is the most important incentive for the national car park renewal and factors like voucher values (which are different for petrol, pure-electric, and hybrid vehicles), has specific implementation rules (which change annually), and the overall budget greatly influences both the number of decommissioned vehicles (that eventually become ELV waste) and the uptake of new electric and hybrid passenger cars.
In a previous research [32], we have investigated how these growing numbers of second-hand old vehicles contribute now and in the future to growing urban pollution and additional environmental impacts. It is clear that the rapidly increasing number of cars and car fleet aging puts a burden on the passenger cars’ life-cycle post-use phase. In this research, we will investigate how this aging car fleet impacts the ELV management system in Romania, with a focus on current practices and their environmental performance.
The objective of this study is to evaluate by means of LCA the environmental profiles of ELV management operations in Romania in 2020. Our investigation is aimed at understanding if and how the end-of-life vehicle recycling system generates potential environmental impacts or benefits by analyzing the actual ELV waste streams, their fate and treatment, and calculating their potential environmental burdens or benefits by means of a life cycle assessment. This research should be viewed as a reference point of the ELV management system performance which could be used in the future (or elsewhere) to benchmark (future) technologies and scenarios. The current research is limited to the environmental ELV management system performance in Romania and it does not consider economic aspects mainly due to a lack of reliable (economic) data, but also due to uncertainties raised by rapid changes in the system and legislation. Furthermore, this study is limited to internal combustion engine vehicles (ICEVs) because, at the moment, they form the largest part of the national personal vehicles fleet.

2. Materials and Methods

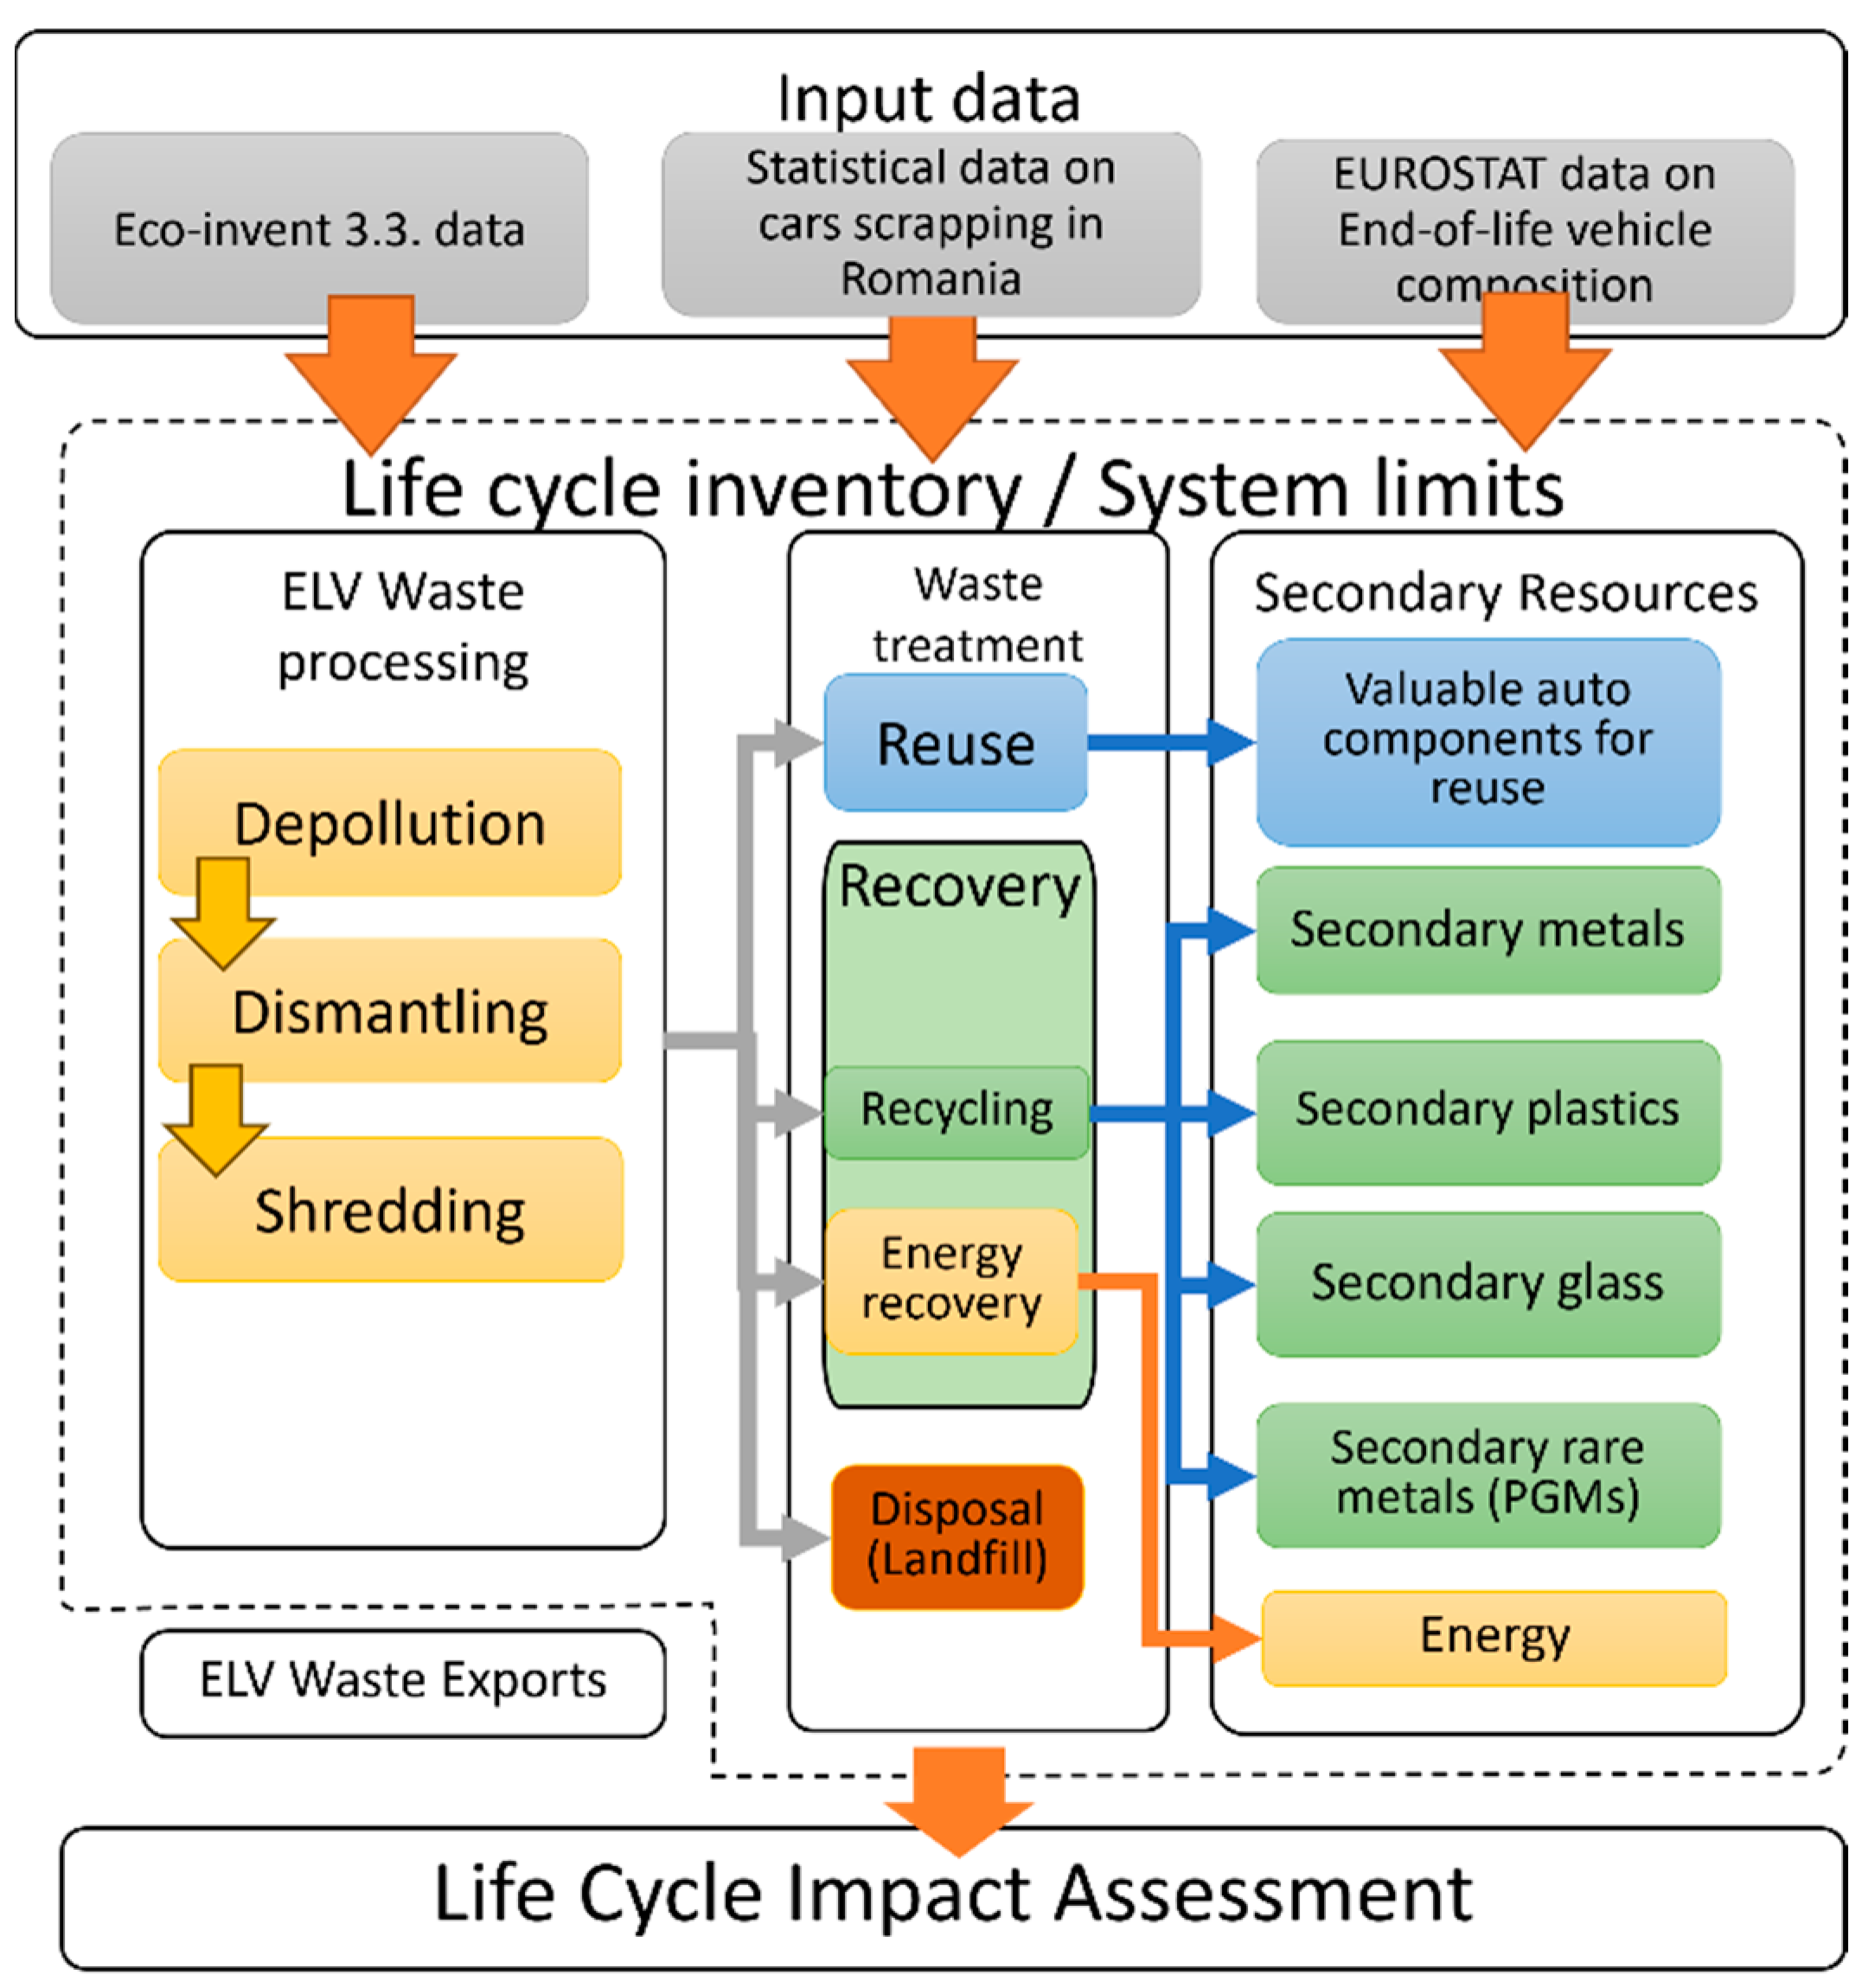
2.1. Research Methodology

The investigation presented in this paper evaluates a current scenario related to ELV waste management in Romania and models and evaluates future scenarios considering several possible changes in the ELV stream treatment routes.
The research strategy presented in Figure 1 depicts an investigation based on a statistical analysis of all retired cars in 2020 in Romania, which become end-of-life vehicles. It also considers Eurostat data regarding the ELV waste composition. These data are then used to model a life-cycle inventory (LCI) which considers the operations and materials involved in ELV management: reused components and material recycling. The operations include ELV storage, (manual) dismantling, shredding, which leads to automotive shredding residue (ASR), and the transport of recycled materials to processors. The distribution and destination of the material flows coming from ELV processing (reused, recycled, and disposed materials) are calculated based on Eurostat data, in order to benefit from the unified data collection methodology [33] and waste stream definitions [34,35] which enable the identification and tracking of various waste-to-resource streams.

2.2. Data Sources

The primary data concerning the distribution and dynamics of the passenger car fleet in Romania were sourced directly from the national governmental database regarding the passenger cars’ deregistration [36]. The ELV composition was sourced from the EUROSTAT database, based on Romania’s reporting, and this was used to compile the life-cycle inventories which subsequently were used for an environmental assessment. The data in Table 1 present the ELV waste quantities for 2020 in Romania and the share of materials with their respective waste treatment routes.

2.3. Life-Cycle Assessment Methodology

A life-cycle assessment was performed according to the specifications of the ISO 14040:2006 standard [37] considering the elements described below.
The goal of this study was to investigate the environmental impacts associated with the end-of-life vehicles’ management in Romania for a period of 1 year (2020). The scope of the evaluation included only the post-operational phase of the vehicles, and it was focused on the waste management operations which were modeled considering waste treatment processes (component reuse, dismantling, recycling, shredding, landfilling, incineration, etc.), as presented in Figure 1.
The recycling and reuse processes’ modeling considered a recycled content approach, which was implemented with a substitution method within the system boundaries. This was achieved by directly subtracting the number of secondary materials in the LCI which shows the benefit of recycling within the system boundary. Generally, this method was preferred over system expansion, which accounts for the avoided primary or raw materials by explicitly modeling their LCIs. System expansion induces many variables that need to be accounted for and very high levels of associated uncertainties. Waste treatment involving energy recovery processes has included the specific net energy outputs together with the waste treatment function of the incineration processes, and no allocation was completed between the two co-processes.
The functional unit of this study was chosen as 1 tonne of ELVs’ treated waste.
The life cycle inventory was modeled in SimaPro (version 9.1.0.11) by partially sourcing data from the EcoInvent 3.3 database for the waste treatment inventory entries and the types of recovered and recycled materials, while the actual values for these were modeled based on the data sourced from the EUROSTAT database. A life-cycle impact assessment was performed with the Recipe 2016 midpoint method [38] considering all its 18 impact indicators, as presented in the Supplementary Material, in Table S2.

3. Results and Discussion

3.1. Life-Cycle Inventory

The data in Table 1 show that ELVs. generate 83,782 tonnes of waste, with 86.16% (72,188 tons) being recovered through recycling and energy recovery, which shows that the recovery target of 85% is being met [39]. Landfilling accounts for 8.45% (7079 tonnes) and recycling dominates at 79.96% (66,991 tonnes), while energy recovery and reuse contribute 6.20% (5198 tonnes) and 5.39% (4515 tonnes), respectively. Metal components from dismantling achieve a 92.23% recovery rate (37,812 tonnes), with 92.22% recycled and 7.13% being reused. However, the 0.64% landfilling rate (264 tonnes) indicates minor losses, likely from contaminated or composite metal parts. With respect to plastic materials, there are some plastic streams that are landfilled, e.g., large plastic parts at 27.83% (747 tonnes), and also all of the shredded light fraction (1820 tonnes) that go in the landfill. From the total, only 67.38% of the large plastic parts are recovered, of which 65.26% (1751 tonnes) being recycled and the rest is sent for energy recovery. Glass components perform better, with 88.60% recovery (1249 tonnes), but reuse remains limited to 4.07% (57 tonnes).
These numbers highlight opportunities for improved ELV management practices like better dismantling, separation, and recycling for plastic components and better shredded light fraction valorization, but also for measures to be implemented in the design phase of the vehicles, like design-for-recycling standards in automotive manufacturing. By analyzing the ELV management routes, one may conclude that although current ELV processing achieves 79.96% recycling rates through conventional methods, some critical gaps exist in handling especially non-ferrous materials and composites because 27.83% of these are lost to landfilling.
ELV tires achieve 92.97% recovery (10,748 tonnes), reported as material recycling (6863 tonnes, 59.36%) and energy recovery (3885 tonnes, 33.60%). It has to be noted that the actual fate of recycled waste tires is, in the end, an energy recovery process in the cement production industry [40,41]. Batteries show 91.69% recovery (4416 tonnes), but the 6.78% (326 tonne) that is being landfilled is problematic.
Details regarding the modeling of the various treatment routes and the specific fate of the various materials are presented in Table 2.

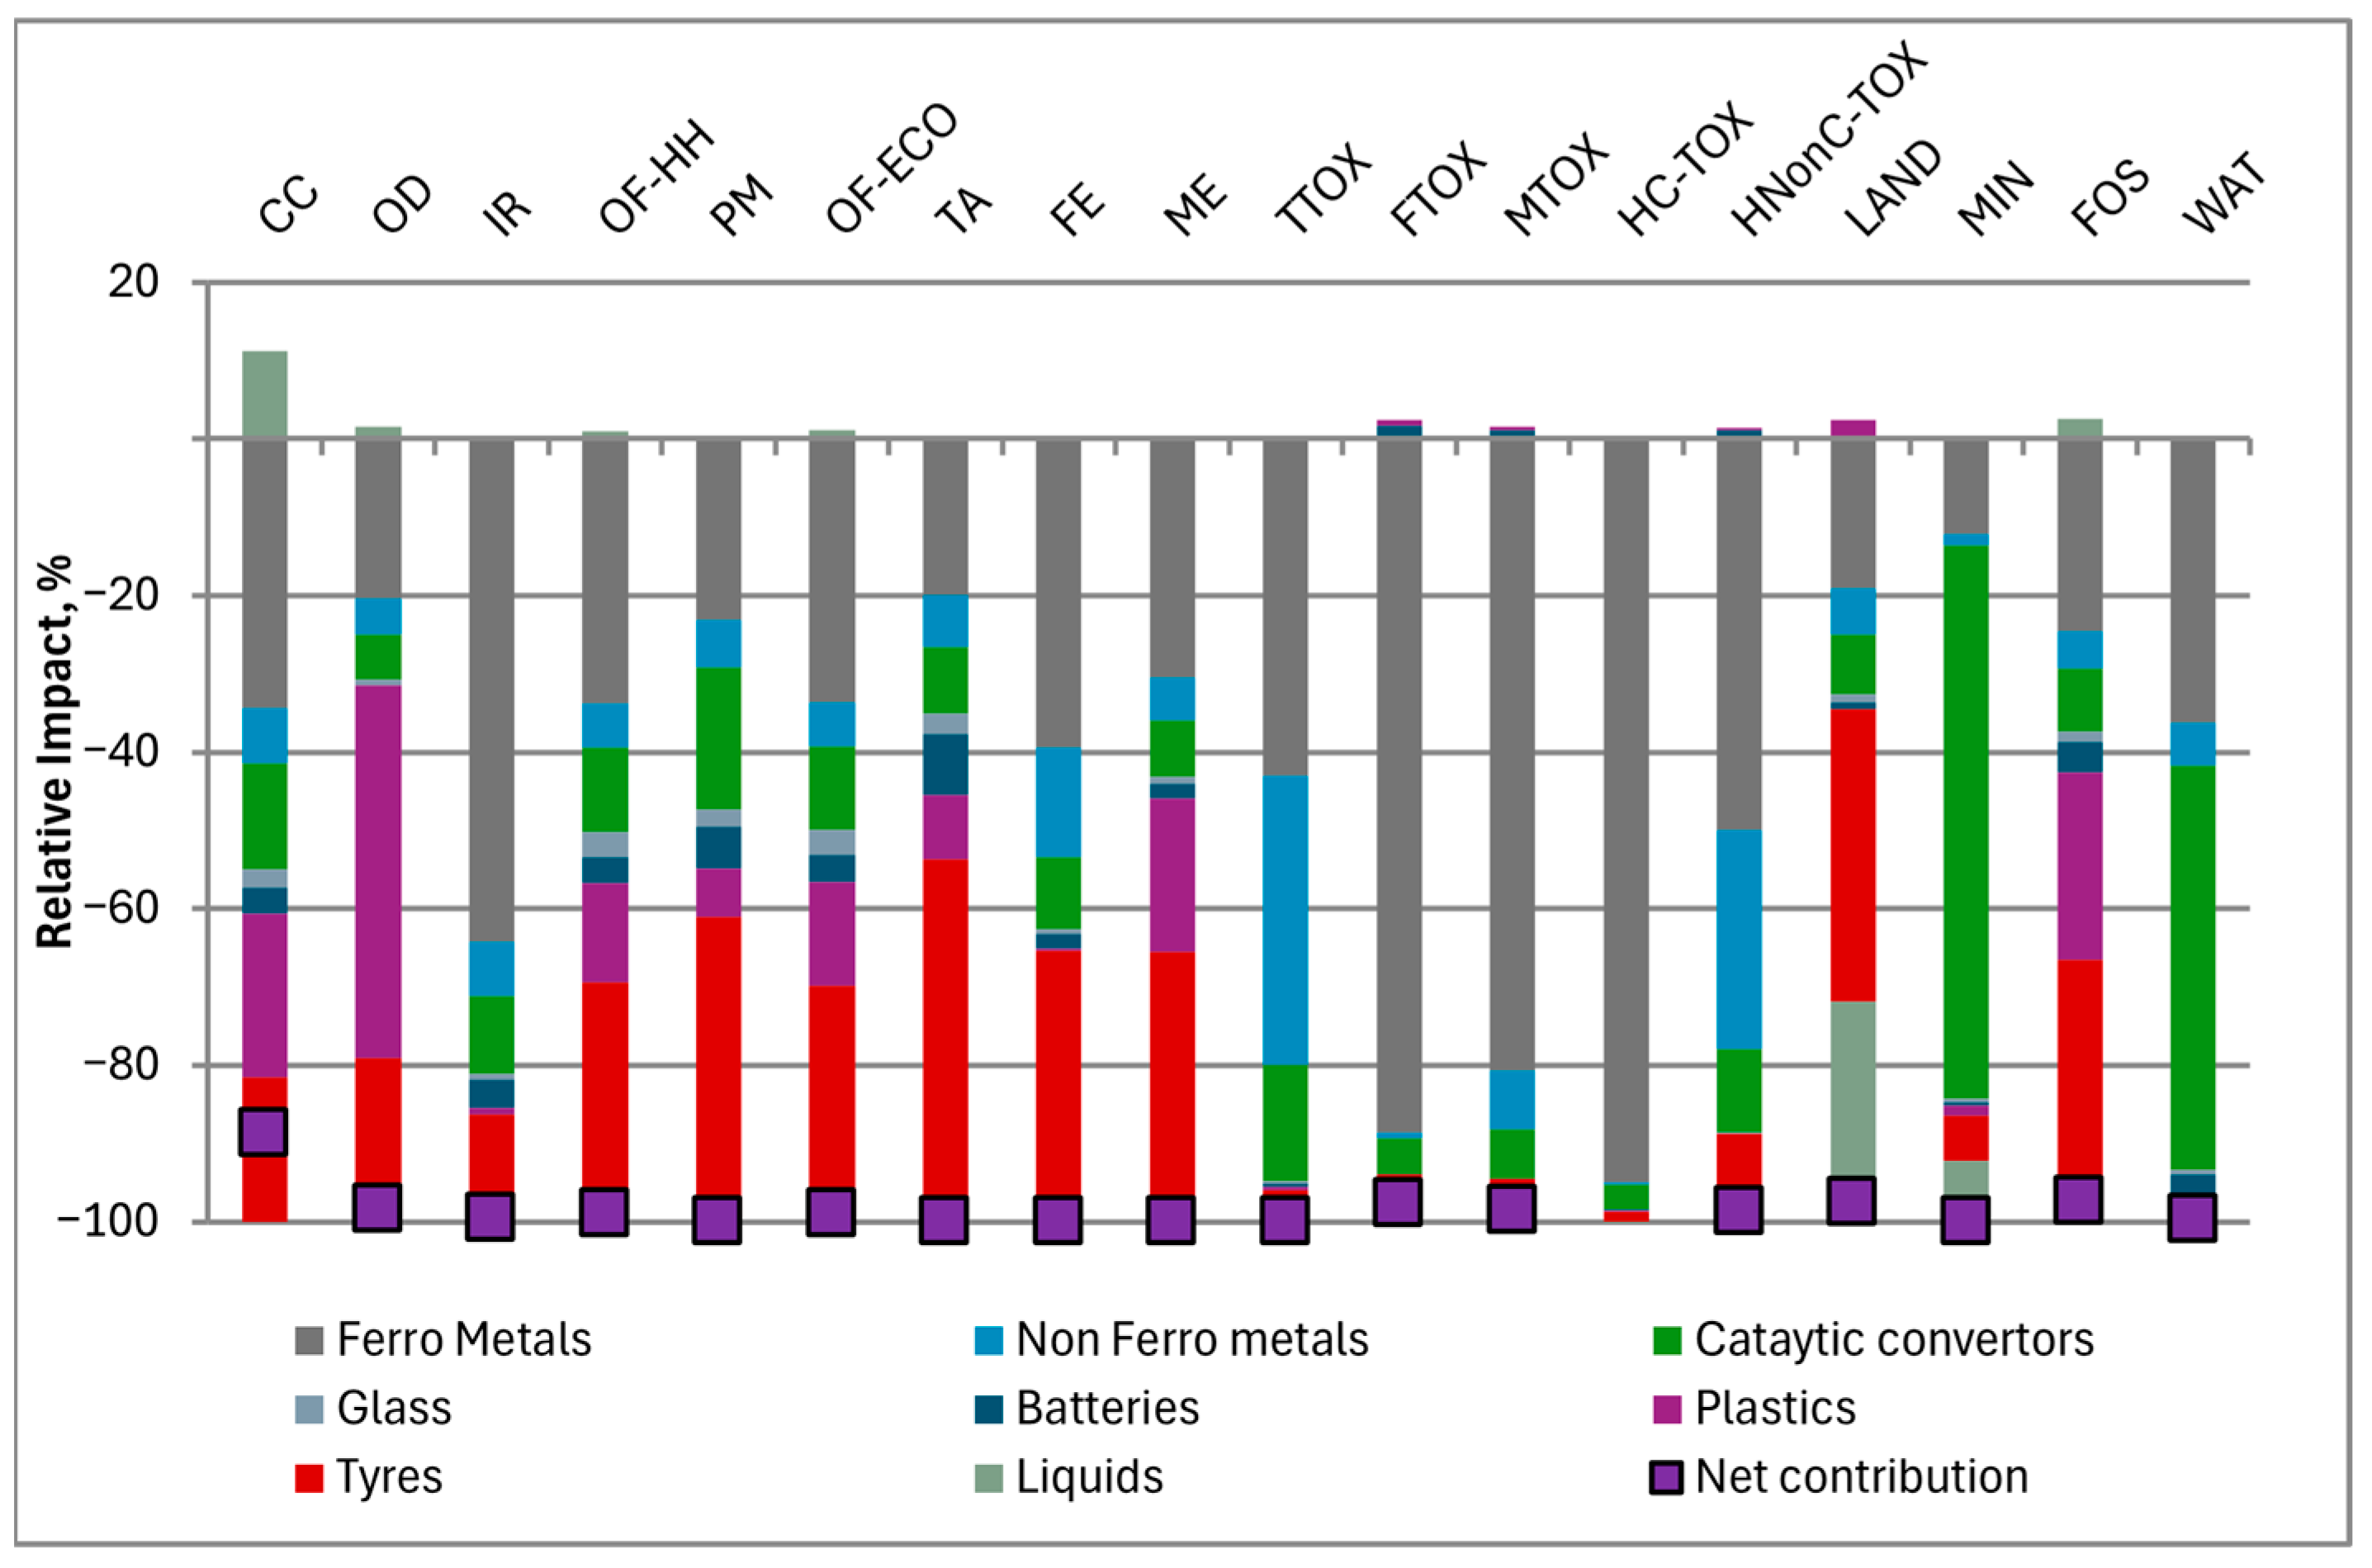
3.2. Environmental Profiles

The analysis has enabled the calculation of specific environmental profiles of the management practices, the actual impacts, and benefits for scrapping end-of-life vehicles. It has to be mentioned that our analysis only considers the scrapping of conventional internal combustion engine (ICEV) passenger vehicles, and we do not analyze any sort of electric vehicles.

3.2.1. Landfilling

Landfilling consists of the direct disposal of ELV components in municipal waste deposits. A distribution of impact contributors across various impact categories, as presented in Figure 2, shows that there are few major contributors: antifreeze solution (1 to 86% of total impacts in different categories), plastics (1.2 to 99%), and hazardous materials (0.1 to 87%). An exception is the climate change category (CC) where the major contributors are the direct emissions of freons from the AC units which lead to 4370 kg equivalent CO2 emissions per tonne of landfilled ELV waste. Landfilled batteries contribute to toxicity-related categories, mainly carcinogenic substances, such as HC-Tox, where due to their lead content, they generate 2.96 kg eq 1,4 DCB (37.9%) from a total of 7.85 kg eq 1,4 DCB. In the Freshwaster Eutrophication (FE) category, waste batteries landfilling contributes 0.0125 kg eq P/1 t of landfilled ELVs, 24.7% to a total of 0.0508 kg eq P/t ELV waste. This profile focuses on the actual landfilled materials and does not account for any eventual avoided impacts due to materials being reused or recycled; this is the reason why (more or less) inert materials like glass and metals do not generate significant impacts here compared to the already mentioned ones.

3.2.2. Energy Recovery

Energy recovery modeling considers the co-incineration of ELV waste, in accordance with the material balance (Table 2). It was modeled based on a waste incineration process from the Eco-invent 3.3. database in which specific data were particularized for the waste composition, calorific values of the different waste materials, energy recovery efficiencies, and specific pollutant emissions. The energetic valorization of tires was modeled as an input to cement production, where tires replace some of the conventional sources. Data on the energy output of the energy recovery processes is presented in Table S3 of the Supplementary Material.
The environmental profile in Figure 3 displays the major contribution of tires in most categories (42–100% of the total impacts), while the other flows only have minor contributions. This is due partly to the major share of waste tires in the waste energy valorization category (74.4% of the total mass), but also to the energy recovery efficiency of tires in the cement kilns (assumed to be 85%) [50], as compared to the (10–74%, Table S1) energy efficiency for the other incinerated flows. However, the profile displays net environmental benefits in all categories even though some waste flows generated environmental burdens. For example, in the climate change category (CC), a net 473 kg eq CO2 emissions are avoided for every tonne of treated ELV waste. In the freshwater (FE) and marine (ME) eco-toxicity categories, the plastic mix generates the highest impacts (4.5 and 5.9 kg eq 1,4-DCB, respectively, per tonne of treated ELVs) due to the heavy metal content in some car components (e.g., printed circuit boards). However, there are high uncertainties regarding the ELV plastic composition, and these results need to be treated accordingly.

3.2.3. ELV Recycling

The profile in Figure 4 presents the relative contribution of recovered materials from waste ELVs. It depicts a complex situation which is dictated by the shares of recycled materials, but also by the actual recycling process. As discussed below, some of these processes do not lead to usable secondary materials flows but are rather energy recovery processes. Overall, there are net environmental benefits due to the material recovery, for example, 674 kg eq CO2/tonne of treated ELV waste is avoided in the climate change category and 3740 m3/tonne ELV of water is reclaimed. Ferrous metal (54.19% of the total recycled ELV waste) recycling is the largest contributor in all categories with shares between 12 and 95% of the total impacts. A more important contribution of steel recycling is recorded in the toxicity-related categories, where it contributes 43% (TTOX), 89% FTOX, 81% MTOX, 95% HC-TOX, and 50% (HnonC-TOX) which sums up to 5.89 tonnes eq 1,4-DCB, mainly due to avoiding future slag processing in steel making. Non-ferrous metal recycling (9.56% of total mass) accounts for impacts of between 0.31 and 37%. A larger contribution of non-ferrous metals is registered in the toxicity-related categories (TTOX 37%, MTOX with 8%, and HnonC-TOX with 28%). Overall, the environmental credits due to non-ferrous metal recycling sum up in the toxicity categories to 3.56 tonnes equivalent 1,4-DCB mostly due to the secondary copper refinement process. It should be mentioned that these very-high-impact scores in the toxicity-related categories of metal recycling (both ferrous and non-ferrous) come from emissions of heavy metal ions from waste slag landfilling (e.g., Chromium VI, which is the most important contributor in this category, has a characterization factor in this category of 142,000 kg eq 1,4-DCB per 1 kg Cr6+ emissions).
With an 11.5% share in the total recycled ELV mass (6863 tonnes), tire recycling leads to impact benefits of between 1.2 and 46% in multiple categories. It has to be mentioned that tire recycling was modeled as co-incineration in cement production, like in the case of energy recovery, because this is the current practice in Romania and material recovery remains limited [41]. Catalytic convertors recycling generates benefits of between 3 and 71%, considering that catalysts make up only 2.65% (1569 tonnes) of the total recycled mass. More significant shares are recorded in the mineral resources’ scarcity category (1.66 kg eq Cu per tonne ELV, 71%) and water consumption (1935 m3 per tonne ELV, 52%) and come from the recovery of rare metals (rhodium, platinum, and palladium), but mainly from stainless-steel convertor cases. Their LCA model considers the state-of-the-art recovery technologies [47,51] and composition data [2]. Recycled plastics bring benefits, especially in the air-pollution-related categories (21% in CC, 48% in OD, and 13% in both ozone-formation-related categories), but also in fossil resources (FOS, 24%). Due to lack of data, liquids recycling was modeled similarly to the energy recovery process, that is, as incineration, which is the current practice for this type of ELV waste. Lastly, battery recycling, which considers the recovery of lead, sulfuric acid, and plastics from cases, leads to some benefits (2–8%) in various categories, but also to negative impacts in FTOX (0.26 kg eq 1,4-DCB, 1.73%), MTOX (0.33 kg eq 1,4-DCB, 1.19%), and HNonC-TOX (4.64 kg eq 1,4-DCB, 1.17%), respectively, due to the lead recovery process.
It should be noted that the profile in Figure 4 presents the actual situation of recycling secondary materials from ELV waste, where the environmental benefits arise from avoiding their actual production, without considering the replacement of primary (virgin) materials. Should this be the case, the avoided burden given by the recovered materials would lead to a reduction in the impacts between 7% in the MTOX and 96.3% in the MIN categories (Figure S1 in Supplementary Material).

3.2.4. ELV Components Reuse

The environmental profile of ELV components reuse is presented in Figure 5. It has a similar complex structure as in the case of recycling, but with some differences.
The major contributors in all categories are still the metal components, with steel (5.2% in ozone depletion and a 69.1% contribution in HC-TOX) and non-ferrous metals (11.2% in ozone depletion and 76.1% in water consumption). In this case, the share of non-ferrous metals is much higher compared with the recycling profile (Figure 4) because components reuse does not include material recycling and recovery processes which, in the case of non-ferrous metals, are energy-intensive and induce a heavy pollution burden. The contribution of polymeric materials is smaller compared, for example, with tire reuse and they only generate benefits of between 0.6% in FTOX and 14.2% in ozone depletion, which is much smaller when compared to recycling. This is due partly to the smaller mass of reused tires, but also to the fact that, here, environmental benefits only stem from material reuse and not energy production. A similar trend is recorded for plastic materials, whose reuse generate benefits in the range of 1 to 26%. It should be noted that modeling the reuse of ELV components is, in fact, a sort of material recycling because their profile only considers benefits that arise from material types based on their share in the total reuse mass and does not account for operations and processes used to fabricate these various reused components (due to a lack of data), nor any other type of valuation is employed.

3.3. Profiles Comparison

In Figure 6a, a comparison of the environmental impacts of the four ELV management routes is presented, and the full details are presented in the Supplementary Material, Table S4. ELV waste recycling has the greatest net environmental benefits in all categories, given its major mass proportion (66,734 tonnes, 79.65%), except for Mineral Resources Scarcity, where ELV component reuse dominates. In fact, ELV component reuse, despite having a relatively low mass flow (4515t, 5.38%), has important contributions in climate change (31%), ozone depletion (52%), and water consumption (71%). Energy recovery has smaller benefits, while landfilling generates negative environmental impacts, especially in climate changes and marine eutrophication.
However, if the same profile is analyzed, but with reference to 1 tonne of treated waste (Figure 6b), it becomes clear that ELV waste reuse generates higher benefits than the other options in many of the impact categories, making it the preferred valorization option for ELV waste. Energy recovery has higher benefits compared to recycling in several categories: in ozone formation (in both human health and ecological compartments), 4.8 and 4.9 kg eq NOx compared to 2.2 kg eq NOx/tonne of treated ELV waste avoided from recycling. An even greater difference is recorded in the Fine Particulate Matter formation, where the energy recovery avoids 2.8 kg eq PM2.5/tonne of treated waste, whereas recycling only accounts for 1.9 kg eq PM2.5. The same trend appears in the terrestrial acidification category, where the energy recovery leads to 16 kg eq SO2 in benefits compared to 4.8 from recycling and in the fossil resources scarcity (800 kg eq oil for energy recovery vs. 330 kg eq oil /tonne treated waste for recycling). An explanation for the better scores of the energy recycling route in these energy-related impact categories is that a better part of them comes from the tire valorization in cement production, which is characterized by very good thermal efficiency and thus leads to more important benefits compared to recycling, where the scores also come from tire recycling (also via cement production) but have a much smaller share in the recycled waste mix. On the other hand, ELV waste recycling has a better performance in the toxicity-related categories which are connected to material processing and recovery: a total of 12,107 kg eq 1,4-DCB/tonne waste is avoided via recycling compared to only 3273.6 kg eq 1,4-DCB via energy recovery. The same holds true for water consumption, where recycling saves 3737 m3 water/tonne of waste and energy recovery only saves 731 m3. One should bear in mind that in this analysis no weighting factors have been applied for these waste treatment options and thus, no prioritization was given to different waste treatment routes. In these conditions, the energy recovery–recycling comparison shows the benefits and burdens of each treatment route and no clear conclusion over one or the other can be drawn. However, if the recycling profile includes benefits from avoiding primary resources (on a 1:1 ratio for metals and 0.85:1 ratio for plastics), the net benefits appear over the energy recovery route in all categories (see Figure S1 in the Supplementary Materials), except for in land use and fossil resources scarcity. As expected, landfilling is the least preferred option, bringing only negative impacts across the whole profile, especially in climate change and marine eco-toxicity due to plastic decomposition during landfilling.

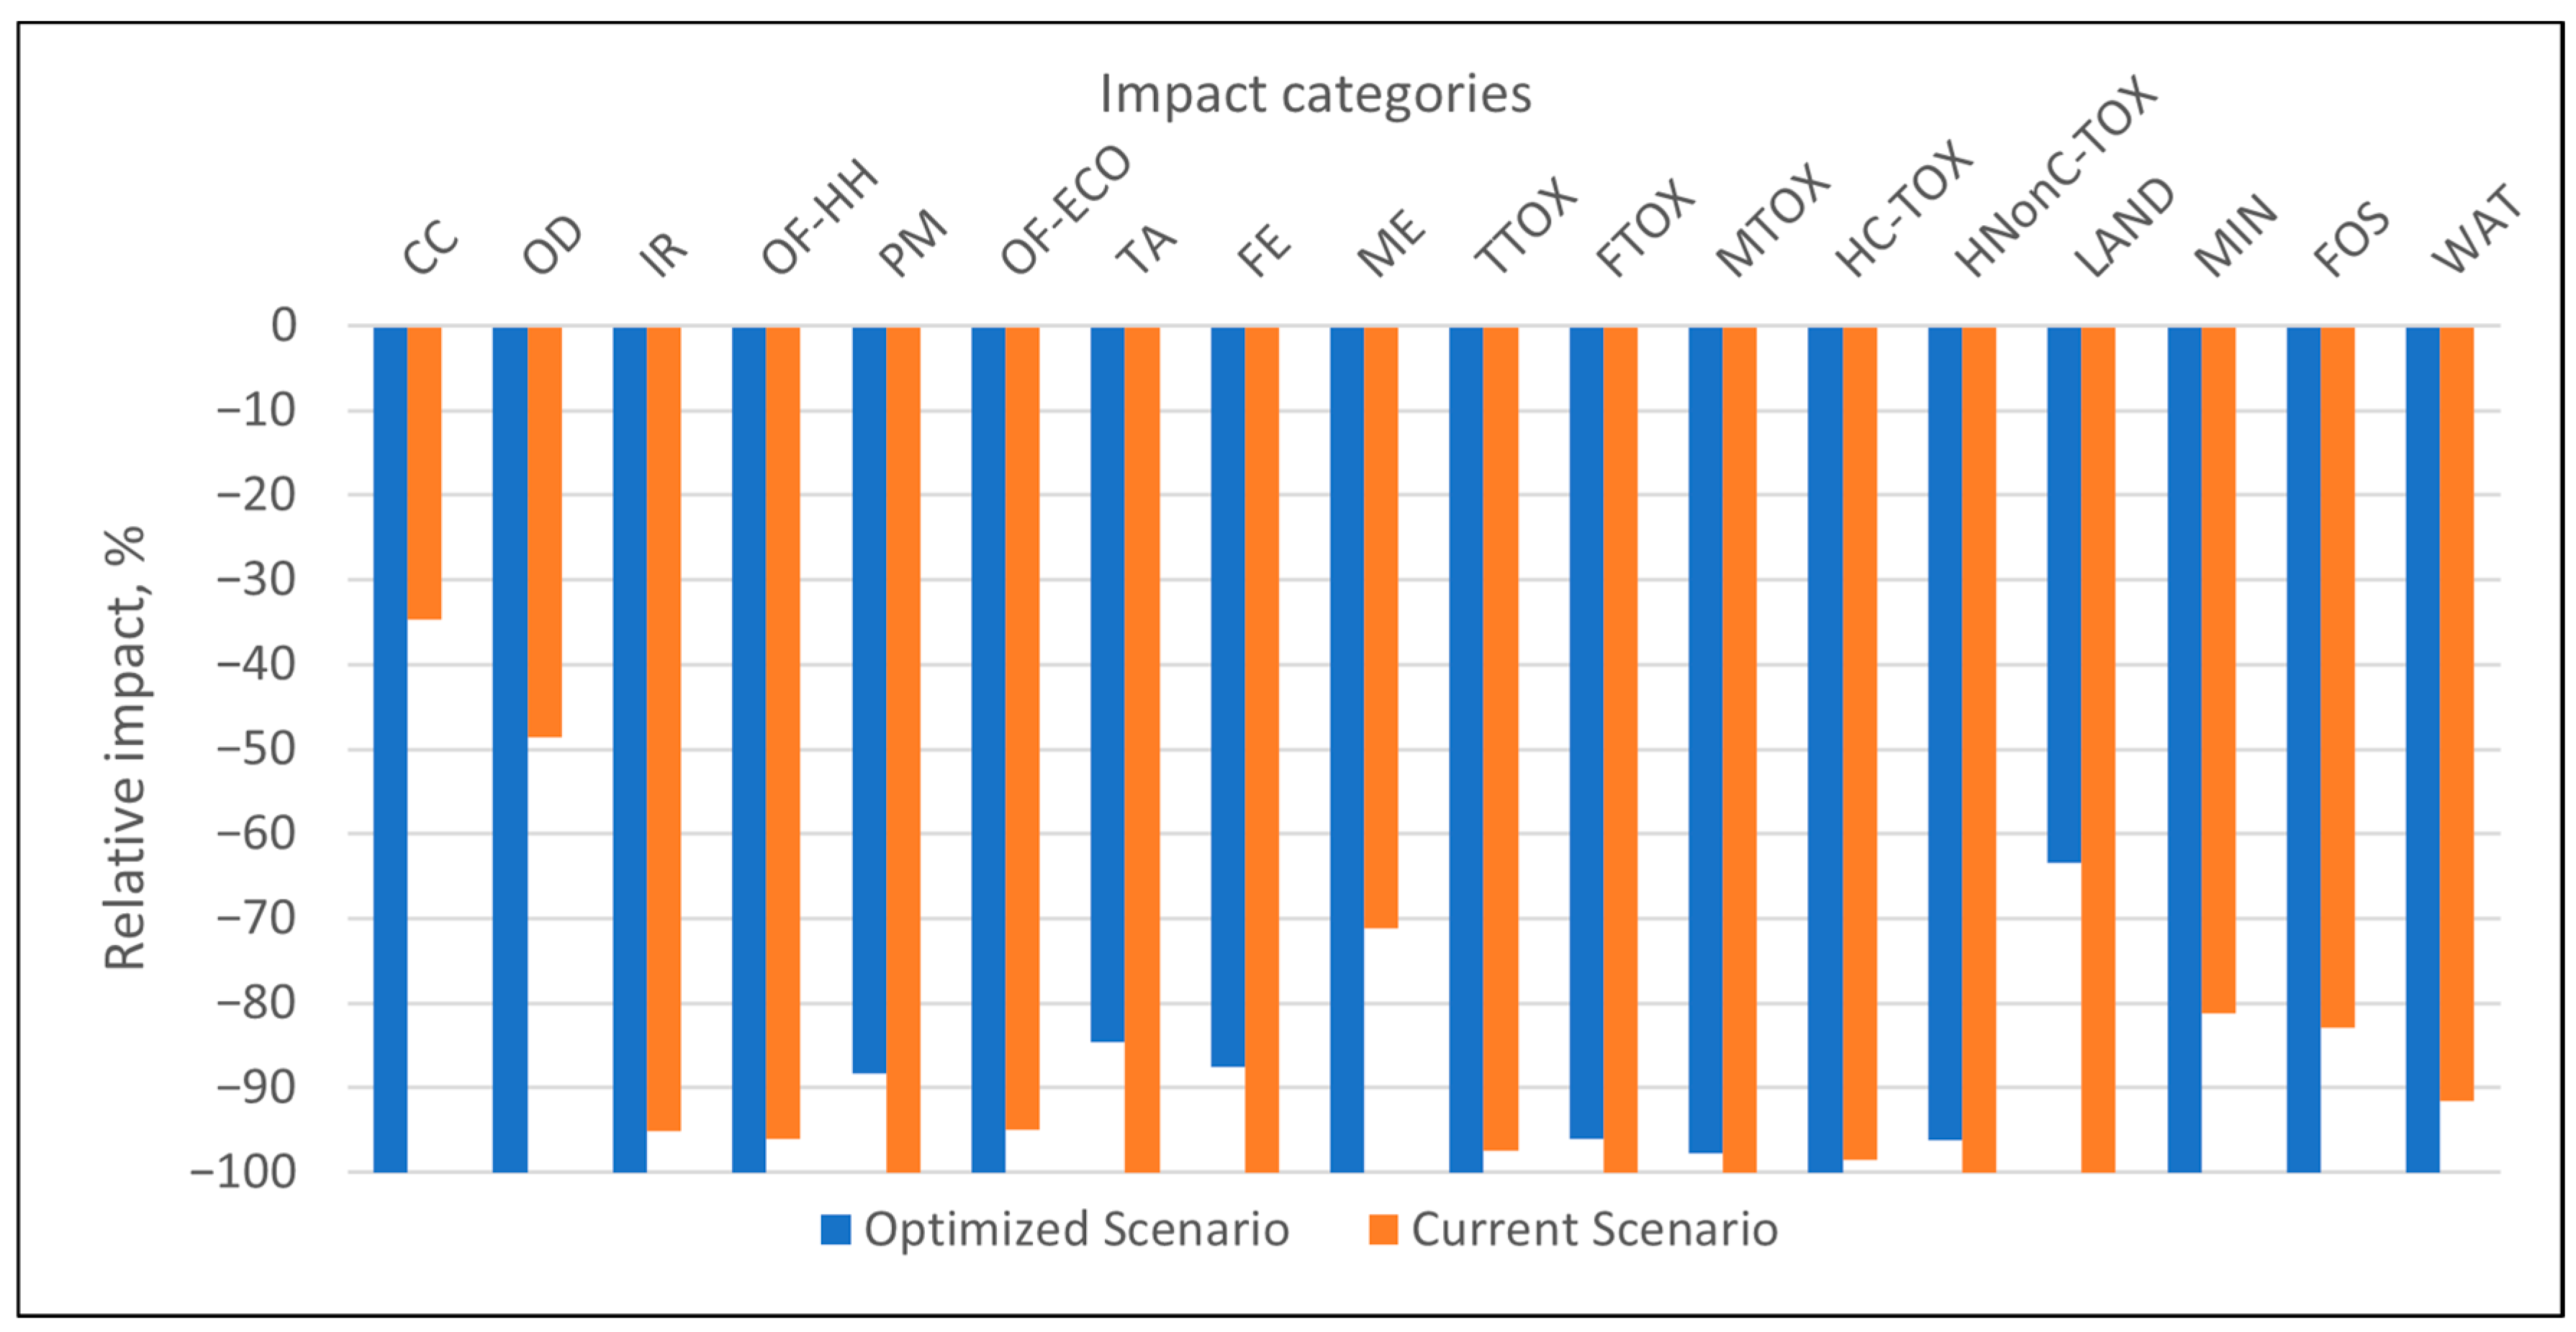
3.4. Environmental Assessment of Future ELV Scenario

As briefly discussed above, although the current practices for ELV management in Romania have led to meeting the current ELV directive targets, and considering the environmental analysis presented in the previous section, as well as the proposed European targets for the minimal recycled content in vehicles, some improvement elements appear as good levers to devise an optimized scenario regarding the ELV management performance in Romania. The system elements have changed to reflect how proposed changes in the European policy will impact the performance of the Romanian ELV system, with reference to minimizing landfilling rates for various ELV streams, as presented in Table 3, and an increased corresponding recycled material content.
This scenario focuses on four major ELV waste streams that are shifted from current landfilling to material recycling: ELV large plastic parts (95% go to recycling, considering better dismantling and sorting procedures), other ELV materials undergo better dismantling and separation practices so 75% are recycled, 70% of the shredder light fraction is recycled (currently, this is registered as other materials from shredding due to contamination with hazardous materials), and improved hazardous waste mitigation through better separation and waste disposal. In the optimized scenario, only 3% of the hazardous materials and 5% of other waste streams (e.g., metals, plastics, etc.) end up in landfilling. No changes were made in the reuse option, mainly because the reused materials are modeled in the LCA as recovered materials, similarly to the recycling processes (minus the recycling burdens).
From an environmental perspective, implementing this scenario led to significant changes in the environmental profile, as presented in Figure 7. Compared to the current scenario in which landfilling has an important contribution, the optimized scenario based on better recycling leads to the improved performance of multiple impact categories. Much better benefits will be encountered in the air-related categories: 65.35% fewer impacts on the climate change category (−650 kg eq CO2 /tonne treated ELV waste) and 51.48% fewer impacts on the ozone depletion category (−0.62 g CFC11 eq/ tonne treated ELV). Also, important positive changes are recorded in the resource-related categories: 18.17% fewer impacts on mineral resources scarcity, −17.15% in fossil resources scarcity, and −8.38% in water consumption. However, implementing these changes leads to fewer environmental benefits compared to the current situation in other categories, of which terrestrial acidification (15%), freshwater eutrophication (12%), and land use (36.5%) have the greatest changes, mainly due to the increased hazardous materials’ quantities sent for incineration.
The implementation of this scenario shows the environmental trade-offs regarding the increased benefits in some categories and the additional burdens in other, suggesting that any decision should be based on additional information or on a prioritization among impacts.

4. Conclusions

This study evaluates the environmental impacts of end-of-life vehicle (ELV) management in Romania by means of an LCA. It focuses on the current environmental performance of ELV waste management practices, and compares it to future scenarios with potential positive changes. The investigation was based on a statistical analysis of retired cars in 2020 and Eurostat data on the ELV waste composition. The results indicate that current practices meet the 85% recovery target, with recycling dominating the recovery methods, accounting for 79.96% of ELV waste treatment, while landfilling accounts for 8.45%. When considering the actual waste streams, ELV waste recycling has the greatest net environmental benefits across most categories, while ELV landfilling has only environmental burdens. In a per tonne of treated waste comparison, ELV component reuse generates the highest benefits compared to other options in most impact categories.
An optimized scenario focusing on minimizing landfilling and increasing recycling points out significant improvements in air-related and resource-related categories, but may increase the impacts in terrestrial acidification, freshwater eutrophication, and land use. This analysis serves as a basis for future research which should include ELV generation dynamics, considering policy changes and consequent automotive market trends, as well as new challenges raised by the transition to electric vehicles.

Supplementary Materials

The following supporting information can be downloaded at: https://www.mdpi.com/article/10.3390/su17083691/s1, Figure S1: Impact comparison of recycled content vs. avoided impacts (per 1 tonne treated waste); Table S1: Romania’s passenger car fleet evolution, Table S2: ReCiPe 2016 impact assessment method categories and indicators; Table S3: Energy recovery from waste incineration; Table S4: ELV waste treatment routes comparison.

Author Contributions

Conceptualization, G.B. and C.T.; Methodology: G.B.; Software, G.B.; Validation: G.B. and C.T.; Formal analysis, F.D.; Investigation, F.D and G.B.; Data curation, F.D.; Writing—original draft: G.B. and F.D.; Writing—review and editing, G.B. and C.T.; Supervision, C.T. All authors have read and agreed to the published version of the manuscript.

Funding

This research received no external funding.

Institutional Review Board Statement

Not applicable.

Informed Consent Statement

Not applicable.

Data Availability Statement

The original contributions presented in the study are included in this article. The data presented in this study are available on request from the corresponding authors.

Conflicts of Interest

The authors declare no conflicts of interest.

Abbreviations

The following abbreviations are used in this manuscript:
ELVEnd-of-life vehicles
ICEVInternal combustion engine vehicle
LCALife-cycle assessment
CCClimate Change (global warming)
ODStratospheric ozone depletion
IRIonizing radiation
OF-HHOzone formation, Human health
PMFine particulate matter formation
OF-ECOOzone formation, Terrestrial ecosystems
TATerrestrial acidification
FEFreshwater eutrophication
MEMarine eutrophication
TTOXTerrestrial ecotoxicity
FTOXFreshwater ecotoxicity
MTOXMarine ecotoxicity
HC-TOHuman carcinogenic toxicity
HNonC-TOXHuman non-carcinogenic toxicity
LANDLand use
MINMineral resource scarcity
FOSFossil resource scarcity
WATWater consumption
ABSAcrylonitrile butadiene styrene
PMMAPolymethyl methacrylate
POMPolyoxymethylene
PVCPolyvinyl chloride
PSPolystyrene
PCPolycarbonate

References

  1. D’Adamo, I.; Gastaldi, M.; Rosa, P. Recycling of End-of-Life Vehicles: Assessing Trends and Performances in Europe. Technol. Forecast. Soc. Chang. 2020, 152, 119887. [Google Scholar] [CrossRef]
  2. Løvik, A.N.; Marmy, C.; Kushnir, D.; Huisman, J.; Maury, T.; Ciuta, T.; Mathieux, F.; Wäger, P. Material Composition Trends in Vehicles: Critical Raw Materials and Other Relevant Metals; European Commission: Brussels, Belgium, 2021; ISBN 9789276452133. [Google Scholar]
  3. Ravina, M.; Bianco, I.; Ruffino, B.; Minardi, M.; Panepinto, D.; Zanetti, M. Hard-to-Recycle Plastics in the Automotive Sector: Economic, Environmental and Technical Analyses of Possible Actions. J. Clean. Prod. 2023, 394, 136227. [Google Scholar] [CrossRef]
  4. Shi, Y.; Zhao, L.; Zheng, J.; Ding, R.; Li, K.; Zhao, H.; Baqar, M.; Zhu, H.; Cheng, Z.; Sun, H. End-of-Life Vehicle Dismantling Activity Emits Large Quantities of Phthalates and Their Alternatives: New Insights on Environmental Sources and Co-Exposure Risks. Environ. Int. 2024, 190, 108933. [Google Scholar] [CrossRef]
  5. Hu, S.; Wen, Z. Monetary Evaluation of End-of-Life Vehicle Treatment from a Social Perspective for Different Scenarios in China. J. Clean. Prod. 2017, 159, 257–270. [Google Scholar] [CrossRef]
  6. European Commission. Impact Assessment Report for the ELV Regulation (Executive Summary); European Commission: Brussels, Belgium, 2023. [Google Scholar]
  7. European Commission. Porposal for a Regulation of the European Parliament and of the Council on Circularity Requirements for Vehicle Design and on Management of End-of-Life Vehicles, Amending Regulations (EU) 2018/858 and 2019/1020 and Repealing Directives 2000/53/EC and 2005; European Commission: Brussels, Belgium, 2023; Volume 0284. [Google Scholar]
  8. Chong, J.Y.; Mat Saman, M.Z.; Ngadiman, N.H.A. End-of-Life Vehicles Research Development in Malaysia: A Comprehensive Review with the Integrated Conceptual Model of Innovative Sustainable Manufacturing Elements. J. Mater. Cycles Waste Manag. 2023, 25, 698–716. [Google Scholar] [CrossRef]
  9. Karagoz, S.; Aydin, N.; Simic, V. End-of-Life Vehicle Management: A Comprehensive Review. J. Mater. Cycles Waste Manag. 2020, 22, 416–442. [Google Scholar] [CrossRef]
  10. European Parliament. Council of the European Union Directive 2000/53/EC of the European Parliament and of the Council of 18 September 2000 on End-of Life Vehicles—Commission Statements. Off. J. Eur. Union 2000, 269, 34. Available online: https://eur-lex.europa.eu/legal-content/EN/ALL/?uri=CELEX:32000L0053 (accessed on 21 February 2025).
  11. Baron, Y.; Kosińska-Terrade, I.; Loew, C.; Köhler, A.; Moch, K.; Sutter, J.; Graulich, K.; Adjei, F.; Mehlhart, G. Study to Support the Impact Assessment for the Review of Directive 2000/53/EC on End-of-Life Vehicles—Final Report; Publications Office of the European Union: Brussels, Belgium, 2023. [Google Scholar]
  12. European Parliament, Council of the European Union. Directive 2005/64/EC of the European Parliament and of the Council of 26 October 2005 on the type-approval of motor vehicles with regard to their reusability, recyclability and recoverability and amending Council Directive 70/156/EEC. Off. J. Eur. Union 2005, 56, 10–27. Available online: https://eur-lex.europa.eu/legal-content/EN/TXT/?uri=OJ:L:2005:310:TOC (accessed on 21 February 2025).
  13. Tazi, N.; Orefice, M.; Marmy, C.; Baron, Y.; Ljunggren, M.; Wäger, P.; Mathieux, F. Initial Analysis of Selected Measures to Improve the Circularity of Critical Raw Materials and Other Materials in Passenger Cars; Publications Office of the European Union: Luxembourg, 2023. [Google Scholar]
  14. Zhou, F.; Lim, M.K.; He, Y.; Lin, Y.; Chen, S. End-of-Life Vehicle (ELV) Recycling Management: Improving Performance Using an ISM Approach. J. Clean. Prod. 2019, 228, 231–243. [Google Scholar] [CrossRef]
  15. Staniszewska, E.; Klimecka-Tatar, D.; Obrecht, M. Eco-Design Processes in the Automotive Industry. Prod. Eng. Arch. 2020, 26, 131–137. [Google Scholar] [CrossRef]
  16. Anselma, P.G.; Belingardi, G. Comparing Battery Electric Vehicle Powertrains through Rapid Component Sizing. Int. J. Electr. Hybrid Veh. 2019, 11, 36–58. [Google Scholar] [CrossRef]
  17. Jung, H. Fuel Economy of Plug-In Hybrid Electric and Hybrid Electric Vehicles: Effects of Vehicle Weight, Hybridization Ratio and Ambient Temperature. World Electr. Veh. J. 2020, 11, 31. [Google Scholar] [CrossRef]
  18. Mierlo, J. Van Special Issue “Plug-In Hybrid Electric Vehicle (PHEV)”. Appl. Sci. 2019, 9, 2829. [Google Scholar] [CrossRef]
  19. Yang, Z.; Wang, B.; Jiao, K. Life Cycle Assessment of Fuel Cell, Electric and Internal Combustion Engine Vehicles under Different Fuel Scenarios and Driving Mileages in China. Energy 2020, 198, 117365. [Google Scholar] [CrossRef]
  20. Alvarez-Meaza, I.; Zarrabeitia-Bilbao, E.; Rio-Belver, R.M.; Garechana-Anacabe, G. Fuel-Cell Electric Vehicles: Plotting a Scientific and Technological Knowledge Map. Sustainability 2020, 12, 2334. [Google Scholar] [CrossRef]
  21. Zhang, L.; Ji, K.; Liu, W.; Cui, X.; Liu, Y.; Cui, Z. Collaborative Approach for Environmental and Economic Optimization Based on Life Cycle Assessment of End-of-Life Vehicles’ Dismantling in China. J. Clean. Prod. 2020, 276, 124288. [Google Scholar] [CrossRef]
  22. Purwani, A.; Sutopo, W.; Hisjam, M.; Widiyanto, A. Approach For Determining Cut-off Values For Electric Motorcycle Swap Battery Before The End-of-Life In The Recycling Classification. J. Appl. Sci. Eng. 2025, 28, 811–820. [Google Scholar] [CrossRef]
  23. Lu, Y.; Wang, J. Life Cycle Assessment for Spent Lithium-Ion Batteries’ Recycling Process: Environmental Impact, Energy Consumption, and Sensitivity Analysis. ACS Sustain. Chem. Eng. 2024, 12, 12966–12975. [Google Scholar] [CrossRef]
  24. Chayutthanabun, A.; Chinda, T.; Papong, S. End-of-Life Management of Electric Vehicle Batteries Utilizing the Life Cycle Assessment. J. Air Waste Manag. Assoc. 2025, 75, 131–143. [Google Scholar] [CrossRef]
  25. Liu, C.; Ren, J.; Hu, Y.; Song, J.; Yang, W. Future Projections and Life Cycle Assessment of End-of-Life Tires to Energy Conversion in Hong Kong: Environmental, Climate and Energy Benefits for Regional Sustainability. Sustain. Prod. Consum. 2025, 55, 328–339. [Google Scholar] [CrossRef]
  26. Mügge, J.; Seegrün, A.; Faßbender, L.; Riedelsheimer, T.; Staufenbiel, P.; Lindow, K. Integrated Consideration of Data Flows and Life Cycle Assessment in Vehicle Dismantling Processes. Procedia CIRP 2024, 122, 1018–1023. [Google Scholar] [CrossRef]
  27. Ahmed, S.; Ahmed, S.; Shumon, M.R.H.; Falatoonitoosi, E.; Quader, M.A. A Comparative Decision-Making Model for Sustainable End-of-Life Vehicle Management Alternative Selection Using AHP and Extent Analysis Method on Fuzzy AHP. Int. J. Sustain. Dev. World Ecol. 2016, 23, 83–97. [Google Scholar] [CrossRef]
  28. dos Santos Soares, T.; Silva, M.M.; Santos, S.M. A Hybrid Grey-DEMATEL Approach to Identify Barriers to the Implementation of an End-of-Life Vehicle Management System in Brazil. J. Clean. Prod. 2023, 386, 135791. [Google Scholar] [CrossRef]
  29. Rosa, P.; Terzi, S. Improving End of Life Vehicle’s Management Practices: An Economic Assessment through System Dynamics. J. Clean. Prod. 2018, 184, 520–536. [Google Scholar] [CrossRef]
  30. Anthony, C.; Cheung, W.M. Cost Evaluation in Design for End-of-Life of Automotive Components. J. Remanuf. 2017, 7, 97–111. [Google Scholar] [CrossRef]
  31. DGPCI – General Directorate for Driving Licenses and Registrations of Ministry of Internal Affairs (Directia Generala Permise de Conducere si Inmatriculari a Ministerului Afacerilor Interne). National Automotive Park Statistics at 31 December 2014. Available online: https://dgpci.mai.gov.ro/news-details/statistica/6790c7e978b3ca04620e1e29 (accessed on 20 March 2025).
  32. Barjoveanu, G.; Dinita, F.; Teodosiu, C. Aging Passenger Car Fleet Structure, Dynamics, and Environmental Performance Evaluation at the Regional Level by Life Cycle Assessment. Sustainability 2022, 14, 8443. [Google Scholar] [CrossRef]
  33. EUROSTAT. Manual for the Implementation of Regulation (EC) No 2150/2002 on Waste Statistics, 2024 Edition; EUROSTAT: Luxemburg, 2024. [Google Scholar]
  34. European Commission. Annex V. Waste subject to the export prohibition in article 36 introductory notes. Off. J. Eur. Union 2006, C 272E, 49, 123–170. Available online: https://eur-lex.europa.eu/legal-content/EN/TXT/?uri=OJ:C:2006:272E:TOC (accessed on 21 February 2025).
  35. Sander, K.; Schilling, S.; Lüskow, H.; Gonser, J.; Schwedtje, A.; Küchen, V. Review of the European List of Waste; European Commission: Brussels, Belgium, 2008; p. 532. [Google Scholar]
  36. Nis, R. TRN103C—Registered Road Vehicles (End of the Year), by Groups of Age Data Set. Available online: http://statistici.insse.ro:8077/tempo-online/#/pages/tables/insse-table (accessed on 21 February 2025).
  37. ISO 14040; Environmental Management—Life Cycle Assessment—Part 1: Principles and Framework. International Organization for Standardization: Geneva, Switzerland, 2006; Volume 3.
  38. Huijbregts, M.A.J.; Steinmann, Z.J.N.; Elshout, P.M.F.; Stam, G.; Verones, F.; Vieira, M.D.M.; Hollander, A.; Zijp, M.; van Zelm, R. ReCiPe 2016 v1.1; National Institute for Public Health and the Environment: Bilthoven, The Netherlands, 2017. [Google Scholar]
  39. Greer, E.L.; Brunet, A. Different Dietary Restriction Regimens Extend Lifespan by Both Independent and Overlapping Genetic Pathways in C. Elegans. Aging Cell 2009, 8, 113–127. [Google Scholar] [CrossRef]
  40. ERTMA. New End-of-Life Tyres Statistics for 2020 and 2021. ERTMA—European Tyre & Rubber Manufacturers Association. Available online: https://www.etrma.org/news/new-end-of-life-tyre-statistics-2020-2021/ (accessed on 20 February 2025).
  41. ERTMA. ERTMA Consolidated Data Report on the Management of End of Life Tyres ( ELTs ) in Europe; ERTMA—European Tyre & Rubber Manufacturers Association: Brussels, Belgium, 2021. [Google Scholar]
  42. UBA. End-of-Life Vehicle Reuse/Recycling/Recovery Rates in Germany for 2008 Pursuant to Art. 7 (2) of the End-of-Life Vehicles Directive 2000/53/EC Country: Germany; UBA—Umwelt Bundesamt: Dessau-Roßlau, Germany, 2015. [Google Scholar]
  43. Maga, D.; Aryan, V.; Blömer, J. A Comparative Life Cycle Assessment of Tyre Recycling Using Pyrolysis Compared to Conventional End-of-Life Pathways. Resour. Conserv. Recycl. 2023, 199, 107255. [Google Scholar] [CrossRef]
  44. Bianco, I.; Panepinto, D.; Zanetti, M. End-of-life Tyres: Comparative Life Cycle Assessment of Treatment. Appl. Sci. 2021, 11, 3599. [Google Scholar] [CrossRef]
  45. Betke, U.; Lieb, A. Micro-Macroporous Composite Materials—Preparation Techniques and Selected Applications: A Review. Adv. Eng. Mater. 2018, 20, 1–28. [Google Scholar] [CrossRef]
  46. Amatayakul, W.; Ramnäs, O. Life Cycle Assessment of a Catalytic Converter for Passenger Cars. J. Clean. Prod. 2001, 9, 395–403. [Google Scholar] [CrossRef]
  47. Ghodrat, M.; Rhamdhani, M.A.; Sharafi, P.; Samali, B. A Comparative Life Cycle Assessment of Recycling the Platinum Group Metals from Automobile Catalytic Converter: An Australian Perspective. Metall. Mater. Trans. E 2017, 4, 77–88. [Google Scholar] [CrossRef]
  48. Unterreiner, L.; Jülch, V.; Reith, S. Recycling of Battery Technologies—Ecological Impact Analysis Using Life Cycle Assessment (LCA). Energy Procedia 2016, 99, 229–234. [Google Scholar] [CrossRef]
  49. Sebola, M.R.; Mativenga, P.T.; Pretorius, J. A Benchmark Study of Waste Tyre Recycling in South Africa to European Union Practice. Procedia CIRP 2018, 69, 950–955. [Google Scholar] [CrossRef]
  50. Handbook of Environmental Engineering Calculations, 2nd ed.; Lee, C.C., Lin, S.D., Eds.; McGraw-Hill Education: New York, NY, USA, 2007; ISBN 9780071475839. [Google Scholar]
  51. Hagelüken, C. Closing the Loop—Recycling of Automotive Catalysts. Metall 2007, 61, 24–39. [Google Scholar]
Figure 1. ELV waste treatment research methodology.
Sustainability 17 03691 g001
Figure 2. Environmental profile of landfilling ELV waste (CC—Climate Change (global warming), OD—Stratospheric ozone depletion, IR—Ionizing radiation, OF-HH—Ozone formation, Human health, PM—Fine particulate matter formation, OF-ECO—Ozone formation, Terrestrial ecosystems, TA—Terrestrial acidification, FE—Freshwater eutrophication, ME—Marine eutrophication, TTOX—Terrestrial ecotoxicity, FTOX—Freshwater ecotoxicity, MTOX—Marine ecotoxicity, HC-TOX—Human carcinogenic toxicity, HNonC-TOX—Human non-carcinogenic toxicity, LAND—Land use, MIN—Mineral resource scarcity, FOS—Fossil resource scarcity, WAT—Water consumption).
Sustainability 17 03691 g002
Figure 3. Environmental profile of energy recovery of ELV wastes (CC—Climate Change (global warming), OD—Stratospheric ozone depletion, IR—Ionizing radiation, OF-HH—Ozone formation, Human health, PM—Fine particulate matter formation, OF-ECO—Ozone formation, Terrestrial ecosystems, TA—Terrestrial acidification, FE—Freshwater eutrophication, ME—Marine eutrophication, TTOX—Terrestrial ecotoxicity, FTOX—Freshwater ecotoxicity, MTOX—Marine ecotoxicity, HC-TOX—Human carcinogenic toxicity, HNonC-TOX—Human non-carcinogenic toxicity, LAND—Land use, MIN—Mineral resource scarcity, FOS—Fossil resource scarcity, WAT—Water consumption).
Sustainability 17 03691 g003
Figure 4. Environmental profile of ELV waste recycling (CC—Climate Change (lobal warming), OD—Stratospheric ozone depletion, IR—Ionizing radiation, OF-HH—Ozone formation, Human health, PM—Fine particulate matter formation, OF-ECO—Ozone formation, Terrestrial ecosystems, TA—Terrestrial acidification, FE—Freshwater eutrophication, ME—Marine eutrophication, TTOX—Terrestrial ecotoxicity, FTOX—Freshwater ecotoxicity, MTOX—Marine ecotoxicity, HC-TOX—Human carcinogenic toxicity, HNonC-TOX—Human non-carcinogenic toxicity, LAND—Land use, MIN—Mineral resource scarcity, FOS—Fossil resource scarcity, WAT—Water consumption).
Sustainability 17 03691 g004
Figure 5. ELV component reuse profile (CC—Climate Change (global warming), OD—Stratospheric ozone depletion, IR—Ionizing radiation, OF-HH—Ozone formation, Human health, PM—Fine particulate matter formation, OF-ECO—Ozone formation, Terrestrial ecosystems, TA—Terrestrial acidification, FE—Freshwater eutrophication, ME—Marine eutrophication, TTOX—Terrestrial ecotoxicity, FTOX—Freshwater ecotoxicity, MTOX—Marine ecotoxicity, HC-TOX—Human carcinogenic toxicity, HNonC-TOX—Human non-carcinogenic toxicity, LAND—Land use, MIN—Mineral resource scarcity, FOS—Fossil resource scarcity, WAT—Water consumption).
Sustainability 17 03691 g005
Figure 6. ELV waste treatment route comparison ((a). considering actual mass flows and (b). considering 1 tonne of each treatment route) (CC—Climate Change (global warming), OD—Stratospheric ozone depletion, IR—Ionizing radiation, OF-HH—Ozone formation, Human health, PM—Fine particulate matter formation, OF-ECO—Ozone formation, Terrestrial ecosystems, TA—Terrestrial acidification, FE—Freshwater eutrophication, ME—Marine eutrophication, TTOX—Terrestrial ecotoxicity, FTOX—Freshwater ecotoxicity, MTOX—Marine ecotoxicity, HC-TOX—Human carcinogenic toxicity, HNonC-TOX—Human non-carcinogenic toxicity, LAND—Land use, MIN—Mineral resource scarcity, FOS—Fossil resource scarcity, WAT—Water consumption).
Sustainability 17 03691 g006
Figure 7. ELV waste treatment scenario comparison (CC—Climate Change (global warming), OD—Stratospheric ozone depletion, IR—Ionizing radiation, OF-HH—Ozone formation, Human health, PM—Fine particulate matter formation, OF-ECO—Ozone formation, Terrestrial ecosystems, TA—Terrestrial acidification, FE—Freshwater eutrophication, ME—Marine eutrophication, TTOX—Terrestrial ecotoxicity, FTOX—Freshwater ecotoxicity, MTOX—Marine ecotoxicity, HC-TOX—Human carcinogenic toxicity, HNonC-TOX—Human non-carcinogenic toxicity, LAND—Land use, MIN—Mineral resource scarcity, FOS—Fossil resource scarcity, WAT—Water consumption).
Sustainability 17 03691 g007
Table 1. ELV generation and treatment in Romania (2020).
Waste TypeGenerated
(Tonnes/%)
Disposal
(Tonnes/%)
Recovered
(Tonnes/%)
Energy Recovery
(Tonnes/%)
Recycled
(Tonnes/%)
Reused
(Tonnes/%)
2 = 3 + 4 + 7 3 4 = 5 + 6 5 6 7
Waste arising only from ELV Vehicles83,782707972,188519866,9914515
100%8.45%86.16%6.20%79.96%5.39%
Waste from dismantling and depollution of ELV, of which:74,273525964,499519859,3014515
100%7.08%86.84%7.00%79.84%6.08%
Liquids (excluding fuel) 35764993048746230228
100%13.97%85.24%20.86%64.38%0.80%
ELV tires11,56145210,74838856863361
100%3.91%92.97%33.60%59.36%3.12%
ELV oil filters3004625442500
100%15.21%84.79%1.34%83.45%0.00%
ELV other materials arising from depollution (excluding fuel) 12303229083465610
100%26.17%73.80%28.17%45.63%0.03%
ELV metal components 40,99826437,812237,8102922
100%0.64%92.23%0.01%92.22%7.13%
ELV large plastic parts26847471808571751128
100%27.83%67.38%2.12%65.26%4.78%
ELV glass140910312493124557
100%7.33%88.60%0.23%88.37%4.07%
ELV other materials arising from dismantling 6066249126871382549887
100%41.07%44.30%2.27%42.03%14.63%
Batteries and accumulators4816326441616440074
100%6.78%91.69%0.34%91.35%1.53%
Catalysts1634815690156957
100%0.46%96.03%0.01%96.03%3.50%
Waste arising from ELV shredding, of which: 92741820745407454
100%19.62%80.38%0%80.38%0%
Ferrous scrap (steel) from shredding725307253 7253
100%0%100%0%100%0%
Non-ferrous materials (aluminum, copper, zinc, lead, etc.) from shredding2000200 200
100%0%100%0%100%0%
Shredder Light Fraction (SLF)00000
0%0%0%0%0%
Other materials arising from shredding18201820000
100%100%0%0%0%0%
End-of-life vehicles exported2360236 236
0%100%0%0%100%
Table 2. Waste LCI modeling details.
Waste Treatment Operation/Treated Waste FlowModeling Details/Recovered Materials (Energy)References
Reuse and RecyclingReuse and recycling consider the recovery of various secondary materials. Reuse (4515 tonnes, 5.38%). Recycling (59,301 tonnes + 7454 tonnes shredded, 79.64%), of which:-
Metal components (63.7%)Secondary materials recovery: 85% steel, 15% non-ferrous metals, of which 88.3% secondary aluminum, 11.7% secondary copper
Non-ferrous metals only consider Al and Cu, other species were not modeled due to lack of data for their fate in recycled materials.
[2,42]
TiresSecondary materials recovered in the reuse track: rubber, steel
Energy recovery in the recycling track, modeled as above [41].
[43,44]
Other materials from dismantlingSecondary materials: 50% metals, 50% plastic materials-
Large plastic parts and other plastic materialsPlastic materials composition (wt%): Polypropylene 37%, Polyurethane 15%, polyacetate 12%, Polyethylene 8%, Polyethylene terephthalate 7%, ABS 7%, others (PMMA, POM, PVC, PS, PC, etc.) 16%[45]
Catalytic convertorsSecondary materials recovery: stainless steel, platinum group metals
Composition considering: average mass/unit: 7.1 kg, 5 kg stainless steel case, 2 kg ceramic monolith, rare metals composition: Rhodium 0.125 g/ELV unit, Palladium 0.125g/ELV unit, Platinum 1.75 g/ELV unit
[2,46,47]
BatteriesLead acid battery composition modeled for a 60 Ah battery weighing 16.6 kg: 25% lead, 35% lead oxides, 10% sulfuric acid, 16% water, 10% PP, 1% glass, 1% antimony
Secondary materials recovered: secondary lead, sulfuric acid, polypropilene
[48]
LiquidsLiquids (excluding fuels) composition based on own assumption considering typical liquid volumes in a medium-class vehicle: 46% motor oil, hydraulic oil and brake fluid, 50% coolant, 4% refrigerants. Recovered in reuse: mineral oils. -
GlassSecondary materials recovery, 100% recovery rate-
Energy recovery:Energy recovery, 5198 tonnes, 6.20%-
TiresTires energetic recovery is modeled as an input in cement production, where they contribute as fuel. Tire composition as described above, net heat production, calorific values, and energy efficiency were accounted for, as well as pollution outputs [40,49,50]
Large plastic parts and other plastic materialsPlastic mix composition as above
Energy recovery was modeled based on an existing incineration process with particularized thermal characteristics for calorific values, and energy efficiencies for each plastic stream. Pollutant emissions and incineration waste were accounted for based on default treatment technologies available in Ecoinvent databases
-
Catalytic convertors, metals, batteries These flows were modeled as hazardous material incineration without energy recovery-
DisposalDisposal, 7079 tonnes, 8.44%
ELV waste composition as described above
Disposal of materials considers default landfilling processes for materials presented in Table 1. Landfilling is modeled considering Ecoinvent 3.3. default emissions, waste stabilization, and other specific burdens associated with landfilling.
-
Table 3. Changes in ELV management options.
ELV Treatment OptionOriginal (2020)
Tonnes (%) *
Recycled-Oriented Scenario (Optimized)
Tonnes (%) *
Change %
Landfilling7079 (8.45%)2380 (2.84%)−66.3%
Material recycling66,755 (79.96%)71,260 (85.45%)+6.3%
Energy recovery5198 (6.2%)5377 (6.41%)+3.44%
Reuse 4515 (5.39%)4515 (5.38%)0%
Exported ELV236 (0.28%)236 (0.28%)0%
Total83,78283,7820%
Total recovery (recycling + energy recovery)86.16%91.86%+5.7
Total valorization (recycling +energy recovery + reuse)91.27%97.14%+5.87
Note: * of total waste.
Disclaimer/Publisher’s Note: The statements, opinions and data contained in all publications are solely those of the individual author(s) and contributor(s) and not of MDPI and/or the editor(s). MDPI and/or the editor(s) disclaim responsibility for any injury to people or property resulting from any ideas, methods, instructions or products referred to in the content.

