
Travel Characteristics and Cost–Benefit Analysis of Bikeshare Service on University Campuses

Abstract
1. Introduction
2. Data Collection and Analysis
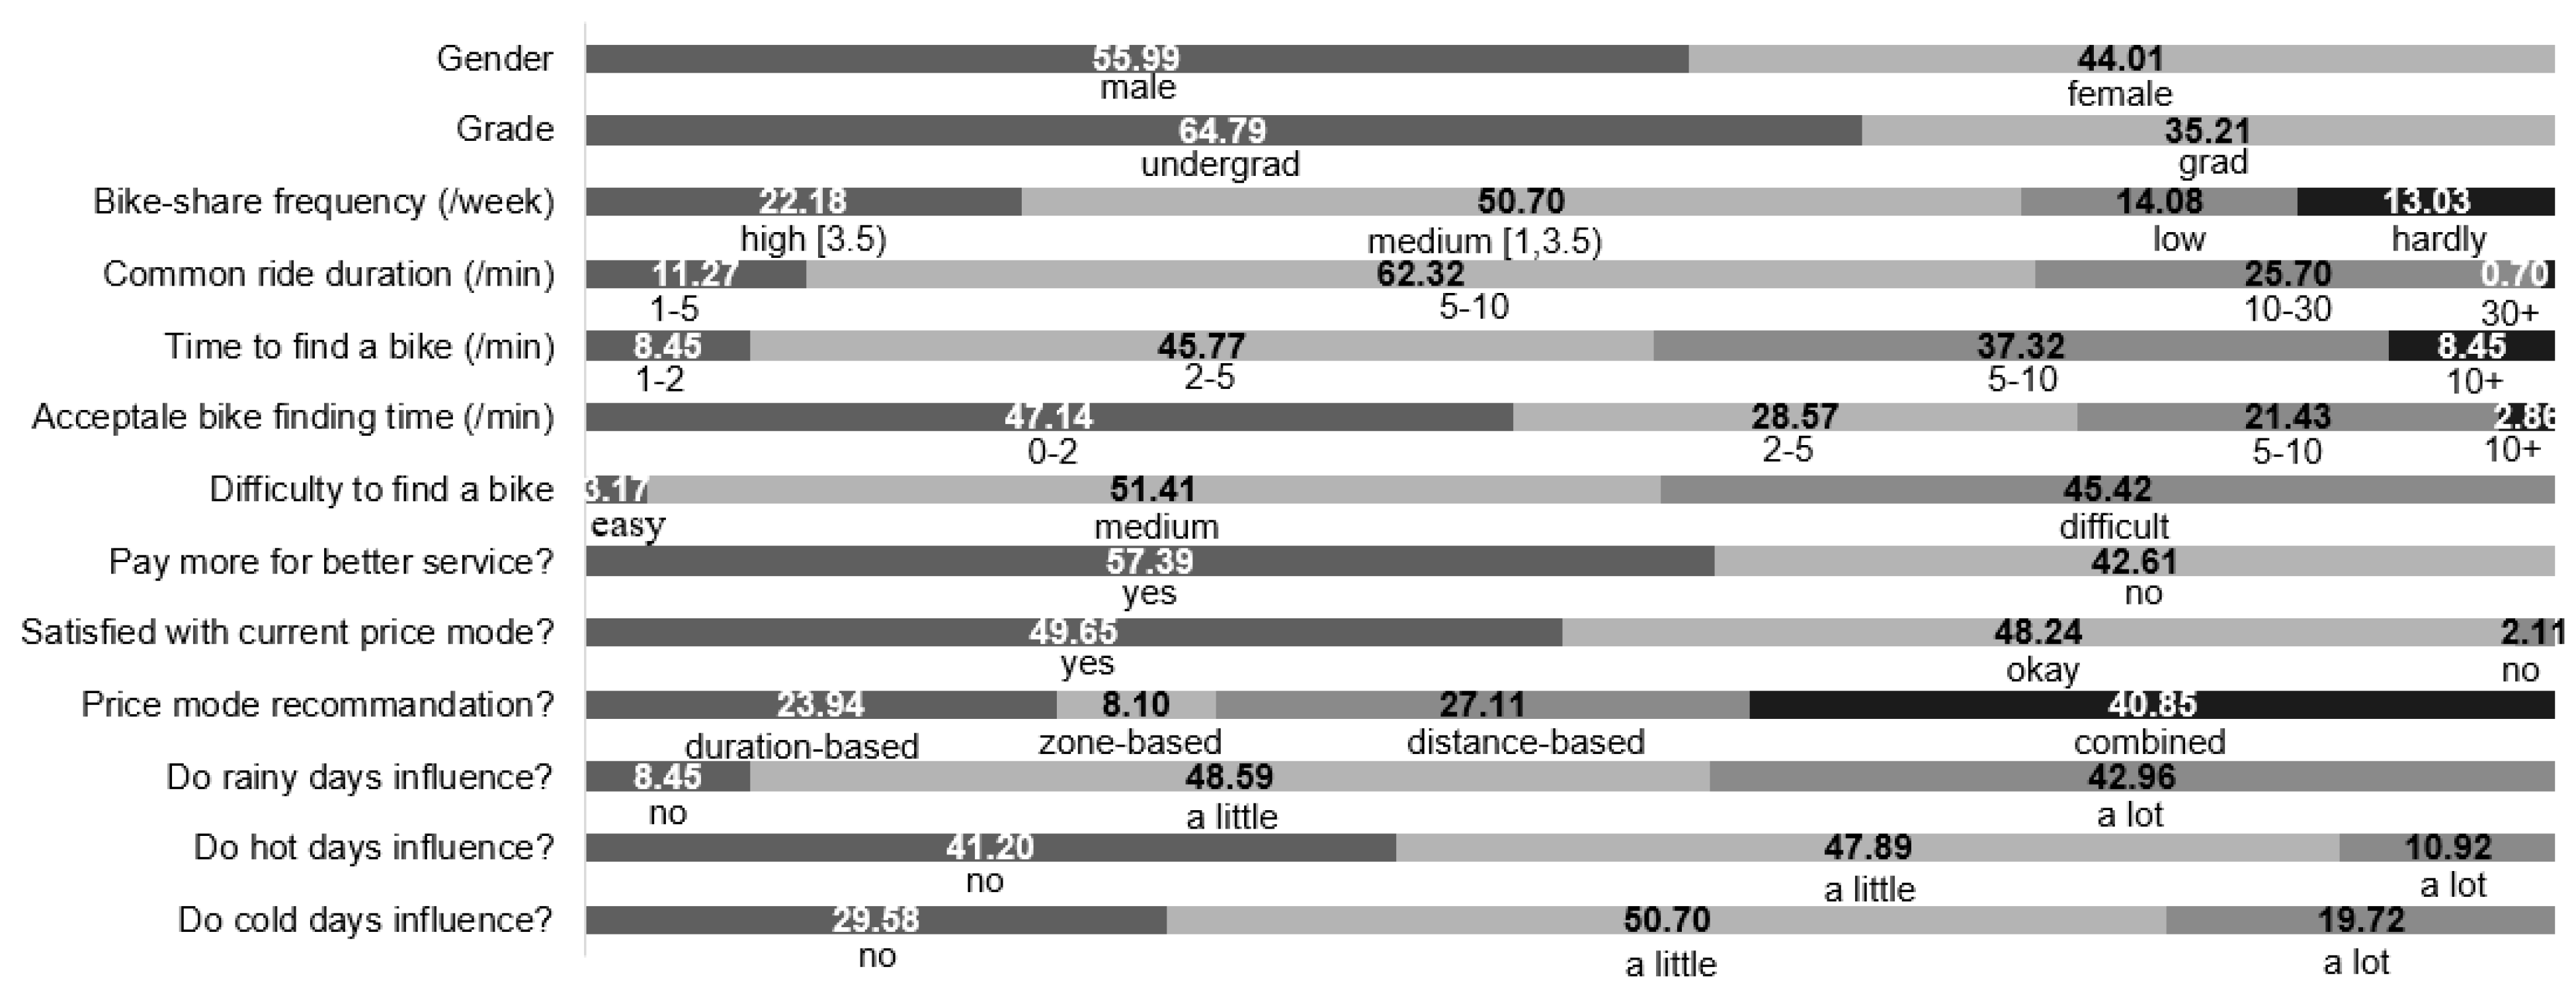
- Travel characteristics: 50.70% of the respondents used shared bikes with medium frequency (equal or more than 1 time but less than 3.5 times per week), and mainly for short-time riding (5–10 min, 62.32%).
- Bikes access: only 3.17% of the respondents find it easy to obtain an available bike, and spent an average of 5.5 min.
- Usage challenges: the inability to locate a bike (85.56%), bike damage (59.86%), and inaccurate bike positioning (28.17%). Additionally, weather-related factors such as rainfall (42.96%), low temperature (19.72%), and high temperature (10.92%) also play a significant role in adversely impacting the service.
- Non-users: The three main reasons for not using the bike-sharing service are owning a private bicycle (63.55%), difficulty in finding a shared bike (43.93%), or the complex registration process (24.3%). Additionally, relatively minor reasons include discomfort during rides (8.41%), high fares (7.48%), lack of bike-riding experience (7.48%), and poor road facilities (4.67%). In conclusion, inadequate bike deployment and untimely maintenance are the key factors contributing to low usage. Furthermore, respondents who own bicycles are primarily senior students (60.29%), and they do not use shared bicycles due to the short traveling time and insufficient vehicle availability.
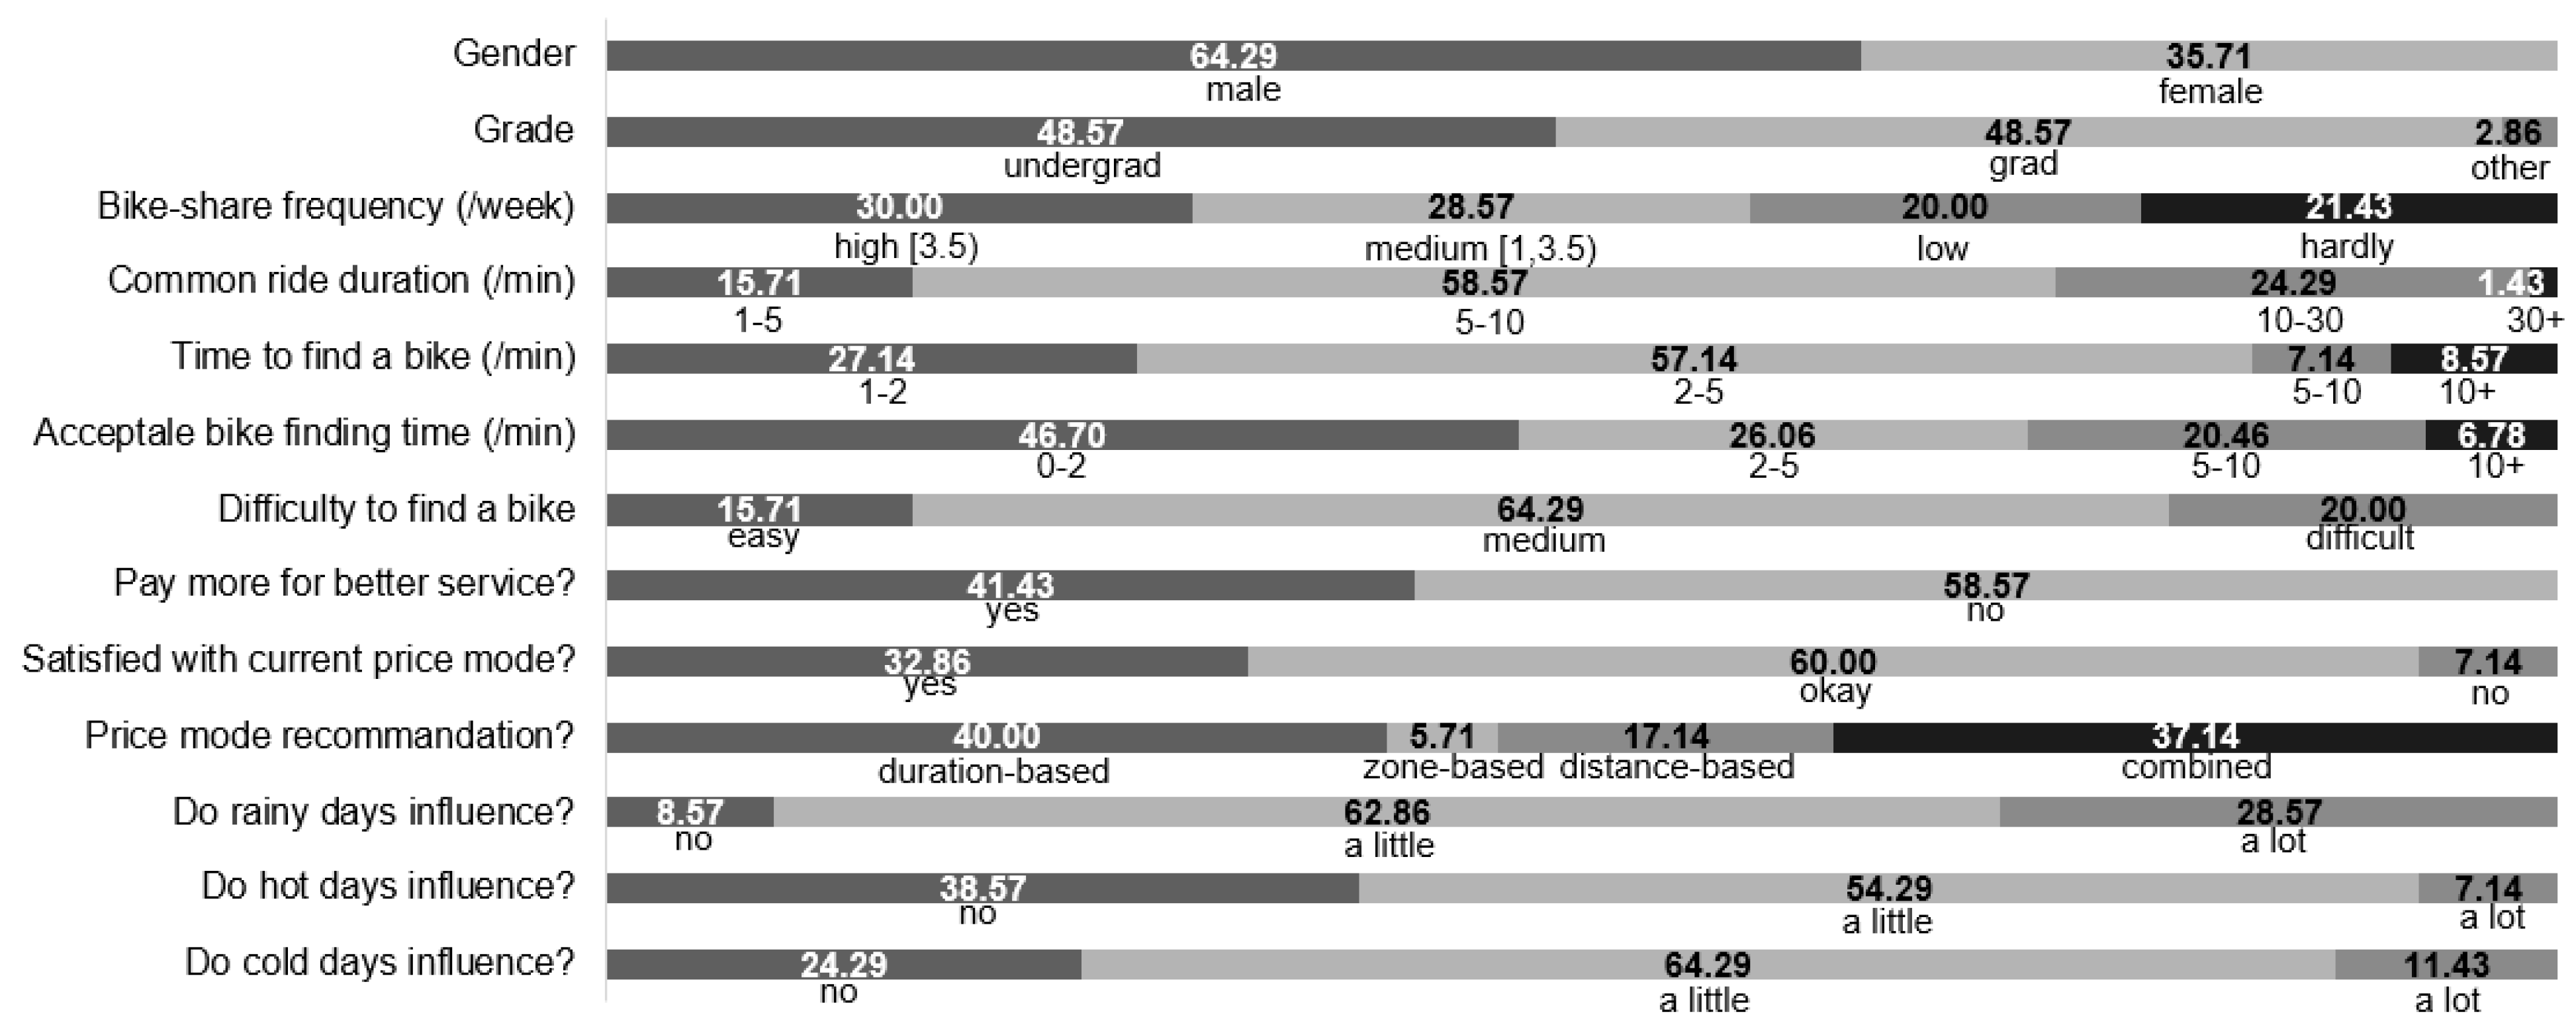
- Comparative analysis: After four years of the BSP operation, the difficulty finding available bikes has decreased from 45.42% to 20%, and the proportion of respondents with high-frequency usage has increased from 22.18% to 30%. However, it is worth noting that the proportion of respondents who almost never use shared bikes has also risen from 13.03% to 21.43%. This may be attributed to students purchasing their own bikes after enrollment and the pricing model. In terms of price factors, the proportion of respondents satisfied with the pricing has decreased from 49.65% to 32.86%, while the proportion of dissatisfied respondents has increased from 2.11% to 7.14%. With the promotion of the BSP, the majority of travelers (40%) have increasingly favored a pricing model based on usage duration.
3. Travel Frequency Analysis
3.1. Key Influencing Factors
3.2. Travel Frequency Prediction Model
- Trip purpose (x3): Compared with urgent or temporary travelers (reference category), short-distance travelers have significantly higher odds of being medium- and high-frequency bikeshare travelers, with p2/p1 and p3/p1 being = 2.211 and = 2.863 times that of urgent travelers, respectively.
- Sensitivity to rainfall (x10): Compared with the travelers who are more sensitive to rainfall (give up using, reference category), the insensitive travelers (continue when not serious) have significantly lower odds of being medium-frequency travelers, with p2/p1 being times that of the sensitive travelers. However, no significant difference in the odds of being high-frequency travelers (p3/p1) is observed. With the equality constraint of Equation (3), this indicates that, compared with sensitive travelers, rainfall-insensitive travelers have a higher probability of being low- and high-frequency travelers (p1, p3) and a lower probability of being medium-frequency travelers (p2).
- Sensitivity to cold weather (x12): Compared with travelers who are more sensitive (give up using, reference category) to cold weather, the insensitive travelers (continue when not serious) have significantly lower odds of being medium- and high-frequency travelers, with p2/p1 and p3/p1 being = 0.324 and = 0.293 times that of urgent travelers, respectively.
- Gender (x1): Compared with female travelers, male travelers have significantly higher odds of being high-frequency travelers, with p3/p1 being = 3.337 times that of female travelers. However, no significant difference in the odds of being medium-frequency travelers (p2/p1) is observed. So, compared with female travelers, male travelers have a higher probability of being high-frequency travelers (p3) and a lower probability of being low- and medium-frequency travelers (p1, p2).
- Maximum bike searching time (x7): Compared with travelers who tolerate long bike searching time (accept bike searching time of 10 min and longer), travelers with low tolerance (accept when less than 2 min) have significantly higher odds of being high-frequency travelers, with p3/p1 being = 8.612 times that of the high-tolerance group. However, no significant difference in the odds of being medium-frequency travelers (p2/p1) is observed. This change in odds indicates an increase in the probability of choosing high-frequency (p3) and a decrease in the probability of choosing low- and medium-frequency (p1, p2) when bike searching time tolerance is low.
4. Cost–Benefit Model
4.1. Cost Estimation
4.2. Benefit Estimation
5. Numerical Analysis
5.1. Benefit Analysis Based on 2017 Survey Data
- Stable fleet size: deploy bikes based on current demand (the demand when the fare is CNY 1/30 min), despite the fluctuation in demand under different fares, and
- Dynamic fleet size: deploy bikes in correspondence with the changing demand. The stable fleet size policy provides a constant annual cost, while the dynamic fleet size policy provides a fluctuating one.
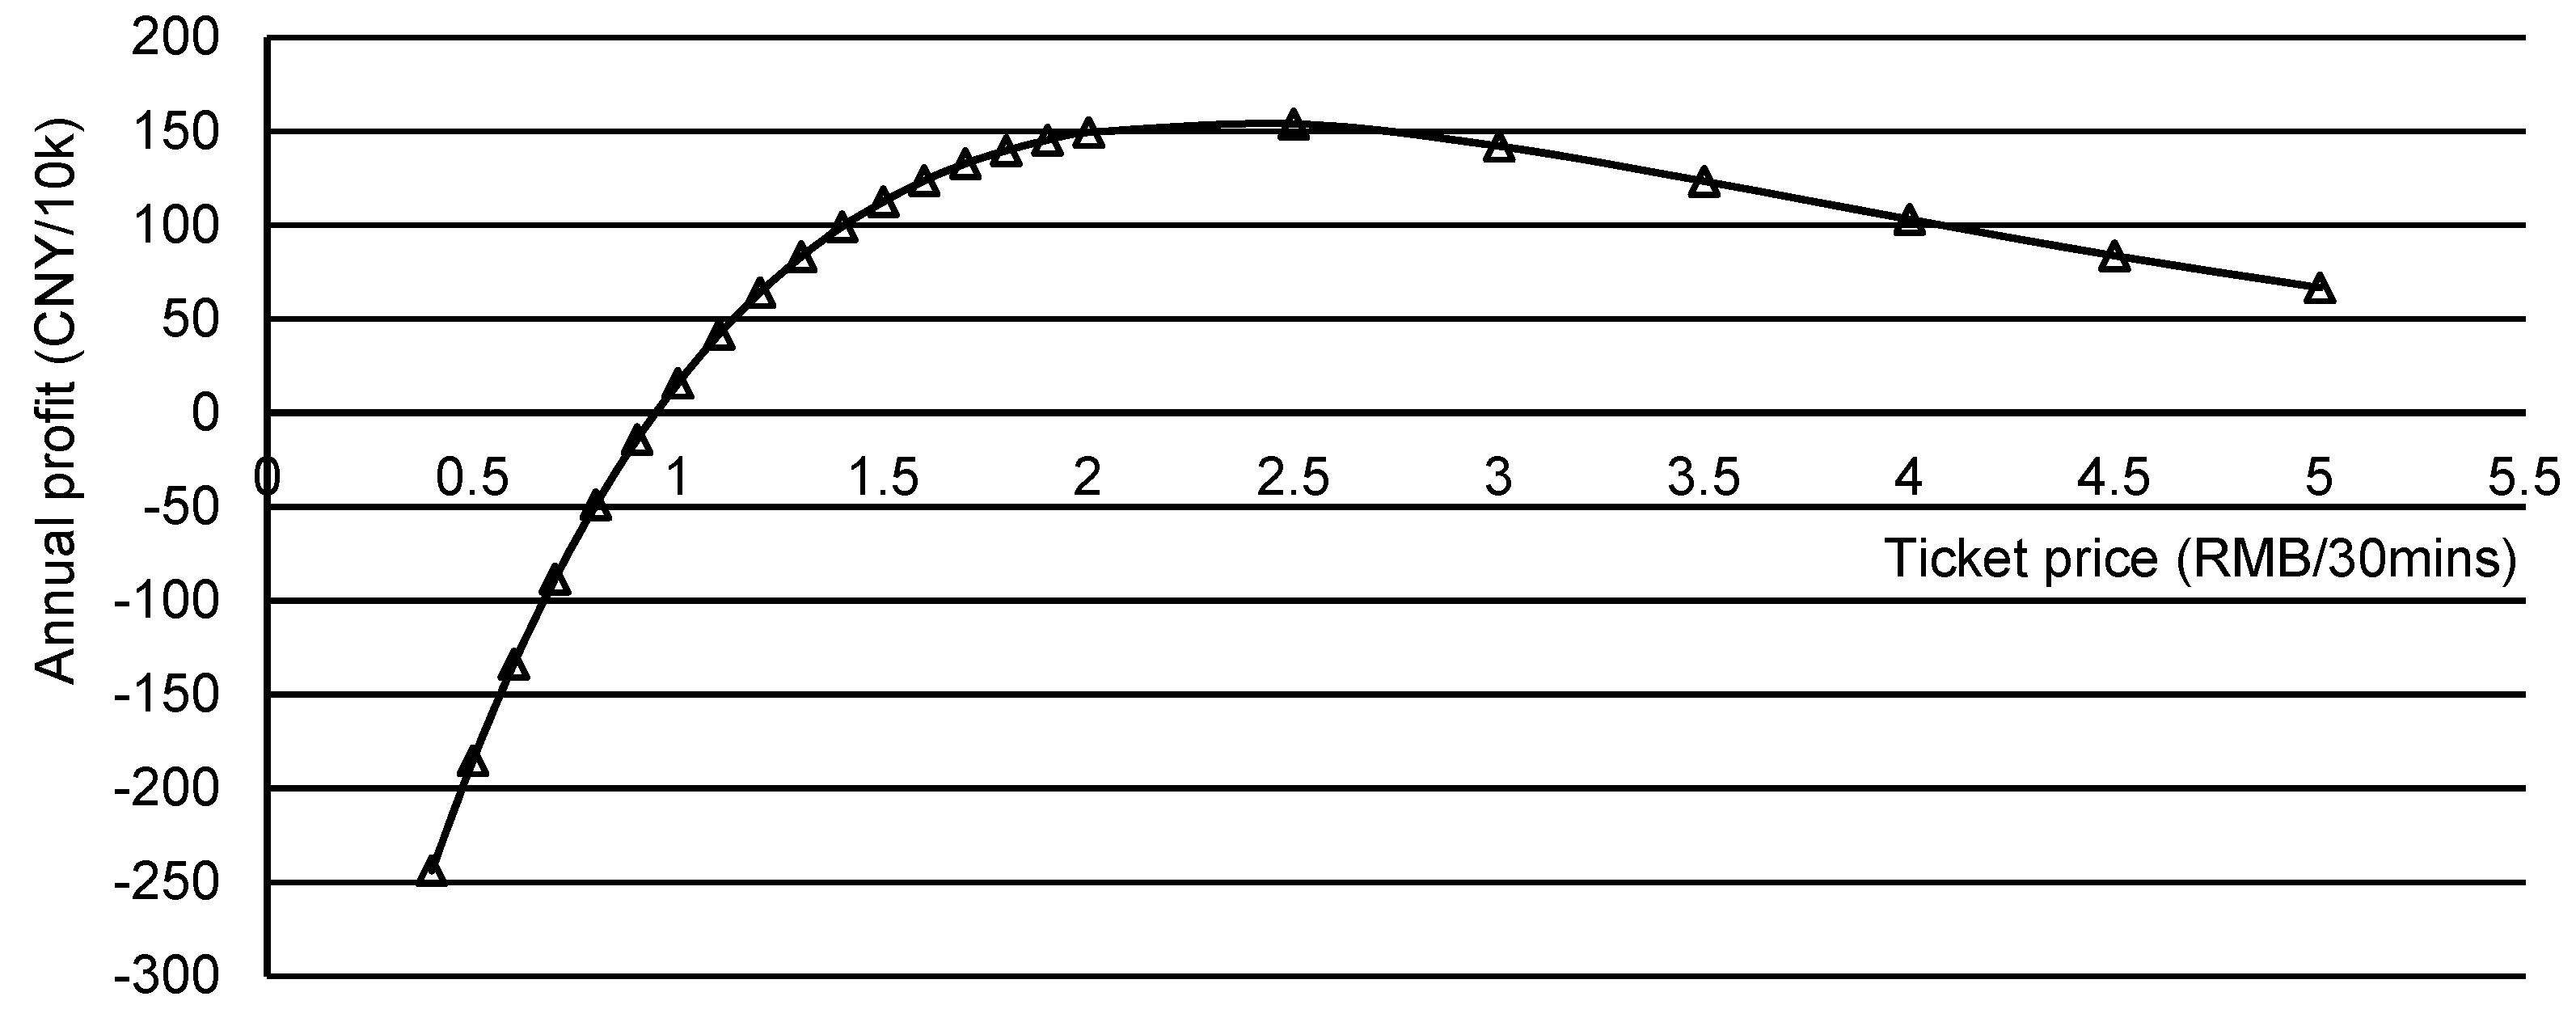
- If the BSPs operation agencies intend to maintain the current fleet size, they can achieve the maximum profit by slightly increasing the fare to about CNY 1.4/30 min.
- If the agencies, in the future, would like to deploy the dynamic fleet size practice, they can achieve an even higher maximum profit with the fare set to about CNY 2.4/30 min.
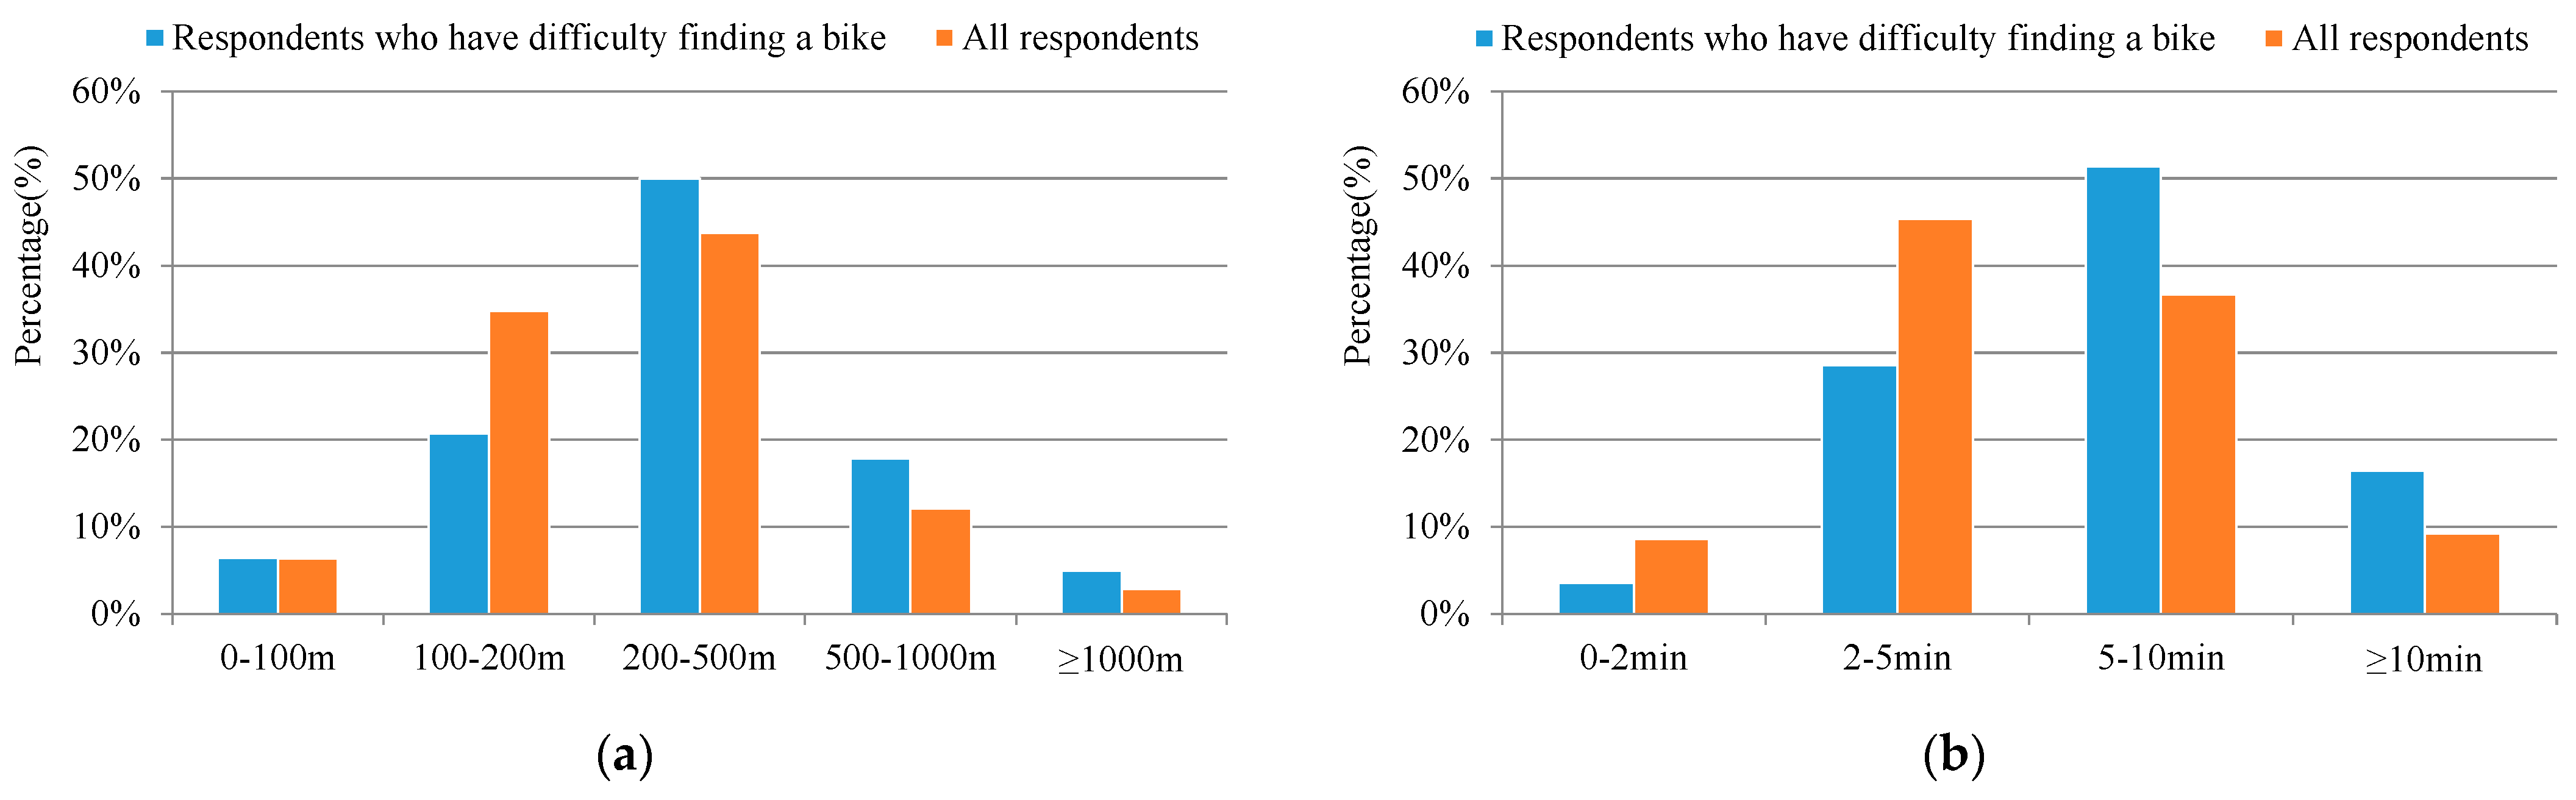
- The agencies can make an even higher profit by attracting more users. They can invest their profit in improving the service, such as increasing the number of bikes, expanding bike coverage, and redistributing bikes timely. The 2017 survey shows that a high percentage of people (43.93%) are non-BSP users due to the difficulties in finding a bike, but a very high percentage of them (86.92%) are willing to use it if more bikes are properly deployed and the bike searching time is reduced.
5.2. Before–After Analysis with 2020 Survey Data
- In 2020, the fare of bikeshares was raised to CNY 1.50/30 min, which is consistent with the findings from the benefit estimation in Figure 4. And, a bikeshare program with e-bikes (e-BSPs) began to emerge on campus, with a fare of CNY 1.5/15 min.
- From Figure 1 and Figure 2, one can observe the proportion of high-frequency users increases while that of medium-frequency users decreases. The ratio between high- and low-frequency users remains relatively stable, while the ratio between medium-frequency and low-frequency users decreases significantly.
- Changes in travel characteristics are also observed. The proportion of male users increases; the users are less sensitive to rainfall and cold weather; the bike-finding experience is improved, with decreased bike access difficulty and bike access time; and the acceptable bike access time remains stable. According to the proposed frequency estimation, a decrease in rainfall sensitivity (x10) should lead to a decrease in the odds of being medium-frequency travelers (compared with low-frequency). The 2020 survey showed the consistent results.
- The frequency distribution in Table 1 and Table 3 is diversified. There is a significant decrease in the pricing satisfaction level for high-frequency users; more respondents find bike searching generally satisfying in each frequency group; and the influence of weather factors on low-frequency trips diminishes. The decline in pricing satisfaction among high-frequency travelers may be due to the introduction of the e-BSP. According to the 2020 survey, 74.27% of the users’ rides last less than 10 min, and the e-BSP service charges CNY 1.5/15 min. So, by choosing e-BSP, they do not need to pay more but can receive a faster and more comfortable riding experience.
- Regarding system operation, significantly more users prefer a duration-based pricing policy, with a proportion nearly matching that of those who prefer a combined pricing policy. The number of people who are generally satisfied with the current pricing policy increases. And the users are less willing to increase the fare to improve the service.
- There is also an increase in the proportion of non-BSP users (27.4% in 2017 to 46.6% in 2020). Overall, 55.7% said they bought private bikes or e-bikes due to a poor riding experience; 14.3% said they still had problems finding bikes; and 67.1% said they would join when bike finding is easier. The introduction of the campus e-BSP could also account for the significant decrease.
6. Conclusions
- More than half of the respondents have used shared bicycles. In total, 60% of the users are high-frequency and medium-frequency travelers, and more people have been willing to use or increase the frequency of use if the number of bikes increases and the bikes are maintained timely.
- The travel frequency of bikeshare users is influenced by their demographic characteristics, travel characteristics, bike finding difficulty, and sensitivity to weather conditions. A multinomial logistic regression model was developed to describe the selection of the three bikeshare travel frequency levels (high, low, and medium).
- The cost–benefit analysis proves that, even with student users who have no income, the BSP agencies can still increase their profit by appropriately adjusting fares and upgrading service levels. Under the existing fleet size and assumptions, a reasonable price is suggested to be about CNY 1–1.4/30 min, and it should not be higher than CNY 2/30 min when the system is designed to be demand responsive in the future.
- For residential areas, industrial parks, and other restricted service communities, bikeshare programs have good prospects. The operation is profitable, the service can be of high quality, and it would be a good practice to promote sustainable transport.
- When operating the BSPs within a restricted service area, regional administrators (e.g., local governments, university management boards, and industrial park committees) will play critical roles alongside operators and users, particularly in preventing negative impacts caused by operators abruptly exiting the market after initial profitability. These impacts may include abandoned obsolete bicycles and unmanaged damaged vehicles. Preventive measures may include refundable deposit schemes for operating enterprises, competitive mechanisms involving two or more operators, and user feedback and penalty mechanisms.
Author Contributions
Funding
Institutional Review Board Statement
Informed Consent Statement
Data Availability Statement
Acknowledgments
Conflicts of Interest
References
- Kou, Z.; Cai, H. Comparing the performance of different types of bike share systems. Transp. Res. Part D Transp. Environ. 2021, 94, 102823. [Google Scholar] [CrossRef]
- DeMaio, P. Bike-sharing: History, Impacts, Models of Provision, and Future. J. Public Transp. 2009, 12, 41–56. [Google Scholar] [CrossRef]
- Cheng, L.; Huang, J.; Jin, T.; Chen, W.; Li, A.; Witlox, F. Comparison of station-based and free-floating bikeshare systems as feeder modes to the metro. J. Transp. Geogr. 2023, 107, 103545. [Google Scholar] [CrossRef]
- Zhan, Z.; Guo, Y.; Noland, R.B.; He, S.Y.; Wang, Y. Analysis of links between dockless bikeshare and metro trips in Beijing. Transp. Res. Part A Policy Pract. 2023, 175, 103784. [Google Scholar] [CrossRef]
- Sun, S.; Duan, Z. Sustaining the development of campus bike-sharing: A lesson from the unsuccessful practice in Dalian Maritime University, China. J. Clean. Prod. 2021, 295, 126483. [Google Scholar] [CrossRef]
- Transport for London. Santander Cycles Quarterly Performance Statistics to the End of December 2017. Available online: https://content.tfl.gov.uk/santander-cycles-transparency-to-end-of-december-2017.pdf (accessed on 2 April 2025).
- Brown, M.J.; Scott, D.M.; Páez, A. A spatial modeling approach to estimating bike share traffic volume from GPS data. Sustain. Cities Soc. 2022, 76, 103401. [Google Scholar] [CrossRef]
- Gehrke, S.R.; Sadeghinasr, B.; Wang, Q.; Reardon, T.G. Patterns and predictors of dockless bikeshare trip generation and duration in Boston’s suburbs. Case Stud. Transp. Policy 2021, 9, 756–766. [Google Scholar] [CrossRef]
- Qian, X.; Jaller, M.; Niemeier, D. Enhancing equitable service level: Which can address better, dockless or dock-based Bikeshare systems? J. Transp. Geogr. 2020, 86, 102784. [Google Scholar] [CrossRef]
- Yoon, G.; Chow, J.Y.J. Unlimited-ride bike-share pass pricing revenue management for casual riders using only public data. Int. J. Transp. Sci. Technol. 2020, 9, 159–169. [Google Scholar] [CrossRef]
- Qian, X.; Xiao, R.I.; Joby, R.; Jaller, M. Optimizing bikeshare service to connect affordable housing units with transit service. J. Transp. Geogr. 2024, 117, 103894. [Google Scholar] [CrossRef]
- Banerjee, S.; Kabir, M.M.; Khadem, N.K.; Chavis, C. Optimal locations for bikeshare stations: A new GIS based spatial approach. Transp. Res. Interdiscip. Perspect. 2020, 4, 100101. [Google Scholar] [CrossRef]
- Liu, X.; Chen, W.; Chen, X.; Chen, J.; Cheng, L. Could free-floating bikeshare weed out station-based bikeshare? Analyzing the relationship between two bikeshare systems from bivariate flow clustering. J. Transp. Geogr. 2024, 118, 103941. [Google Scholar] [CrossRef]
- Pildes, R.; Mittelman, A.; Bucci, G.; Foreman, C.; Noel, G. Congestion Mitigation and Air Quality Improvement Program (CMAQ) Cost-Effectiveness Tables Report; Federal Highway Administration: Washington, DC, USA, 2020.
- Yu, Q.; Zhang, H.; Li, W.; Sui, Y.; Song, X.; Yang, D.; Shibasaki, R.; Jiang, W. Mobile phone data in urban bicycle-sharing: Market-oriented sub-area division and spatial analysis on emission reduction potentials. J. Clean. Prod. 2020, 254, 119974. [Google Scholar] [CrossRef]
- Su, L.; Yan, X.; Zhao, X. Spatial equity of micromobility systems: A comparison of shared E-scooters and docked bikeshare in Washington DC. Transp. Policy 2024, 145, 25–36. [Google Scholar] [CrossRef]
- Gilbert, M.S.; Smith, A.; Walsh, A.L.; Cavallini, M.F. Successfully initiating a bike share program in smaller communities: The College or University as a Focal Point. Am. J. Educ. Res. 2021, 9, 255–262. [Google Scholar] [CrossRef]
- Jin, H.Y. Encouraging sustainable environment using bicycle sharing system in University Campus, Bangkok/Jin Hai Yan. Built Environ. J. 2020, 17, 85–94. [Google Scholar]
- Aliari, S.; Nasri, A.; Motalleb Nejad, M.; Haghani, A. Toward sustainable travel: An analysis of campus bikeshare use. Transp. Res. Interdiscip. Perspect. 2020, 6, 100162. [Google Scholar] [CrossRef]
- Guo, T.; Yang, J.; He, L.; Tang, K. Layout Optimization of Campus Bike-Sharing Parking Spots. J. Adv. Transp. 2020, 2020, 8894119. [Google Scholar] [CrossRef]
- Torres, N.; Martins, P.; Pinto, P.; Lopes, S.I. Smart & Sustainable Mobility on Campus: A secure IoT tracking system for the BIRA Bicycle. In Proceedings of the 2021 16th Iberian Conference on Information Systems and Technologies (CISTI), Chaves, Portugal, 23–26 June 2021; pp. 1–7. [Google Scholar] [CrossRef]
- Wang, S.; Wang, H.; Xie, P.; Chen, X. Life-Cycle Assessment of Carbon Footprint of Bike-Share and Bus Systems in Campus Transit. Sustainability 2020, 13, 158. [Google Scholar] [CrossRef]
- Kutela, B.; Teng, H. The influence of campus characteristics, temporal factors, and weather events on campuses-related daily bike-share trips. J. Transp. Geogr. 2019, 78, 160–169. [Google Scholar] [CrossRef]
- Ricci, M. Bike sharing: A review of evidence on impacts and processes of implementation and operation. Res. Transp. Bus. Manag. 2015, 15, 28–38. [Google Scholar] [CrossRef]
- Chen, X.; Ma, Z.; Ye, G.; Li, Z. Usage behavior and satisfaction analysis of free-floating bicycle sharing system service: Evidence from a Chinese university campus. Res. Transp. Bus. Manag. 2021, 43, 100703. [Google Scholar] [CrossRef]
- Molina-Garcia, J.; Castillo, I.; Queralt, A.; Sallis, J.F. Bicycling to university: Evaluation of a bicycle-sharing program in Spain. Health Promot. Int. 2015, 30, 350–358. [Google Scholar] [CrossRef]
- Fishman, E. Bikeshare: A Review of Recent Literature. Transp. Rev. 2016, 36, 92–113. [Google Scholar] [CrossRef]
- Brough, R.; Freedman, M.; Phillips, D.C. Understanding socioeconomic disparities in travel behavior during the COVID-19 pandemic. J. Reg. Sci. 2021, 61, 753–774. [Google Scholar] [CrossRef] [PubMed]
- Zhang, X.; Wang, X.; Yang, X.; Xu, C.; Zhu, X.; Wei, J. Driver drowsiness detection using mixed-effect ordered logit model considering time cumulative effect. Anal. Methods Accid. Res. 2020, 26, 100114. [Google Scholar] [CrossRef]
- Savolainen, P.; Mannering, F. Probabilistic models of motorcyclists’ injury severities in single- and multi-vehicle crashes. Accid. Anal. Prev. 2007, 39, 955–963. [Google Scholar] [CrossRef]
- Macioszek, E.; Kurek, A. The Analysis of the Factors Determining the Choice of Park and Ride Facility Using a Multinomial Logit Model. Energies 2021, 14, 203. [Google Scholar] [CrossRef]
- Damsere-Derry, J.; Adanu, E.K.; Ojo, T.K.; Sam, E.F. Injury-severity analysis of intercity bus crashes in Ghana: A random parameters multinomial logit with heterogeneity in means and variances approach. Accid. Anal. Prev. 2021, 160, 106323. [Google Scholar] [CrossRef]
- Zhao, S.; Xiong, J.; Kim, S.-Y.; Xu, L.; Yan, J. When bike-sharing crashed in China: A bumpy ride. J. Bus. Strategy 2021, 42, 295–303. [Google Scholar] [CrossRef]


| Questionnaire Contents |
|---|
| Part I: User characteristics (demographic) |
| What is your gender? |
| Which grade are you in? |
| Are you a bikeshare user? |
| Part II: Bikeshare trip characteristics |
| How often do you use a shared bike? |
| What is your motive to use a shared bike? |
| Do you use shared bikes for roundtrip or one way? |
| What is your usual travel purpose? |
| What is your usual travel distance? |
| What is your usual travel duration? |
| What is your usual bike-finding time? |
| What is your usual bike-finding distance? |
| Part III: Environment sensitivity |
| Will you choose the bikeshare service on rainy days? |
| Will you choose the bikeshare service on cold days? |
| Will you choose the bikeshare service on hot days? |
| Part IV: Bikeshare service access |
| Do you think it is difficult to find a bike? |
| What difficulties have you faced? |
| How do the difficulties influence your usage of a shared bike? |
| What is the maximum amount of time you accept to find a bike? |
| What is the maximum walking distance you accept to find a bike? |
| Are you willing to pay extra for the improvement of the bike-finding procedure? |
| Part V: Bikeshare fare policy |
| Are you satisfied with the current fare policy? |
| What other fare policy do you recommend? |
| What is the highest fare you are willing to pay for the bikeshare service? |
| Part VI: Non-bikeshare users |
| What are the reasons for not using shared bikes? |
| When the fare drops below how much would you consider using a shared bike? |
| Would you choose to use shared bikes when it is easier to find a bike? |
| Are you willing to pay extra for the improvement of the bike-finding procedure? |
| Influencing Factors | Classification | Percentage of Travelers (%) | ||
|---|---|---|---|---|
| High-Frequency | Medium-Frequency | Low-Frequency | ||
| Gender | Male | 15.85% | 27.82% | 12.32% |
| Female | 6.34% | 22.89% | 14.78% | |
| Attitude towards current pricing policy | Satisfaction | 12.32% | 25.00% | 12.32% |
| Okay | 9.15% | 25.00% | 14.11% | |
| Dissatisfaction | 0.70% | 0.70% | 0.70% | |
| Desired pricing model | Based on ride time | 5.63% | 13.73% | 4.57% |
| Based on ride area | 1.41% | 5.28% | 1.44% | |
| Based on ride distance | 4.22% | 13.73% | 9.20% | |
| Multi-mode | 10.91% | 17.96% | 11.92% | |
| Difficulty finding a bike | Easy | 0.70% | 1.41% | 1.06% |
| Moderate | 11.62% | 27.11% | 12.68% | |
| Difficult | 9.86% | 22.18% | 13.38% | |
| Time to find a bike | 0–2 min | 1.06% | 5.99% | 1.41% |
| 2–5 min | 8.80% | 26.76% | 10.21% | |
| 5–10 min | 10.56% | 14.44% | 12.32% | |
| 10 min or more | 1.76% | 3.52% | 3.17% | |
| Acceptable bike finding time | 0–2 min | 6.47% | 13.92% | 5.67% |
| 2–5 min | 10.47% | 25.19% | 11.03% | |
| 5–10 min | 4.62% | 7.95% | 7.88% | |
| 10 min or more | 0.62% | 3.65% | 2.53% | |
| Walking distance to find a bike | 0–100 m | 1.41% | 4.23% | 0.70% |
| 100–200 m | 8.10% | 19.37% | 7.75% | |
| 200–500 m | 8.80% | 22.18% | 13.73% | |
| 500 m or more | 3.87% | 4.93% | 4.93% | |
| Sensitivity regarding hot weather | Unaffected | 12.32% | 19.37% | 9.51% |
| Some influence | 8.45% | 26.76% | 12.68% | |
| Seriously affected | 1.41% | 4.58% | 4.92% | |
| Sensitivity regarding rainy weather | Unaffected | 2.82% | 2.46% | 3.17% |
| Some influence | 13.03% | 26.41% | 9.15% | |
| Seriously affected | 6.34% | 21.83% | 14.79% | |
| Sensitivity regarding cold weather | Unaffected | 8.80% | 13.73% | 7.04% |
| Some influence | 7.39% | 28.87% | 14.44% | |
| Seriously affected | 5.99% | 8.10% | 5.64% | |
| Influencing Factors | Factor Indicators | Variable Values |
|---|---|---|
| Personal Characteristics | Gender x1 | 1: Male, 2 *: Female |
| Education Level x2 | 1: Undergraduate, 2 *: Graduate | |
| Travel Characteristics | Trip purpose x3 | 1: Short-distance intra-district travel, 2: Medium- and long-distance inter-district travel, 3 *: Urgency/temporary use |
| Duration x4 | 1: <5 min, 2: 5–10 min, 3 *: ≥10 min | |
| Difficulty finding a bike x5 | 1: Easy, 2: General, 3 *: Difficult | |
| Walking time to find a bike x6 | 1: <2 min, 2: 2–5 min, 3: 5–10 min, 4 *: ≥10 min | |
| Acceptable bike finding time x7 | 1: <2 min, 2: 2–5 min, 3: 5–10 min, 4 *: ≥10 min | |
| Walking distance to find a bike x8 | 1: <100 m, 2: 100–200 m, 3: 200–500 m, 4 *: ≥500 m | |
| Satisfaction with the current pricing policy x9 | 1: Satisfied, 2: General, 3 *: Unsatisfied | |
| Influence of rainy days x10 | 1: Unaffected, 2: Continue to use when it is not serious, 3 *: Give up using | |
| Influence of hot days x11 | 1: Unaffected, 2: Continue to use when it is not serious, 3 *: Give up using | |
| Influence of cold days x12 | 1: Unaffected, 2: Continue to use when it is not serious, 3 *: Give up using |
| Observed Travel Frequency | Predicted Travel Frequency | |||
|---|---|---|---|---|
| Low | Medium | High | Precision | |
| Low | 32 | 39 | 6 | 41.60% |
| Medium | 20 | 112 | 15 | 76.20% |
| High | 4 | 36 | 27 | 40.30% |
| Overall | 19.20% | 64.30% | 16.50% | 58.80% |
| Frequency * | Variable ** | Estimated B a | p-Value | Exp(B), OR b |
|---|---|---|---|---|
| medium | α1 intercept | 0.573 (1.643) | 0.727 | - |
| β1_3 trip characteristic, purpose: short-distance travel | 0.793 (0.360) | 0.028 | 2.211 (1.092, 4.478) | |
| β1_10 weather condition, rainfall: continue to use when not serious | −0.77 (0.35) | 0.028 | 0.463 (0.233, 0.919) | |
| β1_12 weather condition, cold weather: continue to use when not serious | −1.128 (0.480) | 0.019 | 0.324 (0.126, 0.829) | |
| high | intercept | −3.234 (2.075) | 0.119 | - |
| β2_1 user characteristic, gender: male | 1.205 (0.41) | 0.003 | 3.337 (1.495, 7.45) | |
| β2_3 trip characteristic, purpose: short-distance travel | 1.052 (0.442) | 0.017 | 2.863 (1.205, 6.803) | |
| β2_7 quality of service, acceptable accessing time: <2 min | 2.153 (1.088) | 0.048 | 8.612 (1.022, 72.599) | |
| β2_12 weather condition, cold weather: continue to use when not serious | −1.228 (0.53) | 0.02 | 0.293 (0.104, 0.827) |
| Key Influencing Factors | Classification Values | Percentage of Travelers | ||
|---|---|---|---|---|
| High-Frequency | Medium-Frequency | Low-Frequency | ||
| Gender | Male | 18.57% | 21.43% | 24.29% |
| Female | 11.43% | 7.14% | 17.14% | |
| Attitude towards current pricing policy | Satisfaction | 8.57% | 14.29% | 10.00% |
| Okay | 20.00% | 12.86% | 27.14% | |
| Dissatisfaction | 1.43% | 1.43% | 4.28% | |
| Desired pricing model | Based on ride duration | 12.86% | 10.00% | 17.14% |
| Based on ride area | 2.86% | 0.00% | 2.86% | |
| Based on ride distance | 5.71% | 5.71% | 5.71% | |
| Multi-mode | 8.57% | 12.86% | 15.72% | |
| Difficult to find a bike Y/N | Easy | 4.29% | 7.14% | 4.29% |
| Moderate | 20.00% | 17.14% | 27.14% | |
| Difficult | 5.71% | 4.29% | 10.00% | |
| Consumed time to find a bike | 0–2 min | 8.57% | 8.57% | 10.00% |
| 2–5 min | 17.14% | 15.71% | 24.29% | |
| 5–10 min | 1.43% | 1.43% | 4.28% | |
| 10 min or more | 2.86% | 2.86% | 2.86% | |
| Acceptable bike finding time | 0–2 min | 8.57% | 10.00% | 10.00% |
| 2–5 min | 11.43% | 11.43% | 24.29% | |
| 5–10 min | 10.00% | 5.71% | 5.71% | |
| 10 min or more | 0.00% | 1.43% | 1.43% | |
| Walking distance to find a bike | 0–100 m | 2.86% | 8.57% | 7.14% |
| 100–200 m | 14.29% | 8.57% | 20.00% | |
| 200–500 m | 11.43% | 7.14% | 11.43% | |
| 500 m or more | 1.43% | 4.28% | 2.86% | |
| Sensitivity regarding hot weather | Unaffected | 11.43% | 14.29% | 12.86% |
| Some influence | 14.29% | 12.86% | 27.12% | |
| Seriously influence | 4.29% | 1.43% | 1.43% | |
| Sensitivity regarding rainy weather | Unaffected | 0.00% | 1.43% | 7.14% |
| Some influence | 20.00% | 18.57% | 24.29% | |
| Seriously influence | 10.00% | 8.57% | 10.00% | |
| Sensitivity regarding cold weather | Unaffected | 5.71% | 7.14% | 11.43% |
| Some influence | 21.43% | 15.71% | 27.15% | |
| Seriously influence | 2.86% | 5.71% | 2.86% | |
Disclaimer/Publisher’s Note: The statements, opinions and data contained in all publications are solely those of the individual author(s) and contributor(s) and not of MDPI and/or the editor(s). MDPI and/or the editor(s) disclaim responsibility for any injury to people or property resulting from any ideas, methods, instructions or products referred to in the content. |
© 2025 by the authors. Licensee MDPI, Basel, Switzerland. This article is an open access article distributed under the terms and conditions of the Creative Commons Attribution (CC BY) license (https://creativecommons.org/licenses/by/4.0/).
Share and Cite
Zhu, X.; Lyu, D.; Xu, J.; Lin, Y. Travel Characteristics and Cost–Benefit Analysis of Bikeshare Service on University Campuses. Sustainability 2025, 17, 3489. https://doi.org/10.3390/su17083489
Zhu X, Lyu D, Xu J, Lin Y. Travel Characteristics and Cost–Benefit Analysis of Bikeshare Service on University Campuses. Sustainability. 2025; 17(8):3489. https://doi.org/10.3390/su17083489
Chicago/Turabian StyleZhu, Xianyuan, Duanya Lyu, Jianmin Xu, and Yongjie Lin. 2025. "Travel Characteristics and Cost–Benefit Analysis of Bikeshare Service on University Campuses" Sustainability 17, no. 8: 3489. https://doi.org/10.3390/su17083489
APA StyleZhu, X., Lyu, D., Xu, J., & Lin, Y. (2025). Travel Characteristics and Cost–Benefit Analysis of Bikeshare Service on University Campuses. Sustainability, 17(8), 3489. https://doi.org/10.3390/su17083489