1. Introduction
Air pollution is a common challenge in the global urbanisation process, and its effects have transcended geographical boundaries, posing a threat to the health of the worldwide population. According to the World Health Organization [
1], 99% of the world’s population lives in areas with substandard air quality, and ambient air pollution is responsible for 4.2 million premature deaths worldwide. Several studies have confirmed that air pollution is a key environmental factor triggering respiratory diseases [
2,
3]. For example, particulate matter concentrations are highly correlated with the number of hospitalisations for respiratory diseases [
4]. For every 1 μg/m
3 increase in the mean mass concentrations of 2.5-micrometer particulate matter (PM
2.5), inhalable particles (PM
10), nitrogen dioxide (NO
2) and sulphur dioxide (SO
2) in the ambient air, the incidence of respiratory diseases increases by 0.2–1.4%, 0.7–1.6%, 3.7–8.2%, and 0.5–2.3% [
5]. According to the China Health Statistics Yearbook 2022 [
6], respiratory diseases ranked as the fourth cause of death among urban residents in 2021, with a share of 8.45%. How to improve air pollution and enhance people’s well-being has become a common challenge in global urban governance.
As the world’s largest developing country, China’s experience in air pollution control is an important reference for emerging economies. The Chinese government has contributed to the improvement of air pollution in China through a series of measures such as the formulation of the Action Plan for Prevention and Control of Air Pollution [
7] and the Three-Year Action Plan for Winning the Battle for the Blue Sky [
8], and the requirement to “strengthen the synergistic control of pollutants” [
9]. According to the 2021 China Ecological Environment Status Bulletin [
10], the air quality compliance rate for 339 cities at the prefecture level and above nationwide reached 64.3%, an improvement of 3.5 percentage points from 2020. However, pollution levels, including PM
2.5 and ozone (O
3), remained high at 30 μg/m
3 and 137 μg/m
3, respectively. This far exceeds the air quality guideline values set by the World Health Organisation [
1], where the safety threshold for the annual average concentration of PM
2.5 is 5 μg/m
3, and the threshold for the maximum 8-h daily average concentration of O
3 is 100 μg/m
3. Pollution control still has a long way to go.
Among the sources of urban air pollution, emissions from fast-growing vehicles are especially concerning. In Europe, nitrogen oxides (NO
x) and PM
10 are strongly influenced by road traffic, which contributes 73% of NO
x emissions and 42% of PM
10 emissions in Paris and 50% of NO
x and PM
10 emissions in London [
11]. In Africa, vehicles are the largest source of urban outdoor air pollution [
12]. In Asia, particulate matter concentrations in South Korea are mainly influenced by traffic [
13], and vehicle emissions are one of the important sources of air pollution in China [
14]. Data from the Ministry of Public Security shows that China’s vehicle fleet will reach 395 million in 2021, with 79 cities exceeding the one-million mark, ranking first globally in scale [
15]. Therefore, reducing vehicle exhaust pollution is an urgent problem.
As a high-capacity, low-emission green transport infrastructure, the subway is regarded as a “double key” to solving urban traffic congestion and air pollution [
16]. By replacing private car travel, the subway not only directly reduces transport carbon emissions [
17], improves air quality, reduces the incidence of diseases caused by air pollution [
18] and social costs [
19,
20], but also promotes compact development by optimising the spatial layout of cities [
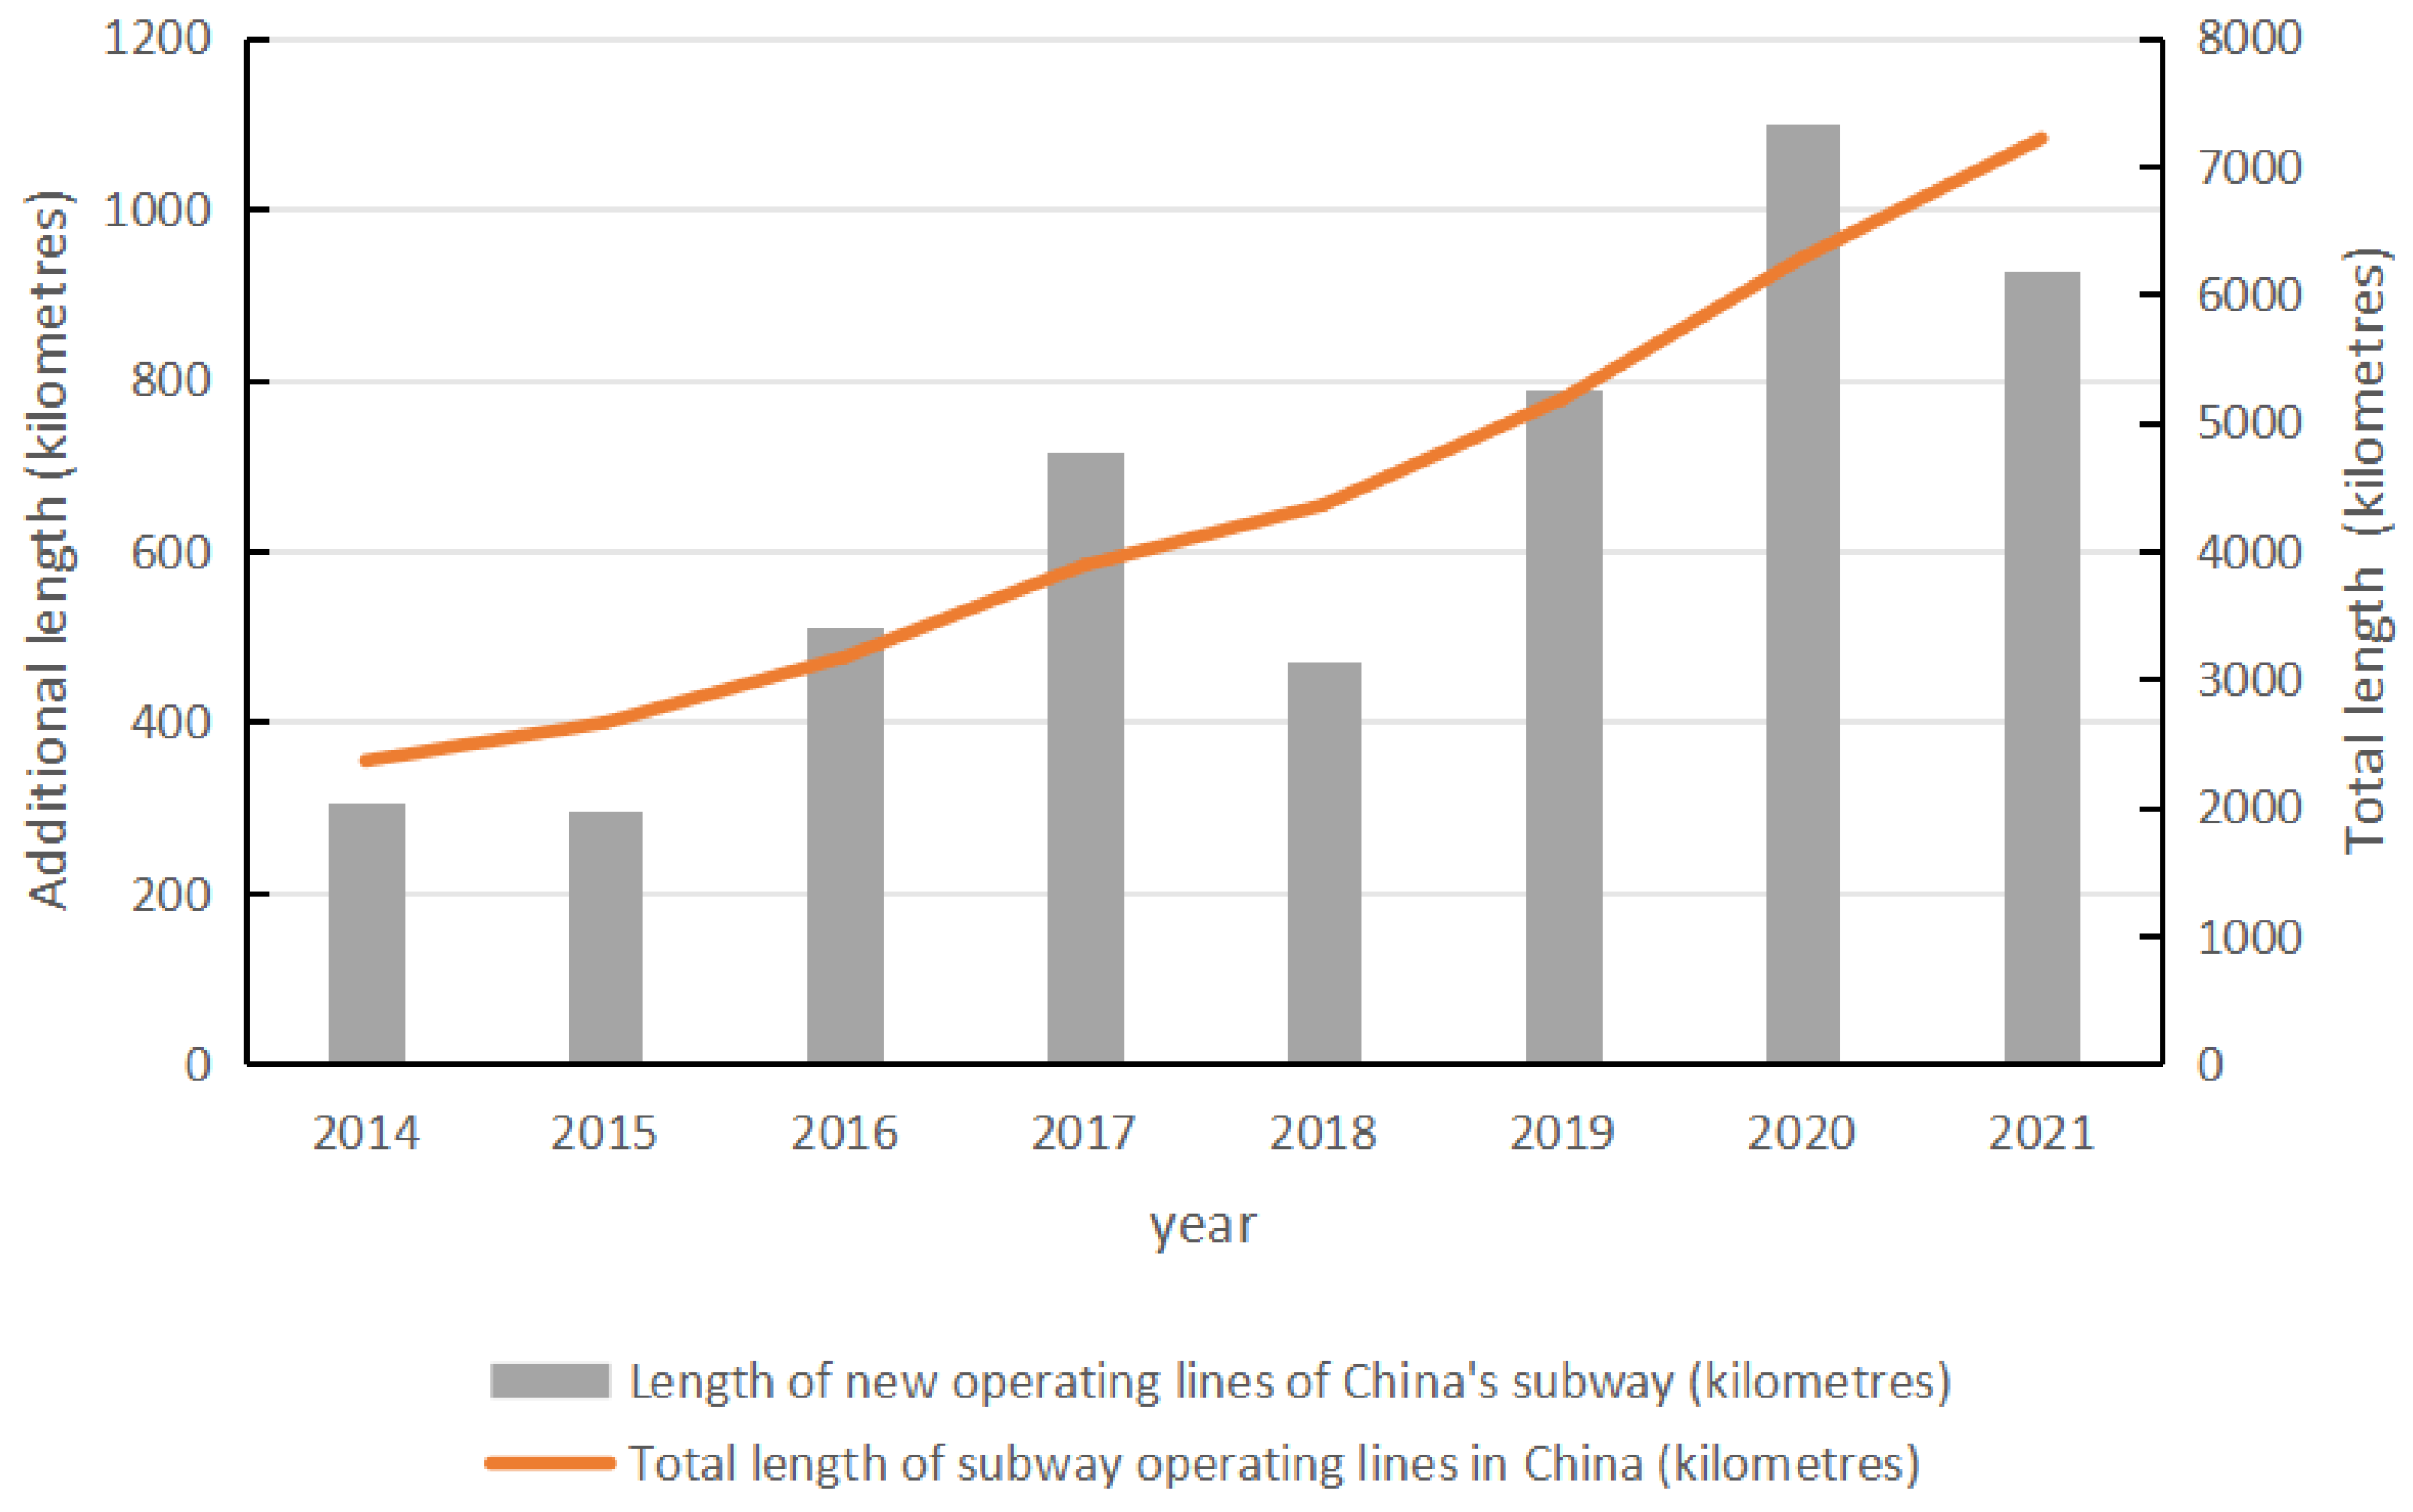
21]. The Chinese government attaches great importance to the construction of subway networks. As shown in
Figure 1. The left
y-axis indicates the length of new operating lines of China’s subway (km), and the right
y-axis indicates the total length of China’s subway operating lines (km). From 2014 to 2021, the total length of subway operating lines in China increased from 2361 km to 7209.7 km. By 2021, the number of cities with subway lines in operation had reached 42, forming the world’s largest urban rail transit system. However, the high cost of subway construction has led to an ongoing debate about its environmental benefits. Does the opening of a subway actually reduce air pollution by changing the travel structure? Does this effect vary across cities with different geographic locations, levels of development, and resource endowments? Answering these questions is of great practical significance for optimising transport infrastructure investment decisions and promoting sustainable urban development.
To answer the above questions, this paper employs the difference-in-differences (DID) model to systematically assess the impact of subway openings on urban air pollution, to deeply analyse the path of its action, and to explore the possible influence of urban heterogeneity on this effect. The potential marginal contributions of this paper are as follows: firstly, this research empirically examines the effect of subway openings on urban air pollution by utilising data from 282 prefecture-level cities in China, spanning from 2014 to 2021, through the DID methodology. On this basis, slope data is used as an instrumental variable for subway openings to effectively control the endogeneity problem of metro opening and obtain more robust research results. Secondly, combined with the existing literature, this study summarises the logical framework of the effect of subway openings on air pollution and investigates the mechanism of this effect. Thirdly, the effects of regional heterogeneity, economic level heterogeneity, and urban heterogeneity are further discussed with the aim of exploring the reasons for the possible differential impact of the air pollution improvement effect of subway openings.
2. Literature Review
A large number of studies have estimated the impact of subways on housing markets [
22,
23,
24], urban economic activity [
25,
26,
27] and the environment [
28,
29,
30], and the factors influencing air pollution, such as economic growth [
31,
32], transport infrastructure [
33,
34] and environmental regulatory policies [
35,
36].
Focusing on the environmental effects of the opening of the subway, researchers at home and abroad have widely discussed the impact of subway openings on air pollution. However, no consensus has been reached so far. Most researchers believed that the opening of the subway, i.e., the first opening of a new subway line in operation, significantly reduced air pollution. Chen and Whalley [
19] studied the effect of the opening of the Taipei Metro on air pollution based on a discontinuity regression design (RDD) and found that the opening of the subway could reduce the concentration of carbon monoxide (CO). Using daily data from 29 Chinese cities from 2013 to 2018, Lu et al. [
17] used the RDD and found that the newly opened subway significantly reduced PM
2.5 concentration. Li et al. [
37] found that opening 14 new underground lines in Beijing could significantly improve air quality, with the extent of improvement correlating positively with the density of the station network. Zheng et al. [
38] discovered that the opening of the Changsha Metro in Hunan Province significantly reduced CO concentrations while exerting minimal influence on O
3 concentrations. Xiao et al. [
39] found that urban air quality significantly improved after the opening of the metro, based on daily data from 2000 to 2012 for prefecture-level cities in China. Li et al. [
40] employed the sharp regression discontinuity method to assess the impact of 112 newly opened subway lines in 26 Chinese cities on air quality and found that the opening of the subway resulted in a significant reduction in PM
2.5 and NO
2 concentrations. Leirião et al. [
41] used an interrupted regression model and found that the opening of the metro improved the local air quality in the city of São Paulo. Xie et al. [
20] used a machine learning approach to study the impact of subway line openings on air quality in China between 2013 and 2018, greatly improving the precision of the estimates, and they found that subway openings improved air quality.
However, some researchers also believed that the opening of the subway did not have a significant impact on reducing air pollution. O’Toole [
42] argued that new rail transport reduces social welfare and may produce more greenhouse gases. Beaudoin et al. [
43] reviewed relevant studies since 2000 and concluded that whether subway opening improves air quality is still open to discussion. Sun et al. [
44] conducted a study based on quarterly data from 28 subway-opening cities in China from 2013–2016 and found that subway opening exacerbates air pollution in the short term. Rivers et al. [
45] explored the impact of traffic strikes on air quality in 18 Canadian cities. They found that traffic stoppages did not affect levels of carbon monoxide or fine particulate matter concentrations. Gendron-Carrier et al. [
46] used a multi-period DID model to analyse 58 cities around the world with subway openings between February 2000 and December 2014 and concluded that, on average, particulate matter concentrations do not change as a result of subway openings.
At present, more researchers have conducted a lot of research and discussion on the opening of the subway and air pollution, respectively. This provides an important reference value for subsequent research, but there is still some room for improvement. Firstly, most of the existing researchers used a single city [
37,
38] or several specific cities [
40,
45] as samples for their studies. Although this can explain the impact of subway openings on air pollution in specific cities, whether the findings can be generalised to all cities in China requires further research and discussion. Secondly, some of the literature uses regression discontinuity [
17,
19,
40] to study the impact of metro opening on urban air pollution. The window periods of such studies are generally short, making it difficult to examine the medium- to long-term environmental effects of metro opening. RDD estimation results are sensitive to bandwidth selection, and it may be difficult to exclude confounding factors near the breakpoints, whereas the use of DID mitigates such problems by designing a control group. Finally, existing relevant studies have yet to reach a consensus on the impact of the opening of the subway on air pollution. This is based on the fact that, on the one hand, the opening of the subway can reduce air pollution emissions through the traffic substitution effect [
19], and on the other hand, it can create more traffic demand and aggravate air pollution [
47].
Therefore, based on the panel data of prefecture-level cities in China from 2014 to 2021, this paper empirically examines the impact of subway openings (i.e., new subway lines opening and operating for the first time) on urban air pollution, and introduces the slope data as an instrumental variable for the endogeneity issue to control for more credible findings. The study not only makes up for the lack of empirical evidence at the national level but also provides a reference for optimising subway layout policies, promoting synergistic development of transport and environment, and promoting sustainable urban development by discussing the mechanism of action and heterogeneous impacts.
5. Results and Discussion
5.1. Baseline Regression Analysis
Table 2 presents the baseline regression results. Column (1) presents the regression results without the inclusion of control variables, accounting just for time-fixed and city-fixed effects. The coefficient of the explanatory variable subway is significantly negative, generally in line with the paper’s anticipation that the opening of the subway reduces urban air pollution. Columns (2) to (7) present the regression results after adding the six control variables sequentially. The coefficient of the explanatory variable subway is −0.042 and passes the significance test at the 1% level. This shows that, all other things being equal, the opening of the subway reduced the city’s annual average AQI by 4.2%, compared to the city without the subway. The opening of the subway has a significant inhibiting effect on the rise of the air quality index, significantly reducing the level of air pollution in the city and improving urban air quality. This may be because the opening of the subway supplants certain vehicle transport modes and partially alleviates urban traffic congestion. It efficiently diminishes motor vehicle exhaust emissions, hence decreasing air pollution concentration and improving air quality. Therefore, Hypothesis 1 is verified: the opening of the subway can significantly reduce the concentration of air pollutants and improve urban air quality.
5.2. Robustness Tests
5.2.1. Parallel Trend Test
The normative DID model needs to satisfy the premise of the parallel trend assumption, i.e., the experimental and control groups have the same trend before the policy intervention. Referring to Beck et al. [
60], to verify whether the experimental and control groups have the same trend of change in air pollution before the opening of the subway, the model is set as follows:
where k denotes the number of years between time t and the year in which the city subway first opened for operation, taking values of −5+, −4, −3, −2, 0, 1, ..., 4+. Negative, 0 and positive values indicate the year before, the year of, and the year after the opening of the subway, respectively. −5+ denotes the 5th year before the opening of the subway and before, and 4+ denotes the 4th year after the opening of the subway and after. The dummy variable
denotes the policy shock of opening a subway in the city. In order to avoid the covariance of the time dummy variables, the dummy variable
in the year before the opening of the subway is not put into the model as the base period. The definitions of other variables and symbols in Equation (2) are the same as those in Equation (1).
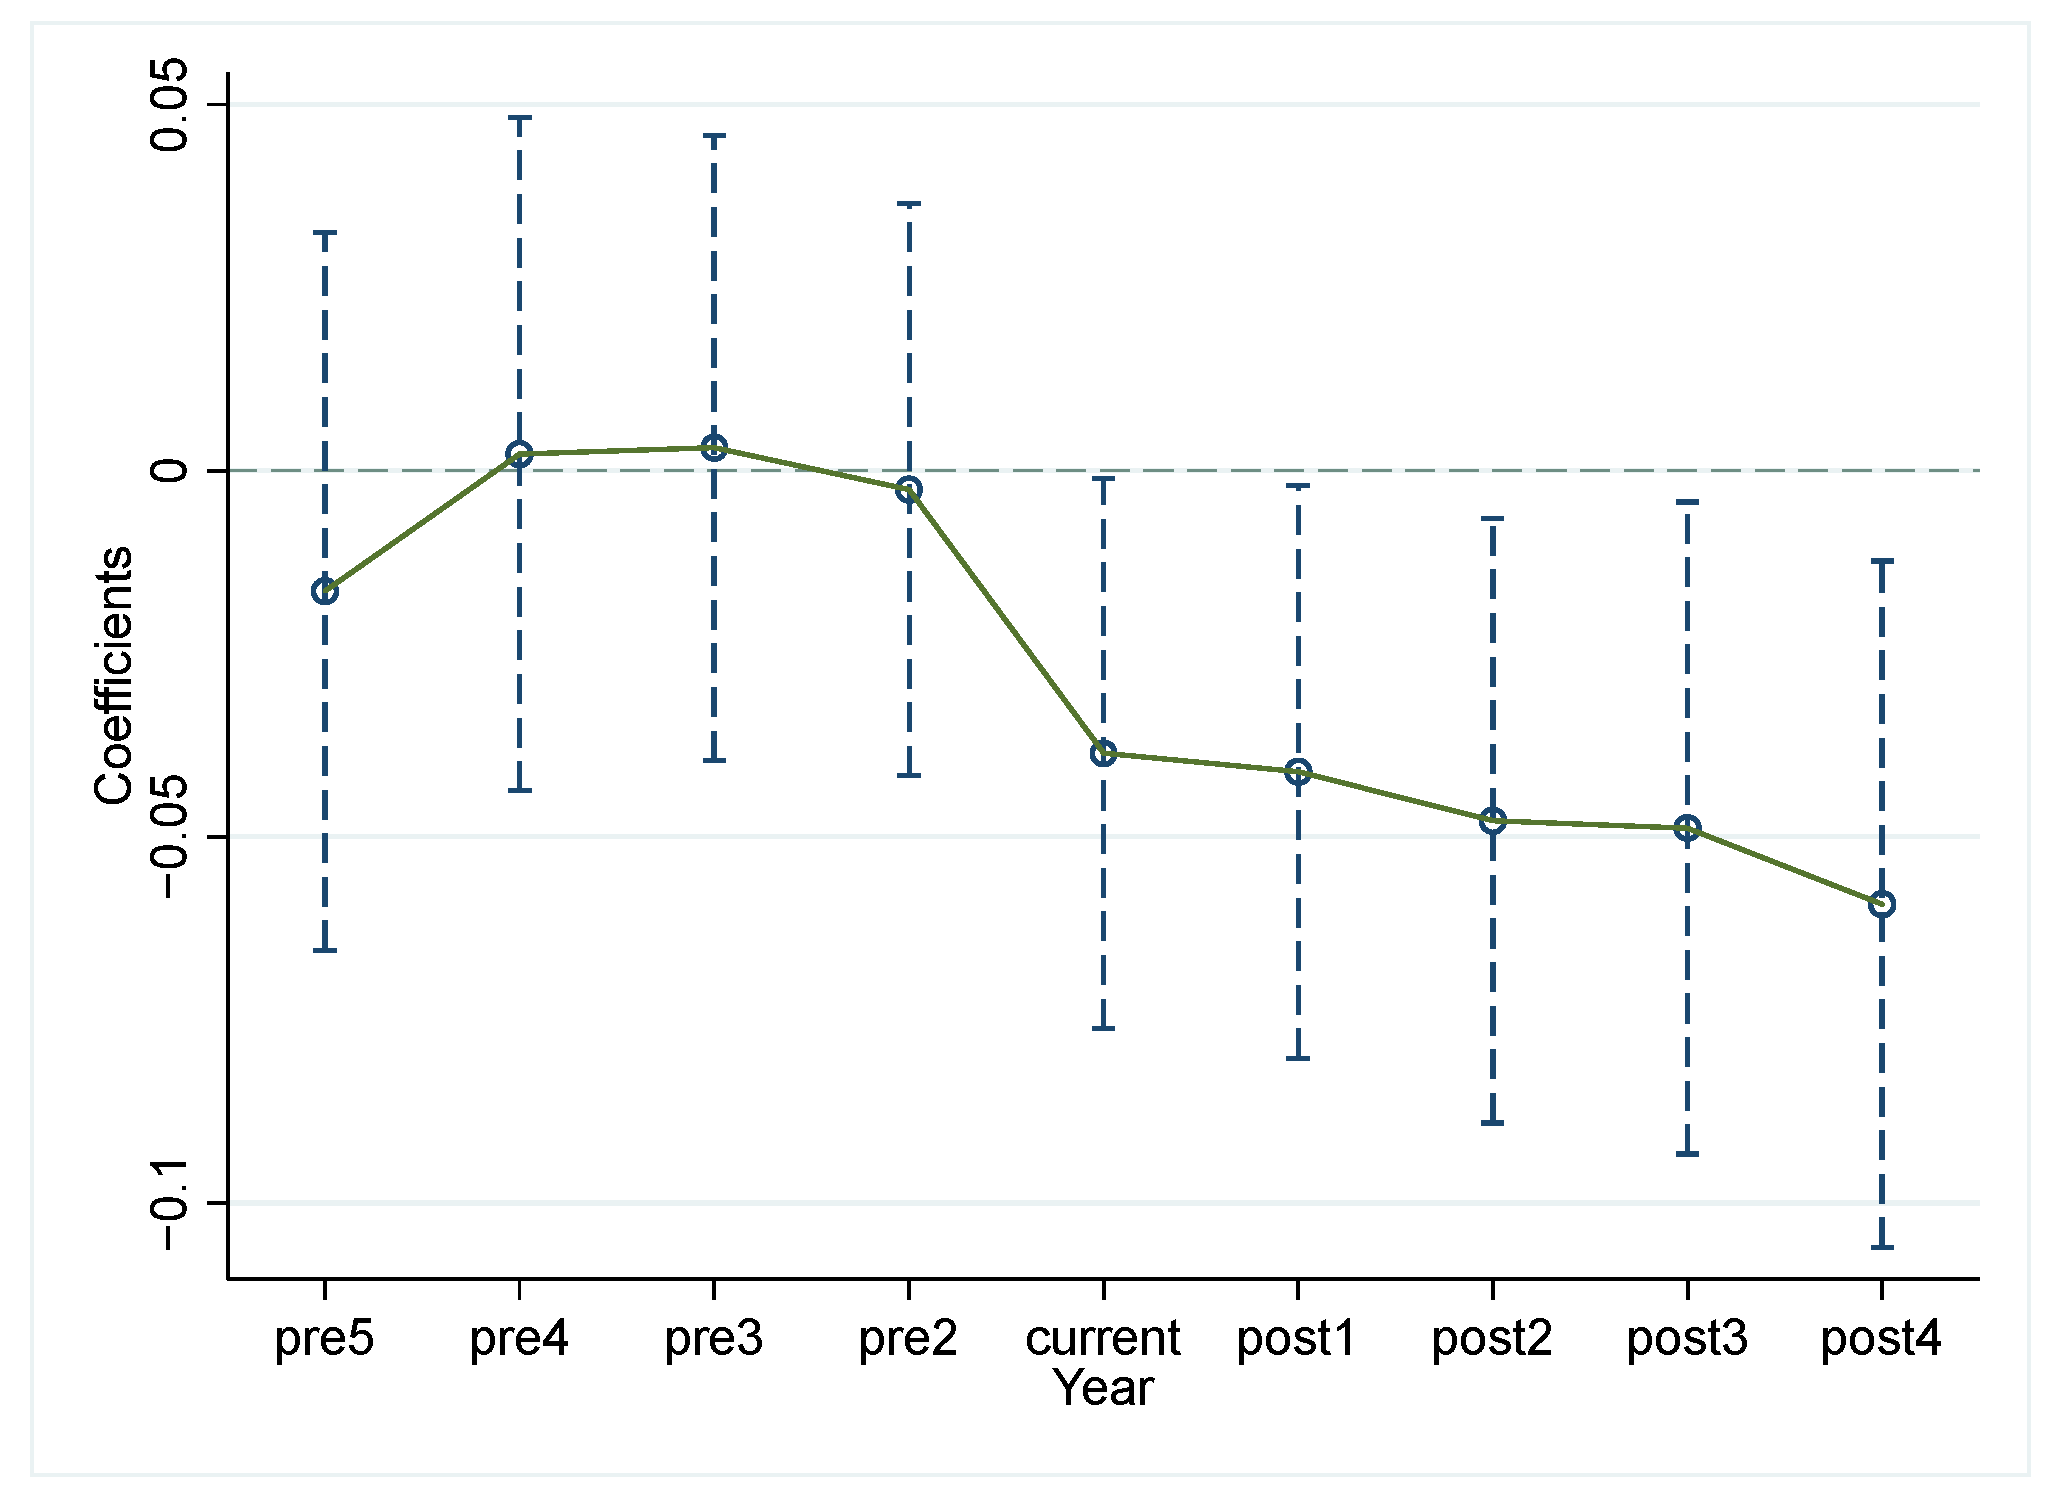
The results of the parallel trend test are shown in
Figure 3. The horizontal axis denotes the year of the policy shock, current denotes the year the subway opened, prek denotes the kth year before the subway opened, and postk denotes the kth year after the subway opened. The vertical axis is the estimated coefficients, the hollow origin in the figure indicates the policy effect of the subway opening in a city in a given year, and the dotted line indicates the 90% confidence interval. It can be seen that the regression coefficients are not significant in all periods before the implementation of the policy, indicating that there is no significant difference between the air pollution of the experimental group and the control group before the opening of the subway, i.e., the DID model passed the parallel trend test.
5.2.2. Placebo Test
To verify whether the results of the baseline regression are affected by other random factors, this paper uses random sampling for the placebo test [
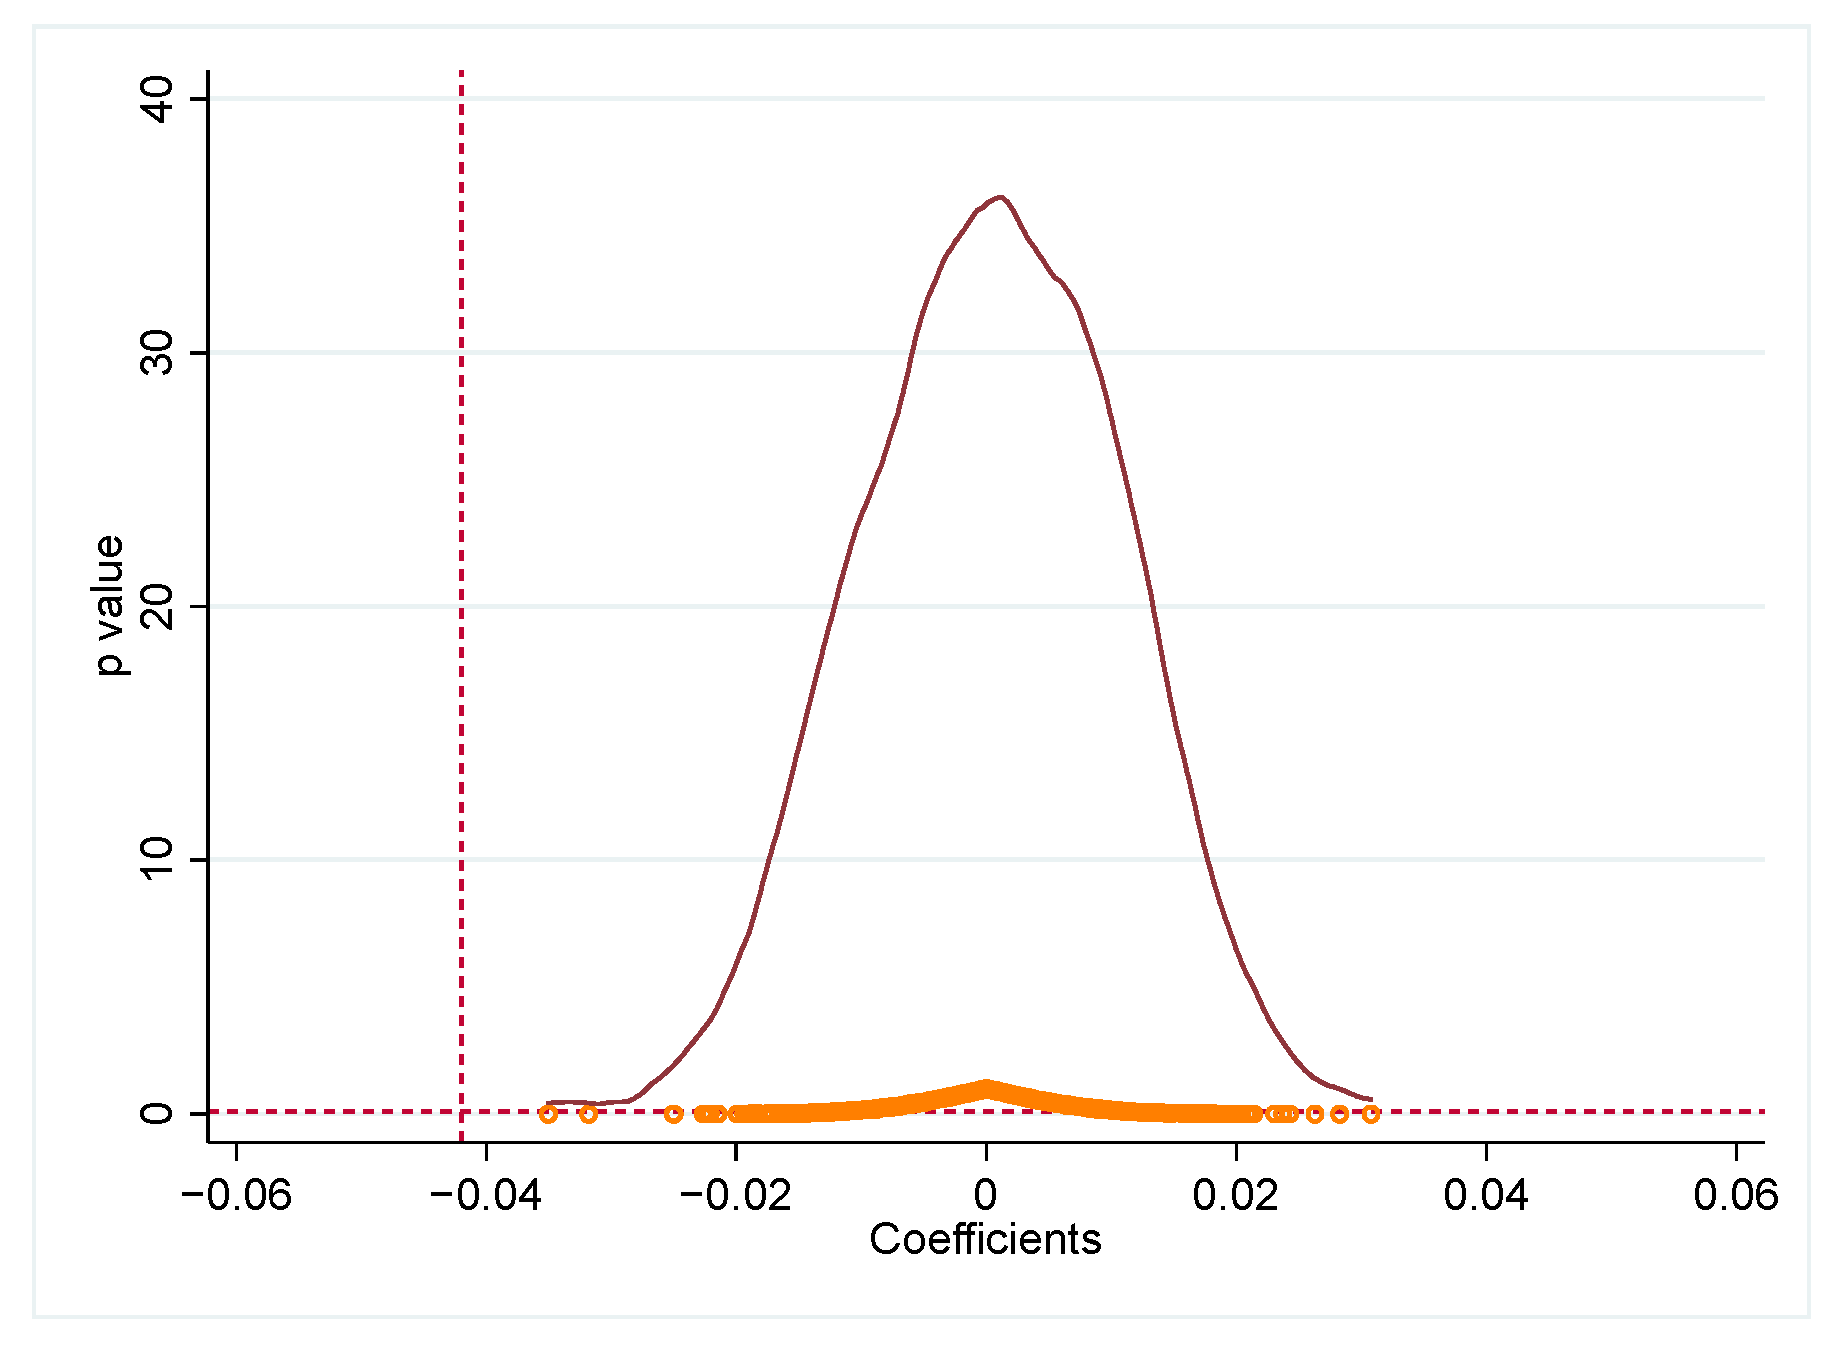
18], and the cities that open subways and the opening time of the subway are randomly set and then put into the model for regression. The results of the regression based on 500 random samples are shown in
Figure 4. The circles located at the bottom of the figure are the (estimated coefficients,
p-values) combination points, the dashed line is the baseline regression results for the real policy, and the solid line is the kernel density estimate of the regression coefficients of the DID term after randomising the treatment group. The estimated coefficients obtained based on the random sample have a mean of 0, follow an approximately positive normal distribution, and are significantly different from the baseline regression results of the real policy. Most of the scatters lie above the dotted line with a
p-value of 0.1, indicating that they are not significant at the 10% level. Thus, the placebo test is passed, and other random factors can be excluded from interfering with the results, reflecting the robustness of the baseline regression findings.
5.2.3. Counterfactual Test
In addition to the shock of the opening of the subway in the city, some other policies or unobserved factors may also affect urban air quality. However, this impact is not associated with the opening of the subway, which in turn leads to the conclusion that the previous baseline regression is not valid. Therefore, this paper conducts a counterfactual test by changing the timing of the policy shock, the opening of the city’s subway. If the regression result is significantly negative, it indicates that the improvement of urban air quality may stem from the impact of other policies rather than the opening of the subway. If the regression result is not significantly negative, it indicates that the urban air quality improvement originates from opening the subway. The regression results of the counterfactual test are shown in
Table 3. Column (1) shows the regression results for the opening of the subway 2 years in advance, and column (2) shows the regression results for the opening of the subway 3 years in advance. The coefficients of the explanatory variables subway_bf2 and subway_bf3 are not significant, which suggests that the improvement of urban air quality is not caused by other factors but originates from the opening of the subway, verifying the robustness of the baseline regression results.
5.2.4. Exclusion of Outlier Cities
As this article removes the 15 cities that opened their subways before 2014, it includes Beijing, Shanghai, Guangzhou and Shenzhen. This has excluded the four first-tier cities in China, avoiding any impact on the reliability of the baseline regression results due to the large differences between these cities and the others. To further enhance the comparability between the experimental and control groups, 17 cities within the provinces (Hainan Province, Tibet Autonomous Region, Qinghai Province, and Ningxia Hui Autonomous Region) that did not have subways during the period 2014 to 2021 have been deleted. The results are shown in column (3) of
Table 3. After the removal of the 17 outlier cities, the coefficient of the subway is still significantly negative and is pretty much the same as the coefficient in
Table 2. This means that the conclusions of the baseline regression in this paper are still valid.
5.2.5. Alteration of Air Pollution Proxy Variables
In previous studies, this paper used the air quality index as a comprehensive indicator of air pollution levels. This method can objectively reflect the overall level of air quality by integrating the concentration information of multiple pollutants, and has been widely used in environmental effect studies [
61,
62]. However, relying on a single composite indicator, AQI, may not be comprehensive enough in assessing the impact of subway opening on air pollution. Based on this, this paper will further refine the dimensions of the analysis by taking six air pollution indicators, namely nitrogen dioxide (lnNO
2), sulphur dioxide (lnSO
2), carbon monoxide (lnCO), ozone 8-hr concentration (lnO
3), inhalable particles (lnPM
10), and 2.5-micrometer particulate matter (lnPM
2.5), as the explained variables to conduct robustness tests, and also to investigate the impact of subway opening on different pollutants.
The regression results are presented in
Table 4. Columns (1), (2), (5), and (6) demonstrate that the coefficients of the subway are significantly negative, indicating that the opening of the subway significantly reduces the NO
2, SO
2, PM
10 and PM
2.5 concentrations, and improves the air pollution level in the city. The coefficient of the subway in column (4) is significantly positive, indicating that the opening of the subway significantly contributes to the production of O
3. This may be related to the secondary pollutant properties of O
3. Therefore, these regression results align closely with the baseline regression result, verifying the robustness of the baseline regression result.
5.3. Endogeneity Test
The results of the previous baseline regression and the robustness test show that the air pollution reduction effect from the opening of the subway is robust. However, the construction planning of the subway may be affected by the air pollution situation, and the endogeneity problem of reverse causality may occur, leading to biased parameter estimates. In addition, the inability to control for omitted variables that simultaneously affect the opening of the subway and urban air pollution may also have an impact on the parameter estimates.
Therefore, the instrumental variable approach will be used to mitigate the endogeneity problem. Suitable instrumental variables should satisfy both high correlation with endogenous variables and ensure sufficient exogeneity, i.e., the instrumental variables affect the explained variables only through endogenous variables. This paper selects the interaction term between slope data and time trend as an instrumental variable, based on the following considerations. Firstly, the geographical gradient is a composite of the topographic variation in a given area and can indirectly measure the cost of opening a subway. Since the slope directly affects subway opening, the correlation between the effective instrumental variable and the endogenous variable can be satisfied. Secondly, slope, as one of the indicators of urban topographic variation, is an inherent geographic information variable of the city. It has a more natural exogenous characteristic, which well satisfies the exogenous assumption of effective instrumental variables.
Since the slope data is a cross-section data of the urban interface, both the endogenous and explanatory variables are panel data that contain information about the city and time. The effect of slope data on subway openings may differ because of different years. Therefore, this paper adopts ArcGIS version 10.2 software to calculate the geographic slope data of each region, and the interaction term between slope data and time trend is used as an instrumental variable. The two-stage least squares method (2SLS) is used to estimate the model. The results are shown in
Table 5.
The p-value of the Kleibergen-Paap rk LM statistic is less than 0.01, which means that the original hypothesis of “insufficient identification of instrumental variables” is rejected at the 1% level. The selection of instrumental variables is reasonable and valid. In the first stage estimation results, the Cragg-Donald Wald F statistic is greater than the standard value at the 10% level (28.11 > 16.38), indicating that there is no weak instrumental variable problem. The coefficients of the explanatory variables are negative at the 10% level of significance, which is consistent in direction with the baseline regression results, verifying that there is a significant improvement effect of subway opening on urban air pollution.
5.4. Mechanism Test
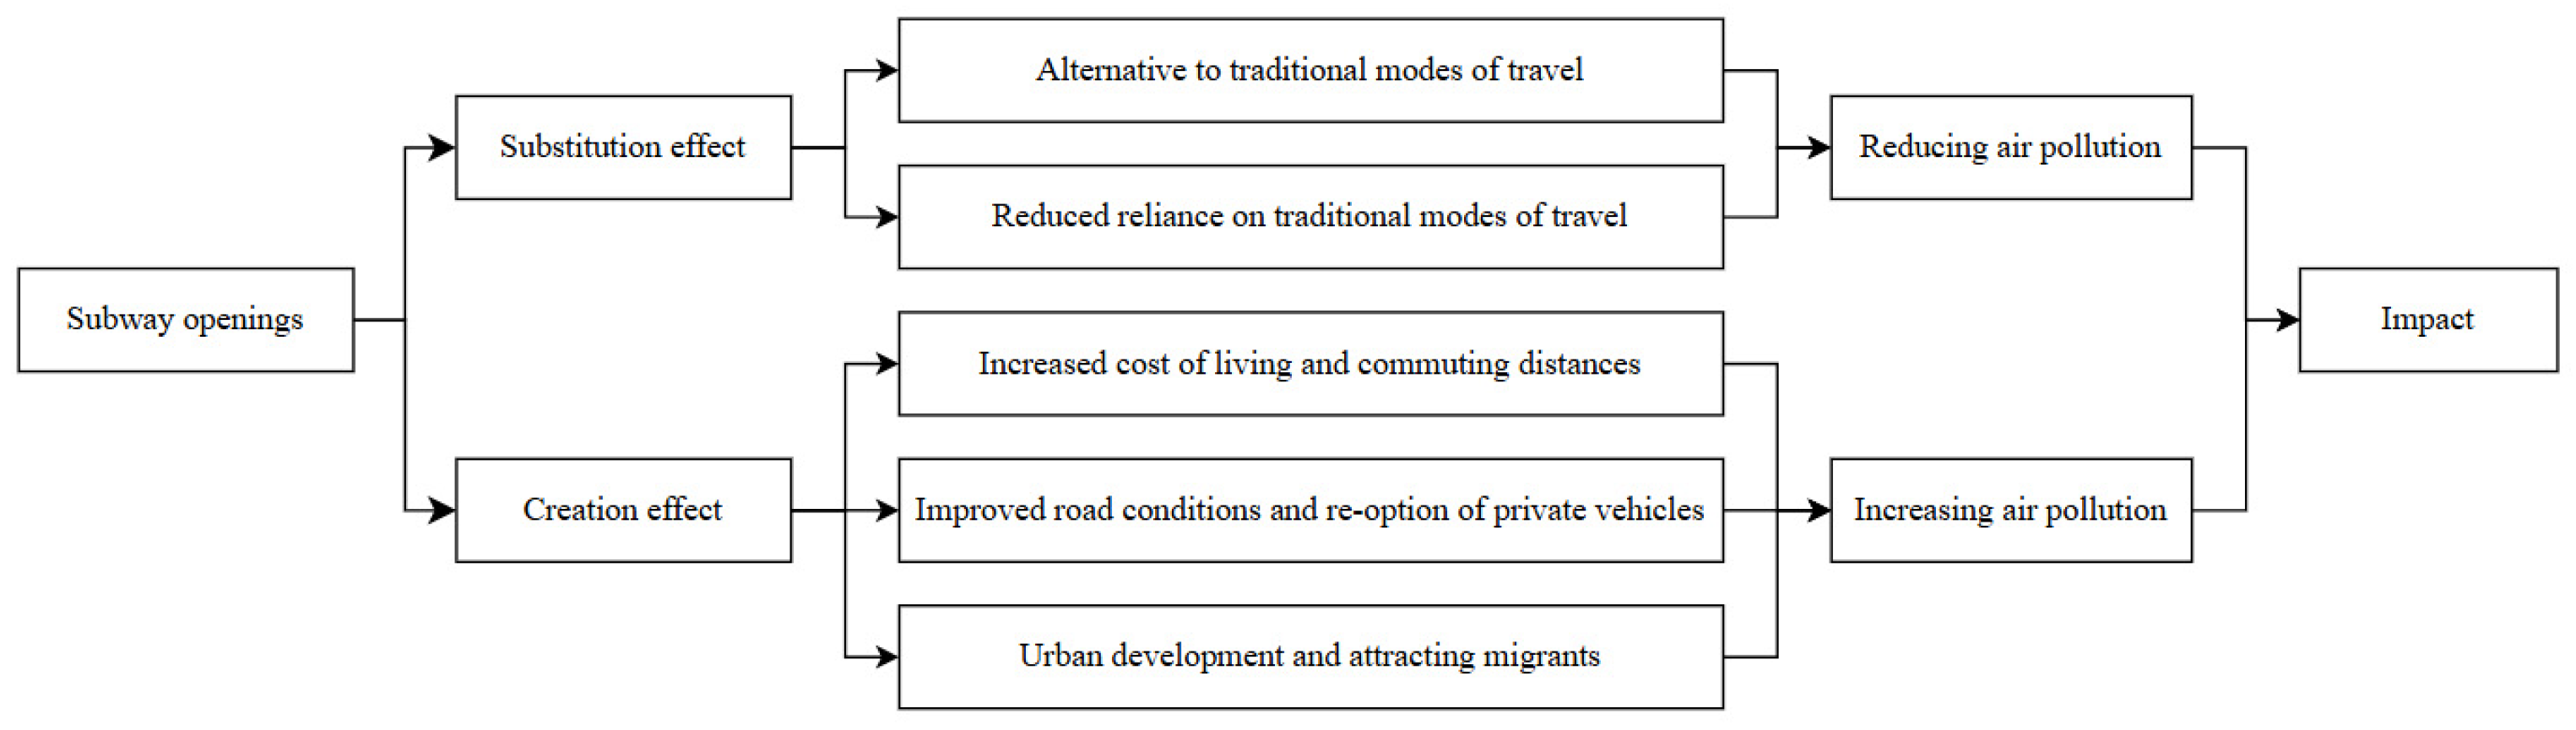
At present, there are two opposite mechanisms in the academic community for the impact of the subway opening on air pollution: one is the traffic substitution effect, and the other is the traffic creation effect. The traffic substitution effect is that the opening of the subway replaces people’s traditional road-travelling modes, such as private cars and taxis, and reduces the number of motor vehicles, which in turn reduces motor vehicle emissions and air pollution [
19]. The traffic creation effect suggests that the subway’s substitution effect is limited and that it generates more traffic demand, increasing commuting pressure and air pollution levels [
47]. Therefore, to investigate the mechanism through which the opening of the subway influences air pollution levels, this paper replaces AQI with the ownership of private cars (lncar), buses (lnbus), and taxis (lntaxi) (in logarithmic terms), together with the growth rates of these vehicle categories (rcar, rbus, rtaxi). The data on bus and taxi ownership were obtained from the China Urban Statistical Yearbook, and the data on private car ownership were obtained from local statistical bureaus.
Table 6 presents the results of the mechanism test. Column (1) shows that the coefficient of the explanatory variables is −0.065, which passes the test of significance at the 1% level, while columns (2) and (3) show that the coefficients lack significance. This suggests that the opening of the subway has led to a significant decline in private car ownership but has no significant effect on bus and taxi ownership, which shows that the opening of the subway has only had a substitution effect on private cars. This may be attributed to the subway offering a rapid and secure mode of public transportation, which leads to some commuters switching from using private cars to using the subway [
63], resulting in a decrease in the number of private cars used. The decrease in private car use directly reduces motor vehicle emissions, which are the main source of NO
x and particulate matter, which corroborates the previous robustness test that “the opening of the subway significantly reduces the concentration of NO
x and particulate matter”. However, the number of buses and taxis is not significantly affected, reflecting the complementary functions and rigidity of demand for different modes of transport. As the “capillary” of urban transport, buses can cover areas not covered by the subway, and their demand is rigid. It still plays an irreplaceable and important role in meeting people’s daily travelling needs. Taxis, on the other hand, mainly cater for immediate travelling needs, with a low degree of overlap with the subway service group, which is difficult to replace with the opening of the subway. Consequently, the opening of the subway mitigates air pollution through the substitution of private cars. Thus, Hypothesis 2 is confirmed: the opening of the subway supplants certain conventional road transportation methods and decreases urban air pollution levels.
The coefficients of the explanatory variables in columns (4)–(6) are not significant, indicating that the opening of the subway does not significantly affect the growth rate of private cars, buses, and taxis. This may be attributed to the current situation where most cities in China with operational subways are tiny and lack comprehensive transit routes throughout the city. In addition, as of 2021, a total of 42 cities in mainland China have opened subways, the subway network is relatively small, and has not yet formed a “network effect”. Therefore, it is difficult to have a significant impact on people’s travelling patterns and cannot significantly influence the growth rate of vehicle ownership. Therefore, it is not possible to test Hypothesis 3: the opening of the subway creates more demand for commuting and exacerbates urban air pollution. In summary, the improvement effect of the subway opening on urban air pollution stems mainly from the dominance of the traffic substitution effect, while the influence of the traffic creation effect is relatively limited.
5.5. Heterogeneity Test
5.5.1. Regional Heterogeneity
The Yangtze River Economic Belt spans 11 provinces and cities in eastern, central and western China. Relying on the Yangtze River as a golden waterway, cities along the river (the Yangtze River Economic Belt cities) have a favourable geographic location, and are often different from other cities in terms of factor resources and governance modes. This may make the opening of the subway have a differential effect on air pollution levels. Therefore, this paper divides the cities into Yangtze River Economic Belt cities (YEB cities) and non-YEB cities (non-YEB cities) for the heterogeneity test. The regression results are shown in column (1) and column (2) of
Table 7.
The coefficient of the explanatory variables for the YEB cities is negative but not significant, and the coefficient for the non-YEB cities is −0.05, which passes the significance test at the 1% level. This indicates that the improvement effect of subway opening on air pollution in non-YEB cities is significantly stronger than that in YEB cities. This may be because the cities in the Yangtze River Economic Belt, as the core region of China’s economic development, are generally characterised by high population density and dense industrial clusters. Although the opening of the subway can replace some private car trips, the economic activities and population movements along the route may increase the demand for commuting, partially offsetting the substitution effect. In addition, the share of industrial emissions in cities in the Yangtze River Economic Belt is generally higher than the national average, and the impact of industrial pollution on air quality may overshadow the marginal substitution effect of the subway. In contrast, non-YEB cities have relatively little economic and human activity. At the same time, cities have relatively lighter industrial pollution and a higher share of transport pollution in overall pollution, making the air pollution improvement effect of subways more readily apparent.
5.5.2. Economic Level Heterogeneity
A city normally builds a subway mainly taking into account the level of the economy. The varying economic levels of cities may result in a disparate impact of subway openings on air pollution levels. This paper measures the city’s economic status using its per capita GDP. This article categorises the sample cities into two groups based on their median per capita GDP: low economic level cities and high economic level cities. The regression outcomes are presented in columns (3) and (4) of
Table 7.
The coefficient of the explanatory variable for cities with a low level of economy is −0.075, which is significant at the 1% level, while the coefficient for cities with a high level of economy is negative but not significant. It shows that the effect of subway opening on air pollution improvement in low-level cities is significantly stronger than that in high-level cities. This may be because the subway network in low economic level cities is mostly concentrated in the core urban areas, and the line planning matches the population distribution better, which makes it easier to achieve the private car substitution target. In contrast, the substitution effect of the subway is partly offset by the fact that high-level cities have better public transport networks and metro lines extend to the suburbs, which may stimulate the “job-household separation” phenomenon and lead to longer commuting distances, increasing the overall demand for transport.
5.5.3. Urban Heterogeneity
Resource-based cities are urban areas where the primary industry is the extraction and processing of natural resources, including minerals and forests, within the region. They have made great contributions to the establishment of China’s independent and complete industrial system and the development of the national economy. However, the prolonged and intense mining and excavation of resources have led to resource-based cities generally facing serious problems such as environmental pollution and ecological damage. This is often at variance with other cities in terms of development planning, etc., which in turn may make the opening of the subway have a differential impact on air pollution levels. Therefore, this paper categorizes cities into resource-based and non-resource-based for heterogeneity testing. The regression outcomes are presented in columns (5) and (6) of
Table 7.
The coefficient of the explanatory variable for resource-based cities is negative but not significant, while the coefficient for non-resource-based cities is −0.034, which is significant at the 5% level. It shows that the opening of the subway has a significantly stronger effect on the improvement of air pollution in non-resource-based cities than in resource-based cities. This may be due to the fact that resource-based cities have long relied on resource development and heavy industry, and industrial pollution dominates in air pollution. Even though the opening of the subway has produced a transport substitution effect, the industrial emission pollution makes it difficult to show a significant improvement in the overall air pollution. In addition, resource-based cities generally face lagging industrial transformation and population outflow. The subway network is mostly laid out around traditional industrial areas, with a low degree of matching with new residential areas, failing to effectively guide the optimisation of the commuting structure and weakening the efficiency of the subway as a substitute for the private car. In contrast, the industrial structure of non-resource-based cities is relatively diversified, and the proportion of traffic pollution in the overall air pollution is relatively high. The opening of the subway can more directly reduce pollutant emissions from transport sources by replacing private car travel, thus showing a significant air pollution improvement effect.
5.6. Discussion and Limitations
In this paper, a DID model is constructed to assess the impact of subway opening on urban air pollution in China by integrating transport infrastructure and environmental quality into a unified framework. This study aims to fill the research gap on the long-term impact of subway opening on urban air pollution. The findings of the study not only provide new empirical evidence for the role of the subway in urban environmental governance, but also provide a reference for optimising subway layout policies and promoting sustainable urban development.
The findings of this paper are similar to those of existing studies [
20,
27,
48], which concluded that the opening of the subway significantly reduces the concentration of air pollutants and improves urban air quality. This improvement effect is mainly achieved through the substitution of private cars. However, Xiao et al. [
39] found that the subway favoured the substitution of taxis, thereby reducing taxi emissions. This may be due to the fact that the period of their study is 2000–2012, which does not overlap with that of this paper. In the discussion of regional heterogeneity, existing studies generally use east, central and west to classify cities [
14,
39], which may hide the differences in the development of different cities within the same region. In contrast, this paper adopts the Yangtze River Economic Belt for regional division, which can capture the synergistic effects of environmental policies and transport networks more precisely. In addition, this paper discusses the impact of different urban development patterns, i.e., whether it is a resource-based city or not, on the improvement effect of air pollution, which provides a new perspective to study the heterogeneous impact of subway opening.
The study also has some limitations. First, this study uses sample data at the prefecture-level city level in China for the empirical study, but due to the unavailability of national raster data samples, it is not possible to examine the improvement effect of the subway openings on air pollution within cities. In further studies, we will endeavour to collect raster data to provide more micro empirical evidence. Second, we discussed the effects of regional, economic level, and urban heterogeneity in the heterogeneity analysis section, but the spatial insights were limited to broad qualitative statements, and the spatial analyses were not well developed. In future research, we will endeavour to improve our spatial analysis, enhance the visualisation of our study, and collect more relevant data to provide a more complete spatial analysis. Finally, our study lacks a substantial contribution to urban environmental research. Our existing analyses are mainly based on air quality index and pollutant concentration data, and we have not yet directly examined the impact of the opening of the subway on the health of residents. Although there is a strong correlation between air pollution and health problems such as respiratory diseases, whether the reduction in pollutant concentrations can be translated into health benefits needs to be further verified. We will further collect health indicators at the individual level, such as the incidence of diseases and the frequency of medical consultations, in order to assess the effect of the subway openings on the improvement of residents’ health, and thus provide substantial contributions to the study of the urban environment.
6. Conclusions and Policy Recommendations
Identifying the improvement effect of subway opening on urban air pollution provides an important basis for coordinating transport infrastructure development with ecological sustainability. This study utilises panel data from 282 Chinese cities spanning 2014 to 2021 and employs the DID model to assess the effect of subway openings on urban air pollution, leading to the following results. (1) The opening of the subway significantly decreases air pollution concentrations and enhances urban air quality, and this conclusion remains valid after a series of robustness tests. (2) The mechanism analysis indicates that the opening of the subway reduces urban air pollution mostly through the traffic substitution effect, resulting from the replacement of private car traffic. (3) Heterogeneity research indicates that the abatement effect of subway openings on air pollution is more significant when the city is a non-Yangtze River Economic Belt city, or when the city’s economic level is lower or when the city is non-resource-based.
Based on the above findings, this paper puts forward the following policy recommendations: first, the government should increase financial support to expand the scale of subway construction. It is recommended that the central and local governments set up a special financial fund to give priority to supporting cities that meet the construction conditions to speed up the process of metro planning and construction. This will not only help to alleviate regional air pollution problems, but will also lead to balanced local economic development through infrastructure investment.
Second, the government should optimise the layout of the subway. It is recommended that subway lines connecting high-density residential areas, business districts and transport hubs be prioritised in subway construction planning to increase station density and accessibility. Particular attention needs to be paid to line coverage in peripheral urban areas to reduce the need for private car commuting. It is also recommended that the government implement a transit-oriented development (TOD) model based on the subway system. High-density mixed-use areas should be built around subway stations, integrating commercial, residential and public service facilities to shorten the travelling distance of residents and further enhance the substitution effect of the subway on private cars.
Third, the government should implement differentiated development strategies for different types of cities. For example, for densely populated cities with complex transport needs, such as the Yangtze River Economic Belt cities, subway construction needs to be linked to regional transport networks, such as water transport and intercity railways, to avoid the traffic creation effect offsetting the emission reduction effect. For cities with a low level of economic performance, it is recommended to focus on promoting the construction of low-cost and high-efficiency subway lines, and to simultaneously implement supporting policies such as bus fare subsidies. For resource-based cities, it is necessary to promote the construction of subway lines in synergy with industrial transformation programmes, attracting green industrial agglomeration by improving transport accessibility and reducing path dependence on traditional high-polluting industries.

