Article

Energy Consumption and Carbon Footprint of the Port of Sines: Contribution to Maritime Transport Sustainability

by
Teresa Batista
1,*,
Carmen Luisa Vásquez
1,*,
Rodrigo Ramírez-Pisco
2,
Lucas de Aquino Marinho
1,
Francisco António Borges
1 and
João Araújo
3
1
MED—Mediterranean Institute for Agriculture, Environment and Development & CHANGE—Global Change and Sustainability Institute, Institute for Advanced and Research, University of Évora, 7004-516 Évora, Portugal
2
UCMA—Research Department, University of Carlemany, Sant Julia de Loria, AD600 Andorra, Andorra
3
APS—Administração dos Portos de Sines e do Algarve, 7521-953 Sines, Portugal
*
Authors to whom correspondence should be addressed.
Sustainability 2025, 17(8), 3382; https://doi.org/10.3390/su17083382
Submission received: 30 January 2025 / Revised: 29 March 2025 / Accepted: 3 April 2025 / Published: 10 April 2025

Abstract

Calculating the energy consumption and carbon footprint is essential for maritime industry sustainability, driving informed decisions and innovation. This study assesses the energy consumption and carbon footprint of the Port of Sines in Portugal to support its decarbonization and energy transition, based on the scopes defined by the Greenhouse Gas Protocol. The proposed calculation model is detailed using different data sources for the 2018–2022 period. For each terminal, the monthly and annual energy consumption and carbon footprint are calculated, considering land and maritime activities into the port jurisdiction area. The results show that more than 99% of the port’s total energy consumption and carbon footprint are due to the operations and activities of the different terminals. On average, the Port of Sines consumes 422,378.45 MWh/year and has a carbon footprint of 224.63185 tCO2eq/year. The analysis reveals a non-linear relationship between energy and carbon footprint, due to the different port activities, emphasizing the need for tailored decarbonization strategies for each terminal.

1. Introduction

In light of the global nature of maritime transportation, several countries and regions bear responsibility for initiatives aimed at reducing risks, enhancing safety, and preventing pollution [1,2,3]. This diversity of interests fosters the coordination of efforts on a global scale, leading to the adoption of standards and practices for the entire sector. These standards and practices encompass not only activities on the high seas but also those conducted within the maritime ports [1,2,3].
The year 1950 marked a turning point with the transportation of a substantial volume of hydrocarbons by sea, prompting heightened awareness of the potential dangers to marine ecosystems from oil spills. In response to this growing concern, the first International Convention for the Prevention of Pollution of the Sea by Oil (OILPOL) was established in 1954. Subsequent to this, in 1973, the International Convention for the Prevention of Pollution from Ships (MARPOL) was endorsed, thereby expanding the scope of the original convention and replacing it [1]. Nevertheless, OILPOL remains the foundational document for those nations that have not adhered to MARPOL [2]. MARPOL [1] and its protocols comprise the international treaty that aims to further mitigate marine pollution [3,4].
The establishment of the Marine Environment Protection Committee (MEPC) in 1973 marked a significant development in this regard [5]. The MEPC, functioning as the senior technical body within the aim of the International Maritime Organization (IMO), plays a pivotal role in addressing the challenges posed by ship-based pollution. This encompasses the mitigation of emissions that pose a threat to human health and contribute to environmental degradation and climate change.
A primary objective of MARPOL is to safeguard the well-being of both humans and the marine environment [1,6]. The MEPC is structured into six annexes, among which is Annex VI, Prevention of Air Pollution in Ships (1997), which entered into force in 2005 and deals with emissions. This annex establishes the policies regarding the regulation of emissions and includes mandatory procedures to prevent atmospheric pollution. Chapters 3 and 4 include the policy established to achieve the reduction in emissions in maritime transport activity [1,6]:
  • Regulation 12: The Montreal Protocol on Substances that Deplete the Ozone Layer [7] and its amendments.
  • Regulation 13: Nitrogen oxides (NOx).
  • Regulation 14: Sulphur oxides (SOx) and particulate matter (PM).
  • Regulation 15: Volatile Organic Compounds (VOC).
  • Regulation 18: Fuel oil availability and quality.
  • Regulation 22: Energy Efficiency Design Index (EEDI).
  • Regulation 23: Energy Efficiency Existing Ship Index (EEXI).
  • Regulation 24: Required EEDI.
  • Regulation 25: Required EEXI.
  • Regulation 26: Ship Energy Efficiency Management Plan (SEEMP).
  • Regulation 27: Collection and Reporting of Ship Fuel Oil Consumption Data.
  • Regulation 28: Carbon Intensity Indicator (CII).
In 2018, the MECP.304 (72) [8] established the Initial IMO Strategy on Reduction of GHG Emissions from Ships including targets for emission reduction in the entire maritime industry in the Roadmap. This strategy includes steps for the carbon intensity of the ship, carbon intensity of international shipping, and greenhouse gas (GHG) emissions from international shipping to peak and decline by 2030 and 2050.
In 2023, the MECP.377 (80) [9] revised the Initial IMO Strategy [8] and established the IMO Strategy on Reduction of GHG Emissions from Ships, which includes indicative checkpoints to reach net-zero GHG emissions from international shipping:
  • To reduce the total annual GHG emissions from international shipping by at least 20%, striving for 30%, by 2030, compared to 2008.
  • To reduce the total annual GHG emissions from international shipping by at least 70%, striving for 80%, by 2040, compared to 2008.
The MECP.377 (80) [9] includes the following measures: “consider and analyze measures to encourage port developments and activities globally to facilitate reduction of GHG emissions from shipping, including provision of ship and shoreside/onshore power supply from renewable sources, infrastructure to support supply of zero or near-zero GHG emission fuels and/or energy sources, and to further optimize the logistics chain and its planning, including ports”.
Maritime ports play a crucial role in the loading and unloading of cargo, as well as in the provision of logistical services. However, this activity faces the challenge of reducing the emissions originating from ships, port authorities [10], and port operations [4,11,12]. The development of a decarbonization plan for port activity, based on the quantification of emissions, is identified as a pivotal task for managers, users [11], and researchers in this domain [4,11,12,13,14,15].
The calculation of the energy consumption and carbon footprint contributes to the sustainability of maritime transport by providing a basis for informed decision-making. Quantifying these metrics enables the identification of opportunities for enhancement, such as the implementation of strategies to improve energy efficiency [16] and reduce fossil fuel consumption [17] and emissions [12]. The continuous monitoring of these metrics enables the assessment of progress toward established emissions reduction targets and the demonstration of commitment to complying with regulatory obligations [9,18,19]. This comprehensive approach is instrumental in catalyzing innovation, fostering collaboration within the supply chain, and promoting the development of more sustainable and resilient maritime transportation systems [9,18,19].
As the accuracy of the calculation of the carbon footprint increases, the methodological complexity and information requirements also rise. The involvement of external agents to the organization itself considerably expands the complexity of the calculation, due to the amount of information required and the difficulty of making it available [20]. However, the greater detail and the comprehensive nature of the calculation make it a suitable tool for the establishment of emission reduction policies and thus for achieving carbon neutrality [21,22,23].
Maritime transport contributes as a fundamental pillar of the Portuguese economy, which increases its responsibility for the sustainable use of marine and coastal resources, while it stimulates economic development. In 2018, the broad spectrum of maritime activities contributed 5.1% to the gross domestic product (GDP) and 4% to national employment. Notably, the port sector accounted for 5% of the country’s total exports in the same year [24], surpassing the European Union (EU) average in terms of cargo volume. This transition presents a significant opportunity to enhance Portugal’s standing on the global stage. In this context, it is imperative to address the global challenges related to climate change, decarbonization of the maritime industry, and the enhancement of long-term sustainability in this sector [11,13,25,26].
Due to its localization and characteristics, the Port of Sines has a strategic importance in Europe, and it is considered its Atlantic Gate [25]. The present study aims to provide a comprehensive energy consumption characterization and carbon footprint analysis of the Port of Sines during the period of 2018 to 2022 as a contribution to maritime transport sustainability.
This study involves the definition of a calculation model integrating multiple data sources from the Port Authority and also from its concessionaires and terminals. This methodology addresses the knowledge gap concerning the decarbonization of multi-terminal and multimodal maritime ports. The implementation of this methodology contributes to the development of best practices in the maritime transport supply chain.
For maritime ports, although there are several methodologies for assessing carbon footprint, different contexts and challenges in accessing data often impose restrictions in the calculation of the indirect emissions of ports [27]. The developed methodology was based on the recommendations of the GHG Protocol [28], on the Port Emissions Toolkit [29], and other relevant publications [18,20,30,31,32,33,34,35]. It aims to reflect the multi-operational specificities, within the multi-terminal and multimodal logistics node of the Port of Sines. Such specificities include a variety of cargo types, transport modes, and distinct terminal characteristics [18,20,30,31,32,33,34,35].
Several studies only contemplate specific terminals or transport modes [20,21,27,35,36]. Nevertheless, few studies [32] consider a methodology that assesses the total port emissions, such as the present case study, where we analyze both energy consumption and carbon footprint for land and maritime transportation. Among the main data sources were the Port Single Window (JUP) and the Logistics Single Window (JUL) [37], which provided data on ship characteristics, movements, and land transport. The specific emission factors were obtained from Portuguese Environment Agency (APA) reports [38]. The methodology employed is replicable on other ports [13,20,21,27,35,36].
The following sections provide a comprehensive description of the materials and methods used in the study and the main results obtained by terminal, considering the diversity of cargo types and emission factors, and finally, the most important conclusions of the study.

2. Materials and Methods

2.1. Port of Sines, Portugal

The Port of Sines (Figure 1) is a piece of maritime infrastructure of vital importance to Portugal, the EU and other countries outside this region. Its location on the Atlantic coast, depth, and facilities make it at an important logistics node. One of the port’s main natural characteristics is its natural depth, with an average of 18 m (max. of 28 m), which is greater than many other maritime regions [21,39].
At present, the Port of Sines has the most important container terminal in the country and is among the most significant ports within the EU, playing a significant role in facilitating international trade and cargo transportation. Additionally, the port’s strategic position in the energy sector, acting as a pivotal hub for the reception of liquid fuels, contributes to the economy and serves as a significant asset for the integration of Portugal within the European market [40].
In 2024, the Port of Sines managed a total cargo of 47,827,062 t, marking an 11.3% increase compared to the same period in the previous year. Concurrently, the number of ships operating within the port decreased by 1.4%, with a total of 1839 ships managed. Table 1 provides a detailed distribution of the cargo by terminal and the respective origin and destination [41].

2.2. General Description

In order to achieve the goal of carbon neutrality, the IMO has established 2008 as the baseline year for comparison, with targets defined for the years 2030 and 2040 [9]. However, an alternative baseline year may be selected, depending on data availability [29]. Tank to wheel (TTW) emissions are taken into consideration [23], classified according to the three scopes of the GHG Protocol [28], which is recommended for analogous studies [29]. For each scope, emissions from land-based and maritime activities, as well as stationary and mobile activities, have been estimated for the Port of Sines jurisdiction area (AJAPS), along with each terminal and the different types of services.
The Port of Sines features five specialized terminals with private concessions, including the Containerized Cargo Terminal (SCT), Liquid Bulks Terminal (LBT), Liquefied Natural Gas Terminal (NGT), Petrochemicals Terminal (PCT), and Multipurpose/General Cargo Terminal (GCT). This last terminal replaced, in 2022, the previous Dry Bulk Terminal (DBT). Additionally, the “Others” category encompasses the Sports and Fishing Port, the tugboat service concession, and electrical services provided to the Sines Industrial and Logistics Zone (ZALSINES). These entities possess a variety of maritime and inland infrastructures, technologies, and inland transport modes for their cargo, among other attributes. The aforementioned factors result in a calculation of energy consumption and carbon footprint that is differentiated for each terminal [42]. Table 2 and Figure 2 provide a description of the terminals and, in general terms, the aspects considered in each scope in the methodology.
The methodology considers the consumption of fuels and electricity used and their respective emission factors. Furthermore, the statistics of ships and cargo managed by each terminal for the period 2018–2022 was obtained from Ports of Sines Authority (APS) statistics reports, JUP/JUL platforms, and concessionaires. In MECP.377 (80) [9], the base year for comparison is 2008. However, there are only complete data available to calculate the three scopes from 2018. In this sense, this has been considered as the base year.

2.3. Scopes

Scope 1 [28] considers the consumption of fossil fuels used by the Ports of APS for land and maritime activities carried out within the jurisdiction area. Scope 2 [28] encompasses the electricity consumption calculated based on the purchase and sales by APS. Scope 3 [28] involves the calculation of energy consumption for the maritime and land transport activities at each terminal, in addition to its electricity consumption. While the calculation of Scope 3 encompasses indirect emissions, it is crucial for the establishment of effective emission reduction policies at the port. This is due to the fact that it enables the identification of the main emission sources associated with the concessionaires and the implementation of joint measures [14].
For Scope 1 [28], the following fuels are considered:
  • Natural gas for boilers.
  • Diesel fuel for the emergency power plant.
  • Diesel fuel for employees’ collective transport vehicles.
  • Diesel and gasoline fuel for private employee transport vehicles.
  • Diesel fuel for the pilot boats within the AJAPS.
Scope 2 [28] includes electricity consumption based on the records kept by APS and the emission factors of APA [38].
Scope 3 [28] includes the calculation of energy and emissions from the activity carried out by the concessionaires in the different terminals. Energy consumption and carbon footprint are calculated for the end use of electricity and for maritime and land transport [29].

2.4. Scope 3

Table 3 presents the annual average of the data from each terminal for the study period, used for Scope 3, where even though “Others” are considered in the calculation of this scope, their data are not featured in the following table, due to their high variability. As can be seen in the table, there is a diverse range of types of ships (with different main engine and deadweight tonnage), maneuvering times and equipment for load/unload cargo for each terminal. Additionally, Scope 3 includes the energy consumption and the calculation of the carbon footprint of the sport and fishing ports, ZALSINES, and the ship service tugboats, since these are operated by concessionaires.

2.4.1. Maritime Transport

Regarding the ship movement data, until 2019, the maritime transport information was obtained from the JUP. In 2020, the JUL information system replaced the previous JUP, according to Law Decree No. 158/2019 [37]. The JUL is the technological platform for defining and supporting the flow of information relating to the formalities of declaration, planning, execution, and monitoring of the maritime transport logistics chain that ports use in Portugal. This platform contains a wide range of information, including details on ship characteristics, cargo declaration, access to facilities, operations in the terminals, and other maritime logistics data. It also provides transport information on road and railway movements [43].
Furthermore, the information regarding maritime transport includes [37,43]:
  • The type of ship and fuel used, IMO id, and other pertinent features.
  • The type and times of maneuvers per terminal: The Passenger Locator Form (PLF)-Entry, anchoring, suspending, berthing, departing, and PLF-Exit maneuvers.
The calculation of the emissions is carried out based on the information regarding the type of ship, the fuel used, and the time duration of the maneuvers, according to the methodology recommended in the European Environment Agency (EEA) [33]. This methodology involves the calculation of the energy consumption and emissions as a function of the power and load factors of the ME and auxiliary engine (AE) of the ship, as well as the execution time of each maneuver within the AJAPS. The load factor, AE/ME proportion, and fuel type are also considered. In this methodology, the AE is estimated as a percentage of the ME depending on the type of ship, regarding the EEA [33].
A total of 28,785 maneuvers were analyzed during the 5-year period of the study; however, only 48% of these data included the power of the ME. To complete the data for the missing values [44], they were assigned based on linear regression.

2.4.2. Land Transport

For land transport, the following fuels are considered:
Diesel and gasoline for the pendular movement of employees by terminal in private and collective vehicles. It is noteworthy that these data are not typically included in the carbon footprint calculation models [15]. In the present study, all data from these calculations were considered to ensure enhanced accuracy and detail in the model. The following data were considered:
o
Number of employees at concessionaires and terminals, provided by APS.
o
Vehicle occupancy rate: 1.2 passengers/vehicle.
o
Distribution of vehicles: 60% diesel and 40% gasoline.
In accordance with the methodology, only the journey within the AJAPS was considered.
Diesel for the transport of cargo by container, general cargo, and cryogenic trucks for LNG terminal.
Electric power for the train line for container transport. Full locomotive and full truck (cargo) are the load factors considered.

2.4.3. Electrical Energy Consumption

The electric energy consumption data were derived from APS records concerning the energy purchases and sales, which were provided to the terminal operators. Additionally, the energy data supplied by external electricity providers to the NGT and PCT were used. Similar to Scope 2, the emission factors are the ones defined by APA for each year [38].

3. Results and Discussion

As described in 
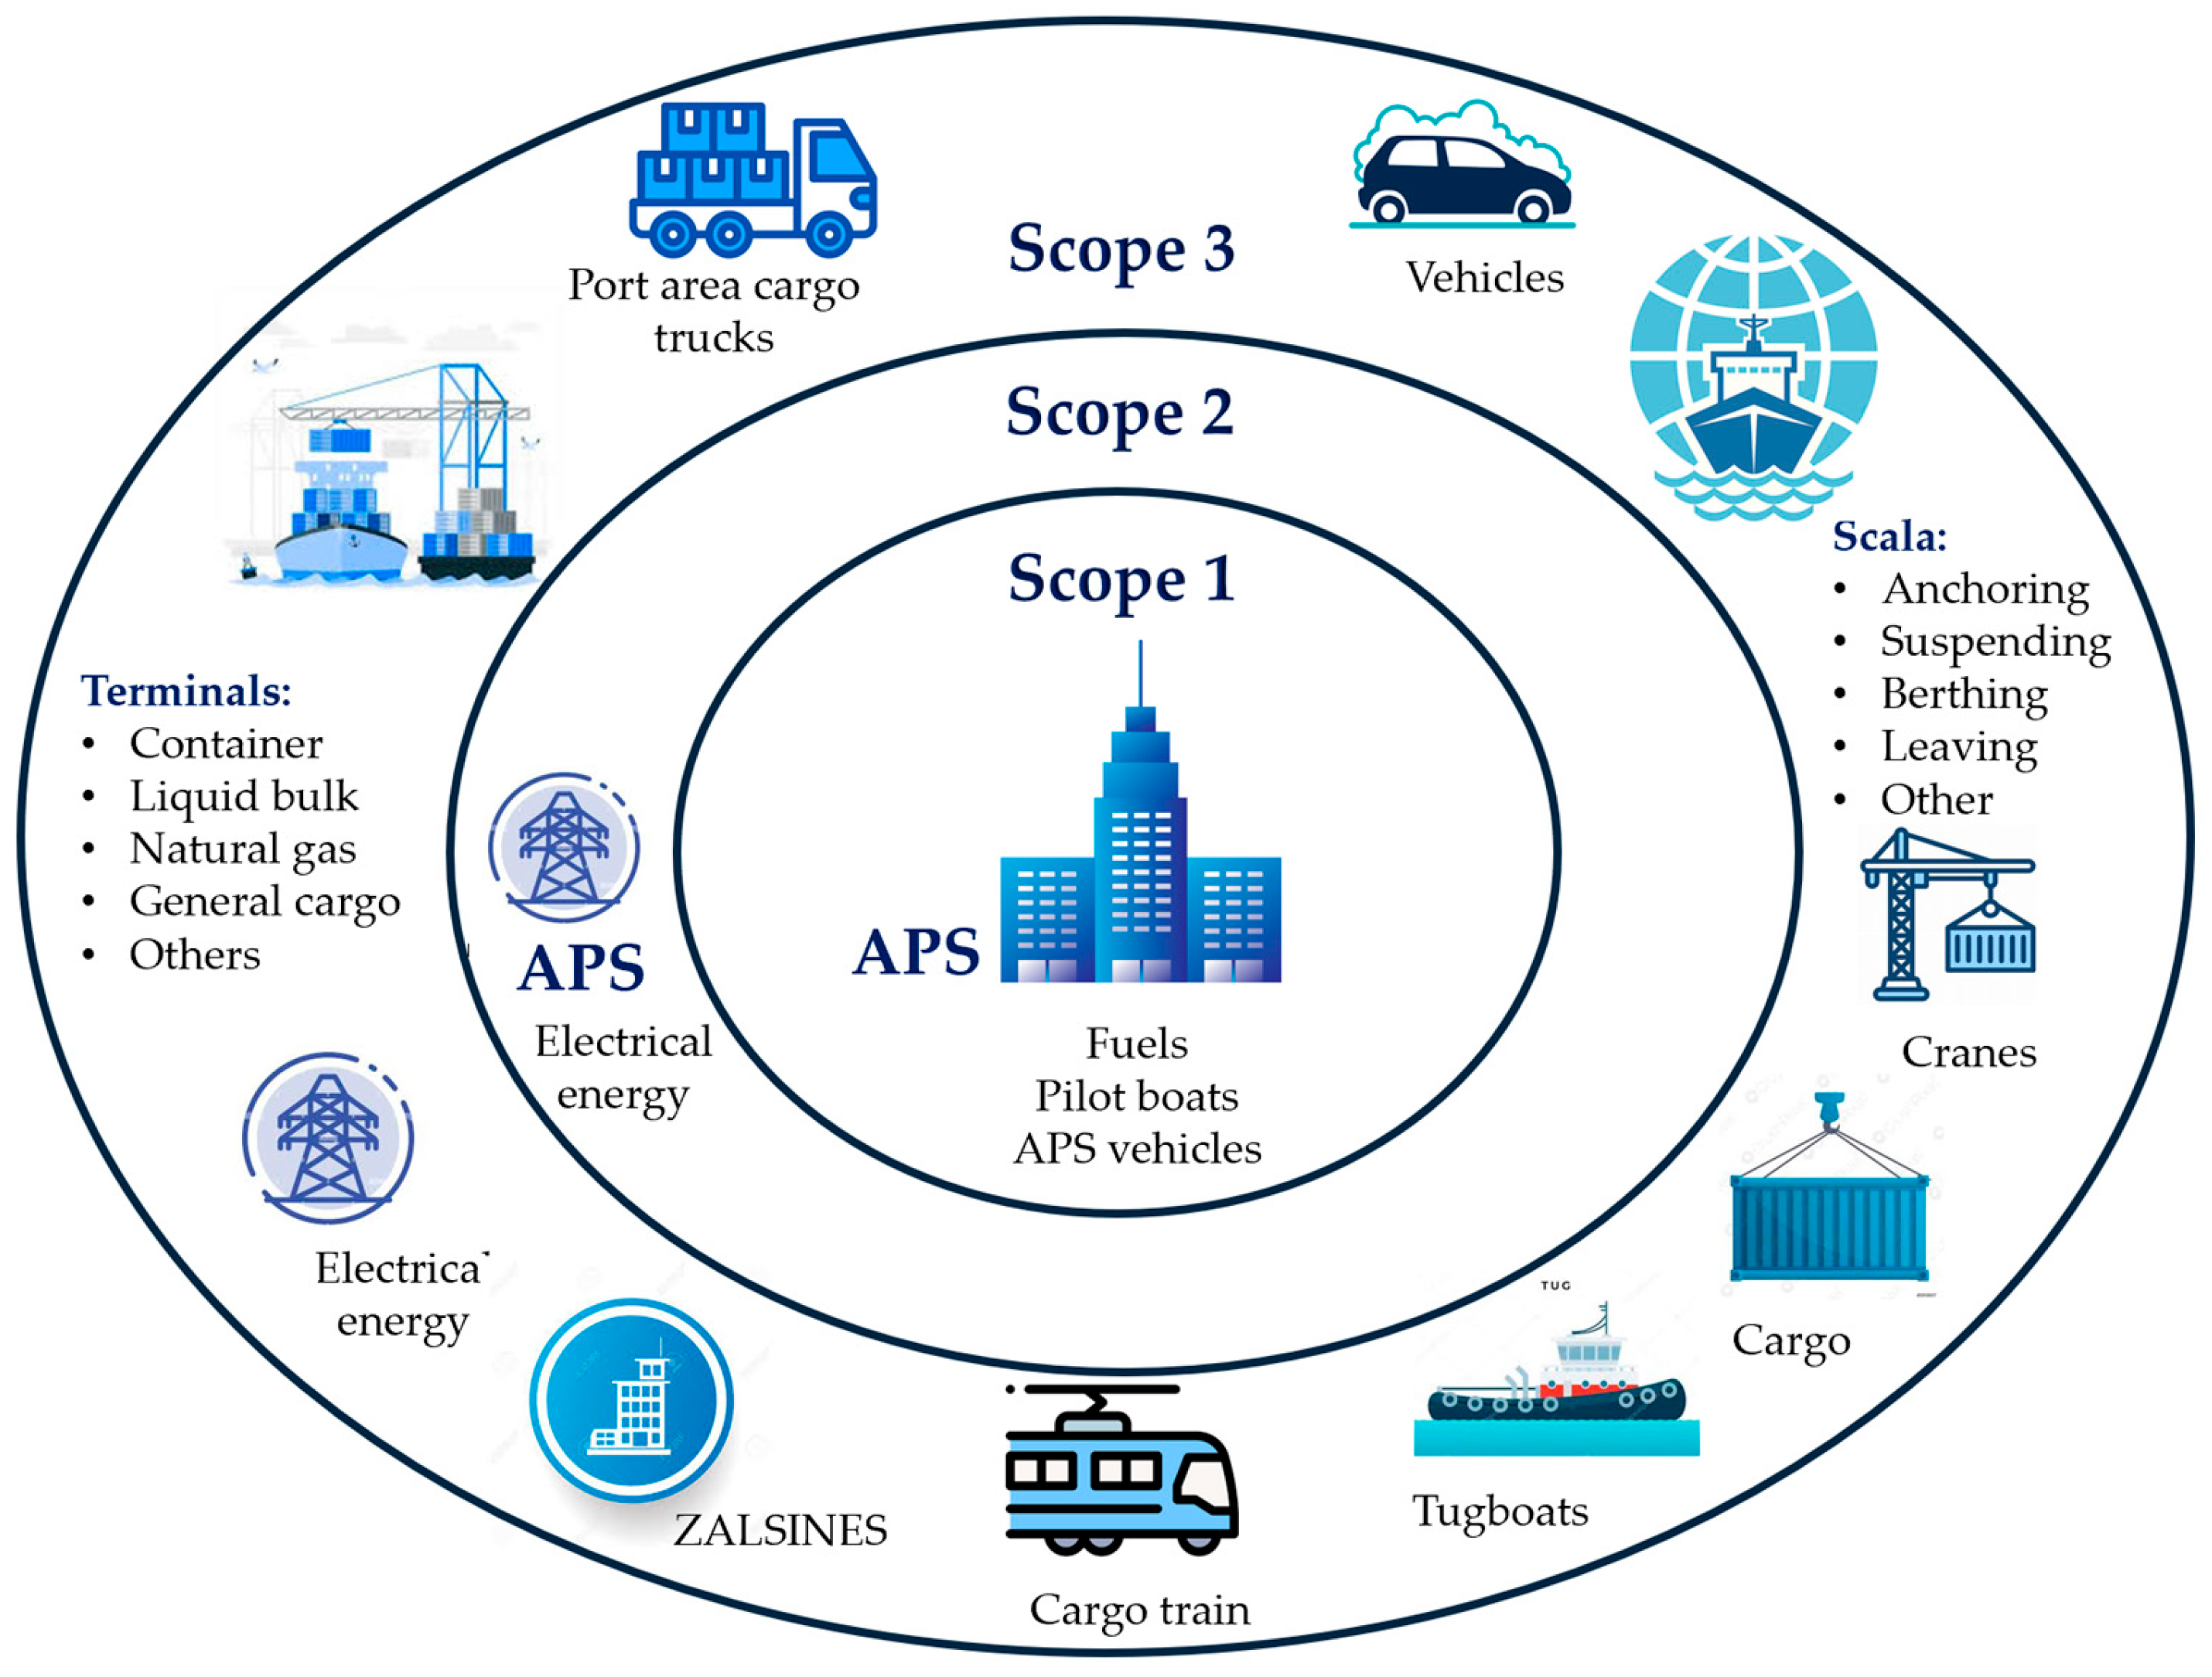
Section 2, the proposed methodology can be replicated at other multi-terminal and multimodal maritime ports by considering factors such as maritime and land boundaries, classification of emission sources by Scope, data sources of operations and emission factors, type of ships and cargo for each terminal, land operation modes, historical records of maritime and land operations, and type of equipment for loading and unloading, among others.
The calculations of energy consumption and carbon footprint were made on a per-movement basis for each type of cargo and then analyzed on a monthly and annual basis. Table 4 and Table 5 show energy characterization and carbon footprint averages. It can be observed that, on average, over 99% of the energy consumption and carbon footprint is attributable to Scope 3.
Considering the year 2018 as a baseline, Figure 3 presents a non-linear relation between the independent variables (number of ships and total annual cargo) and the dependent variables (total energy consumed and carbon footprint).
Specifically, regarding 2018, it can be noted that in the year 2022 there is a reduction of 20% in the ships served and 6% in the managed cargo:
  • During the period between 2018 and 2021, the energy consumption increased by 38% and the emissions by 32%, despite the reduction in the number of ships and cargo handled.
  • The year 2021 has the largest energy and carbon footprint values. This can be explained by the increase in anchoring and berthing times in most of the terminals (Figure 4) [45].
  • In 2022, we observed a decrease in both energy consumption (2%) and carbon footprint (14%).
  • Table 6 shows the correlation between energy consumption, carbon footprint, number of ships, and cargo handled. In this table, it can be observed that there is no significant correlation between these variables.
A closer examination of Figure 4 and 
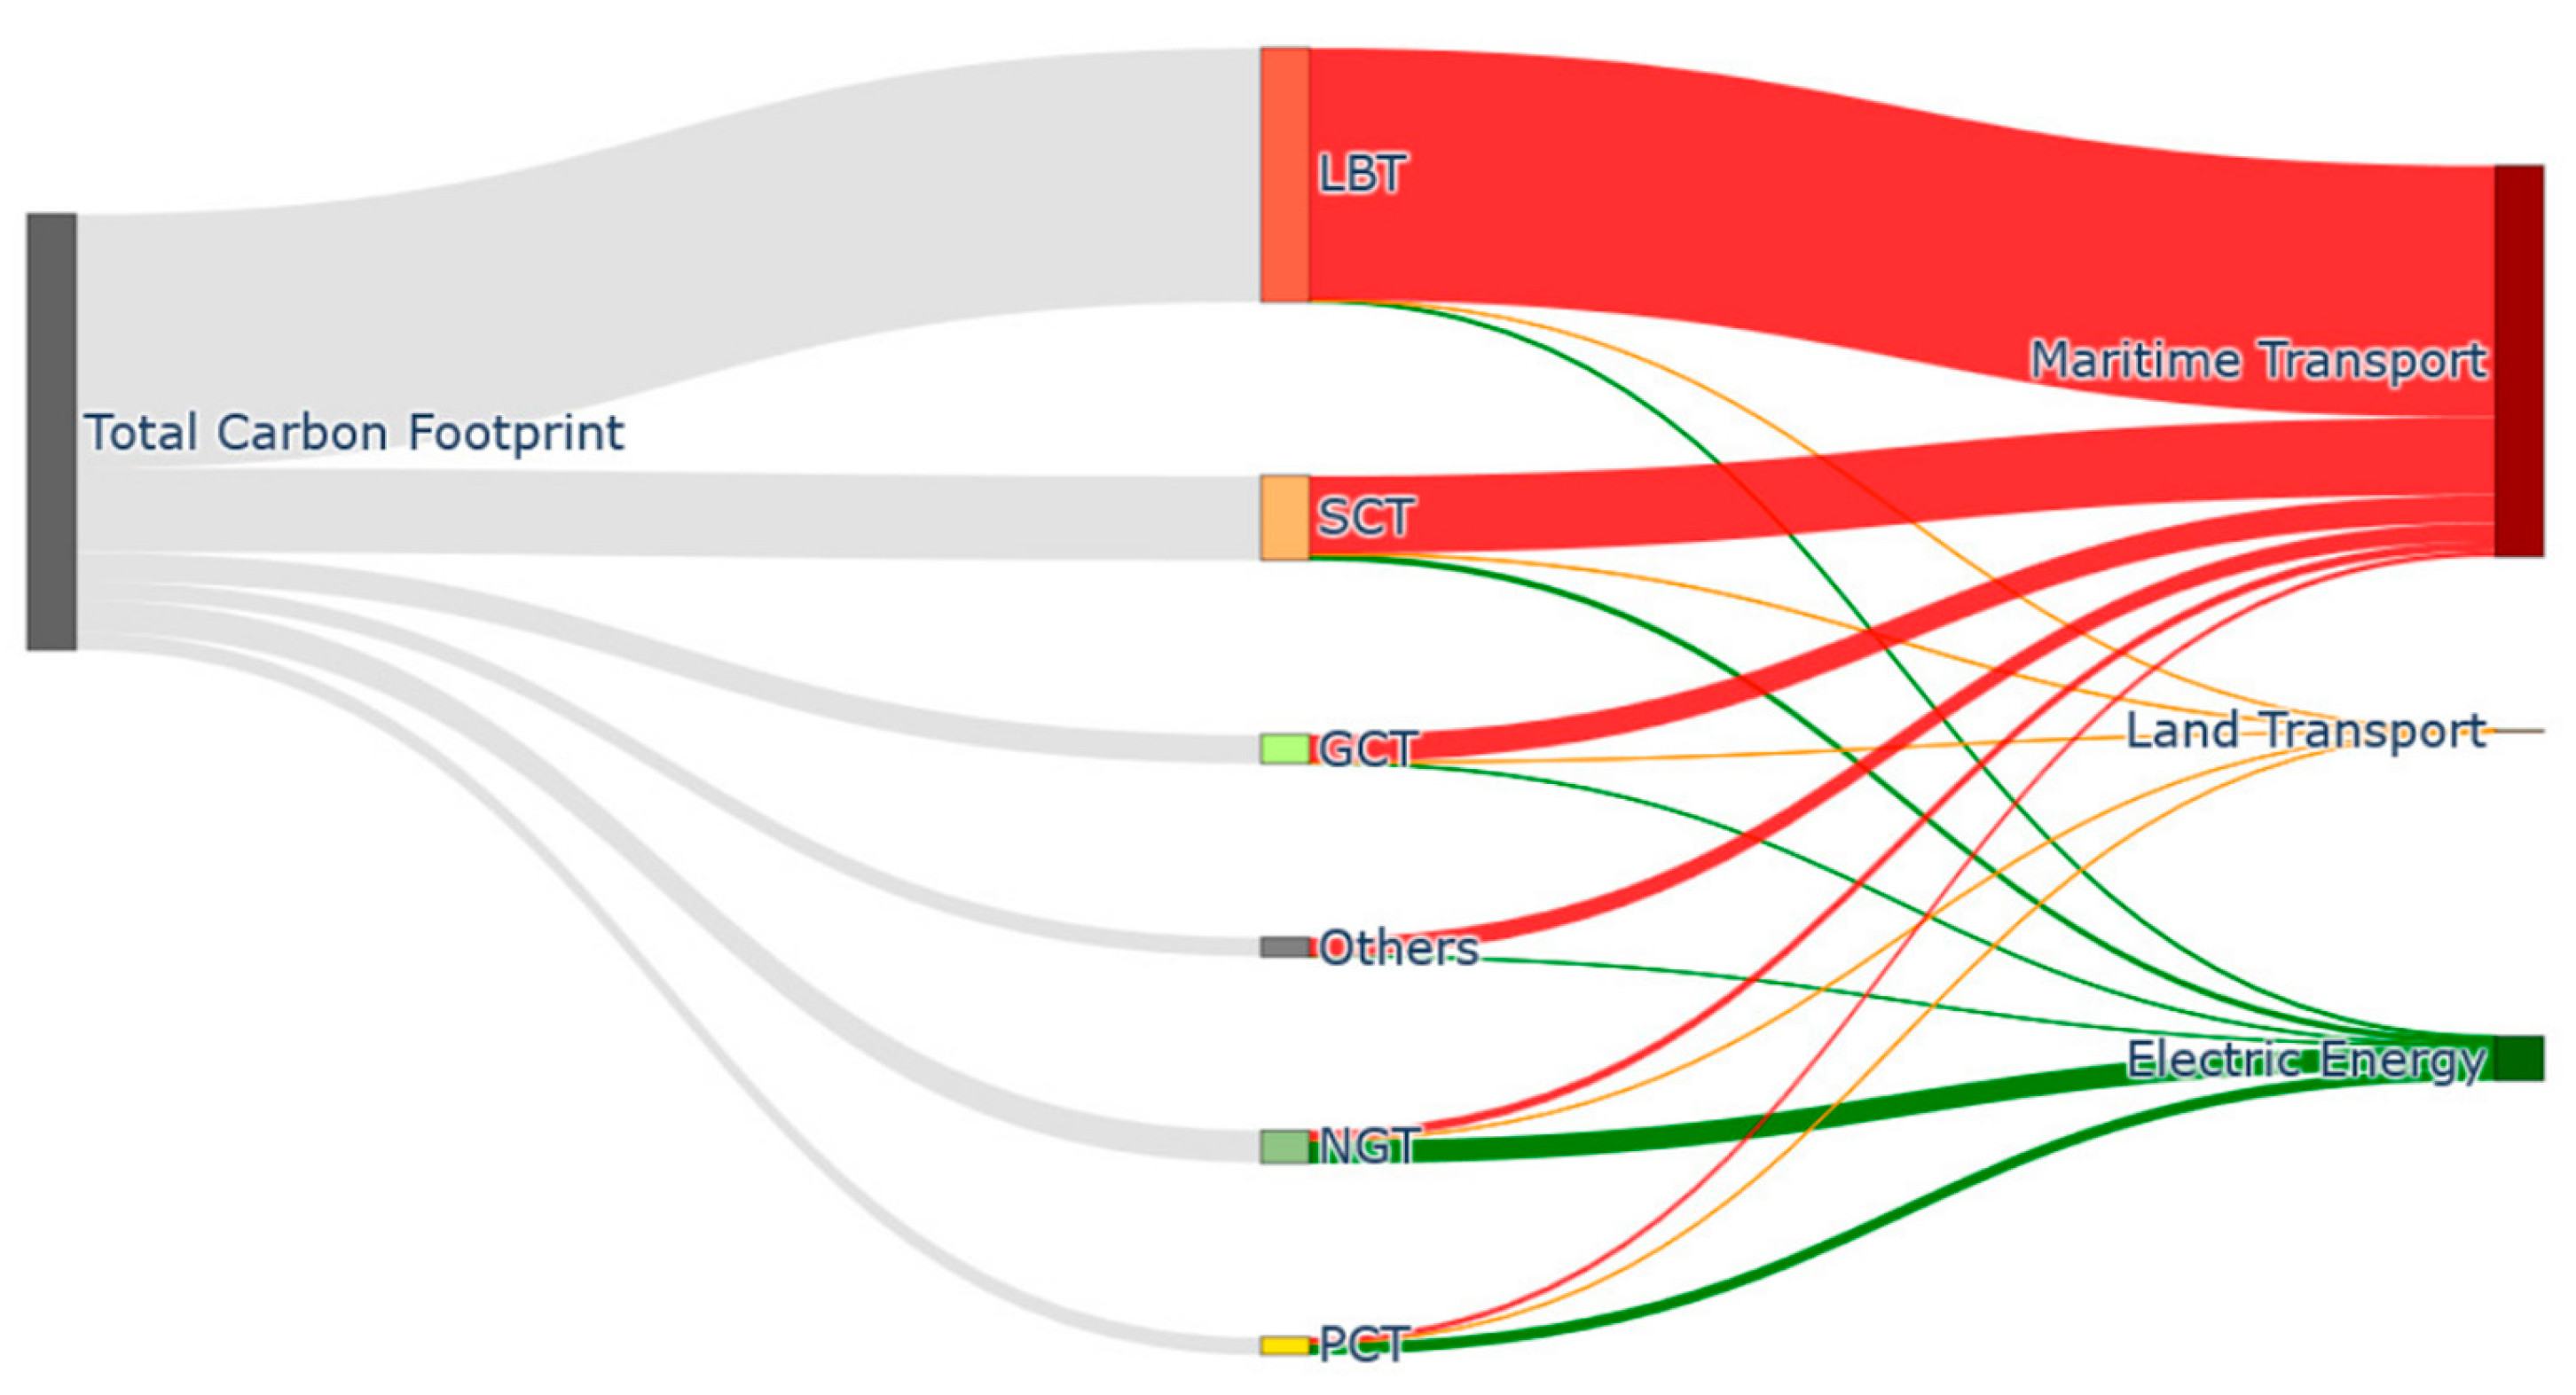
Table 5 reveals distinct patterns. The LBT exhibits the highest values for both energy consumption and carbon footprint, while ‘Others’ show the lowest values. However, in the top two for energy consumption is the NGT, which does not match this position in terms of carbon footprint, as it has been displaced by the SCT. This indicates heterogeneity in the relation between the variables. For LBT, Others, SCT, and GCT, the highest consumption is attributed to maritime transportation. In contrast, the emissions produced by tugboats are less significant. PCT and NGT demonstrate the highest levels of electric energy consumption, while SCT and GCT exhibit a consumption rate between 4% and 2%, respectively, related to land transport freight.
Figure 5 presents this consumption in absolute values, and it is evident that the LBT has the highest value due to maritime transport, matching with being the deepest terminal. Figure 6 and Figure 7 show the Sankey diagrams for the energy consumption and carbon footprint for the year 2022. Figures illustrates the highest energy consumption of each terminal, where it is evident that it depends on their characteristics.
In Table 3 and Table 4, for the period 2018 to 2022, the total carbon footprint was reduced by 13.95%. This is due to several factors:
(a)
Scope 1, which is the emissions due to the consumption of APS fuels. During this period:
a.
The boiler’s natural gas consumption was reduced due to the closure of a restaurant in 2021.
b.
During the years 2021 and 2022, fuel consumption for electrical plants was not reported.
c.
There is a 15.7% reduction in diesel consumption of the pilot boats.
(b)
Scope 2, which concerns the emissions related to the electric energy consumption in the APS, was significantly reduced, due to the 44.5% decrease in the emission factor reported by APA [38] for this period. This was due to the incremental use of renewable energy in Portugal [46].
(c)
Scope 3 represents the carbon footprint of the concessionaries. During this period:
a.
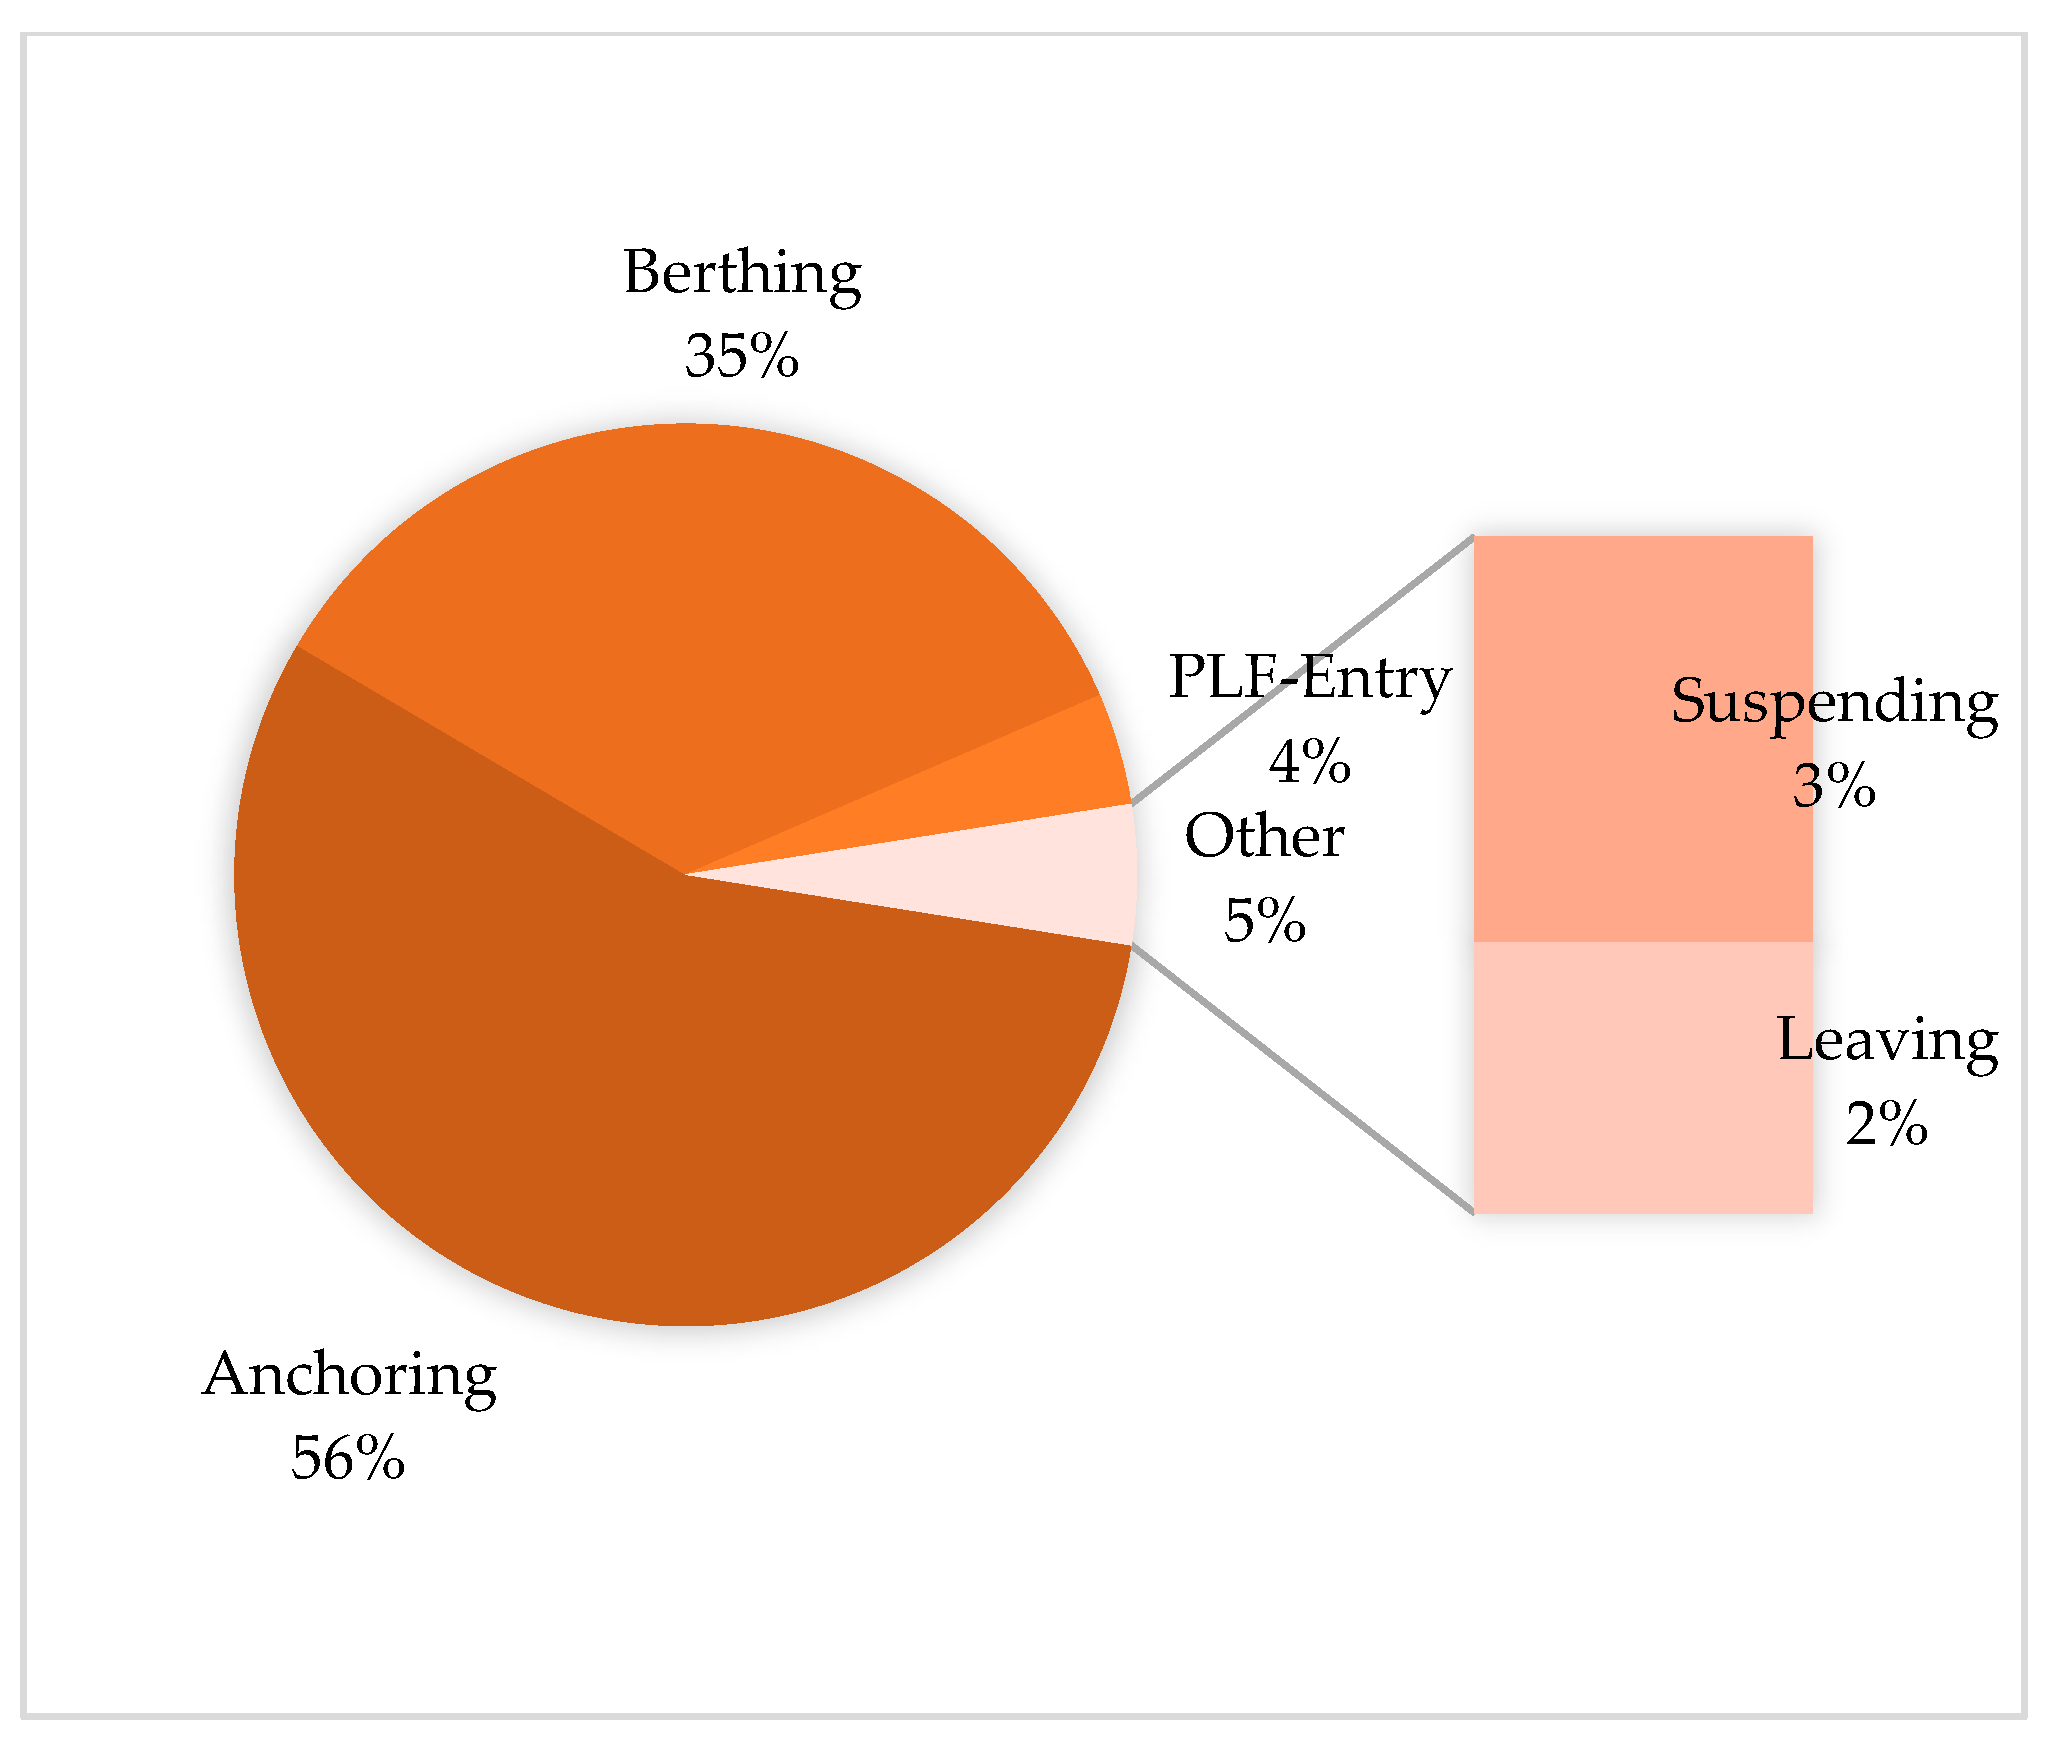
On average, LBT contributed to 59.79% of the carbon footprint. In addition, 99.3% of its emissions are due to maritime transport. For this period, the managed cargo increased by 17.2% and the number of ships served by only 2.3%, going from 23,238.2 to 26,467.6 t/ship, that is, larger ships were attended. On average, 56% and 36% of the emissions occur during anchoring and berthing, respectively. During 2022, there was an increase in these times of 31.3% and 15.9%, respectively. Even the percentage of ships anchoring increased from 51% to 61% during this period, which indicates that the measures to reduce its carbon footprint must be aimed at lowering the percentage and anchoring time of the ships.
LBT terminal has the greatest depth (Table 2) and is in second place in terms of ships served (Table 3), with a large variety of ship types. In addition, based on the model for calculating emissions from maritime transport, the load factor of the AE is higher in these types of ships [33]. Figure 8 shows, on average, the percentage of emissions by type of maneuver for this terminal.
b.
The SCT contributes an average of 19.88% to the carbon footprint. This terminal, in December 2019, increased the number of cranes to 10, which improved the efficiency in the loading and unloading of the container ships. In total, 91.2% of their emissions are due to maritime transport, related to 27% and 52% that occur during anchoring and berthing, respectively. For this period, the percentage of ships anchoring decreased from 9.9% to 4.8%. However, there was an increase in the berthing time of 29.9%, due to an increment in the cargo handled from 1726.3 to 2104.6 TEU/ship. This represents the most efficient terminal in the port due to its relatively low number of ships in anchoring phase. The remaining emissions are due to electric energy consumption (7.5%) and land transport. The electric energy in this terminal is used for the operation of cranes and gantries and their building headquarters, which had an increase in consumption. However, thanks to the decrease in the emission factor [38], the carbon footprint has been reduced.
Finally, the land transport contributes to 1.3% of the carbon footprint, where 70% of this value is related to the transport of cargo within AJAPS (30% and 40% by rail and road transport, respectively) in 1.9 km (rail) and 2.1 km (road).
For this type of terminal, measures to reduce its carbon footprint are found to be related to the use of alternative fuels in AE, increasing the efficiency of its engines, or the possibility of their replacement by electrical engines fed from the terminal during the berthing process, which represents 41.9% of the total operation time in the port and a 51.8% contribution to the emissions. This terminal has the greatest number of ships served (Table 3) and DWT. Figure 9 shows the average percentage of emissions by type of maneuver of this terminal.
c.
NGT contributes to 7.63% of the carbon footprint. Unlike the other two terminals, 70.6% is due to energy consumption of the facility pumping systems for loading and unloading ships. This terminal has an increase in its cargo and number of ships for this period, which has a positive impact on the energetic transition of the country, with LNG being the fuel that has replaced coal in its electrical power plants [26]. However, this has gone from 63,396.6 t/ship to 59,271.9 t/ship for the years 2018 and 2022, respectively. A total of 29.2% of its carbon footprint is due to maritime transportation, which has been reduced thanks to the decrease in the anchoring and berthing times of 16.9% and 5.06%, respectively. In addition, there has been a reduction from 13% to 9% in the ships that anchor. Less than 7% of its cargo is transported by land, hence the contribution to the carbon footprint is less than 0.2%. As a measure to decrease the carbon footprint, the reduction in the emission factor by electricity consumption must be included [38], aligned with the decarbonization policy of the energetic matrix in Portugal [26].
Additionally, during the unloading process of the cryogenic ships, there are cold losses that could be recovered to reduce the refrigerant consumption in the SCT reefer containers and, as a consequence, the port’s total carbon footprint, promoting the circular economy. Figure 10 shows the average percentage of emissions by type of maneuver at this terminal.
d.
GCT, PCT, and Others contribute a total of 12.7% to the port’s carbon footprint. Approximately 80.6% of this footprint is due to maritime transportation. Of this value, 35.6% is emissions due to the use of the tugboats, which decarbonization would impact positively in reducing the total carbon footprint. By the second half of 2022, the GCT replaced the DBT, which has had a positive impact by reducing its carbon footprint.
e.
The carbon footprint of the PCT is due by 67% and 33% to electrical energy consumption and maritime transportation, respectively. The carbon footprint from the consumption of electric energy has been decrease thanks to the reduction in the emission factors [38]. An average of 3593.7 t/ship of maritime transport is maintained despite the increase in its managed cargo by 18%, guaranteeing its efficiency. Meanwhile, 65% of its emissions are due to anchoring and only 30% due to berthing. However, the times of these operations have been reduced by 75.3% and 7.2%, respectively. In addition, the percentage of ships in anchoring has reduced from 68.8% to 37.5%, demonstrating improvements in efficiency from a logistical point of view.
On average, the anchoring time and emissions from this terminal account for approximately 46.5%, a similar value to berthing. To reduce the carbon footprint, increasing efficiency in the logistics of ship waiting times and implementing measures for the AE can be effective.
The carbon footprint of the Port of Sines’ terminals is contingent on maritime activity, particularly berthing and anchoring maneuvers (Figure 8, Figure 9 and Figure 10). Given the risks associated with BLT, GNT, and PCT [47,48,49], some of the potential mitigation strategies are included in Table 7. These measures are supported by several policies and regulations that are already ongoing in the maritime sector at global and European levels [47,48,49].

4. Conclusions

The following work includes the energy characterization and carbon footprint calculation of the Port of Sines for the period of 2018–2022. This characterization is carried out for each of its terminals and their specific activities. Within this framework, it is shown that Scope 3, due to the activity of the concessionaires and the movement of cargo, contributes more than 99% of the energy consumption and carbon footprint of the port as a whole. The study also revealed that with the reduction in the attended ships, there was a decrease in diesel consumption of the pilot boats, which impacted the total carbon footprint of Scopes 1 and 3.
The Port of Sines’ importance for the country’s energy sector is accomplished through its dedicated liquid fuels and liquefied natural gas terminals, which reveal the importance of its carbon footprint assessment and reduction. On average, these terminals represent 65.9% of the energy consumption and 67.4% of the carbon footprint of the port. This is due to the timing of the different maritime operations, particularly berthing and anchoring maneuvers.
The maritime container terminal is the one that manages the largest cargo of the Port of Sines. However, on average, it only represents 18.8% of the energy consumption and 19.9% of the carbon footprint. The total dwell time of this terminal’s ships within the area of jurisdiction is the shortest of all the terminals. In addition, the cargo unloading equipment is electric, eliminating emissions from diesel fuel consumption. For decarbonization, alternatives such as onshore and offshore power supply can be implemented. Even with a connection to the public grid, the emission factor of Portugal’s energy matrix is being progressively reduced.
On average, the Port of Sines consumes a value of 422,378.45 MWh/year and has a carbon footprint of 224,631.85 tCO2eq/year. Being a multi-terminal and multimodal port, its calculation model was non-homogeneous and has required detailed data to ensure its accuracy. We observe that the variables that impact in the characterization of consumption energy and carbon footprint depend on the characteristics of the ships and the modes of transit of cargo.
MECP.377 (80) [9] requests a reduction in GHG emissions from international shipping by at least 20% by 2030, compared to 2008. Although the present work considers the base year of evaluation of 2018, the Port of Sines had reduced its carbon footprint by 13.95% by 2022. This is mainly due to the increase in the cargo per ship, the transition in the Portuguese energetic matrix, and also the improvement of the efficiency in the maritime operation, mostly in the container’s terminal.
The model proposed in this paper considers the diversity of information sources, maritime operations, cargo types, and ships, among other relevant aspects. This adaptability makes it a particularly useful tool for multi-terminal and multimodal ports, where heterogeneity of activities and infrastructures is a predominant characteristic.
The results obtained allow for the identification of the main sources of greenhouse gas emissions and have allowed the identification of the most promising improvement opportunities. The findings of this study have significant implications for strategic decision-making in the Port of Sines and can be used as a model for achieving carbon neutrality in Sines and in the maritime transportation sector.

Author Contributions

Conceptualization, T.B., R.R.-P. and C.L.V.; methodology, T.B., R.R.-P., C.L.V. and F.A.B.; data curation, R.R.-P., C.L.V. and F.A.B.; writing—original draft preparation, C.L.V.; writing—review and editing, T.B., C.L.V., R.R.-P., L.d.A.M. and F.A.B.; supervision, T.B. and R.R.-P.; project administration, T.B. and J.A.; funding acquisition, T.B. and J.A. All authors have read and agreed to the published version of the manuscript.

Funding

The contents of this article were produced within the scope of the Agenda “NEXUS—Pacto de Inovação— Transição Verde e Digital para Transportes, Logística e Mobilidade”, financed by the Portuguese Recovery and Resilience Plan (PRR), with no. C645112083-00000059 (investment project no. 53).

Institutional Review Board Statement

Not applicable.

Informed Consent Statement

Not applicable.

Data Availability Statement

The data presented in this study is available on request from the corresponding author.

Acknowledgments

We express our sincere gratitude to the Administração dos Portos de Sines e do Algarve (APS) for providing access to the necessary data and to the NEXUS Agenda for enabling our participation in this significant project.

Conflicts of Interest

Author João Araújo was employed by the company APS—Administração dos Portos de Sines e do Algarve, S.A. The remaining authors are investigators at the University of Évora. All authors de-clare that the research was conducted in the absence of any commercial or financial relationships that could be construed as a potential conflict of interest. The authors declare that this study re-ceived funding from the PRR—Recuperation and Recovery Plan. The funder had no involvement with the study.

Abbreviations

The following abbreviations are used in this manuscript:
AJAPSPort of Sines jurisdiction area
APAPortuguese Environment Agency
APSPort of Sines Authority
CIICarbon intensity indicator
EEAEuropean Environment Agency
EEDIEnergy Efficiency Design Index
EEXIEnergy Efficiency Existing Ship Index
EUEuropean Union
DBTDry bulk terminal
DWTDeadweight tonnage
GCTGeneral cargo terminal
GDPGross domestic product
GHGGreenhouse gas
GTGross tonnage
IAPHInternational Association of Ports and Harbors
IMOInternational Maritime Organization
JULLogistics Single Window
JUPSingle Port Window
LBTLiquid Bulk Terminal
LNGLiquefied natural gas
MARPOLInternational Convention for the Prevention of Pollution from Ships
MEPCMarine Environment Protection Committee
NGTNatural Gas Terminal
PCTPetrochemical Terminal
PLFPassenger Locator Forms
PMParticulate material
RMGRail-mounted gantry
RTGRubber-tired gantry
ro_roRoll-on/roll-off
OILPOLConvention for the Prevention of Pollution of the Sea by Oil
SCTSine’s Container Terminal
SEEMPShip Energy Efficiency Management Plan
TTWTank to wheel
VOCVolatile Organic Compounds
ZALSINESPort and Industrial and Logistics Zone of Sines
ZILSSines Industrial and Logistics Zone

References

  1. UN. International Convention for the Prevention of Pollution from Ships (1973). Protocols, etc. 17 February 1978. Available online: https://digitallibrary.un.org/record/246517 (accessed on 1 June 2024).
  2. Sáez, P. From maritime salvage to IMO 2020 strategy: Two actions to protect the environment. Mar. Pollut. Bull. 2021, 170, 112590. [Google Scholar] [CrossRef] [PubMed]
  3. Tanaka, Y. Regulation of Greenhouse Gas Emissions from International Shipping and Jurisdiction of States. Rev. Eur. Comp. Int. Environ. Law 2016, 25, 273–401. [Google Scholar] [CrossRef]
  4. Issa, S.; López-Gutierrez, J.; Esteban, M.; Fernández-Sánchez, G.; Garay, R. Scope of the Literature on Efforts to Reduce the Carbon Footprint of Seaports. Sustainability 2023, 15, 8558. [Google Scholar] [CrossRef]
  5. IMO. Marine Environment Protection Committee (MEPC). Available online: https://www.imo.org/en/MediaCentre/MeetingSummaries/Pages/MEPC-default.aspx (accessed on 15 February 2024).
  6. IMO. International Convention for the Prevention of Pollution for Ship 1978. Available online: https://www.imo.org/en/about/Conventions/Pages/International-Convention-for-the-Prevention-of-Pollution-from-Ships-(MARPOL).aspx (accessed on 15 February 2024).
  7. UNEP. The Montreal Protocol on Substances that Deplete the Ozone Layer 1989. Available online: https://ozone.unep.org/treaties/montreal-protocol (accessed on 1 February 2025).
  8. IMO/MEPC. Resolution MEPC.304(72). Initial IMO Strategy on Reduction of GHG Emissions from Ships 2018. Available online: https://wwwcdn.imo.org/localresources/en/KnowledgeCentre/IndexofIMOResolutions/MEPCDocuments/MEPC.304(72).pdf (accessed on 12 January 2024).
  9. IMO/MEPC. Resolution MEPC.377(80). 2023 IMO Strategy on Reduction of GHG Emissions from Ships. 2023. Available online: https://wwwcdn.imo.org/localresources/en/MediaCentre/PressBriefings/Documents/Resolution%20MEPC.377(80).pdf (accessed on 12 January 2024).
  10. Wang, N.; Mu, W.; Ma, R. A Systematic understanding of the risk development process for port authority. Mar. Policy 2024, 167, 106243. [Google Scholar] [CrossRef]
  11. Oloruntobi, O.; Mokhtar, K.; Gohari, A.; Asif, S.; Chuah, L. Sustainable transition towards greener and cleaner seaborne shipping industry: Challenges and opportunities. Clean. Eng. Technol. 2023, 231, 100628. [Google Scholar] [CrossRef]
  12. Barberi, S.; Sambito, M.; Neduzha, L.; Severino, A. Pollutant Emissions in Ports: A Comprehensive Review. Infrastructures 2021, 6, 114. [Google Scholar] [CrossRef]
  13. Fadiga, L.; Ferreira, L.; Bigotte, J. Decarbonising maritime ports: A systematic review of the literature and insights for new research opportunities. J. Clean. Prod. 2024, 452, 142209. [Google Scholar] [CrossRef]
  14. Alamoush, O.; Ballini, F. Port greenhouse gas emission reduction: Port and public authorities’ implementation schemes. Res. Transp. Bus. Manag. 2022, 43, 100708. [Google Scholar] [CrossRef]
  15. Azarkamand, A.; Wooldridge, C.; Darbra, R. Review of Initiatives and Methodologies to Reduce CO2 Emissions and Climate Change Effects in Ports. Int. J. Environ. Res. Public Health 2022, 17, 11, 3858. [Google Scholar] [CrossRef]
  16. Huang, H.; Yan, Q.; Yang, Y.; Wang, S.; Yuan, Q.; Li, X.; Mei, Q. Spatial classification model of port facilities and energy reserve prediction. Ocean. Coast. Manag. 2024, 258, 107413. [Google Scholar] [CrossRef]
  17. Mocerino, L.; Quaranta, F.; Toscano, D. Validation of the estimated ships’ emissions through an experimental campaign in port. Ocean. Eng. 2023, 288, 115957. [Google Scholar] [CrossRef]
  18. EU. Regulation 2015/757 of the European Parliament and of the Council. Official Journal of the European Union 2015. Available online: https://eur-lex.europa.eu/eli/reg/2015/757/oj/eng (accessed on 12 January 2024).
  19. EU. Commission Welcomes Completion of Key ‘Fit for 55′ Legislation, Putting EU on Track to Exceed 2030 Target 2023. Available online: https://ec.europa.eu/commission/presscorner/detail/en/ip_23_4754 (accessed on 12 January 2024).
  20. Aseel, S.; Al-Yafei, M.; Kucukvar, N.; Kazancoglu, Y.; Al-Sulaiati, A.; Al-Hajri, A. A model for estimating the carbon footprint of maritime transportation of Liquefied Natural Gas under uncertainty. Sustain. Prod. Consum. 2021, 27, 1602–1613. [Google Scholar] [CrossRef]
  21. Hsu, W.; Huynh, N.; Quoc, T.; Yu, H. An assessment model of eco-efficiency for container terminals within a port. Econ. Transp. 2024, 39, 1000359. [Google Scholar] [CrossRef]
  22. Kazimieras, E.; Turskis, Z.; Bagocius, V. Multi-criteria selection of a deep-water port in the Eastern Baltic Sea. Appl. Soft Comput. 2015, 26, 180–192. [Google Scholar] [CrossRef]
  23. Osorio-Tejada, J.; Llera Sastresa, E.; Scarpellini, S. Environmental assessment of road freight transport services beyond the tank-to-wheels analysis based on LCA. Environ. Dev. Sustain. 2024, 26, 421–451. [Google Scholar] [CrossRef]
  24. DGPM. Direcao-Geral de Política do Mar. 2023. Available online: https://www.dgpm.mm.gov.pt/conta-satelite-do-mar (accessed on 15 April 2024).
  25. Nunes, R.; Alvim-Ferraz, M.; Martins, F.; Sousa, S. Local mortality and costs from ship-related emissions in three major Portugueses ports. Urban. Clim. 2024, 53, 101780. [Google Scholar] [CrossRef]
  26. Maia, F.; Leitao, S.; Corria, M. Energy transition in Portugal: The harnessing of solar photovoltaics in electric mobility and its impact on the carbon footprint. J. Clean. Prod. 2024, 477, 143834. [Google Scholar] [CrossRef]
  27. Freitas, D.; Gervásio, H. The challenge of benchmarking carbon emissions in maritime ports. Environ. Pollut. 2024, 363, 125170. [Google Scholar] [CrossRef]
  28. G. PROTOCOL. Standards & Guidance. 2024. Available online: https://ghgprotocol.org/standards-guidance (accessed on 1 September 2023).
  29. GEF; UNDP; IMO; GloMEEP; IAPH. Port Emissions Toolkit Guide No.1: Assessment of Port Emissions. 2018. Available online: https://glomeep.imo.org/wp-content/uploads/2018/10/port-emissions-toolkit-g1-online.pdf (accessed on 1 September 2023).
  30. Issa, S.; López-Gutierrez, J.; Esteban, M.; Fernández-Sánchez, G.; Garay-Rondero, C. A Framework for Accurate Carbon Footprint Calculation in Seaports: Methodology Proposal. J. Mar. Sci. Eng. 2023, 11, 1007. [Google Scholar] [CrossRef]
  31. Styhre, L.; Winnes, H.; Black, J.; Lee, H. Greenhouse gas emissions from ships in ports—Case studies in four continents. Transp. Res. Part D 2017, 54, 212–224. [Google Scholar] [CrossRef]
  32. Soltani, H.; Isaa, S.; Garay-Rondero, C. Towards International Maritime Organization Carbon Targets: A Multi-Criteria Decision-Making Analysis for Sustainable Container Shipping. Sustainability 2023, 15, 16834. [Google Scholar] [CrossRef]
  33. EEA. European Maritime Transport Environmental Report. 2021. Available online: https://www.eea.europa.eu/en/analysis/publications/maritime-transport#:~:text=This%20report%20provides%20a%20factual%20analysis%20of%20the,to%20reduce%20the%20sector%27s%20impact%20on%20our%20environment (accessed on 1 September 2023).
  34. Costa, P.; Agreira, C.; Pestana, R.; Cao, Y. European Ports Transition—A new Approached of a Load Model, Consumption Integration of Renewable Energy Sources and Energy Storage Systems Profiles. In Proceedings of the 2024 IEEE Vehicle Power and Propulsion Conference (VPPC), Washington, DC, USA, 7–10 October 2024. [Google Scholar] [CrossRef]
  35. Zhong, H.; Hu, Z.; Leung, T. Carbon emissions reduction in China’s container terminals: Optimal strategy formulation and the influence of carbon emissions trading. J. Clean. Prod. 2019, 219, 518–530. [Google Scholar] [CrossRef]
  36. PGDLISBOA.PT. Ministério Público de Portugal. 2019. Available online: https://www.pgdlisboa.pt/leis/lei_mostra_articulado.php?nid=3188&tabela=leis&ficha=1&pagina=1&so_miolo= (accessed on 15 February 2025).
  37. APA. Fator de Emissão de Gases de Efeito de Estufa para a Eletricidade Produzida em Portugal. 2024. Available online: https://apambiente.pt/clima/fator-de-emissao-de-gases-de-efeito-de-estufa-para-eletricidade-produzida-em-portugal (accessed on 15 February 2025).
  38. Akakura, Y. Analysis of offshore waiting at world container terminals and estimation of CO2 emissions from waiting ships. Asian Transp. Stud. 2023, 9, 100111. [Google Scholar] [CrossRef]
  39. Zhou, C.; Huang, H.; Liu, Z.; Ding, Y.; Xiao, J.; Shu, Y. Identification and analysis of ship carbon emission hotspots based on data field theory: A case study in Wuhan Port. Ocean Coast. Manag. 2023, 235, 106479. [Google Scholar] [CrossRef]
  40. Martínez-Moya, J.; Mestre-Alcover, A.; Sala-Garrido, R.; Furió-Pruñonosa, S. Are transshipment ports more efficient in the Mediterranean Sea? Analysing the role of time at ports using DEA metafrontier approach. J. Transp. Geogr. 2024, 116, 103866. [Google Scholar] [CrossRef]
  41. APS. Port of Sines/Statistics. 2025. Available online: https://www.apsinesalgarve.pt/en/statistics/monthly-statistics/port-of-sines/ (accessed on 15 February 2025).
  42. Zhao, N.; Wang, Z.; Ji, X.; Fu, H.; Wang, Q. Analysis of a maritime transport chain with information asymmetry and disruption risk. Ocean Coast. Manag. 2023, 231, 106405. [Google Scholar] [CrossRef]
  43. Santos, S.; Lima, L.; Castelo, M. Corporate sustainability of Portuguese seaports. J. Clean. Prod. 2022, 380, 136057. [Google Scholar] [CrossRef]
  44. Run, S.; Abouarghoub, W.; Demir, E. Enhancing data quality in maritime transportation: A practical method for imputing missing ship static data. Ocean Eng. 2025, 315, 119722. [Google Scholar] [CrossRef]
  45. Batista, T.; Rosa, L.; Borges, F.; Isbaex, C.; Martins, S. Shipping Patterns at the Port of Sines: A Temporal Analysis from 2010 to 2023. Sustainability 2025, 17, 2344. [Google Scholar] [CrossRef]
  46. Lorenzi, G.; Baptista, P. Promotion of renewable energy sources in the Portuguese transport sector: A scenario analysis. J. Clean. Prod. 2018, 186, 918–932. [Google Scholar] [CrossRef]
  47. Ronza, A.; Carol, S.; Espejo, V.; Vílchez, J.; Arnaldos, J. A quantitative risk analysis approach to port hydrocarbon logistic. J. Hazard. Mater. 2006, 128, 10–24. [Google Scholar] [CrossRef] [PubMed]
  48. Khan, R.; Yin, J.; Mustafa, F.; Shi, W. Factor assessment of hazardous cargo ship berthing accidents using and ordered logit regression model. Ocean Eng. 2023, 284, 115211. [Google Scholar] [CrossRef]
  49. Uzun, D.; Okumus, S.; Canbulat, O.; Gunbeyaz, S.; Karamperidis, S.; Hudson, D.; Turan, O.; Allan, R. Port energy demand model for implementing onshore power supply and alternative fuels. Transp. Res. Part D Transp. Environ. 2024, 136, 104432. [Google Scholar] [CrossRef]
  50. Koznowski, W.; Lebkowoski, A. Unmanned Electric Tugboat Formation Multi-Agent Energy-Aware Control System Concept. Energies 2022, 15, 9592. [Google Scholar] [CrossRef]
  51. Campillo, J.; Domínguez-Jiménez, J.; Cabrera, J. Sustainable Boat Transportation Throughout Electrification of Propulsion Systems: Challenges and Opportunities. In Proceedings of the 2019 2nd Latin American Conference on Intelligent Transportation Systems (ITS LATAM), Bogota, Colombia, 19–20 March 2019. [Google Scholar] [CrossRef]
  52. Papaioannou, V.; Pietrosanti, S.; Holderbaum, W.; Becerra, V.; Mayer, R. Analysis of energy usage for RTG cranes. Energy 2017, 125, 337–344. [Google Scholar] [CrossRef]
  53. Gan, G.; Lee, H.; Tao, Y.; Tu, C. Selecting Suitable, Green Port Crane Equipment for International Commercial Ports. Sustainability 2021, 13, 6801. [Google Scholar] [CrossRef]
  54. Brzeziinski, M.; Pyza, D. A Refined Model for Carbon Footprint Estimation in Electric Railway Transport. Energies 2023, 16, 6567. [Google Scholar] [CrossRef]
  55. Isaa, S.; Esteban, M.; López-Gutiérrez, J.; Fernández-Sánchez, S. Optimizing Smart Energy Infrastructure in Smart Ports: A Systematic Scoping Review of Carbon Footprint Reduction. Mar. Sci. Eng. 2023, 11, 1921. [Google Scholar] [CrossRef]
  56. Wu, X.; Hong, S. Nature-based solutions as sustainability alternatives for shipping: A systematic review. J. Nat. Conserv. 2023, 76, 126496. [Google Scholar] [CrossRef]
  57. DIARIO DE LA REPUBLICA. Mercado Voluntário de Carbono e Estabelece as Regras para o seu Funcionamento. 2024. Available online: https://diariodarepublica.pt/dr/legislacao-consolidada/decreto-lei/2024-854543300 (accessed on 15 February 2025).
  58. Puig, M.; Azarkamand, S.; Wooldridge, C.; Selén, V.; Darbra, R. Insights on the environmental management system of the European port sector. Sci. Total Environ. 2022, 806, 150550. [Google Scholar] [CrossRef]
  59. Sankar, A.; Butt, T. Waste-to-Energy (WtE) for Marine Transport—On-Board Feasibility Implications. Clean. Waste Syst. 2025, 11, 100215. [Google Scholar] [CrossRef]
Figure 1. Port of Sines jurisdiction area (AJAPS).
Sustainability 17 03382 g001
Figure 2. Methodology scheme (Scopes 1, 2, and 3) applied to the Port of Sines.
Sustainability 17 03382 g002
Figure 3. Variation in ships, cargo, energy, and carbon footprint of the Port of Sines for the period 2018–2022. The year 2018 is considered as the baseline for the graph percentages.
Sustainability 17 03382 g003
Figure 4. Variation in ships dwell time at the Port of Sines for the period 2018–2022.
Sustainability 17 03382 g004
Figure 5. Energy and carbon footprint from the Port of Sines’ terminals.
Sustainability 17 03382 g005
Figure 6. Sankey diagram of the energy consumption at the Port of Sines in 2022.
Sustainability 17 03382 g006
Figure 7. Sankey diagram of the carbon footprint of the Port of Sines in 2022.
Sustainability 17 03382 g007
Figure 8. Average percentage of emissions per maneuver at the LBT (2018–2022).
Sustainability 17 03382 g008
Figure 9. Average percentage of emissions per maneuver at the SCT (2018–2022).
Sustainability 17 03382 g009
Figure 10. Average percentage of emissions per maneuver at the NGT (2018–2022).
Sustainability 17 03382 g010
Table 1. Cargo handling and country of origin/destination in the Port of Sines in 2024 [41].
Cargo HandlingTotal (t)Total (%)
Liquid bulk24,253,86250.71
Dry bulk401,2060.84
General cargo23,171,99448.45
Country of Origin/DestinationTotal (t)Total (%)
Continent and autonomic region3,379,6277.06
EU countries9,061,81518.94
Other countries35,385,61974.00
Total Cargo47,827,062100.00
Table 2. Depth and cargo type from the different terminals of the Port of Sines [41].
TerminalDepth (m)Cargo Type
SCT17Container
LBT28Crude oil, refined oil, liquefied petroleum gas, methanol, and chemical naphtha
NGT15Liquefied natural gas (LNG)
PCT12Propylene, ethylene, butadiene, ethyl tertiary butyl ether, ethanol, methyl tertiary butyl ether, aromatic mixtures, and methanol
GCT18Dry bulk, general cargo, and roll-on/roll-off (ro_ro)
Table 3. Ship type and terminal data in the Port of Sines (2018 to 2022).
TerminalShip TypeLand EquipmentShipCargo (t)ME (Hp)DWT (GT)Dwell Time (h)
AVGAVGRANRANAVG
LBTMaritime liquid bulk carrier
  • Centrifugal pumps for the discharge of liquid bulk
76718,097,0561362–29,677495–161,57944.98
NGTMaritime liquified natural gas carrier
  • Cryogenic centrifugal pumps for liquefied natural gas discharge
  • Cryogenic heavy-duty trucks
1353,860,38923,119–63,59490,835–128,80671.48
SCTMaritime container carrier
  • Electric rubber-tired gantries (RTG) and Rail-mounted gantries (RMG)
  • Electric train loading container terminal
  • Heavy-duty truck container terminal
88720,153,7922434–82,059256–232,61842.35
PCTMaritime petrochemical carrier
  • Centrifugal pumps for the discharge from the petrochemical industry
  • Heavy-duty trucks of the petrochemical industry
61499,0991978–65722815–13,79475.23
GCTGeneral cargo ship
  • RTG and RMG by diesel fuel
  • Heavy-duty trucks
1282,029,7921369–69,6191864–90,44954.62
Total 185042,610,3361362–82,059256–232,61857.73
ME: main engine; DWT: deadweight tonnage; AVG: average; RAN: range.
Table 4. Energy characterization and carbon footprint of the Port of Sines. Annual average value for the period 2018–2022.
Energy Consumption (MWh)
Scope20182019202020212022AverageAverage (%)
11758.782024.811802.641799.731601.661797.520.43
21600.121613.601367.001643.001504.001545.540.37
3386,686.69380,522.45413,976.29536,283.83377,707.63419,035.3899.21
Total390,045.59384,160.87417,145.93539,726.56380,813.29422,378.45100.00
Base (%)100.0098.49106.95138.3897.63
Carbon Footprint (tCO2eq)
Scope20182019202020212022AverageAverage (%)
1593.94742.29593.73579.18545.99611.030.27
2459.00376.00251.00266.00205.00311.400.14
3226,347.11179,767.30217,452.23300,064.52194,915.94223,709.4299.59
Total227,400.05180,885.60218,296.96300,909.70195,666.93224,631.85100.00
Base (%)100.0079.5596.00132.3386.05
Table 5. Energy characterization and carbon footprint of Scope 3 of the Port of Sines. Average value for the period 2018–2022.
Energy Consumption (MWh)
FontSCTLBTNGTPCTGCTOthersScope 3Scope 3 (%)
Electric energy17,163.284776.6362,053.1231,634.132209.22733.45118,569.8328.03
Land transport3032.28214.00228.9586.60455.07 4016.900.95
Maritime transport59,356.17192,397.2619,142.654425.9721,126.603978.61300,427.2671.02
Total79,551.73197,387.8981,424.7236,146.7023,790.894712.06423,013.99100.00
Contribution (%)18.8146.6619.258.555.621.11
Carbon Footprint (tCO2eq)
FontSCTLBTNGTPCTGCTOthersScope 3Scope 3 (%)
Electric energy3405.46968.0712,269.496218.96523.05150.0023,535.0310.33
Land transport408.0928.7630.8111.6661.24--540.600.24
Maritime transport41,494.34135,238.275087.543109.0014,886.233978.6174,524.1189.43
Total45,307.89136,235.1017,387.849339.6215,470.524128.61227,869.58100.00
Contribution (%)19.8859.797.634.106.791.81
Table 6. Ship, cargo, energy consumption, and carbon footprint correlation for the Port of Sines. Average value for the period 2018–2022.
Dependent VariableIndependent VariableCorrelation (R2)
EnergyShip0.3032
Cargo0.1007
Carbon FootprintShip0.2030
Cargo0.3432
Table 7. Potential mitigation strategies to reduce energy consumption and carbon footprint correlation at a maritime terminal port.
MeasuresAlternativesLBTGNTSCTPCTGCTOther
Maritime transport decarbonizationAdoption of alternative fuels for ships: LNG, hydrogen, biodiesel, methanol, and ammonia [13,34,49]
Implementation of SEEMP, EEDI, and EEXI [1,6]
Implementation of offshore power supply with renewable energy [9,36]
Implementation of onshore power supply with renewable energy [9,34]
Pilot boats and tugboats: Transition from fossil fuels to electrical energy [50,51]
Reduction in anchoring and berthing time [13]
Land transport decarbonizationCranes and other land equipment: Transition to electric power [52,53]
Electrification and hybridization with renewable energy [13,34]
Increase cargo transportation by train [54]
Electrical energy consumption decarbonizationIncrease the implementation of smart grids and microgrids with renewable energy [55]
Carbon offsettingNature-based solutions for carbon capture, such as afforestation and ecological restoration [56,57]
Cold loss recovery and supply for replacing refrigerant consumption in other terminals [20]
Wastewater and solid waste treatment [58,59]
Note: The dot (•) symbol indicates a correlation between the corresponding row and column.
Disclaimer/Publisher’s Note: The statements, opinions and data contained in all publications are solely those of the individual author(s) and contributor(s) and not of MDPI and/or the editor(s). MDPI and/or the editor(s) disclaim responsibility for any injury to people or property resulting from any ideas, methods, instructions or products referred to in the content.

