Abstract
The olive oil agro-industry generates large quantities of by-products, such as olive cake (OC), whose sustainable valorisation in animal feed can contribute to the principles of circular economy, waste reduction, and resource efficiency. This study evaluated the effects of incorporating OC into the diets of growing Bísaro pigs, focusing on productive parameters and the apparent total tract digestibility (ATTD). Two trials were carried out. In the first trial, 25 pigs were fed five diets containing 0, 5, 10, 15, and 20% exhausted OC (EOC) for 15 days. The results showed a linear decrease in ATTD with increasing EOC levels (p < 0.001), but the increased feed intake compensated for the reduced digestibility, and growth performance was maintained. The initial and final live weight (LW), average daily gain (ADG), average daily feed intake (ADFI), and feed conversion ratio (FCR) were not affected (p > 0.05). In the second trial, 40 pigs were fed five diets for 82 days: a control diet and four diets incorporating 10% crude OC, 10% two-phase OC, 10% EOC, and 10% EOC with 1% olive oil. No significant differences were observed in final weight, ADG, ADFI, FCR, or the digestibility of DM, OM, CP, CF, and NDF. The results suggest incorporating moderate levels of OC into Bísaro pig diets could be a viable strategy for valorising by-products, reducing agro-industrial waste and increasing sustainability in animal production. In addition, the inclusion of OC had no negative impact on animal performance, highlighting the potential of OC as a sustainable ingredient for animal feed, which aligns with the objectives of the circular economy and sustainable livestock farming practices.
1. Introduction
The olive oil industry generates large volumes of waste, which, if not properly managed, can negatively impact soils, aquatic ecosystems, and the atmosphere [1]. The valorisation of these by-products as alternative feed ingredients aligns with the principles of the circular economy, promoting a more sustainable agri-food system, conserving natural resources, and reducing the environmental footprint of livestock production [2,3].
The olive oil sector is fundamental to the Mediterranean economy and culture. Europe dedicates approximately 5,028,159 hectares to olive tree cultivation, primarily in southern regions, accounting for 75% of global olive oil production [4]. In Portugal, the Trás-os-Montes and Alto Douro regions are particularly notable for olive oil production, hosting 23% of the country’s olive oil mills in 2023 (National Statistics Institute).
During extraction, 100 kg of olives generates approximately 35 kg of solid waste (including olive pulp, skin, and pits) and 100 litres of liquid waste, highlighting the need for efficient waste management strategies. The composition of the solid fraction of olive cake (OC) varies depending on the extraction method but possesses significant nutritional potential [5]. Its fat content ranges from 5% to 15% on a dry matter basis, with oleic acid as the predominant fatty acid, followed by palmitic, linoleic, and stearic acids. The compounds can enhance the nutritional profile of animal products when incorporated into livestock diets [6,7,8,9]. Additionally, OC contains 5% to 7% crude protein, 10% to 17% ash [6,10,11], and up to 62% dietary fibre, which may limit digestibility and its use in animal nutrition [12].
Olive oil is typically produced using three extraction methods: the traditional pressing process, the three-phase centrifugal extraction system, and the two-phase system, generating crude OC (COC), three-phase OC, and two-phase OC (TPOC), respectively [13,14]. The two-phase system is considered an “eco-friendly” option due to its lower water consumption. This method yields two final products: a solid fraction comprising moist olive skin and wet pomace and a liquid fraction of olive oil [15,16]. Additionally, some mills dehydrate OC and extract the remaining residual oil (approximately 2% by weight) using solvents. This industrial process produces exhausted OC (EOC) with approximately 10% residual moisture [17,18,19].
Olive cake is rich in bioactive compounds, including polyphenols, anthocyanins, tannins, flavonoids, and dietary fibres (such as pectin), reinforcing its potential as a functional feed ingredient [15]. Research has explored its application in livestock feed, focusing on its nutritional and functional effects [20]. For instance, the high oleic acid content in OC has been shown to enhance the quality of animal-derived products [21]. Although research on the inclusion of olive by-products in pig diets remains limited, several studies have explored their use in other livestock species, such as ruminants [22], poultry [23], and rabbits [24], demonstrating potential benefits in terms of nutritional value and product quality.
The Bísaro pig, a Portuguese autochthonous breed, has gained increasing interest in traditional farming systems over the past three decades. Despite its slower growth rate, this breed is traditionally valued for producing high-quality, premium products, often associated with Protected Designation of Origin (PDO) and Protected Geographical Indication (PGI) status [25,26].
In this context, incorporating olive oil by-products into pig diets represents a promising strategy to reduce feed costs, optimise resource utilisation, and mitigate environmental impact, contributing to a more efficient and sustainable livestock production system. To address this issue, this study was structured into two complementary trials. The first trial aimed to evaluate the acceptability of EOC in pig diets, and the second trial assessed the impact of including different types of OC (COC, EOC without and with 1% olive oil, and TPOC) in the diets.
2. Materials and Methods
This study was conducted at the Unidade Experimental de Suinicultura, University of Trás-os-Montes and Alto Douro (UTAD BioLab Sus) in Vila Real, Portugal. All procedures involving animals complied with Portuguese legislation on animal welfare in experimental research (Decree-Law No. 1/2019, 10 January 2019) and the European Parliament and Council Directive 2010/63/EU of 22 September 2010. The study protocol (2253-e-DZ-2022) was approved by the Animal Welfare Body (ORBEA) of the UTAD.
2.1. Experimental Design, Animals, and Diets
The diets were prepared in a commercial compound feed manufacturing unit using hammermills and horizontal mixers and were distributed in meal form. In including olive cake (OC), the dilution effect of nutrients in the control diets to which the cake was added was considered.
In the first trial, a 15-day experimental period was used to assess the acceptance of the OC. The selected OC was exhausted (EOC) and incorporated into the control diet (EOC0) at increasing levels of 5%, 10%, 15%, and 20% (EOC5, EOC10, EOC15, and EOC20, respectively). A total of 25 Bísaro pigs (10 castrated males and 15 females, 1-year-old, 108.3 ± 8.8 kg BW, in the finishing stage) were used in the experiment. The animals were allocated to the experimental groups while ensuring that each group contained three females and two castrated males with a similar average body weight. To achieve this, the animals were first categorised by sex and body weight, followed by random allocation to the different experimental treatments. This approach ensured a balanced distribution across treatments, minimising variability related to sex and body weight differences. The first six days were dedicated to adapting the animals to the facilities and diets. EOC was selected to investigate the possibility of using OC in pig diets due to its ease of transport, better preservation potential, and longer shelf-life. Four additional diets were prepared based on the control diet.
The second experimental trial lasted 12 weeks, and the animals were provided with five treatments: control diet (CD), control diet + 10% crude OC (COC), control diet + 10% two-phase OC (TPOC), control diet + 10% EOC (EOC), and control diet + 10% EOC + 1% olive oil (EOC-OO). A total of 40 Bísaro pigs (20 castrated males and 20 females, 1 year old) were used, with an initial body weight of 103.0 ± 3.476 kg. The pigs were housed in pairs, resulting in eight repetitions per treatment for live weight assessment and four repetitions per treatment for feed intake, with each pair of pigs representing one repetition. An eight-day acclimatisation period was conducted to allow the animals to adjust to the facilities and diets. As in the first trial, EOC was chosen for its transportability, preservation potential, and more extended availability. Four additional diets were also prepared from the control diet.
2.2. Performances
Weighing in trial 1 was conducted at the beginning (D1), after the adaptation period (D6), and at the end of the experiment (D15), allowing for the calculation of average daily gain (ADG). Average daily feed intake (ADFI) was monitored based on the feed offered and rejected. Using these variables, the feed conversion ratio (FCR) was determined.
Similarly, in trial 2, pigs’ live weight and feed consumption were recorded to calculate performance parameters, including ADG, ADFI, and FCR.
2.3. Bromatological Analysis
This study’s diet and OC samples were dried in a forced-air oven at 50 °C. After drying, they were ground using a 1 mm sieve to ensure uniformity before conducting chemical analysis.
Dry matter (No. 934.01), organic matter (No. 942.05), crude fat (No. 920.39), and total nitrogen (N) were analysed following the methods outlined by the Association of Official Analytical Chemists (AOAC) [27], with total nitrogen determined using the Kjeldahl method (No. 954.01) [28]. Crude protein content was estimated by multiplying the nitrogen content by a conversion factor 6.25. Fibre fractions, including neutral detergent fibre, acid detergent fibre, and acid detergent lignin, were assessed according to the protocol developed by Robertson and Van Soest [29].
The metabolizable energy (ME) of the diets was predicted using the equation proposed by J. Noblet and J. M. Pérez [30], given by the following:
ME was calculated in MJ/kg dry matter (DM), and the coefficients reflect the contribution of different dietary components, namely, ash, crude fat (CF), and neutral detergent fibre (NDF).
2.4. Fatty Acid Analysis
To determine the fatty acid composition of the experimental diets, gas chromatography was employed following the Folch extraction method. The analysis of fatty acid methyl esters (FAMEs) was conducted using an Agilent Technologies GC-Agilent 6890 N gas chromatograph (Madrid, Spain), equipped with a flame ionisation detector and an HP 7683 automatic sample injector. The results were expressed as the percentage of total fatty acids, categorising them into saturated (SFAs), monounsaturated (MUFAs), and polyunsaturated (PUFAs) fatty acids. The procedure was carried out in accordance with ISO 12966-2:2022 guidelines [11,31].
2.5. Phosphorus and Phytic Acid Content
The determination of phytic acid and phosphorus content in the sample diets was performed using the Megazyme commercial kit (K-PHYT, Bray, Ireland), following the manufacturer’s protocol [32]. The procedure involved acid extraction of the samples, followed by enzymatic hydrolysis using phytase and phosphatase to liberate phosphorus. Each sample underwent triplicate analysis. The released phosphate was quantified via a colorimetric reaction with ammonium molybdate, producing molybdenum blue, whose formation is proportional to the inorganic phosphate (Pi) content. The absorbance was recorded at 655 nm, and Pi concentration was calculated based on a calibration curve using phosphorus standards. The results were expressed as grams of phosphorus per 100 g of sample (g P/100 g).
2.6. Granulometry of Diets
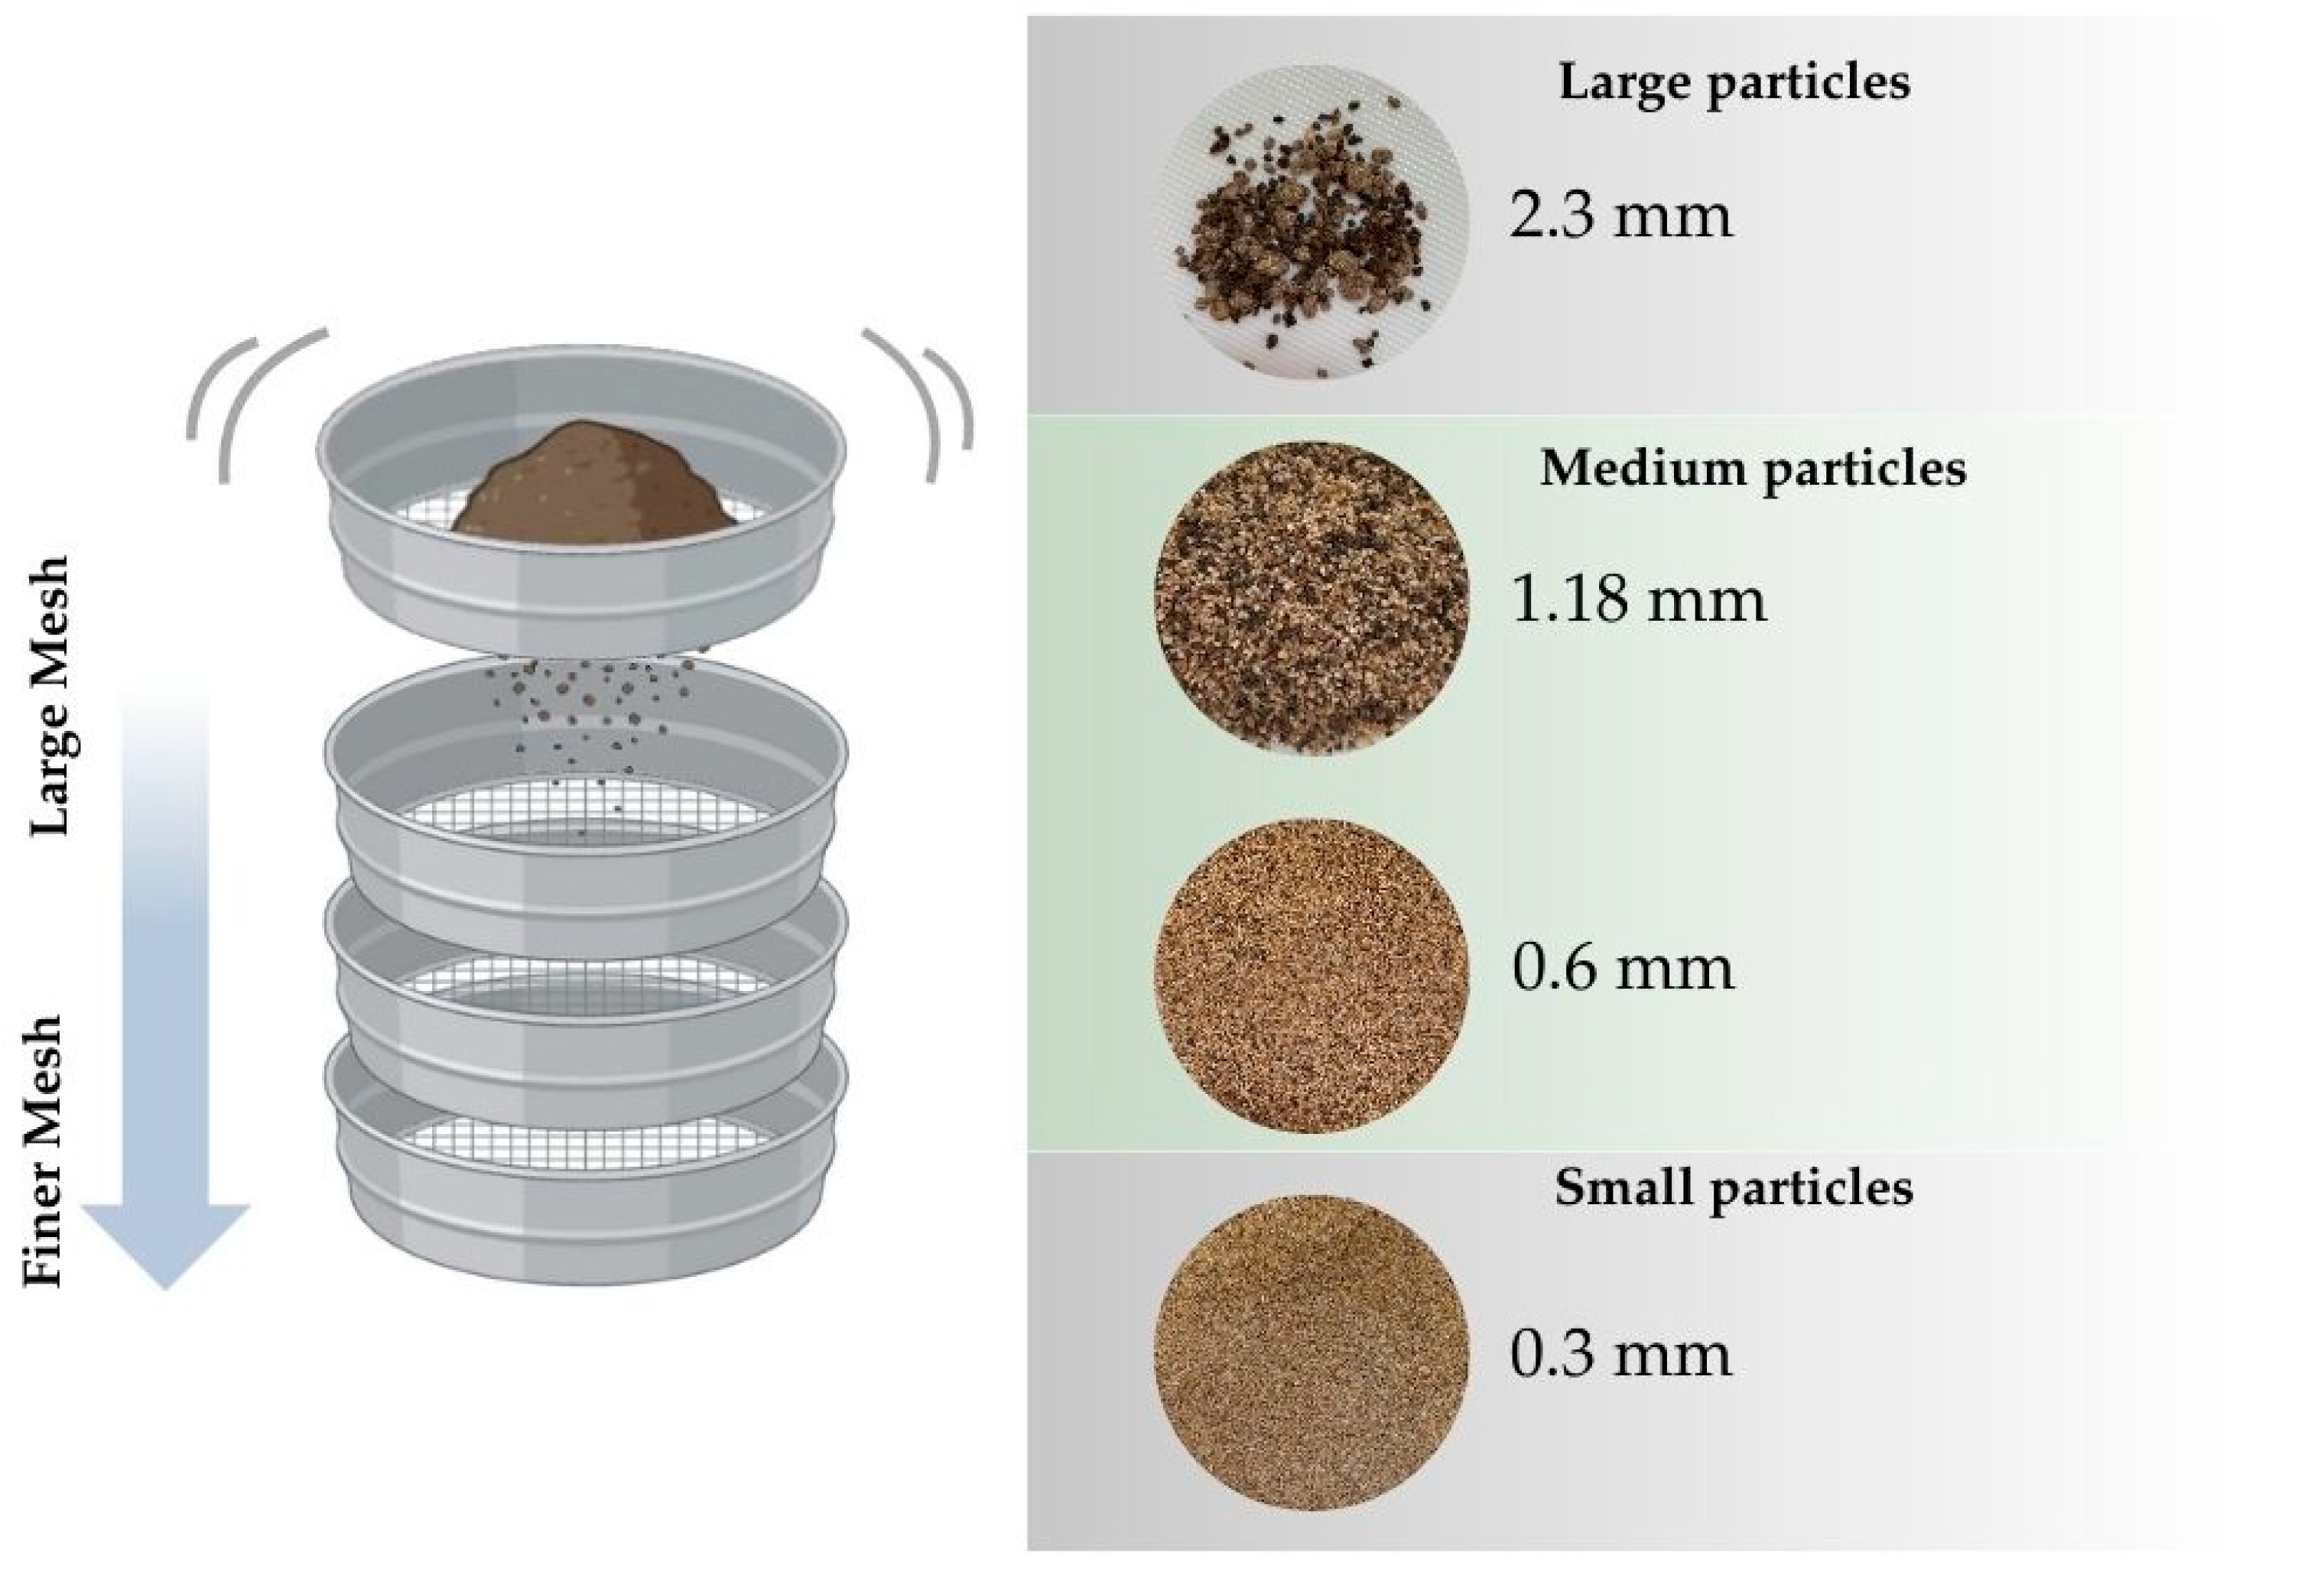
To analyse the particle size of the diets provided to the animals, we applied the methodology outlined by Almeida et al. [33]. Understanding the distribution of particle sizes was essential for evaluating the physical characteristics of the diets and their potential impact on feed efficiency. Subsamples were progressively collected from all diet formulations until a composite sample of roughly 1 kg was obtained. Representative portions were then carefully selected, labelled, and stored appropriately. Each sample underwent duplicate particle size assessment using a Retsch AS 200 basic analytical sieve shaker (Haan, Germany) with four sieves of varying mesh sizes (2.3 mm, 1.18 mm, 0.6 mm, and 0.3 mm). The material retained in each sieve was meticulously weighed, and the proportion of particles at each size fraction was recorded to construct a particle size distribution profile for each diet (Figure 1).
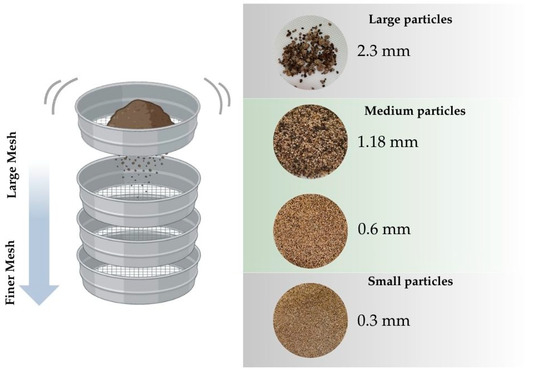
Figure 1.
An overview of the particle size separation process, highlighting the corresponding mesh sizes utilised.
2.7. Digestibility Trial
The digestibility trial was assessed using the indigestible biomarker chromium trioxide (Cr2O3), which is commonly used in digestibility trials with pigs [34]. A standard protocol to calculate the digestibility coefficient involved adding 0.2% of the biomarker to the animals’ diet for four days. Subsequently, faecal samples were gathered at three distinct time points over a span of three consecutive days. These samples were placed in adequately labelled plastic bags and stored at freezing temperatures until further analysis. The faeces were dried in a forced-air oven at 50 °C for sample preparation until a consistent dry matter content was achieved. Once the dry matter stabilisation was achieved, a weighted and representative sample from the three days of collection was prepared for each animal. These faecal samples were ground in a 1 mm sieve mill for chemical analysis and to determine the digestibility coefficient for different diet fractions (dry matter, organic matter, neutral detergent fibre, acid detergent fibre, acid detergent lignin, crude protein, and crude fat). The methodology used to quantify chromium concentration in faecal and feed samples was the atomic absorption (AA) method by spectrophotometry through the ICP-OES assay (Inductively Coupled Plasma Optical Emission Spectrometry). The samples were prepared following specific digestion and dilution procedures. Subsequently, they were analysed using an ICP-OES instrument (Thermo Fisher Scientific®, Vantaa, Finland), which enables the identification and quantification of elements present in the samples through the emission of electromagnetic radiation. The digestibility coefficient was determined by dividing the quantity of nutrients digested by the animal by the total amount of nutrients ingested. This calculation was also applied to each diet fraction individually.
2.8. Statistical Analysis
Data were analysed using the statistical package JMP® Pro 17.1.0 by 2023 SAS Institute Inc.© (Cary, NC, USA). Each pen (housing two animals) was considered the experimental unit for feed intake measurements, while individual animals were treated as the experimental unit for live weight measurements. The data were assessed for normality using the Shapiro–Wilk test and then analysed using analysis of variance (ANOVA). Post hoc comparisons were performed using Tukey’s test, with p-values < 0.05 considered significant, while p-values ≥ 0.05 and <0.1 indicate a trend.
An additional one-way ANOVA with polynomial contrasts was conducted using IBM SPSS Statistics Version 30.0.0.0 by 2024 (Chicago, IL, USA) to examine the linear and quadratic effects of the five dietary treatments in trial 1.
The statistical analysis considered diet a fixed effect while accounting for random variations across experimental blocks. Data are expressed as mean values accompanied by the Standard Error of the Mean (SEM). To enhance clarity, only significant differences between treatments are marked with superscripts, while non-significant differences are not highlighted. Additionally, p-values for all evaluated effects are provided in the tables.
3. Results and Discussion
3.1. Chemical Composition of Diets
The composition analysis of each OC variant was previously detailed by Paié-Ribeiro et al. [11,35]. The chemical composition and phytic acid content of the different diets used in trial 1 are shown in Table 1. The dry matter (DM) and organic matter (OM) contents were consistent between all the treatments, with averages of 97.6% and 93.5%, respectively.

Table 1.
Ingredients and nutrient composition of the experimental diets in trial 1.
The crude protein (CP) content varied between treatments, ranging from 13.9% in EOC20 to 15.5% in the control diet (EOC0). A similar trend was observed for the crude fat (CF) content, with the control diet (EOC0) displaying the highest value. In the other treatments, the values were similar, averaging 3.65%.
As anticipated, the diets with the highest inclusion levels of OC exhibited increased fibre content, including neutral detergent fibre (NDF), acid detergent fibre (ADF), and acid detergent lignin (ADL), with NDF values ranging from 14.7% to 24.8%.
Incorporating EOC into the pigs’ diet resulted in a progressive reduction in the experimental diets’ metabolizable energy (ME, MJ/kg DM). The control diet (EOC0) exhibited the highest ME value (14.3 MJ/kg DM), while the diets containing EOC showed a proportional decrease as the inclusion level increased: 13.9 MJ/kg DM (EOC5), 13.5 MJ/kg DM (EOC10), 13.1 MJ/kg DM (EOC15), and 12.7 MJ/kg DM (EOC20). This reduction was expected due to the energy dilution effect caused by the increased fibre content characteristic of olive cake.
When examining the total phosphorus and phytic acid composition across the five diets, a variation in the levels of these components was noted. Total phosphorus remained relatively constant between the diets, with values ranging from 0.219 to 0.277 g/100 g, showing no clear pattern of increase or decrease with the increasing addition of OC. In contrast, the phytic acid content tended to decrease with increasing CO inclusion, starting at 0.981 g/100 g in the control diet (EOC0) and reaching 0.775 g/100 g in the diet with 20% CO (EOC20). However, the EOC15 diet showed an intermediate variation (0.889 g/100 g). These results suggest that adding OC contributed to a reduction in the phytic acid content, indicating a positive effect of this incorporation on this parameter. In the previous work by Paié-Ribeiro et al. [11], reduced levels of phytic acid were found in the OC (0.264 ± 0.04 in EOC) itself, reinforcing the hypothesis that this by-product has favourable intrinsic characteristics for animal nutrition.
The nutrient composition of diets used in trial 2 is shown in Table 2. Analysis of the five diets, including the control diet and those containing each type of OC, revealed notable variations in fibre, protein, fat, and phosphorus content.
Table 2.
Ingredients and nutrient composition of the experimental diets in trial 2.
As for CP, there was a decrease in all diets containing each type of OC, starting at 15.44% in the control diet and falling to between 13.5% and 14.3% in the diets containing OC. CF content varied from 4.63% in the CD to a maximum of 5.19% in the COC diet, but it showed a slight reduction in the EOC diet (3.99%).
There was an increase in fibre fractions with the inclusion of OC. NDF increased from 17.8% in the control diet (CD) to a maximum value of 23.9% in the EOC diet, while ADF varied from 6.3% in the control diet to 10.7% in the COC diet. ADL also increased with the addition of OC, reaching 3.15% in the EOC diet compared to 0.92% in the CD.
Incorporating 10% OC from different processing methods influenced the ME of the diets. The CD presented the highest ME value, while diets containing OC showed a reduction in energy content: 13.5 MJ/kg DM for COC, 13.2 MJ/kg DM for both TPOC and EOC, and 13.4 MJ/kg DM for EOC-OO. This decrease in ME was expected due to the higher fibre content of olive cake, which contributes to energy dilution. However, including olive oil in EOC-OO appears to mitigate this effect slightly.
For total phosphorus, there was a slight increase with the addition of OC, especially in the EOC diet (0.518 g/100 g), compared to 0.374 g/100 g in the CD diet. The phytic acid content followed a similar trend, higher in the diets with OC, reaching 1.84 g/100 g in the COC diet, in contrast to 1.33 g/100 g in the CD diet. These results show that including OC in diets increases the fibre fractions while reducing the CP and CF content.
Studies have shown that phytic acid supplementation in piglet diets reduces productive parameters, reflected in a reduction in ADG, ADFI, and FCR. This effect is attributed to phytic acid’s ability to bind positively charged minerals, thereby reducing their bioavailability and absorption in the small intestine [36].
In Mediterranean regions, farmers have traditionally used olive by-products in animal feed, but the widespread application of these resources faces challenges [22]. These include nutritional constraints and anti-nutritional factors that can limit their efficacy in improving animal growth performance [33]. Notwithstanding these challenges, using OC in pig diets can provide an opportunity to reduce waste, promote the reuse of agricultural by-products, and mitigate the environmental impact of farming practices. The chemical composition of OC varies depending on factors such as the type of olive used (e.g., Arbequina, Picual, or Koroneiki), the relative amounts of its primary components (such as pulp, skin, and pit), and the oil extraction method [37,38].
OC, as an agro-industrial by-product, has challenging nutritional characteristics for animal diets. Typically, these by-products have a low available protein content, ranging from 5% to 7%, as observed in some vegetable residues [11]. However, the protein content of OC can also depend on the fraction and the processing method. One study, when incorporating OC fractions into extruded food products based on rice, maize, and oat flour, obtained a variation between 4.8% protein in the dry supernatant fraction and 13.4% in the pulp-enriched fraction [39]. Another study also reported that OC powder enriched with pulp contains approximately 12% protein [12]. In addition, OC can also have a high crude fat content, varying according to the extraction method (2.33% to 14%) [40].
The high concentration of fibres is a notable characteristic of OC. In terms of fibre composition, OC exhibits high levels of NDF, between 23% and 73%, and ADL, which can vary from 12% to 37% [41]. These fibre characteristics tend to reduce the digestibility of nutrients [41]. The presence of certain anti-nutritional factors, such as phytic acid, polyphenols, and tannins, can constrain the incorporation of OC into animal diets. These compounds can hinder digestion and reduce the efficiency of fibre breakdown, ultimately impacting feed utilisation. Furthermore, they can decrease the overall palatability of the diet, making it more challenging for animals to consume the feed. Despite these limitations, exploring ways to mitigate these effects could enhance the potential for using OC as a sustainable feed ingredient [22,42,43,44].
Measuring ME in pig diets is crucial for formulating nutritionally balanced and economical rations [45]. Including 10% OC in the diet reduced ME, which can be attributed to increased dietary fibre content. The lower energy availability was consistent across the different types of OCs tested, with a slight recovery observed in the group supplemented with olive oil (EOC-OO). While the reduced ME could theoretically impair animal performance, previous studies indicate that fibre-rich diets may lead to variable effects on feed conversion, depending on the animal’s adaptability to alternative energy sources [46,47]. Thus, OC inclusion should be strategically evaluated to balance nutritional, economic, and environmental benefits.
Based on the chemical characterisation of this by-product, it may have a low nutritional value, although the high concentration of fat present can be an exciting characteristic [48]. Lipids provide more energy than carbohydrates and proteins. From a biochemical perspective, fats consist of carbon and hydrogen in a more reduced form, which means these elements have a higher oxidation potential. For this reason, fat supplementation in pig feed is a common practice [49]. When analysing the fibre fractions, all the cake samples showed high values, but when comparing the CF content, it was observed that the COC had the highest percentage. Ferrer et al. [50], when analysing the chemical composition of partially defatted OC, also observed high fibre concentrations.
Table 3 shows the fatty acid profile of the different diets used in trial 1. Analysis of the fatty acid profile of the five diets showed changes in the monounsaturated (MUFA) and polyunsaturated (PUFA) fatty acid content and the ratio between PUFA/SFA.
Table 3.
Fatty acid profile of the experimental diets in trial 1 (g/100 g).
Saturated fatty acids (SFAs) remained stable throughout the diets, ranging between 18.4% and 18.6%. Among the unsaturated fatty acids, there was a gradual increase in MUFAs, from 28.9% in the control diet to 32.9% in the diet with 20% OC, driven mainly by the increase in oleic acid (C18:1n-9), which ranged from 26.0% to 30.0%. On the other hand, PUFAs showed a downward trend, from 52.7% to 48.6%, mainly due to the decrease in linoleic acid (C18:2n-6), which went from 50.2% in the control diet to 46.1% with the greater inclusion of OC.
In addition, the PUFA/SFA ratio showed a slight decrease, from 2.86 in the diet without OC to 2.63 in the diet with 20% inclusion, while the n-6/n-3 ratio varied from 21.2 to 19.7 throughout the treatments. The findings indicate that the inclusion of OC alters the lipid profile of the diet, boosting the levels of MUFA while decreasing PUFA, especially linoleic acid.
Table 4 shows the concentration of fatty acids present in the diets used during the experimental trial 2, which showed significant changes in the composition, especially for the MUFAs and PUFAs.
Table 4.
Fatty acid profile of the experimental diets in trial 2 (g/100 g).
The CD had a MUFA content of 28.0%, which increased substantially in the diets supplemented with COC and TPOC, reaching 42.4% and 38.3%, respectively. This increase was mainly driven by oleic acid (C18:1n-9), which varied from 25.9% in the CD to 39.9% and 36.1% in the diets with COC and TPOC, respectively. The diet containing 10% EOC had a MUFA content close to the control diet (29.5%), while adding 1% olive oil to the EOC raised the MUFA content to 36.1%.
Regarding PUFA, the EOC0 had the highest content (50.5%), with lower values in the diets supplemented with OC, especially in the diet COC, which registered 37.6%. Linoleic acid (C18:2n-6) followed a similar trend, reducing from 47.6% in the CD to 35.3% in the COC diet. The TPOC and EOC diets showed intermediate PUFA values, with 41.6% and 49.2%, respectively, while adding olive oil to the EOC resulted in a PUFA content of 43.3%.
The PUFA/SFA ratio showed a slight variation, from 2.34 in the CD to 1.88 in the COC diet, while the other diets remained close to the values of the CD. The n-6/n-3 ratio varied little among the diets, remaining between 16.7 and 17.6. These results indicate that including different types of OC alters the lipid profile of the diets, with increases in MUFA in some formulations and reductions in PUFA, especially in diets containing COC.
The pig industry has invested considerably in genetics, management, and nutrition to reduce total fat accumulation in pigs. Concurrently, extensive studies have been dedicated to modifying the fatty acid profile of pork products to align with both processing standards and human dietary guidelines [51]. It is known that the composition of fatty acids (FA) in the pig adipose tissue is influenced mainly by the lipid profile of the diet fed to the animals. In the case of autochthonous breeds, known for their specific meat quality characteristics and high levels of intramuscular fat, adjusting the diet can be a valuable strategy for improving the lipid quality of products while maintaining the sensory and traditional properties associated with these breeds [52].
Building upon this, our recently published study explored the impact of incorporating different types of OC into the diets of Bísaro pigs, with a particular focus on the chemical composition and fatty acid profile of fresh ham muscles [9]. Given that the quality of raw meat directly influences the final characteristics of cured ham, understanding how dietary interventions affect muscle composition is crucial. The findings demonstrated that OC inclusion influenced key parameters such as protein content, collagen levels, and haem pigments while altering the fatty acid profile, particularly regarding MUFA and PUFA concentrations. Furthermore, Leite et al. [53] examined the effects of different OC on the dry-cured loin and dry-cured “cachaço” of Bísaro pork, providing valuable insights into the impact of diet on cured products. Their findings revealed significant differences in chemical composition between these two products. However, no significant effects of olive cake inclusion were observed on the final quality attributes of the cured meat. Together, these studies contribute to a broader understanding of how dietary strategies can enhance both the sustainability and quality of Bísaro pork products.
These results reinforce the potential of olive cake as a sustainable feed ingredient that can contribute to optimising meat quality and balancing nutritional benefits with economic and environmental considerations.
3.2. Granulometry Analysis of Cakes and Diets
The diets’ particle size distribution was important for assessing their physical properties and understanding how this parameter can optimise the animals’ feed. The analysis presented in Table 5 shows the distribution of the geometric mean diameter (GMD) of the two control diets (EOC0 and CD) used in trials 1 and 2, respectively, and the three individual types of OC used in both trials: EOC, COC and TPOC. The uniformity of the particles was assessed based on size, and they were classified as large (>2 mm), medium (2–0.60 mm) and small (<0.60 mm).
Table 5.
Granulometry analysis of the control diets and olive cakes used in experiments 1 and 2.
The results indicate that the control diets (EOC0 and CD) showed a variable particle distribution, with a higher proportion of medium-sized particles (46.4 and 40.1 mm, respectively) and small-sized particles (50.6 and 57.7 mm, respectively). This resulted in a GMD ranging from 205.9 μm to 249.5 μm for the CD and EOC0 diets, respectively.
The GMD of the different OC used in trials 1 and 2 are shown in Table 5 and revealed diverse patterns, with COC and EOC exhibiting larger average geometric diameters (507.4 and 506.9 μm, respectively) and TPOC smaller particles (353.6 μm), which may be related to the partial grinding process.
The digestive physiology of pigs, characterised by a simple stomach and dependence on endogenous enzymes, requires diets formulated with high-quality ingredients and processed in such a way as to guarantee maximum nutrient digestibility and availability. Feed composition, particle size and physical form (meal or pellets) directly influence the efficiency with which the animals utilise the feed, which impacts the animals’ productive performance and intestinal health [54,55,56,57].
The ideal particle size varies between 500 and 1600 µm, depending on the production stage and the diet composition. Particles smaller than 400 µm can cause damage to the gastric mucosa, heightening the likelihood of gastric ulcers and other problems, such as keratinisation, compromising the animals’ health. However, larger particles can reduce the digestibility and palatability of the feed. The right choice of particle size contributes to better animal performance, a lower incidence of disease, and greater production efficiency [54,58].
The OC’s inclusion in pigs’ diets can influence their feed preferences due to the textural properties of the feed, as well as its palatability. As pigs tend to prefer less complex and more crumbly feed, adding OC can make it more difficult for them to accept it, precisely because it changes the texture of the feed, making it more fibrous [59].
Literature data indicate that diets containing very small particles may reduce the ADFI in pigs due to the decreased palatability of these diets. For example, authors report that pigs generally prefer larger particle sizes, as demonstrated by Marshall et al. [60], who observed that animals preferred corn with particle sizes ranging from 500 to 700 µm over finer particles [45]. Similar studies, such as those by De Jong et al. [61] and Nemechek et al. [62], confirm this trend, showing that reducing particle size to below 400 μm decreases feed intake. In addition, studies show that reducing particle size generally decreases ADFI in finishing pigs, especially when the feed is a meal, as reported by Kippert et al. [63]. Thus, the higher GMD observed in EOC 15 (trial 1) and EOC (trial 2) may contribute to greater feed acceptance, potentially favouring feed intake and animal performance, as suggested by these studies.
The particle size of pig feed is not just a scientific concept but a practical consideration that significantly impacts nutrient digestibility, growth performance, and feed efficiency. This understanding empowers us to make informed decisions about feed formulation. Excessively fine particles, often a consequence of the grinding process, can increase the risk of gastric ulcers. Optimising particle size in pelleted diets is crucial for maximising pig health and performance [54,57,64].
Grinding the OC is essential for its efficient incorporation into animal diets. This procedure reduces the particle size, making it more homogeneous and suitable for animal consumption. It also improves the acceptability and digestibility of the material in feed formulation. Moreover, the issue of particle size may explain the difficulty in achieving homogeneous mixtures of the by-products with the base feed, leading to chemical analysis results that could sometimes be more challenging to interpret during the initial phases of these studies.
3.3. Performances Measurements
No deaths were observed during the experimental period. The results of initial (iLW) and final (fLW) live weights were analysed along with the average values of ADG, ADFI, and FCR.
In the first experimental trial (trial 1), the first six days (D1–D6) were spent getting the animals to the experimental diets. Weighing was carried out at the beginning (D1), after the habituation period (D6) and at the end of the experiment (D15). Table 6 shows the results of the animals’ performance in trial 1.
Table 6.
Performances of Bísaro pigs fed different levels of EOC (trial 1).
Although the animals in the EOC15 group had a higher final live weight (D15; around 2 kg higher than average), there were no significant effects (p > 0.05) of the diet on growth. The average daily gain (ADG) showed a significant linear behaviour (p = 0.014), indicating an increase in ADG with increasing levels of EOC, with the highest value observed in the group fed 15% EOC (1.120 kg/day).
Average daily feed intake (ADFI) showed a significant quadratic (p = 0.043), with the highest intake by EOC15 group (4.47 kg/day).
The feed conversion ratio (FCR) showed a significant linear behaviour (p = 0.005), with an improvement in feed efficiency in the animals fed increasing levels of EOC, with the lowest FCR observed in the group fed 15% EOC (3.97). The ANOVA for FCR also showed a tendency towards significance (p = 0.051).
Incorporating fibrous by-products like OC in diets for growing pigs has been associated with a decline in productive performance, negatively impacting weight gain and feed efficiency. Because of the elevated fibre content, the digestibility and availability of nutrients can be affected, reducing animal performance [65]. Although no significant effects were observed for final live weight, animals fed EOC15 exhibited the highest numerical values for final live weight, as well as higher ADG, higher ADFI, and better FCR compared to the CD group. Previous studies reinforce the importance of considering biological trends, even without statistical significance. For example, Liotta et al. [5] observed similar results when incorporating two different levels (5% and 10%) of OC into the diet of Pietrain pigs. The inclusion of OC had a positive effect on ADG and FCR. Specifically, pigs fed 5% of OC showed significantly improved body weight and FCR compared to a CD without OC. Joven et al. [66] consistently reported higher growth rates and feed intake in pigs fed diets containing 5% or 10% OC, compared to diets containing 15% inclusion, which showed inferior performance.
Cole et al. [67] reported that pigs tend to regulate their feed intake to maintain a constant energy consumption. In addition, studies by Coffey et al. [68], Longland and Low [69] and Brand et al. [70] have highlighted that the type of fibre in the diet significantly influences feed intake more than the total amount of fibre. Thus, the performance observed in the EOC 15 group reinforces the idea that EOC, even in high proportions, can be a well-tolerated fibre source, promoting reasonable growth rates and feed intake.
Our study’s results align with previous reports in the literature, where the inclusion of olive by-products such as EOC in pig diets did not negatively affect growth performance, ADG, or FCR in the animals of Bísaro local breed [5,50].
Table 7 shows the results of the animals’ performances in trial 2. No significant differences (p > 0.05) were found in the iLW and fLW, ADG, ADFI, and FCR during the study period. It is important to note that despite no significant differences, there were slight variations in the average values of the evaluated parameters. The animals started the experimental trial with a levelled body weight. However, the animals that received the diet with EOC finished with a higher average live weight than the others. Still, these values were insufficient to generate statistical differences between the groups.
Table 7.
Performances of Bísaro pigs fed different OC diets (trial 2).
The animals’ ADG during the trial varied from 0.522 kg/day to 0.703 kg/day, with no significant differences (p > 0.05). Incorporating different forms of OC in the diet did not affect the animals’ growth. However, the animals that received OC showed higher average values in terms of growth performance relative to the CD.
The results suggest that adding OC in the animals’ diet led to a general increase in intake, with the group that received COC showing the highest intake. This indicates that the animals tended to accept this specific OC better, possibly related to the high residual olive oil and aroma. These components may have influenced the diet’s palatability, leading the animals to consume more feed.
The FCR revealed variations between 5.1 and 5.5. It is essential to highlight that including OC in the diet, except for TPOC, reduced this ratio compared to the CD. The observed differences were around 0.3. This means the animals consumed about 300 g less feed for each kg of LW gain.
From a production perspective, according to the results, 10% OC inclusion in the diets formulated for finishing pigs of this breed does no harm. There were no significant differences in iLW, fLW, and ADG. In other words, according to our results, OC can be included in the animal’s diet. Liotta et al. [5] found that when evaluating the effects of dietary inclusion of OC on the performance of pigs fed at two levels (50 g/kg and 100 g/kg), the animals that received 50 g/kg of OC showed the best values for fLW, ADG, lower ADFI, and better FCR.
According to Jarrett and Ashworth [65], including fibrous by-products in pig diets, especially during growth, can result in lower performance characteristics. However, new studies contradict this effect on animals, as seen in the present experimental trial. Typically, in the conventional system, Bísaro pigs are fattened slowly between 1 and 2 years of age, reaching a slaughter weight ranging from 120 to 180 kg, with the process intentionally scheduled for the colder months of the year (between November and February) [26]. In this trial, although without statistical significance (p > 0.05), the animals started with similar weights between the groups; however, we observed that the animals that received the by-product had a higher fLW at slaughter than the CD, except the TPOC group. The same was observed in the ADG. Regardless of the fibre-rich by-products offered to the animals, it did not inhibit their growth performance, which aligns with [71].
Regarding the ADFI, we observed in our study that the group that received COC had the highest values, while the group that received centrifuged pomace had the lowest values. This difference may be attributed to COC having a higher residual oil content and a more attractive aroma, which may have influenced animal consumption. Additionally, there are reports that pigs under ad libitum conditions maintain a constant energy intake, consequently regulating their feed intake [67].
The FCR ranged between 5.1 and 5.5. These values are high; however, it is crucial to consider that the Bísaro breed has particular genetic characteristics that may include a lower efficiency in utilising the nutrients in the feed, which is characteristic of autochthonous breeds at this age and weight. These animals have slower growth, high maintenance requirements, and significant fat tissue deposition. The meat and derived products from these animals are traditionally known for their excellent quality and suitability for processing. For this reason, they should be valued to ensure their economic feasibility [72]. Santos e Silva et al. [72] compared the growth performance of Bísaro pigs with Landrace × Large White pigs. Also, they obtained high values for the FCR of these animals (FCR = 5.45), demonstrating this breed’s low growth rate and feed efficiency compared to Landrace × Large White pigs. Martins et al. [73], when comparing the growth characteristics of local pig breeds and their crosses, also obtained higher values for the FCR of Bísaro pigs (FCR = 5.2), and this parameter increased even more in the crossbreeding of Alentejana and Bísaro breeds (ALxBI, FCR = 6.0).
3.4. Digestibility Results
Table 8 below reports the intake and apparent total tract digestibility (ATTD) results in analysis for DM, OM, CP, and CF fractions from trial 1. The ATTD of DM, OM, CP, CF, and fibre was determined using CrO2 as a marker (0.2%; 4 days). The incorporation of OC caused a linear decrease (p < 0.001) in the ATTD of DM, OM, CP, CF, and NDF (from 89.2, 91.6, 92.1, 95.0, and 61.6% to 78.2, 79.9, 82.5, 87.1, and 44.5%, respectively). The ADFI of DM and OM increased (quadratic component, p < 0.05), that of protein tended to increase (quadratic component, p = 0.053), that of fat remained unchanged (p > 0.05), and that of NDF increased linearly (p < 0.001). The combination of ADFI and ATTD responses increased the ADFI of digestible DM, OM, CP, and NDF (quadratic response, p < 0.05). In this exploratory trial, the results suggest that the reduction in ATTD observed with the replacement of the control diet with up to 15% OC was offset by an increase in intake. This increase resulted in more significant animal growth, an effect confirmed in the subsequent trial.
Table 8.
Intake, apparent total tract digestibility, and digestible intake in Bísaro pigs fed different levels of EOC (trial 1).
Table 9 below reports the intake and ATTD results analysis for DM, OM, CP, and CF fractions during trial 2. The incorporation of OC caused a significant increase in the intake of CF (p = 0.001) and NDF (p = 0.003). The ATTD of DM, OM, and CP increased with the incorporation of EOC and EOC-OO, and the ATTD of CP tended to increase (p = 0.077). The combination of intake and ATTD responses increased the intake of DM, OM, CP, and digestible NDF, with significant results concerning the digestible intake of CF (p = 0.002) and NDF (p = 0.005).
Table 9.
Intake, apparent total tract digestibility, and digestible intake in Bísaro pigs fed different OC diets (trial 2).
The absence of detailed information regarding the digestibility of particular by-products and other locally sourced feed ingredients for Bísaro pigs represents a significant challenge in optimising their diet formulation and determining accurate inclusion levels. In the current study, the treatment incorporating EOC supplemented with 1% olive oil demonstrated the highest digestibility coefficients, exceeding 90% across all analysed nutrient fractions. This finding underscores the potential of such by-products to enhance dietary efficiency while supporting sustainable feed practices. Our values are elevated compared to other data in the literature; however, the literature mainly reports data from commercial pig breeds. It is essential to consider that Bísaro pigs have distinct physiology and genetic characteristics, which may cause variations in this parameter. Typically, these animals are raised freely on traditional farms and are fed local crops, usually cultivated on the farm itself. Their diet predominantly consists of cereals as the main feed, supplemented throughout the year with various foods, including tubers, vegetables, and fruits [26]. This may also explain why our animals exhibit higher digestibility coefficients than those found in the literature, even when receiving a diet with a fibrous by-product.
Generally, when incorporating a fibre-rich component into the diet of commercial pig breeds, a decrease in the digestibility of various fractions is expected, as shown by Joven et al. [66]. In their study, where barley was replaced with increasing levels of olive cake (OC) (0, 50, 100, and 150 g/kg of feed) in the diet of Duroc × (Landrace × Large White) pigs, a quadratic trend was observed. The inclusion of OC in the diet led to a reduction in the digestibility coefficients of DM and fibre. This can be explained by the fact that, although these by-products are rich in energy and nutrients, they are fibrous in nature. Adding these by-products to pig diets alters the carbohydrate composition, shifting from a starch-rich diet to one containing fewer starches and more non-starch polysaccharides, the primary constituents of dietary fibre. It is important to note that fibre-rich diets typically have lower nutritional value for monogastric animals, including pigs. Their digestive enzymes are not well suited for the efficient breakdown of non-starch polysaccharides in fibre [71].
The improved digestibility observed in animals fed a diet supplemented with olive oil can be attributed to high-fat diets passing more slowly through the gastrointestinal tract than lower-fat diets. This slower transit time allows more time for the digestion and absorption of nutrients, thereby enhancing digestibility [52]. Additionally, Bertol and Ludke [74] noted that as animals age, the digestibility coefficient in trials involving high-fibre diets tends to increase. This improvement is likely related to a better utilisation of the fibrous fraction in the large intestine.
In summary, OC has been used in animal feed for many years, with no reports of toxicity-related negative impacts. Research consistently shows no adverse effects on animal health or performance when OC is included in diets up to certain levels (e.g., 10% for poultry) [9,23,75,76,77]. In the present study, the first trial was designed to evaluate the degree of acceptability of the pomace and any potential adverse effects on the animals’ productive performance. The results indicated that up to 15% inclusion in the diet did not result in any negative effects, and at higher levels, animals even increased their feed intake. Thus, considering that these pigs are destined for slaughter and that the incorporation of pomace occurs only in the finishing phase, long-term adverse nutritional effects are not anticipated.
The economic viability of using OC in animal feed depends on various factors, including the proximity between olive oil mills and pig production units. In the Trás-os-Montes region, which hosts a significant share of Portuguese mills and a high density of this pig breed, the proximity between olive oil production and pig farming facilitates the practical implementation of OC in animal feed. However, one of the main challenges of using pomace in animal feed is the dehydration process, which consumes large amounts of energy. This factor presents a significant limitation, as compound feed factories do not use pomace with high moisture content. Despite this limitation, dehydration of pomace is already carried out in the subsequent process of extracting residual fat using chemical solvents [11]. Therefore, instead of following this industrial process, its direct use in animal feed could represent a more economically advantageous alternative.
4. Conclusions
The results of this study suggest that incorporating different types of olive cake (OC) into the diet of Bísaro pigs does not negatively affect key productive parameters, including growth, ADFI, FCR, or digestibility. Up to inclusion levels of 15%, no negative effects were observed, and animals showed increased intake with higher inclusion levels. This suggests that OC is well accepted and safe for animal diets.
Integrating OC by-products into pig diets may offer several sustainability benefits, reduced environmental emissions, and potential enhancements in intestinal health. Additionally, incorporating OC can help lower feed costs and contribute to more sustainable livestock production. However, the economic viability of using OC depends on factors such as proximity to production sites, drying costs, logistical efficiency, regularity, and nutritional composition.
The possibility of using fresh or exhausted OC directly at production sites represents a viable alternative, minimising costs and increasing practicality. Nevertheless, its impact on nutrient digestibility and overall animal performance may vary. It is essential to carefully select and optimise these by-products to balance economic advantages with potential effects on nutrient absorption and growth performance.
Ultimately, the broader adoption of this practice could support more circular agricultural systems, where agro-industrial waste is repurposed efficiently, reducing reliance on conventional feed sources and mitigating waste disposal challenges. Further comprehensive studies are required to explore the full potential of OC in sustainable animal feeding strategies and to optimise its use for maximum nutritional and economic benefits.
Author Contributions
Conceptualisation: J.P.-R.; investigation: J.P.-R., A.T., J.T., V.P., D.O.-M., M.J.G. and C.G.; data curation, J.P.-R.; writing—original draft preparation, J.P.-R.; writing: J.P.-R.; review and editing: J.P.-R., V.P. and D.O.-M.; funding acquisition: A.T., V.P. and D.O.-M. All authors have read and agreed to the published version of the manuscript.
Funding
This research was funded by “BisOlive: Use of olive pomace in the feeding of Bísaro swine. Evaluation of the effect on meat quality” project NORTE-01-0247-FEDER-072234.
Institutional Review Board Statement
The animal study protocol was approved by the Institutional Ethics Committee of Universidade of Trás-os-Montes and Alto Douro (UTAD), Portugal (protocol code: 2253-e-DZ-2022, 29 September 2022).
Informed Consent Statement
Not applicable.
Data Availability Statement
Data are contained within the article.
Acknowledgments
This work was supported by the projects UIDB/00772/2020 (Doi:10.54499/UIDB/00772/2020), funded by the Portuguese Foundation for Science and Technology (FCT). The authors are grateful for the financial support provided.
Conflicts of Interest
The authors declare no conflicts of interest.
References
- Roig, A.; Cayuela, M.L.; Sánchez-Monedero, M.A. An Overview on Olive Mill Wastes and Their Valorisation Methods. Waste Manag. 2006, 26, 960–969. [Google Scholar] [CrossRef] [PubMed]
- Ajayi, O.O.; Toromade, A.S.; Olagoke, A. Circular Agro-Economies (CAE): Reducing Waste and Increasing Profitability in Agriculture. Int. J. Adv. Econ. 2024, 6, 598–611. [Google Scholar] [CrossRef]
- Vlaicu, P.A.; Untea, A.E.; Oancea, A.G. Sustainable Poultry Feeding Strategies for Achieving Zero Hunger and Enhancing Food Quality. Agriculture 2024, 14, 1811. [Google Scholar] [CrossRef]
- Cifuni, G.F.; Claps, S.; Morone, G.; Sepe, L.; Caparra, P.; Benincasa, C.; Pellegrino, M.; Perri, E. Valorization of Olive Mill Byproducts: Recovery of Biophenol Compounds and Application in Animal Feed. Plants 2023, 12, 3062. [Google Scholar] [CrossRef]
- Liotta, L.; Chiofalo, V.; Lo Presti, V.; Chiofalo, B. In Vivo Performances, Carcass Traits, and Meat Quality of Pigs Fed Olive Cake Processing Waste. Animals 2019, 9, 1155. [Google Scholar] [CrossRef] [PubMed]
- Nunes, M.A.; Palmeira, J.D.; Melo, D.; Machado, S.; Lobo, J.C.; Costa, A.S.G.; Alves, R.C.; Ferreira, H.; Oliveira, M.B.P.P. Chemical Composition and Antimicrobial Activity of a New Olive Pomace Functional Ingredient. Pharmaceuticals 2021, 14, 913. [Google Scholar] [CrossRef]
- Antónia Nunes, M.; Páscoa, R.N.M.J.; Alves, R.C.; Costa, A.S.G.; Bessada, S.; Oliveira, M.B.P.P. Fourier Transform near Infrared Spectroscopy as a Tool to Discriminate Olive Wastes: The Case of Monocultivar Pomaces. Waste Manag. 2020, 103, 378–387. [Google Scholar] [CrossRef]
- Antónia Nunes, M.; Costa, A.S.G.; Bessada, S.; Santos, J.; Puga, H.; Alves, R.C.; Freitas, V.; Oliveira, M.B.P.P. Olive Pomace as a Valuable Source of Bioactive Compounds: A Study Regarding Its Lipid- and Water-Soluble Components. Sci. Total Environ. 2018, 644, 229–236. [Google Scholar] [CrossRef]
- Paié-Ribeiro, J.; Pinheiro, V.; Guedes, C.; Gomes, M.J.; Teixeira, J.; Leite, A.; Vasconcelos, L.; Teixeira, A.; Outor-Monteiro, D. Exploring the Potential of Olive By-Products in Bísaro Pig Feed: Effects on the Chemical Compositions and Fatty Acid Profiles of Three Different Muscles. Foods 2025, 14, 836. [Google Scholar] [CrossRef]
- Sousa, M.M.; Ferreira, D.M.; Machado, S.; Lobo, J.C.; Costa, A.S.G.; Palmeira, J.D.; Nunes, M.A.; Alves, R.C.; Ferreira, H.; Oliveira, M.B.P.P. Effect of Different Time/Temperature Binomials on the Chemical Features, Antioxidant Activity, and Natural Microbial Load of Olive Pomace Paste. Molecules 2023, 28, 2876. [Google Scholar] [CrossRef]
- Paié-Ribeiro, J.; Baptista, F.; Teixeira, J.; Guedes, C.; Gomes, M.J.; Teixeira, A.; Barros, A.N.; Pinheiro, V.; Outor-Monteiro, D. From Waste to Resource: Compositional Analysis of Olive Cake’s Fatty Acids, Nutrients and Antinutrients. Appl. Sci. 2024, 14, 5586. [Google Scholar] [CrossRef]
- Ribeiro, T.B.; Oliveira, A.; Coelho, M.; Veiga, M.; Costa, E.M.; Silva, S.; Nunes, J.; Vicente, A.A.; Pintado, M. Are Olive Pomace Powders a Safe Source of Bioactives and Nutrients? J. Sci. Food Agric. 2021, 101, 1963–1978. [Google Scholar] [CrossRef] [PubMed]
- Rahmanian, N.; Jafari, S.M.; Galanakis, C.M. Recovery and Removal of Phenolic Compounds from Olive Mill Wastewater. JAOCS J. Am. Oil Chem. Soc. 2014, 91, 1–18. [Google Scholar] [CrossRef]
- Gomes, A.; Borges, A.; Peres, J.A.; Lucas, M.S. Bioenergy Production from Agro-Industrial Wastewater Using Advanced Oxidation Processes as Pre-Treatment. Catalysts 2023, 13, 1186. [Google Scholar] [CrossRef]
- Otero, P.; Garcia-Oliveira, P.; Carpena, M.; Barral-Martinez, M.; Chamorro, F.; Echave, J.; Garcia-Perez, P.; Cao, H.; Xiao, J.; Simal-Gandara, J.; et al. Applications of By-Products from the Olive Oil Processing: Revalorization Strategies Based on Target Molecules and Green Extraction Technologies. Trends Food Sci. Technol. 2021, 116, 1084–1104. [Google Scholar] [CrossRef]
- Gullón, P.; Gullón, B.; Astray, G.; Carpena, M.; Fraga-Corral, M.; Prieto, M.A.; Simal-Gandara, J. Valorization of By-Products from Olive Oil Industry and Added-Value Applications for Innovative Functional Foods. Food Res. Int. 2020, 137, 109683. [Google Scholar] [CrossRef]
- Gómez-Cruz, I.; Cara, C.; Romero, I.; Castro, E.; Gullón, B. Valorisation of Exhausted Olive Pomace by an Ecofriendly Solvent Extraction Process of Natural Antioxidants. Antioxidants 2020, 9, 1010. [Google Scholar] [CrossRef]
- Ollero, P.; Serrera, A.; Arjona, R.; Alcantarilla, S. The CO2 Gasification Kinetics of Olive Residue. Biomass Bioenergy 2003, 24, 151–161. [Google Scholar] [CrossRef]
- Manzanares, P.; Ruiz, E.; Ballesteros, M.; Negro, M.J.; Gallego, F.J.; López-Linares, J.C.; Castro, E. Residual Biomass Potential in Olive Tree Cultivation and Olive Oil Industry in Spain: Valorization Proposal in a Biorefinery Context. Span. J. Agric. Res. 2017, 15, e0206. [Google Scholar] [CrossRef]
- Markhali, F.S.; Teixeira, J.A.; Rocha, C.M.R. Olive Tree Leaves-A Source of Valuable Active Compounds. Processes 2020, 8, 1177. [Google Scholar] [CrossRef]
- Ferrer, P.; García-Rebollar, P.; Cerisuelo, A.; Ibáñez, M.A.; Rodríguez, C.A.; Calvet, S.; De Blas, C. Nutritional Value of Crude and Partially Defatted Olive Cake in Finishing Pigs and Effects on Nitrogen Balance and Gaseous Emissions. Anim. Feed Sci. Technol. 2018, 236, 131–140. [Google Scholar] [CrossRef]
- Tzamaloukas, O.; Neofytou, M.C.; Simitzis, P.E. Application of Olive By-Products in Livestock with Emphasis on Small Ruminants: Implications on Rumen Function, Growth Performance, Milk and Meat Quality. Animals 2021, 11, 531. [Google Scholar] [CrossRef]
- de Oliveira, C.O.; Roll, A.A.P.; Medeiros Gonçalves, F.M.; Lopes, D.C.N.; Xavier, E.G. Olive Pomace for the Feeding of Commercial Poultry: Effects on Performance, Meat and Eggs Quality, Haematological Parameters, Microbiota and Immunity. Worlds Poult. Sci. J. 2021, 77, 363–376. [Google Scholar] [CrossRef]
- Alderey, A.; Kassas, N.; Hussein, E.; Farag, S.; Hassan, A.; Atia, S.; Gomaa, M.; Hadad, E.; Hafsa, S. Impacts of Enzymes and Probiotic in Improving the Utilization of Sieved Olive Pulp Meal in Growing Rabbit Diets. J. Adv. Vet. Anim. Res. 2024, 11, 161–170. [Google Scholar] [CrossRef]
- Leite, A.; Domínguez, R.; Vasconcelos, L.; Ferreira, I.; Pereira, E.; Pinheiro, V.; Outor-Monteiro, D.; Rodrigues, S.; Lorenzo, J.M.; Santos, E.M.; et al. Can the Introduction of Different Olive Cakes Affect the Carcass, Meat and Fat Quality of Bísaro Pork? Foods 2022, 11, 1650. [Google Scholar] [CrossRef] [PubMed]
- Santos Silva, J.; Pedro Araújo, J.; Orlando Cerqueira, J.; Pires, P.; Alves, C.; Batorek-Lukač, N. Bísaro Pig. In European Local Pig Breeds—Diversity and Performance. A Study of Project TREASURE; IntechOpen: London, UK, 2019. [Google Scholar] [CrossRef]
- Horwitz, W. Official Methods of Analysis of AOAC International; AOAC International: Gaithersburg, MD, USA, 2006; ISBN 0935584773. [Google Scholar]
- Aguirre, J. The Kjeldahl Method. In The Kjeldahl Method: 140 Years; Springer Nature Switzerland: Cham, Switzerland, 2023; pp. 53–78. ISBN 978-3-031-31457-5. [Google Scholar]
- Van Soest, P.J.; Robertson, J.B.; Lewis, B.A. Methods for Dietary Fiber, Neutral Detergent Fiber, and Nonstarch Polysaccharides in Relation to Animal Nutrition. J. Dairy Sci. 1991, 74, 3583–3597. [Google Scholar] [CrossRef] [PubMed]
- Noblet, J.; Perez, J.M. Prediction of Digestibility of Nutrients and Energy Values of Pig Diets from Chemical Analysis1. J. Anim. Sci. 1993, 71, 3389–3398. [Google Scholar] [CrossRef]
- ISO 12966-2:2017; Animal and Vegetable Fats and Oils-Gas Chromatography of Fatty Acid Methyl Esters-Part 2. International Standard, 2nd ed. CSA Group: Toronto, ON, Canada, 2017.
- PROCEDURE. Megazyme. 2019. Available online: https://d1kkimny8vk5e2.cloudfront.net/documents/Assay_Protocol/K-PHYT_DATA.pdf (accessed on 1 January 2025).
- de Almeida, L.M.; Zavelinski, V.A.B.; Sonálio, K.C.; da Silva, K.F.; Muramatsu, K.; Maiorka, A. Effect of Feed Particle Size in Pelleted Diets on Growth Performance and Digestibility of Weaning Piglets. Livest. Sci. 2021, 244, 104364. [Google Scholar] [CrossRef]
- Oetting, L.L.; Piracicaba, N.A. Avaliação de Diferentes Marcadores Para a Determinação Da Digestibilidade e Taxa de Passagem Do Alimento Em Suínos. Mater’s Thesis, Centro de Energia Nuclear na Agricultura, Universidade de Săo Paulo, Piracicaba, Brazil, 2002. [Google Scholar]
- Paié-Ribeiro, J.; Baptista, F.; Gomes, M.J.; Teixeira, A.; Pinheiro, V.; Outor-Monteiro, D.; Barros, A.N. Exploring the Variability in Phenolic Compounds and Antioxidant Capacity in Olive Oil By-Products: A Path to Sustainable Valorization. Antioxidants 2024, 13, 1470. [Google Scholar] [CrossRef]
- Woyengo, T.A.; Adeola, O.; Udenigwe, C.C.; Nyachoti, C.M. Gastro-Intestinal Digesta PH, Pepsin Activity and Soluble Mineral Concentration Responses to Supplemental Phytic Acid and Phytase in Piglets. Livest. Sci. 2010, 134, 91–93. [Google Scholar] [CrossRef]
- Marcos, C.N.; García-Rebollar, P.; de Blas, C.; Carro, M.D. Variability in the Chemical Composition and in Vitro Ruminal Fermentation of Olive Cake By-Products. Animals 2019, 9, 109. [Google Scholar] [CrossRef]
- Chacón-Ortiz, A.E.; da Maia, L.C.; de Oliveira, A.C.; Venske, E.; Pegoraro, C. Characterization and Heritability of Fruit from Olive Cultivars in the South of Brazil. Bragantia 2022, 81, e7022. [Google Scholar] [CrossRef]
- Ying, D.Y.; Hlaing, M.M.; Lerisson, J.; Pitts, K.; Cheng, L.; Sanguansri, L.; Augustin, M.A. Physical Properties and FTIR Analysis of Rice-Oat Flour and Maize-Oat Flour Based Extruded Food Products Containing Olive Pomace. Food Res. Int. 2017, 100, 665–673. [Google Scholar] [CrossRef]
- Selim, K.; Badawy, W.; Smetanska, I. Utilization of Olive Pomace as a Source of Bioactive Compounds in Quality Improving of Toast Bread. Egypt. J. Food Sci. 2020, 48, 27–40. [Google Scholar] [CrossRef]
- Molina Alcaide, E.; Nefzaou, A. Recycling of Olive Oil By-Products: Possibilities of Utilization in Animal Nutrition. Int. Biodeterior. Biodegrad. 1996, 38, 227–235. [Google Scholar] [CrossRef]
- Molina-Alcaide, E.; Yáñez-Ruiz, D.R. Potential Use of Olive By-Products in Ruminant Feeding: A Review. Anim. Feed Sci. Technol. 2008, 147, 247–264. [Google Scholar] [CrossRef]
- Martín García, A.I.; Moumen, A.; Yáñez Ruiz, D.R.; Molina Alcaide, E. Chemical Composition and Nutrients Availability for Goats and Sheep of Two-Stage Olive Cake and Olive Leaves. Anim. Feed Sci. Technol. 2003, 107, 61–74. [Google Scholar] [CrossRef]
- Marcos, C.N.; de Evan, T.; García-Rebollar, P.; de Blas, C.; Carro, M.D. Influence of Storage Time and Processing on Chemical Composition and in Vitro Ruminal Fermentation of Olive Cake. J. Anim. Physiol. Anim. Nutr. 2019, 103, 1303–1312. [Google Scholar] [CrossRef]
- Lee, S.A.; Ahn, J.Y.; Kim, B.G. Digestible and Metabolizable Energy Concentrations in Cereal Grains and Byproduct Ingredients Fed to Growing Pigs. Anim. Feed Sci. Technol. 2022, 292, 115408. [Google Scholar] [CrossRef]
- Kim, J.; Jo, Y.Y.; Kim, B.G.G. PSIV-B-25 Digestible Energy and Metabolizable Energy of High-Fiber Ingredients in Growing Pig Diets. J. Anim. Sci. 2021, 99, 394–395. [Google Scholar] [CrossRef]
- Lyu, Z.; Zang, J.; Lai, C.; Li, P.; Ma, D.; Zhao, J.; Zhang, S.; Huang, C. Effects of Dietary Fibre Level and Body Weight of Pigs on Nutrient Digestibility and Available Energy in High-fibre Diet Based on Wheat Bran or Sunflower Meal. J. Anim. Physiol. Anim. Nutr. 2019, 103, 1895–1907. [Google Scholar] [CrossRef] [PubMed]
- Vastolo, A.; Calabró, S.; Liotta, L.; Musco, N.; Di Rosa, A.R.; Cutrignelli, M.I.; Chiofalo, B. In Vitro Fermentation and Chemical Characteristics of Mediterranean By-Products for Swine Nutrition. Animals 2019, 9, 556. [Google Scholar] [CrossRef]
- Giromini, C.; Ottoboni, M.; Tretola, M.; Marchis, D.; Gottardo, D.; Caprarulo, V.; Baldi, A.; Pinotti, L. Nutritional Evaluation of Former Food Products (Ex-Food) Intended for Pig Nutrition. Food Addit. Contam. Part A Chem. Anal. Control Expo. Risk Assess. 2017, 34, 1436–1445. [Google Scholar] [CrossRef] [PubMed]
- Ferrer, P.; Calvet, S.; Garciá-Rebollar, P.; De Blas, C.; Jiménez-Belenguer, A.I.; Hernández, P.; Piquer, O.; Cerisuelo, A. Partially Defatted Olive Cake in Finishing Pig Diets: Implications on Performance, Faecal Microbiota, Carcass Quality, Slurry Composition and Gas Emission. Animal 2020, 14, 426–434. [Google Scholar] [CrossRef] [PubMed]
- Cameron, N.D.; Enser, M.; Nute, G.R.; Whittington, F.M.; Penman, J.C.; Fisken, A.C.; Perry, A.M.; Wood, J.D. Genotype with Nutrition Interaction on Fatty Acid Composition of Intramuscular Fat and the Relationship with Flavour of Pig Meat. Meat. Sci. 2000, 55, 187–195. [Google Scholar] [CrossRef]
- Realini, C.E.; Duran-Montgé, P.; Lizardo, R.; Gispert, M.; Oliver, M.A.; Esteve-Garcia, E. Effect of Source of Dietary Fat on Pig Performance, Carcass Characteristics and Carcass Fat Content, Distribution and Fatty Acid Composition. Meat. Sci. 2010, 85, 606–612. [Google Scholar] [CrossRef]
- Leite, A.; Vasconcelos, L.; Ferreira, I.; Domínguez, R.; Pereira, E.; Rodrigues, S.; Lorenzo, J.M.; Teixeira, A. Effect of the Inclusion of Olive Cake in the Diet on the Physicochemical Characteristics of Dry-Cured Loin and Dry-Cured “Cachaço” of Bísaro Pig. Appl. Sci. 2023, 13, 1439. [Google Scholar] [CrossRef]
- Vukmirović, Đ.; Čolović, R.; Rakita, S.; Brlek, T.; Đuragić, O.; Solà-Oriol, D. Importance of Feed Structure (Particle Size) and Feed Form (Mash vs. Pellets) in Pig Nutrition—A Review. Anim. Feed Sci. Technol. 2017, 233, 133–144. [Google Scholar] [CrossRef]
- Wondra, K.J.; Hancock, J.D.; Behnke, K.C.; Hines, R.H.; Stark, C.R. Effects of Particle Size and Pelleting on Growth Perfor-mance, Nutrient Digestibility, and Stomach Morphology in Finishing Pigs2. J. Anim. Sci. 1995, 73, 757–763. [Google Scholar] [CrossRef]
- Choct, M.; Selby, E.A.D.; Cadogan, D.J.; Campbell, R.G. Effects of Particle Size, Processing, and Dry or Liquid Feeding on Performance of Piglets. Aust. J. Agric. Res. 2004, 55, 237–245. [Google Scholar] [CrossRef]
- Ball, M.E.E.; Magowan, E.; McCracken, K.J.; Beattie, V.E.; Bradford, R.; Thompson, A.; Gordon, F.J. An Investigation into the Effect of Dietary Particle Size and Pelleting of Diets for Finishing Pigs. Livest. Sci. 2015, 173, 48–54. [Google Scholar] [CrossRef]
- Jo, Y.Y.; Choi, M.J.; Chung, W.L.; Hong, J.S.; Lim, J.S.; Kim, Y.Y. Effects of Feed Form and Particle Size on Growth Performance, Nutrient Digestibility, Carcass Characteristics, and Gastric Health in Growing-Finishing Pigs. Anim. Biosci. 2021, 34, 1061–1069. [Google Scholar] [CrossRef]
- Solà-Oriol, D.; Roura, E.; Torrallardona, D. Feed Preference in Pigs: Relationship with Feed Particle Size and Texture. J. Anim. Sci. 2009, 87, 571–582. [Google Scholar] [CrossRef] [PubMed]
- Marshall, C.M.; Lee, S.A.; Stein, H.H. 240 Feed Preference of Weanling Pigs Fed Diets Containing Extruded Corn Ground to Different Particle Sizes. J. Anim. Sci. 2024, 102, 234–235. [Google Scholar] [CrossRef]
- De Jong, J.A.; DeRouchey, J.M.; Tokach, M.D.; Goodband, R.D.; Dritz, S.S.; Nelssen, J.L.; McKinney, L. Effects of Corn Particle Size, Complete Diet Grinding, and Diet Form on Finishing Pig Growth Performance, Caloric Efficiency, Carcass Characteristics, and Economics. Kans. Agric. Exp. Stn. 2012. [Google Scholar] [CrossRef]
- Nemechek, J.E.; Tokach, M.D.; Dritz, S.S.; Goodband, R.D.; DeRouchey, J.M.; Woodworth, J.C. Effects of Diet Form and Corn Particle Size on Growth Performance and Carcass Characteristics of Finishing Pigs. Anim. Feed Sci. Technol. 2016, 214, 136–141. [Google Scholar] [CrossRef]
- Kippert, C.J.; Vier, C.M.; Lu, N.; Cast, W.R.; Navales, R.A.; Dritz, S.S.; Orlando, U.A. 134 Meta-Analysis to Determine the Effects of Particle Size on Nursery and Finishing Pig’s Growth Performance and Stomach Morphology. J. Anim. Sci. 2021, 99, 74–75. [Google Scholar] [CrossRef]
- Yun, J.M.; Surh, J. Fatty Acid Composition as a Predictor for the Oxidation Stability of Korean Vegetable Oils with or without Induced Oxidative Stress. Prev. Nutr. Food Sci. 2012, 17, 158–165. [Google Scholar] [CrossRef]
- Jarrett, S.; Ashworth, C.J. The Role of Dietary Fibre in Pig Production, with a Particular Emphasis on Reproduction. J. Anim. Sci. Biotechnol. 2018, 9, 59. [Google Scholar] [CrossRef]
- Joven, M.; Pintos, E.; Latorre, M.A.; Suárez-Belloch, J.; Guada, J.A.; Fondevila, M. Effect of Replacing Barley by Increasing Levels of Olive Cake in the Diet of Finishing Pigs: Growth Performances, Digestibility, Carcass, Meat and Fat Quality. Anim. Feed Sci. Technol. 2014, 197, 185–193. [Google Scholar] [CrossRef]
- Cole, D.J.A.; Duckworth, J.E.; Holmes, W. Factors Affecting Voluntary Feed Intake in Pigs. I. The Effect of Digestible Energy Content of the Diet on the Intake of Castrated Male Pigs Housed in Holding Pens and in Metabolism Crates. Anim. Prod. 1967, 9, 141–148. [Google Scholar] [CrossRef]
- Coffey, M.T.; Seerley, R.W.; Funderburke, D.W.; McCampbell, H.C. Effect of Heat Increment and Level of Dietary Energy and Environmental Temperature on the Performance of Growing-Finishing Swine. J. Anim. Sci. 1982, 54, 95–105. [Google Scholar] [CrossRef] [PubMed]
- Longland, A.C.; Low, A.G. Digestion of Diets Containing Molassed or Plain Sugar-Beet Pulp by Growing Pigs. Anim. Feed Sci. Technol. 1989, 23, 67–78. [Google Scholar] [CrossRef]
- Brand, T.S.; Olckers, R.C.; Van Der Merwe, J.P. Evaluation of Faba Beans (Vicia Faba Cv. Fiord) and Sweet Lupins (Zupizus albus Cv. Kiev) as Protein Sources for Growing Pigs. Afr. J. Online 1995, 25, 31–35. [Google Scholar] [CrossRef]
- Agyekum, A.K.; Nyachoti, C.M. Nutritional and Metabolic Consequences of Feeding High-Fiber Diets to Swine: A Review. Engineering 2017, 3, 716–725. [Google Scholar] [CrossRef]
- Santos e Silva, J.; Ferreira-Cardoso, J.; Bernardo, A.; Pires da Costa, J.S. Conservation and Development of the Bísaro Pig. Characterisation and Zootechnical Evaluation of the Breed for Production and Genetic Management. In Quality of Meat and Fat in Pigs as Affected by Genetics and Nutrition, Proceedings of the Joint Session of the EAAP Commissions on Pig Production, Animal Genetics and Animal Nutrition; Wageningen Academic: Wageningen, The Netherlands, 2000; pp. 85–92. [Google Scholar]
- Martins, J.M.; Fialho, R.; Albuquerque, A.; Neves, J.; Freitas, A.; Nunes, J.T.; Charneca, R. Growth, Blood, Carcass and Meat Quality Traits from Local Pig Breeds and Their Crosses. Animal 2020, 14, 636–647. [Google Scholar] [CrossRef]
- Bertol, T.M.; Ludke, J.V. Determinação Dos Valores de Energia e Do Balanço de Nitrogênio de Alguns Alimentos Para Leitões Na Fase Inicial. Rev. Bras. Zootec. 1999, 28, 1279–1287. [Google Scholar] [CrossRef]
- Scicutella, F.; Cucu, M.A.; Mannelli, F.; Pastorelli, R.; Daghio, M.; Paoli, P.; Pazzagli, L.; Turini, L.; Mantino, A.; Luti, S.; et al. Rumen Microbial Community and Milk Quality in Holstein Lactating Cows Fed Olive Oil Pomace as Part in a Sustainable Feeding Strategy. Animal 2023, 17, 100815. [Google Scholar] [CrossRef]
- Cicchi, C.; Paoli, P.; Modesti, A.; Mannelli, F.; Scicutella, F.; Buccioni, A.; Fontanarosa, C.; Luti, S.; Pazzagli, L. Effect of Bovine Milk Peptides on Cell Inflammation, Proliferation and Differentiation: Milk Potential Benefits Are Preserved in an Unconventional Cow Feeding Strategy. Biology 2023, 12, 1162. [Google Scholar] [CrossRef]
- Shamsi, I.H.; Hussain, N.; Jiang, L. Agro-Industrial By-Products Utilization in Animal Nutrition. In Technological Innovations in Major World Oil Crops; Springer New York: New York, NY, USA, 2012; Volume 2, pp. 209–220. [Google Scholar] [CrossRef]
Disclaimer/Publisher’s Note: The statements, opinions and data contained in all publications are solely those of the individual author(s) and contributor(s) and not of MDPI and/or the editor(s). MDPI and/or the editor(s) disclaim responsibility for any injury to people or property resulting from any ideas, methods, instructions or products referred to in the content. |
© 2025 by the authors. Licensee MDPI, Basel, Switzerland. This article is an open access article distributed under the terms and conditions of the Creative Commons Attribution (CC BY) license (https://creativecommons.org/licenses/by/4.0/).