Article

Accessibility Dilemma in Metro Stations: An Experimental Pilot Study Based on Passengers’ Emotional Experiences

1
Facultad de Administración y Economía, Universidad Santiago de Chile, Santiago 9170465, Chile
2
Escuela de Ingeniería de Construcción y Transporte, Pontifica Universidad Católica de Valparaíso, Valparaíso 2362804, Chile
3
IRyS Group, School of Physical Education, Pontificia Universidad Católica de Valparaíso, Valparaíso 2530388, Chile
*
Author to whom correspondence should be addressed.
Sustainability 2025, 17(7), 3064; https://doi.org/10.3390/su17073064
Submission received: 15 February 2025 / Revised: 23 March 2025 / Accepted: 28 March 2025 / Published: 30 March 2025

Abstract

:
This study explores the passengers’ accessibility dilemma in Valparaíso, Chile, through field observations and laboratory experiments. The aim is to investigate the accessibility in metro stations based on the users’ emotional experience. Perceptions were reported through the emotions of passengers according to a circumplex psychological model and an accessibility ranking. Passengers reported their emotions (e.g., stress, sadness, relaxation, and happiness) during different trip moments. Results indicate that rearranging train seats parallel to movement creates a more spacious aisle, enhancing mobility and evoking positive emotions such as happiness. However, an unexpected rise in sadness suggests that social dynamics may influence emotional responses, warranting further investigation. Overcrowding increases stress and sadness, emphasizing the need for capacity management to improve passengers’ emotional experiences. Field observations reveal that early journey stages, such as walking to the station or waiting on the platform, are associated with unpleasant experiences due to poor infrastructure and accessibility barriers. In contrast, train rides foster more positive emotions, credited to better accessibility onboard. Passenger dissatisfaction arises from issues such as elevator malfunctions, inconsistent train schedules, and inadequate station accessibility. This study could help to understand passenger behavior when the accessibility conditions of metro stations and their surroundings are changed. Further studies will expand the concept of emotions by considering social and psychological factors and explore different types of stations and their surroundings considering a larger sample size in laboratory experiments and field studies.

1. Introduction

Metro stations can be classified based on the taxonomy proposed by Busquets [1], who considers metro stations as urban projects of multiplied land or great urban artefacts, which deal with the transformation of emblematic pieces of the city using converted infrastructure and/or densification. In this sense, from a methodological point of view, an accessibility dilemma is presented in metro stations as they are considered not just simple nodes in a transport network but also places within the city, i.e., a “node-place”. This dilemma of node-place was first applied in the case of Santiago de Chile by López [2], which is generated by the permanence formed by modal exchanges between different modes or by a high density of activities in a certain place. However, according to Koolhaas [3], those spaces of large infrastructures or urban projects such as metro stations could lose the concept of place and become “junk space”. Understanding “junk space” as spaces for pedestrian circulation without accessibility, which has been formed by the accumulation of layers without meaning or proportion to the environment.
Consequently, it is an opportunity for researchers to create or recover mobility spaces as places within the city, facing the dilemma of accessibility. Following this need and based on some manuals such as the REDEFE (Manual de Recomendaciones de Diseño para Proyectos de Infraestructura Ferroviaria) prepared by SECTRA-MIDEPLAN (2003) [4], a metro station as a node-place could be classified into different pedestrian circulation spaces [5] (see Figure 1). However, most studies are concentrated on specific spaces, such as the train–platform interface, which is understood as a complex space where passengers are boarding or alighting the transport vehicle.
From a practical point of view, the stairs (e.g., connection between platform and stairs or escalators), concourse (e.g., turnstiles and ticket machines), complementary space (e.g., commerce), and the city (e.g., street level) are also complex spaces in which accessibility needs to be studied, especially in the metro–bus interchange [5]. In this sense, some recent studies have taken this concept of node-place to report the need to study accessibility from different disciplines. For instance, in the case of Valparaiso Metro (currently 44 km long), in which new lines are under construction (e.g., an extension of 26 km to La Calera city), accessibility problems should be studied, in which passengers need to walk from narrow platforms to crowded stairs or concourse and then walk long distances to combine with other modes such as buses [6].
Metro stations as node-places represent a series of complexities to achieve accessibility. For instance, changes can be generated in the entire circulation interchange space, such as new pedestrian flows, routes and preferences change, new bottlenecks, crossflows, new places of detention and interactions, new users and relationships, as well as new combinations with other modes of transport and their relationships [7]. Likewise, from other disciplines such as psychology, perceptions of accessibility can be reported when existing spaces are modified, such as the adaptation of the bus stop next to the station to incorporate tactile paving, ramps, handrails, etc. Therefore, passengers may perceive different accelerations during their journeys, and changes in their emotions will be achieved. To solve this, different standards have been implemented focused on the public space [8]; however, vulnerable users such as passengers with reduced mobility and older people need more space to move in metro stations compared to other passengers without reduced mobility, in which accessibility standards are not considering the users’ perspective and live experience [9] throughout the journey, from origin to destination.
This dilemma is also related to sustainability, in which Chile as a nation is committed to the Sustainable Development Goals (SDGs) [10]. Among the 17 objectives of the SDGs, objective 3 (health and well-being) includes promoting mental health and well-being, increasing awareness and access to mental health services and support, and improving road safety measures to reduce road traffic injuries and deaths. Therefore, studying accessibility could help to improve mobility and reduce risks focused on vulnerable users who are moving in various types of spaces, which are important steps toward promoting sustainable mobility.
The accessibility dilemma could be evaluated by focusing on vulnerable modes, which has been suggested for further research in different studies [11,12,13,14,15,16]. In addition, the accessibility could be compared to different indicators reported in the literature such as the bicycle level of service [17], the pedestrian level of service proposed by Fruin [18,19,20], the level of service for public transport [21], and some indicators based on emotions [22]. In this sense, are passengers prepared to reach and, therefore, use metro stations? Are metro stations as node-places prepared for bringing pleasant emotions to passengers?
This paper aims to investigate the accessibility dilemma in metro stations based on the users’ experience through the identification of emotions. In this direction, this study is aligned with the sustainable transport planning principles that aim to implement the inverse pyramid of transport mode priority in comparison with traditional transport planning [23], prioritizing vulnerable groups such as the elderly, children, blind people, and passengers with reduced mobility. From the perspective of accessibility, this paper will consider not only the access to metro stations but also their surroundings based on the capability model, which is more representative than the medical model or even the social model [24,25].
The paper is structured as follows. In Section 2, the literature review is presented, followed by the methodology. In Section 4, the results are analyzed, followed by the discussion and conclusions in Section 5 and Section 6, respectively.

2. Literature Review

Accessibility in metro stations is essential for social inclusion and the full participation of all individuals in the community. According to Rotenberg and Nooruddin [26], universal design has been promoted in various metro systems; however, significant deficiencies in accessibility still exist despite current regulations. This is because access to quality public transportation is a fundamental human right that enables people to exercise other rights, such as access to work, education, healthcare, and social life. However, metro stations and their surroundings often present significant barriers for vulnerable users, limiting their mobility and autonomy. This literature review examines the key dimensions of accessibility in metro stations, focusing on the experiences and needs of vulnerable users. It analyzes user-centered evaluation methodologies to understand how accessibility barriers impact the daily lives of these groups and explores strategies to improve accessibility and create a more inclusive public transportation system.
The evolution of safety management systems and risk assessment in the railway industry is notable, reflecting a continued commitment to improving safety standards and implementing proactive risk mitigation strategies. However, a critical aspect that requires greater attention is universal accessibility, especially for people with disabilities. This study will review the existing literature on accessibility in metro stations and their surroundings from the users’ perspectives and their live experiences. Following the principles of sustainable transport planning, modes of transport for vulnerable groups, such as the elderly, children, visually impaired individuals, and passengers with reduced mobility, are prioritized [23]. The review will address how current safety management practices can be adapted to improve accessibility, considering both access to stations and the use of internal spaces and intermodal connections with other transportation hubs [9,27]
Accessibility in and around metro stations for people with disabilities is a critical issue that requires attention and improvement. Research has shown that accessibility in train stations is a multifaceted issue that goes beyond mere physical proximity [28]. Although the value of properties around train stations is influenced by their accessibility points, the impact of train stations on property values can be affected by the inclusion of other accessibility variables, such as roads, in models [28]. This complexity highlights the need for a comprehensive approach to understanding and improving accessibility for people with disabilities.
Studies have highlighted the challenges faced by people with disabilities when navigating train stations. From limited elevators and ramps to uneven surfaces and unmarked pathways, train stations can be dangerous for people with disabilities [26]. Indeed, audits have revealed that less than 40% of train stations meet accessibility standards, indicating a significant gap in ensuring safe and inclusive access for all individuals. This lack of compliance underscores the urgent need for improvements in infrastructure and facilities to meet the needs of people with disabilities.
The issue of accessibility in metro stations is not limited to physical infrastructure but also extends to the overall design and functionality of these spaces. Improving the sustainable design of train stations involves considerations such as emphasizing local cultural elements, enhancing passenger flow, and ensuring inclusivity for all, including those with disabilities [29]. Integrated station–city development approaches, supported by technologies like Geographic Information Science (GIS) and big data, can play a crucial role in assessing and improving pedestrian accessibility, the convenience of facilities, and the intensity of land development around central train station areas [30].
Accessibility for people with disabilities in metro stations is a global concern, as demonstrated by studies conducted in various countries. Research has identified specific facilities for people with disabilities that should be provided in train stations to improve accessibility [31]. Similarly, another study focused on exploring accessibility issues and facilities at a specific train station to improve the experience for people with disabilities [32]. These localized studies highlight the need for tailored interventions to address accessibility challenges based on the unique characteristics of each train station.
In the context of public transportation accessibility, including metro stations, addressing physical, informational, and social barriers is crucial to ensuring inclusivity for all individuals, especially those with disabilities [33]. While research has traditionally focused more on physical and informational barriers, there is a growing recognition of the importance of addressing social barriers to improve accessibility for people with disabilities [33]. This holistic approach is essential for creating a truly inclusive public transportation system that meets the diverse needs of all passengers.
Improving accessibility in train stations for people with disabilities requires a concerted effort from various stakeholders, including policymakers, urban planners, and transportation authorities. Implementing interventions that address the identified problems faced by people with disabilities when using public transportation, including railways, is essential for promoting inclusivity and improving the overall travel experience [34]. By considering the perspectives and needs of people with disabilities, train stations can be transformed into more welcoming and accessible spaces for all passengers [35,36,37].
While the research conducted so far is valued, new studies focused on passengers’ perspectives and live experiences in metro stations are needed, which is the aim of this paper.

3. Methodology

To address the study of the accessibility dilemma in the metro stations of Valparaíso, a multiple case study strategy was employed. This approach allowed for an in-depth examination of the interaction between different user groups, particularly those with disabilities and reduced mobility, and the environment of the metro stations. The multiple case study facilitated comparisons across several trip stages and users to identify common patterns and divergences in the accessibility experience.

3.1. Observations in Existing Metro Stations

The user’s emotional experience is evaluated when accessing, moving through, and using the facilities of existing metro stations, considering their individual needs and capabilities. This includes aspects such as the ease of access to platforms, the clarity of signage, and the availability of elevators and ramps.
The perceived accessibility of railway stations is a complex interaction of physical design, user experience, and spatial integration. Addressing the different accessibility perceived elements through inclusive design, effective management, and community involvement can lead to greater satisfaction and an increase in the use of railway services. Continuous evaluation and adaptation of accessibility measures are essential to meet the changing needs of diverse user groups. Emotional experience, in turn, is represented as the user’s overall attitude toward the metro station, considering their general experience and the evaluation of various aspects such as accessibility.
This study expects to find a positive relationship between perceived accessibility and overall user emotional experience. This means that a higher perception of accessibility at the metro station should translate into a pleasant emotional experience with the overall service. Furthermore, it is suggested that users who feel safer and more satisfied in the station are likely to have a more favorable evaluation of their travel experience.
A proportional stratified sampling method was used, selecting users from different categories. Of the total participants (9), one had a hearing disability, and three had reduced mobility (e.g., using a wheelchair). The remaining participants did not have reduced mobility or disabilities.
The questionnaire used in the study consisted of 60 questions, distributed across 6 sections, and included both closed and open-ended questions. Two types of Likert scales were employed: a 5-point Likert scale (where 1 is “strongly disagree” and 5 is “strongly agree”) and a second 5-point Likert scale (where 1 is “very short (less than 5 min)” and 5 is “very long (more than 30 min)”). The questionnaire evaluates the user’s subjective experience when accessing, moving through, and using the facilities of the subway station, considering their individual needs and capabilities. It covers aspects such as the ease of access to platforms, the clarity of signage, and the availability of elevators and ramps (see Appendix A).
In terms of emotions, the highest point (Likert scale = 5) represents happiness, while the lowest point (Likert scale = 1) represents stress. In addition, passengers can be sad (Likert scale = 2), neutral (Likert scale = 3), and relaxed (Likert scale = 4) in each trip moment. These emotions were recorded according to the circumplex psychology model adapted from Barría et al. [22]. This model considers four predominant emotions, highlighted in Figure 2. At the end of each boarding and alighting process, each participant was asked about their emotion, with the options of feeling happy, relaxed, sad, or stressed.
The questionnaire (see Appendix A) included key dimensions such as:
  • Context of use (conditions and situations in which the services are used, such as frequency of use or the type of users utilizing the services), with 2 questions.
  • Perceived physical accessibility (ease of movement within the station, use of ramps, elevators), with 10 questions.
  • Perceived safety (feelings of safety when using the facilities), with 4 questions.
  • Inclusivity (accessibility and adequacy of services for people with different abilities and needs, such as ramps or adapted services), with 22 questions.
  • Adaptive strategies and environmental awareness (ability to adjust behaviors and decisions based on changing environmental conditions, such as signage or flexible planning), with 4 questions.
  • Intermodal connectivity (ease of transfer between modes of transport, such as buses or bicycles), with 11 questions.
  • Overall satisfaction (global evaluation of the user experience at the station), with 7 questions.
The surveys were administered at key points within the metro stations, including access areas, platforms, and transfer points to other modes of transportation.
In addition, first-hand observations were made to see how vulnerable users navigate the metro stations and what obstacles they encounter. The observations focused on the following:
  • Pedestrian flows: Movements of users in areas such as ramps, elevators, stairs, and transfer points.
  • Identification of barriers: Physical or signage barriers were documented, as well as areas where users experience difficulties or delays.
It was observed that administering the survey in real time during the trip presented difficulties in obtaining spontaneous responses, especially in situations with high passenger traffic. Participants suggested the implementation of alternative data collection methods, such as digital surveys via QR codes or email distribution, for future research.
Data collection was carried out at Francia Station in Valparaiso, on a specific day and time. The participants gathered at the university at 8:50 AM, where the purpose of the study was explained, and the survey questions were reviewed. They then proceeded to the station, experiencing the journey and answering the questions at each of the 9 key moments. Data collection took place from the start of the journey at 9:30 AM until 10:19 AM.
The key trip moments were defined as follows:
  • Moment 1 (M1): From the Origin
  • Moment 2 (M2): On the Way to the Station
  • Moment 3 (M3): Arrival at the Station
  • Moment 4 (M4): Waiting on the Platform
  • Moment 5 (M5): Boarding the Train
  • Moment 6 (M6): On the Train
  • Moment 7 (M7): Leaving the Train
  • Moment 8 (M8): Leaving the Station
  • Moment 9 (M9): Arrival at the Destination
The sum of the Likert scale scores is obtained for each trip moment and then reported in a graph to present the emotions obtained. The accessibility ranking (A) in each trip moment is obtained according to Equation (1), in which αj is the coefficient of emotion perceived by n participants using Likert scale (from j = 1 to j = 5) and Xi is the number of registrations of independent accessibility element perceived by participants in each moment i.
A = j · X i
Considering the worst case in Equation (1), all participants will rank 9 points. This is obtained considering α = 1 and a total of n = 9 participants. The best situation will rank 45 points, which is calculated considering α = 5 and n = 9 participants. Therefore, Table 1 is proposed as a threshold to classify the ranking from Equation (1).

3.2. Experiment Set-Up

To explore some of the accessibility elements (e.g., design layout) obtained from the field study, laboratory experiments are considered through a full-scale replica of a metro car based on the Valparaíso metro stations. The metro car has a length of 7 m and a width of 2.5 m. Additionally, a platform measuring 5 m in length and 3 m in width was included. Inside the metro car, 16 seats were used, representing the same layout as an urban train in Valparaíso (see Figure 3).
A total of 20 people participated in the experiments to represent passengers boarding and alighting from the metro car. Of the total participants, 75% were men, and the rest were women. The age of the participants ranged from 18 to 25 years, with the majority being students. The participants were tracked using vision computing techniques based on the approach used by Garnica-Quiroga [37].
To record the users’ emotional experience, each participant was asked how they felt during the boarding and alighting process. The experiments considered two scenarios:
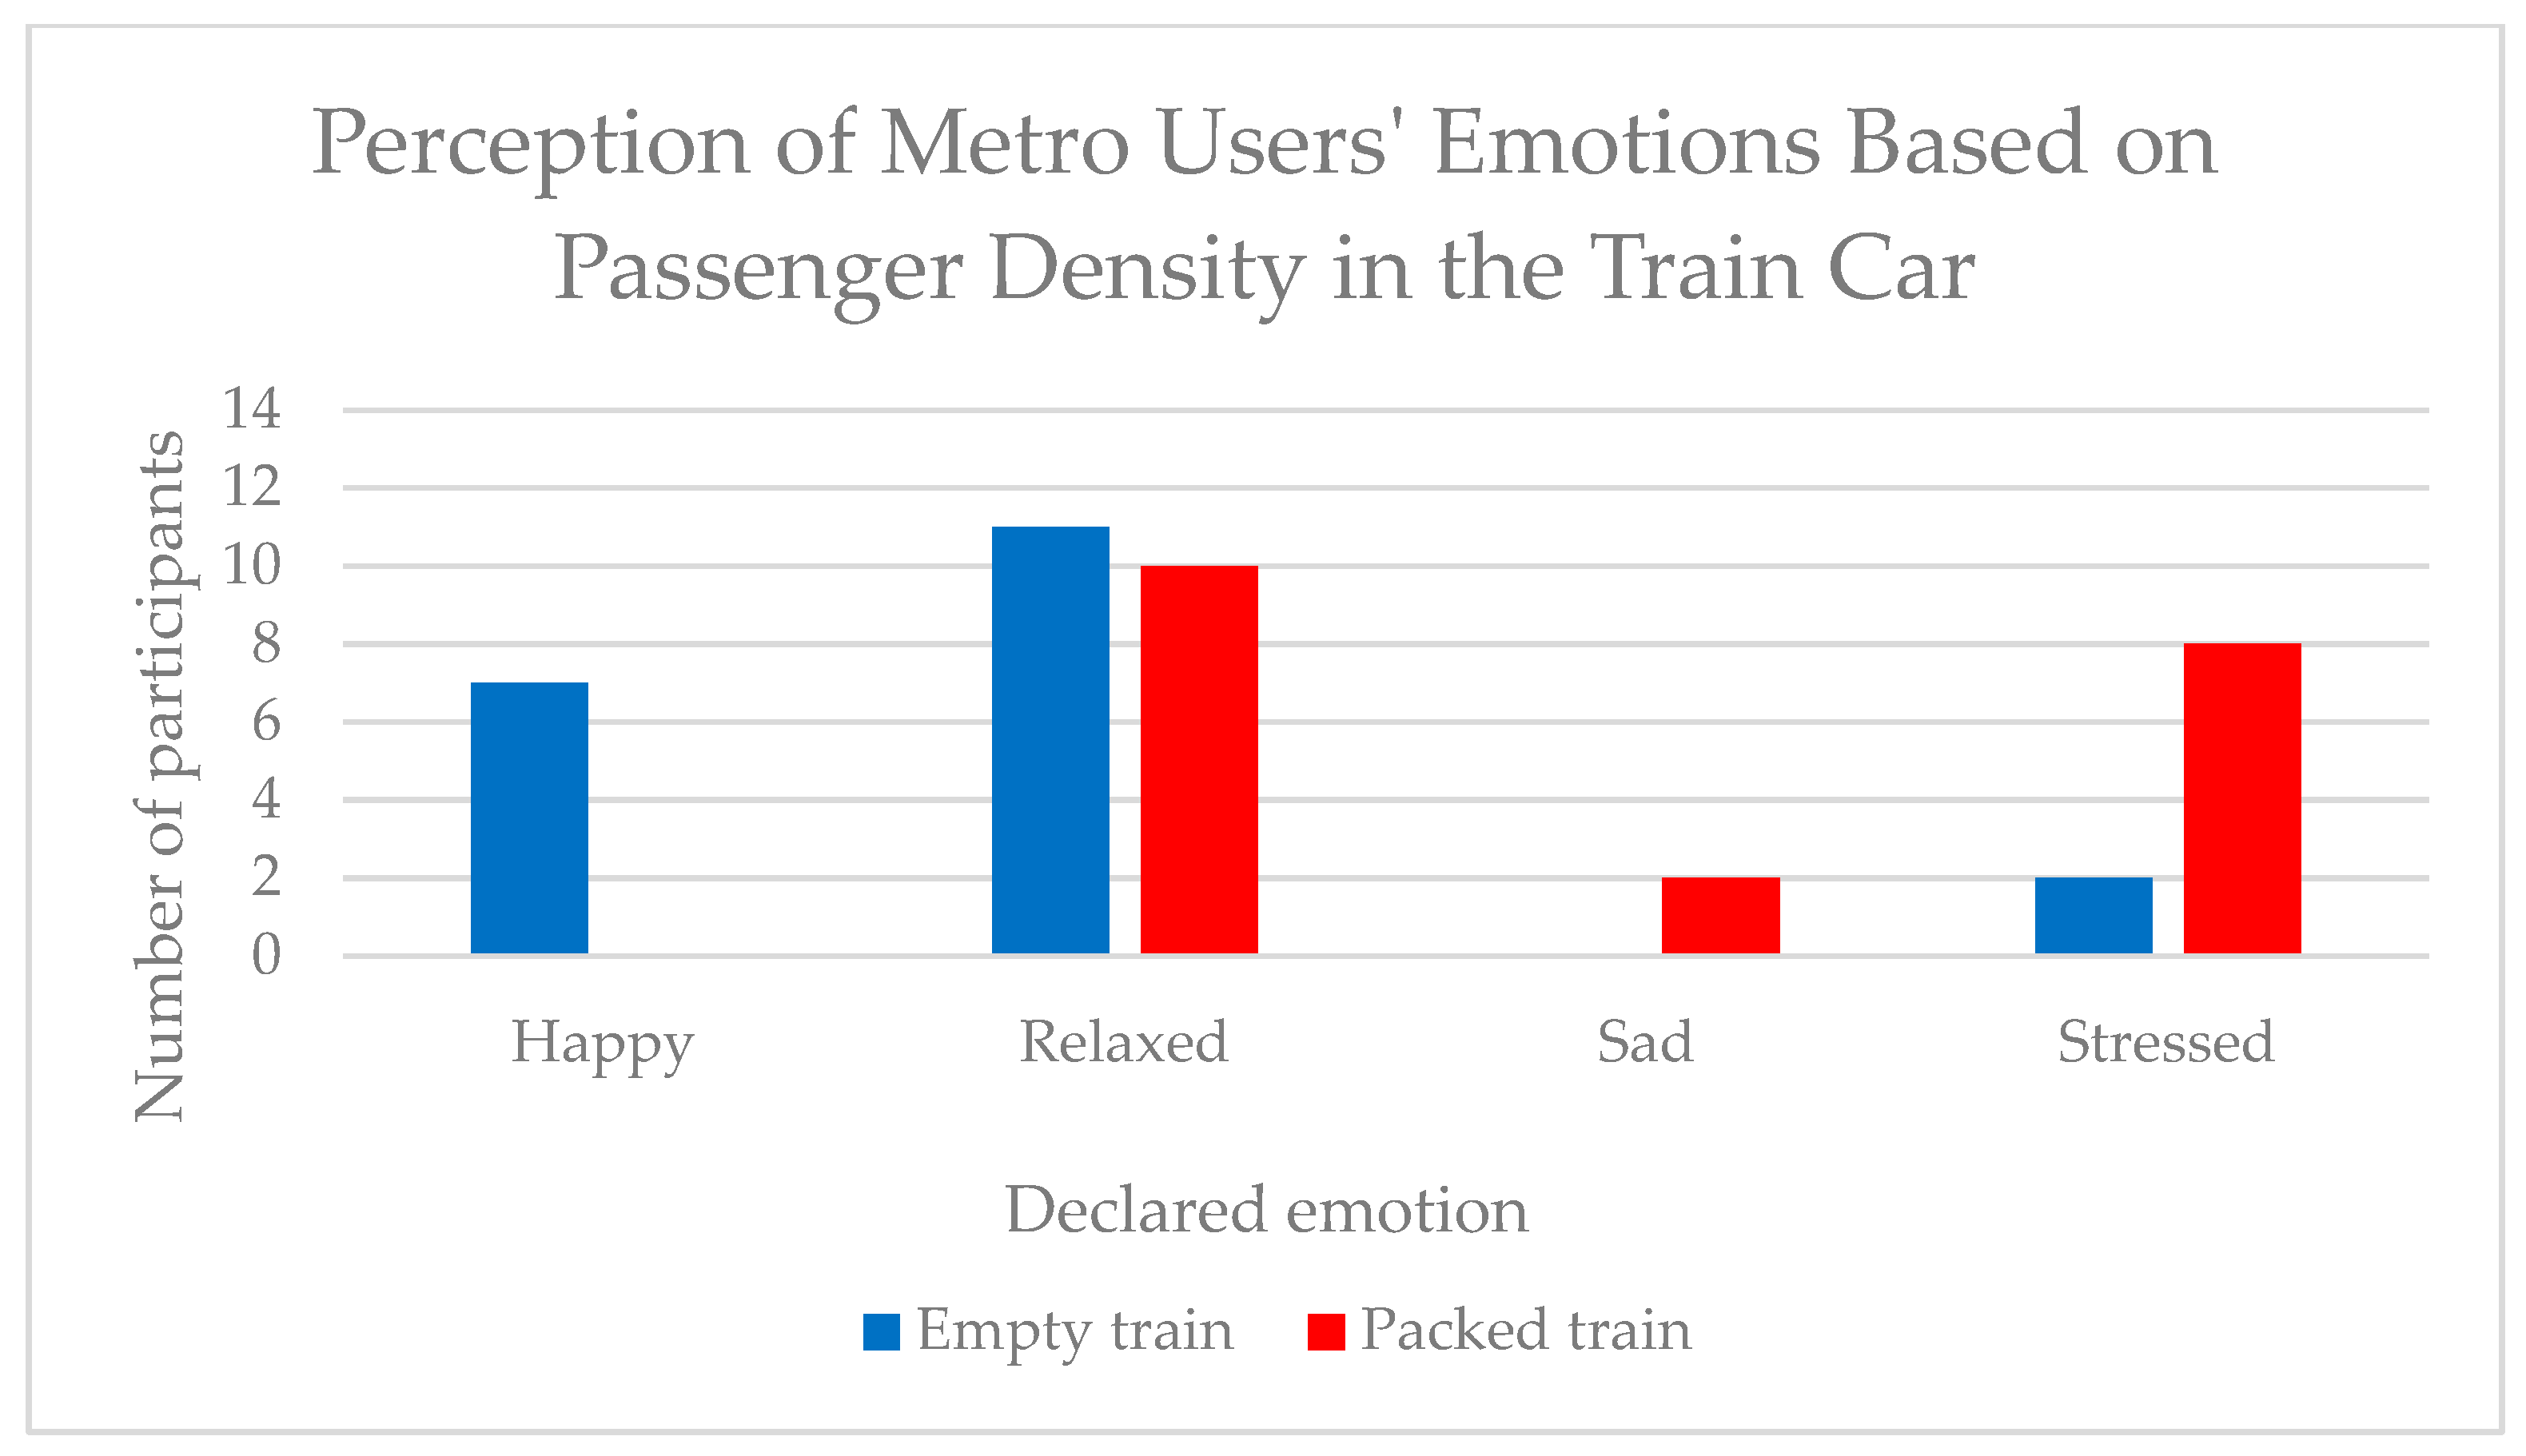
  • Density: The experiments began with an empty metro car, where passengers had to enter and settle into seats. Then, more passengers board the metro car; therefore, a more crowded situation is registered.
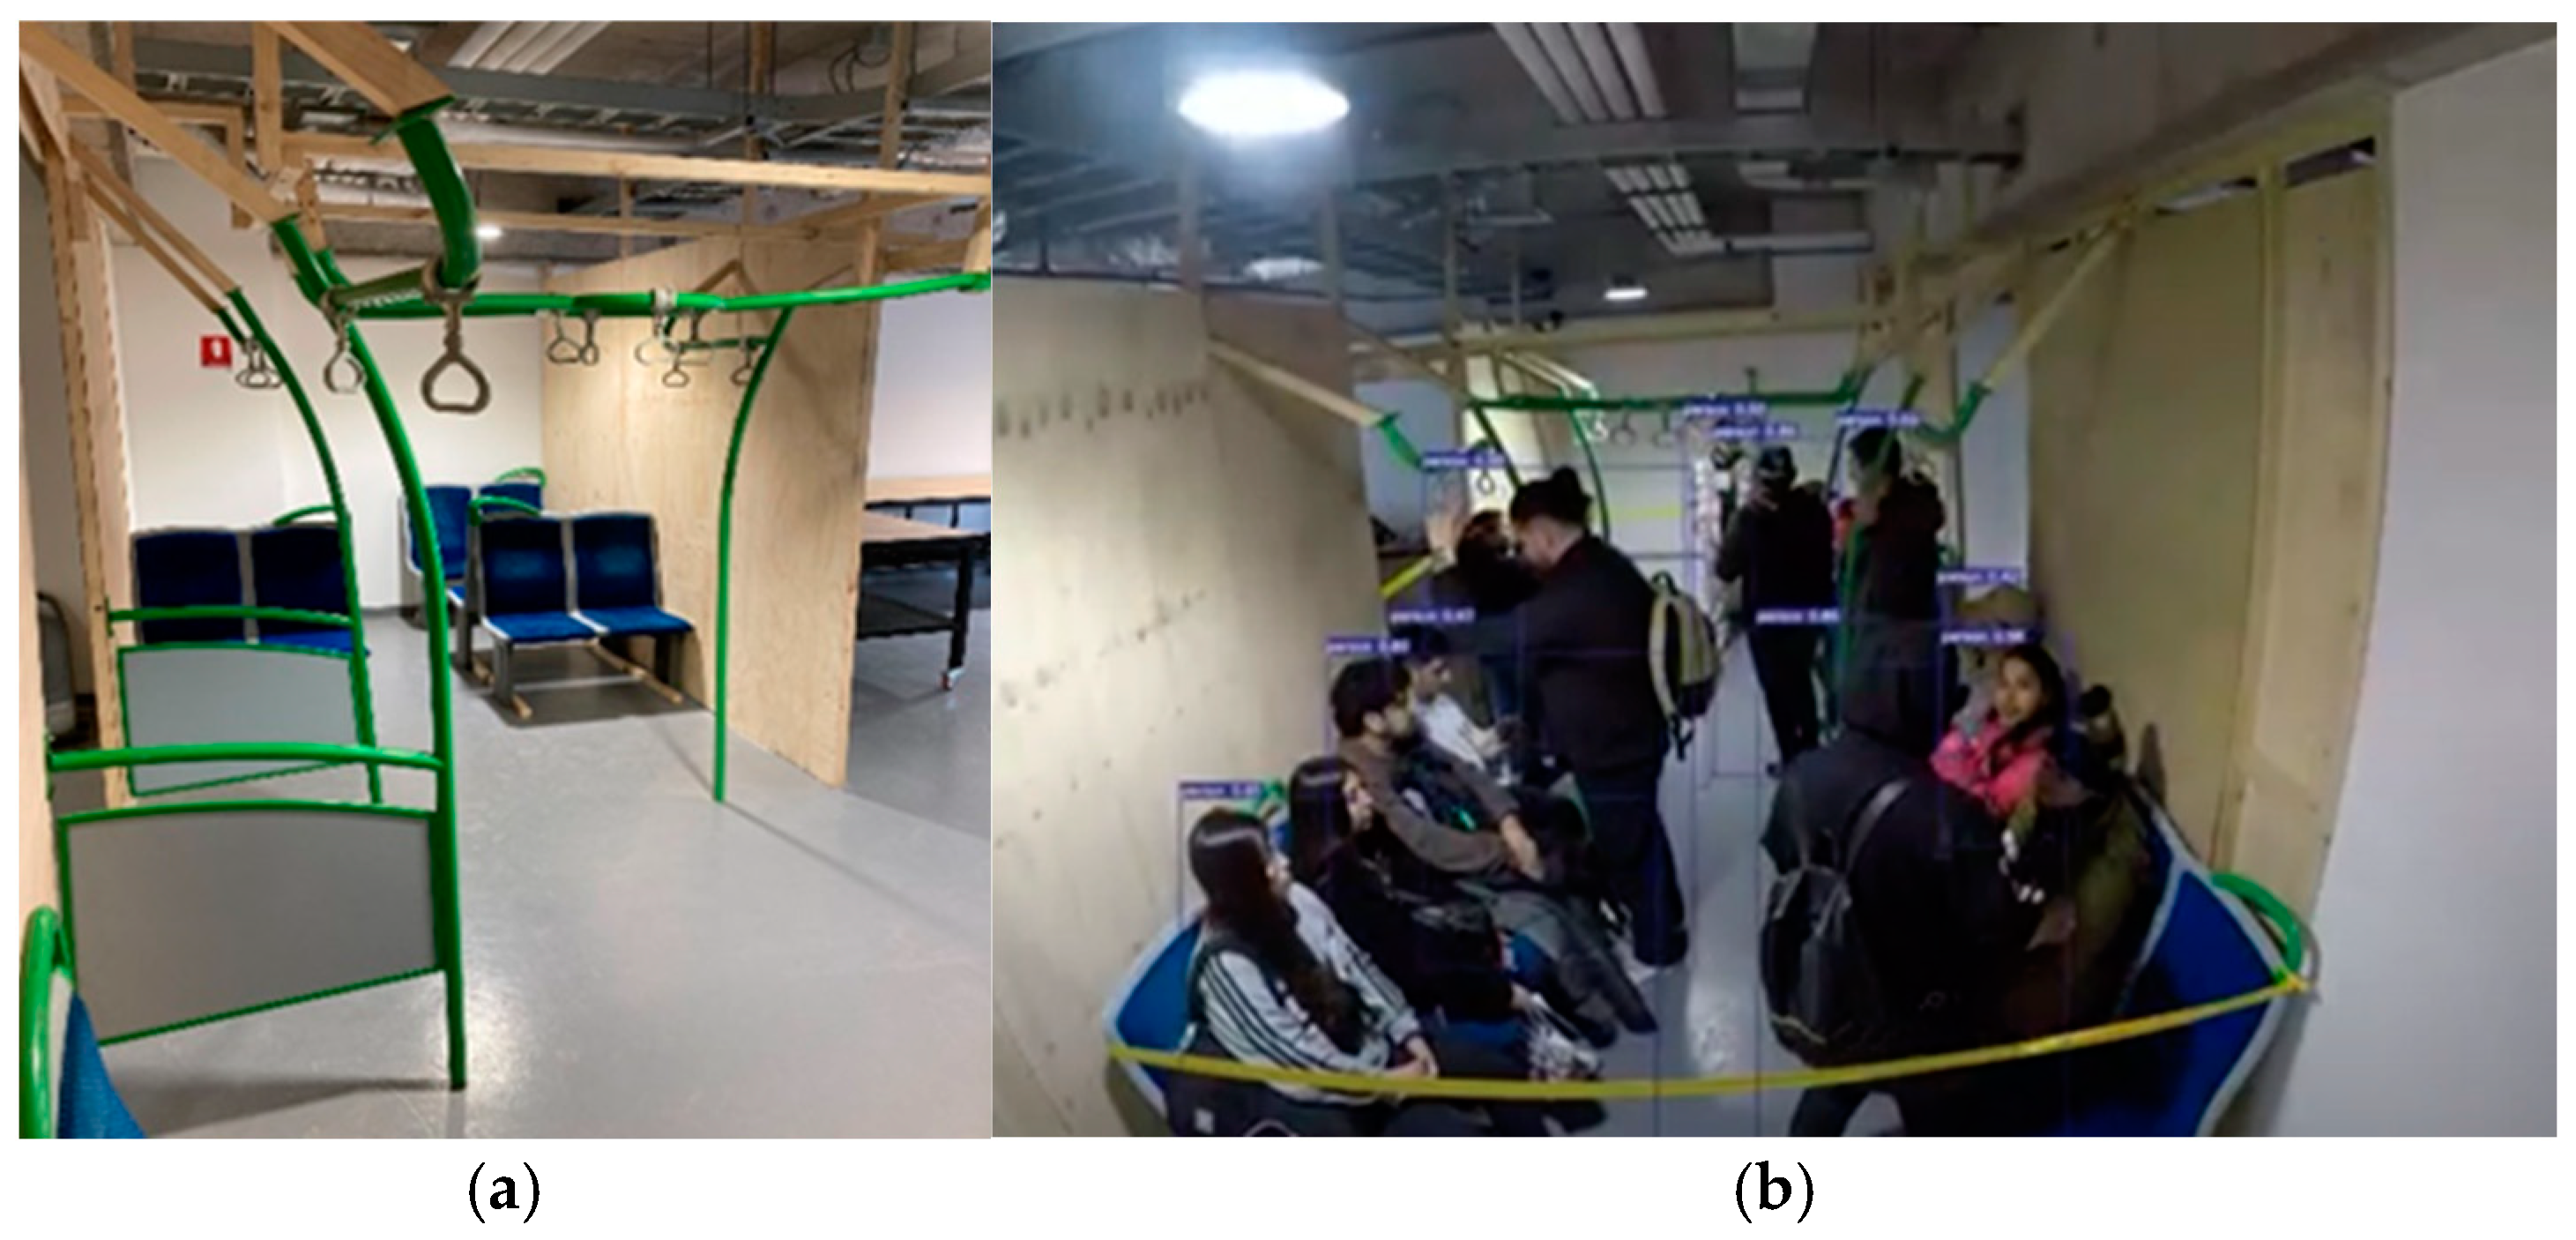
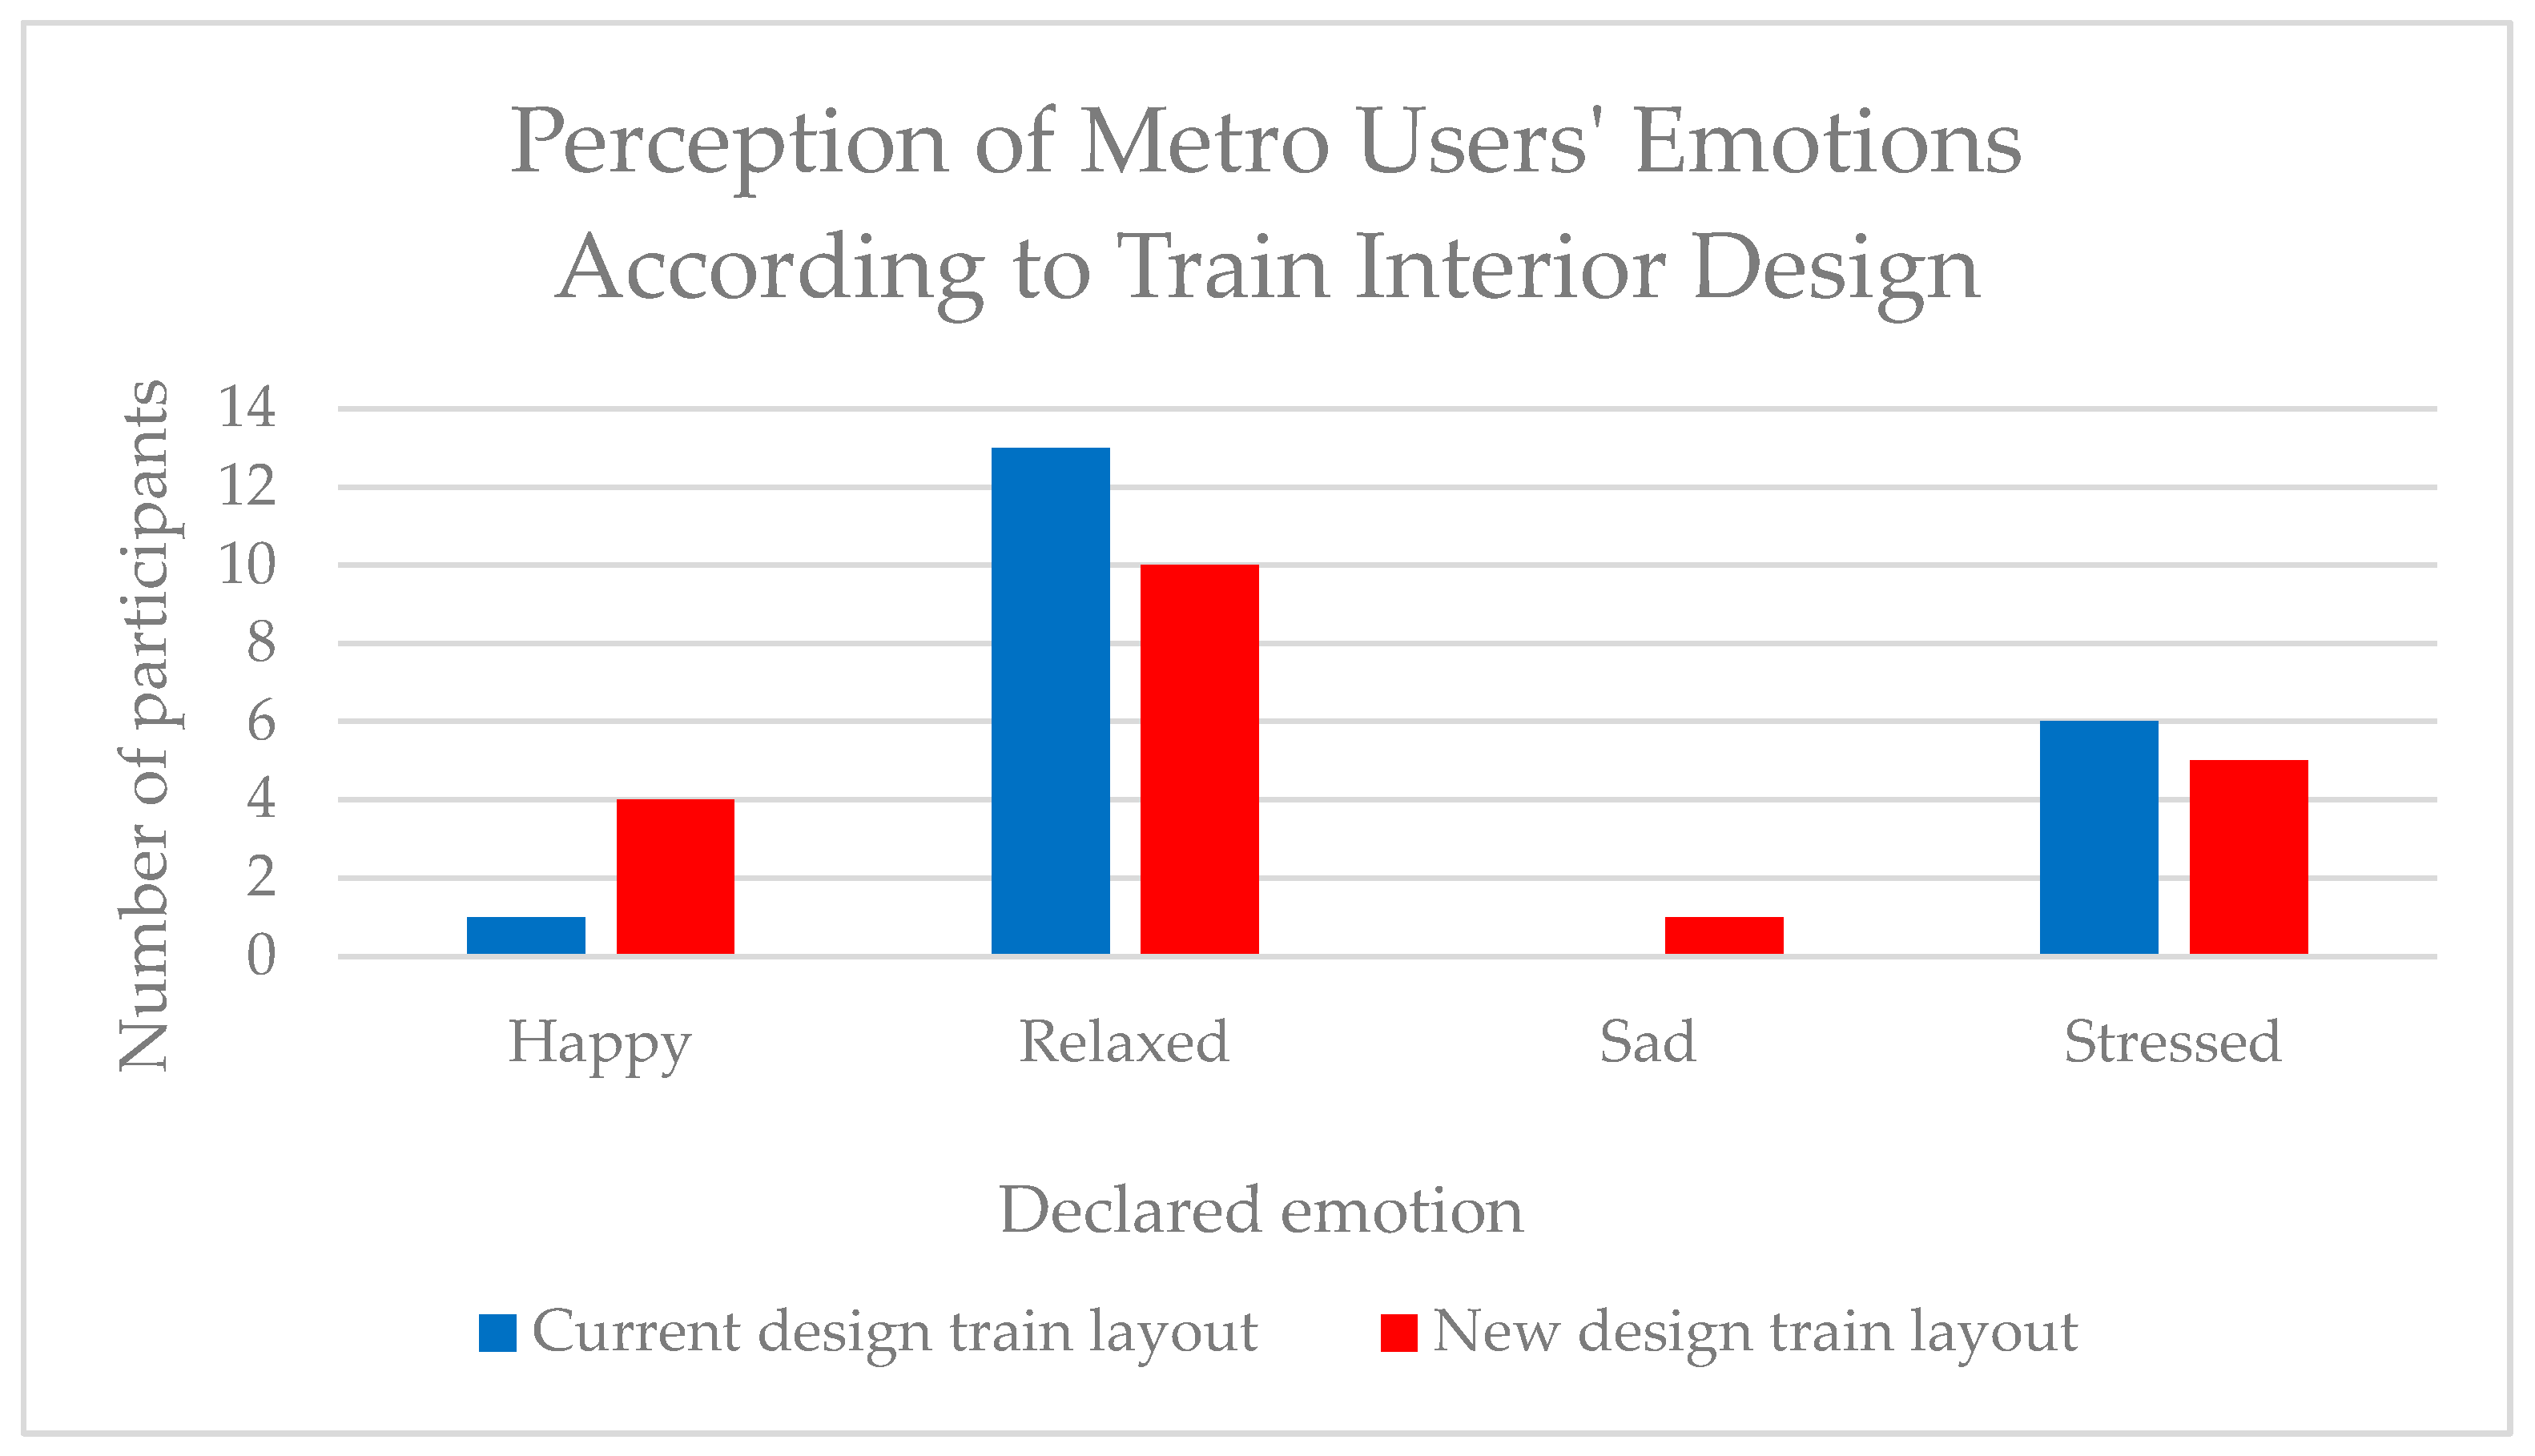
  • Layout: The seats inside the metro car were arranged in a vertical alignment to the assumed movement of the train (see Figure 3a). After boarding and alighting, the layout of the car was modified to consider a new seat arrangement, where the seats were placed parallel to the assumed movement of the train. This change created more space in the aisle of the car (see Figure 3b).
Emotions were recorded according to the circumplex psychology model adapted from Barría et al. [22], as explained previously.

4. Results

4.1. Observations Results

Figure 4 presents the average emotions reported by all participants at each key moment of their journey, highlighting notable trends in emotional responses across different stages of travel. In the case of Moment 1, most participants perceived as “neutral” the use of applications when planning before starting their trip. This can be caused because all of them knew the route as they commute and use the metro system in Valparaiso on a daily basis.
From Figure 4, it is evident that the initial moments of the trip, such as the walk to the station (Moment 2, M2), arrival at the station (Moment 3, M3), or waiting on the platform (Moment 4, M4), are associated with more unpleasant emotions, including feelings of discomfort and frustration. This also happens in the last stage of the trip (Moment 9, M9) when participants arrive at the destination.
As shown in Table 2, this may be due to the external conditions that participants face, such as the physical infrastructure and accessibility challenges encountered while walking around the station (e.g., “physical barriers” in M9). These factors likely contribute to negative emotions as passengers navigate poorly maintained sidewalks, uneven pavement, narrow platforms, or other barriers that hinder smooth movement. For instance, in M2, “noise” is an important perceived element that reached a low total ranking (21) compared to other accessibility elements such as “physical barriers” and “safety” at that moment. However, in M3, the “noise” is considered as an unpleasant overall experience, ranked 24, which is also similar to the waiting time at turnstiles, reaching 25. In contrast, Table 2 shows that “signage” is considered as more pleasant than “waiting time at turnstiles” and “noise” in M3, reaching a total ranking of 36. When participants entered the stations, most of them perceived that waiting on the platform was unpleasant, reaching a low total ranking for “comfort”, “shelter condition”, “mobility facilities”, “information provided”, and “lighting”. All of them scored around 20 points. However, the “noise” is perceived as pleasant, which must be considered an important attribute of the metro platforms in Valparaiso in M4.
Table 2 shows that the later moments of the journey, such as the boarding process (Moment 5, M5), ride on the train (Moment 6, M6), exiting the train (Moment 7, M7), and leaving the station (Moment 8, M8), were associated with more pleasant emotions. These moments typically showed higher levels of satisfaction, with emotions such as relaxation and comfort being more prevalent. The more positive emotional response can likely be attributed to the improved accessibility conditions within the train itself. The design and layout of the train, with wider aisles, comfortable seating, and a generally more accessible environment, likely contribute to a smoother and more enjoyable experience for passengers. Passengers inside the train felt an overall experience considering that the seat comfort, noise, ventilation, train speed, break and acceleration of train, and lighting are adequate, which are attributes of the metro system in Valparaiso. Table 2 also shows that the boarding and alighting process presents, in general, a pleasant experience for participants, highlighting the comfort and safety elements of accessibility. The same happens when passengers exit the station (M7), in which elements such as signage, safety, noise, and mobility facilities allow a pleasant experience for passengers.
Figure 5 further illustrates the accessibility conditions that play a role in shaping these emotional responses. In particular, the figure reveals that the approach to the station often involves navigating through areas that are not well-maintained or that present obstacles, such as damaged sidewalks, poorly marked pathways, or other physical barriers that hinder smooth movement, such as narrow platforms. These factors negatively impact the overall experience and can lead to heightened stress and frustration for participants as they attempt to navigate through the station’s exterior environment. On the other hand, once inside the train, passengers encounter a more accessible environment, which contributes to pleasant emotional levels. The improved conditions within the train, such as clear signage, spacious aisles, and comfortable seating arrangements, offer a sense of relief for passengers, leading to more positive emotional responses. As a result, the participants generally report feeling more relaxed and content during the train journey, illustrating the significant impact that accessible design can have on the emotional well-being of passengers during their commute.
Regarding emotional perceptions, several key issues were identified, pointing to aspects of accessibility and infrastructure that significantly impact users’ experiences. The experiences are ranked in Table 2 (and presented in Figure 4), and they are summarized as follows:
  • Problems with elevator accessibility:
    Frequency: Numerous participants reported encountering issues with the elevators at various stations. This includes malfunctioning elevator buttons, where users struggle to get the elevator to operate properly. Furthermore, some passengers must seek assistance from operators to use the elevators, leading to additional delays and frustration. This issue particularly affects individuals with mobility challenges who rely on these elevators as a primary means of accessing different levels of the station.
    Maintenance: A recurring concern mentioned by participants is the lack of proper maintenance of elevators. Many users described instances where elevators were out of service or did not function as intended, leading to inconvenience and, at times, forcing passengers to take alternative, less accessible routes. This problem appears to be prevalent in certain stations, such as Viña, which contributes to negative emotional responses, such as feelings of helplessness, frustration, and dissatisfaction.
  • Problems with train frequency accessibility:
    Inconsistencies: Another prominent issue raised by users pertains to the train frequency, specifically the inconsistency between the advertised train schedules and the actual arrival times. Some passengers reported that trains did not arrive at the expected times, causing significant delays. This inconsistency leads to emotional reactions such as irritation and stress. Passengers, particularly those on tight schedules, feel frustrated when they cannot rely on the promised train schedules. These inconsistencies disrupt the smooth flow of the commuting experience, leaving passengers feeling anxious and unsettled.
  • Problems with accessibility and the need for infrastructure updates:
    Population Growth: With the increasing number of passengers using the metro system, there is a clear indication that the infrastructure of the stations and trains needs to be updated to accommodate this growth. Many users suggest that stations and platforms are becoming overcrowded, especially during peak hours, leading to difficulties in moving around and navigating spaces. This overcrowding, coupled with the lack of available resources, such as accessible seating or ample space, often results in passengers feeling stressed, agitated, and physically uncomfortable.
    Safety and Communication: Users also expressed the need for improvements in safety and communication within the system. Many highlighted that there were unclear or insufficient signs, especially for people with disabilities, and that announcements or warnings regarding train delays or station changes were not always timely or effective. This lack of effective communication contributes to confusion and anxiety, particularly among vulnerable groups who may require additional guidance to navigate the system. Enhancing safety features and ensuring clear, consistent communication would not only improve users’ sense of security but also contribute to a more positive emotional experience while traveling.

4.2. Experiment Results

As it was presented in the previous section, the inside of the train presented the most pleasant overall experience for participants. Therefore, a more in-depth analysis was performed to better understand the effect of the design layout on the passenger’s emotional experience.
When the seats in the metro carriage are rearranged to a position parallel to the assumed movement of the train (new design), it creates a noticeable difference in the available space within the aisle. The realignment of seats opens more room for passengers to move, which directly impacts the overall experience of the users. As a result, participants in the experiment reported more pleasant emotions compared to the existing design of the metro car, where the seats are arranged perpendicularly to the assumed movement of the train (current design). In the original layout, the narrower aisle space can sometimes lead to feelings of discomfort and congestion, while the new configuration with more aisle space seems to alleviate those issues, contributing to a more enjoyable journey. This change is clearly illustrated in Figure 6, where the data show that in the proposed layout, more participants expressed emotions such as feeling “happy” after using the train. These results suggest that a more spacious and open interior design may enhance passengers’ emotional well-being and comfort during their commute. The ability to move more freely within the train, coupled with a less cramped environment, appears to lead to a more positive overall experience.
On the other hand, unpleasant emotions like stress were noticeably reduced in the proposed seating arrangement. Fewer participants reported feeling stressed in the new design compared to the current one, suggesting that the improved aisle space may contribute to a less stressful and more pleasant travel experience. This stress reduction can be attributed to the fact that passengers may feel less physically restricted and have a greater sense of personal space, which is often associated with improved emotional states.
However, it is important to note that the emotions “sad” and “relaxed” showed an unexpected change in the proposed scenario. While the new design seemed to alleviate stress and promote happiness, there was a slight rise in the number of participants who reported feeling sad. Similarly, the new design presented a slight reduction in the number of “relaxed” reports. These findings stand out and suggest that, although the new layout improves the physical and emotional comfort of users, there may be other factors contributing to this shift in emotional response. For instance, the change in seating arrangement could potentially influence social dynamics within the train, which might lead to feelings of isolation or disconnection for certain individuals.
Another important result is the impact of passenger density inside the train carriage on the emotions expressed by participants (see Figure 7). In the current situation, where the train is empty, participants tend to report more pleasant emotions. This is in stark contrast to the proposed scenario, where participants enter the train and find it filled with a large number of passengers. The change in emotional responses is particularly notable for the feeling of happiness. In the current, less crowded situation, 35% of participants reported feeling happy, but this drops to 0% when the train is crowded with passengers.
This stark contrast highlights how overcrowding can negatively impact passengers’ emotional experiences. Conversely, the emotion of stress experiences an important increase in the crowded situation, with stress reported by 10% of participants in the empty train compared to a substantial 40% in the densely populated train. This demonstrates that increased passenger density leads to greater discomfort and emotional strain, resulting in a higher percentage of participants feeling stressed.
Additionally, there are noticeable, though less dramatic, shifts in the emotions of “relaxed” and “sad”. In the crowded train scenario, fewer participants reported feeling relaxed compared to the empty train, where the spaciousness contributed to a greater sense of comfort and relaxation. On the other hand, the emotion of sadness increased slightly in the crowded situation, suggesting that the presence of too many people in a confined space may contribute to negative emotions such as sadness or discomfort, even if to a lesser extent than stress.

5. Discussion

This article aims to study the accessibility dilemma of passengers in a metro station, using the city of Valparaíso, Chile, as a case study. The research approach is based on field observations complemented by real-scale experiments to compare the obtained results. The study specifically analyzes the interior design of the train, with particular attention to seat placement and passenger density, evaluating how these factors influence the accessibility experience of users. Additionally, various moments of a typical journey are examined, from origin to destination, to identify passengers’ emotions at different points along the route, as well as potential barriers or difficulties they may encounter during their commute on the transportation system.
When the seats in the metro carriage are rearranged to be parallel to the train’s movement, the aisle space is expanded, improving passengers’ mobility and overall experience. Participants in the experiment reported more positive emotions, such as happiness, compared to the current layout, where the seats are perpendicular, which can feel cramped. The new arrangement also led to a noticeable reduction in stress, as the larger aisle space allows for more personal room. However, an unexpected increase in the emotion “sad” (and a decrease in the emotion “relaxed”) was observed in the new layout, suggesting that other factors, such as social dynamics or feelings of isolation, may contribute to this emotional shift. However, further investigation is needed to explore the reasons behind the increase in sadness and the reduction in relaxation.
Concerning the field studies, the initial moments, such as walking to the station (Moment 2) or waiting on the platform (Moment 4), are linked to more unpleasant emotions like discomfort and frustration. These negative feelings are likely due to poor infrastructure and accessibility issues, such as damaged sidewalks and obstacles. Conversely, later moments, such as the train ride (Moment 6) and exiting the station (Moment 8), were associated with more positive emotions, including relaxation and comfort. This shift can be attributed to the better accessibility conditions inside the train, which offer a smoother and more enjoyable experience.
This contrast between the less favorable accessibility conditions in the early stages of the journey and the more favorable environment within the train highlights the importance of improving the accessibility of all stages of the commute, from the walk to the station to the ride itself. Optimizing the entire travel experience, including the surrounding infrastructure and transportation system, can lead to a more enjoyable and emotionally satisfying journey for all passengers.
An accessibility ranking has been provided to better classify the overall emotional experience of participants. Variables such as noise generate different emotions depending on the moment of the trip. Other accessibility elements, such as seat comfort, lighting, and train speed, generate a pleasant overall experience for participants who are travelling inside the train. However, physical barriers can generate unpleasant overall experiences for participants, especially in the surroundings of the stations.
To adequately assess accessibility in metro stations, it is essential to identify vulnerable users and understand their specific needs. Vulnerable users in the context of public transportation include people with disabilities, the elderly, children, and those with reduced mobility, who face various barriers that limit their autonomy and safety. These barriers may include a lack of adequate infrastructure, insecurity, discomfort, and difficulties in accessing stations and vehicles [35]. Accessibility to public transportation, particularly for people with disabilities, is a right that seeks to ensure their social inclusion and full participation in community life. For these individuals, the environments of train stations, metro stations, and other transportation systems must be designed to allow them to move safely, comfortably, and autonomously [36,37].
Key factors in evaluating and improving accessibility at transportation stations, based on the experiences and perspectives of vulnerable users, include the following:
  • Distance and user-friendly design: The proximity of stations and ease of walking to them are critical aspects. Pedestrian-friendly designs, along with adequate coverage of buildings around the stations, can significantly improve accessibility for these users [38].
  • Crowd evaluation: Incorporating crowd evaluation is essential to gain a more comprehensive understanding of accessibility at stations with high passenger traffic. This allows for more effective planning to ensure the mobility of vulnerable users, even during peak hours [39].
  • Connectivity and sustainability: Improving station connectivity and integration with other modes of transport, such as bike-sharing systems, not only fosters smoother access but also supports more sustainable development [40,41].
  • Impact on the urban environment: The proximity of train and metro stations can improve urban accessibility but may also influence phenomena such as gentrification, which must be considered when planning inclusive stations [42].
  • Resilience and vulnerability in station design: The vulnerability and resilience of train and metro stations are critical aspects that must be addressed in planning and design. Resilience to disasters is essential to ensure that stations remain safe and accessible even in emergencies, requiring continuous evaluation of stations to identify potential risks and design solutions that enhance their recovery capacity [43,44]. Evaluating the vulnerability of public transportation networks is also crucial for developing risk mitigation strategies that protect vulnerable users during crises [45].
  • Safety, mobility, and intermodality: Improving pedestrian accessibility and intermodality at train and metro stations is a key goal for creating more inclusive transportation systems. Considering factors like safety on access routes and the integration of various modes of transport can increase the use of public transport among vulnerable users and improve their travel experience [46]. Developing transportation policies that encourage transfers between modes, such as bike-sharing and trains, is an effective strategy to increase public transportation usage and improve accessibility [47].

6. Conclusions

In summary, the primary sources of dissatisfaction among users center around the condition of the elevators, the frequency of the trains, and the overall accessibility of the stations. The lack of maintenance in some areas, as well as issues with inconsistent schedules, directly impact passengers’ emotional experiences, particularly those who rely on the metro system for daily commutes. The need for infrastructure updates is clear, as the growing population of users requires more capacity and more accessible facilities. Additionally, improvements in communication and safety would alleviate stress and create a more positive atmosphere for all passengers, enhancing their overall experience. These findings underscore the importance of addressing both the physical and operational challenges within the system to improve user satisfaction and emotional well-being.
Future studies could expand the sample size of new laboratory experiments and field studies to explore different types of stations and delve deeper into aspects such as the social interactions between passengers, the perceived lack of personal space for certain individuals, or even other environmental factors that may be influencing emotions. This additional research could help refine the understanding of how seating layouts and train environments influence the emotional experiences of passengers, providing valuable insights for designing more inclusive and comfortable public transportation systems.

Author Contributions

Conceptualization, D.V. and S.S.; methodology, V.A., Á.P., S.S. and D.V.; software, B.A., F.R.-R. and I.B.; validation, B.A., I.B. and S.S.; formal analysis, D.V.; investigation, S.S. and V.M.; resources, Á.P.; data curation, S.S. and V.M.; writing—original draft preparation, S.S.; writing—review and editing, D.V., C.M. and R.S.; visualization, B.A., I.B. and F.R.-R.; supervision, S.S., V.M., C.M. and R.S.; project administration, S.S.; funding acquisition, S.S. All authors have read and agreed to the published version of the manuscript.

Funding

This research received no external funding.

Institutional Review Board Statement

The study was conducted in accordance with the Declaration of Helsinki, and approved by the Institutional Review Board (or Ethics Committee) of Pontificia Universidad Catolica de Valparaíso (protocol code BIOEPUCV-H 548-2022 and date of approval 3 October 2022).

Informed Consent Statement

Informed consent was obtained from all subjects involved in the study.

Data Availability Statement

Data is provided within this paper.

Conflicts of Interest

The authors declare no conflict of interest.

Appendix A. Questionnaire

0. Context—Usage Context:
(1) How often do you use this station? (Options: Daily, Weekly, Monthly, Occasionally).
(2) Why do you use this station? (Options: Work, Studies, Leisure, Other).
I. Section 1—Perceived Physical Accessibility:
(3) I always find it easy and unobstructed to move within this station.
(4) I do not encounter physical barriers that hinder my mobility.
(5) The access points to the station are easy to identify and use.
(6) How long does it take you to reach the station from your home/workplace? (Likert 2)
(7) Ramps, elevators, and other accessibility infrastructure are in good working condition and serve their purpose.
(8) The station has enough safe and accessible spaces for parking bicycles or vehicles.
(9) The signage and information screens are clear and helpful.
(10) The bathrooms are accessible, clean, and functional.
(11) The seats, waiting areas, and other amenities are adequate and accessible.
(12) The station environment (noise, lighting, odors) is comfortable and does not negatively affect my experience.
II. Section 2—Safety and Protection:
(13) I feel safe from crime and harassment in this station, both during the day and at night.
(14) The presence of security personnel and surveillance systems makes me feel safer.
(15) The lighting in the station is sufficient to feel safe.
(16) Security guards and surveillance cameras are available and accessible.
III. Section 3—Inclusivity:
(17) Do you benefit from any special fare?
(18) This station is designed to be inclusive and accessible for people of all ages and abilities, including those with cognitive disabilities.
(19) Are the customer service counters at an accessible height for wheelchair users?
(20) Is there signage with an adequate color contrast for people with low vision?
(21) Is information presented in accessible formats for people with cognitive disabilities (pictograms, simple language)?
(22) The announcements (visual and auditory) are accessible and clear for everyone.
(23) How easy was it to find staff to assist you?
(24) The station staff is trained to assist people with disabilities or special needs.
(25) Do you think the station reflects an inclusive design that facilitates the experience for all users?
(26) How important is it to you that the station has functional and accessible elevators?
(27) What specific changes would you recommend to improve the accessibility of this station for people with different disabilities? (Open-ended—Optional)
(28) Describe a positive or negative experience you have had at this station related to accessibility. (Open-ended—Optional)
(29) Do you think the station’s environment meets your expectations?
(30) I feel comfortable using the facilities, regardless of my physical or cognitive abilities.
(31) Are the seats in the waiting areas comfortable?
(32) Are there enough seats available in the waiting areas?
(33) Is the temperature in the station comfortable?
(34) Is the noise level in the station appropriate?
(35) Is the noise level in the train appropriate?
(36) Is the lighting in the station adequate?
(37) Is the lighting inside the train adequate?
(38) The written and announced information is available in the languages most passengers need, and the announcements are clear and understandable for people from various cultural backgrounds.
IV. Section 4—Adaptive Strategies and Environmental Knowledge:
If you do not face accessibility barriers, select ’Not Applicable’ for these questions.
(39) When I encounter accessibility barriers, I usually look for alternative routes within the station. (Yes/No)
(40) I am familiar with the accessible areas within the station (elevators, ramps, alternative entrances). (Yes/No)
(41) I have developed a specific routine to navigate this station due to its design or accessibility. (Yes/No)
(42) I have learned to avoid certain areas of this station due to persistent accessibility barriers. (Yes/No)
V. Section 5—Intermodal Connectivity:
(43) How long do you usually wait for the metro?
(44) Do you consider the waiting time reasonable?
(45) Is it easy to transfer from the subway station to other public transport options?
(46) The connections with other transport modes (buses, taxis, bicycles) are accessible and convenient.
(47) The information about connection transport options is clear, easy to follow, and readily available.
(48) Do you consider the time between the arrival/departure of connecting transport modes sufficient?
(49) The stops/platforms are conveniently located.
(50) The stops/platforms are accessible (ramps, signage, etc.).
(51) The connected transport services (buses, taxis, shared transport, etc.) arrive/depart frequently enough from this station.
(52) The connected transport services are punctual and reliable.
(53) It is easy to transfer between the train and other transport modes at this station.
VI. Section 6—Overall Satisfaction:
(54) I am satisfied with the inclusion measures implemented at this station for people with different abilities and needs.
(55) What specific aspects of this station generate the most satisfaction or dissatisfaction? (Open-ended question)
(56) How important is this station to you compared to others that you use?
(57) How connected do you feel to the train stations compared to the collective transport options you use?
(58) How connected do you feel to this station compared to other stations you use?
(59) Overall, I am satisfied with how inclusive this station is.
(60) Would you recommend this station to other passengers?

References

  1. Busquets, J. Defining the Urbanistic Project–Ten Contemporary Approachs. Harv. Des. Mag. 2006, 71–73. [Google Scholar]
  2. López, A. El metro como infraestructura de proyecto urbano: Tres escenarios de intervención para la estación de metro Plaza Maipú. In Arquitectura; Pontificia Universidad Católica de Chile: Santiago, Spain, 2008. [Google Scholar]
  3. Koolhaas, R. Unkspace, Logan Airport: A World-Class Upgrade for the Twenty-first Century. October 2002, 100, 175–199. [Google Scholar]
  4. Sectra-Mideplan, R. Construcción de Planes Estratégicos de Desarrollo del STU del Gran Valparaıso, IV Etapa; Secretaria de Planificación de Transporte: Biblioteca, Mexico, 2003. [Google Scholar]
  5. Seriani, S.; Fernández, R. Planning guidelines for metro–bus interchanges by means of a pedestrian microsimulation model. Transp. Plan. Technol. 2015, 38, 569–583. [Google Scholar]
  6. Seriani, S.; Arce, P.; Belmar, C.; Blanche, V.; Valencia, A.; Luza, D.; Fujiyama, T. Analyzing the Effect of Yellow Safety Line Designs at the Platform Edge in Metro Stations: An Experimental Approach. Appl. Sci. 2023, 13, 4791. [Google Scholar] [CrossRef]
  7. Seriani, S.; Fernandez, R. Pedestrian traffic management of boarding and alighting in metro stations. Transp. Res. Part C Emerg. Technol. 2015, 53, 76–92. [Google Scholar]
  8. Minvu. Decreto Supremo 50. Ley Nº 20.422, Sobre Igualdad de Oportunidades e Inclusión Social de Personas con Discapacidad; Ministerio de Vivienda y Urbanismo: Santiago, Chile, 2016. [Google Scholar]
  9. Yang, H.; Ruan, Z.; Li, W.; Zhu, H.; Zhao, J.; Peng, J. The impact of built environment factors on elderly people’s mobility characteristics by metro system considering spatial heterogeneity. ISPRS Int. J. Geo-Inf. 2022, 11, 315. [Google Scholar] [CrossRef]
  10. United Nations. United Nations 2015. Available online: https://sdgs.un.org/goals (accessed on 1 January 2025).
  11. Xing, Y.; Lu, J.; Chen, S.; Dissanayake, S. Vulnerability analysis of urban rail transit based on complex network theory: A case study of Shanghai Metro. Public Transp. 2017, 9, 501–525. [Google Scholar]
  12. Jiang, R.; Lu, Q.C.; Peng, Z.R. A station-based rail transit network vulnerability measure considering land use dependency. J. Transp. Geogr. 2018, 66, 10–18. [Google Scholar]
  13. Cottrill, C.D.; Brooke, S.; Mulley, C.; Nelson, J.D.; Wright, S. Can multi-modal integration provide enhanced public transport service provision to address the needs of vulnerable populations? Res. Transp. Econ. 2020, 83, 100954. [Google Scholar]
  14. Hong, L.; Ouyang, M.; Xu, M.; Hu, P. Time-varied accessibility and vulnerability analysis of integrated metro and high-speed rail systems. Reliab. Eng. Syst. Saf. 2020, 193, 106622. [Google Scholar] [CrossRef]
  15. Han, Y.; Ku, J.; Kim, Y.; Hwang, J. Analyzing the accessibility of subway stations for transport-vulnerable population segments in Seoul: Case of bus-to-subway transfer. Case Stud. Transp. Policy 2022, 10, 166–174. [Google Scholar]
  16. Radzimski, A. Accessibility of Vulnerable Populations to Essential Opportunities: A Multimodal Approach with Application to Four Polish Cities. Netw. Spat. Econ. 2024, 1–28. [Google Scholar]
  17. Kazemzadeh, K.; Laureshyn, A.; Winslott Hiselius, L.; Ronchi, E. Expanding the Scope of the Bicycle Level-of-Service Concept: A Review of the Literature. Sustainability 2020, 12, 2944. [Google Scholar] [CrossRef]
  18. TRB. Highway Capacity Manual; Transportation Research Board; Nacional Research Council: Washington, DC, USA, 2000. [Google Scholar]
  19. TRB. Transit Capacity and Level of Service Manual, 2nd ed.; TCRP Report 100; Transportation Research Board: Washington, DC, USA, 2003. [Google Scholar]
  20. TRB. Pedestrian and Bicycle Concept; Pedestrians. In Highway Capacity Manual; Transportation Research Board: Washington, DC, USA, 2010; Chapter 11, Chapter 18. [Google Scholar]
  21. Fernández, R. Temas de Ingeniería y Gestión de Tránsito; RIL Editores: Santiago, Chile, 2014. [Google Scholar]
  22. Barría, C.; Guevara, C.A.; Jimenez-Molina, A.; Seriani, S. Relating emotions, psychophysiological indicators and context in public transport trips: Case study and a joint framework for data collection and analysis. Transp. Res. Part F Traffic Psychol. Behav. 2023, 95, 418–431. [Google Scholar] [CrossRef]
  23. Banister, D. The sustainable mobility paradigm. Transp. Policy 2008, 15, 73–80. [Google Scholar]
  24. Tyler, N. Accessibility and the Bus System: From Concepts to Practice; Thomas Telford: London, UK, 2002. [Google Scholar]
  25. Tyler, N. Accessibility and the Bus System: Transforming the World; ICE Publishing: London, UK, 2015. [Google Scholar]
  26. Rotenberg, S.; Nooruddin, I. Getting on Track: Accessibility Policy and the Design of the Mumbai Metro. J. Public Space 2022, 7, 29–40. [Google Scholar]
  27. Andrade, A.; Escudero, M.; Parker, J.; Bartolucci, C.; Seriani, S.; Aprigliano, V. Perceptions of people with reduced mobility regarding universal accessibility at bus stops: A pilot study in Santiago, Chile. Case Stud. Transp. Policy 2024, 16, 101190. [Google Scholar]
  28. Debrezion, G.; Pels, E.; Rietveld, P. The impact of railway stations on residential and commercial property value: A meta-analysis. J. Real Estate Financ. Econ. 2007, 35, 161–180. [Google Scholar]
  29. Tetiranont, S.; Sadakorn, W.; Rugkhapan, N.T.; Prasittisopin, L. Enhancing sustainable railway station design in tropical climates: Insights from Thailand’s architectural theses and case studies. Buildings 2024, 14, 829. [Google Scholar] [CrossRef]
  30. Liang, Y.; Song, W.; Dong, X. Evaluating the space use of large railway hub station areas in Beijing toward integrated station-city development. Land 2021, 10, 1267. [Google Scholar] [CrossRef]
  31. Isa, H.M.; Zanol, H.; Alauddin, K.; Nawi, M.H. Provisions of disabled facilities at the Malaysian public transport stations. In MATEC Web of Conferences; EDP Sciences: London, UK, 2016. [Google Scholar]
  32. Tamba, J. Exploring The Accessibility and Facility IN Railway Station Used by Persons with Disabilities: An Experience From Kebayoran Railway Station, Jakarta. Indones. J. Disabil. Stud. 2018, 5, 37–45. [Google Scholar]
  33. Stjernborg, V. Accessibility for all in public transport and the overlooked (social) dimension—A case study of Stockholm. Sustainability 2019, 11, 4902. [Google Scholar] [CrossRef]
  34. Borndörfer, R.; Grötschel, M.; Pfetsch, M.E. A column-generation approach to line planning in public transport. Transp. Sci. 2007, 41, 123–132. [Google Scholar] [CrossRef]
  35. Rodriguez Porcel, M.; Lee, S.; Sandoval, D.; Tascón Valencia, J.; Jaramillo, P.J. Auditoría Georreferenciada Y Diagnóstico de Accesibilidad Peatonal de Personas con Discapacidad en la Primera Y Última Milla de un Viaje; IADB: Washington, DC, USA, 2023. [Google Scholar]
  36. Arias-Badia, B. La accesibilidad en los estudios de traducción e interpretación: Experiencias docentes con estudiantes con ceguera y baja visión. Int. J. 21st Century Educ. 2023, 10, 3–14. [Google Scholar]
  37. Garnica-Quiroga, V. El impacto y la percepción de los usuarios acerca del servicio del TransMicable en Bogotá DC, como modo de última y primera milla. Territorios 2021, 44, 171–184. [Google Scholar]
  38. Paydar, M.; Fard, A.K.; Khaghani, M.M. Walking toward metro stations: The contribution of distance, attitudes, and perceived built environment. Sustainability 2020, 12, 10291. [Google Scholar] [CrossRef]
  39. Lin, D.; Zhang, Y.; Meng, L. Assessing bike accessibility to metro systems by integrating crowdedness. Trans. Urban Data Sci. Technol. 2023, 2, 159–177. [Google Scholar]
  40. Giang, V.T.T.; Vinh, T.D.; Huyen, N.T.; Nga, D.T.; Hung, N.M. Connectivity of metro station location with urban space—A study of Hanoi metro line N° 2.3. In E3S Web of Conferences; EDP Sciences: London, UK, 2023. [Google Scholar]
  41. Li, J.; Tang, R. Analysis of the choice behaviour towards docked and dockless shared bicycles based on user experience. Int. Rev. Spat. Plan. Sustain. Dev. 2019, 7, 143–156. [Google Scholar]
  42. Li, S.; Zhao, P. Restrained mobility in a high-accessible and migrant-rich area in downtown Beijing. Eur. Transp. Res. Rev. 2018, 10, 1–17. [Google Scholar] [CrossRef]
  43. Chen, J.; Liu, J.; Peng, Q.; Yin, Y. Resilience assessment of an urban rail transit network: A case study of Chengdu subway. Phys. A Stat. Mech. Its Appl. 2022, 586, 126517. [Google Scholar] [CrossRef]
  44. Jiao, L.; Zhu, Y.; Huo, X.; Wu, Y.; Zhang, Y. Resilience Assessment of Metro Stations Against Rainstorm Disaster Based on Cloud Model: A Case Study in Chongqing, China. Nat. Hazards 2022, 116, 2311–2337. [Google Scholar] [CrossRef] [PubMed]
  45. Qi, Q.; Meng, Y.; Zhao, X.; Liu, J. Resilience assessment of an Urban Metro Complex Network: A case study of the Zhengzhou Metro. Sustainability 2022, 14, 11555. [Google Scholar] [CrossRef]
  46. Bhatt, D.; Chandra, M. GIS and gravity model-based accessibility measure for Delhi metro. Iran. J. Sci. Technol. Trans. Civ. Eng. 2022, 46, 3411–3428. [Google Scholar] [CrossRef]
  47. Chen, B.Y.; Lam, W.H.; Sumalee, A.; Li, Q.; Li, Z.C. Vulnerability analysis for large-scale and congested road networks with demand uncertainty. Transp. Res. Part A Policy Pract. 2012, 46, 501–516. [Google Scholar] [CrossRef]
Figure 1. Spaces in metro stations and their surroundings (node-place) in Valparaiso Metro: (a) platform–stairs, (b) platform–train, (c) city or street level, and (d) concourse.
Sustainability 17 03064 g001
Figure 2. Circumplex psychology model to register the emotions of passengers (in red color the emotions selected).
Sustainability 17 03064 g002
Figure 3. Mock-up in the Mobility and Transport Laboratory at the Pontifical Catholic University of Valparaíso: (a) train layout in which seats are perpendicular to the movement of the train and (b) passengers detected inside the train in which the seats are parallel to the movement of the train.
Sustainability 17 03064 g003
Figure 4. Registration of emotions considering each trip moment (M).
Sustainability 17 03064 g004
Figure 5. Examples of trip moments (M) during the field observation: (a) Moment 2 (on the way to the station); (b) Moment 3 (arrival to the station); (c) Moment 4 (waiting on the platform); and (d) Moment 6 (on the train).
Sustainability 17 03064 g005
Figure 6. Emotions registered when changing the layout of the train carriage.
Sustainability 17 03064 g006
Figure 7. Emotions registered when changing density inside the train carriage.
Sustainability 17 03064 g007
Table 1. Threshold ranking to classify the accessibility perception at existing metro stations.
RankingRanking ValueClassificationDescription
≤n≤9Very unpleasantAccessibility elements generate a very unpleasant overall experience for passengers
(n + 1) to [(5∙n − 1) − (n + 1)]/2 + (n + 1)10 to 27UnpleasantAccessibility elements generate an unpleasant overall experience for passengers
[(5∙n − 1) − (n + 1)]/2 + (n + 1) + 1 to (5∙n − 1)28 to 44PleasantAccessibility elements generate a pleasant overall experience for passengers
≥5∙n≥45Very pleasantAccessibility elements generate a very pleasant overall experience for passengers
Table 2. Accessibility perception rank in each trip moment at existing metro stations.
Trip MomentAccessibility Perception ElementVery Unsatisfied or StressUnsatisfied or SadNeutralSatisfied or RelaxVery Satisfied or HappyTotal Ranking (Using Equation (1))Classification Overall Experience (Using Table 1)
M1: From the OriginUse of a cell phone application to plan a trip1161025Unpleasant
Subtotal M1 11610
M2: On the Way to the StationPhysical barriers0135031Pleasant
Safety0125133Pleasant
Noise2331021Unpleasant
Subtotal M2 258111
M3: Arrival at the StationSignage0025236Pleasant
Waiting time at turnstiles1323025Unpleasant
Noise0611124Unpleasant
Subtotal M3 19593
M4: Waiting on the PlatformComfort1224027Unpleasant
Shelter condition2322022Unpleasant
Mobility facilities1134028Pleasant
Information provided2403022Unpleasant
Noise0224131Pleasant
Lighting3222021Unpleasant
Subtotal M4 91411191
M5: Boarding the TrainComfort1105233Pleasant
Waring sound door closing0025236Pleasant
Time opening and closing doors0107135Pleasant
Noise1215028Pleasant
Subtotal M5 243225
M6: On the TrainSeat comfort0108034Pleasant
Noise1005336Pleasant
Ventilation0214233Pleasant
Train speed0006339Pleasant
Break and acceleration of train0108034Pleasant
Lighting0014439Pleasant
Subtotal M6 1423512
M7: Exiting the TrainComfort2106028Pleasant
Information provided0115130Pleasant
Noise0116134Pleasant
Safety1113333Pleasant
Subtotal M7 343205
M8: Leaving the StationSignage1106132Pleasant
Safety1106132Pleasant
Noise0134132Pleasant
Mobility facilities2025028Pleasant
Subtotal M8 435213
M9: Arrival at the DestinationOverall experience0108034Pleasant
Noise0234029Pleasant
Signage0026135Pleasant
Physical barriers2312124Unpleasant
Communication0214233Pleasant
Subtotal M9 28724425Unpleasant
Total 25525016234
Disclaimer/Publisher’s Note: The statements, opinions and data contained in all publications are solely those of the individual author(s) and contributor(s) and not of MDPI and/or the editor(s). MDPI and/or the editor(s) disclaim responsibility for any injury to people or property resulting from any ideas, methods, instructions or products referred to in the content.

