1. Introduction
China is a large agricultural country, but it also has the largest output of agricultural waste: the annual output of agricultural waste is more than 4 billion tons, and agricultural waste recycling has been a focus of attention. At this stage, although China has begun to set up more agricultural waste recycling points and provide corresponding agricultural waste recycling-related government subsidies—such as pesticide packaging waste, comprehensive crop residue utilization, and the scientific use of mulch film recycling subsidies—it has still not yet formed a high-quality agricultural waste recycling market.
Therefore, optimizing the reverse supply chain is of great significance. For enterprises, the optimization of the reverse supply chain can reduce the cost of waste treatment, recycle waste to obtain new income, centralize recycling, and classify the treatment of waste into fewer pollution sources, thus alleviating environmental pollution and ecological pressure. Optimizing the reverse supply chain of agricultural waste can promote the efficient use of resources and the development of the circular economy. Optimizing the meat reverse supply chain can improve profitability while reusing waste and minimizing carbon emissions, thus promoting environmental sustainability [
1]. As leather processing produces a lot of waste, optimizing its reverse supply chain can help to recycle leather waste and regenerate the product, improving the producer’s profitability [
2]. Grapes are perishable and therefore generate a lot of waste during the growing process. Optimizing the reverse supply chain for grape growing can better deal with such waste to minimize costs, reduce environmental impacts, and enhance social benefits [
3].
The market for agricultural waste recycling and treatment output products is not well developed, and it is important to establish a sustainable agricultural waste management system [
4]. Building a complete and robust disposal system for biodegradable materials is important. Through technological advancements, infrastructural development, and increased consumer awareness, bioplastics have a greater potential to reduce plastic waste [
5]. Recycling agricultural plastic film waste can save environmental and economic costs [
6], and recycling agricultural fiber paper packaging waste can reduce the need for fresh fibers, leading to better sustainable development [
7]. Agricultural net waste recyclates can be used as fillers in lightweight cementitious composites without waste treatment and heat treatment. They have low density, low absorption, high flexural strength, and satisfactory compressive strength [
8]. The implementation of a short supply chain creates more added value in the process of pesticide packaging recycling [
9].
Government policies can affect the operation of the RSC of agricultural waste. By providing different incentives (tax exemptions and subsidies) to the members of the RSC, the government can play a role in improving its coordination [
10]. Agricultural extension units in the public sector and agents in the private sector can lead to potential gains for farmers through the effective management and utilization of agricultural waste [
11]. Incentivizing stakeholders of agricultural waste RSCs to organize and operate collection stations for empty plastic pesticide packaging can lead to a more effective waste pesticide packaging management network, which in turn can lead to the participation of more farmers and related organizations [
12]. When the price of petroleum derivatives used for the production of plastics is low, the implementation of tax rebates by government departments is more favorable for recycling agricultural plastic waste [
13].
In contrast to previous studies, the current work focuses on establishing a stable reverse-recovery market for agricultural waste, improving supply chain circulation efficiency, and promoting the development of a sustainable agricultural economy and agroecology.
The rest of the paper is structured as follows.
Section 2 provides a review of the relevant literature.
Section 3 describes a reverse-supply-chain circulation mode of agricultural waste.
Section 4 provides the assumptions and construction of a game model between agricultural waste recyclers and reprocessing enterprises.
Section 5 presents an evolutionary game analysis of the stability of the equilibrium points and determines the evolutionary stabilization strategies (ESSs) for different scenarios.
Section 6 provides the game model under a governmental incentive and punishment mechanism between agricultural waste recyclers and reprocessing enterprises, as well as a government reward and punishment mechanism.
Section 7 presents a simulation analysis, which discusses the influence of relevant parameters on the evolutionary path of the game. Finally,
Section 8 summarizes the conclusions and limitations of this study.
2. Literature Review
2.1. Agriculture Waste
Agricultural waste generated by agriculture-based industries pollutes the environment. It wastes a lot of beneficial biomass resources that can be used to manufacture many products, such as biofertilizers, biofuels, livestock feeds, and so on. Recycling agricultural waste as high-quality raw materials can reduce costs and environmental pollution [
14]. Agro-processing industries generate large amounts of agricultural waste globally, which can be utilized in ecologically sound textile dyeing processes through sustainable methods [
15]. Many agricultural wastes can be used to replace traditional carbohydrates, and the saccharification and fermentation process of waste sweet potato vines via autoclaving can improve the growth of fermentative yeast and lipid production, which is conducive to the utilization of waste sweet potato vine resources [
16]. Processed agricultural waste can be used to prepare mulch biofilm, and recycling solid digestate into biodegradable plastic substitutes not only produces high-performance biofilms but also reduces the environmental risks that biofilms may pose [
17].
In addition to the recycling methods described above, recycled agricultural waste can be converted into bioplastics and used to manufacture production fuels, and the cellulose contained therein can be recovered. (1) Recycled agricultural waste has the environmental advantages of being biodegradable and biobased, and bioplastics are more attractive to both industry and consumers [
18]. The conversion of agricultural waste into bioplastics has added sustainable value, as does recyclability for biochar production [
19]. (2) Energy security can be enhanced by utilizing agricultural wastes as feedstock for biorefinery methods. The selection of this renewable biomass for the synthesis of green fuels and other green biochemicals can lead to favorable results regarding cost-effectiveness and sustainability [
20]. Refined bioproducts from agricultural wastes help to meet resource and energy needs: apple orchards generate large amounts of waste that can be used to produce fuels and materials [
21]. (3) As the global focus shifts to sustainable development and environmentally friendly practices, there is increasing emphasis on the recycling and utilization of materials derived from agricultural wastes, such as cellulose and lignin [
22]. Nanocellulose derived from agricultural waste can create an innovative nanocoating substance that provides an eco-friendly alternative to geomembranes [
23]. Modified sunflower waste can be used to make natural fiber plastic composites, reducing environmental pollution from agricultural waste [
24]. Cellulosic residues from agricultural wastes can be used as a sustainable source of biofuels and bioenergy. They can also be used to produce value-added products, which can contribute to the development of sustainable agriculture and minimize environmental pollution [
25].
2.2. Reverse Supply Chain for Agricultural Waste
The RSC concept has gained significant attention in the literature over the years. The RSC of agricultural waste has great potential to reduce the environmental and economic costs incurred due to the disposability of agricultural waste, contributing to better sustainable agricultural development. The environmental impact of agricultural waste can be reduced by designing an optimized supply chain distribution network and opening composting centers that minimize the closed-loop supply chain’s total fixed and variable costs [
26]. The reverse supply chain can reduce energy consumption and cost. Waste pomegranates are converted into recyclable products through reverse logistics and later used as vehicle fuel, renewable energy, and compost. The recycling, reprocessing, and reuse of pomegranate products not only reduces harmful impacts on the environment but also helps to improve the competitive position of recycling and processing companies in the market [
27]. Recycling large quantities of agricultural waste, such as olive pomace and orange residue, can reduce landfill costs, and recycling new fertilizers made from them can bring more revenue, which will help improve a company’s economic efficiency [
28]. Recycling agricultural waste is necessary to create closed-loop agri-food chains and more sustainable agroecosystems. Replacing nitrogenous mineral fertilizers with recycled organic fertilizers promotes a circular economy that can make agricultural systems environmentally sustainable while ensuring food security [
29]. Closed-loop agri-food supply chains can effectively reduce economic costs and minimize environmental pollution due to agri-food waste disposal [
30].
The optimization of RSCs by enterprises facilitates the implementation of the circular economy so that enterprises can maximize the use of agricultural waste while solving the problem of agricultural waste coordination and information sharing within and between supply chain participants [
31]. Establishing an agricultural organic waste recycling system needs to be strategized by considering the amount of organic waste and compost generated in local villages and towns. This is due to the difficulty of finding buyers for compost. Most of the compost will be distributed to neighboring farm villages, and optimizing the RSC for agricultural waste can solve this problem [
32]. Transportation costs for the centralized collection, treatment, and distribution of bulky organic agricultural waste to farms are high. Recycling agricultural waste using composting technology is a practical approach, where optimizing agricultural waste recycling systems is important [
33].
2.3. Evolutionary Game
Evolutionary games can be applied to RSCs, such as the recycling of construction materials, pharmaceuticals, and batteries. (1) By selecting construction enterprises and construction material producers as the participating subjects, we constructed an evolutionary game model of the decision-making behavior of both parties in coal waste recycling using evolutionary game theory. Then, we analyzed the influence of various factors on the evolution of decision-making behaviors of both parties and put forward strategies to promote waste recycling [
34]. We constructed a stochastic game model of the production strategy of supplier groups in the construction supply chain to explore the effects of various factors on the evolution process, such as the initial willingness of suppliers to choose low-carbon-emission strategies, the cost subsidy coefficients of the government for low-carbon suppliers, the rewards and punishments of the government, and the reputation of suppliers [
35]. (2) We constructed an evolutionary game model between the government, pharmaceutical recycling enterprises, and consumers, analyzing the effects of the benefits of these participants on the trend of evolutionary stabilization strategies. This can help solve the problem of recycling discarded pharmaceuticals [
36]. (3) Recycling mechanisms for scientific waste are key to achieving sustainable development. Therefore, it is of great significance to explore the recycling mechanism of power batteries from the supply-side perspective based on evolutionary game theory [
37].
To explore the interaction mechanism affecting the decision-making between suppliers and manufacturers based on an evolutionary game, factors such as government subsidies and consumers’ green preferences will drive supply chain actors to choose innovations [
38]. Based on evolutionary game theory, a three-party evolutionary game model was constructed to study each subject’s stability and dynamic evolution process in the green supply chain [
39]. The established tripartite game model can analyze the dynamic evolution of the behavioral choices of each subject and explore the influence of government policies and consumer efforts on the packaging recycling system [
40]. A game model was used to analyze the decision-making game of multi-stakeholders and their stabilization strategies in waste recycling. Finally, it is known that the government should reasonably control the ratio of fines and subsidies and optimize supply chains so that the stakeholders are connected to promote the development of a closed-loop supply chain [
41]. A two-party game model of production and recycling units was established to explore both parties’ decision-making and stabilization strategies. The government’s reward and punishment mechanism has an important impact on the decision-making process of production units and recycling units in closed-loop supply chains, and subsidies have a more obvious incentive effect on recycling units. In contrast, supervision has a more significant effect on improving the active participation of production units [
42]. A decision-making model based on an evolutionary game was developed to assess government subsidies’ impact on firms engaged in green supply chains. Then, various factors affecting the evolution of the game system were investigated through numerical simulations. Government incentives affect the decision-making behavior of enterprises in green supply chains, and moderate government subsidies can motivate enterprises to choose sustainable supply chains, meaning that the government and enterprises can benefit together [
43]. We established an evolutionary game model of participating subjects in an agri-food supply chain based on blockchain to discuss each key parameter’s influence on the participating subjects’ dynamic evolution process [
44]. The model was constructed to study each participant’s evolution and stabilization strategies under different modes and discuss the significance of each participant’s choice of different modes and the corresponding governmental regulatory measures [
45].
On this basis, this paper discusses the RSC optimization problem of agricultural products from the perspective of agricultural waste recyclers and reprocessing enterprises. Based on the evolutionary game method, we replicated dynamic equations. We carried out an analysis of the simulations to understand the effects of the cost of optimizing an RSC for agricultural waste recyclers and reprocessing enterprises, the growth rate of income, and the level of government recycling subsidies on the evolutionary path after improving the efficiency of recycling and reuse.
3. Reverse-Supply-Chain Circulation Mode of Agricultural Waste
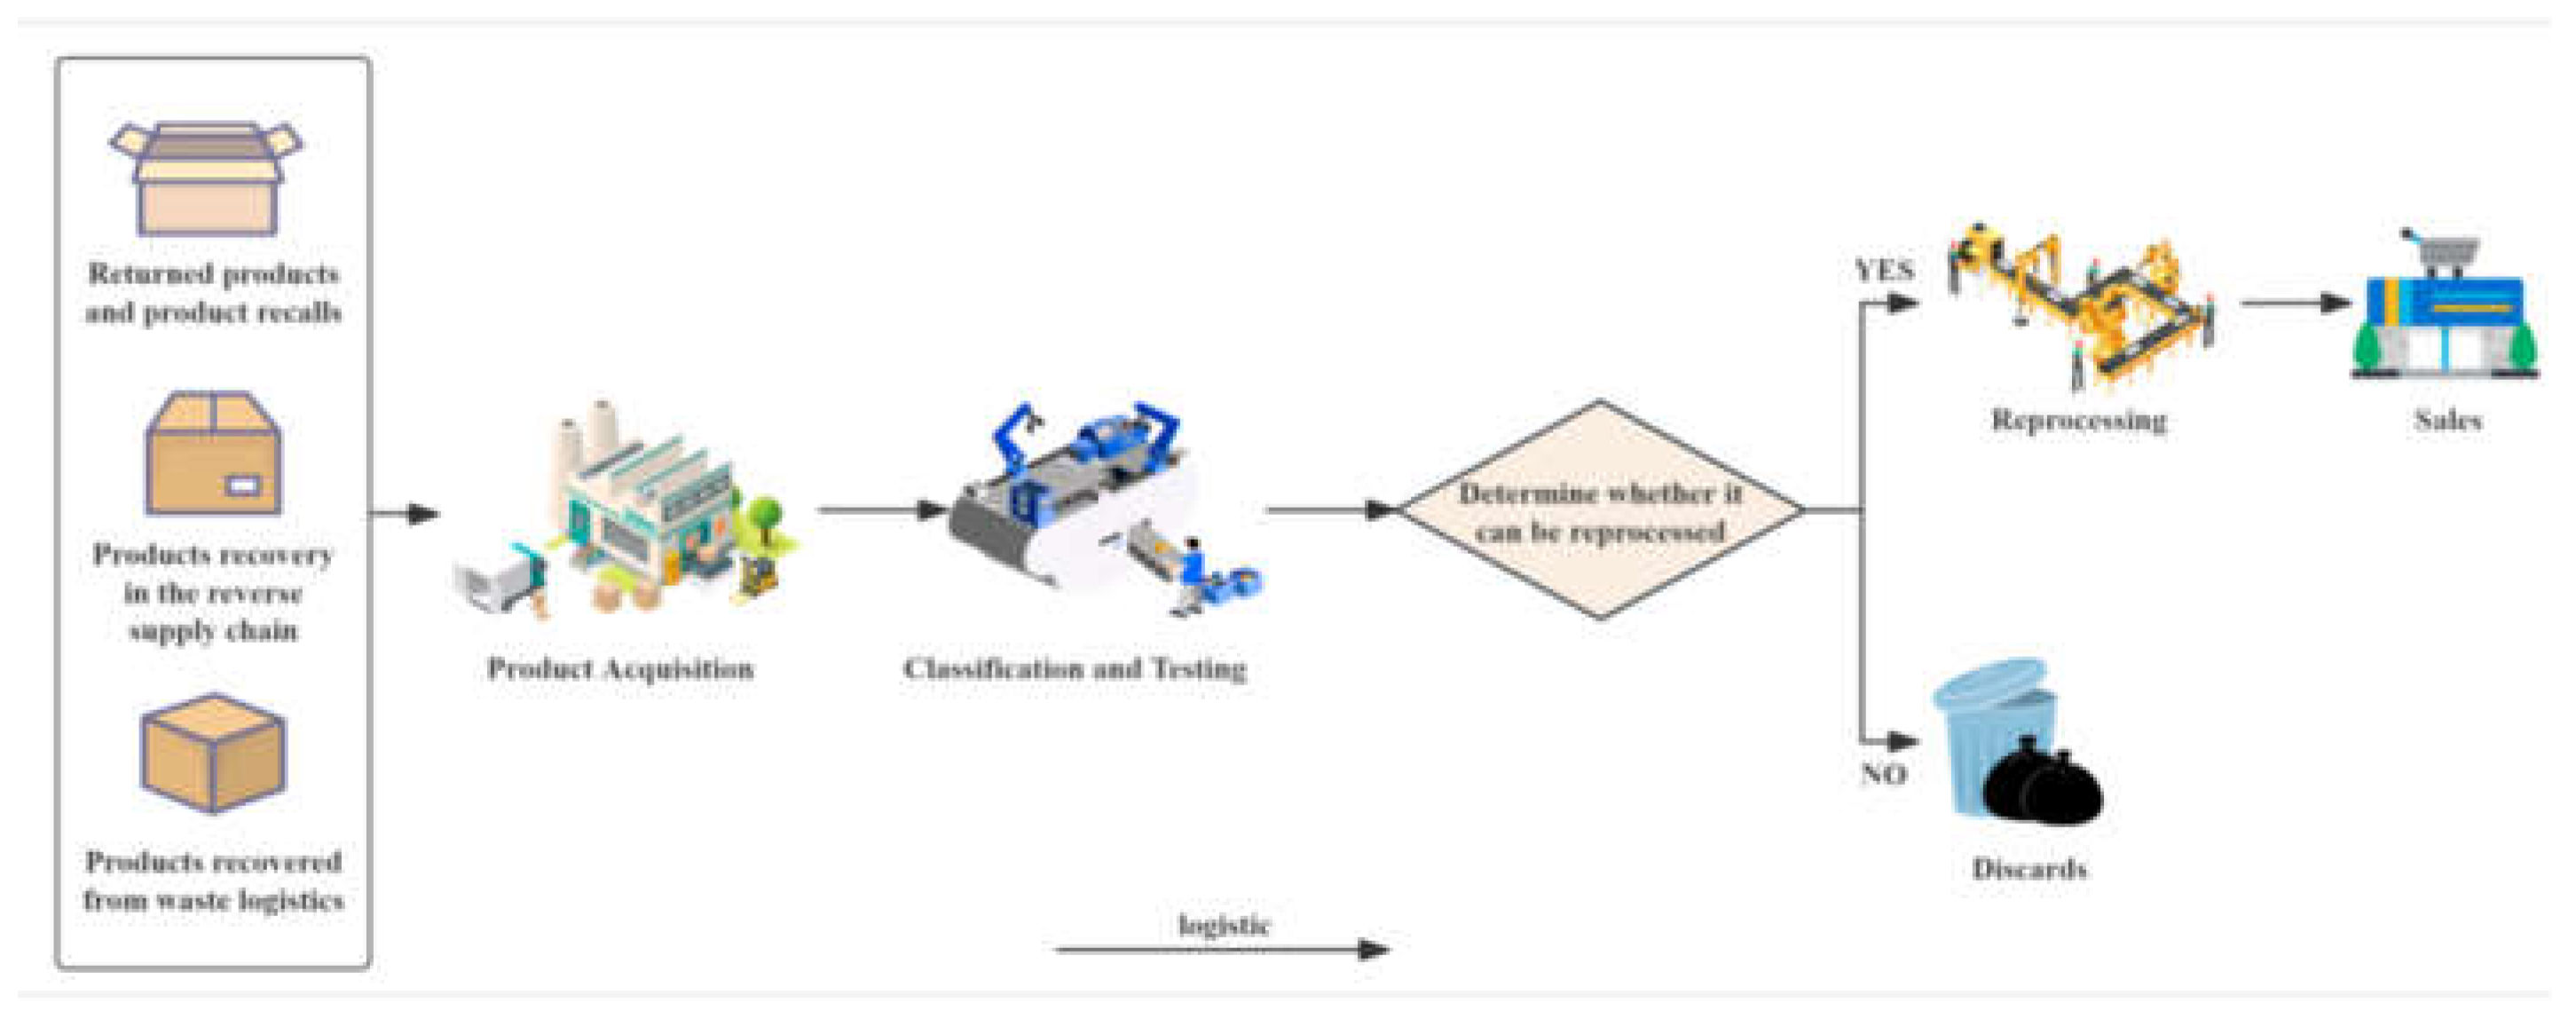
The RSC includes five key components, as shown in
Figure 1: product acquisition, reverse logistics, inspection and classification processing, discarding or reprocessing, and sales.
The product acquisition step mainly arises from products being returned from the forward supply chain and recycled through waste logistics [
46]. In addition, the existing incentives in the reverse supply chain motivate firms to recycle their products. The products obtained from each channel are sorted and inspected. If the result of the quality inspection is that the product is in good condition or not significantly damaged, then these recycled products are sent to refurbishment centers or repaired. Finally, the processed products are sold. If the recovered products are damaged, cannot be repaired, and have no residual value, they can be disposed of after processing [
47].
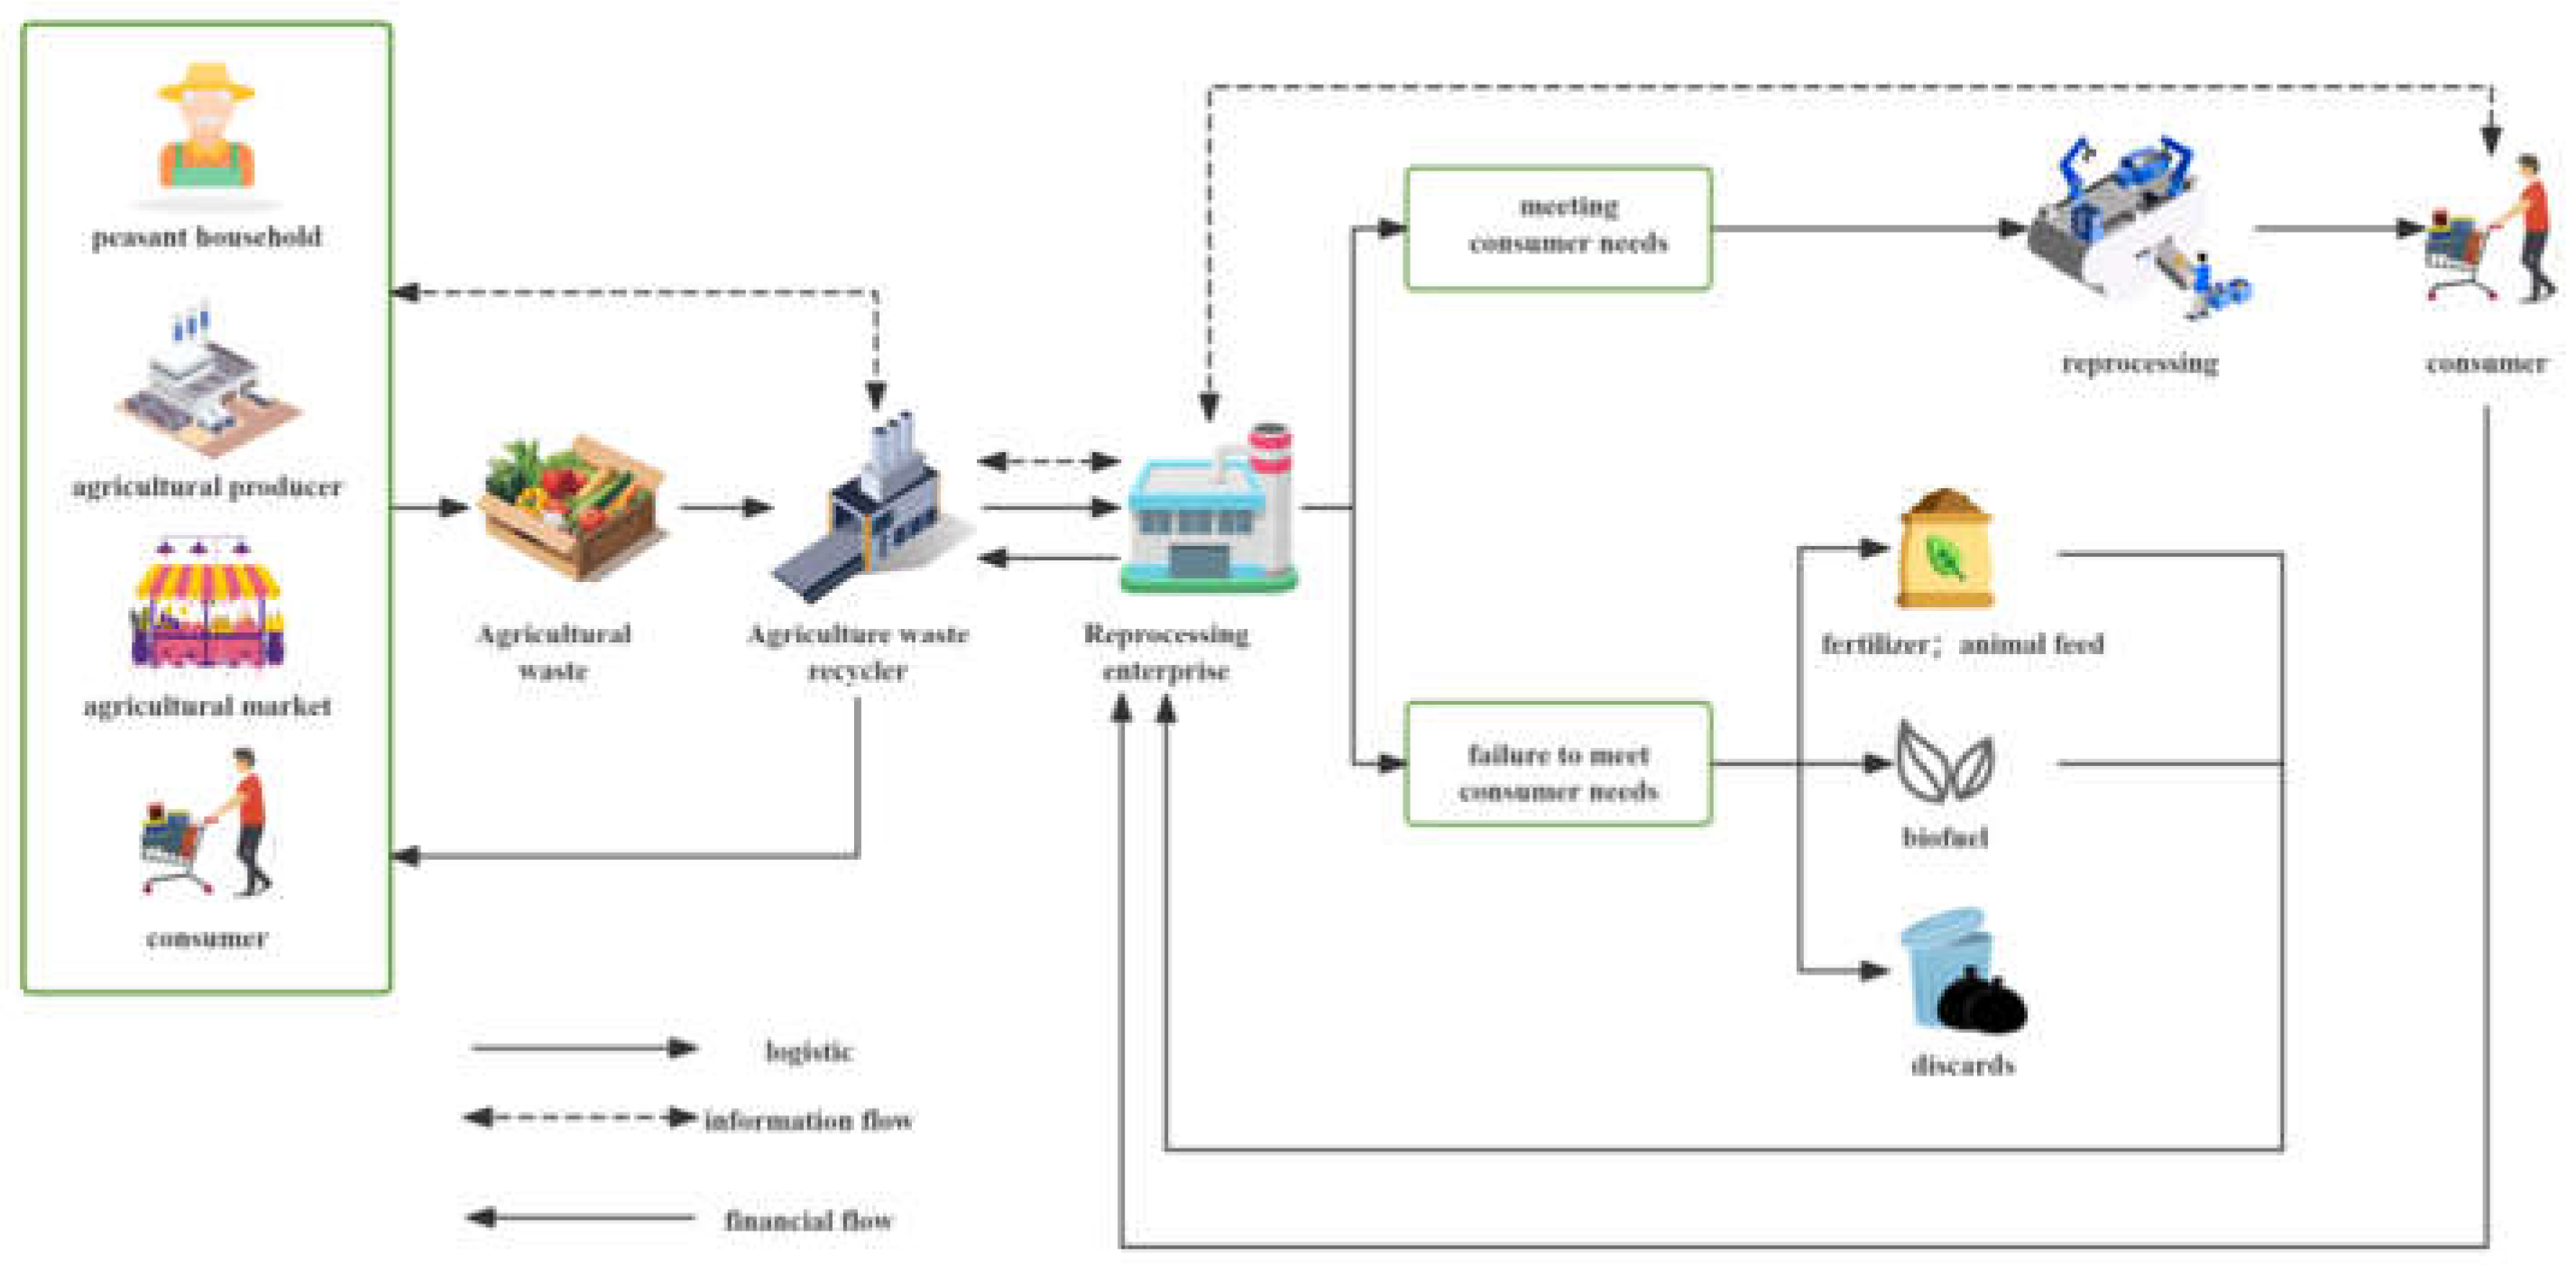
In contrast to the RSC circulation mode in
Figure 1,
Figure 2 shows the RSC recycling model for agricultural waste according to its specificity. In this model, the main sources of waste include farmers, agricultural producers, agricultural markets, and consumers. Agricultural waste is a general term for waste discharged from agricultural production, agricultural product processing, livestock and poultry breeding, and rural residents’ lives, including farmland and orchard residues, agricultural plastic residual film, and pesticide packaging waste. Some of the agricultural waste can be sold to consumers again after processing by reprocessing enterprises. In addition, agricultural waste that cannot be directly recycled can still be used to make many products, such as biofertilizers, biofuels, livestock feed, and so on. Recycling agricultural waste as high-quality raw materials can reduce costs and environmental pollution. The specific recycling model is shown in
Figure 2.
Taking the recycling of agricultural mulch as an example, agricultural waste recyclers collect used agricultural mulch from users, sort it by color, and send it to reprocessing enterprises. The reprocessing enterprises mechanically recover recyclable film and process it accordingly—for example, using specific solvents to dissolve the polyethylene in the film, separating the impurities and remolding it, or processing it into recycled plastic pellets for the production of lower-end plastics (e.g., garbage cans, pipes, etc.)—and then finally distributing and selling those products that still satisfy the needs of the consumers [
48]. Those that can no longer be recycled can be chemically recycled by high-temperature film cracking into fuel oil, natural gas, or chemicals such as carbon black.
Given the inefficiency of the RSC for agricultural waste, it is extremely necessary to establish an integrated operation for waste treatment and to realize the integrated operation of the recycling, sorting, and inspection of agricultural waste by establishing an end-to-end integrated service site. At the same time, government departments should provide support and preferences for end-of-pipe integrated service sites, such as loan support, economic subsidies, tax incentives, and site support. Reprocessing enterprises can also provide certain technical support to the end integrated service sites, thus promoting the completion of the integrated operation of the agricultural waste RSC and improving the circulation efficiency of the agricultural waste RSC.
4. Model Assumptions and Construction
4.1. Model Hypothesis
Many key factors affect the decision-making of agricultural waste recyclers and reprocessing enterprises, including revenue factors, cost factors, technological advances, policy changes, and environmental responsibility. The most important factors are revenue and cost, which include the benefits of agricultural waste recycling, the sales revenue of reprocessed products, and the government’s environmental subsidies, which will directly affect the willingness of enterprises to optimize the reverse supply chain. The cost factors include the cost of agricultural waste recycling, the cost of communication, and the cost of technology invested in the optimization of the reverse supply chain. Both sides want to obtain the maximum benefit while incurring the minimum cost in the game between agricultural waste recyclers and reprocessing enterprises.
This study assumes that the two RSC participants are agricultural waste recyclers and reprocessing enterprises. The game process is one to one and involves a randomly selected agricultural waste recycler and reprocessing enterprise. In
Figure 2 above, agricultural waste recyclers and reprocessing enterprises are both members of the RSC. Their strategies will change over time and adjust to the other party’s strategies to achieve optimal decisions. It can be seen that neither reprocessing enterprises nor agricultural waste recyclers are fully rational, but show bounded rationality, so the evolutionary game approach is suitable for analyzing decision-making processes under this model.
When combined with an analysis of the factors affecting the decision-making of agricultural waste recyclers and reprocessing enterprises, the resulting basic assumptions of the model are given below, and the evolution process is analyzed accordingly:
- (1)
Suppose that products from agricultural waste through reprocessing are sold at the same price as similar products;
- (2)
Suppose that the products from agricultural waste through reprocessing are of the same quality as their counterparts;
- (3)
Suppose that the production of manufactured products from recycled agricultural waste is less costly than the original production;
- (4)
Assume that the quality of the product improves as a result of the optimization of the RSC by the reprocessing enterprise;
- (5)
Assume that both agricultural waste recycler and reprocessing enterprise optimize the RSC, and both sides will have additional profits;
- (6)
Suppose that after communication, if one party refuses to jointly optimize the RSC, the party will lose additional profits;
- (7)
Suppose that the fixed subsidy provided by the government to agricultural waste recyclers is for the environmentally sound treatment of agricultural waste that cannot be recycled;
- (8)
Suppose that the government will give certain subsidies to firms that choose to optimize the RSC.
The relevant parameters are described in
Table 1.
4.2. Model Building
Both the reprocessing enterprise and the agricultural waste recycler each have the option to either optimize or not optimize the RSC. Based on the above assumptions and parameter settings, we constructed a game revenue matrix for a reprocessing enterprise and an agricultural waste recycler in the absence of government subsidies, as shown in
Table 2.
Assuming that in the evolutionary game model composed of a reprocessing enterprise and an agricultural waste recycler, the probabilities of the reprocessing enterprise optimizing the RSC or not optimizing the RSC are x (0 ≤ x ≤ 1) and (1 − x), respectively, and the probabilities of the agricultural waste recycler optimizing the RSC or not optimizing the RSC are y (0 ≤ y ≤ 1) and (1 − y), respectively.
According to the income matrix in
Table 2, the expected benefits to the reprocessing enterprise in choosing to optimize the RSC are:
The expected benefits to the reprocessing enterprise when choosing not to optimize the RSC are:
Therefore, the average expected income of the reprocessing enterprise is:
The replication dynamic equation for the reprocessing enterprise is:
The expected benefits to the agricultural waste recycler when optimizing the RSC are:
The expected benefits of the agricultural waste recycler when choosing not to optimize the RSC are:
Therefore, the average expected income of the agricultural waste recycler is:
The dynamic equation for the agricultural waste recycler is:
The replication dynamic equation of the evolutionary game system between the reprocessing enterprise and the agricultural waste recycler obtained by Formulas (4) and (8) is:
5. Analysis of Evolutionary Game
5.1. Stability Analysis of the Equilibrium Points in the Bilateral Evolutionary Game System
According to Formula (9), the equilibrium points of the system where F (x) = 0 and F (y) = 0 are E0 (0,0), E1 (0,1), E2 (1,0), and E3 (1,1), and point E4 (x*, y*) is the equilibrium point of the system, where .
For the partial derivatives of
x and
y for the above system of dynamic equations, the Jacobi matrix is:
According to Friedman’s stability criterion, an equilibrium point is locally stable if the determinant of the Jacobian matrix detJ is positive and the trace trJ is negative. In such cases, the equilibrium point qualifies as an evolutionary stability strategy. By bringing the local equilibrium point into the Jacobi matrix and obtaining its determinant and trace, the following propositions can be obtained:
Proposition 1. When , , the stability point of the system is (0,0);
Proposition 2. When , , the stability point of the system is (0,1);
Proposition 3. When , , the stability point of the system is (1,0);
Proposition 4. When , , the stability point of the system is (1,1).
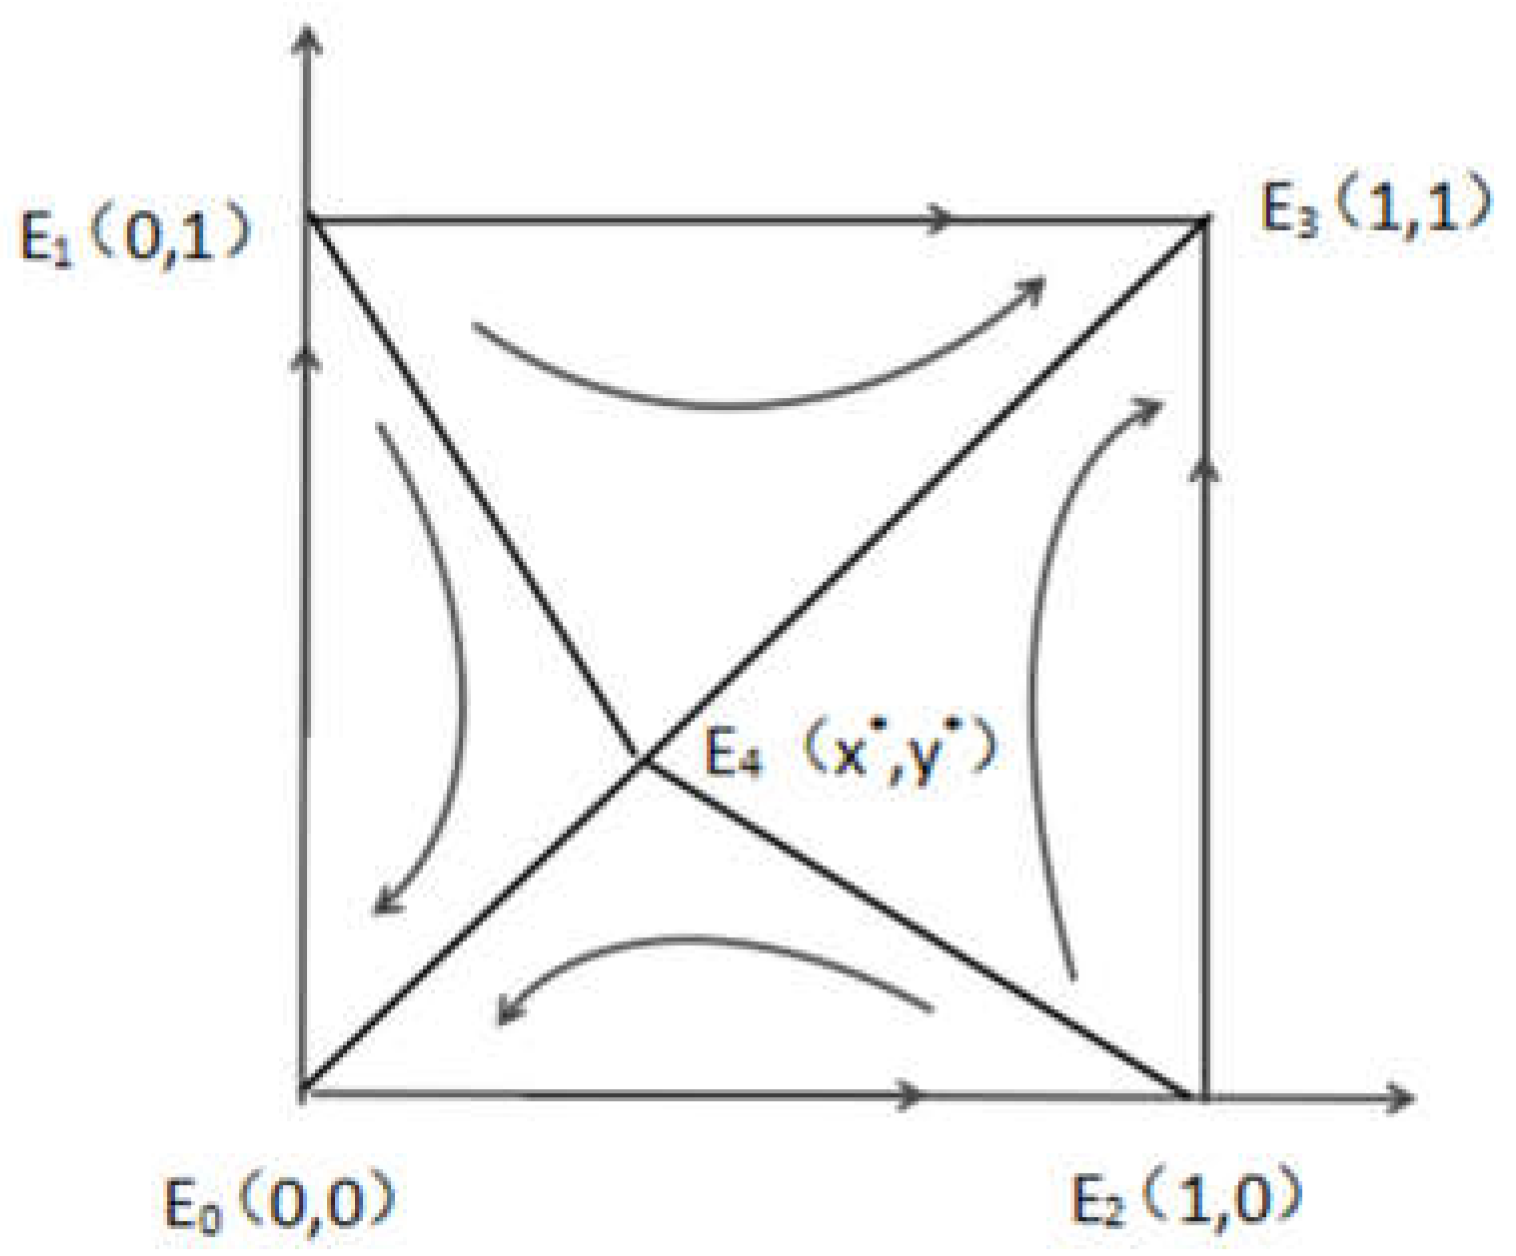
The evolutionary process of a reprocessing enterprise and an agricultural waste recycler choosing to optimize the RSC is shown in
Figure 3.
5.2. Analysis of the Evolutionary Results
In the reverse logistics of agricultural waste, whether reprocessing enterprises optimize the RSC is mainly affected by the cost of optimizing it, the quality of reprocessed agricultural waste, and the selling price of reprocessed agricultural waste. Considering the cost factor, a reprocessing enterprise should weigh the costs and benefits, such as whether high costs will be offset by long-term benefits or how policy subsidies can reduce cost pressure. The quality of agricultural waste may directly impact work efficiency regarding reprocessing and the pass rate of the final product. For example, in the case of straw, poor-quality straw may require more pretreatment, which will increase costs. In terms of the selling price, fluctuations in the market price of the reprocessed product can affect the profitability of the company, which in turn affects whether the reprocessing enterprise chooses to optimize the RSC or not. If the market price is low, the company may be reluctant to invest in it, and conversely, be motivated to optimize it. As for agricultural waste recyclers, whether they choose to optimize the RSC is mainly affected by the cost of optimizing it as well as government incentive policies. On the cost side, RSC optimization for recyclers includes transportation and communication costs. If the transportation radius exceeds a certain range, the cost may increase significantly, affecting the recyclers’ profitability. Both the reprocessing enterprise and agricultural waste recycler are affected by government incentives and will be more likely to optimize the RSC if the government subsidizes them.
Nowadays, a large amount of agricultural waste has caused ecological pollution. To minimize the pollution caused by agricultural waste to the environment and improve the use value of agricultural waste, it is necessary to analyze how to optimize the RSC to achieve better system stability.
From the above propositions, it can be seen that under different stability conditions, the equilibrium results of the game between the reprocessing enterprise and the agricultural waste recycler are significantly different when combining the four stages of evolution to analyze the equilibrium results.
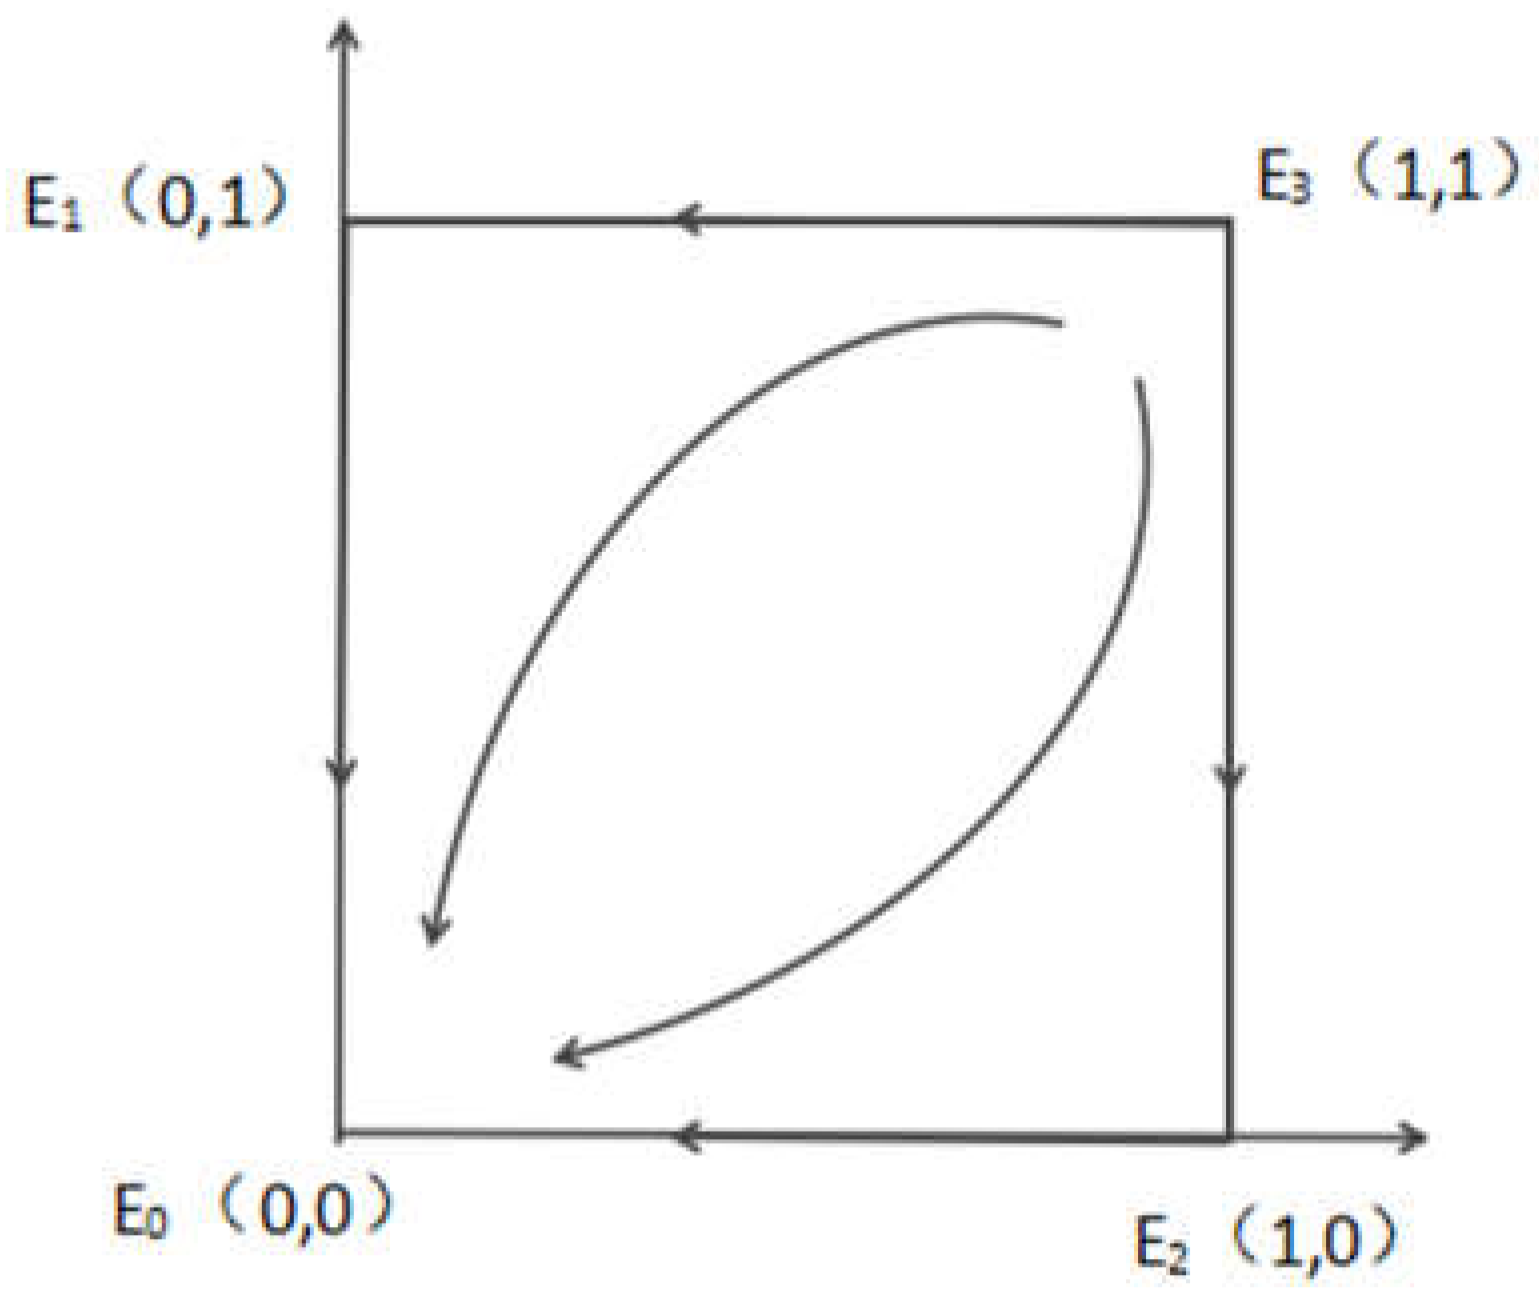
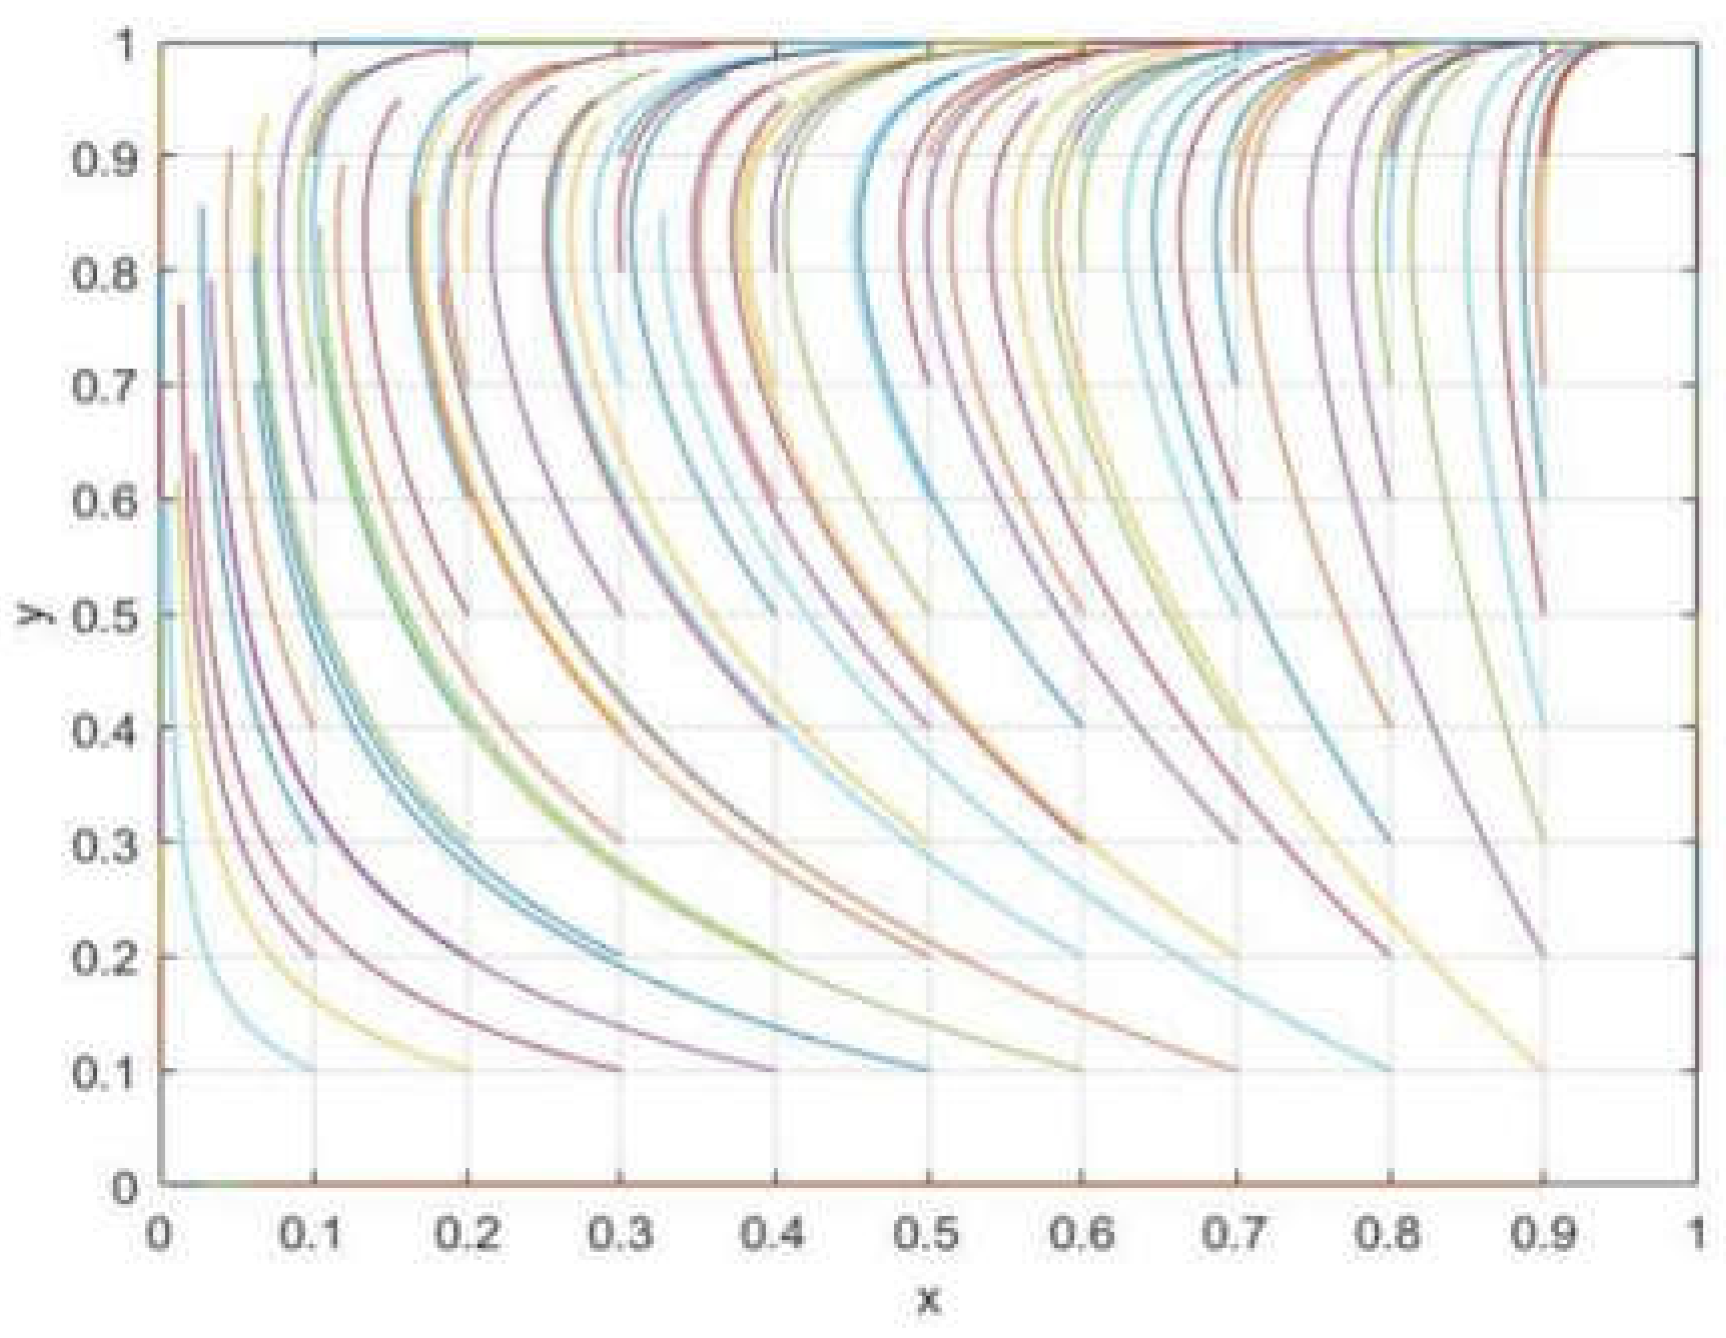
- (1)
When the income-increase rate of the reprocessing enterprise and the agricultural waste recycler from RSC optimization is low and the conditions
,
are met, this indicates that the revenue from RSC optimization for both parties does not significantly improve: the cost is greater than the increase in revenue, meaning that the evolutionary stability strategy for both parties is to not choose to optimize the RSC (as shown in
Figure 4). In the initial stage of RSC optimization, substantial investments in capital and technology are needed, with a low return rate in this stage. Therefore, it is appropriate for both sides to adopt a conservative strategy at this stage.
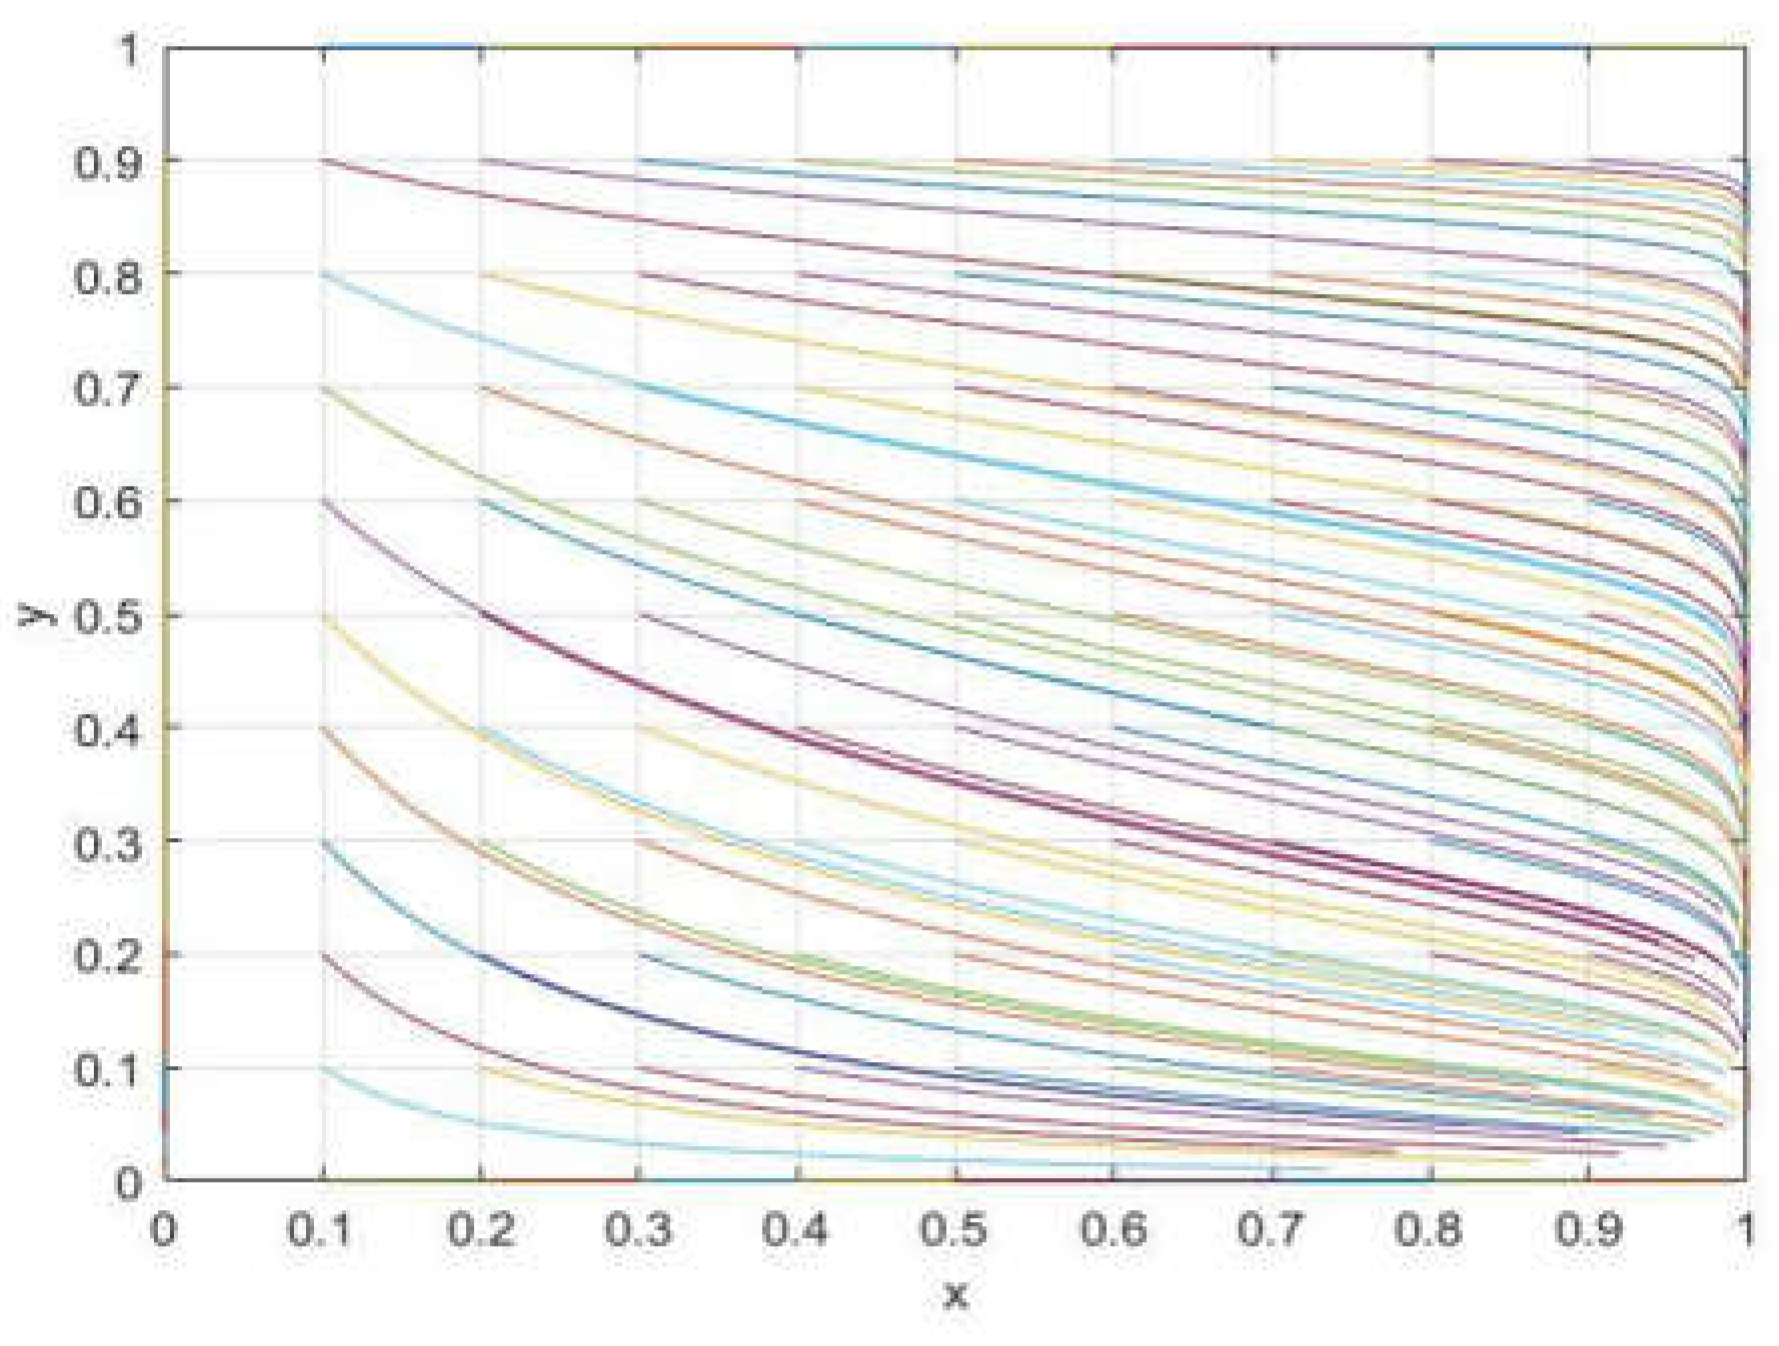
- (2)
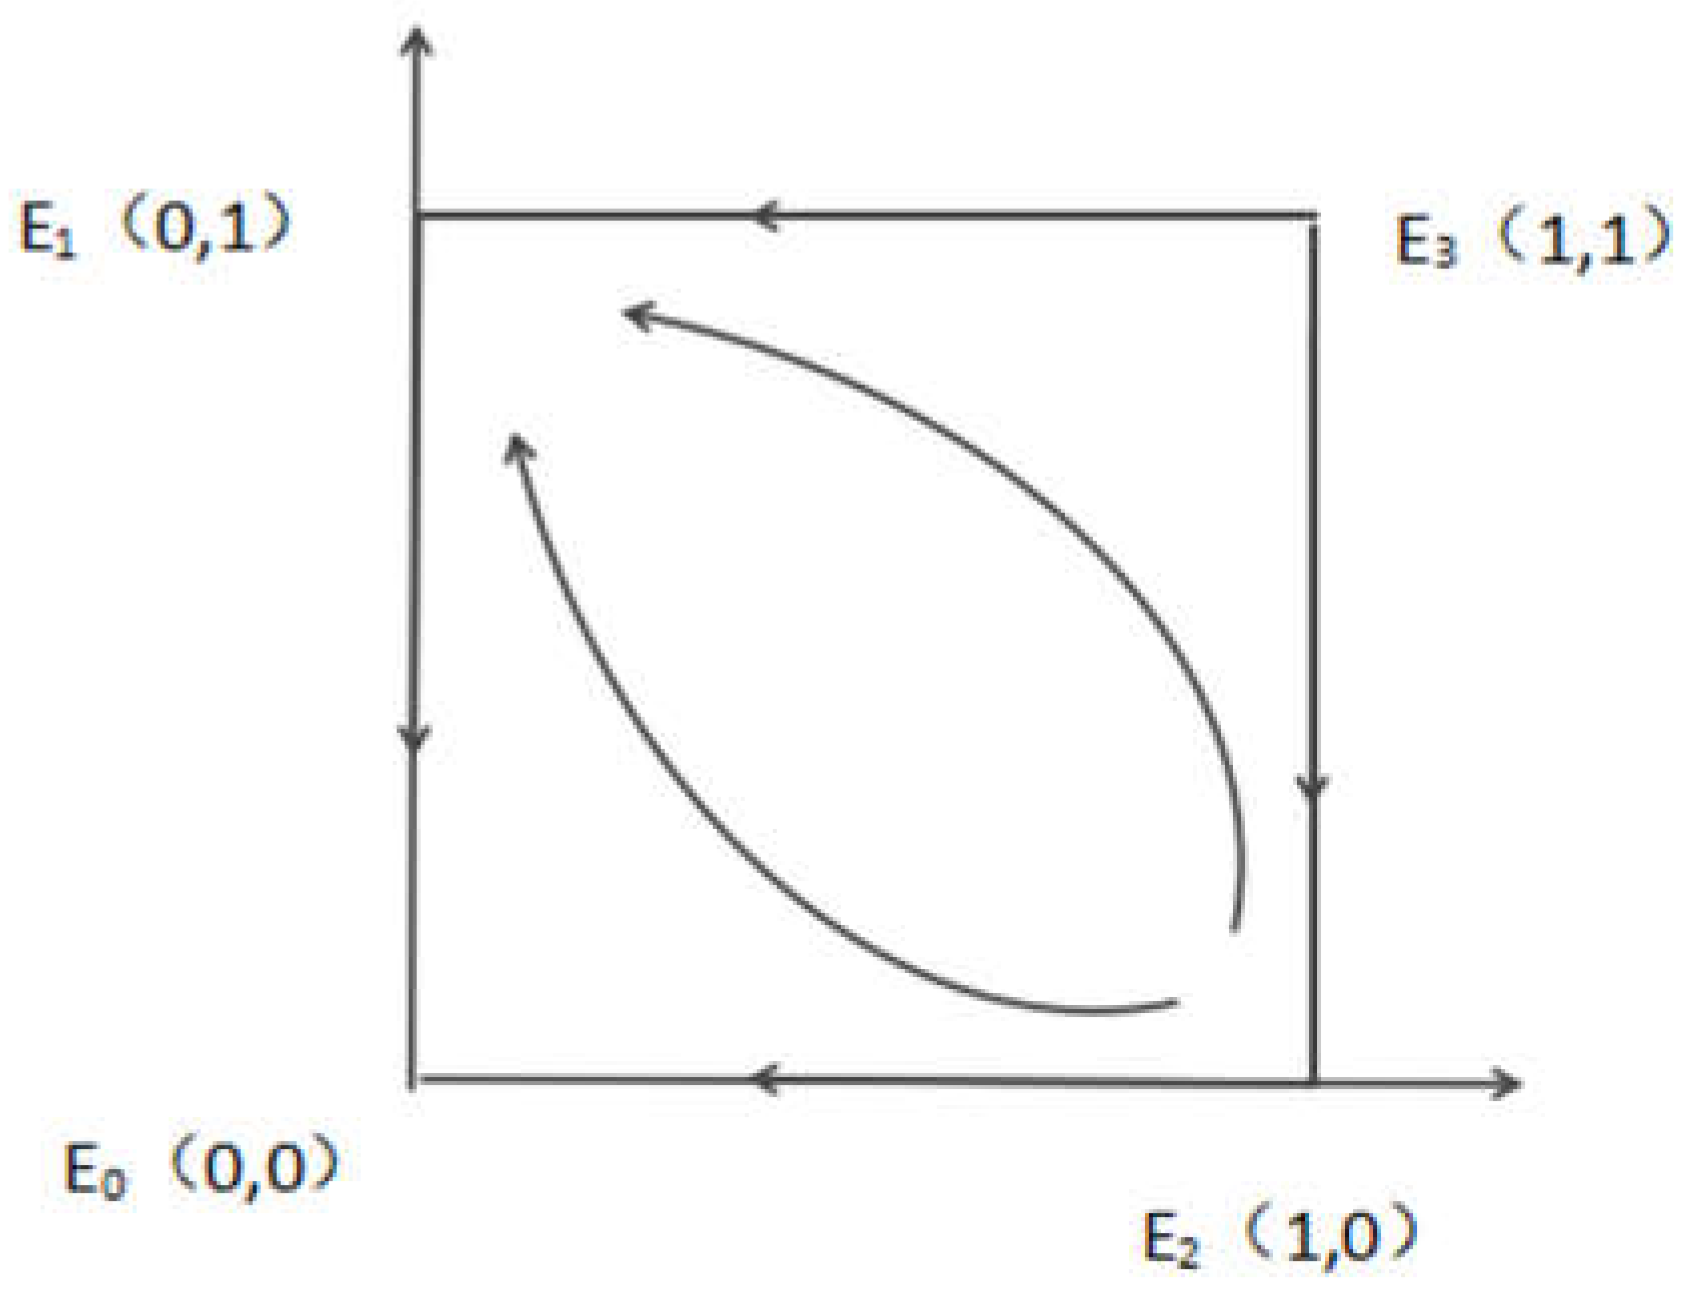
When
,
, point (0,1) becomes the evolutionarily stable strategy of the system; that is, the reprocessing enterprise chooses not to optimize the RSC and the agricultural waste recycler chooses to optimize it. Point (0,0) and point (1,0) are saddle points, and point (1,1) is an unstable point (as shown in
Figure 5). When the revenue-increase rate of the agricultural waste recycler (after choosing to optimize the RSC) reaches a certain threshold, where their total revenue is greater than the cost incurred, but is lower than the revenue of the reprocessing enterprise who also optimizes the RSC, the revenue-increase rate for both parties remains unchanged. The reprocessing enterprise’s benefits are far less than the cost involved, so they will not choose to optimize the RSC. Nowadays, the market mechanism of agricultural waste recycling is not good enough. Due to the optimization of the RSC, the efficiency of many processes, such as logistics transportation and the classification, inspection, and resale of agricultural waste, will be improved; thus, the agricultural waste recycler can obtain a bigger profit from it, so the agricultural waste recyclers will choose to optimize the RSC. However, the revenue-increase rate for the reprocessing enterprise is not enough to make the benefits of RSC optimization higher than the related costs, so the reprocessing enterprise will not choose to optimize the RSC.
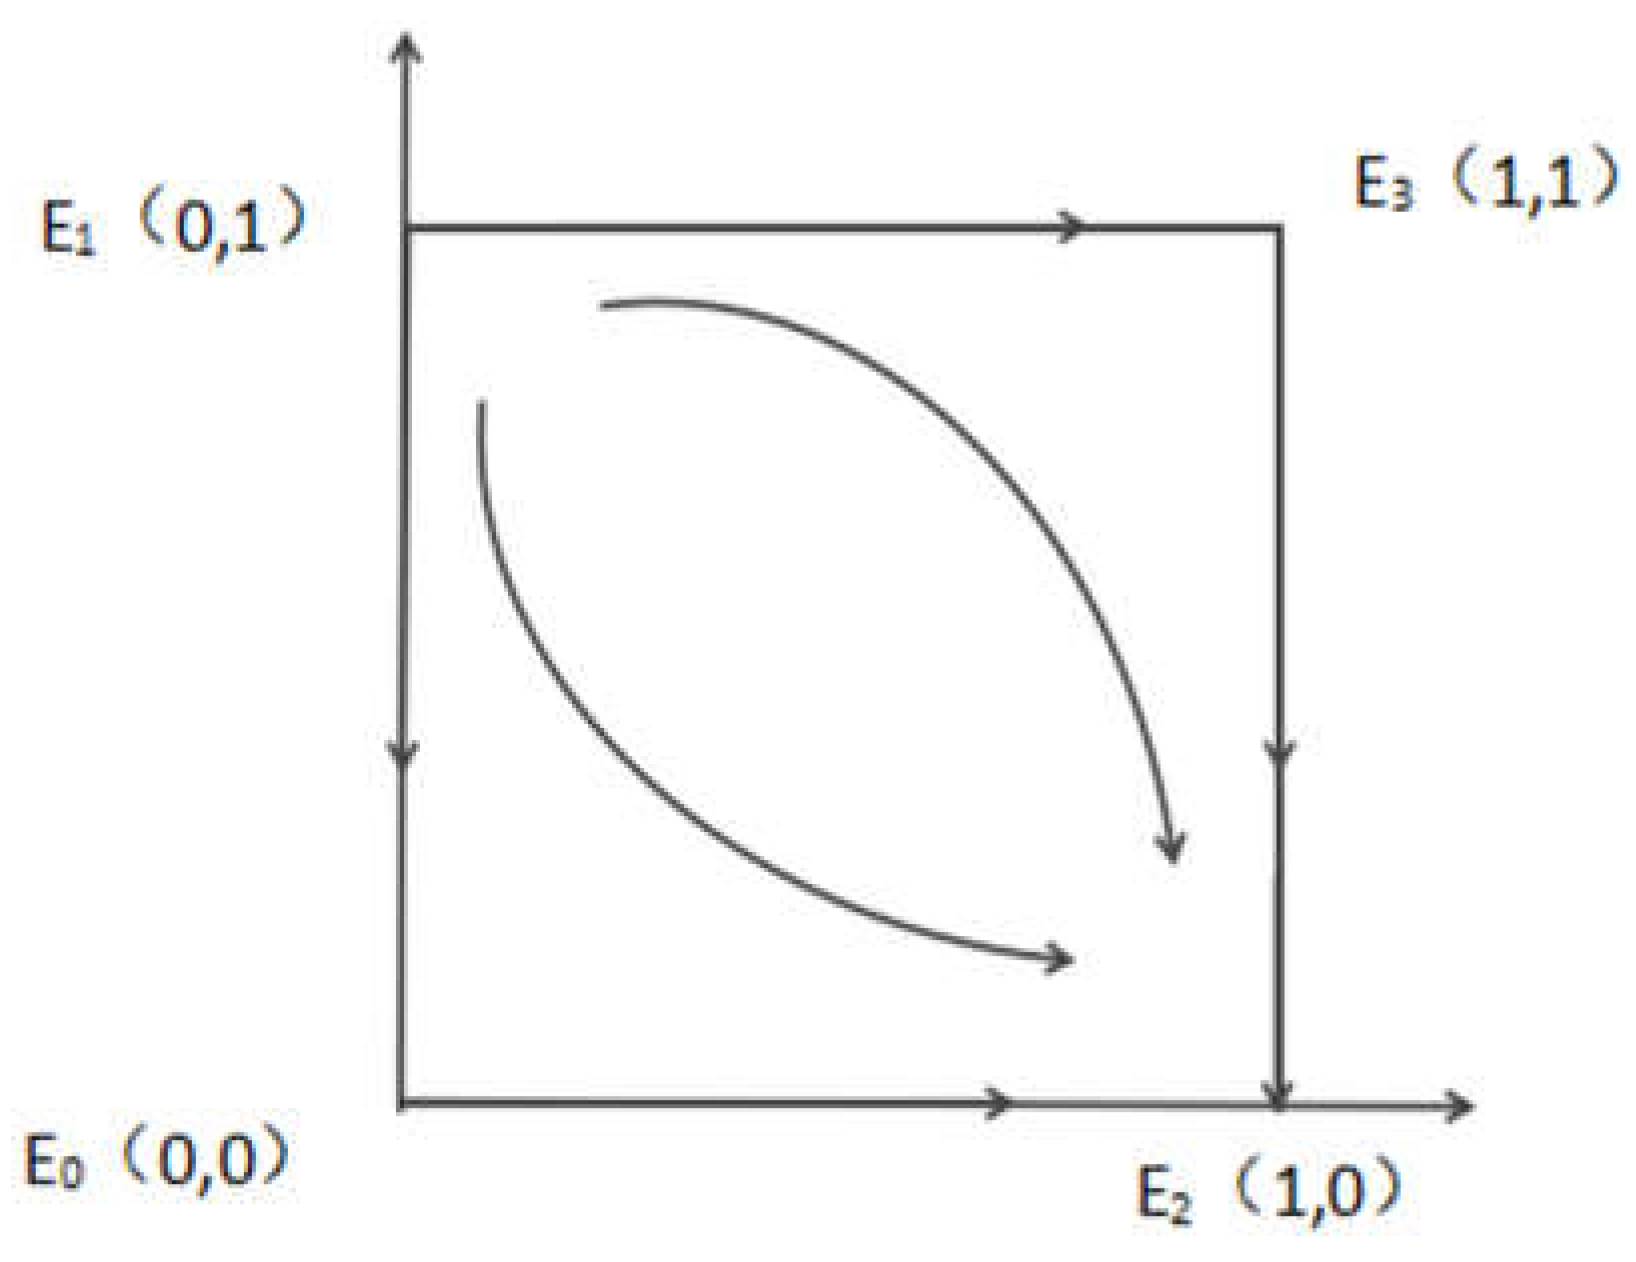
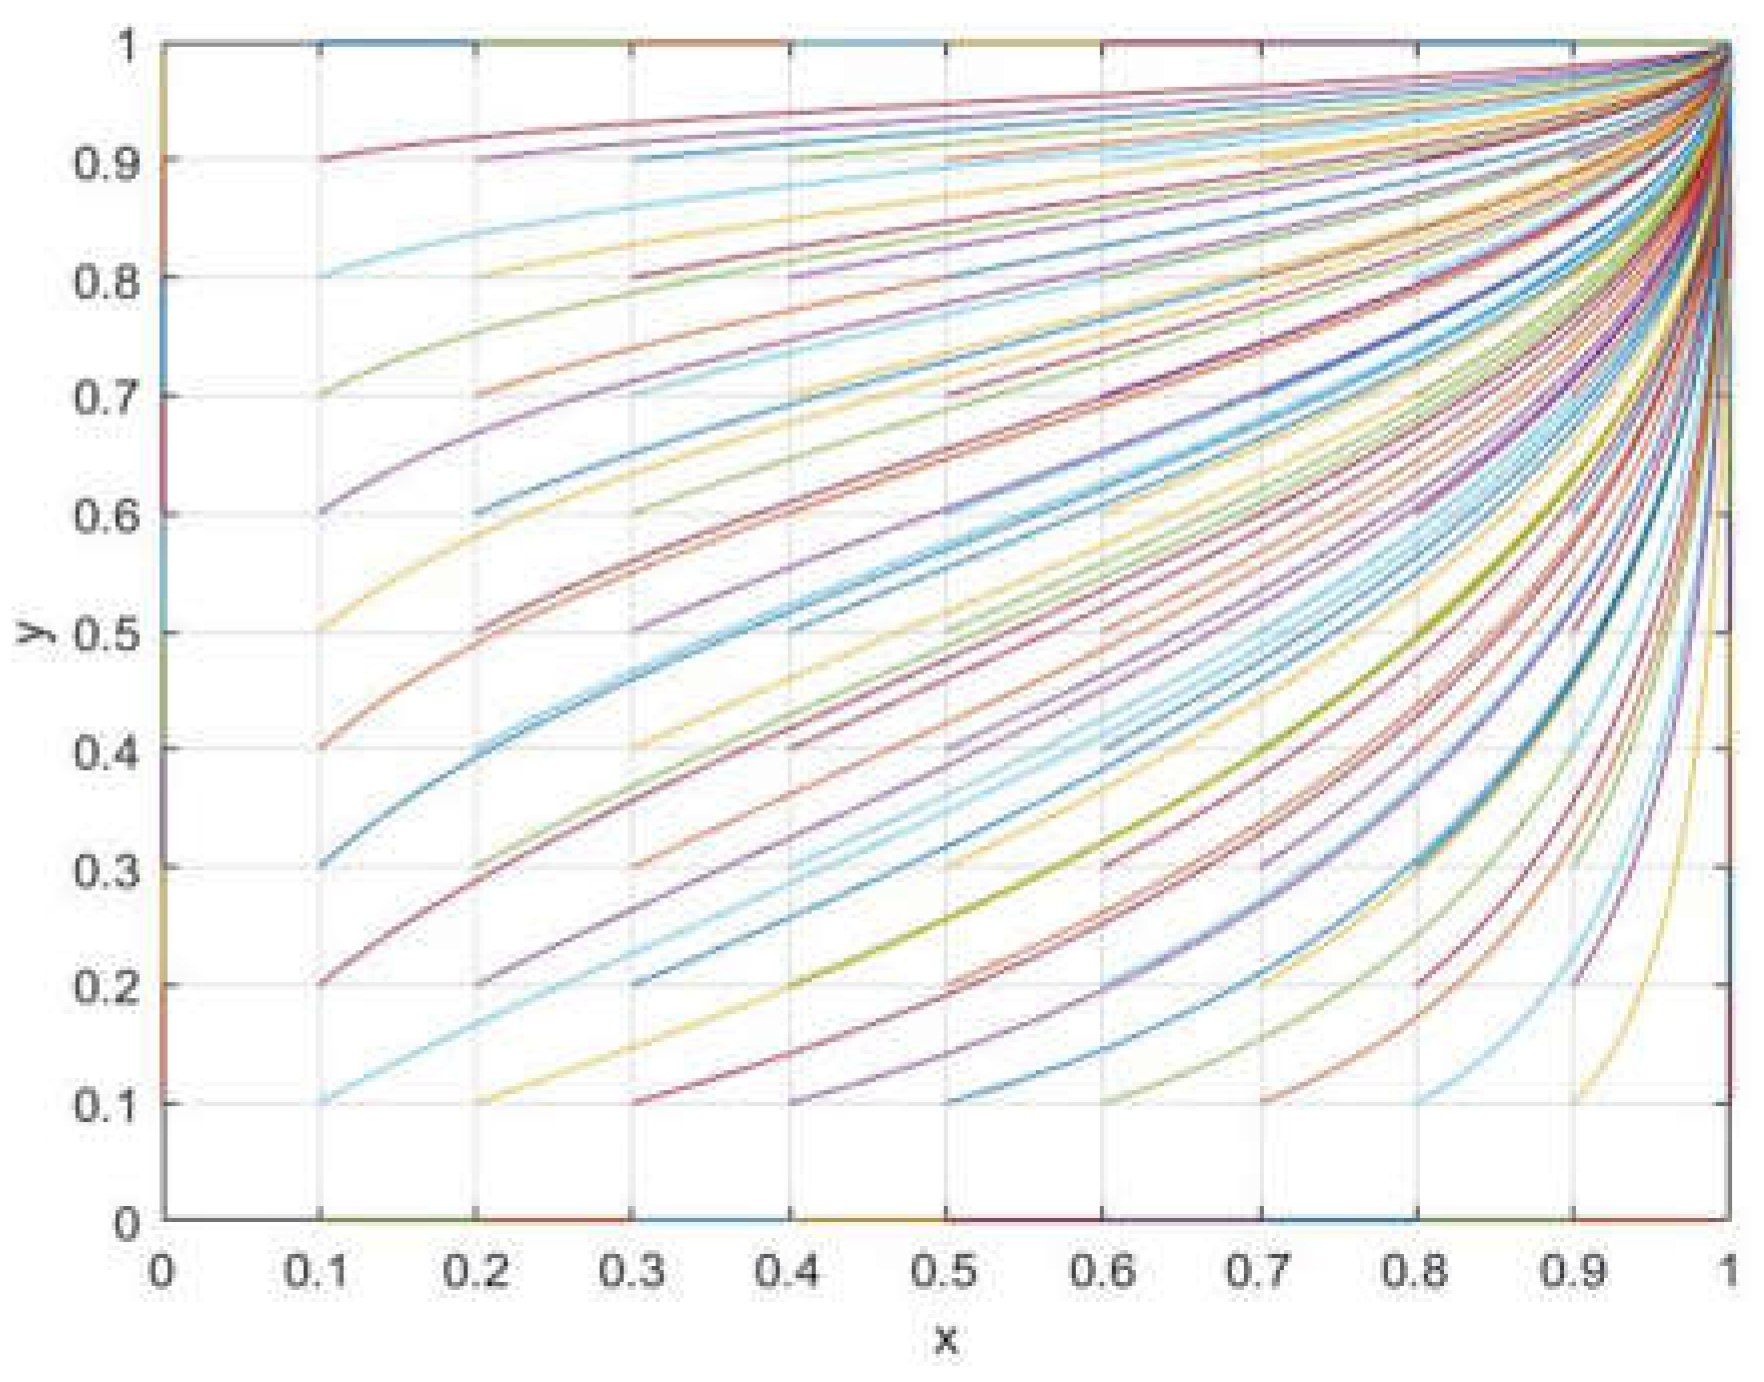
- (3)
When
,
, point (1,0) becomes the evolutionarily stable strategy of the system; that is, the agricultural waste recycler chooses not to optimize the RSC, and the reprocessing enterprise chooses to optimize the RSC. Point (0,0) and point (0,1) are the saddle points, and point (1,1) is the unstable point (as shown in
Figure 6). In this scenario, the revenue for the reprocessing enterprise from RSC optimization is higher than the costs incurred, but is lower than the revenue of the agricultural waste recycler if it also chooses to optimize the RSC. In this case, the revenue-increase rate for the agricultural waste recycler remains unchanged, indicating that their revenue is far less than the cost. Consequently, the agricultural waste recycler will not choose to optimize the RSC.
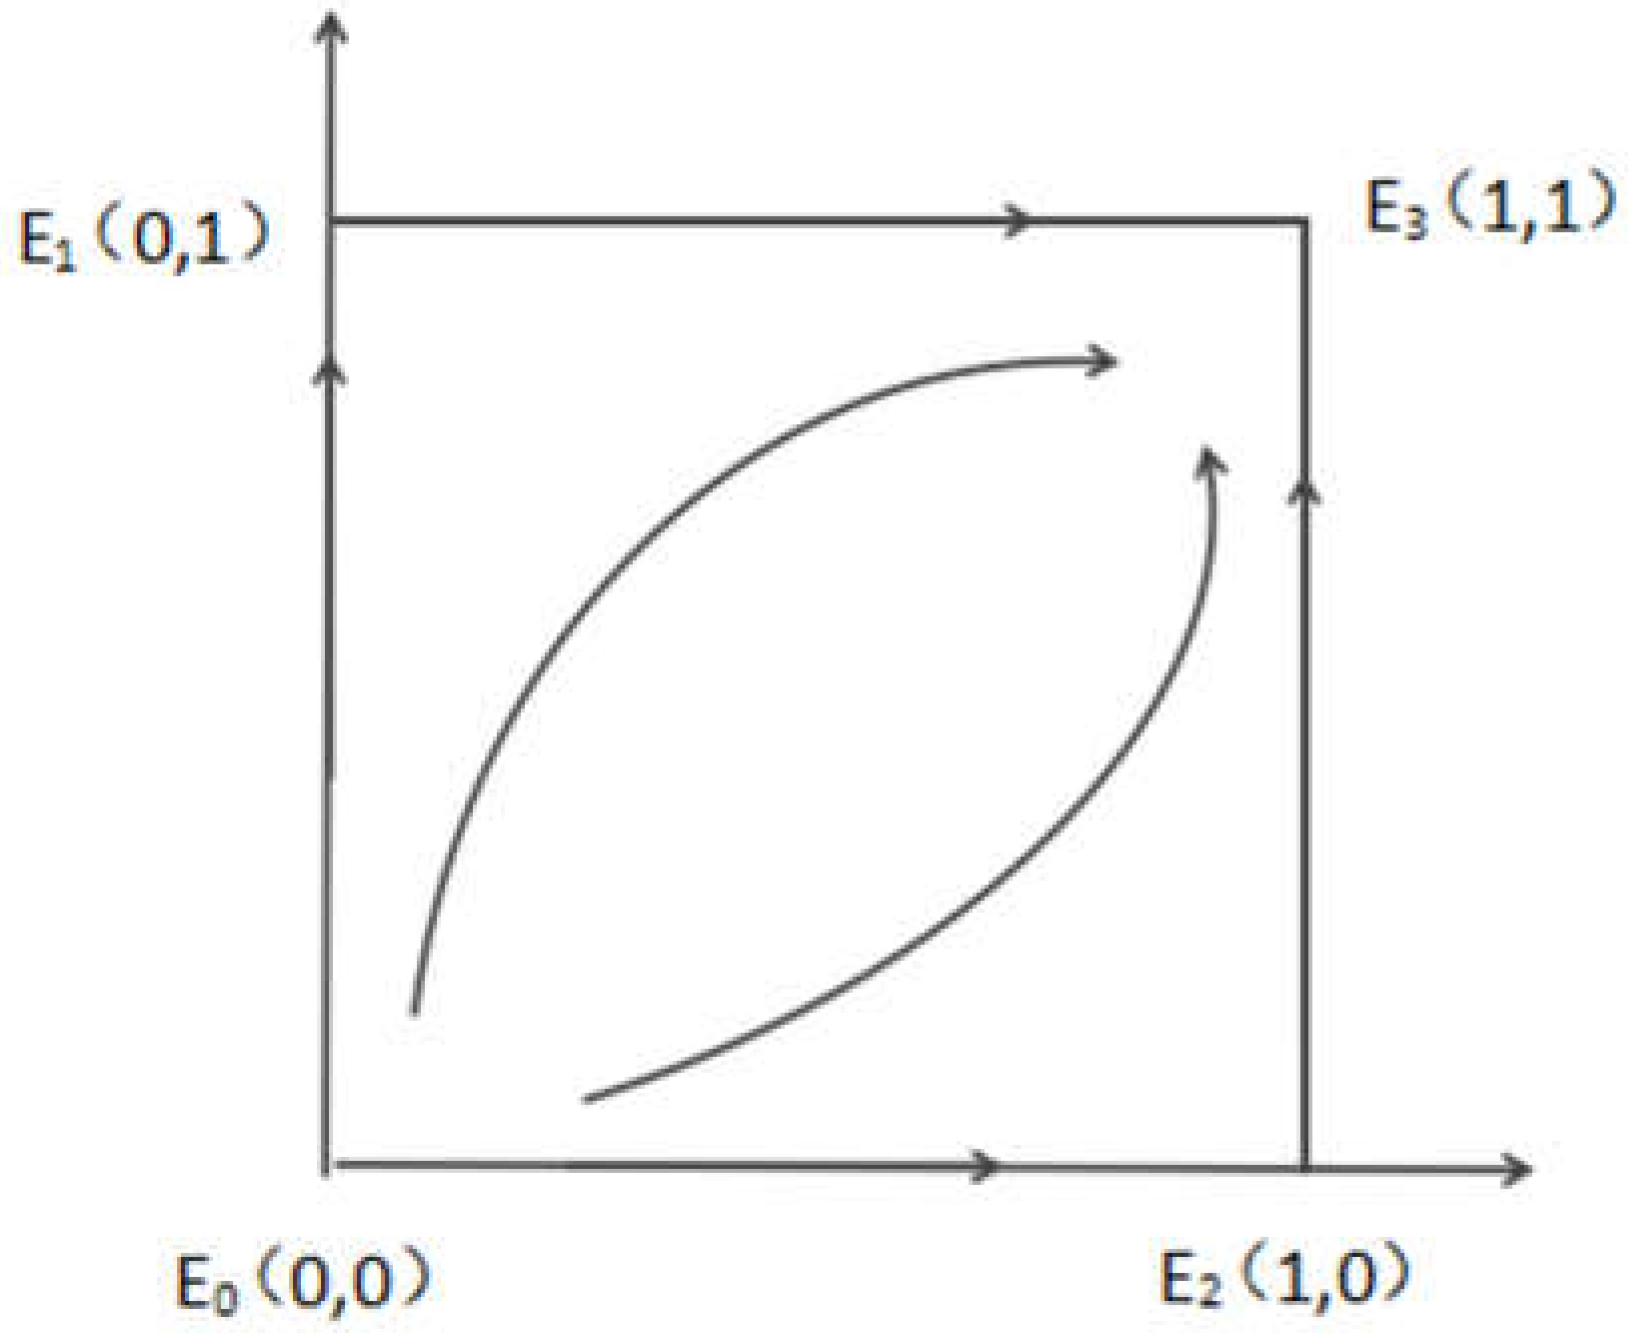
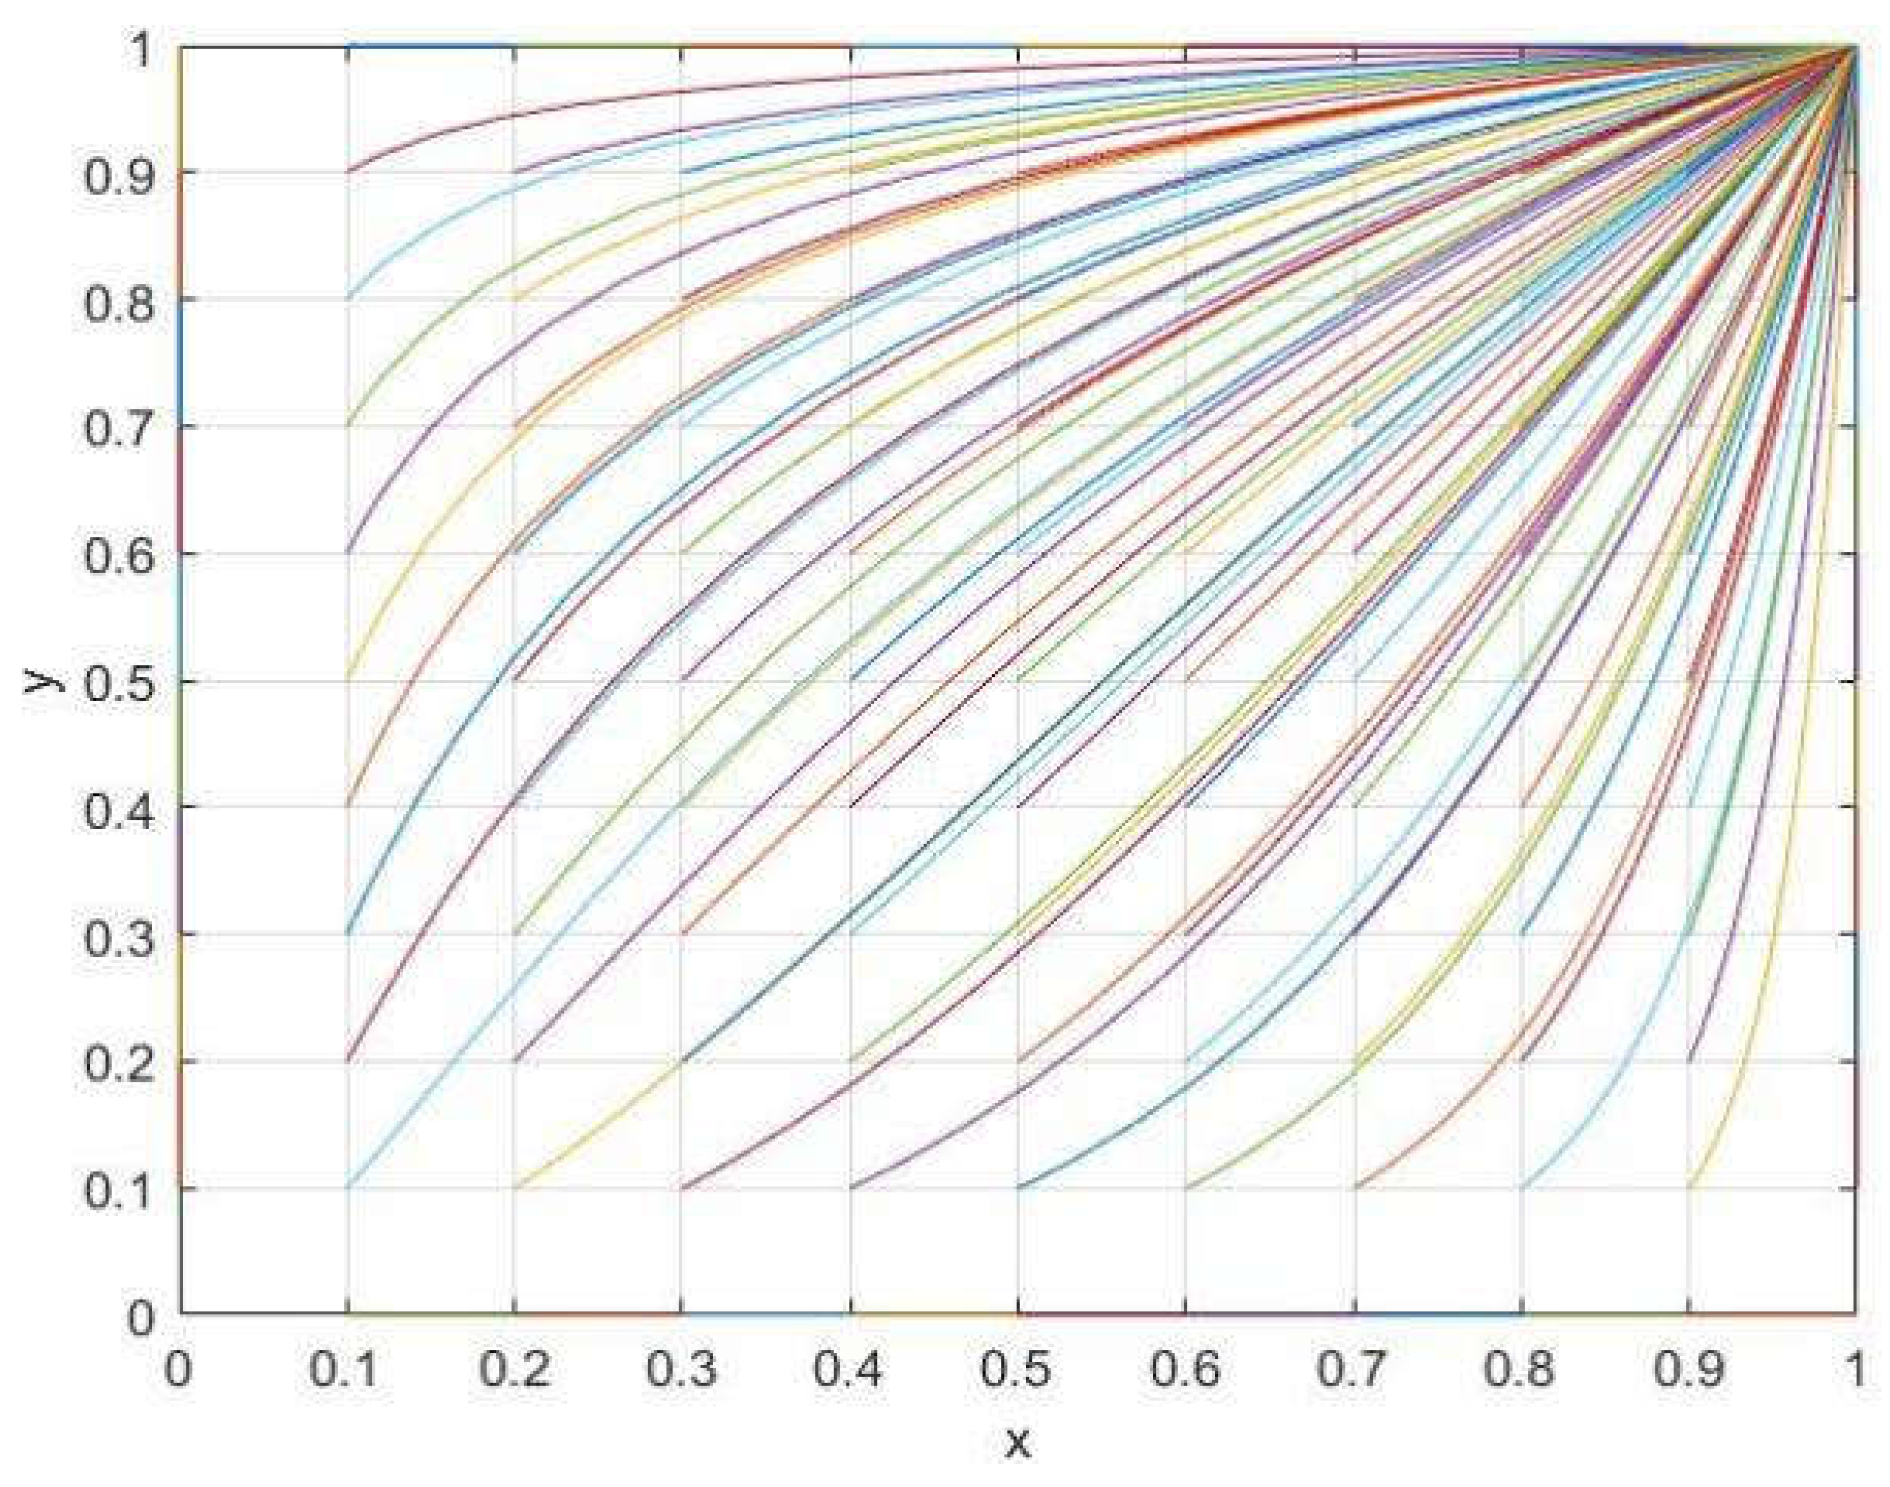
- (4)
When the income increase rate from RSC optimization for the reprocessing enterprise reaches a certain threshold,
,
, both parties in the game choose to optimize the RSC benefit, as the benefits outweigh the investment costs and the gains from mutual optimization are greater than those obtained from independent optimization. In this case, as shown in
Figure 7 point (0,1) and point (1,0) are saddle points, point (0,0) is the unstable point, and point (1,1) is the evolutionary stability strategy of the system; that is, both the reprocessing enterprise and the agricultural waste recycler choose to optimize the RSC.
After the optimization of the RSC, the processing and production costs incurred by the reprocessing enterprises will be reduced, and they can obtain more revenue under the premise of the same sales price. As the recycling of agricultural waste is in line with the concept of circular economy, it can facilitate agricultural waste reuse and resourcefulness and improve the utilization rate of the resources. This can increase the purchasing power of the consumers, and the sales volume of the reproduced products will increase, which will improve overall revenue. The optimization of the RSC for agricultural waste recyclers will improve the efficiency of logistics such as transportation, agri-waste sorting, agri-waste inspection, and agri-waste sales. The RSC for circulation efficiency is conducive to the formation of a higher-quality agricultural waste reverse recycling market. This can be well coordinated to allocate the interests of members of the various segments, thus ensuring the smooth implementation of the model, which is conducive to the maintenance of the entire RSC. It is conducive to maintaining the sustainable operation of the entire agricultural waste RSC model, and the improved efficiency of the RSC processes will enable the agricultural waste recyclers to obtain greater benefit from it. Through the optimization of the RSC, the agricultural waste recyclers can also minimize the pollution caused to the environment and increase the value of the agricultural waste available for use.
As shown above, when the reprocessing enterprise and the agricultural waste recycler optimize the RSC, it creates a virtuous cycle that maximizes benefits for both sides. The overall profit is far greater than if only one party or neither party chooses to optimize the RSC. Therefore, both the reprocessing enterprise and the agricultural waste recycler choose to optimize the RSC.
6. Evolutionary Game Analysis of Agricultural Product Producers and Waste Treatment Enterprises Under the Government Subsidy Mechanism
From the analysis above, the reprocessing enterprise and the agricultural waste recycler will only benefit from RSC optimization when the rate of revenue increase reaches a certain threshold. At this point, the benefits will exceed the costs invested by the enterprises in RSC optimization. As a result, incomes are higher compared to the scenario where only one party chooses RSC optimization. Although RSC optimization can reduce resource waste and pollution, as well as improve the value of agricultural waste, sole reliance on the enterprise to promote this process may give rise to negative sentiments from both sides. Therefore, the government must ensure that the benefits outweigh the costs through subsidies and other means. This will help improve the willingness of enterprises to choose RSC optimization.
In the case of biogas power plants in Taiwan, the generation revenue was calculated based on the biomass subsidy in 2018. With the subsidy’s price support, the three biogas power plants’ power generation revenues were much higher than the power generation costs. The estimated costs of the three biogas power plants are TWD 3.0758, 3.9347, and 2.9061/kWh, and the benefits are TWD 5.0161, 5.0161, and 5.0106/kWh. The normal electricity price in 2018 was TWD 2.8409/kWh. Suppose there is no policy support for biogas power generation. In that case, the unit benefit of the biogas power plant will be reduced from TWD 5.0161/kWh to TWD 2.8409/kWh, which is lower than the unit power generation cost. In other words, livestock manure biomass power generation without price support is unprofitable. The feed-in tariff for biogas power generation from anaerobic digestion facilities increased by TWD 5.0874/kWh in 2019, and the increased tariff provides incentives for enterprises or farms to invest in agricultural waste biogas power generation. According to the input proportion of agricultural waste (e.g., manure, biogas, crop residues, etc.), the installed capacity of biogas plants, and the use of biogas liquid or digestate on farms, differentiated feed-in tariff subsidies for biogas power generation are set up. This initiative will increase the input proportion of agricultural waste and the cost-effectiveness of biogas power plants, at which time the enterprises’ revenues are higher than their input costs. Government subsidies can promote the use of reuse-derived fuel products and increase consumer demand, thus increasing the recycling rate of agricultural waste and corporate revenue [
49]. This example is consistent with the government subsidy impact mechanism studied in this paper.
Under the government subsidy mechanism, the two sides in the evolutionary game are still the reprocessing enterprise and the agricultural waste recycler, both of which are limited and rational. The strategies adopted by each side will be adjusted according to the strategy chosen by the other party to maximize their own benefits.
The strategy set for both the reprocessing enterprise and the agricultural waste recycler includes {optimize the RSC; do not optimize the RSC}. Based on the original revenue matrix, we incorporate government subsidies Sy for enterprises that choose to optimize the RSC to obtain the benefit matrix for the reprocessing enterprise and the agricultural waste recycler under the government subsidy mechanism, as shown in
Table 3.
At this point, the replication dynamic equation for the evolutionary game system that involves a reprocessing enterprise and an agricultural waste recycler is:
For the partial derivatives of
x and
y in the above system of dynamic equations, the Jacobi matrix is:
Under the government subsidy, the equilibrium points of the system are (0,0), (0,1), (1,0), and (1,1). When (1,1) is the stable equilibrium point, det
J is positive and tr
J is negative, according to the Jacobi matrix in Formula (12):
Given the above conditions, it can be inferred that , .
From the above analysis, if the government encourages both the reprocessing enterprise and the agricultural waste recycler to optimize the RSC, the government’s subsidies must be higher than the benefits gained by one side from RSC optimization while the other is not. Moreover, the subsidies should cover the investment costs of both parties. Only when the government subsidies meet these two points can the strategies of both sides evolve towards the {optimize the RSC; optimize the RSC} condition.
Due to the upgrading and optimization of the RSC system in recent years and the attitude of consumers wanting to protect the environment increasing, more and more consumers will choose to buy recycled and reprocessed products when there is no difference in the quality of the products, thus minimizing the pollution caused to the environment and increasing the usable value of agricultural waste. This reduces the production cost of the relevant products and increases the profitability of enterprises. In the whole dynamic operation process, this not only promotes economic growth but also raises people’s awareness of environmental protection, so the government should encourage reprocessing enterprises and agricultural waste recyclers to optimize the RSC and provide certain subsidies for this purpose so as to ensure the normal operation of the program.
7. Simulation Analysis
To more intuitively observe the strategy evolution trajectory of both sides in the game in the RSC of agriculture waste, numerical analysis was conducted using MATLAB R2018b software according to the evolution model shown in
Table 2 and
Table 3.
- (1)
The assumed parameters are set to:
The experimental results are shown in
Figure 8. The results indicate that the final stable point of both sides of the game is point (0,0) and the evolutionary strategy is (do not optimize the RSC; do not optimize the RSC), which is consistent with the conclusion in
Figure 3.
- (2)
The assumed parameters are set to:
The values conform to Proposition 2 when
,
. The experimental results are shown in
Figure 9. The results show that the final stable point of both sides of the game is point (0,1), and the evolution strategy is (do not optimize the RSC; do not optimize the RSC).
- (3)
The assumed parameters are set to:
If the values satisfy Proposition 3, then
,
. The experimental results are shown in
Figure 10. The results indicate that the final stability of both sides of the game is point (1,0) and the evolutionary strategy is (optimize the RSC; do not optimize the RSC).
- (4)
The assumed parameters are set to:
If the values satisfy Proposition 4, then
,
. The experimental results are shown in
Figure 11. The results show that the final stable point of both sides of the game is point (1,1) and the evolutionary strategy is (optimize the RSC; optimize the RSC).
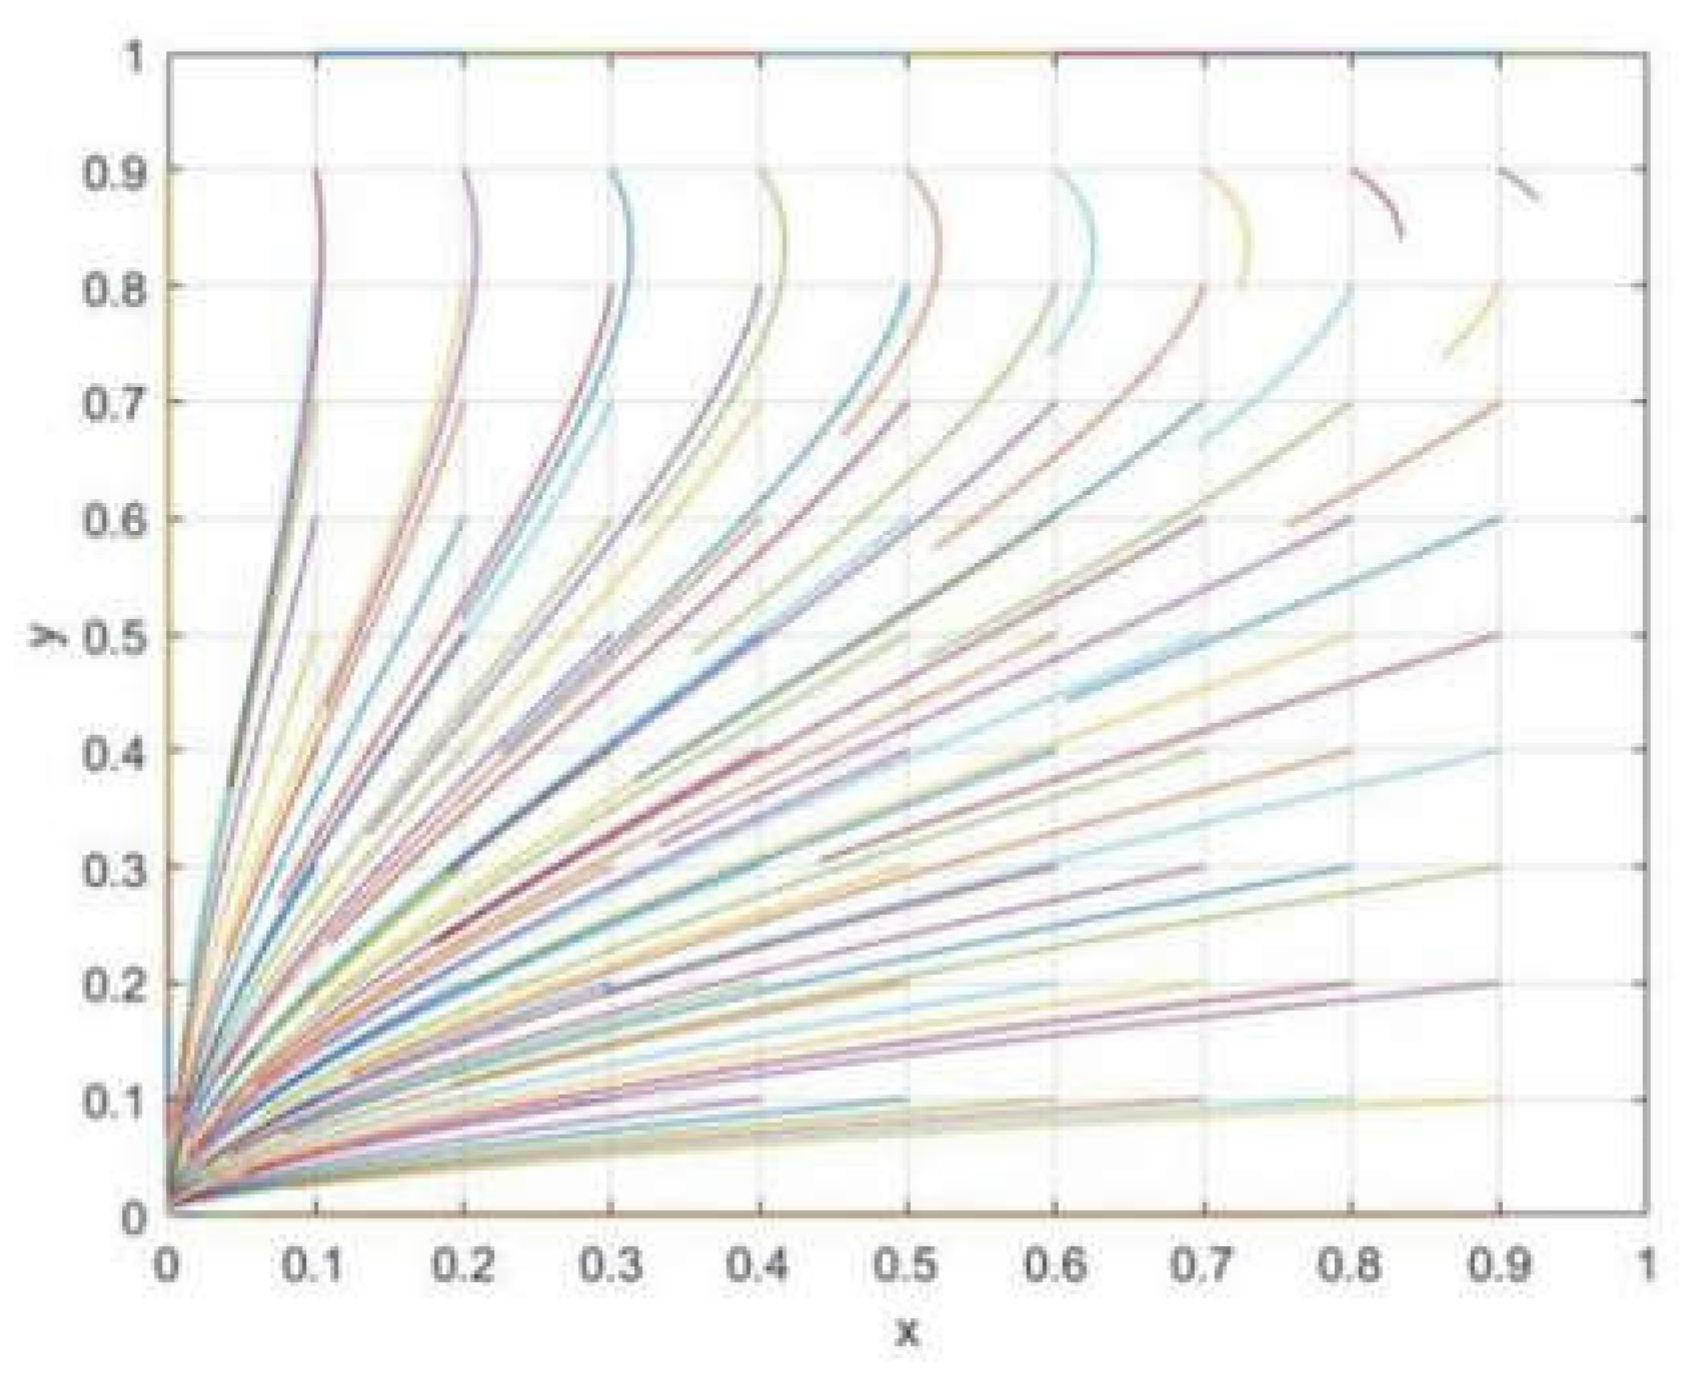
- (5)
The assumed parameters are set to:
Assuming that all other parameters remain unchanged, only the amount, S, of government subsidy given to the reprocessing enterprises and agricultural waste recyclers that optimizes the RSC is considered to assess its effect on the evolutionary outcome.
We added the government subsidy,
Sy, and the experimental results are shown in
Figure 12. According to the results of a comparison between
Figure 12 and
Figure 8, under the premise of all other parameters remaining unchanged, the provision of government subsidies encourages reprocessing enterprises and agricultural waste recyclers to optimize the RSC, and the two sides reach cooperation. In this case, the final stable point of the game is (1,1) and the evolutionary strategy becomes (optimize the RSC; optimize the RSC). Therefore, this demonstrates that government subsidies positively affect RSC optimization for both sides and can improve their economic benefits.
In addition, it can also be learned from the above simulation results that reprocessing enterprises react more strongly to government subsidies than agricultural waste recyclers. Before the government adopts the policy strategy of subsidizing enterprises that choose to optimize the reverse supply chain, the government’s subsidy is mainly a fixed subsidy for agricultural waste recycling enterprises. This is mainly used for the harmless treatment of agricultural waste that cannot be recycled, meaning that the government’s subsidy to enterprises that choose to optimize the reverse supply chain does not have much influence on the strategy choices of the recyclers. However, the reprocessing enterprises will choose to optimize the reverse supply chain only when the benefit obtained from optimizing it is higher than the cost paid. Then, the enterprise’s benefit is lower than when both parties choose to optimize the reverse supply chain at the same time. In
Figure 11 and
Figure 12, it can be seen that when the government gives subsidies to enterprises optimizing the reverse supply chain, the reprocessing enterprises will choose to optimize the reverse supply chain more positively than the agricultural waste recycling enterprises.
8. Conclusions
The decision of reprocessing enterprises and agricultural waste recyclers to optimize the RSC should not only be based on the consideration of enterprise benefits but also on the environmental impact of recycling. Using evolutionary games, we analyzed the influencing factors and conditions for the optimization strategy and, from this, we draw the following conclusions.
- (1)
The key factors affecting whether both parties choose to optimize the RSC are the revenue-increase rate γ for reprocessing enterprises and θ for agricultural waste recyclers after RSC optimization. Only when γ and θ reach a certain threshold will enterprises be driven to choose RSC optimization.
- (2)
Both sides are more inclined to jointly optimize the RSC when the government provides subsidies to reprocessing enterprises and agricultural waste recyclers that optimize the RSC.
- (3)
When the subsidy amount is fixed, reprocessing enterprises reach evolutionary stability faster than agricultural waste recyclers. Therefore, the government’s subsidy has a greater promotional effect on reprocessing enterprises than on agricultural waste recyclers.
The following management implications can be obtained from the analysis of the above conclusions. In the initial stage of agriculture waste, the government should encourage reprocessing enterprises and agricultural waste recyclers to optimize the RSC by providing subsidies to cover the additional costs incurred during optimization. As the reverse-recovery market for agricultural waste reaches a certain scale, the government should reduce the subsidies to avoid excessive dependence, thus forming a virtuous cycle. This approach will help to minimize resource waste and environmental pollution through improving the value of agricultural waste. At the same time, the two key actors in the RSC (reprocessing enterprise and agricultural waste recycler) can achieve the maximum benefits from RSC optimization.
In addition, the government can take regional measures and provide policy support for different types of agricultural waste in different areas. For example, for the main agricultural waste in the areas of planting and cash crop concentration for straw (with agricultural film and pesticide packaging waste), the government can make straw burning illegal and issue fines, and it can give subsidies to compliant recyclers. For large-scale breeding with the main agricultural waste from livestock and poultry manure, the government can subsidize through policies to promote the use of organic fertilizers and biofertilizers.
Optimizing supply chain cooperation among the participants in the reverse agricultural waste supply chain can not only increase their own income but also reduce the environmental pollution caused by agricultural waste and promote the sustainable development of agriculture. The content of this study mainly includes game analysis of the reverse supply chain of agricultural waste, with optimization strategies for the main parties. On the basis of enriching the reverse-supply-chain theory, we also establish a two-party evolutionary game model with and without government subsidy. This was used to compare and analyze the impact of government subsidies on the main decision-making of agricultural waste recycling enterprises and reprocessing enterprises in a more intuitive way, providing a theoretical basis for the government to formulate effective incentives. For other industries, such as the new-energy automobile industry, the evolutionary game model is also applicable: it could be based on the evolutionary game of new-energy automobile battery reverse-supply-chain optimization research, where the manufacturer and recycler choose whether to optimize the strategy. The replicated dynamic equations of the game process and simulation analysis could be constructed to analyze the optimization of the reverse-supply-chain cost and the government’s recycling. This study explored only two subjects in the reverse agricultural waste supply chain: reprocessing enterprises and agricultural waste recyclers. However, other subjects, such as transportation agencies, farmers’ markets, and farmers, also play a role. Future research should explore the cooperation mechanisms among these stakeholders to achieve mutual benefits and promote sustainable resource utilization.


