Abstract
This comparative study examines how geographic isolation and out-migrant motivations shape support systems in two aging, depopulated rural areas of Japan: Shimogo Town and Nanmoku Village. Challenging the prevailing policies’ focus on internal migration as the primary solution for regional revitalization, we highlight the “relationship population”—a specific group of out-migrated family members who maintain ties to their hometowns—and their diverse contributions to rural sustainability. We employed a mixed-methods approach, including quantitative analyses of aging-oriented household survey questionnaires (using multiple correspondence analysis, multinomial logistic regression, k-means, and two-step cluster analysis) and qualitative analyses of interviews with local government officials and residents (case studies in Nanmoku). Our analysis reveals contrasting support patterns: Shimogo exhibits a localized system driven by resident needs, while Nanmoku employs a strategic approach balancing practical support and community engagement. These findings underscore the limitations of one-size-fits-all migration policies and indicate the need for strategies tailored to the local characteristics of each community. By recognizing the diverse motivations behind hometown visits and the contributions to both residents and communities from the “relationship population”, this research advocates shifting the focus from promoting migration to the interplay of family ties, local support systems, and the agency of residents and out-migrated families. This perspective offers actionable insights for policymakers, local leaders, and researchers working on rural revitalization.
1. Introduction
Rural decline is a global phenomenon linked to industrialization and urbanization and varies significantly across regional and local contexts [1,2]. The specific characteristics and severity of this decline vary greatly, especially in geographically remote peripheral rural areas [3] that face compounded challenges concerning their resource-dependent economies and limited infrastructure [4]. This issue, shaped by forces such as globalization, urbanization, and economic restructuring [5,6], extends beyond individual nations and reflects a global trend impacting various regions, including Europe, North America, and Asia [5,6,7,8]. In Southern Europe, rural depopulation is intensified by economic recession, austerity policies, and youth emigration [7], while in North America, rural areas face challenges such as agricultural restructuring and a decline in local industries. Similarly, in parts of Africa, rural areas face persistent challenges such as poverty, environmental degradation, and the out-migration of younger generations [5]. In China, rural hollowing, excessive land conversion, and inadequate infrastructure contribute to imbalanced urban–rural growth, exacerbating socioeconomic disparities and their related consequences [6]. Although rural–urban migration is often seen as problematic, it also facilitates resource flows and adaptation in affected communities, offering opportunities for redistribution [8]. The phenomenon of rural abandonment, often exemplified by the emergence of “ghost towns”, not only underscores the severe consequences of depopulation but also highlights the untapped potential for cultural-, heritage-, and tourism-based regeneration [9]. However, in regions undergoing significant economic and demographic transitions, such as mountainous rural areas, redistribution processes often fail to address challenges stemming from a limited local capacity, necessitating external support [10]. This issue highlights the critical need for innovative revitalization strategies tailored to the unique constraints of these areas. Thus, while the diverse manifestations of rural decline underline the need for tailored, actionable policies, the shared vulnerabilities of these regions call for strategies specifically targeted to their unique conditions.
The mountainous, depopulated rural areas of Japan provide a striking example of the unique challenges arising from both national and local contexts. As the world’s most rapidly aging society [11], Japan faces acute depopulation in its mountainous rural communities where long-standing family-based mutual aid traditions have been eroded by low fertility rates, rapid aging, and substantial youth out-migration [12,13]. Up until the economic bubble burst in the 1990s, Japan’s rural policies primarily ranged from large-scale infrastructure-focused efforts (“Chiikikaseika” [14,15], regional revitalization) to initiatives promoting in-migration (“Chihousousei” [16,17], regional creation). However, in mountainous areas, these policies often proved inadequate in terms of fully addressing the specific needs of aging, depopulated communities. This inadequacy stemmed from a limited scope, which focused on permanent migration, failing to acknowledge the larger depopulation trends since the 2000s and the consequently increasing need to support existing residents for a sustainable future [14]. This limitation of existing approaches necessitates a shift in perspective, changing from focusing on permanent in-migration to embracing a more flexible, mobile, and dynamic understanding of support systems to be used in supporting depopulated mountainous rural areas.
At the heart of this shift is the concept of the “relationship population”, a term broadly used by the Japanese Ministry of Internal Affairs and Communications (MIC) [18] to describe people with diverse relationships with rural communities that transcend a desire for permanent relocation. In this research, we focus on a specific subset of this “relationship population”: out-migrated family members (or “Tashutsushi”) who maintain active ties to their rural hometowns, primarily through regular visits [19]. Unlike permanent migration strategies, which rely on attracting new residents, the “relationship population” embodies a form of mobility that connects rural and urban areas through periodic hometown visits. These visits often provide essential informal care for elderly residents, addressing gaps left by weakened family-based support due to separate habitation and inadequate formal care services [13,18], but their contributions remain underexplored in both policy-related and academic discussions. This study directly addresses this gap by emphasizing the importance of out-migrants’ attachment and mobility [20] and revealing hometown visits as an often-overlooked but vital component for support. Addressing rural decline requires moving beyond simplistic urban–rural dichotomies [21]. The socioeconomic disparities within urban areas significantly contribute to rural shrinkage and the separation of family structures [22,23], leading to the exclusion of non-co-resident members from being considered part of the family unit. To move beyond this limited, co-residence-based viewpoint and to truly understand rural revitalization, it is necessary to acknowledge the diverse motivations for maintaining ties with rural areas [24,25,26], including non-economic factors such as lifestyle preferences, family obligations, and a desire to maintain cultural traditions [27,28,29,30] that influence support networks beyond co-residency.
Thus, this study positions the out-migrated family as the “relationship population” at the center of the rural sustainability discussion, shifting the focus from demographic decline to the interplay of family ties, local support systems, and mobility. This approach is intended to help us analyze how the relationship population’s specific motivations and patterns of hometown visits foster dynamic support systems anchored in community and family ties. We address these complex dynamics through three key research questions: (1) How do out-migrated family members provide informal care and contribute to rural resilience, and how do these contributions vary across different geographic contexts? (2) How do out-migration patterns (i.e., migration to metropolitan areas vs. local towns) shape familial and community support? (3) What policy implications emerge from these findings for rural revitalization strategies, particularly concerning future migration back to one’s hometown? These questions will guide this research, providing crucial insights for policy development and giving rise to more targeted approaches to integrating the “relationship population” into revitalization efforts.
2. Theoretical Frameworks
2.1. Overview of the Conceptual Frameworks
To effectively understand how to support sustainable aging amidst the challenges faced in Japan’s depopulated mountainous rural areas—where life is shaped by geographic isolation, dispersed settlements, infrastructure limitations [12], and reinforced cycles of economic and regional decline [31,32]—this study revisits and builds upon existing theoretical frameworks to provide new insights. This section integrates global and Japan-specific frameworks, as also summarized in Table 1, ultimately positioning the “relationship population” concept as a critical lens for understanding and sustaining rural support systems (Figure 1) while also exploring the potential of encouraging post-retirement migration through mobility-based hometown visits.

Table 1.
Comparative theoretical frameworks for supporting depopulated rural areas of Japan.
Figure 1.
The conceptual framework of this research highlights the interplay of rural challenges, migration patterns, and family support. This framework emphasizes the importance of the relationship population while also highlighting the limitations of current solutions by using a dynamic approach to depict the connection between migration trajectories and community sustainability, providing a basis for understanding the regional dynamics of the contributions of out-migrated families in Shimogo and Nanmoku.
2.2. Counter-Urbanization and “Denenkaiki”
Counter-urbanization refers to the movement of populations from urban to rural areas, as we outlined in Table 1, driven by lifestyle preferences, environmental concerns, and a desire for community-based living [24,26,27]. Existing studies, covering topics such as counter-urbanization [23], “back-to-the-land” movements [28], and lifestyle migration [29], largely focus on permanent relocation driven by lifestyle preferences. Even the Japanese concept of “Denenkaiki” (a return to idyllic rural life) [30] overlooks the dynamic, temporary mobility of the relationship population and its specific support contributions. This phenomenon has been extensively studied in Western contexts, particularly in Europe and North America, although the issue of accessibility—wherein rural areas often present an option for attaining improved living conditions and more favorable housing compared to overcrowded urban centers—is also relevant in this context [40,41]. Japan, influenced by global trends, incorporated counter-urbanization concepts into its early rural revitalization efforts, such as “Denenkaiki” (a return to idyllic rural life), which highlights the appeal of self-sufficiency, natural surroundings, and slower-pace lifestyles [30,33,36,37]. The dominant counter-urbanization narrative simplifies this process as a straightforward return to rural living, overlooking the complex interplay between rural mobility and local attachment [42,43,44,45]. However, the inherent Japanese concept of “Chien” [46], rooted in early cultural and social practices, reflects an understanding that maintaining ties with one’s hometown remains important even after outward migration. While the recognition of this concept allowed for emphasis to be placed on the value of relationships, it did not initially evolve into a broader framework for understanding how such ties could actively support and sustain rural communities.
2.3. The UIJ-Turn Migration
While counter-urbanization offers a valuable perspective on urban-to-rural migration, the UIJ-turn migration framework (summarized in Table 1), driven by a strong desire to achieve visible outcomes in boosting rural populations, pinned a great deal of hope on addressing regional demographic imbalances. In Japan, while population decline at the national level began in the mid-2000s, many regional areas, particularly rural ones, had already been experiencing depopulation since the late 1990s [47]. By the 2010s, the structural changes brought by population decline—such as widespread rural depopulation and an excessive concentration of people in the Tokyo metropolitan area—started to affect Japanese society as a whole. In response to these challenges, the government introduced the “Chihousousei” (Regional Creation) policy in 2014, which focused on promoting internal migration as a potential solution [15,16]. Japan developed the UIJ-turn migration framework to address urban–rural population flows. This model categorizes migration into three distinct types: (1) U-turn, that is, returning to one’s rural hometown after living in an urban area; (2) I-turn, i.e., moving from an urban area to a rural or urban one in which one has no prior ties; and (3) J-turn, that is, relocating to a local town nearby one’s rural hometown [33,34] (Table 1). This framework, refined through policy implementation and analysis, has demonstrated that U-turn migration—with its foundation in pre-existing local connections—is generally more stable and sustainable than I-turn migration, which lacks such relational ties [20,35], underscoring the significance of place attachment in fostering long-term settlement in rural communities.
Although UIJ-turn migration has shaped many local government initiatives, its focus on permanent relocation reveals a hesitance to fully address Japan’s population decline and changing societal dynamics. However, despite a decade of various “Chihousousei” initiatives implemented by municipalities across Japan, the persistent concentration of Japan’s population in the “Kanto Region” (the Tokyo metropolitan area)—where 35.3% of the national population resides, with Tokyo itself accounting for 32.5%—underscores the limitations of viewing the UIJ-turn framework as a panacea for nationwide depopulation [38,39]. Given Japan’s persistently low fertility rate and the continued population decline [39], municipal efforts to attract migrants have devolved into an ineffective zero-sum game.
2.4. The “Relationship Population” Concept
This is where the concept of the “relationship population” becomes crucial. Though existing approaches acknowledge that rural areas need support mechanisms, this need is often understood through the lens of “formal support only, or a permanent migration of new residents”, neglecting a group that is not physically present in communities. As defined by Japan’s MIC, the concept of the “relationship population” expands our understanding of rural population dynamics by recognizing individuals who maintain meaningful connections with rural areas beyond those connections established via permanent residency [18] (Table 1). However, despite being widely used in the existing policy discourse, the term “relationship population” is too broad and may include various types of relationships that do not necessarily translate to long-term support or engagement. Therefore, in this study, we focus on a specific subset of the relationship population: out-migrated family members who maintain strong ties to their rural hometowns through regular visits [19].
As shown in Table 1 and Figure 1, unlike UIJ-turn approaches, which focus solely on residents physically present in an area or rely on a relocation-driven migration framework, the “relationship population” framework emphasizes dynamic social ties as a complementary perspective. By understanding “U-turn like” hometown visit patterns (as highlighted in Figure 1 with respect to the UIJ-turn migration part), we seek to further explore the full spectrum of family and community ties and their potential for promoting post-retirement return migration. To further highlight the importance of mobility, we selected two contrasting rural areas for analysis: Shimogo, located far from metropolitan centers, and Nanmoku, situated within a metropolitan sphere. Therefore, in this paper, we aim to present those overlooked social forces provoking people to frequently—or less frequently—visit their hometowns, providing various forms of support while primarily residing in metropolitan or local urban areas. The following section will provide a detailed description of these two selected areas, highlighting their geographical contexts, transportation and accessibility, and key population dynamics.
3. Study Area
This comparative study focuses on two contrasting depopulated municipalities: Shimogo Town (Aizu Area, Fukushima Prefecture) and Nanmoku Village (Seimo Area, Gunma Prefecture). These municipalities were chosen for their contrasting demographic, geographic, and migration characteristics, making them ideal for a comparative analysis of hometown visit patterns and support dynamics (Table 2). Shimogo, located outside the Tokyo metropolitan area, exhibits dual migration patterns: out-migration to both nearby towns and the Tokyo metropolitan area. This region has placed great emphasis on farming and cultural activities, which are significantly supported by family members who return home [48]. Nanmoku, within the Tokyo metropolitan area but geographically isolated, has one of the highest aging rates in Japan and predominantly experiences local out-migration. Figure 2 and Figure 3 illustrate the contrasting geographic contexts and transportation networks of these areas, highlighting these factors’ potential influence on migration and return-visit patterns. To further highlight the shared challenge of depopulation and the local settings’ influences, Figure 4 shows the distribution of depopulated municipalities around both Shimogo and Nanmoku.
Table 2.
A comparison of the basic information for the two study areas: Shimogo and Nanmoku.
Figure 2.
The local context of Shimogo and Nanmoku, showing transportation networks. This map (created by the authors) shows the geographical locations of Shimogo Town in the Aizu Area (Fukushima Prefecture) and Nanmoku Village in the Seimou Area (Gunma Prefecture) in Japan. Shimogo, located in the Tohoku Region, is more remote but offers better transportation connectivity based on rail networks and accessible routes, whereas Nanmoku, which is geographically closer to Tokyo and located within the Kanto Region, is surrounded by mountainous terrain, which limits its overall accessibility. These contrasting geographic settings also shape these areas’ transportation structures, significantly influencing the frequency and feasibility of hometown visits.
Figure 3.
The locations of Shimogo Town and Nanmoku Village. This map (created by the authors) highlights the geographic positions of Shimogo (Aizu area, Fukushima Prefecture) and Nanmoku (Seimou area, Gunma Prefecture). The locations exhibit contrasting migration patterns: Shimogo’s out-migration to local towns and metropolitan areas versus Nanmoku’s predominance of metropolitan migration. This map provides visual context for this study’s comparative design.
Figure 4.
This map (created by the authors) shows the distribution of depopulated municipalities around Shimogo (Aizu area, Fukushima Prefecture) and Nanmoku (Seimo area, Gunma Prefecture). The MIC defines “depopulated areas” [12] as regions experiencing significant population decline, leading to reduced community vitality and limited public resources, as well as meeting certain demographic (population decline rate and aging rate) and financial criteria. Both Shimogo and Nanmoku are depopulated municipalities. Areas that partially meet these criteria are designated as “partially depopulated municipalities”; “designated municipalities” also face similar challenges, as shown in Figure 4.
As shown in Table 2, Shimogo Town, a government-designated depopulated municipality, is located in the easternmost part of the Aizu region in Fukushima Prefecture, bordering Tochigi Prefecture to the south (Figure 2 and Figure 3). Characterized by dispersed settlements and a reliance on nearby areas for resources, Shimogo is a mountainous area with limited access to vital services, such as healthcare, social services, and transportation (Figure 3). It is accessible by private railway, with connections from Tokyo via the Tobu Railway and from Aizu-Wakamatsu via the Aizu Railway, and it is about 37 km from the Shirakawa IC and 35 km from Aizu-Wakamatsu by car. The town’s economy is centered on traditional agriculture, forestry, and tourism (e.g., Ouchi-juku), and the region is known for local produce and traditional cultural events. There is an increasing trend in which new farmers focus on cultivating flowers to be sold nationwide. In 2020, the population of individuals aged 65 years and over in Shimogo constituted 45.5% of the total population, which is significantly higher than the averages of Fukushima Prefecture (33.8%) [49] and Japan (29.3%) [11]. The town has also experienced a decline of over 45% between 2005 and 2020. But the strong cultural heritage and festivals attract external engagement, and the town is known for its traditional cultural events and festivals.
Nanmoku Village, also a depopulated municipality located in Gunma Prefecture, is situated within the Tokyo metropolitan area but remains isolated in terms of its geographical characteristics (Figure 3 and Figure 4). Surrounded by other depopulated municipalities (Kanna, Ueno, and Shimonita, for which Figure 4 contains more information) within Gunma Prefecture, Nanmoku is characterized by mountainous terrain and limited transportation infrastructure, necessitating a more strategic reliance on both local and regional connections to urban hubs. Located approximately 150 km from Tokyo, Nanmoku is accessible via the Kan-etsu and Joshin-etsu Expressways, requiring over 2.5 h of travel time (including 135 km on toll roads), and travel via national highways can take up to 5 h (Table 2 and Figure 3). Nanmoku’s economy involves small-scale farming and local produce (e.g., flowers and konjac), which are mostly sold in urban centers. Nanmoku has one of the highest aging rates in Japan and experiences predominantly local out-migration [48,51] (Table 2). While it is geographically closer to Tokyo, its mountainous terrain leads to more social isolation and limited accessibility. The out-migrants are more influenced by both regional and metropolitan connections.
Shimogo and Nanmoku were chosen as contrasting cases to explore how different geographic contexts and out-migration patterns influence familial support. While both municipalities are mountainous and depopulated, they differ in terms of their proximity to local urban centers, their transportation infrastructure, and their reliance on different types of support. This contrast allows us to explore the complexities of rural sustainability and the role of the “relationship population” in different settings. Furthermore, it highlights the need for a multi-method approach to capture those differences.
4. Materials and Methods
In this study, we adopted a comparative, mixed-methods approach to investigate the role of out-migrated family members in supporting rural community resilience, building upon findings from our Shimogo study (Phase 1) [52] and extending the investigation to Nanmoku (Phase 2). Figure 5 provides a visual overview of our methodological path, which began with an exploratory phase in Shimogo (Phase 1), followed by a comparative analysis in Nanmoku (Phase 2). This comparison was made to reveal how geographic proximity, migration patterns, and aging populations shape family support dynamics.
Figure 5.
This flowchart outlines the methodological path of the study, ranging from the initial data collection in Shimogo (Phase 1) to the comparative analysis in Nanmoku (Phase 2). It highlights the key steps, methods, and focus areas of each phase and the way that data were used for further analysis. For detailed information about the data analysis methods, see Section 4.4.
4.1. Overview of Research Design
Phase 1—the Shimogo study: In this exploratory phase, we investigated the daily activities of elderly residents (aged 65+) and the support provided by out-migrated family members during hometown visits. Data were collected through surveys distributed to all eligible households and interviews with local government officials. The analysis of these data revealed four distinct types of return visits: obligation-driven, high-support, community-maintenance-focused, and leisure-oriented visits. These findings highlighted the significant influence of geographic proximity on the frequency and types of support provided.
Phase 2—the Nanmoku study: Building upon the Shimogo findings, in this phase, we focused on a geographically isolated area within the Tokyo metropolitan region with a high proportion of elderly residents. Data were collected through surveys (distributed to all households with the support of local officials) and semi-structured interviews with 12 resident families. Family members were categorized as either frequent (Family A) or less frequent (Family B) visitors based on survey responses. Here, we analyzed how this division of labor shaped the provision of caregiving, household support, and community engagement.
4.2. Questionnaire Design
As shown in Figure 5, the questionnaire was designed to capture objective behavioral indicators, rather than subjective satisfaction measures [53], and reduce the burden of aging respondents, focusing on daily activities, hometown visit patterns, and support behaviors. The questionnaire, which is available in Appendix A Table A1, was designed based on prior research and the relevant literature [52,54], including four types of daily life behaviors that potentially involve participation by both residents and out-migrated family members and are often considered key aspects of the unique characteristics of rural communities. These behaviors included essential activities (daily living, e.g., medical care and shopping), productive activities (e.g., farming and yard work), social and leisure pursuits (e.g., teatime with friends), and community engagement (e.g., community meetings, clean-up, and festivals) (Table 3); at the same time, we also considered the specific context of rural communities in Japan. The Shimogo questionnaire focused on resident households, while the Nanmoku questionnaire included questions specifically targeting out-migrated family members (Family A and Family B) to better understand their motivations and support behaviors.
Table 3.
Summary of questionnaire content in Nanmoku.
4.3. Data Collection
This study adhered to the ethical guidelines established by the Chiba University Research Ethics Review Committee, focusing on non-interventional research methods. All data collection and handling procedures complied with relevant university regulations, ensuring the privacy of all participants (see Institutional Review Board Statement).
In Shimogo, the survey was administered through the town office, ensuring participant anonymity and eliminating direct researcher contact (Figure 5). In Nanmoku, with village office approval, surveys were distributed directly to households, accompanied by a comprehensive written explanation of the study, the voluntary nature of participation, and measures for privacy protection (Figure 5). In total, we collected 378 completed surveys in Shimogo and 155 in Nanmoku. Basic descriptive statistics regarding the respondents in Nanmoku are presented in the Appendix A in Table A2, Table A3 and Table A4 (for the Shimogo data, see [52]). In Nanmoku, 12 resident families also participated in semi-structured interviews. All data collection and handling procedures complied with relevant university regulations, ensuring the privacy of all participants was maintained. All respondents were informed that returning completed questionnaires constituted consent. Further, all personally identifiable information was removed from the data before analysis. A total of 12 Nanmoku residents participated in the semi-structured interviews, and the cases presented in Section 5.4 were anonymized to protect participant confidentiality. Participation in both surveys and interviews was voluntary. These procedures ensured the ethical treatment of all participants and the integrity of the data collected for this comparative analysis of rural support systems.
4.4. Data Analysis
In this study, we employed a comparative, mixed-methods approach to investigate the role of out-migrated family members in supporting rural community resilience. The data analyses were conducted using IBM SPSS Statistics version 27.0.0.0. Figure 5 provides a visual overview of our methodological path. As shown in Table 4, to address the limitations imposed by using only categorical data and the lack of numerical variability, we employed a carefully designed, sequential multi-method approach, where each method was specifically chosen to build upon and address the limitations of the previous one.
Table 4.
Data analysis methodology framework: a sequential and progressive approach.
Detailed information on the data and analyses for Shimogo can be found in our previously published study [52], while all detailed analyses, tables, and figures for Nanmoku are provided in the Appendix A. The key steps of our data analysis, as Table 3 shows, included collecting descriptive statistics, which were used to summarize the characteristics of resident households, out-migrated relatives, and the support behaviors in both areas. Detailed descriptive statistics are provided in Appendix A Table A2, Table A3 and Table A4.
MCA was applied to identify key support dimensions, reflecting residents’ needs in Shimogo and the motivations and engagement behaviors of Families A and B in Nanmoku [55,56,57,58]. The full results of the Nanmoku MCA analysis are provided in the Appendix A in Table A5 and Table A6 for Family A and Table A10 and Table A11 for Family B, as well as in Figure A1 and Figure A3.
Multinomial logistic regression was used to examine the factors influencing hometown visit frequencies, focusing on the relationships between MCA dimensions and visit patterns for Shimogo families and Nanmoku Families A and B [56,57,58,59]. The detailed results of the regression analysis for Nanmoku are provided in Appendix A Table A7 and Table A12.
Cluster analysis was used to group relatives based on MCA scores [59], revealing distinct engagement patterns among Shimogo relatives and Nanmoku families (Section 5.3). K-means clustering was applied to Shimogo and Nanmoku Family A, while a two-step clustering approach was used for Nanmoku Family B. For the uneven K-means clustering distributions, we used two-step cluster analysis, which allowed us to analyze both categorical and continuous variables while identifying clusters automatically [60,61,62]. The detailed results of the cluster analysis are provided in Appendix A Table A8 and Table A9 for Family A, Table A13, Table A14 and Table A15 for Family B, and Figure A2 and Figure A4.
The qualitative analysis involved the thematic coding of the interview data from Nanmoku, offering insights into motivations, support dynamics, and intergenerational contributions. Case studies were conducted to contextualize the quantitative findings (Section 5.4). Visualizations support these analyses, including a Sankey diagram [63] (Section 5.2) illustrating the flow of support behaviors to MCA dimensions and maps (Section 5.1 and Section 5.3) highlighting geographic contexts and pathways of engagement.
In this study, we compare Shimogo’s localized support networks with Nanmoku’s more strategic and regionally distributed systems to reveal how differing community needs and out-migrated relatives’ motivations shape rural resilience strategies.
5. Results
5.1. Geographic Context, Out-Migration, and Frequent Visitor Patterns
This section presents a comparative analysis of household structures and support networks in Shimogo and Nanmoku, illustrating how contrasting forms of geographic isolation shape both household demographics and the nature of support provided in these depopulated rural areas. Shimogo, located in the easternmost part of the Aizu region in Fukushima Prefecture, exhibits a form of localized isolation defined by its remoteness and dispersed settlements, leading to a reliance on nearby areas for resources. Nanmoku, situated in the westernmost part of the Seimo region in Gunma Prefecture, exhibits a different form of geographic isolation. Despite being within the Tokyo Metropolitan region, it is characterized by a mountainous terrain and limited transportation infrastructure, necessitating a more strategic reliance on both local and regional connections to urban hubs. These distinct forms of isolation shape the patterns of out-migration and the support networks that emerge in these two areas.
These distinct forms of isolation significantly influence the dynamics of household composition, the age profiles of residents, and the strategies for accessing external support.
5.1.1. Resident Characteristics and Geographic Context
The contrasting forms of geographic isolation influence household structures and support mechanisms, as detailed in Table 5. Shimogo’s localized isolation is reflected in its higher proportion of multi-senior households (53.5%), which are reliant on local support, while Nanmoku’s mountainous isolation and higher aging rate are reflected in a significantly greater reliance on peer support networks and a greater proportion of single-senior household members aged 80 and over (73.5%). Despite these differences, both communities show comparable levels of need for support, indicated by a similar reliance on formal support services (Shimogo: 13.4%; Nanmoku: 13.0%). However, they diverge in terms of their access to support and the ways in which they engage with these systems. Shimogo residents exhibit greater self-reliance (64% self-help), while Nanmoku residents utilize combined support systems more frequently (39.4%), underscoring the influence of geographic accessibility on their respective support strategies.
Table 5.
Characteristics of resident households in Shimogo and Nanmoku.
5.1.2. Out-Migration Patterns and the Geography of Frequent Visitors
The contrasting forms of geographic isolation shape the kinship networks and patterns of hometown visits. Table 5 and Table 6 and Figure 6 demonstrate that in Shimogo, 91.3% of the most frequent visitors (monthly or more) were localized within the Aizu area, particularly Aizuwakamatsu City, illustrating a strong reliance on a localized support network. In contrast, Nanmoku had a more strategic pattern, with frequent visitors (Family A) roughly split between nearby Tomioka (28.6%), a locally accessible city, and Takasaki (28.6%), a major transportation hub with regional connections. Conversely, a greater proportion of less frequent visitors (Family B) from Nanmoku are found in the wider Gunma region (11.0%) or the more distant Tokyo Metropolitan Region (22.9%). Despite these differences in migration choices, both Shimogo and Nanmoku reveal evidence of sustained connections with hometowns through regular visits. Within Nanmoku, while children are the predominant family tie for both Families A (71.9%) and B (68.3%), suggesting their shared primary responsibility for familial support, siblings represent a significantly higher proportion of Family B (24.4%) compared to Family A (15.7%). While Nanmoku is located within the Tokyo Metropolitan area (“Kanto” Region), Figure 6 clearly demonstrates that it is primarily the regional connections within Seimou, not proximity to Tokyo itself, that are most strongly associated with frequent visits. Furthermore, while family reunions were the most reported purpose for visits (approximately 83%), Nanmoku Family A shows significantly higher involvement in practical support activities (chore support, farm work, and grave visits) than Family B, highlighting the multifaceted nature of their sustained engagement in family and community life.
Table 6.
Characteristics of relatives in Shimogo and Nanmoku.
Figure 6.
This bar chart displays the geographic locations of relatives who visit their hometowns monthly or more often, presented as a percentage of the total monthly or more-frequent visitors within each group: Shimogo relatives, Nanmoku Family A (most frequent visitors), and Nanmoku Family B (second most frequent visitors). Visit frequencies were significantly different across the different locations for Shimogo (p < 0.001, Cramer’s V 0.323), Family A (p < 0.05; Cramer’s V 0.268), and Family B (p < 0.001, Cramer’s V 0.381), as assessed using Chi-square tests. Local area includes the town or village itself; local region includes Seimou for Nanmoku and Aizu for Shimogo; Tokyo Metropolitan includes the Kanto region (Gunma excluded for Nanmoku).
This analysis reveals that geographic isolation—which is localized in Shimogo versus strategically dispersed in Nanmoku—shapes support systems and mobility patterns, a fact that has direct implications for future rural engagements. Shimogo’s localized networks, centered in Aizuwakamatsu, suggest a foundation for future return migration, while Nanmoku’s strategically balanced use of local and regional hubs indicates a more complex pathway for maintaining ties. These findings necessitate context-specific rural revitalization strategies.
5.2. Motivation Shapes Contribution: Analyzing Rural Support in Shimogo and Nanmoku
This section explores how the motivations of out-migrated family members shape their support contributions to Shimogo and Nanmoku. Building on the analysis of geographic isolation (Section 5.1), we used multiple correspondence analysis (MCA) [55,56,57,58,59], multinomial logistic regression (Table 7) [58], and a Sankey diagram [63] (Figure 7) to reveal that while Shimogo’s support networks are primarily a reflection of localized self-sufficiency and the expressed needs of its residents, the networks in Nanmoku are driven by the more diverse motivations and individual support preferences of its out-migrated relatives.
Table 7.
MCA dimensions, top contributions, and associated visit frequencies.
Figure 7.
Motivations shape contributions: visualizing support pathways in depopulated rural Japan. This Sankey diagram illustrates the relationships between key behaviors and the multiple correspondence analysis (MCA) dimensions that capture differing forms of support and are expressed by the actions of the Shimogo family, Nanmoku Family A, and Nanmoku Family B. The width of each pathway is proportional to the loading values derived from the MCA discrimination measures, which emphasize that motivation shapes the way in which support is provided. The Sankey diagram was generated using Chiplot (https://www.chiplot.online). Citation [63] refers to the methodology behind the Sankey diagram visualization.
Table 7 presents a comparative overview of the MCA dimensions and their relation to visit frequencies, highlighting the distinct forms of support in Shimogo and Nanmoku. In Shimogo, the dimensions reflect resident needs: “resident self-reliance”, characterized by farm work, highlights the residents’ capacity to manage daily life, while “community support needs” underscore their reliance on external resources through shopping support. Furthermore, in Shimogo, increases in both self-reliance and reliance on community support are both associated with a reduction in the frequency of relative visits. In contrast, the dimensions for Nanmoku emphasize the motivations that drive the actions of out-migrated relatives: Family A is motivated to provide “daily support”, demonstrated through shopping support and yard work, and focuses on “community engagement”, exemplified by community activities, while Family B’s support motivations center on providing “on-demand support” through farm work and on “community engagement” through their own social and outdoor leisure activities. The results of the multinomial logistic regression demonstrate that, in Nanmoku, higher scores for Family A’s “daily support” and “community engagement” dimensions are associated with more frequent visits, while Family B’s focus on “on-demand support” is associated with a higher likelihood of less frequent (yearly) visits compared to weekly visits.
Figure 7 illustrates these support pathways by showing how key activities, such as “shopping support”, “farm work”, and “yard work”, contribute to different dimensions in Shimogo and Nanmoku. In Shimogo, these activities are structured around dimensions reflecting residents’ self-reliance or their need for external community support. In Nanmoku, the same activities reveal the different motivations of out-migrants who support their hometowns: the motivation for Family A is more consistent and direct support, and that for Family B is more flexible, need-based engagement.
By applying MCA, multinomial logistic regression, and Sankey visualization, this analysis demonstrates how motivation shapes contributions to rural support in depopulated areas. The dimensions identified in Shimogo are shaped by relatives’ perceptions of their residents’ needs and the need for both self-reliance and external support. In contrast, the dimensions for Nanmoku reveal how out-migrant relatives’ patterns of support are driven by the differing reasons motivating Family A to provide regular and direct support and those motivating Family B to offer more flexible engagement. These complex processes, made visible through a Sankey diagram (Figure 7), highlight that a complex interplay of factors influences how out-migrants both provide and maintain these support systems, emphasizing the need to acknowledge these factors when developing future revitalization strategies.
5.3. The Dynamic Interplay Between Isolation, Motivation, and Support Networks
In this section, we examine the diverse engagement patterns of out-migrated families—a key component of the “relationship population”—in Shimogo and Nanmoku, using cluster analysis (Table 8) to synthesize the findings on geographic isolation (Section 5.1) and support motivations (Section 5.2). The visualization of these support pathways in Figure 6 can help one interpret the cluster analysis, highlighting that support strategies in depopulated rural areas of Japan are not simply a product of in- or out-migration but shaped by a combination of geographical context and individual agency, all of which influence their motivations and their subsequent contributions to rural resilience. Table 8 then summarizes the core findings, connecting the preceding analyses to show the influence of out-migrant preferences and motivations.
Table 8.
Comparative analysis of out-migrated family clusters: driving motivations, geographic context, and support activities.
A comparative analysis of the clustered data (Table 8) reveals that while Shimogo’s out-migrant support is structured around perceived resident needs—ranging from the more distant, obligation-driven visits (Cluster 1, N = 107) to more consistent engagement prioritizing practical household support (Cluster 2, N = 47) or community-focused activities (Cluster 3, N = 46) or recreation (Cluster 4, N = 113)—Nanmoku Family A, with the most frequent visitors, demonstrates a more strategic approach, with visits structured through a combination of practical tasks (such as shopping and yard work, Cluster 1, N = 32) and community activities (Cluster 2, N = 34). This finding shows that this behavior is not simply a reaction to a need but an approach to support that reflects out-migrants’ motivations. In contrast, the results for Family B reveal that their support system ranges from those with highly specific farm work needs (Cluster 1, N = 17) and those who prioritize a more balanced approach that combines shopping with outdoor leisure activities (Cluster 2, N = 46) to others who focus on maintaining a more symbolic connection through less frequent annual visits (Cluster 3, N = 56). This analysis demonstrates how these varying choices highlight a diversity of approaches to support within rural communities and their relationship with the overall influence of out-migrants within this context.
The differing pathways of out-migration and hometown support are illustrated in Figure 8. This diagram illustrates that Shimogo’s support pathways are primarily localized, with visits often originating from nearby Aizuwakamatsu City. In contrast, while many of Nanmoku’s most frequent visitors (Family A) demonstrate a preference for the nearby cities of Tomioka and Takasaki, the less frequent visitors (Family B) are more likely to engage with their hometown from a more distant location, often in the Tokyo Metropolitan Region. This distribution highlights that the out-migrants, though connected to the Tokyo area, demonstrate a preference for the closer regional urban centers when structuring their engagements and that the location of their out-migration is directly connected to the forms of support that they can provide. As summarized in Table 9, this analysis demonstrates that support systems in depopulated rural areas are shaped by a complex interplay of both geographic contexts and the decisions of out-migrants, all of which are structured by the needs of the residents and the agency of the out-migrant families. Shimogo is characterized by a system that has emerged to respond to the needs of the local population, creating a self-reliant and localized form of support, whereas Nanmoku has a more varied set of approaches to support. We studied how this is directly influenced by the motivations of out-migrant families and their personal choices regarding how to structure this support. These findings suggest that relying solely on a single framework may not fully capture the complexities of rural support, as the “relationship population” represents a diverse and heterogeneous group with varying dynamics and contributions.
Figure 8.
Migration pathways and motivational clusters for out-migrated families. This map illustrates the primary out-migration pathways for Shimogo and Nanmoku families, highlighting distinct clusters of motivational behavior among returning relatives. The Shimogo pathways emphasize localized support, while the Nanmoku pathways showcase varied patterns, including obligation-driven, leisure-oriented, and multi-faceted engagements. The dashed arrows indicate potential U-turn and J-turn migration patterns after retirement.
Table 9.
Contrasting rural support systems: Shimogo and Nanmoku.
5.4. Illustrative Case Studies: Lived Experiences in Nanmoku
This section presents two Nanmoku case studies illustrating how resident and out-migrant agency shapes support systems (Table 10). Case Study 1 reveals how one elderly resident actively maintains her autonomy despite being geographically isolated, while Case Study 2 demonstrates how another family proactively structures support through intergenerational engagement and community participation. These examples offer critical insights into the diverse forms of engagement within the “relationship population” and how these forms are shaped by the interplay of individual motivations and geographic context, as further illustrated by the mobility pathways depicted in Figure 9.
Table 10.
Comparative analysis of the illustrative case studies in Nanmoku.
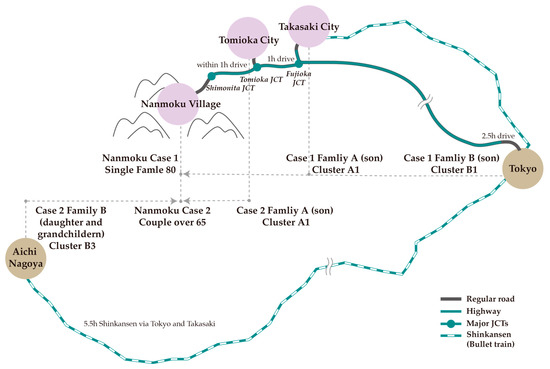
Figure 9.
Intergenerational mobility and support pathways in Nanmoku. This figure illustrates the mobility and support patterns of two Nanmoku families based on qualitative interview data (see Table 10 for details). Case 1 (top) concerns an 80-year-old woman who lives alone and is supported by her two sons. Case 2 (bottom) concerns a couple (both over 65) supported by their children.
Case Study 1: Autonomy and Multi-Layered Support in the Face of Isolation. This case study features an 80-year-old woman in Nanmoku who, despite being geographically isolated and elderly, maintains her autonomy through a combination of family support and community services (Table 10). Her strong desire to remain in her home shapes the support provided by her two sons: one based in nearby Takasaki (Cluster A1), who provides regular assistance, and another in Tokyo (Cluster B1), who focuses on less frequent but targeted farm support. This family support network is further supplemented by community resources, including a mobile vendor and a day service for bathing. This case highlights how individual agency, family support, and community services can be combined to create a viable support system, even in challenging circumstances.
Case Study 2 Active Aging and Intergenerational Reciprocity: The second case study features a couple in their late 60s residing in Nanmoku who, unlike the previous case, demonstrate a high degree of self-sufficiency while still benefiting from a strong intergenerational support network (Table 10). This couple’s lifestyle is characterized by active participation in their community, with the husband still working and playing a key role in community activities, and the wife managing the household and tending to their small farm. The couple’s support system involves their children and grandchildren. Their son in Tomioka (Cluster A1) provides regular practical assistance. Their daughter in Aichi (Cluster B3) visits periodically, providing a connection to the community while her children receive childcare from their grandparents. This case highlights the proactive nature of this family’s approach to support, where both generations contribute to a dynamic and mutually beneficial system. This dynamic, mutually beneficial system exemplifies a proactive approach to support, with the potential for future return migration via the couple’s more mobile unmarried son.
These case studies emphasize that support systems in depopulated rural areas are shaped not only by geographic context and resident needs but also by the agency and motivations of out-migrated family members. Case 1 illustrates how an elderly resident’s desire for autonomy can structure a multi-layered support system that draws on both family and community resources. Case 2 highlights that support can involve reciprocal relationships across generations, with out-migrants strategically balancing practical assistance, family ties, and personal preferences. These examples underscore the limitations of simplistic models of rural support and emphasize the need to recognize the diverse forms of engagement within the “relationship population”, whose members are often driven by a complex interplay of obligation, choice, and personal circumstances.
6. Discussion
This comparative study of Shimogo and Nanmoku revealed that support systems in depopulated rural areas are shaped by geographic isolation, resident needs, and the motivations of out-migrated family members. Our analysis progressed from examining geographic context (Section 5.1) to exploring motivations and support behaviors (Section 5.2), identifying diverse engagement pathways through cluster analysis (Section 5.3), and finally illustrating lived experiences through case studies (Section 5.4). This multi-faceted approach demonstrates the limitations of simplistic migration models and highlights the “relationship population’s” agency in structuring support. This discussion will explore the implications of these findings for rural mobility, strategic support choices, and policy interventions.
6.1. The Evolving Role of Local Towns in Depopulated Rural Areas
Contrary to the narrative depicting rural decline as a one-way trajectory, this research highlights the evolving role of local towns as critical anchors within dispersed support networks [2,64,65], demonstrating that the “relationship population’s” strategic engagement with these hubs is vital for rural sustainability in Japan [66]. The contrasting experiences of Shimogo and Nanmoku reveal that these towns are not merely passive bystanders in the process of depopulation. In Shimogo, as shown in the analysis of geographic context (Section 5.1) and out-migrant locations (Table 5, Figure 6), the nearest urban center, Aizuwakamatsu City, serves as a vital hub for the localized support network. This finding suggests that Aizuwakamatsu is more than just a destination for out-migrants; it functions as an anchor for maintaining connections within the Aizu region, facilitating the provision of support and sustaining the social fabric of the community through its connection to Shimogo [67].
Nanmoku presents a different dynamic, where the local towns of Tomioka and Takasaki act as strategic gateways, connecting this geographically isolated village to broader regional and metropolitan networks (Section 5.1, Figure 6). This highlights that out-migrants are making strategic choices about where to live, reflecting a balance between the desire for urban opportunities (“Tokaishikou”) and the pull to maintain strong ties with their hometowns (“Chimoto Teichaku”) (Section 5.3, Table 8 and Table 9) [68]. The decision to reside in these local towns, as illustrated by the prevalence of these locations among Family A members (Table 6), reflects a deliberate effort to balance proximity with access to wider opportunities and resources.
These contrasting patterns suggest that in the context of depopulation, local towns are evolving into critical nodes within an increasingly dispersed, yet interconnected, rural landscape. This finding indicates that policy interventions should not only focus on the villages themselves but also consider how best to support and strengthen these local towns, recognizing their increasingly important roles as centers for economic activity, social interaction, and the provision of essential services for the surrounding rural areas as well as in facilitating connection between out-migrants and their families [66]. Furthermore, these findings compel us to rethink the very nature of “Chiiki” (local region) revitalization policies [69]. Effective revitalization may require moving beyond a narrow focus on economic development to create a framework that incorporates the social and emotional ties of the “relationship population”, recognizing that the value of a community is not simply based on economic activity but also the social and emotional ties that bind it together.
6.2. Beyond Obligation: Agency, the “Peasant Economy”, and the “Relationship Population”
Traditional frameworks for understanding rural communities in Japan have often relied on concepts such as a “peasant economy” [70,71], a “moral economy” [72,73], and “sōgo fujo” (mutual aid) [35] to explain the social relationships and reciprocal obligations that underpin community life. However, the rapid depopulation of rural areas has challenged the traditional foundations of these systems, raising questions about their continued relevance in contemporary rural Japan [74,75]. While some studies have viewed the decline in “sōgo fujo” as a symptom of rural decline and the erosion of community ties [76], this research offers a different perspective, one that recognizes the enduring importance of family and community ties while acknowledging the emergence of new forms of engagement and support that are shaped by the agency and motivations of the “relationship population”.
The contrasting experiences of Shimogo and Nanmoku, as detailed in our analysis of geographic isolation (Section 5.1), resident needs, and out-migrant motivations (Section 5.2), as well as our analysis of behavioral patterns and clusters (Section 5.3), reveal that depopulation does not simply lead to a uniform erosion of traditional support systems but instead creates a shift in how these systems operate, based on both needs and motivations. In Shimogo, geographic isolation has fostered a localized support system where the actions of out-migrated relatives primarily reflect resident needs. The MCA dimensions of “resident self-reliance” and “community support needs” (Table 7) highlight how Shimogo’s out-migrants respond to the community’s capacity for self-sufficiency and its reliance on external resources. This is a system structured around a clear understanding of resident needs and driven by a need to maintain the existing social and community structures. The clusters identified in Shimogo (Table 8) further illustrate this pattern, with out-migrants engaging in a spectrum of activities that range from more infrequent, obligation-driven visits (Cluster 1) to more consistent support focused on practical household or farming needs (Cluster 2) or community engagement (Cluster 3). These patterns of support demonstrate that Shimogo’s out-migrants primarily respond to the perceived needs of residents within a localized network.
Nanmoku, however, presents a contrasting picture, where the “sōgo fujo” of support is more clearly driven by the motivations and agency of out-migrated relatives, who use a wider range of resources to maintain contact with their hometowns. The MCA dimensions for Family A and Family B (Table 7, Table A6 and Table A11; Figure A1 and Figure A3) capture distinct motivations for engagement: “daily support” and “community engagement” for Family A, and “on-demand support” combined with more symbolic forms of “community engagement” for Family B. The cluster analysis (Table 8 and Table 9) further revealed how these motivations translate into diverse patterns of engagement, with Family A demonstrating a clear commitment to providing both practical, everyday support and more symbolic forms of community participation, while Family B adopts a more flexible approach, responding to specific needs and maintaining connections through social and cultural activities. The differing patterns of mobility and support that are evident in Nanmoku are linked to the choices made by the out-migrants regarding where to live and how to maintain their connections with their families and communities. Our strategic use of both nearby towns and the more distant metropolitan region highlights that, in contrast to the more reactive approach in Shimogo, these out-migrants have agency in shaping support.
This analysis challenges the notion that rural depopulation inevitably leads to the demise of a “peasant economy” and “sōgo fujo”. Instead, it reveals that these concepts are being reinterpreted and adapted within the context of the “relationship population”, as out-migrants and residents negotiate new forms of engagement and support, demonstrating that individual choices, alongside deep-rooted cultural values, are crucial for understanding how rural communities are adapting to the challenges of demographic change. By acknowledging this diversity and recognizing the agency of both residents and out-migrants, we can develop more effective strategies for sustaining rural communities in the face of depopulation.
6.3. Beyond In-Migration: Empowering the “Relationship Population” for Rural Revitalization
This research demonstrates that rural support systems are not shaped primarily by in- or out-migration [76,77] but by a complex interplay of geographic context, resident needs, and the strategic choices of a diverse “relationship population”. This subsection moves beyond traditional migration models to explore the lived realities of support in depopulated areas and their implications for both policy and community revitalization.
While the desire for a more idyllic rural life and the inherent value of rural–urban mobility have been presented as driving forces for attracting residents to rural areas [30,45], the findings from Shimogo and Nanmoku highlight that support is, more often than not, the primary motivation for out-migrants to maintain connections with their hometowns. Although many may maintain a connection to place through patterns of leisure activities, most out-migrants are more driven by a need to provide support, whether through practical activities, such as farming, or through their routine engagements with community life [78]. We have also shown that there are strong limitations to the forms of support that can be delivered to highly isolated areas. As a result, policymakers must question whether promoting in-migration, particularly to severely depopulated areas such as the one seen in Case Study 1 in Section 5.4, is an effective solution for addressing the challenges of demographic decline. The complex networks of support in such areas also suggest that U-turn and J-turn migration must be understood in light of the broader social and practical realities of everyday life in rural communities and not simply as a straightforward means of addressing a demographic imbalance. These forms of rural mobility, as well as the limitations that they impose, must, therefore, be understood as a crucial component of what shapes the patterns of engagement that are visible throughout these communities [45]. It is not simply a case of promoting an urban-to-rural migration or even of encouraging former residents to return home, as these new forms of engagement also exist alongside deeply rooted bonds of family, tradition, community, and a sense of shared history [68,70,78].
These findings, particularly the contrasting examples from Shimogo and Nanmoku, highlight that simplistic migration policies fail to recognize the limitations imposed by geography, resources, and existing support networks. In Shimogo, with its self-reliant and localized structure, support is often structured as a reaction to resident needs. Therefore, direct policies promoting further migration may have a limited effect. In contrast, the data from Nanmoku highlight that out-migrant family members have developed a far more complex and strategic approach to their support, wherein they are making active choices regarding their participation and levels of engagement and the type of support that they will provide, shaped by their own capacity for action and personal preferences for engagement. The more nuanced patterns of support that have been structured by out-migrant communities in Nanmoku, and the strong ties to their hometowns that have resulted from this strategic behavior, highlight the importance of looking for ways to support J-turn migration as a means of strengthening communities while also recognizing that they do not always provide a magical solution to the challenges of rural depopulation. In cases like Nanmoku, it may be more productive to support the local hubs, such as Tomioka and Takasaki, which are already being used by out-migrants to structure their support systems and which provide easier access to a complex set of social and economic ties. Any policies must also be structured to reflect the needs of specific communities and the requirements and personal choices of those who are providing support.
This research emphasizes that rural sustainability cannot be achieved through a simple focus on migration alone but is instead the result of a complex interplay between geographic context, resident needs, and the ability of the “relationship population” to structure their own support systems in depopulated regions of Japan [79]. To ensure the long-term vitality of these areas, policymakers must move beyond simplistic models and develop strategies that explicitly value, support, and empower the diverse motivations and choices that structure the actions of both residents and their out-migrated relatives, creating an environment where both residents and the “relationship population” can actively contribute to the creation of sustainable rural communities.
6.4. Strengths and Limitations
This study has several key strengths. Its comparative design, analyzing distinct rural communities (Shimogo and Nanmoku), provides a nuanced understanding of how geographic context shapes support systems and out-migrant engagement. The mixed-methods approach employed, integrating quantitative and qualitative data, offers a rich perspective on the “relationship population”, revealing both broad patterns and individual experiences. This approach is also novel with regard to its focus on the agency and motivations of out-migrants, rather than solely resident needs, challenging conventional models of rural decline. Our detailed analysis of geographic context, motivations, and support pathways, combined with illustrative case studies, also provides a strong foundation for developing targeted policy recommendations.
Despite these strengths, this research has limitations. The relatively small sample size, particularly for qualitative data, restricts the generalizability of our findings. Reliance on cross-sectional data limits insights into the dynamic evolution of support systems over time. Future research should examine the long-term sustainability of these support models, the integration of formal and informal care systems, and the impact of evolving policies on rural networks. Comparative studies across different rural contexts could further validate these findings and expand their applicability. In addition, while the contrasting characteristics of Shimogo and Nanmoku provided a valuable framework for comparison, the significant difference in their population sizes should be acknowledged as a potential limitation. By addressing these issues, we can better understand how we can sustain aging, depopulated rural areas through innovative, inclusive strategies.
7. Conclusions
This study examined how geographic isolation and out-migrant motivations shape support systems in two depopulated mountainous rural areas of Japan: Shimogo Town and Nanmoku Village. By challenging the prevailing policy focus on internal migration, this research offers a new perspective by highlighting the “relationship population”—out-migrated family members who maintain ties to their hometowns—as a key component of rural sustainability. Through a mixed-methods approach, combining quantitative analyses of household surveys with qualitative analyses of interviews and case studies, we identified contrasting support patterns: Shimogo exhibits a localized system driven by resident needs, while Nanmoku reveals a strategic approach balancing practical support and community engagement.
Our findings underscore the limitations of one-size-fits-all migration policies and emphasize the need for context-specific strategies that recognize the diverse motivations and contributions of this “relationship population”. We have shown that while Shimogo’s support system is primarily a reflection of localized self-sufficiency and the expressed needs of its residents, the networks in Nanmoku are driven by the more diverse motivations and individual support preferences of its out-migrated relatives. These findings highlight the importance of mobility and dynamic exchanges, grounded in family ties, hometown bonds, and traditional cultural practices, as critical elements in fostering the long-term sustainability of rural communities. Furthermore, these findings suggest a need to re-evaluate top-down, migration-focused policies to acknowledge the power of existing family ties that are created and supported by local communities, especially in rural settings, where household-based, small-scale means of production (such as in Shimogo) have historically been the basis of social and economic life (as in a peasant economy) [70,71] and where such ties remain an important part of the local social structure.
This research contributes to the field by offering a new perspective on rural sustainability, one that moves beyond a purely demographic focus and embraces the complex social networks that underpin these communities. By using a mixed-methods approach, we were able to combine different types of data and show how they relate to each other. The framework we used and the approaches we have taken also provide a new way to study the complex interplay between mobility, support, and community resilience. Our findings have important implications for policymakers, local leaders, and researchers working on rural revitalization and aging in place and suggest that future strategies should empower the “relationship population” and support the diverse forms of engagement it offers.
Specifically, for Shimogo, policies should focus on strengthening localized support networks through investment in community resources and support for traditional activities while also facilitating practical support for out-migrants and encouraging farm-based return visits and participation in local cultural events, even for shorter periods, while also highlighting the importance of regional hubs such as Aizuwakamatsu City as a key area for a sustainable support system. Aizuwakamatsu is an important part of the Aizu area, and unlike Tomioka and Takasaki in Seimou, which are located within or close to the Tokyo metropolitan area, its own sustainability is also highly linked to the sustainability of the regions surrounding it. For Nanmoku, policies should support strategic mobility, remote living, and intergenerational reciprocity, recognizing the importance of family ties in a dynamic support system; improve transportation services for travel to nearby regional hubs (Tomioka and Takasaki) to facilitate the relationship population’s engagement; promote remote work opportunities; and support the development of local businesses and services that cater to both residents and out-migrated families.
Author Contributions
Conceptualization, W.W. and Y.S.; methodology, W.W., Y.C. and Y.S.; formal analysis, W.W. and Y.C.; validation, W.W. and Y.S.; investigation, W.W. and Y.S.; resources, W.W. and Y.S.; data curation, W.W.; writing—original draft preparation, W.W.; writing—review and editing, W.W.; supervision, Y.S.; project administration, Y.S. All authors have read and agreed to the published version of the manuscript.
Funding
This research received no external funding; all costs were covered by the first author, who retains full ownership of all data, figures, and tables.
Institutional Review Board Statement
In accordance with Chiba University’s Graduate School of Horticulture Research Ethics Review Committee guidelines (Article 3), ethical review was not required for this study. The study design, using anonymous questionnaires on everyday life topics, is non-interventional and does not involve human subject research as defined by the committee, which mandates review for research involving human biological materials in medical, epidemiological, or psychological contexts. All data collection and handling procedures complied with relevant university regulations, ensuring the privacy of all participants (https://www.chiba-u.ac.jp/general/JoureiV5HTMLContents/act/frame/frame110001468.htm (accessed on 1 December 2024).
Informed Consent Statement
Participants were informed that participation was voluntary, and returning the mailed questionnaire was regarded as consent.
Data Availability Statement
The original contributions presented in this study are included in the article, and further inquiries can be directed to the corresponding author.
Acknowledgments
We extend our sincere gratitude to the town officers of Shimogo and Nanmoku, as well as the residents who participated in the survey. We also appreciate the constructive comments and suggestions provided by the anonymous reviewers and the support from MDPI Author Services. We thank the editors at MDPI for their assistance throughout the submission process.
Conflicts of Interest
The authors declare no conflict of interest.
Appendix A
For Shimogo, the design of the questionnaire, MCA dimensions, top contributing behaviors, dimension traits, and the influence on visit frequency are based on a previously published study [52]. For Nanmoku Family A and Family B, the MCA dimensions, top contributing behaviors, dimension traits, and the influence on visit frequency are detailed in Appendix A in Table A1, Table A2, Table A3, Table A4, Table A5, Table A6, Table A7, Table A8, Table A9, Table A10, Table A11, Table A12, Table A13, Table A14 and Table A15 and Figure A1, Figure A2, Figure A3 and Figure A4.
Table A1.
The main contents of the survey questionnaire distributed in Nanmoku.
Table A1.
The main contents of the survey questionnaire distributed in Nanmoku.
| Questionnaire Summary | Resident Households 1 | Most (Family A) and Second-Most (Family B) Frequent Hometown Visit Relatives 2 |
|---|---|---|
| Basic Information 3 | 1. Residential area (name of settlement) | 5. Location of Visit Relatives |
| 2. Age and Gender of all family members | 6. Age | |
| 7. Frequency of Hometown Visit | ||
| 8. Relationship (kinship) to Resident Households | ||
| Healthcare And Shopping 4 | 3. Health conditions: | |
| Select the health conditions that apply to your family (multiple choice). | ||
| 3.1. All family members are in good health | ||
| 3.2. Need to go to the hospital regularly | ||
| 3.3. Uses a home visit helper | ||
| 3.4. Uses a day service (bathing, rehabilitation, etc.). | ||
| 3.5. Uses home visit medical services | ||
| 3.6. Need caregiving. | ||
| 4. Shopping (medical care) methods: | ||
| Select the shopping (medical care) conditions that apply to your family (multiple choice) | ||
| 4.1. Completed by family without others’ help | ||
| 4.2. Requires relatives to go shopping (go to hospital) with family members during their hometown visit | ||
| 4.3. Requires nearby neighbors to go shopping (go to hospital) with family members | ||
| 4.4. Relatives bring the items to our family | ||
| 4.5. Neighbors bring the items to our family | ||
| 4.6. Use mobile vending vehicles in communities | ||
| 4.7. Use online services from co-ops, Amazon, and others | ||
| Purpose of Hometown-Visiting | 9. Purpose of Hometown-Visiting | |
| Select the main purpose of hometown-visiting by relatives that apply to your family (multiple choice). | ||
| 9.1. Family/relative gatherings or reunions | ||
| 9.2. Supporting household chores | ||
| 9.3. Supporting farm work, yard work (gardening), | ||
| 9.4. Enjoying outdoor leisure activities (e.g., walking, fishing) | ||
| 9.5. Engaging in individual social activities/events | ||
| 9.6. Visiting gravesites | ||
| Frequency of Daily Shopping | 10. Providing Daily Essentials Shopping | |
| Frequency of Agricultural Work | 11. Providing Yard Work 12. Providing Farmland Cultivation, including Planting in Pots, Gardening, Home Vegetable Gardening | |
| Frequency of Outdoor Leisure Activities | 13. Outdoor Leisure Activities Frequency of engaging in Outdoor Leisure Activities during Hometown Visits, including: Barbecue (BBQ) Foraging for Wild Plants (Mountain Vegetables), Fishing, Hiking, Walking/Strolling, Carpentry Work, Agricultural Work | |
| Frequency of Personal Social Activities | 14. Social Interactions and Leisure Activities in the Community during hometown visits, Including: Spending Time with Friends (e.g., Teatime) Engaging in Hobbies Going Out | |
| Frequency of Community Activities | 15. Participating on Behalf of Residents with Community Activities, including: Community Lawn Mowing Community Clean-Up (Trash Collection) Local Festival |
To ensure the data were consistent and minimize the burden on the respondents, several survey design choices were implemented. 1 Responses were collected from a household perspective, 2 focusing on the most (Family A) and second-most (Family B) frequent visitors when multiple relatives visited. 3 Open-ended questions allowed for the accurate recording of the settlement names and locations of visiting relatives not included in the provided options. 4 Household health status was based on the most severe health condition reported among members. All shopping (medical care) methods employed by household members were recorded.
Table A2.
Basic information on resident households.
Table A2.
Basic information on resident households.
| Survey Questions | Survey Items | Details and Proportion | |||
|---|---|---|---|---|---|
| 1. Location of Resident Households by Settlements N = 155 | Settlement Name | Quantity | Proportion | ||
| Ōhinata | 39 | 25.2% | |||
| Iwado | 24 | 15.5% | |||
| Ozawa | 23 | 14.8% | |||
| Mukuruma | 18 | 11.6% | |||
| Ōshiozawa | 17 | 11.0% | |||
| Hisawa | 9 | 5.8% | |||
| Ōnita | 7 | 4.5% | |||
| Hazawa | 6 | 3.9% | |||
| Tozawa | 6 | 3.9% | |||
| Hoshio | 4 | 2.6% | |||
| Chihara | 1 | 0.6% | |||
| Not Provided | 1 | 0.6% | |||
| 2. Household Composition N = 150 | Categorizations of Household Composition | Details of Demographic Characteristics | Quantity | Proportion | |
| Single-Senior Household N = 49 (33.8%) | Gender | ||||
| Male | 12 | 75.5% | |||
| Female | 37 | 24.5% | |||
| Age | |||||
| Early Senior (65–79) | 13 | 26.5% | |||
| Later Senior (≥80) | 36 | 73.5% | |||
| Multi-Senior Households N = 66 (42.1%) | Same-Generation Senior Household | 50 | 82.0% | ||
| Intergeneration Senior Household | 11 | 18.0% | |||
| Intergenerational Households N = 35 (24.1%) | Two-Generation Household (Early Senior) | 20 | 57.1% | ||
| Two-Generation Household (Later Senior) | 12 | 34.3% | |||
| Two-Generation Household (Junior Only) | 3 | 8.6% | |||
| 3. Health Conditions 2 N = 146 | Categorizations of Health Conditions 2 | Options (Multiple-Choice Questions) 1 | Quantity | Selection Rate 1 | |
| Healthy Households N = 49 (33.6%) | 3.1. All Family Members are In Good Health | 49 | 33.6% | ||
| Self-Reliant Medical Care Households N = 78 (53.4%) | 3.2. Require Regular Medical Attention | 93 | 64.0% | ||
| Number of Support-Reliant Households N = 19 (13.0%) | Support-Needed Households N = 10 (6.2%) | 3.3. Utilize In-Home Care Services (for basic assistance) | 5 | 2.5% | |
| 3.4. Attend Adult Day Care | 11 | 7.5% | |||
| Care-Needed Households N = 9 (6.8%) | 3.5. Receive Home Visit Medical Services | 1 | 0.8% | ||
| 3.6. Require Long-Term Care Assistance | 8 | 5.4% | |||
| 4. Shopping Medical-care Methods 3 N = 147 | Categorizations of Shopping Medical-Care Methods 3 | Options (Multiple-Choice Questions) 1 | Quantity | Selection Rate 1 | |
| Self-help N = 77 (53.0%) | 4.1. Shop (Seek Medical Care) Independently with Cohabiting Family | 121 | 82.3% | ||
| Mutual aid N = 12 (8.2%) | 4.2. Shop (Seek Medical Care) with Hometown Visiting Relatives | 27 | 18.3% | ||
| 4.3. Shop (Seek Medical Care) with Community Residents | 15 | 10.2% | |||
| 4.4. Have Shopping Performed on Their Behalf by Hometown Visiting Relatives | 18 | 11.6% | |||
| 4.5. Have Shopping Performed on Their Behalf by Community Residents | 3 | 2.0% | |||
| Combined support N = 58 (38.8%) | 4.6. Utilize Community Mobile Vending for Shopping | 15 | 9.5% | ||
| 4.7. Utilize Home Delivery Services (e.g., Co-op) for Shopping | 36 | 24.5% | |||
Due to voluntary participation, N varies across items. Percentages are based on valid responses. 1 Selection rates for options in multiple-choice questions 3 and 4 are shown in Table 3. 2 Household health conditions are categorized as follows: healthy households (all family members are in good health, and there is no formal long-term care; only option 3.1 should be selected); self-reliant-medical-care households (one or more family members require regular medical attention but not formal long-term care; only option 3.2 should be selected); and support-reliant households (utilizing formal long-term care services; any combination of options 3.3–3.6 can be selected). Support-reliant households are further categorized as support-needed (options 3.3 or 3.4) and care-needed (options 3.5 or 3.6) households. 3 This categorization focuses on the primary method of obtaining daily necessities and healthcare: self-help (option 4.1 only), mutual aid (options 4.2–4.5 alone or in combination, highlighting the reliance on relatives and neighbors), and combined support (all other combinations of options 4.1–4.7), reflecting the complex support networks observed in Nanmoku.
Table A3.
Basic information on resident households’ out-migrated family (A and B).
Table A3.
Basic information on resident households’ out-migrated family (A and B).
| Survey Questions | Survey Items | Quantity (Proportion) | ||||
|---|---|---|---|---|---|---|
| Family A 3 | Family B 3 | |||||
| 5. Location of Visit Relatives | Wide range division | Prefecture/City/Town | N = 147 | N = 118 | ||
| Seimou area 1 | Total | N = 112 | 76.2% | N = 75 | 63.6% | |
| Tomioka City | 32 | 28.6% | 29 | 38.7% | ||
| Takasaki City | 32 | 28.6% | 22 | 29.3% | ||
| Nanmoku Village | 25 | 22.3% | 14 | 18.7% | ||
| Shimonita Town | 12 | 10.7% | 4 | 5.3% | ||
| Others | 11 | 9.8% | 6 | 8.0% | ||
| Other areas in Gunma Prefecture | Total | N = 17 | 11.6% | N = 13 | 11.0% | |
| Maebashi City | 7 | 41.2% | 6 | 46.2% | ||
| Others | 10 | 58.8% | 7 | 53.8% | ||
| Kanto Region 2 (Kanto Region exclude Gunma Prefecture) | Total | N = 15 | 10.2% | N = 27 | 22.9% | |
| Tokyo | 4 | 26.7% | 12 | 44.5% | ||
| Saitama | 4 | 26.7% | 9 | 33.3% | ||
| Chiba | 7 | 46.6% | 1 | 3.7% | ||
| Kanagawa | - | - | 5 | 18.5% | ||
| Other Regions | Others | N = 3 | 2.0% | N = 3 | 2.5% | |
| 6. Age | Total | N = 152 | N = 121 | |||
| Under 50 | 47 | 31.0% | 46 | 37.5% | ||
| 50~64 | 61 | 40.1% | 35 | 29.1% | ||
| 65~74 | 18 | 11.8% | 20 | 16.7% | ||
| Over 75 | 26 | 17.1% | 20 | 16.7% | ||
| 7. Frequency of Hometown Visit 5 | Total | N = 151 | N = 119 | |||
| More than once a week | 50 | 33.1% | 17 | 14.3% | ||
| More than once a month | 64 | 42.4% | 46 | 38.7% | ||
| More than once a year | 37 | 24.5% | 56 | 47.0% | ||
| Less than once a year (excluded from total) | 4 | - | 3 | - | ||
| 8. Relationship of Hometown-visiting Relatives to Residents | Total | N = 153 | N = 123 | |||
| Parent | 14 | 9.1% | 2 | 1.6% | ||
| Child | 110 | 71.9% | 84 | 68.3% | ||
| Sibling | 24 | 15.7% | 30 | 24.4% | ||
| Others | 5 | 3.3% | 7 | 5.7% | ||
| 9. Main Purpose of Hometown-Visiting | Multiple-choice Question | Selection Rate 4 | Selection Rate 4 | |||
| 9.1. Family/relative gatherings or reunions | 127 | 83.0% | 104 | 83.2% | ||
| 9.2. Supporting household chores | 27 | 17.6% | 20 | 16.0% | ||
| 9.3. Supporting farm work, yard work (gardening, planting in pots) | 14 | 9.2% | 11 | 8.8% | ||
| 9.4. Enjoying outdoor leisure activities (e.g., walking, fishing) | 25 | 16.3% | 22 | 17.6% | ||
| 9.5. Engaging in personal social activities/events (e.g., teatime with friends, engaging in hobbies) | 20 | 13.1% | 10 | 8.0% | ||
| 9.6. Visiting gravesites | 94 | 61.4% | 64 | 51.2% | ||
Due to voluntary participation, N varies across items. Percentages are based on valid responses. 1 The Seimou area includes Tano District (Kanna Village and Ueno Village), Kanra District (Kanra Town, Shimonita Town, and Nanmoku Village), and the urban area (Takasaki City, Tomioka City, Fujioka City, and Yasunaka City). 2 The Kanto Region does not have a legally defined boundary. In this study, the Kanto Region refers to the prefectures of Tokyo, Ibaraki, Tochigi, Gunma, Saitama, Chiba, and Kanagawa (Figure 2). 3 Family A corresponds to the most frequent visitor, and Family B corresponds to the second most frequent visitor, also shown in Table A1. 4 The selection rates for options in the ninth set of multiple-choice questions are also shown in Table A1. 5 Q7 “Less than once a year” sample 4 for Family A and 3 for Family B were excluded from the total.
Table A4.
Comparison of support from Family A and Family B.
Table A4.
Comparison of support from Family A and Family B.
| Survey Questions On Questionnaire | Details | Family A Most Frequent | Family B Second-Most Frequent | ||
|---|---|---|---|---|---|
| Quantity | Proportion | Quantity | Proportion | ||
| 10. Daily Essentials Shopping | Total | N = 147 | N = 118 | ||
| More than once a week | 21 | 14.3% | 8 | 6.8% | |
| More than once a month | 16 | 10.9% | 11 | 9.3% | |
| Several times a year | 21 | 14.3% | 22 | 18.6% | |
| Almost never | 89 | 60.5% | 77 | 65.3% | |
| 11. Yard Work around house | Total | 147 | N = 116 | ||
| More than once a month | 22 | 15.0% | 4 | 3.4% | |
| Several times a year | 11 | 7.5% | 11 | 9.5% | |
| Almost never | 114 | 77.5% | 101 | 87.1% | |
| 12. Farm Work | Total | N = 149 | N = 117 | ||
| More than once a month | 16 | 10.7% | 5 | 4.2% | |
| Several times a year | 19 | 12.8% | 12 | 10.3% | |
| Almost never | 114 | 76.5% | 100 | 85.5% | |
| 13. Outdoor Leisure Activities | Total | N = 145 | N = 115 | ||
| More than once a month | 19 | 13.1% | 7 | 6.1% | |
| Several times a year | 67 | 46.2% | 59 | 51.3% | |
| Almost never | 59 | 40.7% | 49 | 42.6% | |
| 14. Personal Social Activities | Total | N = 148 | N = 121 | ||
| More than once a week | 14 | 9.4% | 7 | 5.8% | |
| More than once a month | 7 | 4.7% | 8 | 6.6% | |
| Several times a year | 39 | 26.4% | 21 | 17.4% | |
| Almost never | 88 | 59.5% | 85 | 70.2% | |
| 15. Community Activities | Total | N = 148 | N = 119 | ||
| Participate All | 19 | 12.8% | 8 | 6.7% | |
| Participate Part | 30 | 20.3% | 21 | 17.6% | |
| Almost never | 99 | 66.9% | 90 | 75.6% | |
Due to voluntary participation, N varies across items. Percentages are based on valid responses. The analysis of visiting relatives’ activities (questions 10–15) is based on respondents who reported that relatives visit at least once a year (Table A3, Q7); “Less than once a year” samples were excluded.

Figure A1.
MCA of Family A’s activities in Nanmoku. (a) Discrimination measures (contributions) for each variable for Dimensions 1 and 2. Age and geographic location are included as supplementary variables. (b) Joint category plot of variables. Dimension 1, representing Family A’s support for daily activities, is displayed on the horizontal axis; Dimension 2, representing the community engagement of Family A, is displayed on the vertical axis. The proximities of the points reflect the strengths of their associations.
Table A5.
Model summary for MCA of Family A’s activities.
Table A5.
Model summary for MCA of Family A’s activities.
| Dimension | Cronbach’s Alpha | Variance Accounted For | ||
|---|---|---|---|---|
| Total (Eigenvalue) | Inertia | Variance Explained (%) | ||
| 1 | 0.778 | 2.845 | 0.474 | 61.27% |
| 2 | 0.532 | 1.797 | 0.300 | 38.73% |
| Total | 4.643 | 0.774 | 100.0% | |
| Mean | 0.683 | 2.321 | 0.387 | |
Eigenvalues represent the amount of variance explained by each dimension. Inertia is proportional to the eigenvalue and represents the total variance explained by each dimension. Cronbach’s alpha is a measure of internal consistency reliability; values above 0.6 indicate acceptable reliability. The mean Cronbach’s alpha is based on the mean eigenvalue.
Table A6.
Discrimination measures (contributions) for MCA of Family A’s activities.
Table A6.
Discrimination measures (contributions) for MCA of Family A’s activities.
| Variables | Dimension 1 Daily Support | Dimension 2 Community Engagement | Mean |
|---|---|---|---|
| 10A. Daily Shopping Support | 0.523 | 0.225 | 0.473 |
| 11A. Yard Work Support | 0.577 | 0.042 | 0.309 |
| 12A. Farm Work Support | 0.559 | 0.279 | 0.419 |
| 13A. Outdoor Leisure Activities | 0.474 | 0.274 | 0.374 |
| 14A. Social Activities | 0.324 | 0.413 | 0.369 |
| 15A. Participation in Community Activities as a Substitute | 0.387 | 0.564 | 0.476 |
| Age (Supplementary) | 0.099 | 0.023 | 0.061 |
| Relationship (Supplementary) | 0.023 | 0.008 | 0.015 |
| Geographic Location (Supplementary) | 0.031 | 0.028 | 0.030 |
| Active Total | 2.845 | 1.797 | 2.321 |
Higher values indicate a stronger association between a variable and a given dimension. Age, relationship with residents, and geographic location were included as supplementary variables.
Table A7.
Multinomial logistic regression predicting the hometown visit frequency of Family A based on MCA dimensions.
Table A7.
Multinomial logistic regression predicting the hometown visit frequency of Family A based on MCA dimensions.
| Hometown Visit Frequency | B | Std. Error | Wald | df | p | Exp(B) | 95% CI for Exp(B) | |
|---|---|---|---|---|---|---|---|---|
| More than once a month | ||||||||
| Intercept | 0.366 | 0.247 | 2.189 | 1 | 0.139 | - | - | - |
| Dimension 1 | −1.001 | 0.328 | 23.843 | 1 | 0.000 | 0.202 | 0.106 | 0.384 |
| Dimension 2 | −0.909 | 0.271 | 11.241 | 1 | 0.001 | 0.403 | 0.237 | 0.686 |
| More than once a year | ||||||||
| Intercept | −1.546 | 0.753 | 4.222 | 1 | 0.040 | - | - | - |
| Dimension 1 | −4.133 | 1.167 | 12.548 | 1 | 0.000 | 0.016 | 0.002 | 0.158 |
| Dimension 2 | −0.838 | 0.455 | 3.395 | 1 | 0.065 | 0.433 | 0.177 | 1.055 |
This study highlights the direction and significance of relationships. Model fit significantly outperformed the intercept-only mode (χ2 = 96.329, df = 4, p < 0.001). Pseudo R2: Cox and Snell = 0.472, Nagelkerke = 0.534, and McFadden = 0.297. Dimension 1: negatively associated with return frequency; Dimension 2: weaker negative association. Hometown visit frequency is based on respondents who reported at least one annual visit (Question 7, Table A3).
Table A8.
Explained variance and case distribution in MCA dimension scores by number of K-means clusters (N = 155).
Table A8.
Explained variance and case distribution in MCA dimension scores by number of K-means clusters (N = 155).
| Number of Clusters | Explained Variance of Dimension | Distribution of Cases | ||||||||
|---|---|---|---|---|---|---|---|---|---|---|
| 1 | 2 | Cluster A1 | Cluster A2 | Cluster A3 | Cluster A4 | |||||
| 2 | 0.776 | 0.024 | 116 | 74.8% | 39 | 25.2% | ||||
| 3 | 0.622 | 0.498 | 32 | 20.6% | 34 | 21.9% | 89 | 57.4% | ||
| 4 | 0.780 | 0.776 | 27 | 17.4% | 12 | 7.7% | 30 | 19.4% | 86 | 55.5% |
This table shows the explained variance and case distribution for 2, 3, and 4 clusters in Nanmoku Family A based on MCA dimension scores (Table A5). Explained variance reflects the proportion of total variance captured by the clusters, calculated as the ratio of between-cluster variance to total variance. A higher explained variance indicates a greater ability of the cluster solution to capture the variance in the data. While the 4-cluster solution achieves the highest explained variance in Dimension 1, its uneven distribution (with cluster 2 containing only 7.7% of the cases) makes the 3-cluster solution more balanced and interpretable for analyzing behavioral patterns.

Figure A2.
Mean (±SD) scores for Dimension 1 (daily support provided to residents) and Dimension 2 (community support) for 3 clusters (N = 155) identified via a k-means cluster analysis of the MCA object scores. One-way ANOVAs: p < 0.001 for both dimensions (Dimension 1: F (2, 152) = 217.161; Dimension 2: F (2, 152) = 156.232). These results suggest that the clusters effectively capture meaningful differences in daily support and community engagement patterns.
Table A9.
Descriptive statistics of Family A clusters based on MCA dimension scores.
Table A9.
Descriptive statistics of Family A clusters based on MCA dimension scores.
| Variables | Percentages in Clusters 1 | Chi-Square Tests (p-Value) 2 | Characteristic | ||||||
|---|---|---|---|---|---|---|---|---|---|
| Cluster A1 | Cluster A2 | Cluster A3 | |||||||
| Age | <50 years | 8 | 25.8% | 3 | 9.1% | 36 | 40.9% | <0.05 | Cluster A3: predominantly younger; Cluster A2: predominantly older; Cluster A1: mix |
| ≥50 years | 23 | 74.2% | 30 | 90.9% | 52 | 59.1% | |||
| Relationship | Parent | 5 | 16.1% | 3 | 9.1% | 6 | 6.7% | - | Predominantly children in all clusters, with higher sibling representation in Cluster A3 |
| Child | 22 | 71.0% | 26 | 78.8% | 62 | 69.7% | |||
| Sibling | 3 | 9.7% | 3 | 9.1% | 18 | 20.2% | |||
| Relatives from Seimou area | 24 | 77.4% | 25 | 86.2% | 63 | 72.4% | - | Seimou-based across all clusters | |
| Hometown visits (weekly) | 8 | 25.0% | 29 | 87.9% | 13 | 15.1% | <0.001 | Cluster A2: high frequent visits | |
| Hometown visits (>monthly) | 30 | 93.7% | 33 | 100% | 38 | 44.2% | Cluster A1: frequent visits | ||
| Hometown visits (yearly only) | 2 | 6.3% | - | - | 25 | 40.7% | Cluster A3: high rate of visits (both annual and less frequent) | ||
| Chore support 3 | 8 | 25.0% | 12 | 35.3% | 7 | 7.9% | <0.001 | Clusters A1 and A2: low levels of chore support; Cluster A3: lowest level of chore support | |
| Grave visit 3 | 20 | 62.5% | 21 | 61.8% | 53 | 59.6% | - | Common across all clusters | |
| Outdoor leisure activities (weekly) | 2 | 6.7% | 15 | 50.0% | 2 | 2.4% | <0.001 | Cluster A2: high level of weekly outdoor leisure activities | |
| Outdoor leisure activities 3 | 26 | 86.7% | 25 | 83.3% | 35 | 41.2% | Cluster A3: least amount of engagement | ||
| Shopping support (>monthly) | 11 | 37.9% | 20 | 58.8% | 6 | 7.2% | <0.001 | Cluster A2: frequent shopping support; Cluster 1: lower level | |
| Shopping support (yearly only) | 9 | 31.0% | 12 | 35.3% | 68 | 81.0% | Cluster A3: infrequent shopping support | ||
| Yard work support (weekly) | 3 | 11.1% | 18 | 54.5% | - | - | <0.001 | Cluster A2: high-level support; Cluster A1: low-level support | |
| Yard work support 3 | 8 | 29.6% | 24 | 72.7% | 1 | 1.2% | Cluster A3: infrequent yard work support | ||
| Farm work support (weekly) | 2 | 6.7% | 14 | 42.4% | - | - | <0.001 | Cluster A2: high-level support; Cluster A1: low-level support | |
| Farm work support 3 | 16 | 53.3% | 17 | 51.5% | 2 | 2.3% | Cluster A3: infrequent farm work support | ||
| High-frequency social activities (>monthly) | 3 | 10.0% | 14 | 43.8% | 4 | 4.7% | <0.001 | Cluster A2: high level of social activity | |
| Social activities 3 | 23 | 76.7% | 23 | 71.9% | 14 | 16.3% | Clusters A1 and A2 high social participation; Cluster A3: lower participation | ||
| Community activities 3 | 22 | 73.3% | 18 | 56.2% | 9 | 10.5% | <0.001 | Cluster A1: high engagement; Cluster A2: moderate engagement; Cluster A3: lower engagement | |
| Shopping and medical care support needed by residents 4 | 17 | 54.8% | 22 | 78.6% | 27 | 31.0% | <0.001 | Cluster A2: higher support needs; Cluster A3: high unmet support needs | |
1 Percentages are within-cluster proportions based on valid responses; sample sizes vary across variables. 2 p-values are based on chi-square tests and indicate whether a characteristic significantly differs across clusters. 3 Chore support, grave visits, outdoor leisure activities, yard work support, farm work support, social activities, and community activities indicate participation, not frequency. 4 Support needed by residents refers to the proportion of households within each cluster requiring external support for shopping or healthcare (Table A2, Q4, referring to the quantities of mutual-aid and combined-support households).
Table A10.
Model summary for MCA of Family B’s activities.
Table A10.
Model summary for MCA of Family B’s activities.
| Dimension | Cronbach’s Alpha | Variance Accounted For | ||
|---|---|---|---|---|
| Total (Eigenvalue) | Inertia | Variance Explained (%) | ||
| 1 | 0.770 | 2.793 | 0.466 | 56.9% |
| 2 | 0.633 | 2.115 | 0.353 | 43.1% |
| Total | 4.909 | 0.818 | 100.0% | |
| Mean | 0.711 | 2.454 | 0.409 | |
Eigenvalues represent the amount of variance explained by each dimension. Inertia is proportional to the eigenvalue and represents the total variance explained by each dimension. Cronbach’s alpha is a measure of internal consistency reliability; values above 0.6 indicate acceptable reliability. The mean Cronbach’s alpha is based on the mean eigenvalue.

Figure A3.
MCA of Family B’s activities in Nanmoku. (a) Discrimination measures (contributions) for each variable for Dimensions 1 and 2. Age and geographic location are included as supplementary variables. (b) Joint category plot of variables. Dimension 1, representing Family B’s on-demand support for daily activities, is displayed on the horizontal axis; Dimension 2, representing community engagement by focusing on the social contact of Family B, is displayed on the vertical axis. The proximities of the points reflect the strengths of their associations.
Table A11.
Discrimination measures (contributions) for MCA of Family B’s activities.
Table A11.
Discrimination measures (contributions) for MCA of Family B’s activities.
| Variables | Dimension 1 On-Demand Support | Dimension 2 Social Contact | Mean |
|---|---|---|---|
| 10B. Daily Shopping Support | 0.614 | 0.405 | 0.510 |
| 11B. Yard Work Support | 0.605 | 0.513 | 0.559 |
| 12B. Farm Work Support | 0.499 | 0.334 | 0.417 |
| 13B. Outdoor Leisure Activities | 0.401 | 0.200 | 0.301 |
| 14B. Social Activities | 0.279 | 0.527 | 0.403 |
| 15B. Participation in Community Activities as a Substitute | 0.395 | 0.135 | 0.265 |
| Age (Supplementary) | 0.058 | 0.067 | 0.062 |
| Relationship (Supplementary) | 0.022 | 0.175 | 0.099 |
| Geographic Location (Supplementary) | 0.030 | 0.136 | 0.083 |
| Active Total | 2.793 | 2.115 | 2.454 |
Higher values indicate a stronger association between a variable and a dimension. Age, relationship with residents, and geographic location were included as supplementary variables.
Table A12.
Multinomial logistic regression predicting the hometown visit frequency of Family B based on MCA dimensions.
Table A12.
Multinomial logistic regression predicting the hometown visit frequency of Family B based on MCA dimensions.
| Hometown Visit Frequency | B | Std. Error | Wald | df | p | Exp(B) | 95% CI for Exp(B) | |
|---|---|---|---|---|---|---|---|---|
| More than once a month | ||||||||
| Intercept | 1.619 | 0.391 | 17.13 | 1 | 0.000 | - | - | - |
| Dimension 1 | 1.066 | 0.303 | 12.424 | 1 | 0.000 | 2.905 | 1.605 | 5.255 |
| Dimension 2 | −0.287 | 0.21 | 1.866 | 1 | 0.172 | 0.75 | 0.497 | 1.133 |
| More than once a year | ||||||||
| Intercept | −1.546 | 0.753 | 4.222 | 1 | 0.040 | - | - | - |
| Dimension 1 | −4.133 | 1.167 | 12.548 | 1 | 0.000 | 0.016 | 0.002 | 0.158 |
| Dimension 2 | −0.838 | 0.455 | 3.395 | 1 | 0.065 | 0.433 | 0.177 | 1.055 |
This study highlights the direction and significance of relationships. Model fit significantly outperformed the intercept-only mode (χ2 = 40.092, df = 4, p < 0.001). Pseudo R2:Cox and Snell = 0.286, Nagelkerke = 0.331, and McFadden = 0.168. Dimension 1: higher scores are linked to lower return frequencies, with the direction of association depending on the comparison category. Dimension 2: No significant association. Hometown visit frequency is based on respondents who reported at least one annual visit (Question 7, Table A3).
Table A13.
The auto-clustering results for Family B obtained via two-step cluster analysis.
Table A13.
The auto-clustering results for Family B obtained via two-step cluster analysis.
| Number of Clusters | Schwarz’s Bayesian Criterion (BIC) | BIC Change | Ratio of BIC Changes | Ratio of Distance Measures |
|---|---|---|---|---|
| 1 | 430.669 | |||
| 2 | 267.024 | −163.645 | 1.000 | 2.094 |
| 3 | 203.842 | −63.183 | 0.386 | 3.526 |
| 4 | 206.468 | 2.627 | −0.016 | 1.092 |
| 5 | 211.296 | 4.827 | −0.029 | 1.750 |
| 6 | 226.340 | 15.044 | −0.092 | 1.623 |
| 7 | 246.615 | 20.275 | −0.124 | 1.205 |
| 8 | 268.318 | 21.703 | −0.133 | 1.214 |
| 9 | 291.251 | 22.933 | −0.140 | 1.286 |
| 10 | 315.461 | 24.210 | −0.148 | 1.253 |
| 11 | 340.574 | 25.113 | −0.153 | 1.163 |
| 12 | 366.185 | 25.612 | −0.157 | 1.298 |
| 13 | 392.500 | 26.315 | −0.161 | 1.363 |
| 14 | 419.443 | 26.943 | −0.165 | 1.053 |
| 15 | 446.473 | 27.030 | −0.165 | 1.025 |
Silhouette measure of 0.8 for cohesion and separation in a “good” cluster quality. BIC Change: the change in Schwarz’s Bayesian information criterion (BIC) from the previous number of clusters. Ratio of BIC Changes: the ratio of the BIC change for the current number of clusters to the BIC change for the two-cluster solution. Ratio of Distance Measures: The ratio of the distance measures between the current number of clusters and the previous number of clusters. This table shows the results of the auto-clustering phase of the two-step clustering method, where we used categorical visit frequency (Table A3, Q7, N = 119) and MCA dimension 1 and 2 scores (Table A8) as input variables. The three-cluster solution was chosen because the BIC change showed a substantial decrease from 2 to 3 clusters, while further increases in the number of clusters did not lead to a similarly large change, indicating that three clusters captured most of the meaningful patterns in the data.

Figure A4.
The mean (± SD) scores for Dimension 1 (on-demand support) for 3 clusters (N = 119) identified via a two-step cluster analysis of the MCA object scores. One-way ANOVAs: p < 0.001 for dimension 1: F (2, 116) = 30.928. Only dimension 1 is a significant predictor for Family B. Dimension 1 (On-Demand Support) captures this task-oriented nature. It reflects a focus on providing specific types of practical assistance when needed. Dimension 2 (Social Contact) is not a significant predictor of visit frequency for Family B. This further supports the idea that visits pertaining to this family are not primarily driven by a desire for social engagement but rather a specific need for support.
Table A14.
Cluster distribution and centroids of Family B’s two-step cluster analysis.
Table A14.
Cluster distribution and centroids of Family B’s two-step cluster analysis.
| Cluster | N | Percentage of Combined | Object Score Dimension 1 (On-Demand Support) | Object Score Dimension 2 (Social Contact) | ||
|---|---|---|---|---|---|---|
| Mean | Std. | Mean | Std. | |||
| Cluster B1 | 17 | 11.6% | −1.475 | 1.720 | 0.328 | 2.021 |
| Cluster B2 | 46 | 38.7% | 0.062 | 0.811 | 0.029 | 1.294 |
| Cluster B3 | 56 | 47.1% | 0.368 | 0.353 | −0.114 | 0.469 |
| Combined | 119 | 100% | −0.013 | 1.044 | 0.004 | 1.148 |
Dimension 2 scores are provided for reference but were not found to be significant predictors of visit frequency in the regression analysis (Table A12).
Table A15.
Descriptive statistics of Family B clusters based on MCA dimension scores.
Table A15.
Descriptive statistics of Family B clusters based on MCA dimension scores.
| Variables | Percentages in Clusters 1 | Chi-Square Tests (p-Value) 2 | Characteristic | ||||||
|---|---|---|---|---|---|---|---|---|---|
| Cluster B1 | Cluster B2 | Cluster B3 | |||||||
| Age | <50 years | 10 | 58.8% | 27 | 65.9% | 40 | 71.4% | - | B3: predominantly younger; Cluster B1 and B2: mix |
| ≥50 years | 7 | 41.2% | 14 | 34.1% | 16 | 28.6% | |||
| Relationship | Parent | 1 | 5.9% | 1 | 2.2% | - | - | - | Predominantly children and a small proportion of siblings in all clusters |
| Child | 12 | 70.6% | 31 | 68.9% | 39 | 70.9% | |||
| Sibling | 3 | 17.6% | 10 | 22.0% | 14 | 25.5% | |||
| Relatives from Seimou area | 15 | 88.2% | 35 | 81.4% | 25 | 45.5% | <0.001 | Cluster B1 and B2: Seimou-based | |
| Relatives from Kanto region | 1 | 5.9% | 4 | 9.3% | 19 | 34.5% | Cluster B3: mix | ||
| Hometown visits (weekly) | 17 | 100% | - | - | - | - | <0.001 | Cluster B1: highly frequent visits Cluster B2: frequent visits; Cluster B3: infrequent visits | |
| Hometown visits (monthly) | - | - | 46 | 100% | - | - | |||
| Hometown visits (yearly) | - | - | - | - | 56 | 100% | |||
| Chore support 3 | 5 | 29.4% | 7 | 15.2% | 7 | 12.5% | - | Low-level chore support across all clusters | |
| Grave visit 3 | 6 | 35.3% | 24 | 52.2% | 30 | 53.6% | - | Low levels in Cluster B1 | |
| Outdoor leisure activities (weekly) | 4 | 25.0% | 2 | 4.8% | 1 | 1.9% | <0.05 | Cluster B1: high levels of engagement in outdoor leisure activities Cluster B2 and B3: moderate levels of engagement | |
| Outdoor leisure activities 3 | 12 | 75.0% | 21 | 50.0% | 31 | 59.6% | |||
| Shopping support (>monthly) | 9 | 52.9% | 9 | 22.0% | - | - | <0.001 | Cluster B1: frequent shopping support; Cluster B2: lower-level shopping support; Cluster B3: infrequent shopping support | |
| Shopping support (yearly only) | 2 | 11.8% | 8 | 19.5% | 11 | 20.4% | |||
| Yard work support (weekly) | 3 | 17.6% | 1 | 2.5% | - | - | <0.001 | Cluster B1: moderate-level support; Cluster B2 and B3: infrequent yard work support | |
| Yard work support 3 | 8 | 47.1% | 4 | 10.0% | 2 | 3.6% | |||
| Farm work support (weekly) | 3 | 17.6% | 1 | 2.4% | 1 | 1.9% | <0.05 | Cluster B1: moderate level support; Cluster B2 and B3: infrequent farm work support | |
| Farm work support 3 | 7 | 41.2% | 3 | 7.3% | 2 | 11.1% | |||
| High-frequency social activities (>monthly) | 4 | 23.5% | 3 | 6.7% | - | - | <0.001 | Cluster B1: high level of social activity engagement; | |
| Social activities 3 | 12 | 71.6% | 12 | 26.7% | 12 | 21.8% | Clusters B2 and B3: lower engagement | ||
| Community activities 3 | 8 | 53.7% | 10 | 23.8% | 10 | 17.9% | <0.001 | Cluster B1: moderate levels of engagement; Cluster B2 and B3: lower engagement | |
| Shopping and medical care support needed by residents 4 | 9 | 46.2% | 17 | 69.0% | 19 | 66.7% | - | Cluster B1: lower support needed; Cluster B2 and B3: higher support needed | |
1 Percentages are within-cluster proportions based on valid responses; sample sizes vary across variables. 2 p-values are based on chi-square tests and indicate whether a characteristic significantly differs across clusters. 3 Chore support, grave visits, outdoor leisure activities, yard work support, farm work support, social activities, and community activities indicate participation, not frequency. 4 Support needed by residents refers to the proportion of households within each cluster requiring external support for shopping or healthcare (Table A2, Q4; the numbers of mutual-aid and combined-support households).
References
- Liu, Y.; Li, Y. Revitalize the world’s countryside. Nature 2017, 548, 275–277. [Google Scholar] [CrossRef] [PubMed]
- Johnson, K.M.; Lichter, D.T. Rural depopulation: Growth and decline processes over the past century. Rural Sociol. 2019, 84, 3–27. [Google Scholar] [CrossRef]
- Lobao, L. A Sociology of the Periphery Versus a Peripheral Sociology: Rural Sociology and the Dimension of Space 1. Rural Sociol. 1996, 61, 77–102. [Google Scholar] [CrossRef]
- Naumann, M.; Reichert-Schick, A. Infrastrukturelle Peripherisierung: Das Beispiel Uecker-Randow (Deutschland). Plan. Rev. 2012, 48, 27–45. [Google Scholar] [CrossRef]
- Tenza-Peral, A.; Pérez-Ibarra, I.; Breceda, A.; Martínez-Fernández, J.; Giménez, A. Can local policy options reverse the decline process of small and marginalized rural areas influenced by global change? Environ. Sci. Policy 2022, 127, 57–65. [Google Scholar] [CrossRef]
- Li, Y.; Li, Y.; Westlund, H.; Liu, Y. Urban–rural transformation in relation to cultivated land conversion in China: Implications for optimizing land use and balanced regional development. Land Use Policy 2015, 47, 218–224. [Google Scholar] [CrossRef]
- Camarero, L.; Oliva, J. Thinking in rural gap: Mobility and social inequalities. Palgrave Commun. 2019, 5, 95. [Google Scholar] [CrossRef]
- Ricardo Grau, H.; Mitchell Aide, T. Are Rural–Urban Migration and Sustainable Development Compatible in Mountain Systems? Mt. Res. Dev. 2007, 27, 119–123. [Google Scholar] [CrossRef]
- Gizzi, F.T.; Antunes, I.M.H.R.; Reis, A.P.M.; Giano, S.I.; Masini, N.; Muceku, Y.; Pescatore, E.; Potenza, M.R.; Corbalán Andreu, C.; Sannazzaro, A.; et al. From Settlement Abandonment to Valorisation and Enjoyment Strategies: Insights through EU (Portuguese, Italian) and Non-EU (Albanian) ‘Ghost Towns’. Heritage 2024, 7, 3867–3901. [Google Scholar] [CrossRef]
- Li, Y.; Westlund, H.; Liu, Y. Why some rural areas decline while some others not: An overview of rural evolution in the world. J. Rural Stud. 2019, 68, 135–143. [Google Scholar] [CrossRef]
- Cabinet Office, Government of Japan. Chapter 2: International Trends in Aging, (2) Japan Has the Highest Aging Rate in the World. In Annual Report on the Aging Society; Reiwa 6 Edition; Cabinet Office: Tokyo, Japan, 2022; Available online: https://www8.cao.go.jp/kourei/whitepaper/w-2024/zenbun/06pdf_index.html (accessed on 22 January 2025).
- Ministry of Internal Affairs and Communications, Regional Revitalization Group, Deprived Areas Countermeasures Office. Current Status of Countermeasures for Deprived Areas. 2024. Available online: https://www.soumu.go.jp/main_sosiki/jichi_gyousei/c-gyousei/2001/kaso/kasomain8.htm (accessed on 22 January 2024).
- Van Houtven, C.H.; Norton, E.C. Informal care and health care use of older adults. J. Health Econ. 2004, 23, 1159–1180. [Google Scholar] [CrossRef] [PubMed]
- Ogawa, N. What Is Regional Revitalization? The Duality of Regional Revitalization (地域活性化とは何か: 地域活性化の二面性). J. Urban Manag. Local Gov. Res. 2013, 28, 42–53. [Google Scholar]
- Ogawa, N. Regional Revitalization and Local Creation. Onomichi City Univ. Econ. Inf. Bull. 2016, 16, 17–37. [Google Scholar] [CrossRef]
- Cabinet Office, Government of Japan. Basic Policy for Town, People, and Job Creation 2021 (まち・ひと・しごと創生基本方針 2021). Available online: https://www.chisou.go.jp/sousei/info/index.html#an20 (accessed on 22 January 2025).
- Kameda, S. Issues in Hilly and Mountainous Areas: Focusing Mainly on the Direct Payment System (中山間地域の諸問題, 主に直接支払制度をめぐって). Ref. Jpn. Natl. Diet Libr. 2009, 59, 5–26. [Google Scholar]
- Ministry of Internal Affairs and Communications, Japan, Relationship Population. Available online: https://www.soumu.go.jp/kankeijinkou/about/index.html (accessed on 22 January 2025).
- Ashida, T. One Case of How People Come to Their Rural Home Village and Assist Farming There: A Case Study of a Kitakanto Rural Village. J. Rural Plan. 2006, 25, 473–478. [Google Scholar] [CrossRef][Green Version]
- Gieling, J.; Vermeij, L.; Haartsen, T. Beyond the Local-Newcomer Divide: Village Attachment in the Era of Mobilities. J. Rural Stud. 2017, 55, 237–247. [Google Scholar] [CrossRef]
- Champion, T.; Hugo, G. Introduction: Moving beyond the urban-rural dichotomy. In New Forms of Urbanization, 1st ed.; Routledge: New York, NY, USA, 2017; pp. 3–24. [Google Scholar]
- Pallagst, K.; Wiechmann, T.; Martinez-Fernandez, C. (Eds.) Shrinking Cities: International Perspectives and Policy Implications, 1st ed.; Routledge: New York, NY, USA, 2013. [Google Scholar] [CrossRef]
- Iwasaki, Y. Shrinkage of regional cities in Japan: Analysis of changes in densely inhabited districts. Cities 2021, 113, 103168. [Google Scholar] [CrossRef]
- Mitchell, C.J.A. Making sense of counterurbanization. J. Rural Stud. 2004, 20, 15–34. [Google Scholar] [CrossRef]
- Janc, K.; Dołzbłasz, S.; Raczyk, A.; Skrzypczyński, R. Winding Pathways to Rural Regeneration: Exploring Challenges and Success Factors for Three Types of Rural Changemakers in the Context of Knowledge Transfer and Networks. Sustainability 2023, 15, 6612. [Google Scholar] [CrossRef]
- Champion, T. Urbanization, suburbanization, counterurbanization and reurbanization. In Handbook of Urban Studies; Paddison, R., Ed.; SAGE Publications Ltd.: Thousand Oaks, CA, USA, 2001; Volume 160, pp. 143–161. [Google Scholar]
- Klien, S. “The young, the stupid, and the outsiders”: Urban migrants as heterotopic selves in post-growth Japan. Asian Anthropol. 2022, 21, 10–23. [Google Scholar] [CrossRef]
- Halfacree, K. From dropping out to leading on? British counter-cultural back-to-the-land in a changing rurality. Prog. Hum. Geogr. 2006, 30, 309–336. [Google Scholar] [CrossRef]
- Benson, M.; O’Reilly, K. Migration and the Search for a Better Way of Life: A Critical Exploration of Lifestyle Migration. Sociol. Rev. 2009, 57, 608–625. [Google Scholar] [CrossRef]
- Odagiri, T.; Tsutsui, K. Creating New Agricultural and Mountain Villages with Migrants: Series Rural Return Vol. 3–Past, Present, and Future of Rural Return (シリーズ田園回帰, 田園回帰の過去・現在・未来, 移住者と創る新しい農山村); Rural Culture Association Japan (Nōbunkyō): Tokyo, Japan, 2016. [Google Scholar]
- Hattori, K.; Kaido, K.; Matsuyuki, M. The development of urban shrinkage discourse and policy response in Japan. Cities 2017, 69, 124–132. [Google Scholar] [CrossRef]
- White Paper on Land, Infrastructure, Transport and Tourism in Japan. 2020. Available online: https://www.mlit.go.jp/statistics/file000004.html (accessed on 1 November 2024).
- Ministry of Internal Affairs and Communications. Questionnaire Survey Results on Migrants to Depopulated Areas: The 2nd “Denenkaiki” Research Meeting, FY2017. 2017. Available online: https://www.soumu.go.jp/main_sosiki/jichi_gyousei/c-gyousei/2001/kaso/02gyosei10_04000047.html (accessed on 22 January 2025).
- Luzi, C. The gap between administration and migrants: Terminologies and experiences of urban-rural migration in Japan. J. Rural Stud. 2025, 113, 103500. [Google Scholar] [CrossRef]
- Ji, N.Y. Return to the countryside: An ethnographic study of young urbanites in Japan’s shrinking regions. J. Rural Stud. 2024, 107, 103254. [Google Scholar] [CrossRef]
- Zollet, S.; Qu, M. Revitalising rural areas through counterurbanisation: Community-oriented policies for the settlement of urban newcomers. Habitat Int. 2024, 145, 103022. [Google Scholar] [CrossRef]
- Takahashi, Y.; Kubota, H.; Shigeto, S.; Yoshida, T.; Yamagata, Y. Diverse values of urban-to-rural migration: A case study of Hokuto City, Japan. J. Rural Stud. 2021, 87, 292–299. [Google Scholar] [CrossRef]
- Statistics Division, Bureau of General Affairs, Tokyo Metropolitan Government. Estimated Population of Tokyo: Monthly Data. Available online: https://www.toukei.metro.tokyo.lg.jp/jsuikei/js-index.htm (accessed on 22 January 2025).
- Statistics Bureau, Ministry of Internal Affairs and Communications. The Shape of Municipalities Seen Through Statistics. Available online: https://www.stat.go.jp/data/s-sugata/naiyou.html (accessed on 22 January 2025).
- Cyrek, M.; Cyrek, P. Living standards in rural areas of European Union countries. J. Rural Stud. 2025, 113, 103507. [Google Scholar] [CrossRef]
- Dillman, D.A.; Tremblay, K.R. The Quality of Life in Rural America. ANNALS Am. Acad. Political Soc. Sci. 1977, 429, 115–129. [Google Scholar] [CrossRef]
- Dilley, L.; Gkartzios, M.; Odagiri, T. Developing counterurbanisation: Making sense of rural mobility and governance in Japan. Habitat Int. 2022, 125, 102595. [Google Scholar] [CrossRef]
- Barcus, H.R.; Brunn, S.D. Place elasticity: Exploring a new conceptualization of mobility and place attachment in rural America. Geogr. Ann. Ser. B Hum. Geogr. 2010, 92, 281–295. [Google Scholar] [CrossRef]
- Cloke, P.; Milbourne, P.; Widdowfield, R. The complex mobilities of homeless people in rural England. Geoforum 2003, 34, 21–35. [Google Scholar] [CrossRef]
- Milbourne, P.; Kitchen, L. Rural mobilities: Connecting movement and fixity in rural places. J. Rural Stud. 2014, 34, 326–336. [Google Scholar] [CrossRef]
- Kimura, K.; Sakurai, Y. A study on the characteristic of Private Subdivision Dwellers in the suburb of Fukui city from the view of the connection to their hometown and the residence career A basic study on the continuity of habitation in the suburb of local city. J. City Plan. Inst. Jpn. 2005, 40, 529–534. [Google Scholar] [CrossRef]
- Cabinet Office, Government of Japan. Fiscal Year 2008 Edition: Regional Economy, Chapter 2, Section 1, 1. In Population Movements by Regional Block; Cabinet Office: Tokyo, Japan, 2008; Available online: https://www5.cao.go.jp/j-j/cr/cr08/chr08_2-1-1.html (accessed on 22 January 2025).
- Ministry of Internal Affairs and Communications, Municipal Administration Division. National Overview of Municipalities: Reiwa 5 Edition; Ministry of Internal Affairs and Communications: Tokyo, Japan, 2023. [Google Scholar]
- Shimogo Town Office. Shimogo Town Official Website. Available online: https://www.town.shimogo.fukushima.jp/index.html (accessed on 4 January 2025).
- Statistics Bureau, Government of Japan. Population Census: Main Results by Prefecture, Municipality, 2005–2020. Available online: https://www.e-stat.go.jp/stat-search/files?page=1&layout=datalist&toukei=00200521&tstat=000001049104&cycle=0&tclass1=000001049105&tclass2val=0 (accessed on 22 January 2025).
- Nanmoku Village Office. Nanmoku Village Official Website. Available online: https://nanmoku.ne.jp (accessed on 22 January 2025).
- Wang, W.; Saito, Y. Aging in Place in a Depopulated, Mountainous Area: The Role of Hometown-Visiting Family Members in Shimogo, Japan. Sustainability 2024, 16, 10547. [Google Scholar] [CrossRef]
- Rioux, L. The well-being of aging people living in their own homes. J. Environ. Psychol. 2005, 25, 231–243. [Google Scholar] [CrossRef]
- Sugiyama, M.; Ikuta, E.; Okazaki, K.; Takai, I.; Mori, K. Activity Environment Based on Lifestyle Types of New Town Residents: Activity Environment for Prevention of Locomotive Syndrome in the Elderly Part 1. J. Archit. Plan. 2015, 80, 341–350. [Google Scholar] [CrossRef]
- Abdi, H.; Valentin, D. Multiple correspondence analysis. Encycl. Meas. Stat. 2007, 2, 651–657. Available online: https://personal.utdallas.edu/~Herve/Abdi-MCA2007-pretty.pdf (accessed on 1 December 2024).
- Hoffman, D.L.; De Leeuw, J. Interpreting multiple correspondence analysis as a multidimensional scaling method. Mark. Lett. 1992, 3, 259–272. [Google Scholar] [CrossRef]
- Lolle, H. Multiple Classification Analysis (MCA): Unfortunately, a nearly forgotten method for doing linear regression with categorical variables. In Symposium I Anvendt Statistik; Copenhagen Business School & Statistics: Copenhagen, Denmark, 2008; pp. 103–122. [Google Scholar]
- Fithian, W.; Josse, J. Multiple correspondence analysis and the multilogit bilinear model. J. Multivar. Anal. 2017, 157, 87–102. [Google Scholar] [CrossRef]
- Audigier, V.; Husson, F.; Josse, J. MIMCA: Multiple imputation for categorical variables with multiple correspondence analysis. Stat. Comput. 2017, 27, 501–518. [Google Scholar] [CrossRef]
- Frades, I.; Matthiesen, R. Overview on Techniques in Cluster Analysis. In Bioinformatics Methods in Clinical Research; Methods in Molecular Biology (MIMB); Springer: New York, NY, USA, 2009; Volume 593, pp. 81–107. [Google Scholar] [CrossRef]
- Satish, S.M.; Bharadhwaj, S. Information search behaviour among new car buyers: A two-step cluster analysis. IIMB Manag. Rev. 2010, 22, 5–15. [Google Scholar] [CrossRef]
- Li, H.; Zou, M.; Li, B.; Xu, X.; Zhang, Z.; Tang, X.; Ma, L.; Feng, S.; Liu, W. Two-step cluster analysis based on three-dimensional CT measurements of craniofacial structures in severe craniofacial microsomia. J. Plast. Reconstr. Aesthetic Surg. 2024, 99, 256–262. [Google Scholar] [CrossRef]
- Lupton, R.C.; Allwood, J.M. Hybrid Sankey diagrams: Visual analysis of multidimensional data for understanding resource use. Resour. Conserv. Recycl. 2017, 124, 141–151. [Google Scholar] [CrossRef]
- Vining, D.R.; Pallone, R. Migration between core and peripheral regions: A description and tentative explanation of the patterns in 22 countries. Geoforum 1982, 13, 339–410. [Google Scholar] [CrossRef]
- Svendsen, G.L.H.; Sørensen, J.F.L. There’s more to the picture than meets the eye: Measuring tangible and intangible capital in two marginal communities in rural Denmark. J. Rural Stud. 2007, 23, 453–471. [Google Scholar] [CrossRef]
- Sakuma, M. Measures for the sustainability of depopulated and aging mountain villages. Sociol. Stud. 2017, 100, 83–104. [Google Scholar] [CrossRef]
- Tanaka, S.; Yamashita, Y. New relationships between regional cities and depopulated areas. Annu. Rep. Jpn. Assoc. Urban Sociol. 1999, 17, 109–126. [Google Scholar] [CrossRef]
- Yamaguchi, Y. Youth Employment Mobility and Residential Choice: Urban Orientation and Local Settlement (若者の就职移动と居住地选択―都会志向と地元定着―); Kokon Shoin: Tokyo, Japan, 2018. [Google Scholar]
- Odagiri, T. Rural Innovation Theory and Supporters for Rural Regeneration. J. Rural Plan. Assoc. 2013, 32, 384–387. [Google Scholar] [CrossRef][Green Version]
- Shanin, T. The Nature and Logic of the Peasant Economy I: A Generalisation. J. Peasant Stud. 1973, 1, 63–80. [Google Scholar] [CrossRef]
- Creed, G.W. “Family Values” and Domestic Economies. Annu. Rev. Anthropol. 2000, 29, 329–355. [Google Scholar] [CrossRef]
- Harrison, E. ‘People are willing to fight to the end’. Romanticising the ‘moral’ in moral economies of irrigation. Crit. Anthropol. 2020, 40, 194–217. [Google Scholar] [CrossRef]
- Peterson, N.; Taylor, J. The modernising of the indigenous domestic moral economy: Kinship, accumulation and household composition. Asia Pac. J. Anthropol. 2003, 4, 105–122. [Google Scholar] [CrossRef]
- Seki, I. Consideration about the heir to the system of mutual aid in the fishing community. J. Rural Plan. Assoc. 2014, 33, 17–20. [Google Scholar] [CrossRef][Green Version]
- Kusumoto, Y. Changing Rural Communities and Research Trends in the Architectural Institute of Japan. J. Rural Plan. Assoc. 1983, 2, 4–12. [Google Scholar] [CrossRef][Green Version]
- Takeguchi, Y.; Suzuki, S. Approaches to Settlement Support in an Era of Extreme Population Decline and Aging Society. Stud. Reg. Sci. 2021, 51, 15–35. [Google Scholar] [CrossRef]
- Iversen, E.B.; Lockstone-Binney, L.; Ibsen, B. Can the participation of civil society in policy networks mitigate against societal challenges in rural areas? J. Rural Stud. 2025, 113, 103495. [Google Scholar] [CrossRef]
- Takano, K. Sociological Analysis of Living Spaces Among Residents in Depopulated Areas: Analysis based on the Results of a Survey in the Tamagawa Area, Yamaguchi Prefecture; Faculty of Human-Environment Studies, Kyushu University: Fukuoka, Japan, 2024; Volume 13, pp. 57–74. [Google Scholar] [CrossRef]
- Klien, S. Post-pandemic developments in lifestyle migration in Japan: From back-to-the-land to urbanrural? J. Rural Stud. 2025, 114, 103505. [Google Scholar] [CrossRef]
Disclaimer/Publisher’s Note: The statements, opinions and data contained in all publications are solely those of the individual author(s) and contributor(s) and not of MDPI and/or the editor(s). MDPI and/or the editor(s) disclaim responsibility for any injury to people or property resulting from any ideas, methods, instructions or products referred to in the content. |
© 2025 by the authors. Licensee MDPI, Basel, Switzerland. This article is an open access article distributed under the terms and conditions of the Creative Commons Attribution (CC BY) license (https://creativecommons.org/licenses/by/4.0/).