Abstract
In recent years, the combined effects of rapid urbanization and climate change have led to frequent floods in urban areas. Rainstorm flood risk warning systems play a crucial role in urban flood prevention and mitigation. However, there has been limited research in China on nationwide urban flood risk warning systems based on rainfall predictions. This study constructs a two-level early warning system (EWS) at the national and urban levels using a two-dimensional hydrological–hydrodynamic model considering infiltration and urban drainage standards. A methodology for urban rainstorm flood risk warnings is proposed, leveraging short-term and high-resolution rainfall forecast data to provide flood risk warnings for 231 cities in central and eastern China. Taking Beijing as an example, a refined rainstorm flood warning technique targeting city, district, and street scales is developed. We validated the methodology with monitoring data from the “7.31” rainstorm event in 2023 in Beijing, demonstrating its applicability. It is expected that the findings of this study will serve as a valuable reference for the urban rainstorm flood risk warning system in China.
1. Introduction
In recent years, the dual pressures of global climate change and rapid urbanization have led to an increased frequency of extreme rainfall and urban flood events [1,2,3,4,5]. These events severely disrupt urban functionality and pose significant threats to lives and property [6,7,8,9]. Particularly, from 17 to 23 July 2021, Henan Province experienced severe flooding, resulting in 398 deaths or disappearances and direct economic losses of 120.06 billion yuan [10]. According to the China Bulletin on Flood and Drought Disasters, over the past decade, more than 100 cities in China annually experienced severe inundation or urban flooding.
Amid this backdrop of frequent extreme weather and recurrent urban flooding during heavy rainfall [11,12,13], the ability to anticipate, assess, and mitigate urban flood risks has become a pressing issue. Timely dissemination of early warning information is essential to guide public responses, safeguard lives, and minimize economic losses. In response, several cities in China, including Beijing, Shanghai, Shenzhen, Wuhan, Nanjing, Xi’an, and Kunming, have initiated exploratory efforts in urban flood early warning systems [14,15,16,17,18,19]. For instance, Yang Biao and colleagues proposed an urban flood monitoring and early warning system applied in selected regions of Shantou City [20], while Cao Xuejian and co-authors developed a comprehensive observation-based urban flood risk early warning system, tested in Beijing’s Qinghe River basin [21].
Advances in numerical flood modeling, the Internet of Things, big data, artificial intelligence, and cloud computing have catalyzed the transition from conventional meteorological rainstorm warnings to more targeted urban flood early warning systems [22,23,24,25,26]. Currently, urban flood early warning methods can be categorized into the following three types. 1. Monitoring-based warning: This approach installs monitoring facilities in flood-prone areas to measure inundation depth and extent, enabling real-time urban flood warnings based on monitored data [27,28,29]. 2. Forecast-based warning using rainfall predictions: Early warnings are issued based on the forecasted rainfall intensity and coverage. However, this method operates on a large spatial scale and does not account for the complex urban rainfall-runoff processes. 3. Forecast-based warning using rainstorm-flood models: This method constructs urban rainstorm flood models driven by high-resolution, short-term rainfall forecasts, real-time hydrological and meteorological data, and operational conditions. It predicts surface inundation depth, duration, and extent, providing short-term, high-resolution, and large-scale urban flood warnings [30,31,32,33].
This paradigm shift allows for proactive flood risk management by predicting urban inundation areas before heavy rainfall events, enabling more precise disaster prevention and mitigation strategies. Unlike traditional approaches that rely solely on storm forecast data, urban flood early warning systems forecast inundation distribution before extreme rainfall, issuing risk alerts tailored to specific scenarios.
Despite promising developments, significant challenges remain. Many developed cities in China face high costs, slow computation speeds, and inconsistent warning metrics in implementing refined flood simulation models. Additionally, there is a nationwide lack of systems capable of providing rapid urban flood risk warnings for multiple cities simultaneously. To address these gaps, the Chinese Ministry of Emergency Management (MEM) in 2022 outlined a national-level requirement for rainstorm-induced urban flood early warning services in central and eastern China. Subsequently, the China Institute of Water Resources and Hydropower Research, in collaboration with the National Disaster Reduction Center, undertook the development of an urban rainstorm flood early warning model.
This study addresses the urgent need for rainstorm-induced urban flood risk warnings in central and eastern Chinese cities. By leveraging two-dimensional hydrological–hydrodynamic models and high-performance computing, we propose an early warning system (EWS). Furthermore, we introduce an administrative-level urban flood early warning system based on forecasted rainfall, providing robust technical support for urban flood prevention and mitigation efforts.
2. Methodology
2.1. Structure of the EWS
The EWS establishes flood models to calculate flood risk elements such as inundation depth and duration and classifies urban flood risk warning levels based on predefined indicators. Urban flood risk warning operates at two levels. At the national level, rapid warnings are issued for 231 prefecture-level and above cities across 24 regions, including Guangdong, Fujian, and Zhejiang, as shown in Figure 1. At the urban level, the focus shifts to flood risks in administrative divisions such as districts, counties, and streets.
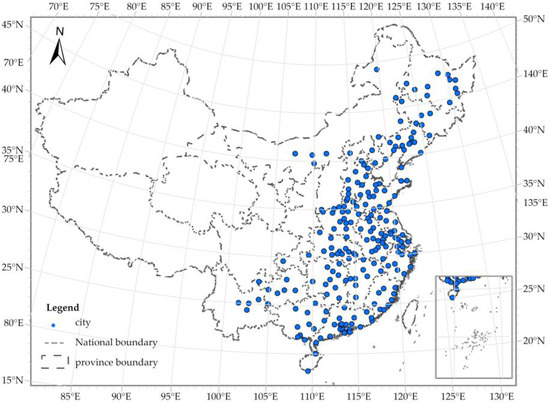
Figure 1.
Study area and city locations. Map lines delineate study areas and do not necessarily depict accepted national boundaries.
The EWS (Figure 2) first conducts national-level warnings, issuing warning levels for 231 cities. Subsequently, for cities with yellow or higher warning levels, urban-level risk warnings are carried out, resulting in risk warning levels for three types of administrative divisions: city-level, district-level, and street-level.
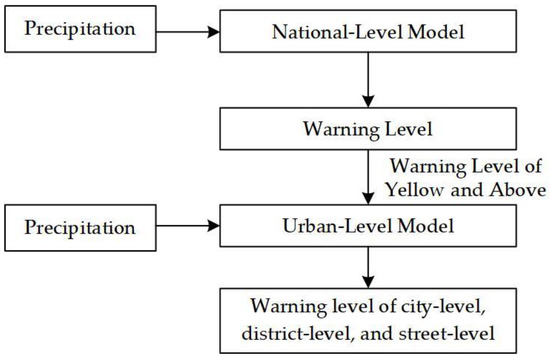
Figure 2.
Flow chart of EWS.
2.2. Model Construction
2.2.1. Hydrodynamic Method
The two-dimensional shallow water equations are widely used for modeling hydrodynamic processes dominated by horizontal water flow, such as surface runoff in urban areas, nearshore waves, and tides. The vector form of these equations is as follows:
In the equations, the variables are defined as follows: t is time, U represents the vector of conserved variables, including water depth (h) and momentum (hu and hv), F and G are the flux vectors along the x- and y-axes in the Cartesian coordinate system, representing momentum transport in their respective directions, and S is the source term vector, which includes factors such as rainfall, infiltration, bed slope, and friction.
In the equations, g represents the gravitational acceleration with a value of 9.81 m/s2, h is the water depth, u and v are the depth-averaged velocities in the x- and y-directions, respectively, R is the rainfall intensity, I is the infiltration rate, z is the bed elevation, and Cf is the friction coefficient, determined by , where n is Manning’s roughness coefficient.
In this study, the widely used modified Horton equation is employed as the method for calculating infiltration.
In the equation, fc represents the minimum infiltration rate or steady-state infiltration rate, f0 is the maximum infiltration rate or initial infiltration rate, and kd is the decay coefficient. This equation describes the decay process of the infiltration rate over time, reflecting the differences in infiltration capacity between the initial and steady-state phases of rainfall.
The drainage capacity of the urban sewer network is based on the urban drainage planning of each city and is subtracted during the infiltration process. For example, if the drainage standard is designed for a 3-year recurrence interval, the corresponding rainfall intensity is calculated based on the storm event formula, and then the net rainfall input model is used for flood inundation calculations.
The model [34] utilizes structured uniform orthogonal grids for discretization and employs the finite volume method for numerical computation.
2.2.2. The National Model
The EWS consists of two components: the National Urban Rainstorm-Inundation Model and the City-Level Rainstorm-Inundation Model. When the national model detects flood risks in specific cities, it activates the detailed city-level risk warning models for those areas.
In China, among cities tasked with flood prevention, there are 31 key flood control cities and 54 important flood control cities, predominantly located in the southeastern region of the Hu Huanyong Line in central and eastern China. Therefore, the national rainstorm-inundation warning model primarily targets major cities in the central and eastern regions. This includes 231 prefecture-level and above cities across 24 regions, such as Guangdong, Fujian, and Zhejiang provinces.
The elevation data (Figure 3) used in this study are based on the 30 m resolution ASTER GDEM V3 (https://www.gscloud.cn accessed on 20 September 2023), and the land use data (Figure 3) is sourced from the Resource and Environmental Science and Data Center, Chinese Academy of Sciences (https://www.resdc.cn accessed on 20 September 2023).
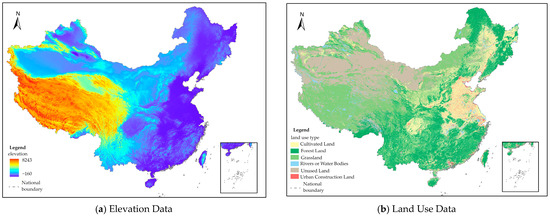
Figure 3.
Elevation data and land use data. Map lines delineate study areas and do not necessarily depict accepted national boundaries.
Based on collected data, including China’s administrative boundary vector maps, terrain elevation data, land use type data, soil type data, and the Outdoor Drainage Design Standard (GB50014-2021) (Table 1), a regular grid with a resolution of 1 km × 1 km was established. Following the research [35,36], infiltration and surface roughness parameters were calibrated using land use type data. Parameter selections are summarized in Table 2.

Table 1.
The design return period of storm sewer.
Table 2.
Manning’s roughness coefficient and infiltration parameters.
Since this study primarily focuses on urban flooding, particularly the impact of rainfall on cities, the built-up areas were selected as the study sites. The data on urban built-up areas is derived from the China 2020 Built-up Area Dataset published by Sun Jie [37]. A visual representation of built-up areas for select cities is shown in Figure 4.
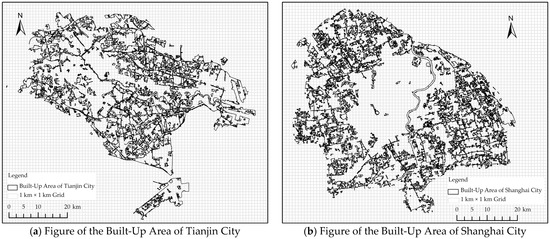
Figure 4.
Schematic diagram of built-up areas in selected cities.
2.2.3. The Urban Model
Taking Beijing as an example, the construction of the city-level model is explained in detail.
Using Beijing as an example, the construction of a localized urban flood model is explained. Based on the Beijing Urban Master Plan (2016–2035), this study focuses on early warning systems for rainstorm-induced urban flooding in the central districts of Beijing, including Dongcheng, Xicheng, Haidian, Chaoyang, Fengtai, and Shijingshan. To enhance the precision of flood early warnings, the influence of surrounding areas on the central districts was also considered. The modeling area includes the Sixth Ring Road, with an additional expansion to the southwest, as shown in Figure 5a.
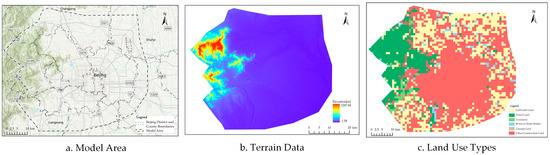
Figure 5.
Model Area, Surface Elevation, and Land Use Data.
A two-dimensional hydrodynamic model was employed to simulate and forecast urban flooding in Beijing’s central districts. The study used a grid resolution of 30 m × 30 m to construct a two-dimensional surface hydrological–hydrodynamic model, generating approximately 4.66 million grid cells. Runoff parameters and surface roughness were assigned based on land use type data. The topography and land use distribution of the study area are illustrated in Figure 5b,c. The elevation data used in this study are based on the 30 m resolution ASTER GDEM V3 (https://www.gscloud.cn), and the land use data is sourced from the Resource and Environmental Science and Data Center, Chinese Academy of Sciences (https://www.resdc.cn).
For major drainage channels in Beijing’s central districts, such as the North Canal, Wenyu River, and Liangshui River, grid elevations were adjusted based on relevant design specifications. Considering the extensive data volume of the urban stormwater drainage network and its impact on computational efficiency, this study utilized a net rainfall input model for inundation calculations. The approach was guided by outcomes from the Beijing Flood and Waterlogging Management Plan and the Flood Control and Waterlogging System Plan for Beijing’s Central Urban Area, incorporating design recurrence intervals of drainage pipelines.
2.3. Early Warning Rules
Based on the severity of urban flooding hazards, flood risk warning levels are classified into four categories: low risk, moderate risk, high risk, and very high risk. These levels are represented by blue, yellow, orange, and red, respectively (e.g., the red warning in risk alerts represents a very high risk). This study integrates early warning criteria from multiple cities, including Beijing, Wuhan, and Shanghai, to define the thresholds for urban flood risk warning levels. The threshold values are summarized in Table 3.
Table 3.
Threshold values for urban flood grid warning.
The overall urban flood warning is based on the grid calculation results from the national model, which includes parameters such as the maximum inundation depth and the longest inundation duration for the city’s built-up area. The area proportion of grids at different warning levels is then calculated to determine the overall urban warning level. For cities classified with yellow or higher warning levels, urban flood warning notifications are issued. Following this, the localized urban model is activated, and depending on the specific needs, the urban flood warning can be further subdivided into district, county, or street-level alerts.
3. Application Effects
3.1. National Early Warnings
Based on the national model, overall early warnings are issued for major cities in the central and eastern regions, and warning levels are classified accordingly. For national urban flood risk early warnings, the rainfall events are considered from 00:00 to 24:00 each day, with flood risk warnings issued for cities in the central and eastern regions of the country on that specific day.
The rainfall data selected includes hourly measured areal rainfall data from five events between 28 July and 1 August 2023. After deducting the city’s drainage capacity, the net rainfall is input into the model for flood simulation. Urban flood warnings are issued based on daily precipitation data for overall city-wide flood risk assessment.
Using the observed rainfall data from 28 July 2023 (Figure 6), flood warning levels for each city are classified based on the inundation depth and duration within the built-up areas. The warning levels are divided into blue, yellow, orange, and red, as shown in Figure 7.
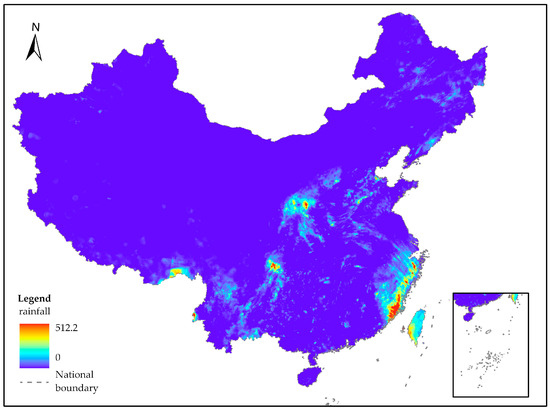
Figure 6.
Rainfall for 28 July 2023. Map lines delineate study areas and do not necessarily depict accepted national boundaries.
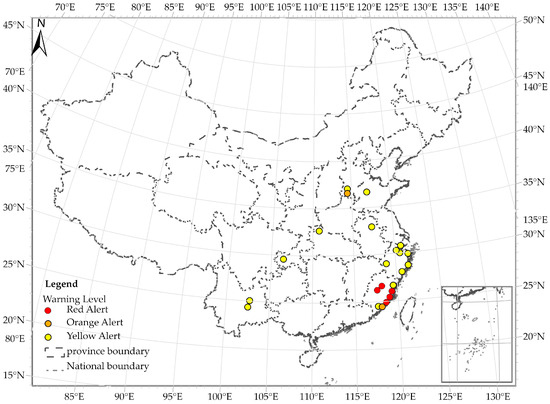
Figure 7.
National urban flood risk warning map for 28 July 2023. Map lines delineate study areas and do not necessarily depict accepted national boundaries.
According to reports, Quanzhou experienced flood risks on 28 July 2023. A total of 383 flooded road sections were reported across the city, with an inundated area of 29,180.5 m2 in Fengze District. The entire Fuzhou metro network suspended station operations, and some metro lines closed their entrances and exits. Other regions also reported urban flooding situations in the news (Figure 8).
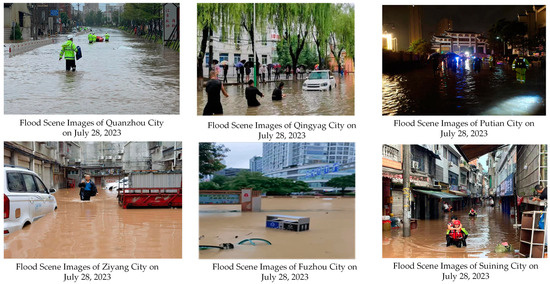
Figure 8.
Field images of urban flooding in partially successful forecasted cities on 28 July 2023.
In the equation, ACC represents the hit rate; p is the number of cities where the model issued an early warning and flooding actually occurred; and q is the total number of cities for which the model issued a warning.
In this case, flooding situations reported in the news are considered successful warnings. Among the cities with red alerts, Fuzhou, Quanzhou, and Putian had successful warnings, resulting in a hit rate of 60%. All cities with orange alerts had successful warnings, leading to a hit rate of 100%. Among the cities with yellow alerts, nine cities, including Jinan and Xingtai, had successful warnings, giving a hit rate of 62.5%. The overall hit rate for the day was 65.22%.
The forecast results from 29 July to 1 August 2023, are shown in Figure 9. Based on the actual flooding information, the five-day warning results were analyzed. The success rates for the warnings were as follows: red alert at 75%, orange at 80.77%, yellow at 49.45%, and blue at 38.46%. Among these, the success rates for blue and yellow alerts were relatively low. Analysis suggests that this may be due to shallow inundation or the use of emergency measures, such as mobile pump stations, by relevant authorities to quickly drain the water, minimizing the impact on residents’ daily lives and production. As a result, there were no related reports on these instances.
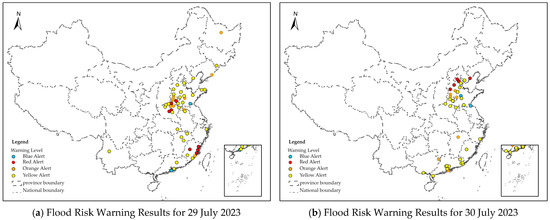
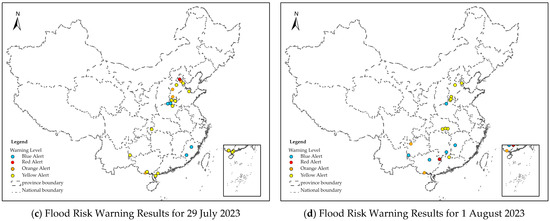
Figure 9.
Schemes follow the same formatting. Warning results from 29 July to 1 August 2023. Map lines delineate study areas and do not necessarily depict accepted national boundaries.
The national urban rainstorm flood risk early warning model has been running at the National Disaster Reduction Center for two years, and the results are considered reliable.
3.2. Urban Early Warnings
After the warning is issued, the urban model is activated. Taking Beijing, a city with a red alert warning, as an example, the urban-level rainstorm flood risk warning is conducted.
3.2.1. Reasonableness Analysis
The precipitation data used for the simulation were collected from over 300 monitoring stations, including Longquan and Dongguoyuan, with the calculation period spanning from 29 July to 2 August.
The simulation results for the maximum inundation depth distribution in central Beijing during the “23·7” rainstorm event are shown in Figure 10. According to the results, 16.96% of the total simulated area had a maximum inundation depth exceeding 0.2 m; 10.3% had a depth exceeding 0.5 m; 4.67% exceeded 1 m; and 1.48% had a depth exceeding 2 m. From Figure 10, it can be observed that the southwestern part of the study area had a relatively large maximum inundation depth, which corresponds to the flood-affected areas of Fangshan District and Mentougou District during the “23·7” Beijing extreme rainstorm event.
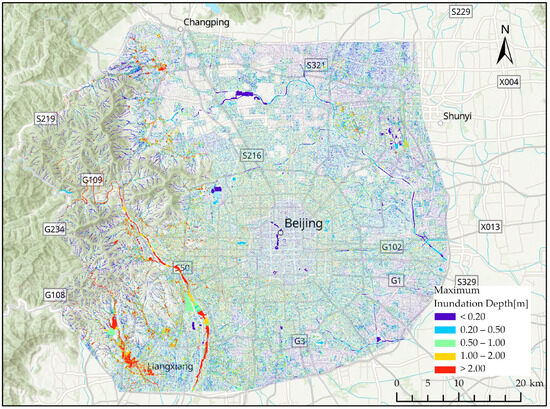
Figure 10.
Simulated maximum inundation depth map of the modeling area.
Based on the measured heights of the flood traces, the maximum water levels at 88 flooding points within the study area were collected, and the measured water depths were compared with the maximum inundation depths calculated by the model (Figure 11). Among these, 53 inundation points, where the difference between the measured and simulated depths did not exceed 15 cm, accounted for 60.28% of the total points. There were 68 inundation points where the difference did not exceed 30 cm, representing 77.27% of the total points. The predicted inundation points were largely consistent with the actual conditions.
Figure 11.
Difference distribution map between actual and simulated water depths at inundation points.
False alarms may have occurred because relevant management departments took timely drainage measures during actual rainfall events, reducing flooding, which the model was unable to capture. On the other hand, missed warnings may be related to insufficient terrain accuracy, especially in low-lying areas prone to flooding, where the model did not fully consider these terrain details.
In addition, the model was validated using typical rainfall events in Zhengzhou, a central Chinese city, and Shenzhen, a southern city. For Zhengzhou, the “7.20” extreme rainstorm was selected, and simulations based on actual rainfall data showed that 68% of inundation points had an error within 15 cm. For Shenzhen, the “9.7” extreme rainstorm was used, with 77% of inundation points having an error within 20 cm. The water levels of all inundation points were obtained through flood trace measurements.
3.2.2. Flood Warning Applications
The study further analyzed the flood risk warning levels within the built-up area of Beijing. The distribution of different warning levels is as follows: red alert grids account for 11.15% of the built-up area, orange and above warning grids make up 15.18%, yellow and above warning grids cover 18.51%, and blue and above warning grids occupy 20.54%. Based on the urban flood risk early warning thresholds, the flood risk warning level for the modeling area in Beijing is classified as a red alert.
Taking the central districts of Beijing as an example, the maximum inundation depth (max_h) is shown in Figure 12, and the proportion of maximum inundation depths and the overall flood risk warning levels are summarized in Table 4. Among these, Fengtai District had 33 inundation points, accounting for 37.5% of all inundation points in the simulation area. Of these, 6 points had a water depth exceeding 1 m, and 11 points had a depth exceeding 0.5 m.
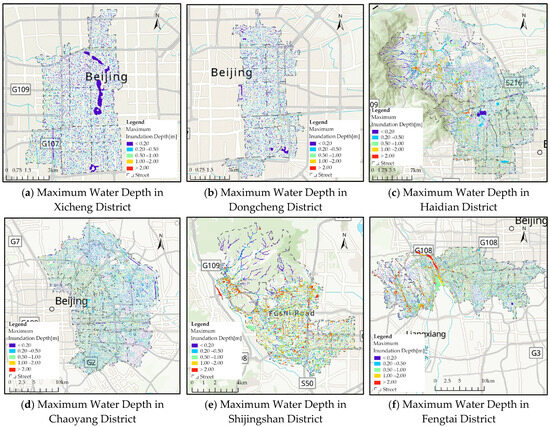
Figure 12.
Maximum inundation depth map for each district.
Table 4.
Proportion of maximum inundation depth and overall flood warning levels.
For the districts/counties that issued early warnings, street-level flood risk warnings can be further issued. Taking Dongcheng District as an example (Figure 13), the overall flood risk warning was conducted for streets such as Donghuamen Street and Qianmen Street. Due to the high drainage standards in Dongcheng District and the relatively low rainfall intensity, most areas were classified under blue alerts.
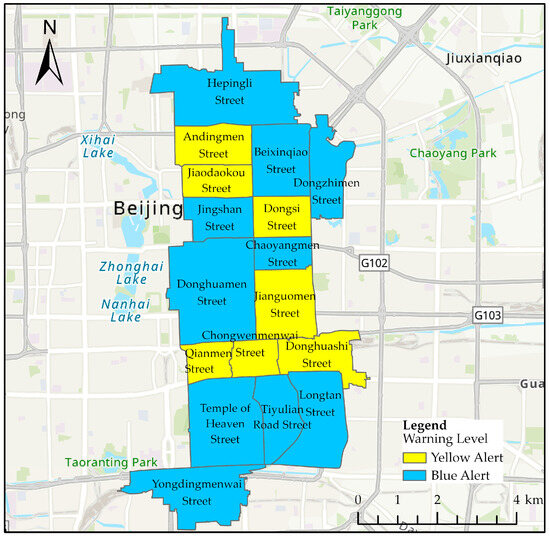
Figure 13.
Flood risk warning map for streets in Dongcheng District.
4. Discussion and Conclusions
Most urban flood warnings are targeted at small areas or individual cities [38,39], but the models often operate slowly and lack efficiency [40]. Additionally, not all cities have implemented model-based predictions, with only a few having explored this area. There is a pressing need for a model capable of providing rapid flood risk warnings for multiple cities simultaneously. To address this, this study proposes a two-layer EWS model.
The proposed two-layer EWS model consists of national and urban levels. At the national level, it simultaneously computes risk levels for 231 cities and classifies them into warning levels. For cities with warning levels of yellow or above, the urban-level warnings are activated. The urban-level warning system allows for risk warnings tailored to various administrative divisions as needed. In addition, the two-layer EWS model incorporates GPU parallel computing technology, requiring only 5 min for nation-level model computations and just 20 min for urban-level model computations.
However, this study has some limitations. First, infiltration parameters are categorized based on land use, which lacks precision. In areas with complex land use patterns, determining infiltration parameters based on broad land use categories may reduce model accuracy. Further refining land use classifications and incorporating more field-measured infiltration data can help optimize parameter settings and improve accuracy. Second, artificial drainage capacity was not considered. In cases of surface water accumulation, manual interventions often mitigate flood severity. Third, the actual drainage capacity of urban pipelines often deviates from design standards, and these discrepancies were not accounted for when building the model. Additionally, the model generalizes the drainage system, which may reduce its accuracy. Fourth, in complex urban environments, terrain accuracy significantly impacts prediction accuracy. Elevated roads, depressed areas, and other urban features can lead to errors in the prediction results. Finally, the designation of urban warning levels does not consider resilience factors such as flood control infrastructure and emergency drainage measures.
This study proposed a method for urban rainstorm flood risk warning and established a flood risk warning model for key cities in central and eastern China. Through the application of five observed rainfall events from 28 July to 1 August 2023, and the example of the Beijing “31 July 2023” rainstorm-induced urban flooding, the reasonableness of the proposed method was validated. Since the model’s implementation in 2023, it has issued over 100 flood risk warning alerts to the Ministry of Emergency Management each year, providing technical support for urban flood defense at the national level.
However, given the limitations in high-resolution city topography, drainage network data, and other data sources, further research will be needed to refine studies on urban drainage, river boundary conditions, and flood control operations. By incorporating high-resolution DEM data to improve terrain accuracy and combining detailed drainage network information, including various pipe diameters, pumping stations, and gates, the model’s simulation accuracy for drainage capacity can be enhanced.
Future research will involve refining model parameters and conducting a more comprehensive analysis of drainage networks and river characteristics in complex regions to enhance the accuracy and reliability of the urban-level model. Meanwhile, the model will incorporate the simulation of artificial drainage capacity, considering factors such as pipe sedimentation, activation of emergency pumping stations, and the impact of drainage infrastructure aging and maintenance. In addition, future research will focus on analyzing the specific impact of urban floods on vulnerable assets and incorporate factors of urban resilience to optimize urban warning thresholds. This optimization aims to enhance the precision and targeting of risk warnings, thereby improving the practical utility and reliability of the model.
The accurate operation of the EWS relies on high-precision data, including rainfall, terrain, and drainage information, as the quality of the data directly affects the accuracy of the warnings. Therefore, it is essential for cities to provide detailed and reliable data support. Furthermore, the warning thresholds of the EWS should be optimized based on the geographical characteristics, drainage capacity, and historical flood records of each city to ensure the system’s adaptability and effectiveness. Consequently, the implementation of the system requires not only technical support but also collaboration among multiple departments, including meteorology, water management, urban planning, and emergency management. These departments should work together to promote data sharing, threshold setting, and the improvement of emergency response mechanisms, thereby enhancing the city’s flood disaster warning capabilities and disaster prevention level.
Author Contributions
Conceptualization, Q.G. and F.C.; methodology, W.Z.; software, Q.G. and W.Z.; validation, X.H., H.X. and W.Z.; formal analysis, Q.G.; investigation, X.H.; resources, W.Z.; data curation, Q.G.; writing—original draft preparation, Q.G.; writing—review and editing, Q.G. and F.C.; visualization, H.Z.; supervision, H.Z.; project administration, F.C.; funding acquisition, F.C. and W.Z. All authors have read and agreed to the published version of the manuscript.
Funding
The Research was funded by the Tianjin Flood Control Dispatch Emergency Command Platform Construction Project (JZ120205A0042024) and the Recommendations for Enhancing Flood Control Capacity for Exceedance Flood Events in the Yishu River Basin (JZ0145B042024), the Flood Control and Drought Mitigation Center of the China Institute of Water Resources and Hydropower Research.
Institutional Review Board Statement
Not applicable.
Informed Consent Statement
Not applicable.
Data Availability Statement
The data that support the findings of this study are available from the corresponding author upon reasonable request.
Conflicts of Interest
The authors declare no conflicts of interest.
References
- Xu, T. Permeability Control and Flood Risk Assessment of Urban Underlying Surface: A Case Study of Runcheng South Area, Kunming. Nat. Hazards 2022, 111, 661–686. [Google Scholar] [CrossRef]
- Liu, W.; Feng, Q.; Engel, B.A.; Yu, T.; Zhang, X.; Qian, Y. A Probabilistic Assessment of Urban Flood Risk and Impacts of Future Climate Change. J. Hydrol. 2023, 618, 129267. [Google Scholar] [CrossRef]
- Hallegatte, S.; Green, C.; Nicholls, R.J.; Corfee-Morlot, J. Future Flood Losses in Major Coastal Cities. Nat. Clim. Change 2013, 3, 802–806. [Google Scholar] [CrossRef]
- Chang, L.-C.; Liou, J.-Y.; Chang, F.-J. Spatial-Temporal Flood Inundation Nowcasts by Fusing Machine Learning Methods and Principal Component Analysis. J. Hydrol. 2022, 612, 128086. [Google Scholar] [CrossRef]
- Balaian, S.K.; Sanders, B.F.; Abdolhosseini Qomi, M.J. How Urban Form Impacts Flooding. Nat. Commun. 2024, 15, 6911. [Google Scholar] [CrossRef]
- Wüthrich, D.; Korswagen, P.A.; Selvam, H.; Oetjen, J.; Bricker, J.; Schüttrumpf, H. Field Survey Assessment of Flood Loads and Related Building Damage from the July 2021 Event in the Ahr Valley (Germany). J. Flood Risk Manag. 2014, 18, e13024. [Google Scholar] [CrossRef]
- Okunola, O.H.; Werners, S.E. A Multi-Dimensional Framework for Assessing Disaster Recovery Pathways: Lessons and Experiences from Germany and Nigeria. Int. J. Disaster Risk Reduct. 2024, 112, 104777. [Google Scholar] [CrossRef]
- Yang, Q.; Zhang, S.; Dai, Q.; Yao, R. Assessment of Community Vulnerability to Different Types of Urban Floods: A Case for Lishui City, China. Sustainability 2020, 12, 7865. [Google Scholar] [CrossRef]
- He, J.; Qiang, Y.; Luo, H.; Zhou, S.; Zhang, L. A Stress Test of Urban System Flooding upon Extreme Rainstorms in Hong Kong. J. Hydrol. 2021, 597, 125713. [Google Scholar] [CrossRef]
- Wu, Z.; Zheng, X.; Chen, Y.; Huang, S.; Hu, W.; Duan, C. Urban Flood Loss Assessment and Index Insurance Compensation Estimation by Integrating Remote Sensing and Rainfall Multi-Source Data: A Case Study of the 2021 Henan Rainstorm. Sustainability 2023, 15, 11639. [Google Scholar] [CrossRef]
- Wang, P.; Li, Y.; Yu, P.; Zhang, Y. The Analysis of Urban Flood Risk Propagation Based on the Modified Susceptible Infected Recovered Model. J. Hydrol. 2021, 603, 127121. [Google Scholar] [CrossRef]
- Liang, Y.; Liao, W.; Zhang, Z.; Li, H.; Wang, H. Using a Multiphysics Coupling-Oriented Flood Modelling Approach to Assess Urban Flooding under Various Regulation Scenarios Combined with Rainstorms and Tidal Effects. J. Hydrol. 2024, 645, 132189. [Google Scholar] [CrossRef]
- Zhao, G.; Xu, Z.; Pang, B.; Tu, T.; Xu, L.; Du, L. An Enhanced Inundation Method for Urban Flood Hazard Mapping at the Large Catchment Scale. J. Hydrol. 2019, 571, 873–882. [Google Scholar] [CrossRef]
- Wu, Z.; Zhou, Y.; Wang, H.; Jiang, Z. Depth Prediction of Urban Flood under Different Rainfall Return Periods Based on Deep Learning and Data Warehouse. Sci. Total Environ. 2020, 716, 137077. [Google Scholar] [CrossRef]
- Qi, W.; Ma, C.; Xu, H.; Zhao, K. Urban Flood Response Analysis for Designed Rainstorms with Different Characteristics Based on a Tracer-Aided Modeling Simulation. J. Clean. Prod. 2022, 355, 131797. [Google Scholar] [CrossRef]
- Wang, P.; Li, Y.; Zhang, Y. An Urban System Perspective on Urban Flood Resilience Using SEM: Evidence from Nanjing City, China. Nat. Hazards 2021, 109, 2575–2599. [Google Scholar] [CrossRef]
- Xu, T.; Xie, Z.; Jiang, F.; Yang, S.; Deng, Z.; Zhao, L.; Wen, G.; Du, Q. Urban Flooding Resilience Evaluation with Coupled Rainfall and Flooding Models: A Small Area in Kunming City, China as an Example. Water Sci. Technol. 2023, 87, 2820–2839. [Google Scholar] [CrossRef] [PubMed]
- Chen, Y.; Zhou, H.; Zhang, H.; Du, G.; Zhou, J. Urban Flood Risk Warning under Rapid Urbanization. Environ. Res. 2015, 139, 3–10. [Google Scholar] [CrossRef]
- Zhou, Y.; Wu, Z.; Xu, H.; Wang, H. Prediction and Early Warning Method of Inundation Process at Waterlogging Points Based on Bayesian Model Average and Data-Driven. J. Hydrol. Reg. Stud. 2022, 44, 101248. [Google Scholar] [CrossRef]
- Yang, B.; Qian, Y.; Chen, L.; Li, J.; Huang, L.; Zhu, F. Research and Application of Urban Waterlogging Monitoring and Early Warning System. China Water Wastewater 2024, 40, 107–112. [Google Scholar]
- Cao, X.; Qi, Y.; Li, M.; Yang, Z.; Ni, G. Early Warning System of Urban Waterlogging under the Threat of Extreme Rainfall Events. Chin. J. Atmos. Sci. 2022, 46, 953–964. [Google Scholar] [CrossRef]
- Mei, C.; Shi, H.; Liu, J.; Song, T.; Wang, J.; Gao, X.; Wang, H.; Li, M. Analyzing Urban Form Influence on Pluvial Flooding via Numerical Experiments Using Random Slices of Actual City Data. J. Hydrol. 2024, 633, 130916. [Google Scholar] [CrossRef]
- Li, C.; Liu, M.; Hu, Y.; Wang, H.; Zhou, R.; Wu, W.; Wang, Y. Spatial Distribution Patterns and Potential Exposure Risks of Urban Floods in Chinese Megacities. J. Hydrol. 2022, 610, 127838. [Google Scholar] [CrossRef]
- Chen, G.; Hou, J.; Zhou, N.; Yang, S.; Tong, Y.; Su, F.; Huang, L.; Bi, X. High-Resolution Urban Flood Forecasting by Using a Coupled Atmospheric and Hydrodynamic Flood Models. Front. Earth Sci. 2020, 8, 545612. [Google Scholar] [CrossRef]
- Zhang, H.; Wu, W.; Hu, C.; Hu, C.; Li, M.; Hao, X.; Liu, S. A Distributed Hydrodynamic Model for Urban Storm Flood Risk Assessment. J. Hydrol. 2021, 600, 126513. [Google Scholar] [CrossRef]
- Mohamadiazar, N.; Ebrahimian, A.; Hosseiny, H. Integrating Deep Learning, Satellite Image Processing, and Spatial-Temporal Analysis for Urban Flood Prediction. J. Hydrol. 2024, 639, 131508. [Google Scholar] [CrossRef]
- Wu, Z.; Zhou, Y.; Wang, H. Real-Time Prediction of the Water Accumulation Process of Urban Stormy Accumulation Points Based on Deep Learning. IEEE Access 2020, 8, 151938–151951. [Google Scholar] [CrossRef]
- Li, X.; Yu, Y.; Wang, C.; Zheng, S.; Li, L.; Chen, G. Monitoring and Characterization of the Entire Urban Flooding Process in the Typical Southern Plain River Network Area. J. Hydraul. Eng. 2022, 53, 845–853. [Google Scholar] [CrossRef]
- Zheng, Y.; Jing, X.; Lin, Y.; Shen, D.; Zhang, Y.; Yu, M.; Zhou, Y. Research on Nowcasting Prediction Technology for Flooding Scenarios Based on Data-Driven and Real-Time Monitoring. Water Sci. Technol. 2024, 89, 2894–2906. [Google Scholar] [CrossRef]
- Chen, W.; Wu, H.; Kimball, J.S.; Alfieri, L.; Nanding, N.; Li, X.; Jiang, L.; Wu, W.; Tao, Y.; Zhao, S.; et al. A Coupled River Basin-Urban Hydrological Model (DRIVE-Urban) for Real-Time Urban Flood Modeling. Water Resour. Res. 2022, 58, e2021WR031709. [Google Scholar] [CrossRef]
- Zang, Y.; Meng, Y.; Guan, X.; Lv, H.; Yan, D. Study on Urban Flood Early Warning System Considering Flood Loss. Int. J. Disaster Risk Reduct. 2022, 77, 103042. [Google Scholar] [CrossRef]
- Su, X.; Shao, W.; Liu, J.; Jiang, Y.; Wang, K. Dynamic Assessment of the Impact of Flood Disaster on Economy and Population under Extreme Rainstorm Events. Remote Sens. 2021, 13, 3924. [Google Scholar] [CrossRef]
- Wang, H.; Hu, Y.; Guo, Y.; Wu, Z.; Yan, D. Urban Flood Forecasting Based on the Coupling of Numerical Weather Model and Stormwater Model: A Case Study of Zhengzhou City. J. Hydrol. Reg. Stud. 2022, 39, 100985. [Google Scholar] [CrossRef]
- Peng, F.; Hao, X.; Chai, F. A GPU-Accelerated Two-Dimensional Hydrodynamic Model for Unstructured Grids. Water 2023, 15, 1300. [Google Scholar] [CrossRef]
- Engman, E.T. Roughness Coefficients for Routing Surface Runoff. J. Irrig. Drain. Eng. 1986, 112, 39–53. [Google Scholar] [CrossRef]
- Mohamoud, Y.M. Evaluating Manning’s Roughness Coefficients for Tilled Soils. J. Hydrol. 1992, 135, 143–156. [Google Scholar] [CrossRef]
- Sun, J.; Sun, Z.; Guo, H.; Wang, J.; Jiang, H.; Gao, J. A Dataset of Built-up Areas of Chinese Cities in 2020. Chin. Sci. Cit. Database 2022, 7, 184–198. [Google Scholar] [CrossRef]
- Ngan, N.T.; Trung, N.H. Application of GIS and SWMM Model to Assess Urban Flooding in Metro Residential Area of Ninh Kieu District. IOP Conf. Ser. Earth Environ. Sci. 2023, 1170, 012007. [Google Scholar] [CrossRef]
- Wang, Y.; Chen, A.S.; Fu, G.; Djordjević, S.; Zhang, C.; Savić, D.A. An Integrated Framework for High-Resolution Urban Flood Modelling Considering Multiple Information Sources and Urban Features. Environ. Model. Softw. 2018, 107, 85–95. [Google Scholar] [CrossRef]
- Qi, W.; Ma, C.; Xu, H.; Chen, Z.; Zhao, K.; Han, H. A Review on Applications of Urban Flood Models in Flood Mitigation Strategies. Nat. Hazards 2021, 108, 31–62. [Google Scholar] [CrossRef]
Disclaimer/Publisher’s Note: The statements, opinions and data contained in all publications are solely those of the individual author(s) and contributor(s) and not of MDPI and/or the editor(s). MDPI and/or the editor(s) disclaim responsibility for any injury to people or property resulting from any ideas, methods, instructions or products referred to in the content. |
© 2025 by the authors. Licensee MDPI, Basel, Switzerland. This article is an open access article distributed under the terms and conditions of the Creative Commons Attribution (CC BY) license (https://creativecommons.org/licenses/by/4.0/).