

Using Neural Networks to Forecast the Amount of Traffic Accidents in Poland and Lithuania


Abstract
1. Introduction
- NR—number of road accidents;
- NI—number of inhabitants.
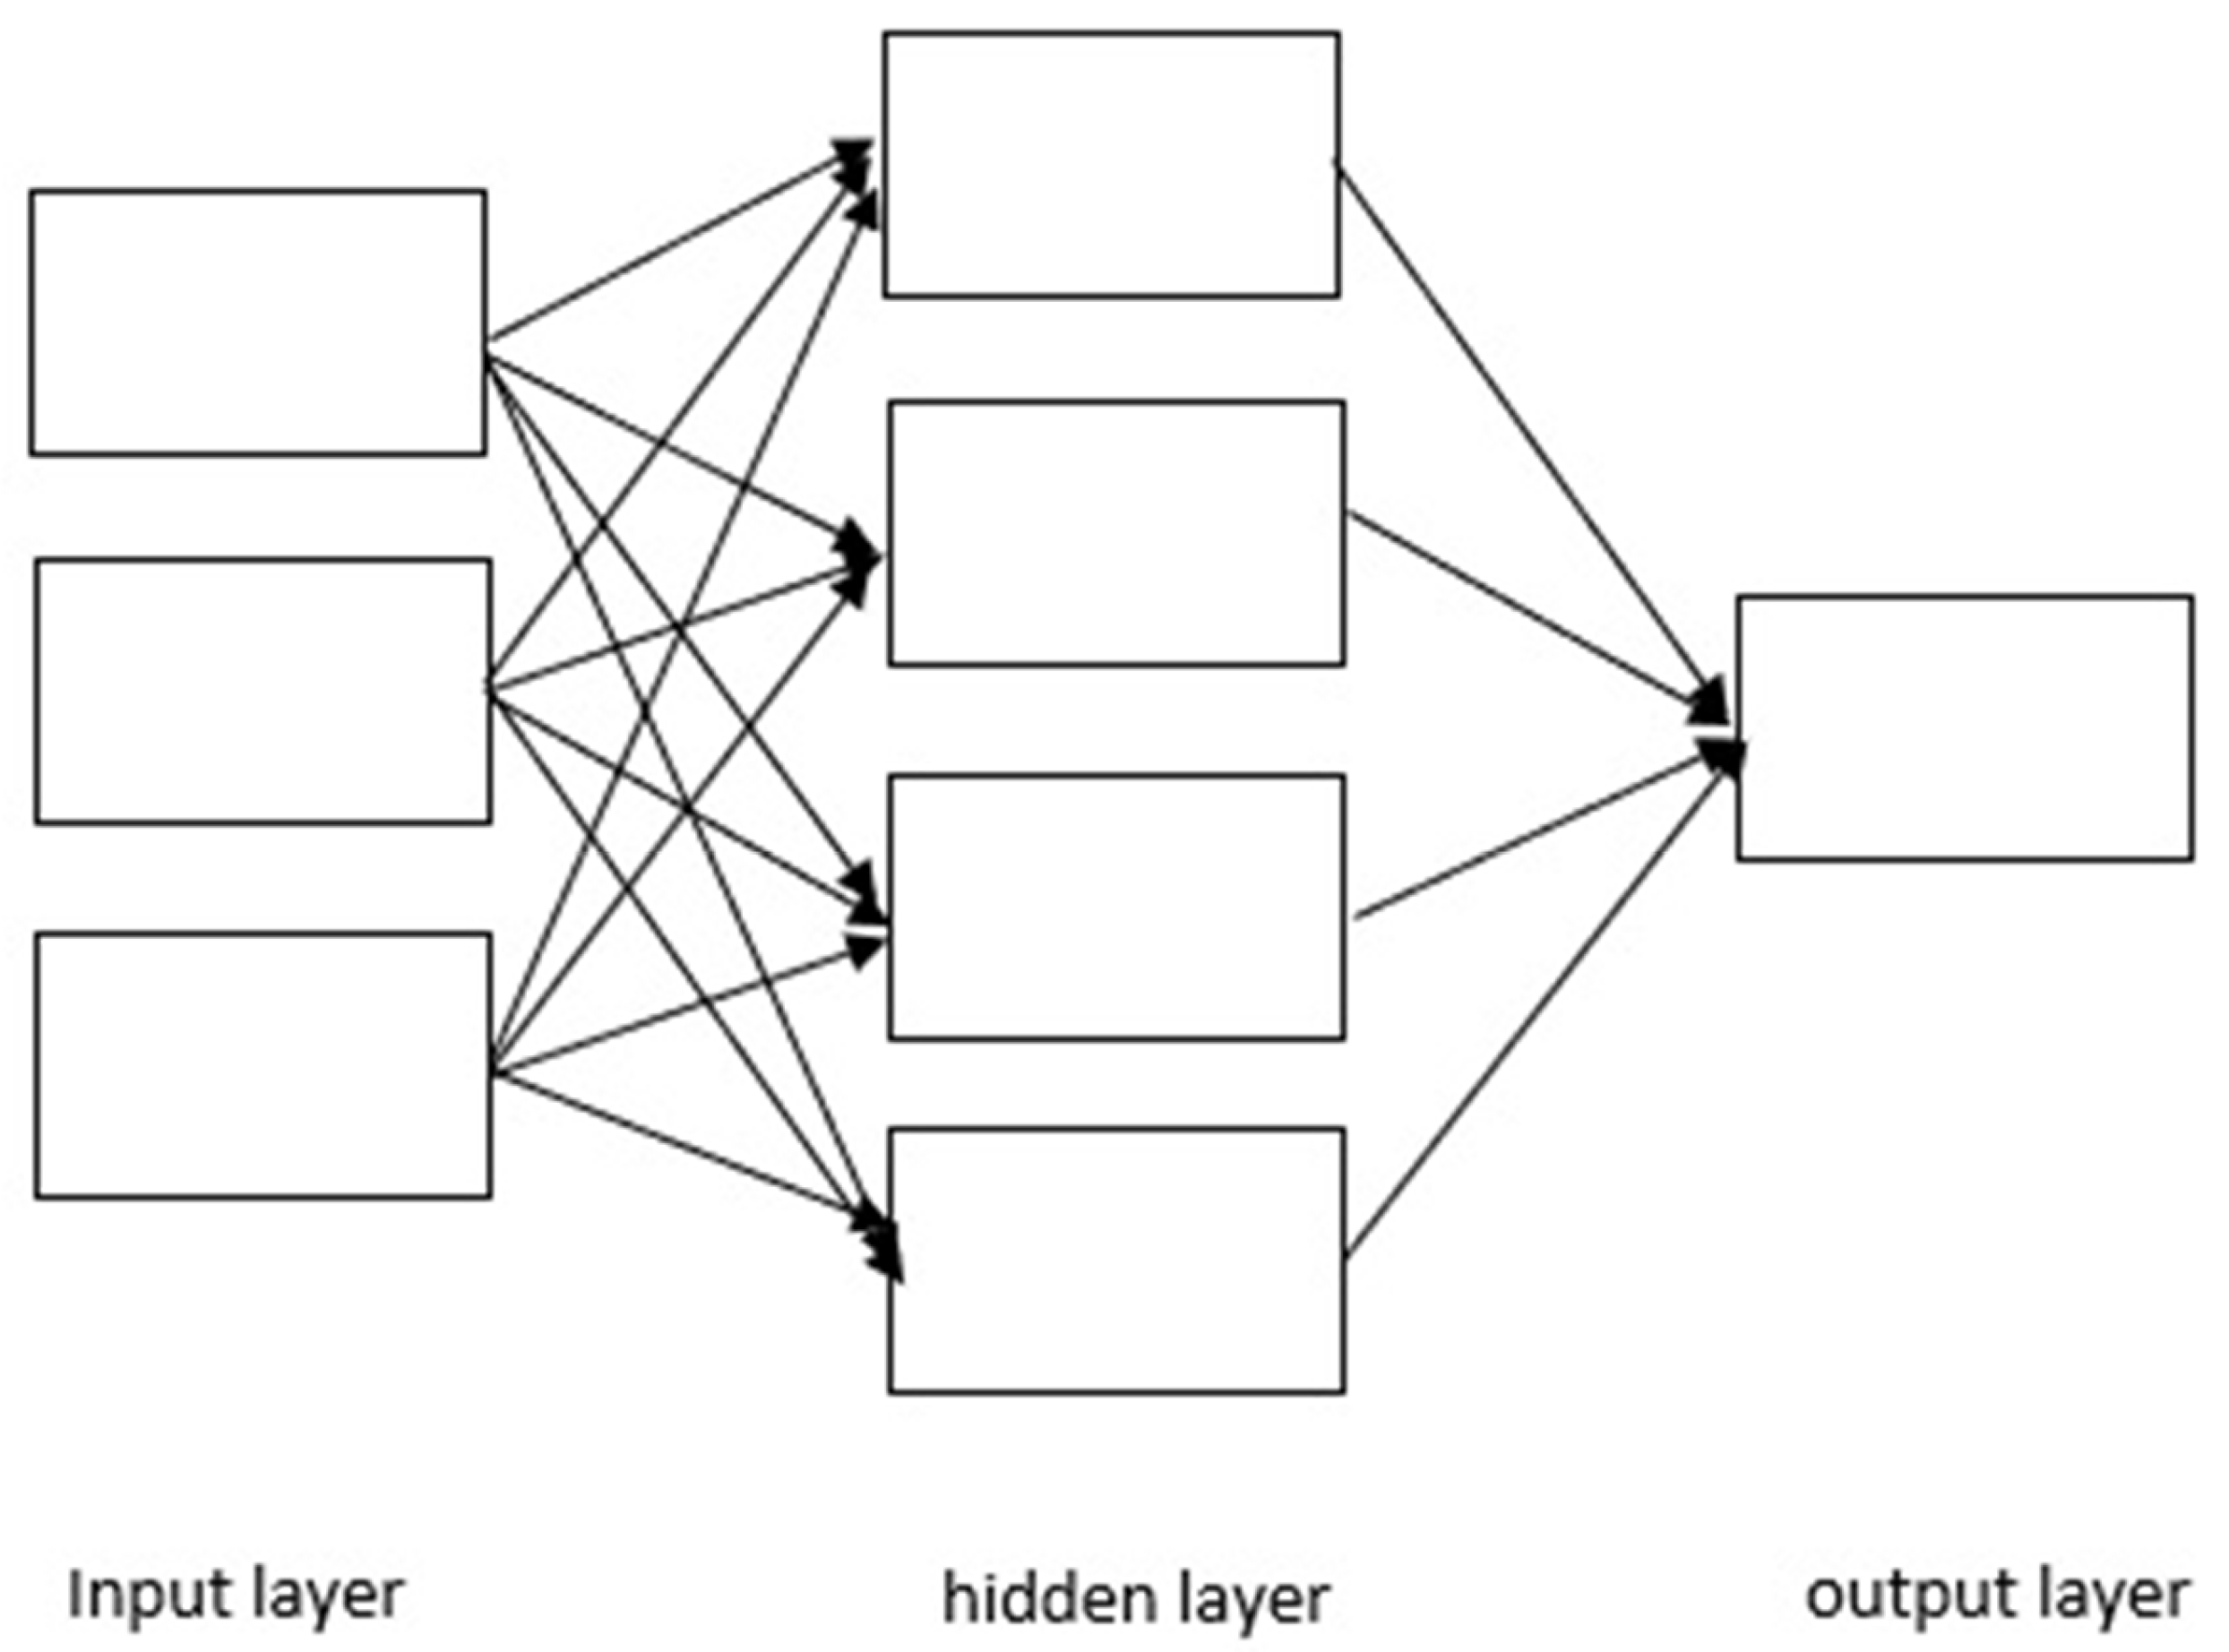
2. Materials and Methods
- n—length of forecast horizon;
- Y—observed value of road accidents;
- Yp—projected value of road accidents.
3. Results
- Teaching 70%, testing 15% and validation 15%;
- Teaching 80%, testing 10% and validation 10%;
4. Discussion
5. Conclusions
Author Contributions
Funding
Institutional Review Board Statement
Informed Consent Statement
Data Availability Statement
Conflicts of Interest
Appendix A

| Network Number | Network Name | Quality (Learning) | Quality (Testing) | Quality (Validation) | Learning Algorithm | Error Function | Activation (Hidden) | Activation (Output) | Errors | |||||
|---|---|---|---|---|---|---|---|---|---|---|---|---|---|---|
| ME | MAE | MPE | MAPE | SSE | Theil | |||||||||
| 20 | MLP 1-7-1 | 0.97 | 0.98 | 0.99 | BFGS 12 | SOS | Tanh | Logistic | 932.03 | 2374.97 | 2.85% | 6.69% | 2747.76 | 4.56 × 10−³ |
| 20 | MLP 1-8-1 | 0.97 | 0.98 | 0.99 | BFGS 4 | SOS | Linear | Logistic | 664.14 | 2092.80 | 3.19% | 6.46% | 2667.94 | 4.30 × 10⁻³ |
| 20 | MLP 1-2-1 | 0.97 | 0.98 | 0.99 | BFGS 4 | SOS | Exponential | Exponential | 1168.74 | 2119.69 | 3.23% | 5.69% | 2657.54 | 4.26 × 10⁻³ |
| 20 | MLP 1-4-1 | 0.96 | 0.97 | 0.99 | BFGS 4 | SOS | Exponential | Linear | 1815.06 | 2891.74 | 2.84% | 7.52% | 3551.21 | 7.61 × 10⁻³ |
| 20 | MLP 1-3-1 | 0.97 | 0.97 | 0.99 | BFGS 42 | SOS | Tanh | Logistic | 1113.77 | 2387.70 | 3.25% | 6.64% | 2802.32 | 4.74 × 10⁻³ |
| 40 | MLP 1-7-1 | 0.97 | 0.98 | 0.99 | BFGS 8 | SOS | Exponential | Exponential | 837.43 | 2001.24 | 2.77% | 5.68% | 2484.15 | 3.72 × 10⁻³ |
| 40 | MLP 1-3-1 | 0.97 | 0.98 | 0.99 | BFGS 8 | SOS | Exponential | Exponential | 909.41 | 2052.58 | 2.80% | 5.71% | 2526.15 | 3.85 × 10⁻³ |
| 40 | MLP 1-2-1 | 0.97 | 0.96 | 0.99 | BFGS 7 | SOS | Logistic | Logistic | 1110.51 | 2279.94 | 3.35% | 6.40% | 2764.05 | 4.61 × 10⁻³ |
| 40 | MLP 1-8-1 | 0.97 | 0.96 | 0.99 | BFGS 5 | SOS | Logistic | Exponential | 1483.15 | 2363.70 | 4.57% | 6.80% | 2927.92 | 5.17 × 10⁻³ |
| 40 | MLP 1-3-1 | 0.96 | 0.95 | 0.99 | BFGS 5 | SOS | Logistic | Exponential | 1035.60 | 2590.23 | 3.60% | 7.73% | 3048.65 | 5.61 × 10⁻³ |
| 60 | MLP 1-4-1 | 0.97 | 0.97 | 0.99 | BFGS 7 | SOS | Tanh | Logistic | 1031.48 | 2377.94 | 3.10% | 6.68% | 2772.29 | 4.64 × 10⁻³ |
| 60 | MLP 1-7-1 | 0.97 | 0.97 | 0.99 | BFGS 5 | SOS | Tanh | Logistic | 777.04 | 2415.30 | 2.17% | 6.63% | 2763.52 | 4.61 × 10⁻³ |
| 60 | MLP 1-2-1 | 0.97 | 0.97 | 0.99 | BFGS 9 | SOS | Exponential | Logistic | 1109.93 | 2233.82 | 3.17% | 6.12% | 2715.75 | 4.45 × 10⁻³ |
| 60 | MLP 1-5-1 | 0.97 | 0.97 | 0.99 | BFGS 12 | SOS | Tanh | Exponential | 1090.27 | 2283.83 | 3.28% | 6.40% | 2721.35 | 4.47 × 10⁻³ |
| 60 | MLP 1-6-1 | 0.97 | 0.98 | 0.99 | BFGS 5 | SOS | Exponential | Exponential | 1071.39 | 1987.71 | 3.83% | 5.94% | 2590.07 | 4.05 × 10⁻³ |
| 80 | MLP 1-5-1 | 0.97 | 0.97 | 0.99 | BFGS 7 | SOS | Tanh | Logistic | 1040.10 | 2404.10 | 3.15% | 6.78% | 2796.23 | 4.72 × 10⁻³ |
| 80 | MLP 1-8-1 | 0.97 | 0.98 | 0.99 | BFGS 14 | SOS | Exponential | Logistic | 1023.90 | 2217.06 | 3.03% | 6.15% | 2661.45 | 4.27 × 10⁻³ |
| 80 | MLP 1-3-1 | 0.97 | 0.98 | 0.99 | BFGS 7 | SOS | Exponential | Logistic | 801.65 | 2239.47 | 2.48% | 6.27% | 2623.54 | 4.15 × 10⁻³ |
| 80 | MLP 1-7-1 | 0.97 | 0.96 | 0.99 | BFGS 7 | SOS | Logistic | Logistic | 978.70 | 2426.95 | 2.68% | 6.63% | 2851.96 | 4.91 × 10⁻³ |
| 80 | MLP 1-7-1 | 0.97 | 0.98 | 0.99 | BFGS 13 | SOS | Exponential | Logistic | 873.08 | 2237.49 | 2.54% | 6.16% | 2638.93 | 4.20 × 10⁻³ |
| 100 | MLP 1-8-1 | 0.97 | 0.98 | 0.99 | BFGS 18 | SOS | Exponential | Logistic | 1021.62 | 2260.14 | 2.99% | 6.25% | 2688.97 | 4.36 × 10⁻³ |
| 100 | MLP 1-5-1 | 0.97 | 0.97 | 0.99 | BFGS 6 | SOS | Logistic | Logistic | 1108.50 | 2402.26 | 3.24% | 6.69% | 2819.42 | 4.80 × 10⁻³ |
| 100 | MLP 1-4-1 | 0.97 | 0.98 | 0.99 | BFGS 11 | SOS | Logistic | Exponential | 909.58 | 2320.20 | 2.93% | 6.65% | 2707.86 | 4.43 × 10⁻³ |
| 100 | MLP 1-2-1 | 0.96 | 0.95 | 0.99 | BFGS 7 | SOS | Tanh | Logistic | 1114.15 | 2426.31 | 4.15% | 7.43% | 3005.79 | 5.45 × 10⁻³ |
| 100 | MLP 1-2-1 | 0.97 | 0.97 | 0.99 | BFGS 8 | SOS | Tanh | Logistic | 894.03 | 2347.67 | 2.83% | 6.67% | 2720.34 | 4.47 × 10⁻³ |
| 200 | MLP 1-6-1 | 0.96 | 0.96 | 0.99 | BFGS 8 | SOS | Tanh | Logistic | 644.88 | 2480.32 | 2.22% | 7.15% | 2814.19 | 4.78 × 10⁻³ |
| 200 | MLP 1-6-1 | 0.97 | 0.96 | 0.99 | BFGS 7 | SOS | Tanh | Logistic | 770.95 | 2330.09 | 2.51% | 6.64% | 2702.56 | 4.41 × 10⁻³ |
| 200 | MLP 1-3-1 | 0.97 | 0.97 | 0.99 | BFGS 10 | SOS | Logistic | Logistic | 970.77 | 2347.01 | 2.97% | 6.61% | 2750.08 | 4.56 × 10⁻³ |
| 200 | MLP 1-2-1 | 0.95 | 0.92 | 0.99 | BFGS 7 | SOS | Logistic | Exponential | 319.55 | 2657.15 | 0.32% | 7.61% | 3035.78 | 5.56 × 10⁻³ |
| 200 | MLP 1-4-1 | 0.97 | 0.97 | 0.99 | BFGS 6 | SOS | Tanh | Logistic | 1200.19 | 2356.37 | 3.63% | 6.66% | 2816.40 | 4.79 × 10⁻³ |
| Minimal | 319.55 | 1987.71 | 0.32% | 5.68% | 2484.15 | 3.72 × 10⁻³ | ||||||||
| Network Number | Network Name | Quality (Learning) | Quality (Testing) | Quality (Validation) | Learning Algorithm | Error Function | Activation (Hidden) | Activation (Output) | Errors | |||||
|---|---|---|---|---|---|---|---|---|---|---|---|---|---|---|
| ME | MAE | MPE | MAPE | SSE | Theil | |||||||||
| 20 | MLP 1-5-1 | 0.96 | 0.99 | 1.00 | BFGS 8 | SOS | Logistic | Linear | 422.40 | 1830.32 | 0.90% | 5.12% | 2362.11 | 3.37 × 10⁻³ |
| 20 | MLP 1-5-1 | 0.96 | 0.99 | 1.00 | BFGS 5 | SOS | Linear | Tanh | 420.05 | 2152.64 | 0.39% | 6.51% | 2773.07 | 4.64 × 10⁻³ |
| 20 | MLP 1-3-1 | 0.96 | 0.99 | 1.00 | BFGS 63 | SOS | Tanh | Logistic | 702.37 | 1986.10 | 2.31% | 5.57% | 2455.03 | 3.64 × 10⁻³ |
| 20 | MLP 1-8-1 | 0.96 | 0.99 | 1.00 | BFGS 6 | SOS | Linear | Tanh | 326.74 | 2130.77 | 0.17% | 6.45% | 2734.11 | 4.51 × 10⁻³ |
| 20 | MLP 1-8-1 | 0.96 | 0.99 | 1.00 | BFGS 6 | SOS | Logistic | Tanh | 265.62 | 1759.88 | 0.80% | 4.63% | 2294.49 | 3.18 × 10⁻³ |
| 40 | MLP 1-5-1 | 0.96 | 0.99 | 1.00 | BFGS 5 | SOS | Tanh | Exponential | 1544.71 | 2539.20 | 6.27% | 8.23% | 3300.44 | 6.57 × 10⁻³ |
| 40 | MLP 1-5-1 | 0.96 | 0.99 | 1.00 | BFGS 6 | SOS | Linear | Tanh | 180.47 | 2355.28 | 0.72% | 7.31% | 2994.43 | 5.41 × 10⁻³ |
| 40 | MLP 1-2-1 | 0.96 | 0.99 | 1.00 | BFGS 6 | SOS | Linear | Tanh | 184.52 | 2325.08 | 1.67% | 7.28% | 2934.77 | 5.20 × 10⁻³ |
| 40 | MLP 1-6-1 | 0.96 | 0.98 | 1.00 | BFGS 4 | SOS | Logistic | Logistic | 725.12 | 2046.17 | 3.35% | 6.03% | 2699.40 | 4.40 × 10⁻³ |
| 40 | MLP 1-2-1 | 0.96 | 0.99 | 1.00 | BFGS 10 | SOS | Logistic | Tanh | 397.20 | 1761.51 | 1.05% | 4.76% | 2339.08 | 3.30 × 10⁻³ |
| 60 | MLP 1-2-1 | 0.95 | 0.98 | 1.00 | BFGS 5 | SOS | Logistic | Exponential | 46.12 | 2638.20 | 0.89% | 7.75% | 3021.27 | 5.51 × 10⁻³ |
| 60 | MLP 1-6-1 | 0.96 | 0.99 | 1.00 | BFGS 5 | SOS | Linear | Tanh | 381.15 | 2625.38 | 2.79% | 8.41% | 3359.27 | 6.81 × 10⁻³ |
| 60 | MLP 1-6-1 | 0.95 | 0.98 | 1.00 | BFGS 5 | SOS | Logistic | Logistic | 1436.54 | 2605.98 | 2.62% | 6.58% | 3107.29 | 5.83 × 10⁻³ |
| 60 | MLP 1-3-1 | 0.95 | 0.98 | 1.00 | BFGS 7 | SOS | Tanh | Tanh | 225.51 | 2181.93 | 1.10% | 6.66% | 2827.63 | 4.83 × 10⁻³ |
| 60 | MLP 1-6-1 | 0.95 | 0.99 | 1.00 | BFGS 7 | SOS | Exponential | Logistic | 231.31 | 2206.35 | 0.69% | 5.98% | 2657.70 | 4.26 × 10⁻³ |
| 80 | MLP 1-2-1 | 0.96 | 0.99 | 1.00 | BFGS 11 | SOS | Logistic | Tanh | 63.00 | 2068.87 | 0.35% | 6.24% | 2669.34 | 4.30 × 10⁻³ |
| 80 | MLP 1-3-1 | 0.96 | 0.99 | 1.00 | BFGS 4 | SOS | Linear | Tanh | 261.75 | 2325.06 | 0.42% | 7.18% | 2957.41 | 5.28 × 10⁻³ |
| 80 | MLP 1-2-1 | 0.96 | 0.98 | 1.00 | BFGS 7 | SOS | Logistic | Linear | 553.25 | 2205.41 | 2.23% | 6.74% | 2759.02 | 4.59 × 10⁻³ |
| 80 | MLP 1-2-1 | 0.95 | 0.98 | 1.00 | BFGS 6 | SOS | Tanh | Logistic | 81.51 | 2328.80 | 0.41% | 6.55% | 2719.89 | 4.46 × 10⁻³ |
| 80 | MLP 1-7-1 | 0.96 | 0.99 | 1.00 | BFGS 5 | SOS | Linear | Tanh | 159.97 | 2374.17 | 0.82% | 7.38% | 3018.42 | 5.50 × 10⁻³ |
| 100 | MLP 1-7-1 | 0.96 | 0.99 | 1.00 | BFGS 7 | SOS | Linear | Tanh | 573.15 | 2175.01 | 0.84% | 6.54% | 2792.33 | 4.71 × 10⁻³ |
| 100 | MLP 1-2-1 | 0.95 | 0.99 | 1.00 | BFGS 9 | SOS | Tanh | Logistic | 334.46 | 2310.29 | 1.71% | 6.79% | 2726.36 | 4.49 × 10⁻³ |
| 100 | MLP 1-5-1 | 0.96 | 0.99 | 1.00 | BFGS 5 | SOS | Linear | Tanh | 180.96 | 2441.21 | 1.90% | 7.72% | 3101.83 | 5.81 × 10⁻³ |
| 100 | MLP 1-2-1 | 0.96 | 0.99 | 1.00 | BFGS 7 | SOS | Linear | Tanh | 573.25 | 2174.78 | 0.84% | 6.54% | 2791.98 | 4.70 × 10⁻³ |
| 100 | MLP 1-4-1 | 0.96 | 0.99 | 1.00 | BFGS 5 | SOS | Linear | Tanh | 100.84 | 2331.11 | 0.91% | 7.25% | 2967.66 | 5.32 × 10⁻³ |
| 200 | MLP 1-8-1 | 0.96 | 0.99 | 1.00 | BFGS 6 | SOS | Tanh | Tanh | 380.18 | 2350.66 | 2.18% | 7.47% | 3034.06 | 5.56 × 10⁻³ |
| 200 | MLP 1-2-1 | 0.96 | 0.98 | 1.00 | BFGS 7 | SOS | Tanh | Linear | 265.66 | 2300.27 | 1.76% | 7.12% | 2877.84 | 5.00 × 10⁻³ |
| 200 | MLP 1-8-1 | 0.96 | 0.99 | 1.00 | BFGS 2 | SOS | Tanh | Tanh | 1932.17 | 2744.39 | 4.08% | 6.86% | 3486.86 | 7.34 × 10⁻³ |
| 200 | MLP 1-3-1 | 0.96 | 0.98 | 1.00 | BFGS 7 | SOS | Logistic | Tanh | 38.54 | 1969.49 | 0.44% | 5.51% | 2441.32 | 3.60 × 10⁻³ |
| 200 | MLP 1-4-1 | 0.95 | 0.98 | 1.00 | BFGS 5 | SOS | Logistic | Logistic | 704.60 | 2296.70 | 1.35% | 6.17% | 2731.82 | 4.50 × 10⁻³ |
| Minimal | 38.54 | 1759.88 | 0.17% | 4.63% | 2294.49 | 3.18 × 10⁻³ | ||||||||
| Network Number | Network Name | Quality (Learning) | Quality (Testing) | Quality (Validation) | Learning Algorithm | Error Function | Activation (Hidden) | Activation (Output) | Errors | |||||
|---|---|---|---|---|---|---|---|---|---|---|---|---|---|---|
| ME | MAE | MPE | MAPE | SSE | Theil | |||||||||
| 20 | MLP 1-7-1 | 0.95 | 0.88 | 0.79 | BFGS 5 | SOS | Exponential | Tanh | 116.84 | 293.52 | 2.65% | 7.20% | 472.03 | 1.10 × 10⁻² |
| 20 | MLP 1-5-1 | 0.96 | 0.80 | 0.79 | BFGS 11 | SOS | Exponential | Logistic | 50.81 | 287.67 | 1.24% | 6.68% | 486.55 | 1.17 × 10⁻² |
| 20 | MLP 1-7-1 | 0.95 | 0.87 | 0.80 | BFGS 14 | SOS | Tanh | Tanh | 129.74 | 300.58 | 3.23% | 7.40% | 474.81 | 1.11 × 10⁻² |
| 20 | MLP 1-4-1 | 0.95 | 0.86 | 0.80 | BFGS 17 | SOS | Tanh | Tanh | 118.34 | 309.49 | 3.08% | 7.64% | 477.01 | 1.12 × 10⁻² |
| 20 | MLP 1-8-1 | 0.95 | 0.86 | 0.80 | BFGS 6 | SOS | Linear | Tanh | 101.48 | 346.30 | 2.87% | 8.73% | 492.44 | 1.20 × 10⁻² |
| 40 | MLP 1-7-1 | 0.95 | 0.86 | 0.80 | BFGS 5 | SOS | Linear | Tanh | 56.14 | 342.71 | 1.59% | 8.56% | 484.27 | 1.16 × 10⁻² |
| 40 | MLP 1-2-1 | 0.95 | 0.85 | 0.80 | BFGS 9 | SOS | Logistic | Linear | 103.22 | 333.19 | 2.90% | 8.31% | 486.14 | 1.16 × 10⁻² |
| 40 | MLP 1-3-1 | 0.94 | 0.88 | 0.80 | BFGS 2 | SOS | Linear | Tanh | 280.75 | 432.36 | 6.18% | 9.80% | 530.19 | 1.39 × 10⁻² |
| 40 | MLP 1-5-1 | 0.95 | 0.86 | 0.80 | BFGS 14 | SOS | Tanh | Tanh | 72.85 | 324.85 | 2.20% | 7.97% | 469.73 | 1.09 × 10⁻² |
| 40 | MLP 1-4-1 | 0.95 | 0.84 | 0.81 | BFGS 10 | SOS | Logistic | Tanh | 68.48 | 338.43 | 2.04% | 8.37% | 486.85 | 1.17 × 10⁻² |
| 60 | MLP 1-5-1 | 0.95 | 0.85 | 0.80 | BFGS 5 | SOS | Linear | Tanh | 15.31 | 363.05 | 1.03% | 9.38% | 512.18 | 1.29 × 10⁻² |
| 60 | MLP 1-2-1 | 0.95 | 0.85 | 0.80 | BFGS 13 | SOS | Logistic | Tanh | 97.04 | 327.47 | 2.72% | 8.11% | 485.12 | 1.16 × 10⁻² |
| 60 | MLP 1-2-1 | 0.95 | 0.86 | 0.80 | BFGS 7 | SOS | Linear | Tanh | 99.28 | 346.01 | 2.85% | 8.70% | 490.43 | 1.19 × 10⁻² |
| 60 | MLP 1-6-1 | 0.95 | 0.86 | 0.80 | BFGS 3 | SOS | Logistic | Linear | 47.65 | 355.01 | 2.64% | 8.34% | 473.70 | 1.11 × 10⁻² |
| 60 | MLP 1-3-1 | 0.95 | 0.85 | 0.80 | BFGS 8 | SOS | Logistic | Linear | 98.13 | 332.87 | 2.77% | 8.28% | 486.39 | 1.17 × 10⁻² |
| 80 | MLP 1-4-1 | 0.95 | 0.86 | 0.80 | BFGS 5 | SOS | Linear | Tanh | 57.41 | 342.51 | 1.64% | 8.55% | 483.87 | 1.15 × 10⁻² |
| 80 | MLP 1-7-1 | 0.94 | 0.86 | 0.81 | BFGS 2 | SOS | Tanh | Tanh | 193.51 | 447.86 | 2.57% | 9.52% | 566.17 | 1.58 × 10⁻² |
| 80 | MLP 1-5-1 | 0.95 | 0.86 | 0.80 | BFGS 5 | SOS | Linear | Tanh | 21.46 | 344.49 | 0.49% | 8.64% | 486.20 | 1.16 × 10⁻² |
| 80 | MLP 1-6-1 | 0.94 | 0.85 | 0.81 | BFGS 2 | SOS | Tanh | Tanh | 143.23 | 402.10 | 2.54% | 9.28% | 509.69 | 1.28 × 10⁻² |
| 80 | MLP 1-3-1 | 0.95 | 0.86 | 0.80 | BFGS 5 | SOS | Linear | Tanh | 59.53 | 342.41 | 1.72% | 8.55% | 483.56 | 1.15 × 10⁻² |
| 100 | MLP 1-7-1 | 0.95 | 0.86 | 0.80 | BFGS 4 | SOS | Linear | Tanh | 97.95 | 346.00 | 2.76% | 8.72% | 492.12 | 1.19 × 10⁻² |
| 100 | MLP 1-8-1 | 0.95 | 0.86 | 0.80 | BFGS 4 | SOS | Linear | Tanh | 79.26 | 344.72 | 2.07% | 8.71% | 494.49 | 1.21 × 10⁻² |
| 100 | MLP 1-5-1 | 0.95 | 0.86 | 0.80 | BFGS 4 | SOS | Linear | Tanh | 100.76 | 346.25 | 2.85% | 8.72% | 492.49 | 1.20 × 10⁻² |
| 100 | MLP 1-4-1 | 0.95 | 0.85 | 0.80 | BFGS 13 | SOS | Tanh | Tanh | 91.68 | 346.05 | 2.62% | 8.69% | 491.42 | 1.19 × 10⁻² |
| 100 | MLP 1-6-1 | 0.95 | 0.86 | 0.80 | BFGS 5 | SOS | Linear | Tanh | 4.80 | 352.90 | 0.26% | 8.99% | 499.52 | 1.23 × 10⁻² |
| 200 | MLP 1-7-1 | 0.95 | 0.86 | 0.80 | BFGS 4 | SOS | Linear | Tanh | 101.52 | 346.31 | 2.87% | 8.73% | 492.47 | 1.20 × 10⁻² |
| 200 | MLP 1-4-1 | 0.95 | 0.86 | 0.80 | BFGS 4 | SOS | Linear | Tanh | 101.01 | 346.26 | 2.86% | 8.72% | 492.37 | 1.19 × 10⁻² |
| 200 | MLP 1-3-1 | 0.95 | 0.86 | 0.80 | BFGS 4 | SOS | Linear | Tanh | 75.43 | 345.50 | 1.91% | 8.75% | 496.30 | 1.21 × 10⁻² |
| 200 | MLP 1-8-1 | 0.95 | 0.86 | 0.80 | BFGS 5 | SOS | Linear | Tanh | 101.59 | 346.31 | 2.88% | 8.73% | 492.42 | 1.20 × 10⁻² |
| 200 | MLP 1-8-1 | 0.95 | 0.86 | 0.80 | BFGS 4 | SOS | Linear | Tanh | 78.13 | 345.02 | 2.02% | 8.73% | 495.22 | 1.21 × 10⁻² |
| Minimal | 4.80 | 287.67 | 0.26% | 6.68% | 469.73 | 1.09 × 10⁻² | ||||||||
| Network Number | Network Name | Quality (Learning) | Quality (Testing) | Quality (Validation) | Learning Algorithm | Error Function | Activation (Hidden) | Activation (Output) | Errors | |||||
|---|---|---|---|---|---|---|---|---|---|---|---|---|---|---|
| ME | MAE | MPE | MAPE | SSE | Theil | |||||||||
| 20 | MLP 1-2-1 | 0.90 | 1.00 | 1.00 | BFGS 6 | SOS | Tanh | Exponential | 134.74 | 393.58 | 2.22% | 8.75% | 591.36 | 1.72 × 10⁻² |
| 20 | MLP 1-2-1 | 0.90 | 1.00 | 1.00 | BFGS 6 | SOS | Tanh | Exponential | 220.56 | 1410.13 | 17.04% | 36.02% | 1471.74 | 1.07 × 10⁻¹ |
| 20 | MLP 1-2-1 | 0.90 | 1.00 | 1.00 | BFGS 6 | SOS | Tanh | Exponential | 107.06 | 293.38 | 2.98% | 7.14% | 452.54 | 1.01 × 10⁻² |
| 20 | MLP 1-2-1 | 0.90 | 1.00 | 1.00 | BFGS 6 | SOS | Tanh | Exponential | 103.92 | 359.62 | 0.98% | 7.64% | 535.33 | 1.41 × 10⁻² |
| 20 | MLP 1-2-1 | 0.90 | 1.00 | 1.00 | BFGS 6 | SOS | Tanh | Exponential | 54.42 | 341.90 | 1.87% | 8.42% | 474.11 | 1.11 × 10⁻² |
| 40 | MLP 1-2-1 | 0.93 | 1.00 | 1.00 | BFGS 0 | SOS | Exponential | Linear | 79.02 | 330.92 | 2.38% | 8.24% | 465.18 | 1.07 × 10⁻² |
| 40 | MLP 1-8-1 | 0.93 | 1.00 | 1.00 | BFGS 0 | SOS | Exponential | Linear | 94.95 | 332.66 | 2.86% | 8.30% | 468.35 | 1.08 × 10⁻² |
| 40 | MLP 1-8-1 | 0.93 | 1.00 | 1.00 | BFGS 0 | SOS | Exponential | Linear | 92.36 | 327.48 | 2.79% | 8.14% | 463.80 | 1.06 × 10⁻² |
| 40 | MLP 1-5-1 | 0.93 | 1.00 | 1.00 | BFGS 2 | SOS | Tanh | Linear | 86.38 | 769.14 | 4.16% | 17.71% | 875.68 | 3.78 × 10⁻² |
| 40 | MLP 1-2-1 | 0.93 | 1.00 | 1.00 | BFGS 2 | SOS | Exponential | Exponential | 169.63 | 729.93 | 1.83% | 16.07% | 880.63 | 3.82 × 10⁻² |
| 60 | MLP 1-7-1 | 0.93 | 1.00 | 1.00 | BFGS 0 | SOS | Linear | Tanh | 54.42 | 341.90 | 1.87% | 8.42% | 474.11 | 1.11 × 10⁻² |
| 60 | MLP 1-5-1 | 0.92 | 1.00 | 1.00 | BFGS 5 | SOS | Logistic | Logistic | 141.96 | 386.07 | 1.79% | 8.08% | 570.73 | 1.61 × 10⁻² |
| 60 | MLP 1-5-1 | 0.93 | 1.00 | 1.00 | BFGS 0 | SOS | Linear | Tanh | 54.42 | 341.90 | 1.87% | 8.42% | 474.11 | 1.11 × 10⁻² |
| 60 | MLP 1-5-1 | 0.93 | 1.00 | 1.00 | BFGS 0 | SOS | Linear | Tanh | 54.42 | 341.90 | 1.87% | 8.42% | 474.11 | 1.11 × 10⁻² |
| 60 | MLP 1-6-1 | 0.94 | 1.00 | 1.00 | BFGS 0 | SOS | Logistic | Tanh | 100.10 | 298.22 | 2.80% | 7.27% | 455.09 | 1.02 × 10⁻² |
| 80 | MLP 1-2-1 | 0.93 | 1.00 | 1.00 | BFGS 4 | SOS | Exponential | Exponential | 6.39 | 317.71 | 1.23% | 7.16% | 483.83 | 1.15 × 10⁻² |
| 80 | MLP 1-2-1 | 0.93 | 1.00 | 1.00 | BFGS 0 | SOS | Exponential | Linear | 97.24 | 327.26 | 2.96% | 8.13% | 463.60 | 1.06 × 10⁻² |
| 80 | MLP 1-3-1 | 0.93 | 1.00 | 1.00 | BFGS 0 | SOS | Exponential | Linear | 93.10 | 326.55 | 2.78% | 8.12% | 463.80 | 1.06 × 10⁻² |
| 80 | MLP 1-8-1 | 0.93 | 1.00 | 1.00 | BFGS 0 | SOS | Linear | Tanh | 54.42 | 341.90 | 1.87% | 8.42% | 474.11 | 1.11 × 10⁻² |
| 80 | MLP 1-4-1 | 0.93 | 1.00 | 1.00 | BFGS 3 | SOS | Exponential | Exponential | 215.34 | 621.17 | 9.75% | 16.10% | 662.96 | 2.17 × 10⁻² |
| 100 | MLP 1-2-1 | 0.93 | 1.00 | 1.00 | BFGS 0 | SOS | Tanh | Linear | 84.90 | 301.01 | 2.41% | 7.37% | 450.93 | 1.00 × 10⁻² |
| 100 | MLP 1-8-1 | 0.93 | 1.00 | 1.00 | BFGS 0 | SOS | Exponential | Linear | 85.41 | 333.58 | 2.63% | 8.26% | 467.98 | 1.08 × 10⁻² |
| 100 | MLP 1-8-1 | 0.96 | 1.00 | 1.00 | BFGS 166 | SOS | Logistic | Exponential | 3.37 | 227.91 | 0.80% | 5.18% | 363.52 | 6.51 × 10⁻³ |
| 100 | MLP 1-4-1 | 0.93 | 1.00 | 1.00 | BFGS 2 | SOS | Exponential | Logistic | 376.04 | 833.96 | 2.14% | 17.19% | 1089.97 | 5.85 × 10⁻² |
| 100 | MLP 1-2-1 | 0.93 | 1.00 | 1.00 | BFGS 0 | SOS | Exponential | Linear | 92.59 | 326.49 | 2.81% | 8.10% | 462.81 | 1.06 × 10⁻² |
| 200 | MLP 1-6-1 | 0.93 | 1.00 | 1.00 | BFGS 0 | SOS | Exponential | Linear | 95.16 | 324.12 | 2.86% | 8.04% | 461.95 | 1.05 × 10⁻² |
| 200 | MLP 1-4-1 | 0.93 | 1.00 | 1.00 | BFGS 3 | SOS | Exponential | Exponential | 160.92 | 664.22 | 8.86% | 16.78% | 703.59 | 2.44 × 10⁻² |
| 200 | MLP 1-4-1 | 0.93 | 1.00 | 1.00 | BFGS 4 | SOS | Tanh | Logistic | 66.82 | 446.60 | 4.59% | 10.57% | 552.80 | 1.51 × 10⁻² |
| 200 | MLP 1-5-1 | 0.94 | 1.00 | 1.00 | BFGS 0 | SOS | Tanh | Tanh | 137.58 | 314.34 | 3.67% | 7.79% | 482.26 | 1.15 × 10⁻² |
| 200 | MLP 1-7-1 | 0.93 | 1.00 | 1.00 | BFGS 0 | SOS | Exponential | Linear | 83.79 | 330.50 | 2.63% | 8.13% | 465.29 | 1.07 × 10⁻² |
| Minimal | 3.37 | 227.91 | 0.80% | 5.18% | 363.52 | 6.51 × 10⁻³ | ||||||||
References
- WHO. The Global Status on Road Safety. WHO: Geneva, Switzerland, 2018; 403p, Available online: https://www.who.int/publications/i/item/9789241565684 (accessed on 23 May 2023)ISBN 9789241565684.
- Tambouratzis, T.; Souliou, D.; Chalikias, M.; Gregoriades, A. Maximising accuracy and efficiency of traffic accident prediction combining information mining with computational intelligence approaches and decision trees. J. Artif. Intell. Soft Comput. Res. 2014, 4, 31–42. [Google Scholar] [CrossRef]
- Zhu, L.; Lu, L.; Zhang, W.; Zhao, Y.; Song, M. Analysis of accident severity for curved roadways based on bayesian networks. Sustainability 2019, 11, 2223. [Google Scholar] [CrossRef]
- Arteaga, C.; Paz, A.; Park, J. Injury severity on traffic crashes: A text mining with an interpretable machine-learning approach. Saf. Sci. 2020, 132, 104988. [Google Scholar] [CrossRef]
- Yang, Z.; Zhang, W.; Feng, J. Predicting multiple types of traffic accident severity with explanations: A multi-task deep learning framework. Saf. Sci. 2022, 146, 105522. [Google Scholar] [CrossRef]
- Gorzelańczyk, P. Change in the Mobility of Polish Residents during the Covid-19 Pandemic. Commun.—Sci. Lett. Univ. Zilina 2022, 24, A100–A111. [Google Scholar] [CrossRef]
- Chudy-Laskowska, K.; Pisula, T. Forecasting the number of road accidents in Subcarpathia. Logistics 2015, 4, 2782–2796. [Google Scholar]
- Khaliq, K.A.; Chughtai, O.; Shahwani, A.; Qayyum, A.; Pannek, J. Road accidents detection, data collection and data analysis using V2X communication and edge/cloud computing. Electronics 2019, 8, 896. [Google Scholar] [CrossRef]
- Rajput, H.; Som, T.; Kar, S. An automated vehicle license plate recognition system. Computer 2015, 48, 56–61. [Google Scholar] [CrossRef]
- Zheng, Z.; Wang, C.; Wang, P.; Xiong, Y.; Zhang, F.; Lv, Y. Framework for fusing traffic information from social and physical transportation data. PLoS ONE 2018, 13, e0201531. [Google Scholar] [CrossRef] [PubMed]
- Abdullah, E.; Emam, A. Traffic accidents analyzer using big data. In Proceedings of the 2015 International Conference on Computational Science and Computational Intelligence (CSCI), Las Vegas, NV, USA, 7–9 December 2015; Institute of Electrical and Electronics Engineers Inc.: Piscataway, NJ, USA, 2016; pp. 392–397. [Google Scholar] [CrossRef]
- Vilaça, M.; Silva, N.; Coelho, M.C. Statistical analysis of the occurrence and severity of crashes involving vulnerable road users. Transp. Res. Procedia 2017, 27, 1113–1120. [Google Scholar] [CrossRef]
- Bąk, I.; Cheba, K.; Szczecińska, B. The statistical analysis of road traffic in cities of Poland. Transp. Res. Procedia 2019, 39, 14–23. [Google Scholar] [CrossRef]
- Chand, A.; Jayesh, S.; Bhasi, A.B. Road traffic accidents: An overview of data sources, analysis techniques and contributing factors. Mater. Today Proc. 2021, 47, 5135–5141. [Google Scholar] [CrossRef]
- Helgason, A. Fractional integration methods and short Time series: Evidence from asimulation study. Political Anal. 2016, 24, 59–68. [Google Scholar] [CrossRef]
- Lavrenz, S.; Vlahogianni, E.; Gkritza, K.; Ke, Y. Time series modeling in traffic safetyresearch. Accid. Anal. Prev. 2018, 117, 368–380. [Google Scholar] [CrossRef] [PubMed]
- Forecasting Based on Time Series. Available online: http://pis.rezolwenta.eu.org/Materialy/PiS-W-5.pdf (accessed on 10 May 2024).
- Sunny, C.M.; Nithya, S.; Sinshi, K.S.; Vinodini, V.M.D.; Lakshmi, A.K.G.; Anjana, S.; Manojkumar, T.K. Forecasting of Road Accident in Kerala: A Case Study. In Proceedings of the 2018 International Conference on Data Science and Engineering (ICDSE), Kochi, India, 7–9 August 2018. [Google Scholar] [CrossRef]
- Procházka, J.; Flimmel, S.; Camaj, M.; Bašta, M. Modelling the Number of Road Accidents; Publishing House of the University of Economics in Wrocław: Wrocław, Poland, 2017. [Google Scholar] [CrossRef]
- Dudek, G. Rutkowski, L., Korytkowski, M., Scherer, R., Tadeusiewicz, R., Zadeh, L.A., Zurada, J.M., Eds.; Forecasting Time Series with Multiple Seasonal Cycles Using Neural Networks with Local Learning. In Artificial Intelligence and Soft Computing; ICAISC. Lecture Notes in Computer Science; Springer: Berlin/Heidelberg, Germany, 2013; Volume 7894. [Google Scholar] [CrossRef]
- Statistic Road Accident. Available online: https://statystyka.policja.pl/ (accessed on 10 May 2024).
- Traffic Accident Statistics in Lithuania. Available online: https://tka.lt/en/katalogas/eismo-ivykiu-statistika-lietuvoje/#tab-1 (accessed on 10 May 2024).
- Dertat, A. Applied Deep Learning—Part 1: Artificial Neural Networks. 2023. Available online: https://medium.com/towards-data-science/applied-deep-learning-part-1-artificial-neural-networks-d7834f67a4f6 (accessed on 10 May 2024).
- Artificial Neural Networks—Part 1. Available online: http://strata-czasu.net/sztuczne-sieci-neuronowe-czesc-1 (accessed on 10 May 2024).
- Lake, B.M.; Ullman, T.D.; Tenenbaum, J.B.; Gershman, S.J. Building machines that learn and think like people. Behav. Brain Sci. 2017, 40, e253. [Google Scholar] [CrossRef] [PubMed]
- Becoming Human. How Netflix Uses AI, Data Science, and Machine Learning—From a Product Perspective. Available online: www.becominghuman.ai (accessed on 10 August 2019).
- Forbes. The Amazing Ways eBay is Using Artificial Intelligence to Boost Business Success. Available online: www.forbes.com (accessed on 12 September 2020).
- Wu, Y.; Schuster, M.; Chen, Z.; Le, Q.V.; Norouzi, M.; Macherey, W.; Krikun, M.; Cao, Y.; Gao, Q.; Macherey, K.; et al. Google’s neural machine translation system: Bridging the gap between human and machine translation. arXiv 2016, arXiv:1609.08144. [Google Scholar] [CrossRef]
- Oronowicz-Jaśkowiak, W. The application of neural networks in the work of forensic experts in child abuse cases. Adv. Psychiatry Neurol. 2019, 28, 273–282. [Google Scholar] [CrossRef]
- Žuraulis, V.; Sokolovskij, E. Vehicle velocity relation to slipping trajectory change: An option for traffic accident reconstruction. Promet—TrafficTransp. 2018, 30, 395–406. [Google Scholar] [CrossRef]
- Gorzelanczyk, P.; Ho, J.S. Forecasting the Number of Road Accidents in Poland by Road Type. Highlights Veh. 2024, 2, 13–23. [Google Scholar] [CrossRef]
- Gorzelańczyk, P. Forecasting the number of road accidents caused by pedestrians in Poland using neural networks. Cogn. Sustain. 2024, 3, 1–10. [Google Scholar] [CrossRef]

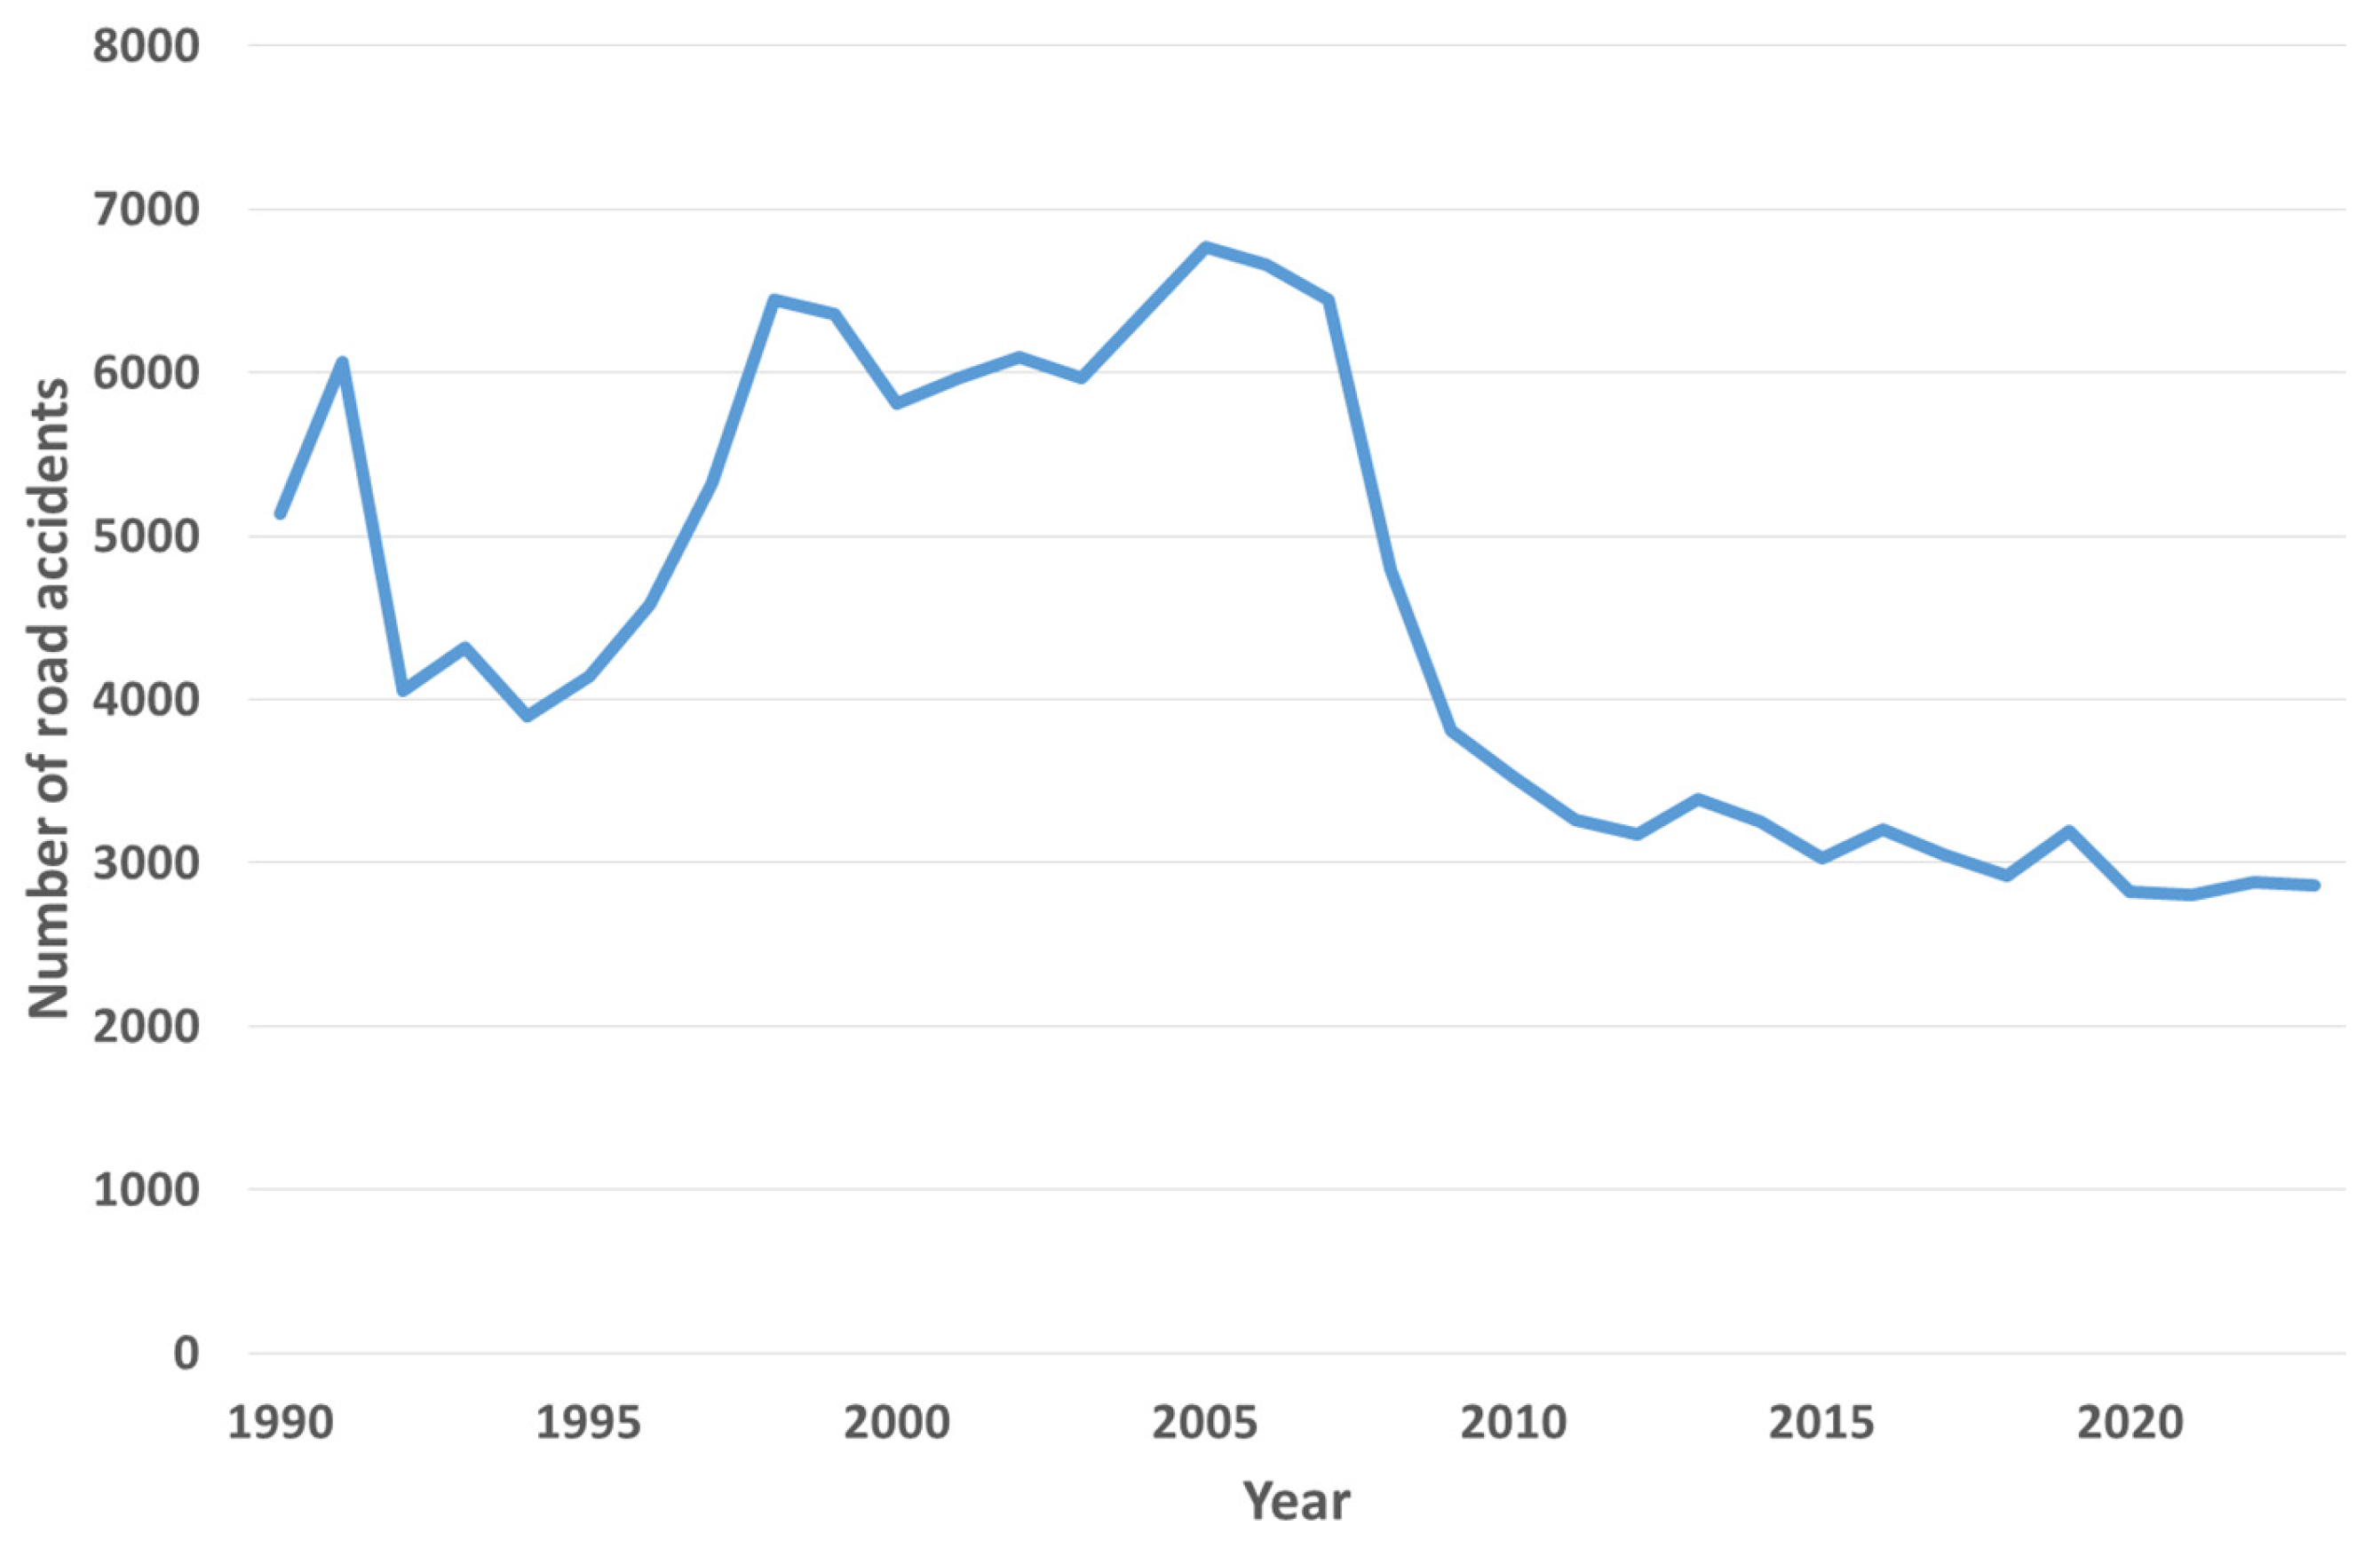
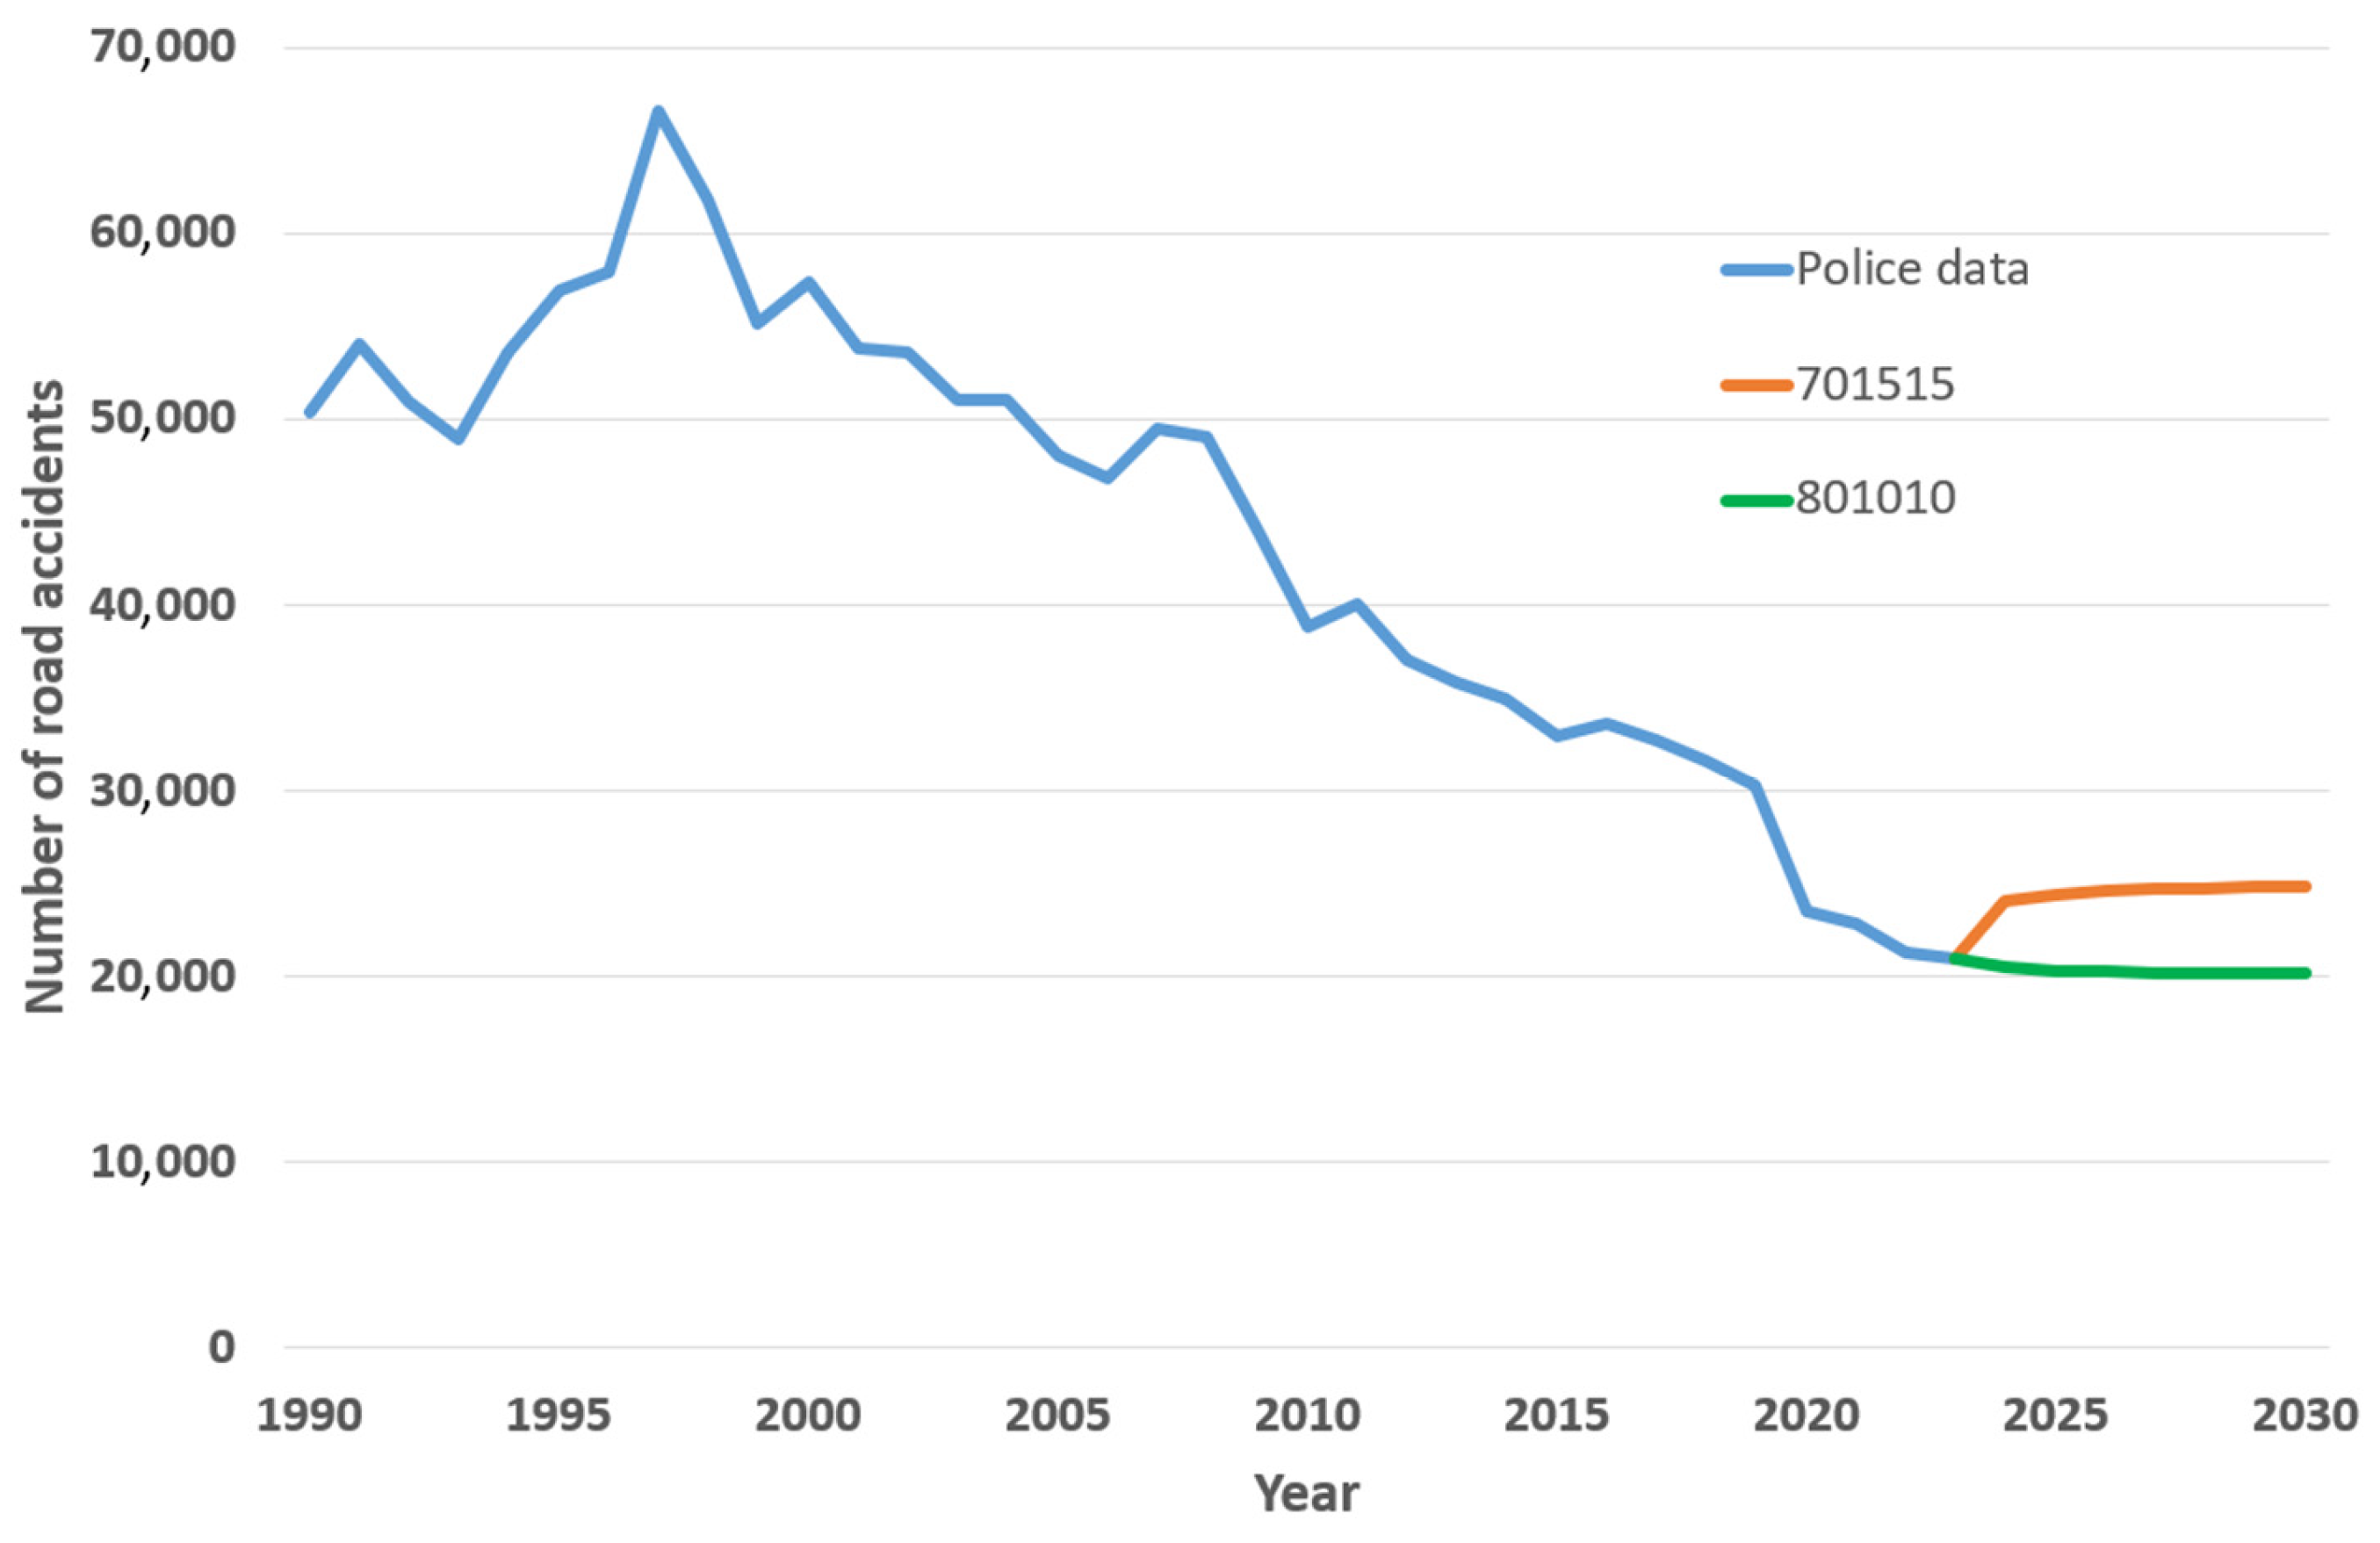

| Year | Poland | Lithuania | Year | Poland | Lithuania |
|---|---|---|---|---|---|
| 1990 | 50,432 | 5135 | 2007 | 49,536 | 6448 |
| 1991 | 54,038 | 6067 | 2008 | 49,054 | 4795 |
| 1992 | 50,990 | 4049 | 2009 | 44,196 | 3805 |
| 1993 | 48,901 | 4319 | 2010 | 38,832 | 3530 |
| 1994 | 53,647 | 3902 | 2011 | 40,065 | 3266 |
| 1995 | 56,904 | 4144 | 2012 | 37,046 | 3173 |
| 1996 | 57,911 | 4579 | 2013 | 35,847 | 3391 |
| 1997 | 66,586 | 5319 | 2014 | 34,970 | 3255 |
| 1998 | 61,855 | 6445 | 2015 | 32,967 | 3033 |
| 1999 | 55,106 | 6356 | 2016 | 33,664 | 3201 |
| 2000 | 57,331 | 5807 | 2017 | 32,760 | 3051 |
| 2001 | 53,799 | 5972 | 2018 | 31,674 | 2925 |
| 2002 | 53,559 | 6090 | 2019 | 30,288 | 3190 |
| 2003 | 51,078 | 5963 | 2020 | 23,540 | 2826 |
| 2004 | 51,069 | 6372 | 2021 | 22,816 | 2808 |
| 2005 | 48,100 | 6771 | 2022 | 21,322 | 2878 |
| 2006 | 46,876 | 6658 | 2023 | 20,936 | 2863 |
Disclaimer/Publisher’s Note: The statements, opinions and data contained in all publications are solely those of the individual author(s) and contributor(s) and not of MDPI and/or the editor(s). MDPI and/or the editor(s) disclaim responsibility for any injury to people or property resulting from any ideas, methods, instructions or products referred to in the content. |
© 2025 by the authors. Licensee MDPI, Basel, Switzerland. This article is an open access article distributed under the terms and conditions of the Creative Commons Attribution (CC BY) license (https://creativecommons.org/licenses/by/4.0/).
Share and Cite
Gorzelańczyk, P.; Sokolovskij, E. Using Neural Networks to Forecast the Amount of Traffic Accidents in Poland and Lithuania. Sustainability 2025, 17, 1846. https://doi.org/10.3390/su17051846
Gorzelańczyk P, Sokolovskij E. Using Neural Networks to Forecast the Amount of Traffic Accidents in Poland and Lithuania. Sustainability. 2025; 17(5):1846. https://doi.org/10.3390/su17051846
Chicago/Turabian StyleGorzelańczyk, Piotr, and Edgar Sokolovskij. 2025. "Using Neural Networks to Forecast the Amount of Traffic Accidents in Poland and Lithuania" Sustainability 17, no. 5: 1846. https://doi.org/10.3390/su17051846
APA StyleGorzelańczyk, P., & Sokolovskij, E. (2025). Using Neural Networks to Forecast the Amount of Traffic Accidents in Poland and Lithuania. Sustainability, 17(5), 1846. https://doi.org/10.3390/su17051846