Article

Modulating Coffee Fermentation Quality Using Microbial Inoculums from Coffee By-Products for Sustainable Practices in Smallholder Coffee Production

by
Luisa-Fernanda Duque-Buitrago
1,
Karen-Dayana Calderón-Gaviria
1,
Laura-Sofia Torres-Valenzuela
1,*,
Martha-Isabel Sánchez-Tamayo
2 and
José-Luis Plaza-Dorado
1,*
1
GIPAB Group (Agrifood and Biotechnological Processes Research Group), School of Food Engineering, University of Valle, Cali 760042, Colombia
2
Faculty of Agronomic Engineering, University of Tolima, Ibagué 730006, Colombia
*
Authors to whom correspondence should be addressed.
Sustainability 2025, 17(5), 1781; https://doi.org/10.3390/su17051781
Submission received: 28 October 2024 / Revised: 2 December 2024 / Accepted: 3 December 2024 / Published: 20 February 2025
(This article belongs to the Special Issue Sustainable Strategies for Food Waste Utilization)

Abstract

:
This study developed an inoculum culture for semi-controlled coffee fermentation using lactic acid bacteria (LAB) and yeast, with coffee production by-products as carbon sources. The viability of the inoculum was optimized by using a mixture design to vary the proportions of coffee pulp (CP) and wastewater (CWW) in 0.25 increments; as a process variable, fermentation time ranged from 36 to 48 h for LAB and 12 to 36 h for yeast. Soluble solids (SS), pH, and titratable acidity (TA) were monitored, and the response variable was the variation in microbial viability. The optimized inoculums were used for coffee fermentation alone and in combination, and fermentation parameters and sensory evaluation were measured. The optimal by-product combination for LAB inoculum was 100% CP, with a 48 h fermentation, reaching a maximum of 7.8 × 10⁷ CFU/mL. The optimal formulation for yeast was 100% CWW for 36 h, achieving a maximum concentration of 8.3 × 10⁸ CFU/mL. Experimental results for both inoculums were fit to a quadratic statistical model with R2 of 0.84 and 0.88 and Adj-R2 of 0.77 and 0.83 for LAB and yeast, respectively. The optimized inoculums produced high sensory scores, particularly in balance, fragrance, and acidity. Using mixed inoculums, we achieved the highest fragrance/aroma score (8.25) and an improved balance, attributed to higher TA and lower pH, which are linked to enhanced flavor complexity. This demonstrates that by-product-based inoculums can not only increase microbial viability but also improve the sensory quality of coffee, supporting sustainable practices in coffee processing.

1. Introduction

Coffee, a globally consumed commodity, faces multifaceted challenges that impact its economic, social, and environmental sustainability, ranging from socioeconomic factors to environmental concerns and market volatility. In response, different strategies have been used to reduce volatility, increase productivity, and adopt sustainable practices to improve quality and prices. Producing nations have invested in differentiating their products as ‘specialty coffees’ through origin, processing techniques, and sustainability practices. Colombian mild-washed coffee serves as an exemplary case, distinguished by its unique characteristics that meet growing consumer demands for high-quality, sustainably produced coffee. At the producer level, diversifying postharvest processes, such as fermentation reactions, is an essential strategy for enhancing coffee distinctiveness and shaping sensory attributes and overall quality [1]. The link between postharvest processes and sensory characteristics emphasizes the importance of exploring modifications to traditional fermentation techniques. This topic has garnered significant attention from industry and academic researchers in recent years [2].
In wet coffee processing, coffee cherries are de-pulped and fermented after harvesting to remove residual mucilage, a process that significantly influences flavor through the production of microbial metabolites [3]. This workflow involves key steps: de-pulping, washing, fermentation lasting 12–18 h, and drying beans to achieve a final moisture content of 10–12%. However, this process generates substantial environmental challenges. On average, processing one ton of dried coffee beans generates approximately 3.6 tons of fresh by-products [4]. Approximately 40–45 L of wastewater (CWW) are produced per kilogram of processed coffee, with a chemical oxygen demand (COD) of 3000–7000 mg/L [5]. Untreated CWW and by-products often lead to water contamination, microbial proliferation, and unpleasant odors in rural areas, where waste management infrastructure is limited.
Coffee pulp (CP), comprising 29–43% (w/w) of the fruit, and mucilage, which contains 84.2% water, 8.9% protein, and 4.1% sugar [6,7], are among the key by-products of wet processing. These materials are rich in carbohydrates, providing valuable carbon sources for microbial fermentation. Additionally, CWW is rich in sugars and bioactive compounds, including caffeine and phenolics, and has potential applications in food, pharmaceutical, and cosmetic industries [8].
Despite their environmental risks, these by-products present an opportunity for sustainable reuse. Their composition makes them ideal substrates for microbial fermentation, transforming waste into valuable resources and aligning with circular economic principles in coffee production. Such innovations can mitigate environmental impacts while contributing to the sustainable development of the coffee industry. Fermentation is a critical stage in coffee processing and shapes flavor and aroma profiles. Natural fermentation occurs regardless of the post-harvest method used to obtain parchment coffee [9,10]. In wet or submerged fermentation, the medium is excess water, while in dry or semi-dry methods, it is the mucilage itself. Innovations in post-harvest operations include the introduction of specific microorganisms, such as LAB and yeast, either alone or in combinations, sourced externally or internally isolated from the same coffee process [11,12]. These microorganisms are intentionally added to initiate fermentation, leading to shorter fermentation times and desirable outcomes. These modifications aim to amplify desired flavor attributes while mitigating undesirable ones, resulting in coffee with consistent flavors. These innovations increase the marketability of specialty coffees, reinforcing the importance of fermentation in the pursuit of coffee quality and differentiation, and are being studied in different steps of the processes, as in the coffee processing per se [13,14], in the green coffee beans already processed [15,16], and in the development of new beverages of brewed coffee [17,18,19].
LAB and yeast are significant components of the indigenous microbiota associated with the submerged fermentation of de-pulped coffee cherries in wet processing [9,20]. During mucilage fermentation, LAB produces organic acids, such as lactic and acetic acid, and volatile compounds that significantly contribute to the flavor of the coffee profile [21]. These organic acids enhance the acidity and overall complexity of the coffee. Additionally, LAB contributes to developing desirable fruity and floral notes by producing esters and other volatile compounds. LAB also plays a crucial role in reducing undesirable compounds that may negatively affect coffee flavor by outcompeting spoilage microorganisms and lowering the pH, thus creating a favorable environment for beneficial flavors [22,23]. Conversely, yeast produces volatile metabolites, particularly aromatic esters, that can remain after roasting and contribute to the fruity and floral attributes of the roasted coffee [2,20,21,22,23,24,25]. The metabolic activities of yeast significantly influence the modulation of soluble carbohydrates, organic acids, alcohols, volatile compounds, and other substances in the coffee pulp and mucilage. This metabolic exchange alters flavor-related constituents in green coffee beans, modifying the final roasted coffee flavor [2].
Previous studies on coffee fermentation were conducted with monocultures of various commercial microorganisms, including fungi, yeasts, and LAB [12,26]. The favorable biomodifications of coffee aroma by the tested microorganisms during green coffee bean fermentation were mainly achieved through the direct production of fruity volatile compounds by yeasts [25] and the acidification of green coffee beans by sugar-supplemented LAB fermentation, which indirectly elevated the production of caramel-smelling furan derivatives during roasting [16,22,27]. Also, not only have individual microbial applications taken place, but the synergistic interactions between yeast and LAB such as Pichia fermentans and Pediococcus acidilactici have been reported to impact aroma complexity significantly [23].
However, some methodologies used in these studies are not feasible at the farm scale, as they often require sterilization of coffee or rely on advanced technology and specialized knowledge. While scientifically valid for understanding the effects of each inoculum, this approach is impractical for smallholder coffee growers due to their particular characteristics [28]. Additionally, the preparation of inoculums using specific microbiological media presents a significant drawback. These media often demand controlled laboratory environments and precise formulations, which are not easily replicable outside specialized facilities. This further limits the applicability of these methods for farmers with limited resources or access to advanced equipment.
Despite operating on a small scale, smallholder coffee farmers are vital to the industry. They represent 95% of coffee farms, with 84% managing less than two hectares of land [28,29]. Developing accessible, low-cost, and sustainable fermentation methods that utilize coffee by-products can contribute to sustainability by empowering smallholder farmers, promoting rural development, ensuring equitable access to innovation, and encouraging environmentally conscious coffee production. This study aimed to optimize the use of coffee by-products in developing inoculum for semi-controlled fermentation with commercial LAB and yeast at a smallholder scale. By focusing on accessible and replicable methods, the study seeks to advance sustainable practices in coffee processing, reducing waste, improving resource efficiency, and enhancing the livelihoods of smallholder farmers. To achieve this, a three-step procedure was followed: (1) designing and optimizing mixture proportions of CP and CWW for microbial viability variation, (2) applying these optimized inoculums to coffee fermentation, and (3) evaluating the fermentation parameters and sensory qualities of the final product.

2. Materials and Methods

A research roadmap was designed to ensure a replicable approach toward advancing sustainable coffee processing practices. This structured approach is illustrated in Figure 1, providing a clear overview of the study’s methodology.

2.1. Coffee Beans

Freshly harvested coffee cherries (Coffea arabica var Colombia) were obtained at 1557 m above sea level in Morales, Cauca, Colombia. During harvest, cherries were selected based on health and maturity criteria; any green, overripe, or damaged cherries were discarded.

2.2. Coffee Pulp

The coffee pulp (CP) was collected immediately from the de-pulping machine during a traditional wet process. It was washed to remove debris, stored in plastic bags, and frozen until needed. The pulp was thawed, blended in a commercial blender with water at a 1:2 pulp-to-water ratio, and boiled for 5 min to stop spontaneous fermentation.

2.3. Coffee Wastewater

The coffee wastewater (CWW) was produced during the traditional wet fermentation process, in which de-pulped coffee cherries were submerged in water at a 1:1 ratio and allowed to ferment spontaneously for 24 h. Following fermentation, the coffee mass was removed, and the CWW was immediately boiled for 5 min, cooled, and then frozen.

2.4. Microorganisms

Fresh commercial yeast Saccharomyces cerevisiae (Levapan, Cali, Colombia) and lactic acid bacteria Streptococcus thermophilus and Lactobacillus delbrueckii subsp. Bulgaricus commercial yogurt (Colacteos, Pasto, Colombia) were used for fermentation.

2.5. Analytical Methods

2.5.1. Microorganism Viability

Viable aerobic bacterial counts were obtained by enumerating LAB on de Man Rogosa Sharpe agar and culturing yeast on potato dextrose agar (Scharlab, Barcelona, Spain). For microbiological analysis, 1 mL samples from each CWW were diluted in a 10-fold series with peptone water (Scharlab, Barcelona, Spain), ranging from 101 to 106. Microbial counts were determined using the standard spread plate method, with agar plates incubated at 37 °C for 48 h for bacteria and 24 h for yeasts. Total viable bacterial counts were obtained by counting the colony-forming units (CFU). The reported population data represents the means of triplicate analyses.

2.5.2. pH

The pH of the inoculum and the coffee fermentation liquid was monitored by taking samples from each at every sampling point according to AOAC method 981.12 [30]. The pH of the brewed coffee was determined using a technique described by Mazzafera (1999), where 2.25 g of ground coffee was mixed with 50 mL of deionized water heated to 80 °C, then cooled to room temperature before measuring the pH. The reported data represents the mean values from triplicate analyses [31].

2.5.3. Soluble Solids

The total soluble solids (SS) of the inoculum and the coffee fermentation liquid were monitored by taking samples from each at every sampling point using a digital and portable refractometer (Atago, Tokyo, Japan), according to AOAC Official Method 932.12 [30].

2.5.4. Titratable Acidity

Titratable acidity (TA) was determined by mixing 1 mL of liquid media from the inoculum, fermentation, and brewed coffee with distilled water. Acidity was titrated using 0.1 N sodium hydroxide with phenolphthalein as the indicator. The results reported are the means of triplicate analyses with standard deviation, according to AOAC Official Method 942.15 [30], using lactic acid as the standard acid with a specified equivalence of 0.009.

2.6. Coffee Cup Quality Evaluation

Cup quality was evaluated by an external coffee taster certified as a Q-Arabica grader. The evaluation was performed in triplicate as a blind assessment, with each sample assessed three times by the same certified grader to ensure consistency. The coffee samples were prepared following Specialty Coffee Association (SCA) protocols [32], roasted at 115.6 °C for 9–10 min until reaching a roast degree of 48–63 Agtron, and ground according to SCA cupping protocols. For brewing, 150 mL of hot water (92–94 °C) was poured over 8.25 ± 0.25 g of ground coffee, and the mixture steeped for 4 min. Sensory assessments commenced at 65 °C for olfactory evaluation and 43 °C for gustatory evaluation. Attributes assessed included aroma, taste, acidity, body, balance, aftertaste, and overall quality, each rated on a scale from 0 to 10 in 0.25 increments. A descriptive analysis and a total score, with a maximum of 100 points, were assigned, covering fragrance/aroma, flavor, acidity, body, uniformity, balance, sweetness, clean cup, and overall quality. To ensure an anonymous review, samples were masked, and the grader was not informed of the experimental treatments of each sample.

2.7. Experimental Methods

2.7.1. Bacteria and Yeast Inoculums Optimized Production

The experiments utilized a mixture design, part of the response surface methodology class. Mixtures were defined by varying the percentages of coffee pulp (CP) and coffee wastewater (CWW) in experimental units of 100 mL with 5% (v/v) inoculation of LAB and 1% (w/v) yeast. The optimization of the mixtures was based on the relative microbial growth (RG) of CFU/mL from the initial inoculation to the maximum CFU/mL during the 48 h fermentation, with measurements taken at 0, 12, 18, 24, 36, and 48 h. SS, TA, and pH were also monitored during the 48 h inoculum fermentation. An analysis of variance (ANOVA) was performed to determine the effect of these parameters on inoculum generation during the process variable levels of each microorganism. Statistical analyses were performed with MINITAB version 19.
Relative microbial growth (RG) was quantified as the maximum increase in microbial viability and the time required to achieve it, as shown in Equation (1):
RG   = ( C F U t i C F U t 0 ) C F U t 0
where C F U t i represents the highest viable count reached by each microorganism during the experiment at time ti, and C F U t 0 is the viable count at the initial time point.
The experiments were conducted in a randomized order to reduce systematic errors. As indicated in Equation (2), the sum of the proportions equals one.
i = 1 k X i = 10 X i 1   i = 1 k
where X i stands for the proportions of the i t h component of the mixture that represents the total number of components.
This study employed a quadratic regression model, as shown in Equation (3), to analyze the relationship between the dependent variable y ^ and the independent variables X i and X j :
y ^ = i = 1 k β i X i + i = 1 k 1 j = i + 1 k β i j X i X j  
where y ^ is the predicted dependent variable, X i (CP) and X j (CWW) represent independent variables; β i and β i j denote the linear and quadratic coefficients, respectively. The first term captures the linear effects of the variables, while the second term accounts for the interactions between variable pairs, capturing quadratic effects.
Table 1 presents the proportions of components, the experimental conditions of the mixture design, the response, and the process variables. The experiments consisted of 18 runs, including cubic, central, and axial points. The proportions of the components were evaluated for both yeast and LAB. Additionally, different growth times were assessed for each microorganism: 36 and 48 h for LAB and 12 and 36 h for yeast.
An ANOVA was performed to assess the adequacy and significance of the model. The statistical significance of the model and its equation terms were evaluated based on the p-value (p < 0.05). Statistical analyses were carried out using MINITAB version 19. The quality of the model was evaluated by computing the coefficient of determination (R2) to determine the proportion of variance in the dependent variable explained by the independent variables, as shown in Equation (4). The adjusted R2 to measure the variance between model predictions ( y ^ ) and experimental data ( y ) as described in Equation (5). Values close to one indicate strong agreement between experimental and simulated data. The root mean square error (RMSE) was calculated to evaluate the predictive accuracy of the model using Equation (6), where lower RMSE values suggest higher model precision [33].
R 2 = 1 i = 1 n ( y i y ^ i ) 2 i = 1 n ( y i y ¯ ) 2
A d j u s t e d   R 2 = 1 ( 1 R 2 ) ( n 1 ) n P 1
R M S E = i = 1 n ( y i y i ^ ) 2 n
where y i represents the experimental data, y i ^ is the model prediction, y ¯ the experimental data, n is the number of observations, and P is the number of predictors. SS, TA, and pH were also monitored during the 48 h inoculum fermentation. An ANOVA was performed to determine the effect of these parameters on inoculum generation during the process variable levels of each microorganism. Statistical analyses were performed with MINITAB version 19.

2.7.2. Optimization

A response optimizer was used to find the optimal mixture using the desirability compound, aiming to maximize the RG as the response variable. All variables were equally weighted. The selection was based on response variable models explaining over 70% of behavior (R2 adj. > 0.7).

2.7.3. Experimental Validation

Validation experiments were performed by reproducing inoculum production under optimal conditions. The observed responses were compared to the optimal predictions from the optimization, using relative error (RE) as shown in Equation (7):
R E = y y ^ y 100 %
The optimized procedure and control fermentation were performed three times, with three samples per replicate.

2.8. Coffee Processing with Optimized Inoculums

The coffee processing was conducted using the wet method. Freshly harvested Coffea arabica cherries were de-pulped using a DH-2 depulper (Penagos, Colombia), and the resulting beans were mixed with potable water to ferment and remove the mucilage. The laboratory-scale setup consisted of 1 L flasks containing 800 g of de-pulped beans and 400 mL of water.
LAB and yeast inoculums were prepared according to the optimized conditions obtained in the Section 2.7.2. prior to coffee processing. The following six fermentation treatments were applied with 6% (v/w) of the respective inoculum: (1) Direct LAB inoculation sourced from commercial yogurt without prior optimization; (2) Optimized LAB inoculum prepared under optimized growth conditions; (3) Fresh yeast inoculation without prior optimization; (4) Optimized yeast inoculum prepared under optimized growth conditions; (5) Mixture of optimized LAB and yeast inoculum; (6) Control treatment without microbial inoculation.
All coffee processing was conducted at room temperature without sterilization of the materials to mimic real-world coffee farm conditions. The fermentation vessels were left undisturbed for the process, allowing for the natural degradation of mucilage. After fermentation, the coffee beans were removed from the vessels, washed with potable water, and dried at 40 °C for 24 h until the beans reached a moisture content of 10–12%.
A principal component analysis (PCA) was used to evaluate both physicochemical and sensory attributes across the different coffee samples. The sensory data included fragrance/aroma, body, flavor, uniformity, and overall score, while the physicochemical parameters were assessed both at the initial (I) and end (E) stages.

3. Results

The results are structured into four sections. Section 3.1 presents the monitoring of key fermentation parameters such as pH, SS, TA, and RG during the inoculum fermentation process. Section 3.2 focuses on the statistical analysis of the development of the inoculum, providing results on RG, statistical models, and further analysis of the interactions between coffee by-products and RG. Section 3.3 addresses the optimization of the results using the desirability compound and the chosen model to maximize RG, along with the validation of the optimized inoculum, comparing the predicted and observed outcomes to evaluate the accuracy of the optimization process. Finally, Section 3.4 evaluates the performance of the optimized inoculum during coffee fermentation, emphasizing fermentation parameters and the sensory evaluation of the final product.

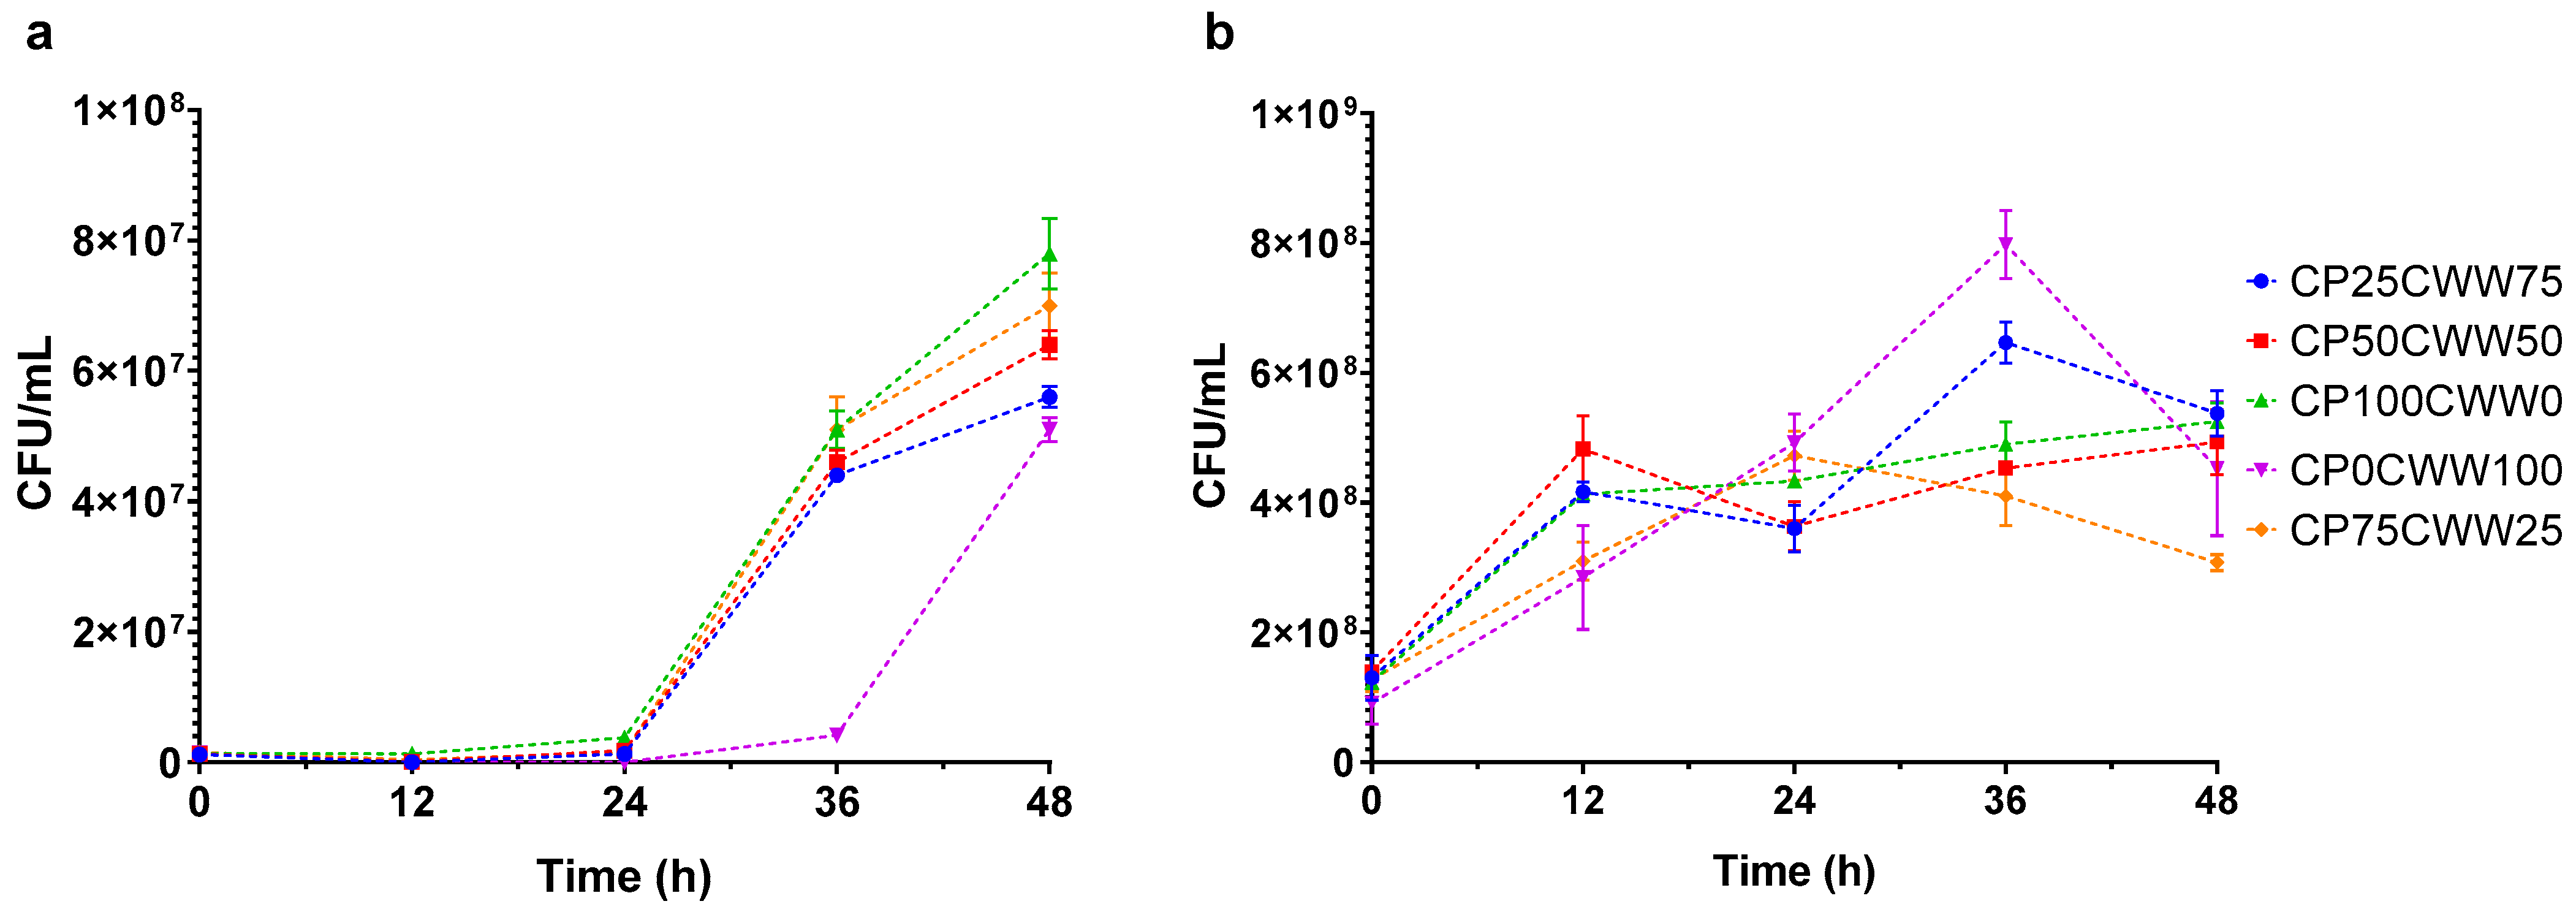
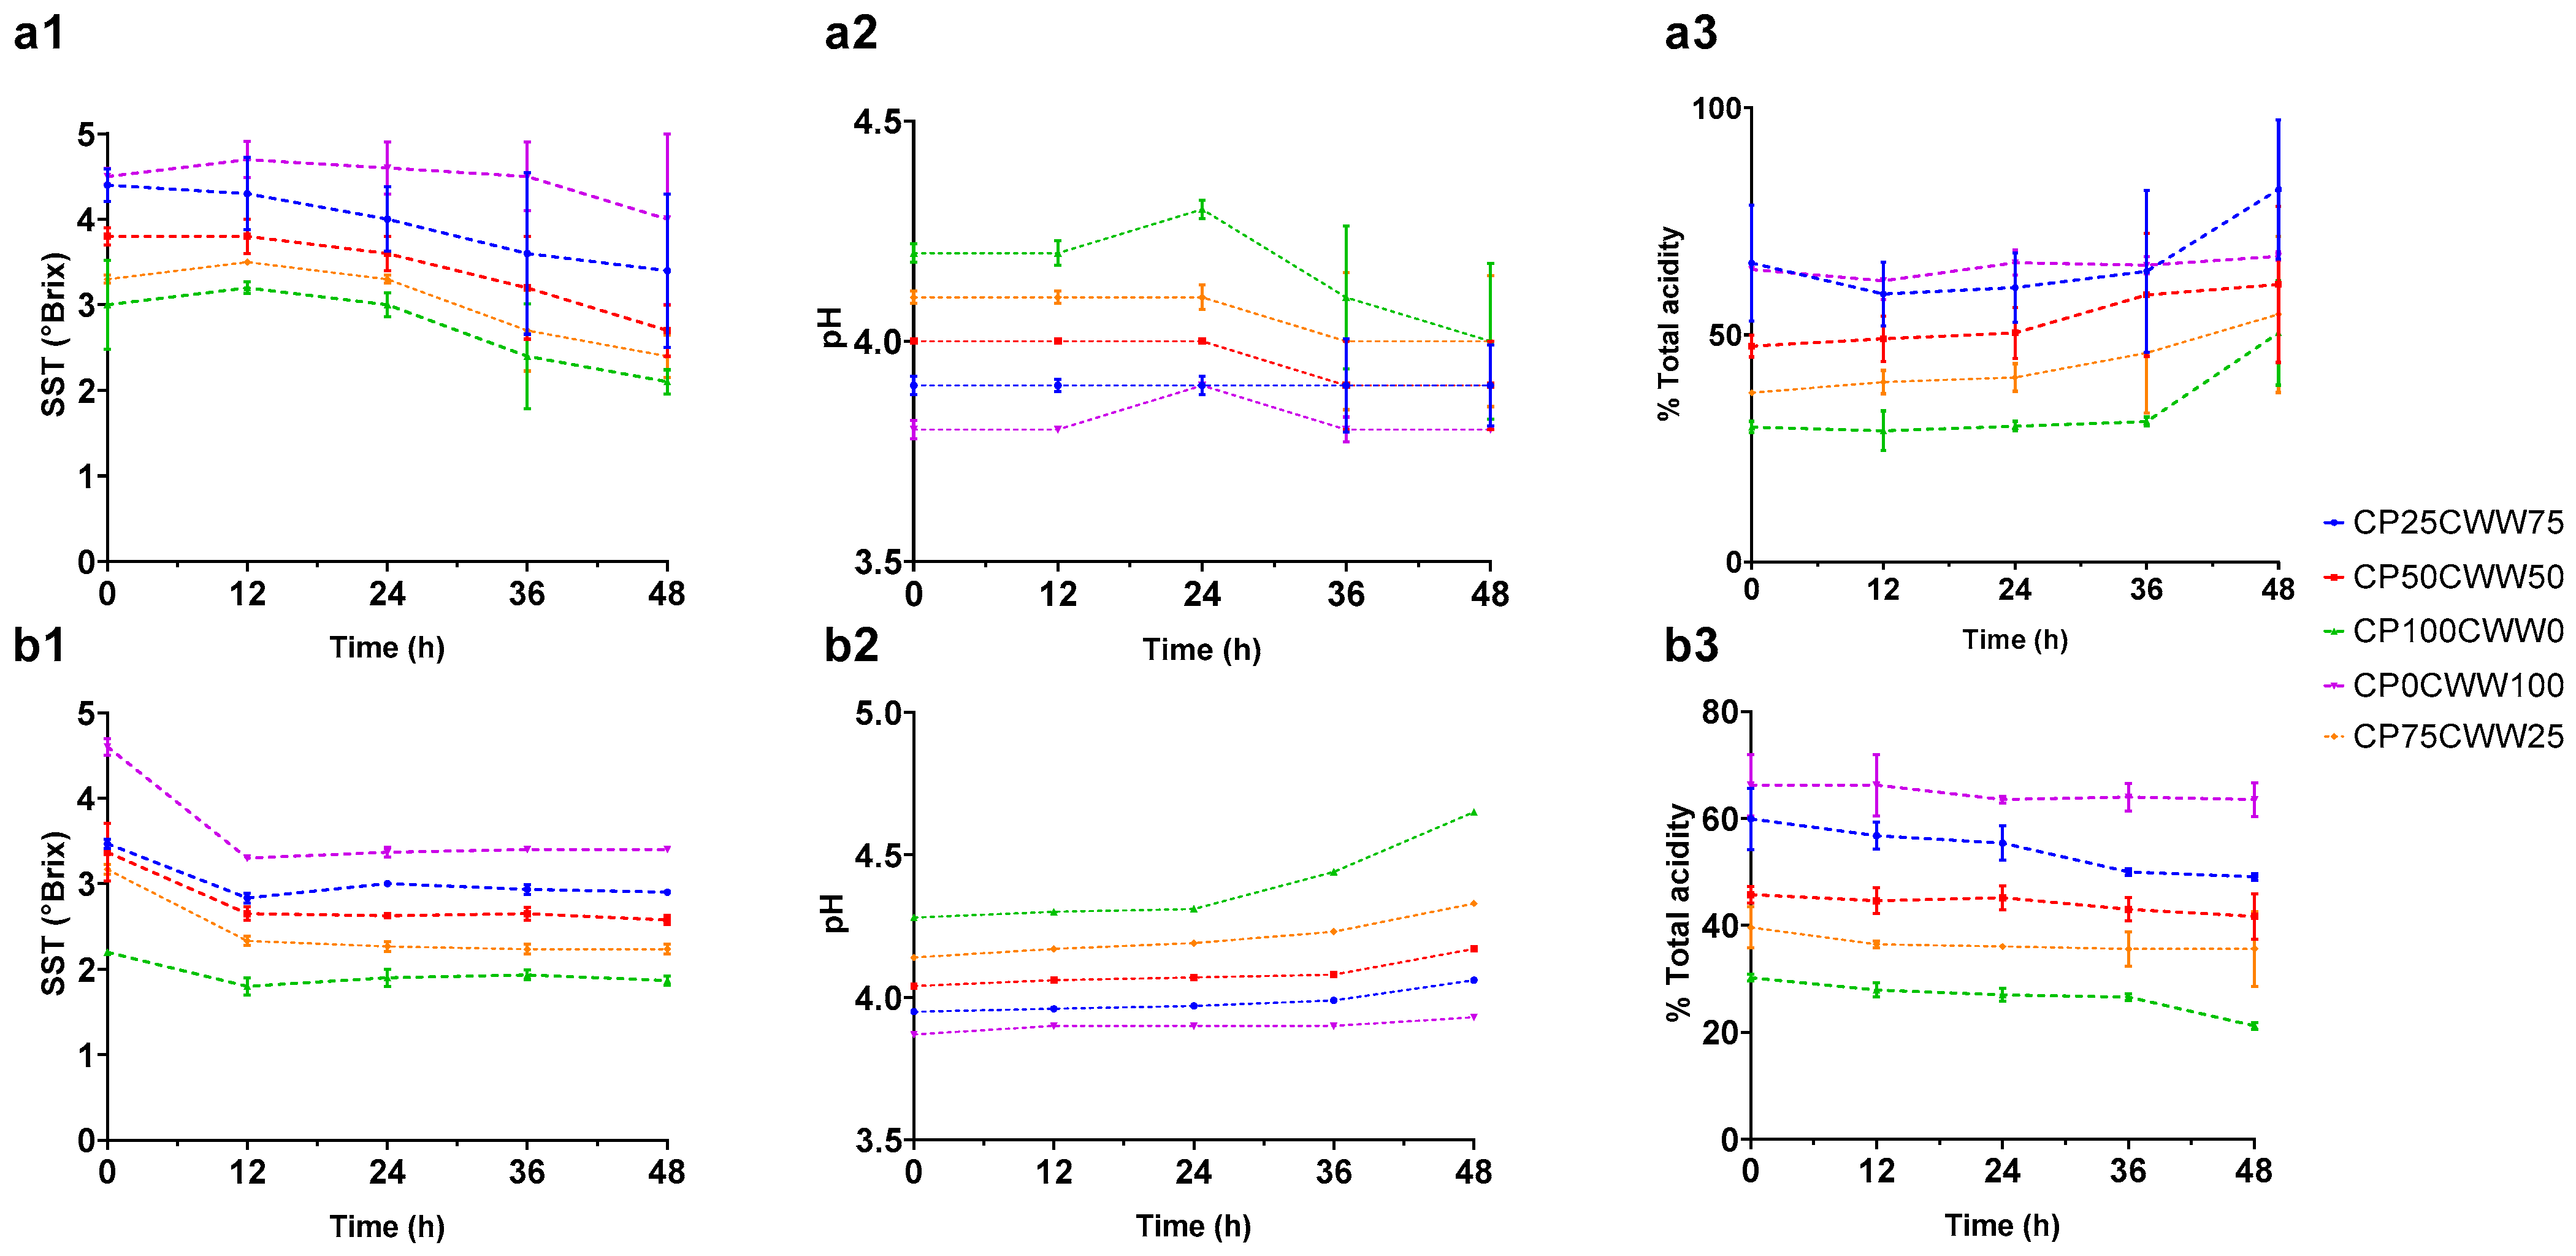
3.1. Dynamic Monitoring of Inoculum Fermentation Parameters

The mixture design of experiments (DOE) for both microorganisms included eighteen experimental runs in five formulations, each varying by 25%. The initial physicochemical parameters of CP and CWW used as carbon sources in the inoculum were as follows: pH 4.24 and 3.81 ± 0.06, TA 0.46 ± 0.02 and 0.65 ± 0.02, and SS 3.20 ± 0.33 °Brix and 4.91 ± 0.33 °Brix, respectively. Figure 2 shows the growth of LAB and yeast across the different formulations. The initial microbial viability among formulations varied between values of 1.4 ± 0.1 × 10⁶ CFU/mL for LAB and 5.8 ± 0.4 × 10⁷ CFU/mL for yeast.
The growth of each microorganism exhibited opposite trends. LAB viability was primarily influenced by the proportion of CP in the formulations, reaching 7.8 × 10⁷ CFU/mL after 48 h of incubation in CP100CWW0. In contrast, yeast viability was driven by the percentage of CWW, peaking at 8.3 × 10⁸ CFU/mL after 36 h of incubation in CP0CWW100.
Figure 3 illustrates the fermentative parameters SS, pH, and TA for the different formulations, highlighting the dynamic changes observed during fermentation for both inoculums. A consistent decline in SS was observed throughout the 48 h fermentation period in all formulations. Initial SS values ranged from 2.2 to 4.6 °Brix, influenced by the proportions of CP and CWW in each formulation. As fermentation progressed, SS levels gradually decreased, with the most significant drop observed in the yeast-inoculated blends after 12 h, indicating sustained sugar consumption by the yeast formulations CP0CWW100 with yeast and CP100CWW0 with LAB exhibited the sharpest declines, suggesting higher sugar availability and consumption by the inoculated microorganisms than initially measured.
The pH levels exhibited slight fluctuations during fermentation. In LAB-inoculated formulations, particularly CP100CWW0 and CP75CWW25, pH values dropped after 24 h, which is consistent with the production of organic acids as LAB metabolizes sugars and growth. In contrast, yeast-inoculated formulations, such as CP0CWW100 and CP25CWW75, maintained stable pH levels or showed slight increases over time, indicating that yeast metabolism results in less acid production compared to LAB.
TA increased significantly in LAB-inoculated formulations over the 48 h fermentation period, especially in CP100CWW0 and CP75CWW25. The sharp increase in TA between 36 and 48 h aligns with active acid production by LAB, as seen in the corresponding decrease in pH. On the other hand, yeast-inoculated formulations exhibited minimal or stable changes in TA, with CP0CWW100 even showing a slight reduction. This further supports the observation that yeast fermentation produces lower amounts of acid compared to LAB.

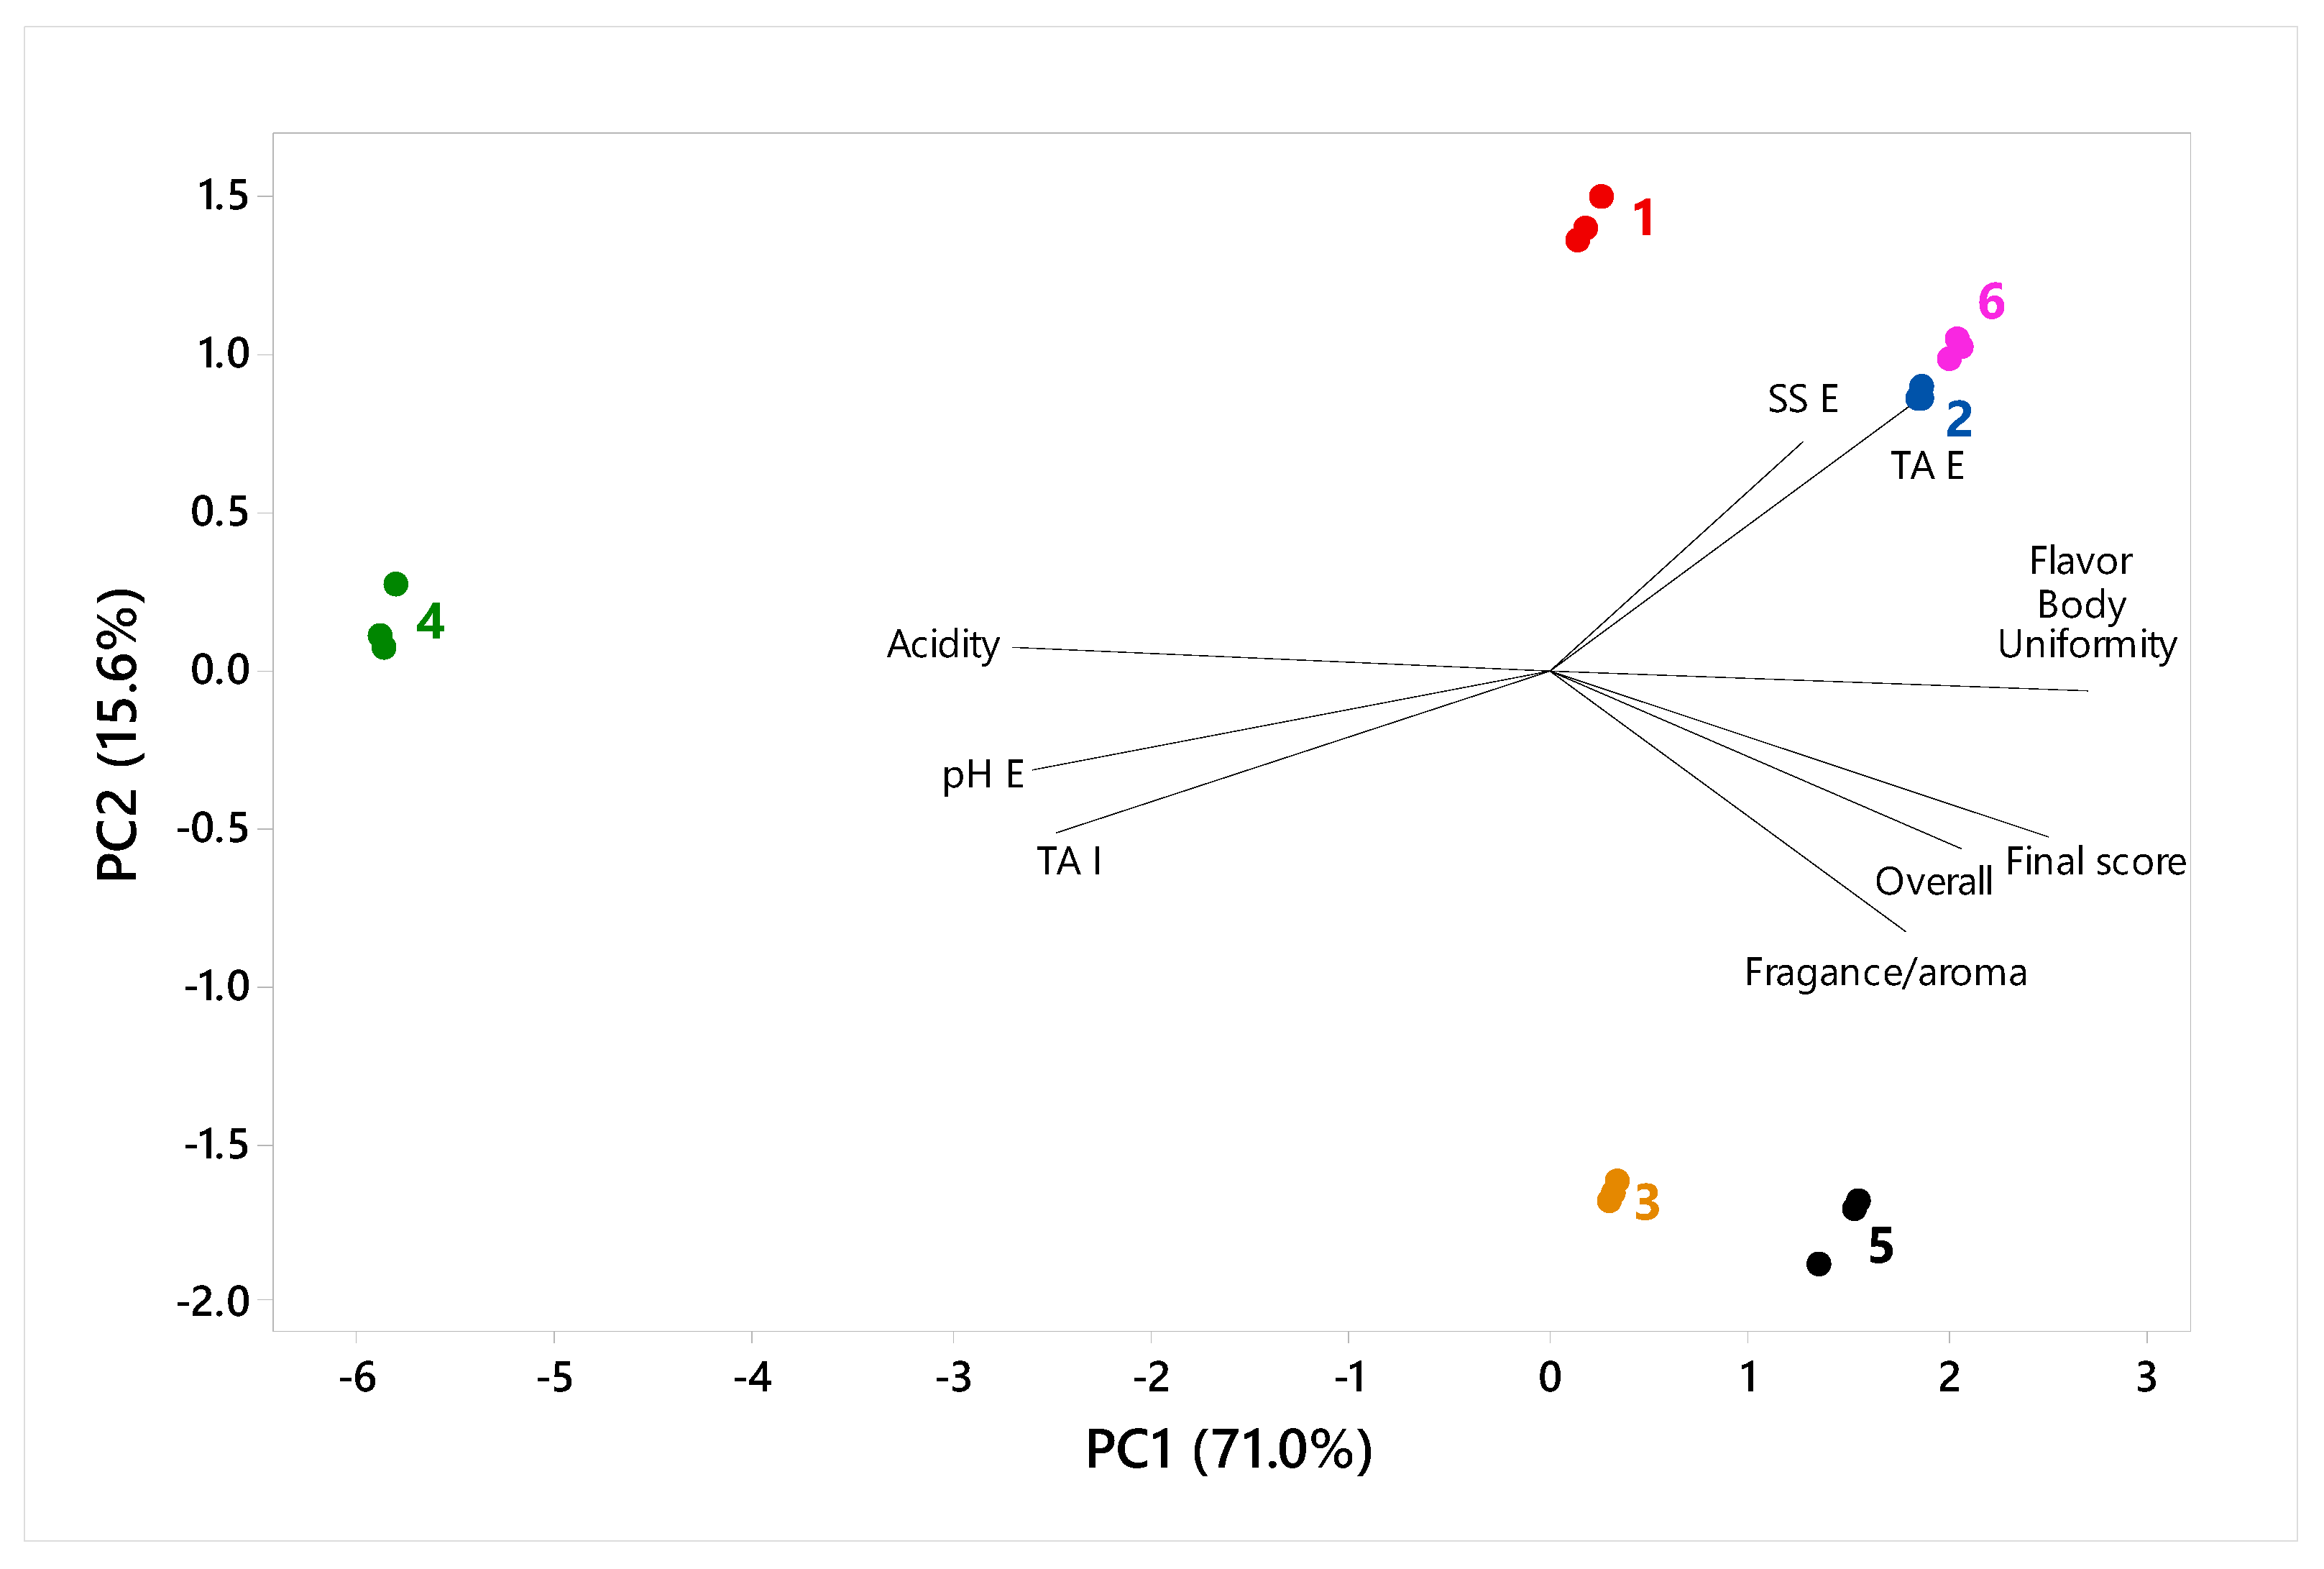
3.2. Statistical Analysis

The independent and dependent variables were fitted to the various models proposed in the experimental design. Table 2 summarizes the observed and predicted responses for both microorganism inoculums based on the results of the mixture design experiment. The linear predictive models for LAB and yeast are shown in Equations (8) and (9), respectively, while the quadratic predictive models for these microorganisms are presented in Equations (10) and (11).
The quadratic model demonstrated a better fit for the LAB and yeast inoculum, as evidenced by statistical values. For the LAB inoculum, the quadratic model resulted in an R2 of 0.84, an adjusted R2 of 0.77, and an RMSE of 4.71. Similarly, the quadratic model yielded an R2 of 0.88, an adjusted R2 of 0.83, and an RMSE of 0.76 for the yeast inoculum. These values indicate a reasonable fit between the predicted and observed data, especially for the yeast inoculum.
Linear model,
R G L A B = 12.163   X 1 43.744   X 2 + 0.870   X 3 X 1 + 1.710   X 3 X 2
R G y e a s t = 7.563   X 1 + 1.609   X 2 0.068   X 3 X 1 + 0.285   X 3 X 2
Quadratic model
R G L A B = 26.848   X 1 82.755   X 2 + 216.060   X 1 X 2 + 1.628   X 3 X 1 + 2.467   X 3 X 2 4.196   X 1 X 2 X 3
R G y e a s t = 5.002   X 1 0.952   X 2 + 14.185   X 1 X 2 + 0.053   X 3 X 1 + 0.407   X 3 X 2 0.672   X 1 X 2 X 3
where RG represents relative microbial growth; X 1 and X 2 are independent variables CP and CWW, respectively; and X 3 is process variable.
The ANOVA of quadratic models revealed significant effects of the concentrations of CWW, CP, and time on the viability of the microorganisms. Both CWW and CP concentrations, along with incubation time, were statistically significant components and factors for both inoculums. LAB viability increased with higher time values and was significantly influenced by the proportion of CP in the mixture (p = 0.025). Similarly, yeast viability increased with higher time values but was primarily driven by the percentage of CWW (p = 0.00) (Supplementary Materials Table S1).

3.3. Optimization and Validation

The response variable was optimized using the desirability function to maximize microbial growth for both the LAB and yeast inoculums. According to the model, the highest RG for the LAB inoculum was predicted with 100% CP (CP100CWW0) and a fermentation time of 48 h, yielding a predicted RG of 51.3, equivalent to a theoretical count of 7.1 × 10⁷ CFU/mL. For the yeast inoculum, the highest RG was predicted with 100% CWW (CP0CWW100) and a fermentation time of 36 h, resulting in an RG of 13.7 and a theoretical count of 8.5 × 10⁸ CFU/mL.
Validation experiments were performed in triplicate under these optimized conditions. At the end of the fermentation period, the experimental RG values for LAB were 45.98 ± 4.30 (equivalent to 6.4 ± 0.6 × 10⁷ CFU/mL), while for yeast, they were 12.14 ± 1.16 (equivalent to 7.6 ± 0.7 × 10⁸ CFU/mL). These results confirmed the accuracy of the model, as the experimental values closely matched the theoretical predictions. The RE was 10% for LAB and 11% for yeast, demonstrating the reliability of the optimization process, as shown in Table 3.

3.4. Performance Evaluation of Optimized Inoculum

The viability of LAB and yeast in coffee fermentation was evaluated using both direct inoculation from commercial sources and optimized inoculums. The initial LAB count from direct inoculation using commercial yogurt (fermentation 1) was 2.9 ± 0.5 × 10⁶ CFU/mL, while the optimized LAB inoculum (fermentation 2 and 5) had an initial count of 7.1 ± 0.7 × 10⁷ CFU/mL. For yeast, direct inoculation using fresh yeast (fermentation 3) showed an initial count of 3.5 ± 0.4 × 10⁹ CFU/mL, whereas the optimized yeast inoculum (fermentation 4 and 5) started with 8.2 ± 0.8 × 10⁸ CFU/mL. The SS, pH, and TA were also measured during fermentation, as detailed in Table 4.
Regarding pH, LAB-inoculated coffee (fermentations 1 and 2) showed a decrease, indicating increased acidity, which is typical of LAB-driven fermentations. This aligns with the expected production of organic acids by lactic acid bacteria. In contrast, yeast-fermented coffee (fermentations 3 and 4) maintained stable pH levels or exhibited only slight fluctuations, indicating lower acid production compared to LAB-fermented coffee. Regarding TA, coffee inoculated with LAB (fermentations 1 and 2) demonstrated a significant increase in acidity during fermentation, consistent with the observed pH decrease. Conversely, yeast-fermented samples (fermentations 3 and 4) exhibited more stable TA levels, indicating lower acid production. The control treatment (fermentation 6) followed a similar TA trend to yeast-fermented coffee. LAB-inoculated coffee (fermentations 1 and 2) showed a substantial increase in TA, correlating with the pronounced pH decrease, confirming that LAB fermentation was characterized by elevated acid production from the breakdown of carbohydrates into organic acids, driving the overall acidification of the coffee. In contrast, TA levels in yeast-fermented coffee (fermentations 3 and 4) showed a modest increase, indicating that yeast fermentation resulted in lower acid production. This aligns with the more stable pH values observed, suggesting that yeast activity primarily influenced other metabolic pathways, such as the production of flavor compounds, rather than significant acid generation.
The inoculation of LAB and yeast on the sensory properties is shown in Table 5. Regarding the sensory evaluation, variations in fragrance/aroma, flavor, aftertaste, and acidity scores were recorded across the fermentation setups. Treatment 5, which involved a mixture of optimized LAB and yeast inoculum, consistently scored highest in key sensory attributes, such as fragrance/aroma (8.25), flavor (8), and overall score (8.25), indicating a direct relationship between fermentation parameters and sensory outcome as the observed increase in titratable acidity in treatment 5, which showed the highest final TA and lowest pH.
Aftertaste showed little variation across treatments, suggesting that despite differences in acidity, the aftertaste remained consistent. Similarly, body, or mouthfeel, exhibited slight variation, with scores consistently between 7.5 and 7.75, indicating that while LAB and yeast inoculum influenced acidity and flavor, their impact on body was minimal. Uniformity maintained a perfect score of 10 across all setups, highlighting that the fermentation processes were well-controlled and resulted in minimal sensory defects across samples, regardless of physicochemical changes. Clean cup, which indicates the absence of off-flavors or defects, remained constant at 10 for all fermentations. This stability implies that the inoculum types did not introduce undesirable flavors, even in treatments with higher acidity.
In contrast, balance and other key sensory characteristics such as fragrance/aroma and flavor showed more variation, particularly in treatment 5. Balance scored 7.75 across most treatments but increased to 8 in treatment 5, suggesting that the LAB and yeast inoculum mixture in this treatment created a more harmonized sensory profile. This improvement aligns with both physicochemical changes—especially higher acidity—and the enhanced aroma and flavor scores, indicating a more cohesive sensory experience. The highest fragrance/aroma score (8.25) was also observed in treatment 5, which had high TA and a notably lower pH. This suggests that volatile organic acids and other by-products may have contributed to enhanced aroma and flavor perception. Lower pH values in fermented products are often linked to more complex profiles, as organic acids and other metabolites contribute to sharper, more distinct tastes and aromas. The strong flavor profile of treatment 5 further supports this, indicating that the mixed inoculum enriched flavor complexity and balance. Acidity also correlated with physicochemical changes; treatment 5 had a high acidity score (7.75), corresponding to the higher TA (62.43%), suggesting that fermentation increased both acid content and perceived acidity, enhancing the sensory experience.
Across all fermentations, certain sensory attributes appeared consistently. Notably, citrus acidity with honey-like qualities was present in each sample. Fragrance and aroma notes featured nutty undertones, such as hazelnut, walnut, and maple syrup. The body of the coffee varied slightly from light and silky to syrupy, yet remained smooth across treatments, suggesting minimal impact of inoculum variations on mouthfeel.
PCA was performed to visually assess the relationships between physicochemical parameters and sensory attributes across the fermentation treatments (Figure 4). The PCA biplot reduces data dimensionality, enabling the identification of key contributors to sensory variation and facilitating the interpretation of correlations between physicochemical variables and sensory characteristics. The first two principal components (PC1 and PC2) accounted for 71.0% and 15.6% of the total variance, respectively, effectively capturing a significant portion of the variability in the data.
The positioning of the treatments in the PCA space reveals distinct profiles. PC1, which aligns with variables such as final titratable acidity (TA(E)), soluble solids (SS(E)), and overall score, is positively associated with higher sensory scores. This trend is particularly evident for treatments 1, 2, 3, 5, and 6, which cluster along PC1, showing strong correlations with sensory attributes such as fragrance/aroma, body, flavor, uniformity, and final score.

4. Discussion

This study focused on optimizing inoculum formulations by utilizing coffee processing by-products, specifically CP and CWW. Due to their large volumes, these by-products present significant environmental challenges for coffee farms. CP constitutes approximately 45% of the fresh coffee cherry, meaning that producing 1 ton of dried coffee beans generates 3.64 tons of fresh CP. Additionally, wet processing methods produce 40–45 L of CWW per kilogram of dried coffee, resulting in around 40,000–45,000 L of CWW for each ton of dried coffee beans [5]. Utilizing these by-products mitigates environmental impact, reduces waste, and creates value-added products, thereby improving the sustainability and efficiency of the coffee production system.

4.1. Impact of Coffee By-Products on LAB and Yeast Growth in Different Inoculum Formulations

The optimization of inoculum formulations demonstrated the critical role of coffee by-products, such as CP and CWW, in enhancing microbial viability. The results confirmed that LAB, by producing organic acids, lowered the pH of fermentation media, creating a favorable environment for inhibiting spoilage microorganisms and enhancing desirable flavor attributes [10,19,31]. For example, the significant pH reduction observed in CP-rich formulations correlates with the higher viability of LAB, aligning with its known role in producing organic acids. Similarly, yeast-driven formulations, particularly those enriched with CWW, showed increased production of aromatic esters and modulated essential substances, including soluble carbohydrates and organic acids, as reflected in the enhanced sensory complexity of treatments involving yeast inoculum [34,35].
The predictive model that optimized inoculum formulations performed well in predicting microbial viability, though minor deviations were observed between theoretical predictions and experimental outcomes. These discrepancies could be attributed to unmodeled environmental factors, such as variations in initial microbial load or slight temperature fluctuations during fermentation. Nevertheless, the model proved robust, optimizing conditions for maximizing LAB and yeast viability.
The composition of coffee by-products significantly influences microbial growth during fermentation. A higher percentage of CP favored LAB viability, while higher concentrations of CWW enhanced yeast growth. Formulations with balanced ratios of CP and CWW, such as CP50CWW50 and CP25CWW75, supported moderate growth rates for LAB and yeast. However, after 36 h, yeast viability declined, which is associated with nutrient depletion as the SS decreased or the accumulation of metabolic by-products [18].
The concentration of SS reflects the availability of fermentable sugars, a critical factor for microbial growth. Yeasts, particularly Saccharomyces cerevisiae and Pichia species, thrive in CWW-rich environments due to their higher sugar content, leading to a more rapid decrease in SS than CP-dominant formulations. The ability of the yeast to quickly consume sugars supports the production of volatile compounds, which contribute to the fruity and floral aromas of the coffee. LAB, however, metabolizes sugars more slowly, particularly complex carbohydrates, resulting in a more gradual decline in SS. This difference in sugar utilization between yeast and LAB reflects their complementary roles in fermentation dynamics.
Changes in pH, SS, and TA during coffee fermentation are closely tied to the metabolic activity of LAB and yeast. The decision not to adjust initial physicochemical parameters, such as pH, SS, or TA, was made to replicate the natural fermentation conditions typically encountered on smallholder coffee farms, where such variations are not controlled. This allowed us to evaluate the performance of LAB and yeast in realistic scenarios, ensuring the findings are directly applicable to practical, field-scale operations. This approach is particularly relevant as smallholder farmers often lack the resources or infrastructure to precisely adjust these parameters during fermentation. The fermentative metabolism of LAB and the respiratory metabolism of yeast, especially under aerobic conditions, lead to distinct patterns in these parameters across different formulations.
Differences in SS between the formulations reflected variations in sugar content, with CWW providing a more abundant carbon source for yeast due to its higher concentration of soluble sugars [6,36]. Changes in pH levels across different formulations correlated with carbohydrate availability. Microbial activity led to the hydrolysis of polysaccharides into monosaccharides, producing organic acids, which caused a decrease in pH [3,6,37], particularly in CWW-rich formulations [37]. After 36 h, pH levels in all formulations begin to rise, signaling reduced microbial activity due to nutrient depletion or the accumulation of inhibitory by-products. This shift indicates a decline in fermentation efficiency as LAB and yeast become less metabolically active.
TA, an indicator of organic acid production, shows a marked increase during the initial stages of fermentation, especially in yeast-inoculated formulations with higher CWW content. The rapid fermentation of sugars by yeast results in the accumulation of organic acids such as succinic and malic acid, contributing to the acidic profile of the coffee [38]. In LAB formulations with higher CP content, TA rises more gradually as LAB ferments complex carbohydrates over a more extended period [26]. This prolonged acidification enhances the sensory complexity, contributing to a well-rounded flavor and aroma.

4.2. Impact of LAB and Yeast Inoculum in Coffee Fermentation and Sensory Profile

Fermentation 1, involving direct LAB inoculation, increased SS instead of the expected decrease. This suggests that microbial activity or enzymatic breakdown of coffee mucilage components may have released more soluble solids into the fermentation leachate, contributing to the higher °Brix values. This result contrasts with typical fermentation patterns, where microorganisms consume sugars. Fermentation 2, which used an optimized LAB inoculum, showed a significant decrease in SS, indicating that this inoculum was more efficient at metabolizing sugars. This sharp reduction is consistent with the production of organic acids and fermentation by-products, which lead to a notable drop in soluble solids. The pre-adaptation of the LAB in the inoculum facilitated an active metabolism of the carbon sources typical of coffee fermentation.
Fermentation 3, using fresh yeast without prior optimization, showed an increase in SS similar to that of direct LAB fermentation, suggesting that the yeast did not efficiently consume sugars and released additional soluble solids from the coffee beans. In fermentation 4, the yeast inoculum resulted in a moderate decrease in SS, indicating active sugar consumption, albeit slower than LAB fermentations. This slower utilization suggests that yeast ferments sugar into alcohol and other compounds more gradually. In fermentation 6 (the control), an unexpected increase in SS was observed due to passive release from the coffee beans in the absence of inoculated microorganisms. This implies that natural processes, such as leaching or slight spontaneous fermentation by native microorganisms, contributed to the accumulation of this soluble solid without a deliberate fermentation process.
The mixed inoculum fermentation (fermentation 5) balanced the two trends, showing a moderate increase in TA and a slight decrease in pH. This suggests that the combination of LAB and yeast resulted in more controlled acid production. The yeast’s metabolic activities tempered LAB acidification, leading to a more balanced flavor profile. The significant SS decrease and the pH and TA increase in treatments with combined inoculations indicated an ecological interaction between these microbial groups. The interaction between LAB and yeasts also involves yeast autolysis, which releases essential nutrients such as amino acids and polysaccharides that support LAB growth. At the same time, LAB acidification creates an environment conducive to yeast fermentation [23,26]. The control fermentation (fermentation 6), which lacked microbial inoculation, exhibited minimal changes in pH and TA, reflecting limited natural fermentation activity. Despite the lack of deliberate inoculation, fermentation 6 demonstrated a significant increase in TA due to natural spontaneous fermentation by indigenous microorganisms. The elevated TA alongside relatively stable pH indicates that acid production occurred, potentially driven by native lactic acid bacteria or yeast in the environment.
LAB are known for enhancing acidity and flavor complexity in fermented foods, including coffee by-products [39,40]. In our study, the behavior of LAB microbial growth related to pH reduction and increased TA, particularly when CP was used as a carbon source, is similar to the findings of de Melo Pereira et al. (2015), where LAB fermentation also resulted in similar pH shifts [40]. Additionally, the fermentation process led to considerable sugar consumption, further supporting the active metabolism of LAB during the fermentation of CP as a carbon source, which increased bacterial biomass. LAB species such as Leuconostoc and Lactococcus produce volatile compounds such as diacetyl and acetoin, which enhance flavor [21]. This aligns with previous work highlighting LAB’s role in producing aroma-enhancing metabolites [41], which likely contributed to the sensory improvements observed in our study. Although the metabolomic analysis of the resulting coffee was not within the scope of this research, the relationship between specific metabolites produced by LAB and the modulation of sensory profiles during coffee fermentation is consistent with our results and other studies [21,39,41,42,43].
Yeasts, particularly Saccharomyces cerevisiae and Pichia species, also play a critical role in the fermentation process by altering the carbohydrates, organic acid, and volatile compound content of the coffee beans. They produce vital flavor-active compounds, such as 2,3-butanedione (buttery flavor), acetaldehyde (fruity flavor), and hexanal (green bean flavor) [24,44]. Furthermore, S. cerevisiae contributes terpenes and esters derived from amino acids, adding sweet, caramel, fruity, and floral characteristics to the final coffee product [35,45]. Recent studies on mixed-culture fermentations involving LAB and yeasts have demonstrated improved fermentation efficiency and enhanced volatile compound production [23]. The combination of Pichia fermentans and Pediococcus acidilactici, for instance, significantly increased lactic acid and ethanol production in ripe coffee beans, highlighting the complementary roles of these microorganisms. Yeast activity, particularly in sugar consumption, was more efficient with P. fermentans, especially in fructose utilization, compared to LAB-only fermentations [23]. These observations are consistent with findings from other fermentations, where LAB acidification and yeast activity jointly modulate sensory outcomes. This ecological interaction leads to improved sensory attributes, such as increased concentrations of ethanol (alcoholic notes), isoamyl alcohol (banana and pear notes), and ethyl acetate (fruity notes), which were observed in spontaneous coffee fermentations [26,46]. The balance of these microbial activities contributes to the overall complexity and richness of the coffee’s flavor profile.
The sensory profile variations across different fermentation setups appear to be directly influenced by physicochemical changes occurring during fermentation. Specifically, increased acidity and decreased pH in treatments, such as treatment 5. These findings support research showing that fermentation, especially with mixed LAB and yeast inoculum, significantly alters the sensory profile of coffee by producing organic acids and metabolites that enrich flavor complexity and aroma intensity [23,39,47]. Attributes such as body, aftertaste, and clean cup were consistently maintained across treatments, indicating that variations in fermentation conditions remained controlled and did not introduce negative sensory defects. Treatment 5’s high TA and balanced acidity, paired with optimal aroma scores, underscore how mixed inoculum fermentation can enhance sensory outcomes by promoting beneficial by-products without compromising consistency [48,49].
Tailoring coffee flavor profiles through controlled fermentation offers substantial socio-economic and environmental benefits. By leveraging microbial activity, smallholder producers can create stable cup profiles that meet commercial quality standards while appealing to diverse consumer preferences. This adaptability supports long-term market viability and provides a competitive advantage by enabling product differentiation. Furthermore, this research integrates microbiology, food science, and socio-economic considerations [50], contributing to a sustainable coffee production model that balances economic growth, environmental stewardship, and social resilience.
In addition to socio-economic gains, controlled fermentation promotes resource efficiency by utilizing local by-products such as CP and CWW. These practices reduce waste and align with sustainable agricultural methods, allowing producers to enhance coffee quality without compromising environmental responsibility. By refining fermentation techniques, small-scale farmers can produce high-quality coffee tailored to market demands while supporting environmental preservation and economic sustainability. This integration of innovation and resourcefulness underscores the potential of microbial fermentation as a transformative tool in coffee processing [51,52].
Although the overall final scores across treatments did not change significantly, this consistency is a positive outcome, as it indicates that quality remains uncompromised even as sensory profiles are modulated. The positive influence of LAB and yeast inoculum on both physicochemical and sensory attributes is further evident in treatments 4 and 5, which exhibited favorable parameters and scored highest in sensory qualities. These results align with previous studies indicating that optimal fermentation conditions, particularly through the synergistic effects of LAB and yeast, enhance desirable flavor and aroma compounds [48].
Additionally, PCA results illustrate relationships between physicochemical and sensory characteristics, showing how microbial activity shapes overall coffee quality [48,49,53,54]. Variables such as initial titratable acidity (TA(I)) and final pH (pH(E)) are more closely aligned with sensory attributes related to acidity, indicating their influence on this specific sensory dimension. Treatments positioned in the lower-right quadrant of the biplot (e.g., treatments 1, 2, and 6) exhibit higher overall sensory scores, suggesting a significant influence of the final-stage physicochemical parameters (SS(E) and TA(E)) on sensory outcomes. Interestingly, the contribution of PC2, while smaller, highlights variability not fully explained by the evaluated physicochemical parameters. This suggests that achieving higher final scores and enhanced sensory attributes (e.g., fragrance/aroma) may also depend on other variables not assessed in this study. For instance, treatments applying inoculum developed with yeast or mixtures of LAB and yeast show strong associations with improved sensory profiles, emphasizing the potential of these inoculums in enhancing coffee quality.
These findings raise questions about additional physicochemical or biochemical factors influencing sensory attributes, underscoring the need for further research to explore other contributors to coffee quality beyond the parameters evaluated in this study. Carefully controlled fermentation using LAB and yeast thus emerges as a promising method to achieve specific sensory qualities, providing a foundation for future studies aimed at optimizing fermentation to improve product development.

5. Conclusions

The optimized inoculum formulations enable the repurposing of coffee by-products, such as coffee pulp (CP) and coffee wastewater (CWW), reducing waste while promoting microbial production. By adjusting these formulations, microbial viability and sensory enhancement were balanced—CWW concentrations boosted yeast growth, while CP concentrations supported LAB viability. These findings support large-scale applications in coffee processing facilities, reinforcing sustainability, and delivering both environmental and economic benefits. The optimized formulations balance the growth and viability of LAB and yeast, offering a scalable solution that enhances process control while maintaining the desired sensory quality of the final product. This research highlights the potential of optimized microbial inoculums to enhance sensory attributes and promote sustainable coffee fermentation practices, offering a scalable solution for smallholder farmers.

Supplementary Materials

The following supporting information can be downloaded at: https://www.mdpi.com/article/10.3390/su17051781/s1.

Author Contributions

Conceptualization, L.-S.T.-V., M.-I.S.-T., and J.-L.P.-D.; methodology, L.-F.D.-B. and K.-D.C.-G.; validation, L.-F.D.-B. and K.-D.C.-G.; formal analysis, L.-F.D.-B., K.-D.C.-G., and J.-L.P.-D.; investigation, L.-F.D.-B. and K.-D.C.-G.; resources, L.-S.T.-V. and J.-L.P.-D.; writing—original draft preparation, L.-F.D.-B. and K.-D.C.-G.; writing—review and editing, L.-S.T.-V. and J.-L.P.-D.; visualization, L.-F.D.-B. and K.-D.C.-G.; supervision, L.-S.T.-V. and J.-L.P.-D.; project administration, L.-F.D.-B.; funding acquisition, L.-S.T.-V., M.-I.S.-T., and J.-L.P.-D. All authors have read and agreed to the published version of the manuscript.

Funding

This research was supported by the Ministerio de Ciencia, Tecnología e Innovación through the Fondo Nacional de Financiamiento para la Ciencia, la Tecnología y la Innovación, Fondo Francisco José de Caldas, and the Programa Orquídeas, Mujeres en la Ciencia: Agentes para la Paz (935-2023) under funding contract 286-2023.

Institutional Review Board Statement

Not applicable.

Informed Consent Statement

Not applicable.

Data Availability Statement

The original contributions presented in the study are included in the article/Supplementary Materials; further inquiries can be directed to the corresponding author.

Conflicts of Interest

The authors declare no conflicts of interest.

References

  1. Espíndola Rafael, V. A Business Case to Increase Specialty Coffee Consumption in Producing Countries; Specialty Coffee Association: Santa Ana, CA, USA, 2020. [Google Scholar]
  2. de Melo Pereira, G.V.; de Carvalho Neto, D.P.; Magalhães Júnior, A.I.; Vásquez, Z.S.; Medeiros, A.B.P.; Vandenberghe, L.P.S.; Soccol, C.R. Exploring the Impacts of Postharvest Processing on the Aroma Formation of Coffee Beans—A Review. Food Chem. 2019, 272, 441–452. [Google Scholar] [CrossRef] [PubMed]
  3. Aswathi, K.N.; Shirke, A.; Praveen, A.; Chaudhari, S.R.; Murthy, P.S. Pulped Natural/Honey Robusta Coffee Fermentation Metabolites, Physico-Chemical and Sensory Profiles. Food Chem. 2023, 429, 136897. [Google Scholar] [CrossRef] [PubMed]
  4. Ibarra-Taquez, H.N.; GilPavas, E.; Blatchley, E.R.; Gómez-García, M.Á.; Dobrosz-Gómez, I. Integrated Electrocoagulation-Electrooxidation Process for the Treatment of Soluble Coffee Effluent: Optimization of COD Degradation and Operation Time Analysis. J. Environ. Manag. 2017, 200, 530–538. [Google Scholar] [CrossRef] [PubMed]
  5. Serna-Jiménez, J.A.; Siles, J.A.; de los Ángeles Martín, M.; Chica, A.F. A Review on the Applications of Coffee Waste Derived from Primary Processing: Strategies for Revalorization. Processes 2022, 10, 2436. [Google Scholar] [CrossRef]
  6. Zhao, N.; Kokawa, M.; Amini, R.K.; Dong, W.; Kitamura, Y. Isolation of Yeast and LAB from Dry Coffee Pulp and Monitoring of Organic Acids in Inoculated Green Beans. Foods 2023, 12, 2622. [Google Scholar] [CrossRef]
  7. Haile, M.; Kang, W.H. Antioxidant Activity, Total Polyphenol, Flavonoid and Tannin Contents of Fermented Green Coffee Beans with Selected Yeasts. Fermentation 2019, 5, 29. [Google Scholar] [CrossRef]
  8. Sofía Torres-Valenzuela, L.; Andrea Serna-Jiménez, J.; Martínez, K. Coffee By-Products: Nowadays and Perspectives. In Coffee-Production and Research; IntechOpen: London, UK, 2020. [Google Scholar]
  9. Evangelista, S.R.; da Cruz Pedroso Miguel, M.G.; Silva, C.F.; Pinheiro, A.C.M.; Schwan, R.F. Microbiological Diversity Associated with the Spontaneous Wet Method of Coffee Fermentation. Int. J. Food Microbiol. 2015, 210, 102–112. [Google Scholar] [CrossRef]
  10. Cruz-O’Byrne, R.; Piraneque-Gambasica, N.; Aguirre-Forero, S. Microbial Diversity Associated with Spontaneous Coffee Bean Fermentation Process and Specialty Coffee Production in Northern Colombia. Int. J. Food Microbiol. 2021, 354, 109282. [Google Scholar] [CrossRef]
  11. Zhang, S.J.; Page-Zoerkler, N.; Genevaz, A.; Roubaty, C.; Pollien, P.; Bordeaux, M.; Mestdagh, F.; Moccand, C. Unlocking the Aromatic Potential of Native Coffee Yeasts: From Isolation to a Biovolatile Platform. J. Agric. Food Chem. 2023, 71, 4665–4674. [Google Scholar] [CrossRef]
  12. Polanía-Rivera, A.M.; López-Silva, J.; Torres-Valenzuela, L.S.; Plaza-Dorado, J.L. Development of Starter Inoculum for Controlled Arabica Coffee Fermentation Using Coffee By-Products (Pulp and Mucilage Broth), Yeast, and Lactic Acid Bacteria. Fermentation 2024, 10, 516. [Google Scholar] [CrossRef]
  13. Martins, P.M.M.; Ribeiro, L.S.; da Cruz Pedroso Miguel, M.G.; Evangelista, S.R.; Schwan, R.F. Production of Coffee (Coffea Arabica) Inoculated with Yeasts: Impact on Quality. J. Sci. Food Agric. 2019, 99, 5638–5645. [Google Scholar] [CrossRef] [PubMed]
  14. Evangelista, S.R.; da Cruz Pedrozo Miguel, M.G.; de Souza Cordeiro, C.; Silva, C.F.; Marques Pinheiro, A.C.; Schwan, R.F. Inoculation of Starter Cultures in a Semi-Dry Coffee (Coffea Arabica) Fermentation Process. Food Microbiol. 2014, 44, 87–95. [Google Scholar] [CrossRef] [PubMed]
  15. Ulhano Braga, A.V.; Miranda, M.A.; Aoyama, H.; Schmidt, F.L. Study on Coffee Quality Improvement by Self-Induced Anaerobic Fermentation: Microbial Diversity and Enzymatic Activity. Food Res. Int. 2023, 165, 112528. [Google Scholar] [CrossRef] [PubMed]
  16. Wang, C.; Sun, J.; Lassabliere, B.; Yu, B.; Liu, S.Q. Coffee Flavour Modification through Controlled Fermentation of Green Coffee Beans by Lactococcus Lactis Subsp. Cremoris. LWT 2020, 120, 108930. [Google Scholar] [CrossRef]
  17. Chan, M.Z.A.; Lu, Y.; Liu, S.Q. In Vitro Bioactivities of Coffee Brews Fermented with the Probiotics Lacticaseibacillus Rhamnosus GG and Saccharomyces Boulardii CNCM-I745. Food Res. Int. 2021, 149, 110693. [Google Scholar] [CrossRef]
  18. Chan, M.Z.A.; Toh, M.; Liu, S.Q. Growth, Survival, and Metabolic Activities of Probiotics Lactobacillus Rhamnosus GG and Saccharomyces Cerevisiae Var. Boulardii CNCM-I745 in Fermented Coffee Brews. Int. J. Food Microbiol. 2021, 350, 109229. [Google Scholar] [CrossRef]
  19. Chan, M.Z.A.; Toh, M.; Liu, S.Q. Growth, Survival, and Metabolic Activities of Probiotic Lactobacillus spp. in Fermented Coffee Brews Supplemented with Glucose and Inactivated Yeast Derivatives. Food Res. Int. 2020, 137, 109746. [Google Scholar] [CrossRef]
  20. Zhang, S.J.; De Bruyn, F.; Pothakos, V.; Contreras, G.F.; Cai, Z.; Moccand, C.; Weckx, S.; De Vuyst, L. Influence of Various Processing Parameters on the Microbial Community Dynamics, Metabolomic Profiles, and Cup Quality During Wet Coffee Processing. Front. Microbiol. 2019, 10, 2621. [Google Scholar] [CrossRef]
  21. de Melo Pereira, G.V.; da Silva Vale, A.; de Carvalho Neto, D.P.; Muynarsk, E.S.; Soccol, V.T.; Soccol, C.R. Lactic Acid Bacteria: What Coffee Industry Should Know? Curr. Opin. Food Sci. 2020, 31, 1–8. [Google Scholar] [CrossRef]
  22. de Melo Pereira, G.V.; de Carvalho Neto, D.P.; Medeiros, A.B.P.; Soccol, V.T.; Neto, E.; Woiciechowski, A.L.; Soccol, C.R. Potential of Lactic Acid Bacteria to Improve the Fermentation and Quality of Coffee during On-Farm Processing. Int. J. Food Sci. Technol. 2016, 51, 1689–1695. [Google Scholar] [CrossRef]
  23. da Silva Vale, A.; de Melo Pereira, G.V.; de Carvalho Neto, D.P.; Rodrigues, C.; Pagnoncelli, M.G.B.; Soccol, C.R. Effect of Co-Inoculation with Pichia Fermentans and Pediococcus Acidilactici on Metabolite Produced during Fermentation and Volatile Composition of Coffee Beans. Fermentation 2019, 5, 67. [Google Scholar] [CrossRef]
  24. Bressani, A.P.P.; Martinez, S.J.; Evangelista, S.R.; Dias, D.R.; Schwan, R.F. Characteristics of Fermented Coffee Inoculated with Yeast Starter Cultures Using Different Inoculation Methods. LWT 2018, 92, 212–219. [Google Scholar] [CrossRef]
  25. Wang, C.; Sun, J.; Lassabliere, B.; Yu, B.; Liu, S.Q. Coffee Flavour Modification through Controlled Fermentation of Green Coffee Beans by Saccharomyces Cerevisiae and Pichia Kluyveri: Part II. Mixed Cultures with or without Lactic Acid Bacteria. Food Res. Int. 2020, 136, 109452. [Google Scholar] [CrossRef] [PubMed]
  26. Vinícius de Melo Pereira, G.; Soccol, V.T.; Brar, S.K.; Neto, E.; Soccol, C.R. Microbial Ecology and Starter Culture Technology in Coffee Processing. Crit. Rev. Food Sci. Nutr. 2017, 57, 2775–2788. [Google Scholar] [CrossRef] [PubMed]
  27. Mahingsapun, R.; Tantayotai, P.; Panyachanakul, T.; Samosorn, S.; Dolsophon, K.; Jiamjariyatam, R.; Lorliam, W.; Srisuk, N.; Krajangsang, S. Enhancement of Arabica Coffee Quality with Selected Potential Microbial Starter Culture under Controlled Fermentation in Wet Process. Food Biosci. 2022, 48, 101819. [Google Scholar] [CrossRef]
  28. Samoggia, A.; Fantini, A. Revealing the Governance Dynamics of the Coffee Chain in Colombia: A State-of-the-Art Review. Sustainability 2023, 15, 13646. [Google Scholar] [CrossRef]
  29. Wienhold, K.; Goulao, L.F. The Embedded Agroecology of Coffee Agroforestry: A Contextualized Review of Smallholder Farmers’ Adoption and Resistance. Sustainability 2023, 15, 6827. [Google Scholar] [CrossRef]
  30. AOAC. Official Methods of Analysis of AOAC INTERNATIONAL; AOAC International: Rockville, MD, USA, 2023. [Google Scholar]
  31. Mazzafera, P. Chemical Composition of Defective Coffee Beans. Food Chem. 1999, 64, 547–554. [Google Scholar] [CrossRef]
  32. SCA. Speciality Coffee Asociation Protocols & Best Practices; Specialty Coffee Association: Santa Ana, CA, USA, 2024. [Google Scholar]
  33. Plaza-Dorado, J.L.; Suárez-Rodríguez, C.; Torres-Valenzuela, L.S. Tuneable Solvents-Based Extraction for the Recovery of Caffeine from Coffee Wastewater. Environ. Prog. Sustain. Energy 2024, 43, e14291. [Google Scholar] [CrossRef]
  34. Evangelista, S.R.; Silva, C.F.; da Cruz Miguel, M.G.P.; de Souza Cordeiro, C.; Pinheiro, A.C.M.; Duarte, W.F.; Schwan, R.F. Improvement of Coffee Beverage Quality by Using Selected Yeasts Strains during the Fermentation in Dry Process. Food Res. Int. 2014, 61, 183–195. [Google Scholar] [CrossRef]
  35. Ruta, L.L.; Farcasanu, I.C. Coffee and Yeasts: From Flavor to Biotechnology. Fermentation 2021, 7, 9. [Google Scholar] [CrossRef]
  36. Osorio, V.; Medina, R.; Acuña, J.R.; Pabón, J.; Álvarez, C.I.; Matallana, L.G.; Fernández-Alduenda, M.R. Transformation of Organic Acids and Sugars in the Mucilage and Coffee Beans during Prolonged Fermentation. J. Food Compos. Anal. 2023, 123, 105551. [Google Scholar] [CrossRef]
  37. Elhalis, H.; Cox, J.; Zhao, J. Ecological Diversity, Evolution and Metabolism of Microbial Communities in the Wet Fermentation of Australian Coffee Beans. Int. J. Food Microbiol. 2020, 321, 108544. [Google Scholar] [CrossRef] [PubMed]
  38. Inés, G.; Mejia, J.; Osorio, G. Microbiología De La Fermentación Del Mucílago De Café Según Su Madurez Y Selección. Cenicafé 2012, 63, 58–78. [Google Scholar]
  39. Cassimiro, D.M.d.J.; Batista, N.N.; Fonseca, H.C.; Oliveira Naves, J.A.; Coelho, J.M.; Bernardes, P.C.; Dias, D.R.; Schwan, R.F. Wet Fermentation of Coffea Canephora by Lactic Acid Bacteria and Yeasts Using the Self-Induced Anaerobic Fermentation (SIAF) Method Enhances the Coffee Quality. Food Microbiol. 2023, 110, 104161. [Google Scholar] [CrossRef]
  40. Vinícius de Melo Pereira, G.; Neto, E.; Soccol, V.T.; Medeiros, A.B.P.; Woiciechowski, A.L.; Soccol, C.R. Conducting Starter Culture-Controlled Fermentations of Coffee Beans during on-Farm Wet Processing: Growth, Metabolic Analyses and Sensorial Effects. Food Res. Int. 2015, 75, 348–356. [Google Scholar] [CrossRef]
  41. Smit, B.A.; Vlieg, J.E.T.v.H.; Engels, W.J.M.; Meijer, L.; Wouters, J.T.M.; Smit, G. Identification, Cloning, and Characterization of a Lactococcus Lactis Branched-Chain α-Keto Acid Decarboxylase Involved in Flavor Formation. Appl. Environ. Microbiol. 2005, 71, 303–311. [Google Scholar] [CrossRef]
  42. Wang, C.; Sun, J.; Lassabliere, B.; Yu, B.; Zhao, F.F.; Zhao, F.F.; Chen, Y.; Liu, S.Q. Potential of Lactic Acid Bacteria to Modulate Coffee Volatiles and Effect of Glucose Supplementation: Fermentation of Green Coffee Beans and Impact of Coffee Roasting. J. Sci. Food Agric. 2019, 99, 409–420. [Google Scholar] [CrossRef]
  43. Martinez, S.J.; Bressani, A.P.P.; Dias, D.R.; Simão, J.B.P.; Schwan, R.F. Effect of Bacterial and Yeast Starters on the Formation of Volatile and Organic Acid Compounds in Coffee Beans and Selection of Flavors Markers Precursors during Wet Fermentation. Front. Microbiol. 2019, 10, 1287. [Google Scholar] [CrossRef]
  44. Sampaio, V.d.M.; Wiele, N.; Vale, A.d.S.; Woiciechowski, A.L.; Karp, S.G.; Soccol, C.R.; Pereira, G.V.d.M. Modulation of Aroma and Chemical Composition of Coffee Beans through Simultaneous and Sequential Inoculation of Pichia fermentans and Pediococcus pentosaceus during Wet Fermentation. Syst. Microbiol. Biomanuf. 2024. [Google Scholar] [CrossRef]
  45. Moreira, R.F.A.; Trugo, L.C.; De Maria, C.A.B. Componentes Voláteis Do Café Torrado. Parte II. Compostos Alifáticos, Alicíclicos e Aromáticos. Quim. Nova 2000, 23, 195–203. [Google Scholar] [CrossRef]
  46. Elhalis, H.; Cox, J.; Frank, D.; Zhao, J. The Crucial Role of Yeasts in the Wet Fermentation of Coffee Beans and Quality. Int. J. Food Microbiol. 2020, 333, 108796. [Google Scholar] [CrossRef] [PubMed]
  47. Bravim, D.G.; de Oliveira, T.M.; Rosário, D.K.A.D.; Batista, N.N.; Schwan, R.F.; Coelho, J.M.; Bernardes, P.C. Inoculation of Yeast and Bacterium in Wet-Processed Coffea Canephora. Food Chem. 2023, 400, 134107. [Google Scholar] [CrossRef] [PubMed]
  48. Galarza, G.; Figueroa, J.G. Volatile Compound Characterization of Coffee (Coffea Arabica) Processed at Different Fermentation Times Using SPME–GC–MS. Molecules 2022, 27, 2004. [Google Scholar] [CrossRef]
  49. Jimenez, E.J.M.; Martins, P.M.M.; de Oliveira Vilela, A.L.; Batista, N.N.; da Rosa, S.D.V.F.; Dias, D.R.; Schwan, R.F. Influence of Anaerobic Fermentation and Yeast Inoculation on the Viability, Chemical Composition, and Quality of Coffee. Food Biosci. 2023, 51, 102218. [Google Scholar] [CrossRef]
  50. Lyon, S.W. A Cross-Disciplinary Approach Needs to Be at the Core of Sustainability. Sustainability 2023, 15, 15954. [Google Scholar] [CrossRef]
  51. Calderon, N.; Jiang, G.Z.; Gibney, P.A.; Dando, R. A Consumer Assessment of Fermented Green Coffee Beans with Common Beer/Wine Yeast Strains for Novel Flavor Properties. Fermentation 2023, 9, 865. [Google Scholar] [CrossRef]
  52. Kwak, H.S.; Jeong, Y.; Kim, M. Effect of Yeast Fermentation of Green Coffee Beans on Antioxidant Activity and Consumer Acceptability. J. Food Qual. 2018, 2018, 5967130. [Google Scholar] [CrossRef]
  53. Rosário, D.K.A.D.; da Silva Mutz, Y.; Vieira, K.M.; Schwan, R.F.; Bernardes, P.C. Effect of Self-Induced Anaerobiosis Fermentation (SIAF) in the Volatile Compounds and Sensory Quality of Coffee. Eur. Food Res. Technol. 2024, 250, 667–675. [Google Scholar] [CrossRef]
  54. Martins, P.M.M.; Batista, N.N.; Naves, J.A.O.; Dias, D.R.; Schwan, R.F. Use of Microencapsulated Starter Cultures by Spray Drying in Coffee under Self-Induced Anaerobiosis Fermentation (SIAF). Food Res. Int. 2023, 172, 113189. [Google Scholar] [CrossRef] [PubMed]
Figure 1. Research roadmap.
Sustainability 17 01781 g001
Figure 2. Lactic acid bacteria (a) and yeast (b) growth in different formulations of inoculum. Labels represent the percentage of each component in the total inoculum: CP (coffee pulp) and CWW (coffee wastewater). Data are reported as mean ± SD from measurement replicates, with experimental replicates based on the DOE.
Sustainability 17 01781 g002
Figure 3. Fermentative parameters of lactic acid bacteria (a1a3) and yeast (b1b3) in different inoculum formulations: total soluble solids (SST) (1), pH (2), and titratable acidity (TA) (3). Labels represent the percentage of each component in the total inoculum: CP (coffee pulp) and CWW (coffee wastewater). Data are reported as mean ± SD from measurement replicates, with experimental replicates based on the DOE.
Sustainability 17 01781 g003
Figure 4. Biplot of the principal component analysis (PCA) of physicochemical and sensory attributes across the different coffee samples. A total of 86.6% of the variance was described by the two principal components (PC). Dots correspond to individual replicates of 1. Direct LAB inoculation sourced from commercial yogurt without prior optimization. 2. Optimized LAB inoculum prepared based on optimized growth conditions. 3. Fresh yeast inoculation without prior optimization. 4. Optimized yeast inoculum prepared based on optimized growth conditions. 5. Mixture of optimized LAB and yeast inoculum. 6. Control treatment without any microbial inoculation.
Sustainability 17 01781 g004
Table 1. Component and factor levels used in the mixture design of the experiment.
RunComponents (%)Process Variable Time (h)Response Variable
CPCWWLABYeast
125753612Relative Microbial Growth (RG)
225754836
350503612
450504836
575254836
650503612
710004836
850504836
950504836
1050503612
1101004836
1201003612
1375253612
1410003612
1550504836
1650503612
1750504836
1850503612
Table 2. Experimental results of the maximum increment in microbial viability of lactic acid bacteria (LAB) and yeast across different inoculum formulations, along with the model quality results for both microorganisms.
Exp.
Number
(n)
ComponentsResponse Variable
Relative Growth (RG)
Process VariableLABProcess VariableYeast
X1X2X3X3
CP
(%)
CWW
(%)
Time
(h)
ObservedLinear ModelQuadratic ModelTime
(h)
ObservedLinear ModelQuadratic Model
125753634.3324.2324.68125.325.465.50
225754844.3042.2242.333611.5210.1910.12
350503634.0630.6535.16126.885.896.31
450504851.1246.1347.15369.188.497.80
575254845.8750.0350.14366.876.806.73
650503628.4030.6535.16126.385.896.31
710004853.1453.9451.29367.035.106.91
850504838.0646.1347.15367.178.497.80
950504842.7146.1347.15368.308.497.80
1050503635.3830.6535.16126.975.896.31
1101004834.4038.3235.673613.1911.8913.70
120100361.9217.806.06123.855.033.93
1375253633.3437.0737.52125.166.326.36
1410003634.5343.4931.76126.076.745.64
1550504853.0946.1347.15366.448.497.80
1650503637.8030.6535.16126.715.896.31
1750504852.4846.1347.15366.758.497.80
1850503636.0730.6535.16126.055.896.31
R2 0.67360.8364 0.73210.8797
Adj-R2 0.60360.7682 0.67470.8295
RMSE 6.65164.7093 1.13110.7598
R2: Coefficient of determination; Adj-R2: adjusted R2 to measure the variance between model predictions and experimental data; RMSE: root mean square error.
Table 3. Validation model for LAB and yeast inoculum.
ParameterExperimental ValuePredicted ValueRE (%)
RGlab45.98 ± 4.3051.310.35
RGyeast12.14 ± 1.1613.7011.33
RE: relative error.
Table 4. Experimental results of lactic acid bacteria (LAB) fermentation parameters and yeast-inoculated coffee.
FermentationSS (°Brix)pHTA (%)
InitialEndInitialEndInitialEnd
15.35.95.043.8413.2165.76
25.13.14.883.7812.3154.95
32.33.34.584.7731.8333.03
44.33.14.484.2020.7233.03
54.43.04.613.9016.8146.24
65.06.15.383.867.5162.43
SS: soluble solids; TA: titratable acidity. 1. Direct LAB inoculation sourced from commercial yogurt without prior optimization. 2. Optimized LAB inoculum prepared based on optimized growth conditions. 3. Fresh yeast inoculation without prior optimization. 4. Optimized yeast inoculum prepared based on optimized growth conditions. 5. Mixture of optimized LAB and yeast inoculum. 6. Control treatment without any microbial inoculation.
Table 5. Sensory profile of lactic acid bacteria (LAB) fermentation parameters and yeast-inoculated coffee.
Fermentation
123456
CharacteristicScore
Fragrance/aroma 7.75887.758.258
Flavor8887.7588
Aftertaste7.757.757.757.757.757.75
Acidity7.757.757.7587.757.75
Body7.757.757.757.57.757.75
Uniformity101010101010
Sweetness101010101010
Clean cup101010101010
Balance7.757.757.757.57.757.75
Overall7.75887.7588
Final score84.585858485.2585
Sensory notesFragrance of tangerine with walnut, aroma of almond and grapefruit, flavor of tangerine, hazelnut, and molasses, lingering honey-like aftertaste of sugarcane and walnut, creamy body, citrus honey-like acidity.Fragrance of vanilla and maple syrup, aroma of red apple with honey, flavor of vanilla, butter, and orange, molasses aftertaste with tangerine, silky body, tangerine citrus acidity.Fragrance of honey with hazelnut, aroma of orange and maple syrup, creamy flavor of grapefruit, tangerine, and butter, honey aftertaste with vanilla, creamy body, citrus honey-like acidity.Fragrance of molasses and hazelnut, aroma of maple syrup with molasses, flavor of coriander seed, celery, and molasses, herbal and molasses aftertaste, citrus honey-like acidity, light and silky body.Fragrance of delicate mango with toasted hazelnut, aroma of orange with honey, delicate flavor of vanilla, molasses, and tropical fruits, caramel aftertaste with a subtle hint of honey, silky body, bright citrus acidity.Fragrance of honey and molasses, aroma of maple syrup with anise, flavor of lime, tangerine, and maple syrup, honey-like aftertaste, syrupy body, juicy citrus acidity.
1. Direct LAB inoculation sourced from commercial yogurt without prior optimization. 2. Optimized LAB inoculum prepared based on optimized growth conditions. 3. Fresh yeast inoculation without prior optimization. 4. Optimized yeast inoculum prepared based on optimized growth conditions. 5. Mixture of optimized LAB and yeast inoculum. 6. Control treatment without any microbial inoculation.
Disclaimer/Publisher’s Note: The statements, opinions and data contained in all publications are solely those of the individual author(s) and contributor(s) and not of MDPI and/or the editor(s). MDPI and/or the editor(s) disclaim responsibility for any injury to people or property resulting from any ideas, methods, instructions or products referred to in the content.

