Article

A Novel Hybrid Deep Learning for Attitude Prediction in Sustainable Application of Shield Machine

1
Department of Engineering Management, Suzhou University of Technology, Suzhou 215500, China
2
Institute of Intelligent Manufacturing and Smart Transportation, Suzhou City University, Suzhou 215104, China
3
School of Rail Transportation, Soochow University, Suzhou 215000, China
*
Authors to whom correspondence should be addressed.
Sustainability 2025, 17(23), 10604; https://doi.org/10.3390/su172310604
Submission received: 24 October 2025 / Revised: 24 November 2025 / Accepted: 25 November 2025 / Published: 26 November 2025
(This article belongs to the Section Sustainable Engineering and Science)

Abstract

Accurate prediction of the shield attitude is critical for controlling the excavation direction, ensuring construction safety, and advancing the sustainability of shield tunneling by reducing energy and environmental disturbance. Traditional prediction methods for the shield attitude have a certain lag and low prediction accuracy, and existing machine learning methods lack research on the varying importance of different parameters affecting the shield attitude, while also ignoring the global information characteristics of the data. To accurately predict the shield attitude and support sustainability-oriented operations, this study proposes a novel prediction model based on a project in Shenyang, China. The model utilizes a channel domain attention mechanism to learn the importance of various influencing parameters and extracts spatial features via a convolutional neural network. Additionally, it captures long-range dependency and local temporal features using a transformer augmented with a bidirectional long short-term memory network. Experimental results show that the proposed model achieves lower MAE and RMSE and higher R2 compared with baseline and sub-models. Its generalization and reliability are further validated using data from another shield tunnel section. From a sustainability perspective, timely and high-fidelity predictions enable proactive steering that reduces unnecessary corrective actions and extreme operating states (e.g., thrust/torque spikes), which are associated with higher energy use, accelerated consumable wear, over-grouting, and potential surface disturbance. Finally, integrating the model’s predictions with onsite adjustment measures effectively mitigates alignment deviations, contributing to more energy-efficient, resource-conscious, and low-disturbance trajectory control.

1. Introduction

1.1. Research Background

As an important piece of underground engineering equipment, the shield machine is widely used in urban subway construction, tunnelling, and energy pipeline construction [1,2]. Its high efficiency, safety, and environmental friendliness make it the preferred choice for underground construction [3]. The stability and accuracy of the shield machine’s attitude during construction directly affect the project’s quality, safety, and progress, especially when facing complex geological conditions, where accurately predicting and controlling the shield machine’s attitude becomes particularly crucial [4,5]. The shield attitude includes some parameters, such as position, orientation, and inclination. Precise control of these parameters is crucial for ensuring the straightness of the tunnel, preventing deviation from the designed axis, and minimizing the impact on the surrounding environment. In addition to safety and quality, attitude control has clear implications for sustainability. Deviations in attitude increase the likelihood of corrective actions and extreme operating states (e.g., rapid thrust or torque changes), which are typically associated with increased energy consumption, higher rates of tool and component wear, and potential surface disturbance [6]. Therefore, the precise attitude prediction in the sustainable application of shield machines is crucial for tunnelling technology and a key factor in the success of underground engineering projects.
Initially, engineers installed measurement sensors (such as inclinometers, GPS, etc.) to monitor the shield machine’s attitude in practical construction. If deviations in the shield machine’s attitude were detected, they would promptly make adjustments. This method is straightforward to implement, but sensors can be vulnerable to damage in complex underground environments. Additionally, engineers need to monitor the data constantly, which can lead to delayed reactions and adjustment times if not completed promptly. Later, some scholars developed theoretical models [7,8], numerical models [9], and laboratory tests [10] to analyze the shield machine’s attitude changes and influencing factors under different working conditions. This approach allows for predicting the shield attitude, thereby improving the accuracy and reliability of the construction process. Yang et al. [11] created a dynamic model to fulfill the requirements of shield tunnelling. Xie et al. [12] developed a kinematic model for the thrust system to enable automatic control of the thrust trajectory. Liu et al. [13] developed a dynamic control model to predict the position of the tunnel boring machine in advance. Wang et al. [14] developed a mathematical model for controlling the pose of a shield tunnelling machine in complex geological conditions. Zhong et al. [9] used the Midas finite element software to create a finite element model for the shield attitude. They investigated the effects of shield tail leakage-induced bottom excavation and face collapse-induced top void on the shield attitude.
These methods typically model the shield construction based on its geometric parameters, mechanical properties, and geological conditions, using on-site measurement data to calibrate the models, thereby achieving some achievements. However, these methods have some limitations, such as: (1) the shield machine construction involves a variety of complex mechanical and geological factors, and it is challenging to thoroughly consider the interactions among these factors in both theoretical and numerical models., leading to low prediction accuracy; (2) geological conditions and construction parameters change continuously during the construction process, making it challenging for traditional methods to achieve rapid and accurate real-time predictions; (3) different geological conditions may be encountered during construction, and theoretical models have poor adaptability, requiring frequent adjustments to the model parameters.
Recently, artificial intelligence (AI) technology has been used in various fields to build computational prediction models and solve practical problems [15], such as data processing [16,17] and pattern recognition [18,19]. AI-based methods for predicting the shield machine’s attitude have gradually become a focal point of research in both academic and engineering communities. Many scholars have introduced advanced prediction models, combined with real-time data from construction sites, to predict the shield machine’s attitude, thereby providing more reliable references for construction control. A Bayesian model is a common machine learning model. Chen et al. [20] proposed an intelligent method to predict the shield attitude based on a Bayesian light gradient boosting machine (LGBM) model. To improve prediction performance, some scholars proposed improved Bayesian machine learning methods. Wang et al. [21] proposed to combine the Gaussian process model and Bayesian machine learning method to predict shield attitude. Wu et al. [22] used a multi-objective evolutionary algorithm to revise Bayesian optimization categorical boosting to predict large-diameter slurry shield attitudes. With the increase in the volume of monitoring data and the development of deep learning (DL) technologies (convolutional neural network (CNN), long short-term memory (LSTM), and gate recurrent unit (GRU)), some scholars also adopted DL methods to predict the shield machine’s attitude [1,23,24]. Based on the time-series characteristics of shield posture, many scholars have established a series of hybrid DL prediction models, such as the LSTM-attention model [25], the CNN-LSTM model [26], and the CNN-GRU model [27].
In addition, to study the impact of irregular monitoring data acquisition intervals on shield attitude, Chen et al. [28] proposed the Time-Aware Long-Short-Term Memory method. Due to the longer computation time of RNN models. Fu et al. [29] adopted a temporal convolutional network (TCN) to predict the attitude of a super-large diameter shield. Compared with theoretical models and numerical simulation models, AI-based prediction models have the following advantages: (1) AI models can be trained using large amounts of historical data, automatically learning complex patterns within the data, thereby reducing the reliance on traditional physical models; (2) AI models can obtain real-time data during construction and quickly make predictions, providing immediate guidance. (3) By continuously learning from new data, the models can automatically adapt to different construction environments, enhancing the robustness of predictions.

1.2. Research Gaps and Objectives

The complexity of shield tunnelling construction means that the attitude of the shield machine is influenced by multiple factors (such as geological and shield operation parameters), and the impact of different parameters on the shield attitude varies. Existing prediction methods primarily focus on the temporal characteristics of shield attitude data, lacking research on the differing importance of various parameters. Additionally, shield attitude data exhibit both global dependency features and local temporal patterns due to the long-term nature of shield tunnel construction. Existing research has primarily focused on employing recurrent neural networks (RNNs)-based models to capture local temporal patterns in shield attitude data, while insufficient attention has been paid to investigating its global dependency features. Global information refers to the long-term and large-scale trends and patterns related to the shield attitude throughout the tunnelling process. This information typically includes the overall tunnelling direction and path, changes in geological conditions, engineering parameters, and historical attitude data. Combining global and local information can lead to a more comprehensive and accurate prediction of the shield attitude, ensuring the safety and efficiency of the engineering construction.
In this paper, we build a novel computational prediction model (CNN-Channel-Attention-Transformer-Bidirectional LSTM, CCATB) to predict the shield attitude. This model consists of a CNN model integrated with a channel attention mechanism and a Transformer model integrated with BiLSTM. The importance of various parameters that affect the shield attitude can be learned using the channel attention mechanism, while the CNN model extracts local spatial features from the data. Subsequently, the Transformer-BiLSTM model captures long-range global features using the Transformer model and learns local temporal features of the attitude data by the BiLSTM model. Compared to existing work, the contributions of this paper are as follows:
(1) The proposed model can learn the importance of various parameters that affect the shield attitude and capture global dependency features and local temporal patterns.
(2) Generality and effectiveness of the proposed model are validated through vigorous evaluation.
(3) The research can provide the scientific base to make engineering decisions more reliable, spontaneous, and creative and can improve the sustainable application of the shield machine.

2. Problem Definition

The attitude of the shield machine primarily refers to its position and orientation relative to the tunnel axis during the excavation process. As shown in Figure 1, the shield attitude typically includes six key parameters: HDSH (horizontal deviation of the shield head), VDSH (vertical deviation of the shield head), HDST (horizontal deviation of the shield tail), VDST (vertical deviation of the shield tail), roll, and pitch, respectively.
Shield tunnelling construction involves complex interactions between the machine and the geological strata, and numerous factors influence the shield attitude, such as geological parameters and shield operation parameters. Assuming the combination of parameters affecting the shield attitude is x 1 , x 2 , , x n , we need to train and learn from the historical data y 1 , y 2 , , y T up to T moment to obtain the optimal model function f 1 (   ) for predicting the shield machine’s attitude y T + 1 , y T + 2 , , y m for the next m time periods. The mathematical formula is expressed as follows:
y T + 1 , y T + 2 , , y m = f 1 y 1 , y 2 , , y T
y t = f 2 x 1 t , x 2 t , , x n t
where the function f 2 (   ) represents the correlation function between the influencing factors and the shield machine’s attitude at time t.

3. Method

3.1. Framework

The framework of the CCATB model is shown in Figure 2. From Figure 2, it can be seen that the CCATB model mainly consists of a CNN model integrated with a channel-domain attention mechanism and a Transformer model integrated with the BiLSTM model. The input to the model first passes through a channel-domain attention mechanism to learn the importance of each parameter on the shield machine’s attitude. Then, through the convolutional and pooling operations of the CNN model, such as convolutional layers, pooling layers, and fully connected layers, the model automatically extracts the spatial features of data [30]. Next, the output of the CNN model integrated with the channel-domain attention mechanism is used as the input to the Transformer model integrated with BiLSTM, which captures long-range dependencies (global features) in the time-series data using the Transformer model and uses BiLSTM to explore short-term patterns and local features in the data. Finally, the fully connected layer is used to obtain the prediction results of the model.

3.2. CNN-Attention Model

The shield machine’s attitude is influenced by various factors, such as shield machine operation parameters, geological parameters, and tunnel structure parameters, and the impact of each parameter on the shield machine’s attitude changes differently. Identifying the differences in how different parameters affect the shield attitude can help improve the model’s prediction accuracy. This section proposes arranging the parameters that influence the shield attitude along the channel domain of the input of the CNN model and then introducing a channel-domain attention mechanism to adaptively capture the importance of different parameters, as shown in Figure 3.
First, the parameters f 1 , f 1 , , f n affecting the shield attitude are arranged along the channel domain direction of the input of the CNN model, resulting in a new input x.
Max pooling, by selecting the maximum value within the pooling region, retains the most significant information in local features, which helps to improve the robustness and detection capabilities of the model. Average pooling, by calculating the average value within the pooling region, smooths the feature information and reduces the impact of noise, which helps to preserve the overall structure and global information of the data [31]. Combining max pooling and average pooling can create a better balance between local and global features, resulting in improved model performance and generalization ability. Therefore, this paper adopts max and average pooling to generate channel attention weights, as shown in the following formula.
A x 1 = f A v g p o o l x
A x 2 = f M a x p o o l x
where f is the sigmoid activation function; A v g p o o l is the average pooling function; M a x p o o l is the maximum pooling function.
Max pooling and average pooling capture the feature’s local significant information and global average information, respectively. By concatenating these pieces of information, a new output is obtained.
A x 3 = A x 1 + A x 2
This is fed into a multilayer perceptron (MLP), which can perform nonlinear transformations on these features, enhancing the interaction and modelling of dependencies between channels. Finally, the model generates channel attention weights, enabling it to focus more on important information, thereby improving overall performance and generalization ability.
A x 4 = f M L P A x 3
Finally, the updated channel attention weights are concatenated with the original input to obtain a new matrix X .
X = x + A x 4
The new matrix X is used as the input to the CNN model, and spatial features are extracted through convolution and pooling operations.
c j l = f i X j x i l 1 w i j l + b j l
c j l = f β j l d o w n x i l 1 + b j l
where l is the network layer, X j is the jth input data matrix, c j l is the jth output of layer, x i l 1 is the i-th output of layer l, f () is the activation function, w i j l is the kernel parameter at the location (i, j), b j l is the bias, and is the convolution symbol, down() is the subsampling function, β j l is the weight, and b j l is the bias.
A fully connected layer structure transforms graph-form data into vector-form data to facilitate the computation of the BiLSTM model.
Y = W c + b
where W is the weight, b is the bias.

3.3. Transformer-BiLSTM Model

As shown in Figure 4, in comparison to traditional RNN models, the Transformer model is better at handling global information. This is because the self-attention mechanism within the model structure can dynamically allocate weights, capturing dependencies between elements at any distance in the sequence and paying different levels of attention to elements at other positions in the sequence. Additionally, the Transformer model can efficiently process long sequences through parallelization, resulting in faster training speed and higher efficiency [32]. Although the Transformer model can capture long-range dependencies, its performance gradually decreases as the sequence length increases. The self-attention mechanism within the Transformer model structure lacks explicit local coherence and cannot directly capture dependencies between adjacent elements, like models specifically designed to handle local information. Therefore, it is not adept at processing local temporal details.
Given that the attitude data of the shield machine contains both global and local information, this paper proposes introducing the BiLSTM model into the decoder block of the Transformer model to improve its prediction performance for the shield machine attitude. The BiLSTM model has strong feature extraction capabilities within local time windows and can effectively capture short-term patterns and local features, thereby achieving more precise predictions. As illustrated in Figure 5, the BiLSTM model captures both forward and backward information in the sequence [33]. This is particularly important during the decoder stage, as it helps the model better understand the contextual information in the input sequence, especially the background information relevant to predicting future time points. BiLSTM can capture long-term dependencies in time series data effectively through its hidden states and cell states. It is useful for pattern recognition and trend analysis in time series prediction tasks. By integrating the BiLSTM into the decoder block of the Transformer model, the model’s performance in time series prediction tasks can be significantly enhanced because this hybrid model not only captures global dependencies but also effectively handles local temporal features, which enhances the accuracy and reliability of the predictions.
According to Equation (10), the output of the CNN-Attention model is Y = y 1 , y 2 , y n . This output is the input to the Transformer-BiLSTM model, where y h is the feature vector at the h-th time step. The input Y e m b e d is obtained after passing through the embedding layer and positional encoding.
Y e m b e d = E Y + P Y
where E is the embedding layer, which maps each input y h to an embedding vector E y h ; and P is the positional encoding, which adds positional information to each embedding vector.
Then, the Y e m b e d is passed through the multi-head attention mechanism to capture the importance of different elements at various positions. The query matrix Q , key matrix K , and value matrix V are obtained through linear transformations:
Q = Y e m b e d W Q
K = Y e m b e d W K
V = Y e m b e d W V
The self-attention computation for each head is as follows:
Z i = A t t e n t i o n Q W Q i , K W K i , V W V i = s o f t   max Q W Q i K W K i T d k V W V i
Then, the outputs of all heads are concatenated, and a linear transformation is applied:
Z = C o n c a t Z 1 , Z 2 , , Z h W O
Residual connections and layer normalization are applied:
Z r e s = Y e m b e d + Z
Z n o r m = L a y e r N o r m Z r e s
The computation is then performed through a feed-forward neural network:
F F N Z n o r m = Re L U Z n o r m W 1 + b 1 W 2 + b 2
Residual connections and layer normalization are applied again to obtain the output of the encoder block.
Y o u t = L a y e r N o r m Z n o r m + F F N Z n o r m
Assuming the input sequence to the decoder is Z = z 1 , z 2 , , z t , where z i is the feature vector at the i-th time step. Note that t is usually less than n, as the decoder processes partially known future data. After passing through the embedding layer and positional encoding, the input is obtained as Z e m b e d .
Z e m b e d = E Z + P Z
where E is the embedding layer that maps each input z i to an embedding vector E z i ; P is the positional encoding that adds positional information to each embedding vector.
The Z e m b e d is then processed through a masked multi-head attention mechanism to capture the importance of elements at different positions. The query matrix Q , key matrix K , and value matrix V are obtained through linear transformations.
Q = Z e m b e d W Q
K = Z e m b e d W K
V = Z e m b e d W V
The masked self-attention calculation for each head is performed, and a mask matrix M is used to prevent the current position from seeing future positions:
Z i = A t t e n t i o n Q W Q i , K W K i , V W V i , M = s o f t   max Q W Q i K W K i T + M d k
M i j = 0               i j   i < j
Then, the outputs from all heads are concatenated and passed through a linear transformation.
Z = C o n c a t Z 1 , Z 2 , , Z h W O
Followed by residual connection and layer normalization.
Z r e s = Y e m b e d + Z
Z n o r m 1 = L a y e r N o r m Z r e s 1
As shown in Figure 6, the BiLSTM layer is added in the decoder block to capture local information in the data:
H B i L S T M = B i L S T M Z n o r m 1
Through the encoder-decoder attention mechanism, the query matrix Q , key matrix K , and value matrix V are obtained via linear transformations.
Q = H B i L S T M W Q
K = Z e m b e d W K
V = Z e m b e d W V
The computational process of the encoder-decoder attention mechanism is:
Z e n c d e c i = A t t e n t i o n Q W Q i , K W K i , V W V i = s o f t   max Q W Q i K W K i T d k V W V i
Then, the outputs of all heads are concatenated and subjected to a linear transformation.
Z e n c d e c = C o n c a t Z e n c d e c 1 , Z e n c d e c 2 , , Z e n c d e c h W O
The output undergoes residual connection and layer normalization.
Z r e s 2 = Z n o r m 1 + Z e n c d e c
Z n o r m 2 = L a y e r N o r m Z r e s 2
Computation is performed through a feed-forward neural network.
F F N Z n o r m 2 = Re L U Z n o r m 2 W 1 + b 1 W 2 + b 2
Residual connection and layer normalization are applied again to obtain the decoder block output.
Z o u t = L a y e r N o r m Z n o r m 2 + F F N Z n o r m 2
Finally, the ultimate prediction is generated through a fully connected layer:
R e s u l t s = Z o u t W o u t + b o u t

4. Case Study

4.1. Project Overview

Shenyang Metro Line 3 is planned as a major east-west trunk line of the city, starting from the Baoma New Town in the west and ending in the Hunnan New District. It connects key functional areas such as the BMW New Town, Wenhua Road area, Nanta, Dongta, and Hunnan New District, establishing a connection between the city’s core area and the western and eastern sections of the city. This line is an important east-west corridor in the southern part of the city. The total length of the line is 44 km, with 35 stations. Due to the geological and environmental conditions along the route, the construction methods for underground works mainly include the open cut, cover excavation, shield tunnelling, and mining methods. The research object selected in this paper is a certain shield tunnelling section. Within the exploration range, the strata from top to bottom are mainly ① miscellaneous fill soil layer, ④1 silty clay layer, ④2 fine sand layer, ④3 medium-coarse sand layer, ④4 gravelly sand layer, ⑤3 medium-coarse sand layer, ⑤4 gravelly sand layer, ⑦1 clayey gravel layer, and ⑧ clay layer. The underground stations and tunnels are primarily located in the ④4 gravelly sand and ⑤3 medium-coarse sand layers. The shield operation data are sourced from the real-time monitoring platform of the shield machine.

4.2. Parameter Selection

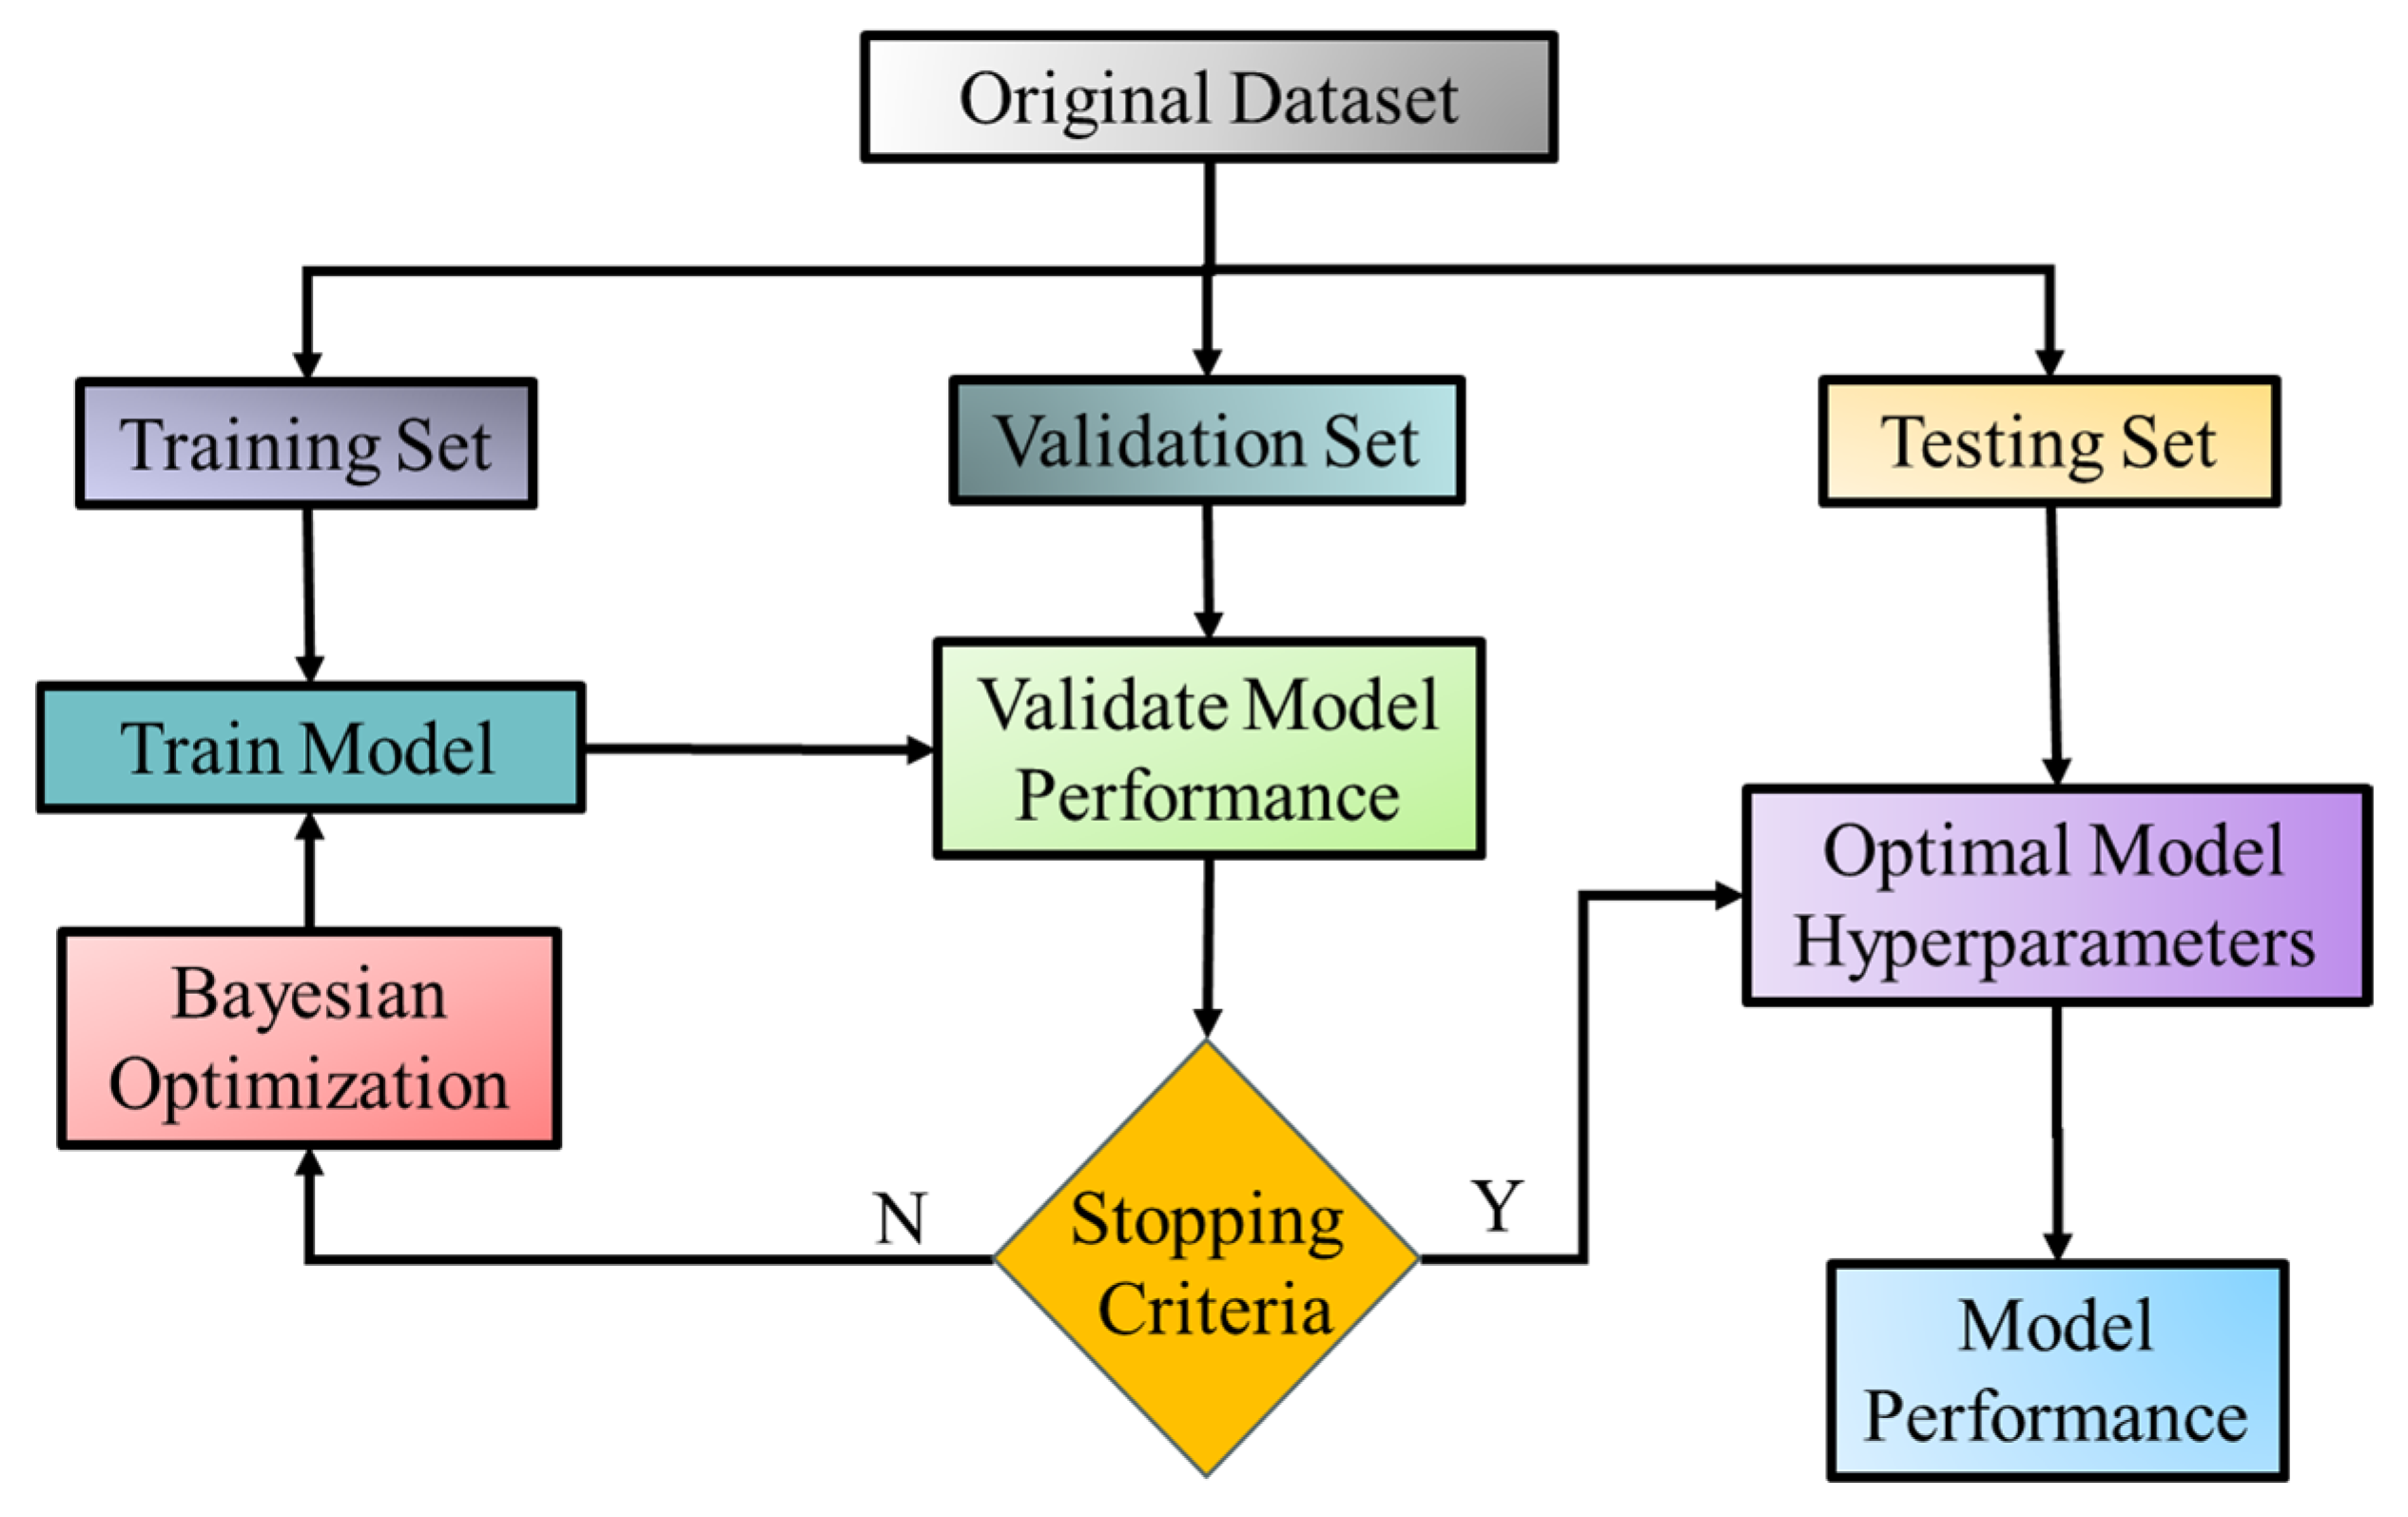
The change in the shield machine’s attitude is a complex process involving mechanical-strata interaction, with numerous parameters primarily categorized into shield operation and strata parameters. Based on a comprehensive review of existing studies [21,24] and the analysis of this project, the selected input parameters are cutter rotational speed, penetration depth, cutter torque, thrust, driving speed, grouting volume, articulation stroke (4 types), chamber earth pressure, cohesion, and friction angle. The output parameters are the vertical and horizontal deviations of the tail, middle, and front shields. This paper selects the vertical deviation of the middle shield as the output parameter, with a total of 10,270 data sets. The dataset is split into training, validation, and testing sets with a distribution of 70%, 25%, and 5%, respectively, as shown in Figure 7. The descriptions of each parameter are presented in Table 1 below.

4.3. Baseline Models and Evaluation Metrics

This paper selects two existing classic prediction models (RF [34]), LSTM [35], and two recently developed models (CNN-BiLSTM [36] and LSTM-Attention [24]) as the baseline models for the CCATB model. Hyperparameters are parameters that need to be pre-defined before the model training. Hyperparameters are not derived from training data and directly impact the final prediction performance of the models. Thus, this paper determines the optimal hyperparameters for each model using a Bayesian optimization algorithm. The detailed steps are as follows: (1) As shown in Figure 7, the dataset is divided into training, validation, and test sets. Input data undergoes normalization to ensure consistent feature scaling; (2) Initialize the BO framework using the training set as the sample space. Define the hyperparameters to be optimized and their search boundaries. Implement 5-fold cross-validation with the CCATB model: Generate an initial set of hyperparameter combinations. Train the model iteratively, using the mean root mean square error (RMSE) from cross-validation as the fitness value. Evaluate the objective function (mean squared error, MSE) on the validation set. Update the probabilistic surrogate model based on evaluation results, then propose new hyperparameter combinations through acquisition function optimization. Repeat until convergence (i.e., MSE shows no significant decrease over successive iterations), outputting the optimized hyperparameter configuration; (3) Construct the final CCATB model using the optimal hyperparameters. Perform prediction on the test set and calculate performance metrics: Coefficient of determination (R2), root mean square error (RMSE), and mean absolute error (MAE). The complete computational workflow is illustrated in Figure 8. The optimal hyperparameters of models are shown in Table 2.
Table 2 shows that the units of various parameters are inconsistent. A large difference in units can lead to inconsistent scales in the data, causing some parameters to dominate the model training process. In contrast, the influence of other parameters is weakened, affecting the model’s prediction accuracy. Common methods for data normalization include min-max normalization, Z-score standardization, and decimal scaling normalization. Min-max normalization is simple and intuitive, easy to understand, and easy to implement [37]. By linearly transforming the data into [0, 1], it ensures that all features have consistent scales, avoiding the dominance of certain features due to scale differences during model training. Therefore, the data is processed using the min-max normalization method, and the formula is shown below.
x = x x min x max x min
This paper selects RMSE, MAE, and R2 as the evaluation metrics to measure the difference between the predicted values and the actual values [38].
α RMSE = 1 n i = 1 n y i Y i 2
α MAE = 1 n i = 1 n | y i Y i |
R 2 = 1 i = 1 n ( y i Y i ) 2 / i = 1 n ( y i y ¯ i ) 2
where y ¯ i is the average value of the actual values; n is the number of predicted values.

4.4. Prediction Flowchart

Figure 9 shows the steps for predicting the shield attitude. The content is mainly categorized into three sections: data acquisition, model establishment, and performance analysis and engineering application of the model.

5. Results and Discussions

5.1. Loss Values

The model’s loss values for the training, validation, and test sets are illustrated over the iterations in Figure 10. In the training set, the loss value decreases quickly during the early stages and gradually stabilizes as the number of iterations increases, indicating that the model gradually learns effective patterns and features from the training data. With more iterations, the model’s performance improves, and the loss value decreases to a stable level. The same trend can be observed in the validation and test sets, indicating that the model can also gradually uncover the internal characteristics of the data on independent validation and test sets. Additionally, during the stable phase, the loss values for the training, validation, and test sets are relatively low and close to each other, suggesting that the model has good generalization ability and performs well on unseen data. The model reaches a stable state of loss values after approximately 180 iterations on the training, validation, and test sets, indicating that the 220 iterations set is sufficient to meet the training requirements of the model.

5.2. Comparison with Other Models

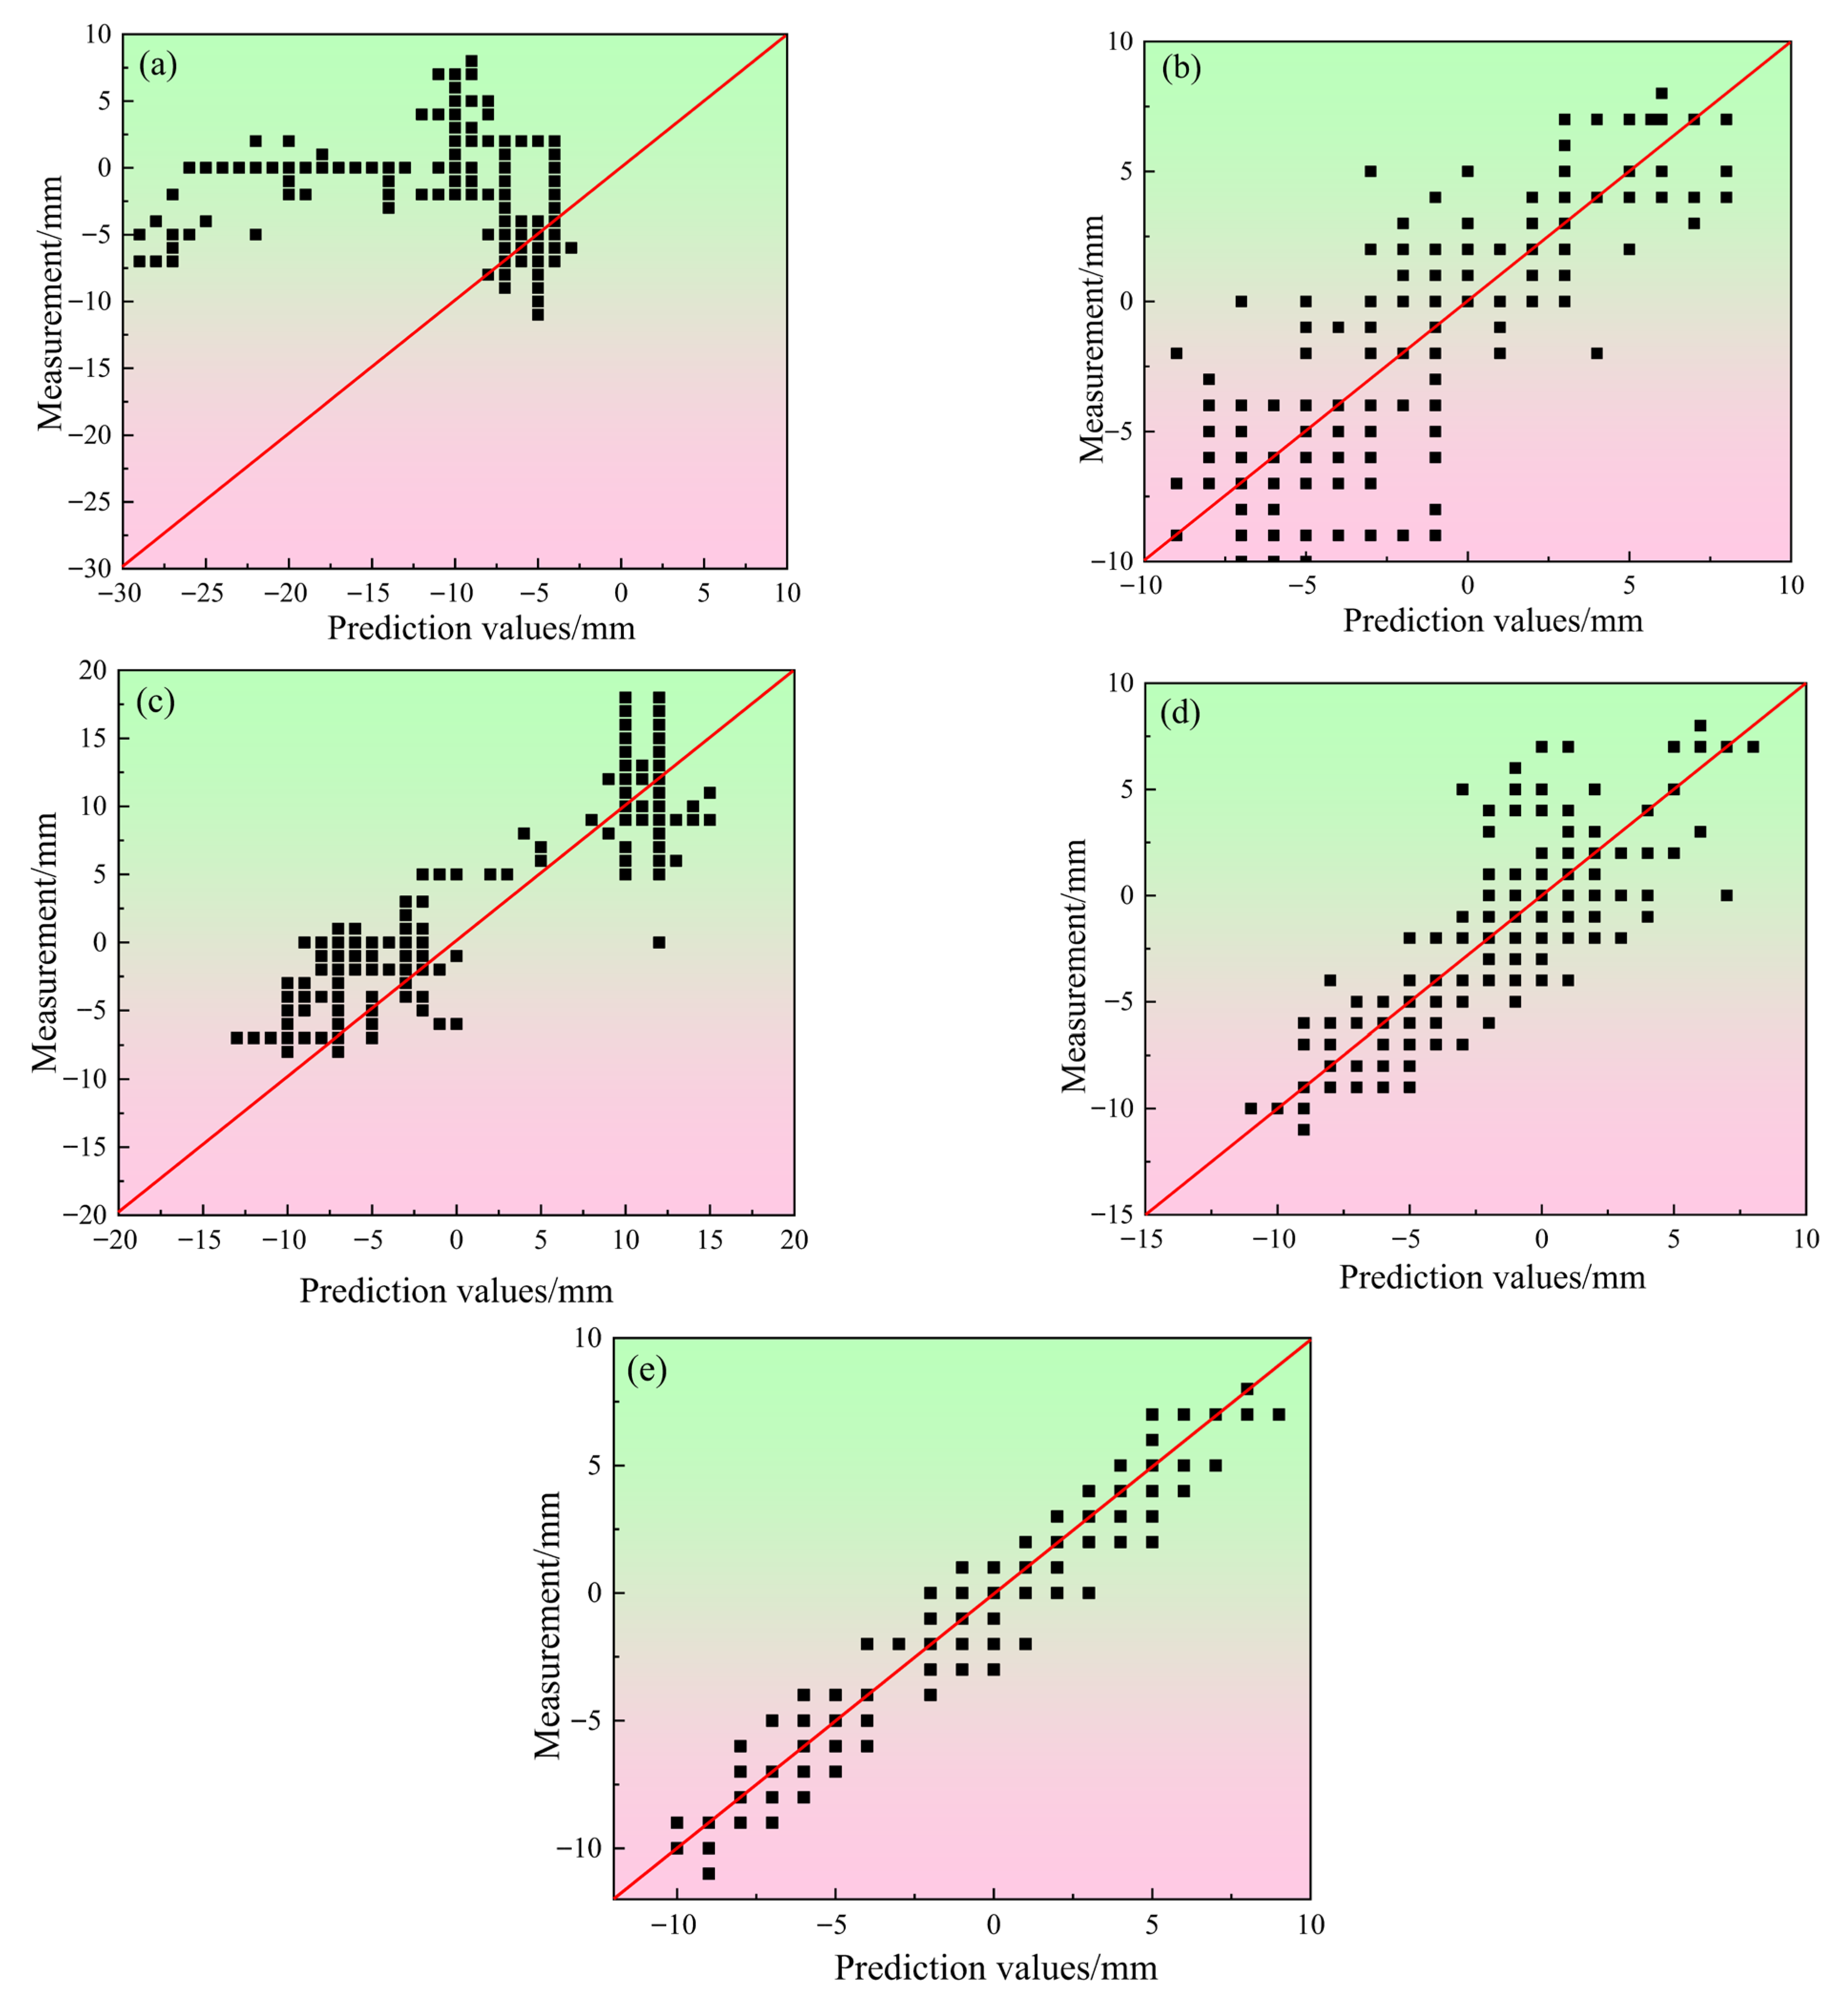
The prediction results of the CCATB model, compared with various baseline models, are shown in Table 3 and Figure 11. The comparison of the data presented in Table 3 shows that the CCATB model has the smallest MAE and RMSE values and the largest R2 value, indicating that the proposed CCATB model demonstrates the highest prediction performance. In comparison to the RF model, the CCATB model is a deep learning model with strong representation learning capabilities. It can automatically capture long-term dependencies and complex nonlinear patterns in time series data, resulting in improved prediction outcomes. The CCATB model uses a channel-domain attention mechanism, which allows it to adaptively learn the importance of various parameters. When compared to the LSTM, LSTM-Attention, and CNN-BiLSTM models, the CCATB model also benefits from the introduction of the Transformer model. This combination effectively captures long-range dependencies in time series data, resulting in improved prediction performance. The correspondence between prediction values and measurement is shown in Figure 11. We found that the CCATB model has the smallest prediction error, which aligns with the conclusions drawn from Table 3. Comparing the CCATB model with baseline models shows that it can learn the internal characteristics of the shield attitude data more accurately and effectively capture the patterns of data variation, providing better guidance for construction.

5.3. Ablation Experiments

To better understand the internal working mechanisms of the CCATB model, this section conducts ablation experiments, selecting the following sub-models: Transformer, Transformer-BiLSTM, and CNN-Attention models. The results of the experiment are presented in Table 4. The data in Table 4 shows that the CCATB model has the lowest MAE and RMSE values, as well as the highest R2 value, indicating superior prediction performance. Unlike the Transformer and Transformer-BiLSTM models, the CCATB model incorporates a CNN-Attention module that can assess the significance of various parameters affecting the shield machine’s attitude. Additionally, by utilizing convolutional and pooling operations, the model can better process high-dimensional data and identify potential key features in the input data, thereby enhancing the prediction performance of the CCATB model. In comparison to the CNN-Attention model, the Transformer-BiLSTM module in the CCATB model can capture long-range dependencies and local features of the time series data. The ablation experiments show that the CCATB model effectively utilizes the strengths of each sub-model, revealing the complex features of shield attitude data and achieving more accurate predictions.
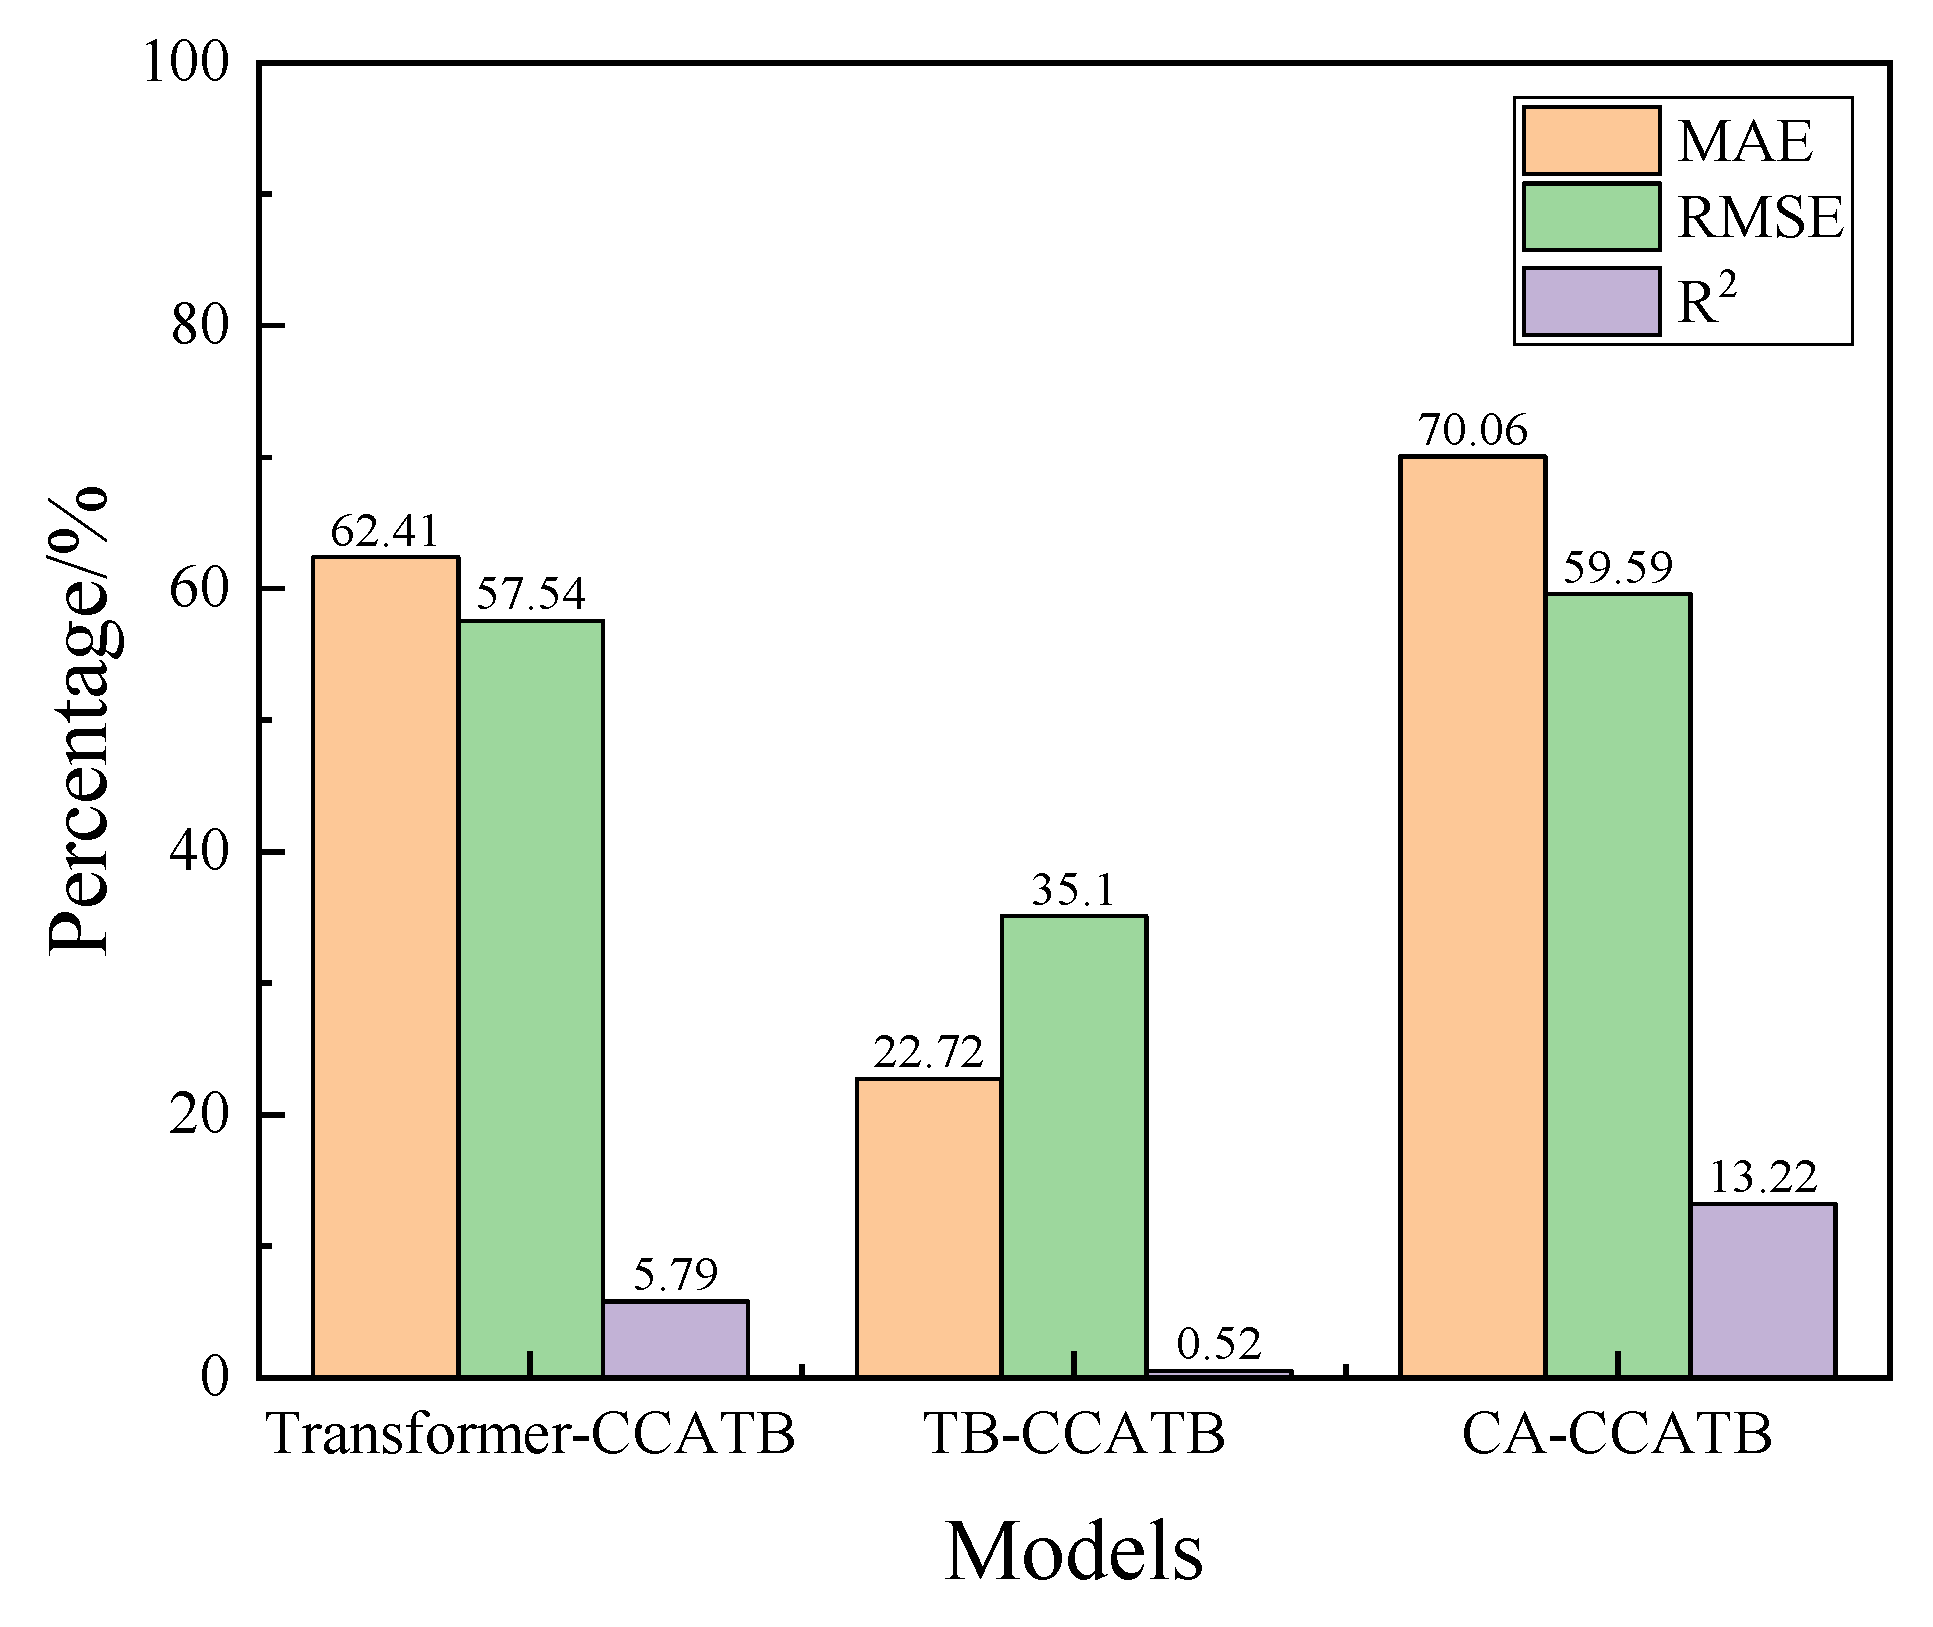
Figure 12 shows how the CCATB model improves compared to the three sub-models across three evaluation metrics. Figure 12 illustrates that the CCATB model decreases the MAE and RMSE values by 62.41% and 57.54%, respectively, while increasing the R2 value by 5.79% compared to the Transformer model. In comparison to the Transformer-BiLSTM model, the CCATB model shows a reduction in MAE and RMSE values by 22.72% and 35.1%, respectively, while also increasing the R2 value by 0.52%. In comparison to the CNN-Attention model, the CCATB model achieves a 70.06% reduction in MAE and a 59.59% reduction in RMSE values, respectively, and increases the R2 value by 13.22%. These results further indicate that the CCATB model effectively combines the advantages of each sub-model, demonstrating stronger data learning capabilities and thus achieving better prediction performance.

5.4. Analysis of Generalization Ability

The ability of a model to generalize refers to its performance when processing unseen data. In other words, it measures whether the model can effectively apply the patterns it has learned from the training data to new data. To assess the generalization ability and reliability of the CCATB model, this section selects monitoring data from another tunneling interval of a newly constructed tunnel for a prediction experiment. The key differences between the two tunneling intervals are shown in Table 5. The prediction results are shown in Table 6 and Figure 13.
From Table 6 and Figure 13, it can be intuitively seen that the MAE and RMSE values predicted by the CCATB model are 0.745 and 0.991, respectively, with an R2 value of 0.968. In comparison to the four baseline models, the CCATB model demonstrates the lowest MAE and RMSE values and the highest R2 value. This indicates that the CCATB model performs well in predicting the shield machine’s attitude at this tunneling interval. It also confirms that the CCATB model has good generalization ability and reliability, achieving excellent prediction results across different construction segments.

5.5. Engineering Application

When the prediction values of the shield attitude will exceed allowable deviations in subsequent tunneling, preemptive engineering measures (e.g., adjusting thrust of propulsion jacks and grouting control) are implemented to prevent alignment overruns and avoid damage to the shield machine and segment structures. The CCATB model was applied to the subsequent tunneling phase (Rings 209–218), with dynamic management of tunneling parameters through integration of ground monitoring feedback and on-site engineering measures, to validate its field applicability.
Figure 14 and Figure 15 illustrate the variation curve of the shield tail and front attitude during tunneling under the combined application of CCATB model predictions and proactive engineering interventions. It can be seen that Rings 199–208 exhibit significantly larger fluctuations in attitude variation compared to Rings 209–218, primarily due to the lag effect inherent in real-time reactive adjustments by technicians. In Figure 14, the average vertical and horizontal deviations of the shield tail in Rings 199–208 were 30.7 mm and −69.3 mm, respectively, whereas in Rings 209–218, these values decreased to 13.5 mm and −7.0 mm, representing reductions of 56.0% (vertical) and 89.9% (horizontal). The results demonstrate that: Proactive measures guided by the CCATB model mitigate the lag effect of on-site adjustments, effectively reducing shield alignment deviations. No significant alignment deviations occurred in Rings 209–218, validating the CCATB model as a practical tool for shield attitude control in tunnel construction.
Through the analysis of torque, grouting volume, and other parameters during the construction process, the following is found: (1) Energy consumption: A 31% reduction in average torque fluctuation effectively saves electricity and reduces energy consumption. (2) Equipment wear: The monitored tool wear coefficient decreased by 29%. (3) Environmental impact: Excessive synchronous grouting consumption was reduced by 37%, mitigating the impact of grouting on the surrounding stratum environment.

5.6. Parameter Correlation Analysis

To identify the input parameters that most strongly influence the attitude predictions, we employed the maximal information coefficient (MIC) method to investigate the correlations between various input parameters and shield attitude. The maximal information coefficient (MIC) is a non-parametric statistical method based on mutual information, designed to measure the strength of associations between variables, including both linear and nonlinear relationships. It is capable of detecting a wide range of complex relationships, such as linear, nonlinear, periodic, and piecewise functional dependencies. MIC remains robust in the presence of noise and does not rely on assumptions about the underlying data distribution, making it suitable for continuous, discrete, or mixed-type data. We conduct experiments to calculate the correlation between input parameters (e.g., thrust, cutterhead torque, earth chamber pressure, driving speed, penetration depth, cutterhead rotational speed, articulation stroke (4 types), grouting volume, cohesion, and friction angle) and shield attitude (vertical deviation of the middle shield), as shown in Figure 16. The correlation of each parameter with shield attitude, ranked from strongest to weakest, is as follows: thrust, cutterhead torque, earth chamber pressure, driving speed, penetration depth, cutterhead rotational speed, articulation stroke (4 types), grouting volume, cohesion, and friction angle. The top three parameters—thrust, cutterhead torque, and earth chamber pressure—are critical for the following reasons: (1) Thrust is the core force directly controlling the shield machine’s advancement. Its magnitude and direction directly affect the pitch angle and yaw angle; uneven thrust can directly cause torsional deformation of the machine body and horizontal yaw, making it the primary operational variable for attitude control.
(2) Cutterhead torque reflects the uniformity of stratum hardness. Stratum inhomogeneity causes torque fluctuations, inducing torsional vibration of the machine body. Improper thrust control under high torque easily leads to abrupt changes in pitch or yaw.
(3) Earth chamber pressure imbalance disturbs the soil in front of the excavation face: excessive pressure may lift the shield machine, while insufficient pressure tends to cause settlement. Uneven pressure distribution can also trigger yaw. Earth chamber pressure is a key indicator of stratum reaction force for maintaining attitude stability.

5.7. Further Discussion

Through the above experiments, it is verified that the model has good prediction performance and generalization ability, and can provide advanced guidance for engineering construction. However, there are still some shortcomings in the research of this paper. First, the complexity of the model and the demand for computational resources are high, and the model structure needs to be optimized to reduce the computational complexity of the model in the future. Then, the generalization ability of the model needs to be validated in tunnelling projects with different terrain and geological conditions to ensure its effectiveness in a wider range of scenarios.

6. Conclusions

To improve the prediction accuracy of the shield machine in attitude and sustainable application, this paper introduces a novel prediction model (CCATB) for shield machine attitudes based on deep learning technology. The model’s performance was evaluated using monitoring data from two tunneling intervals, leading to the following conclusions:
(1)
Compared with existing shield machine’s attitude prediction models, the CCATB model can not only learn the importance of various parameters affecting the shield machine’s attitude but also capture both global and local information characteristics in the attitude data.
(2)
Comparison and ablation experiments revealed that the MAE and RMSE values for the CCATB model are lower than those of the baseline and sub-models. Additionally, the R2 value for the CCATB model is higher than that of the baseline and sub-models, indicating that the CCATB model has superior prediction accuracy.
(3)
By selecting monitoring data from another tunnelling interval for experimental verification, it has been confirmed that the CCATB model demonstrates strong generalization ability and reliability, achieving excellent prediction results across different construction segments.
(4)
Applying the CCATB model to subsequent shield tunneling processes and integrating it with on-site engineering measures can mitigate the lag effect of field adjustments, effectively reducing shield alignment deviations during tunneling. The proposed CCATB model demonstrates practical significance for controlling shield alignment in shield tunnel construction.

Author Contributions

Conceptualization, M.D.; methodology, M.D.; software, F.Z.; validation, C.C.; formal analysis, M.D.; writing—original draft preparation, M.D., F.Z.; writing—review and editing, C.C., P.J.; visualization, C.C.; supervision, P.J. All authors have read and agreed to the published version of the manuscript.

Funding

This work was supported by the Research on the Cutting Failure Mechanism and Prediction Model of Shield Tunneling Through Reinforced Concrete Structures (2024SGY019). The financial supports are gratefully acknowledged.

Institutional Review Board Statement

Not applicable.

Informed Consent Statement

Not applicable.

Data Availability Statement

The data associated with this research are available and can be obtained by contacting the corresponding author upon reasonable request.

Conflicts of Interest

The authors declare no conflicts of interest.

References

  1. Zhang, Y.X.; Ren, X.H.; Zhang, J.X.; Zhang, Y.Z.; Ma, Z.C. A novel workflow including denoising and hybrid deep learning model for shield tunneling construction parameter prediction. Eng. Appl. Artif. Intell. 2024, 133 Pt A, 108103. [Google Scholar] [CrossRef]
  2. Lin, L.K.; Zhu, H.X.; Ma, Y.B.; Peng, Y.Y.; Xia, Y.M. Surface feature and defect detection method for shield tunnel based on deep learning. J. Comput. Civ. Eng. 2025, 39, 04025019. [Google Scholar] [CrossRef]
  3. Feng, Z.B.; Wang, J.Y.; Liu, W.; Li, T.J.; Wu, X.G.; Zhao, P.X. Data-driven deformation prediction and control for existing tunnels below shield tunneling. Eng. Appl. Artif. Intell. 2024, 138 Pt A, 109379. [Google Scholar] [CrossRef]
  4. Li, J.; Wang, H.W. Modeling and analyzing multiteam coordination task safety risks in socio-technical systems based on FRAM and multiplex network: Application in the construction industry. Reliab. Eng. Syst. Saf. 2023, 229, 108836. [Google Scholar] [CrossRef]
  5. Zhao, S.; Liao, S.M.; Yang, Y.F.; Tang, L.H. Prediction of shield tunneling attitudes: A multi-dimensional feature synthesizing and screening method. J. Rock Mech. Geotech. Eng. 2024, 17, 3358–3377. [Google Scholar] [CrossRef]
  6. Xu, J.; Bu, J.F.; Qin, N.; Huang, D.Q. SCA-MADRL: Multiagent deep reinforcement learning framework based on state classification and assignment for intelligent shield attitude control. Expert Syst. Appl. 2024, 235, 121258. [Google Scholar] [CrossRef]
  7. Shen, X.; Yuan, D.J. Influence of shield yawing angle variation on shield–soil interaction. China J. Highw. Transp. 2020, 33, 132–143. [Google Scholar] [CrossRef]
  8. Pan, G.R.; Fan, W. A rigorous calculating model of inclinometer-data fusion in tunnel-boring-machine attitude. J. Tongji Univ. (Nat. Sci. Ed.) 2018, 46, 1433–1439. Available online: https://link.cnki.net/urlid/31.1267.N.20181112.1116.014 (accessed on 20 November 2025).
  9. Zhong, X.C.; Yi, B.B.; Zhu, W.B. Numerical simulation of shield attitude and its mutation judgement methods for shield tunneling through fine sand stratum. J. Huazhong Univ. Sci. Technol. (Nat. Sci. Ed.) 2024, 1–8. Available online: https://link.cnki.net/urlid/42.1658.N.20221021.1601.003 (accessed on 20 November 2025).
  10. Wu, G.Q.; Tan, Y.J.; Zeng, J.Y.; Zheng, J.L.; Zhang, R.; Liu, Y.F.; Yue, S. Laboratory tests of an eccentrically loaded strip footing above single underlying void. J. Build. Eng. 2025, 111, 113211. [Google Scholar] [CrossRef]
  11. Yang, H.; Shi, H.; Gong, G.; Hu, G. Electro-hydraulic proportional control of thrust system for shield tunneling machine. Autom. Constr. 2009, 18, 950–956. [Google Scholar] [CrossRef]
  12. Xie, H.; Duan, X.; Yang, H.; Liu, Z. Automatic trajectory tracking control of shield tunneling machine under complex stratum working condition. Tunn. Undergr. Space Technol. 2012, 32, 87–97. [Google Scholar] [CrossRef]
  13. Liu, H.; Wang, J.; Zhang, L.; Zhao, G. Trajectory tracking of hard rock tunnel boring machine with cascade control structure. In Proceedings of the 2014 IEEE Chinese Guidance, Navigation and Control Conference, Yantai, China, 8–10 August 2014; IEEE: Shanghai, China, 2014; pp. 2326–2331. [Google Scholar] [CrossRef]
  14. Wang, L.; Yang, X.; Gong, G.; Du, J. Pose and trajectory control of shield tunneling machine in complicated stratum. Autom. Constr. 2018, 93, 192–199. [Google Scholar] [CrossRef]
  15. Hartmann, T.; Trappey, A. Advanced Engineering Informatics—Philosophical and methodological foundations with examples from civil and construction engineering. Dev. Built Environ. 2020, 4, 100020. [Google Scholar] [CrossRef]
  16. Lyu, G.W.; Luo, C.Y.; Wu, S.S.; Wang, C.; Ma, W.; Yang, M.; Wang, P.; Yang, S.Q. An enhanced variational mode decomposition method for processing hydrodynamic data of underwater gliders. Measurement 2025, 244, 116468. [Google Scholar] [CrossRef]
  17. Peng, G.L.; Sun, S.S.; Xu, Z.W.; Du, J.X.; Qin, Y.J.; Sharshir, S.W.; Kandeal, A.W.; Kabeel, A.E.; Yang, N. The effect of dataset size and the process of big data mining for investigating solar-thermal desalination by using machine learning. Int. J. Heat Mass Transf. 2025, 236, 126365. [Google Scholar] [CrossRef]
  18. Lu, Y.Z.; Wang, H.; Lu, Z.G.; Niu, J.Y.; Liu, C. Gait pattern recognition based on electroencephalogram signals with common spatial pattern and graph attention networks. Eng. Appl. Artif. Intell. 2025, 141, 109680. [Google Scholar] [CrossRef]
  19. Parashar, A.; Parashar, A.; Rida, I. Journey into gait biometrics: Integrating deep learning for enhanced pattern recognition. Digit. Signal Process. 2024, 147, 104393. [Google Scholar] [CrossRef]
  20. Chen, H.Y.; Li, X.Y.; Feng, Z.B.; Wang, L.; Qin, Y.W.; Skibniewski, M.J.; Chen, Z.S.; Liu, Y. Shield attitude prediction based on Bayesian-LGBM machine learning. Inf. Sci. 2023, 632, 105–129. [Google Scholar] [CrossRef]
  21. Wang, L.; Pan, Q.J.; Wang, S.Y. Data-driven predictions of shield attitudes using Bayesian machine learning. Comput. Geotech. 2024, 166, 106002. [Google Scholar] [CrossRef]
  22. Wu, X.G.; Wang, J.Y.; Feng, Z.B.; Chen, H.Y.; Li, T.J.; Liu, Y. Multisource information fusion for real-time prediction and multiobjective optimization of large-diameter slurry shield attitude. Reliab. Eng. Syst. Saf. 2024, 250, 110305. [Google Scholar] [CrossRef]
  23. Wang, K.Y.; Wu, X.G.; Zhang, L.M.; Song, X.Q. Data-driven multi-step robust prediction of TBM attitude using a hybrid deep learning approach. Adv. Eng. Inform. 2023, 55, 101854. [Google Scholar] [CrossRef]
  24. Fu, K.; Xue, Y.G.; Qiu, D.H.; Wang, P.; Lu, H.L. Multi-channel fusion prediction of TBM tunneling thrust based on multimodal decomposition and reconstruction. Tunn. Undergr. Space Technol. 2026, 167, 107061. [Google Scholar] [CrossRef]
  25. Kang, Q.; Chen, E.J.; Li, Z.C.; Luo, H.B.; Liu, Y. Attention-based LSTM predictive model for the attitude and position of shield machine in tunneling. Undergr. Space 2023, 13, 335–350. [Google Scholar] [CrossRef]
  26. Zhou, C.; Xu, H.C.; Ding, L.Y.; Wei, L.C.; Zhou, Y. Dynamic prediction for attitude and position in shield tunneling: A deep learning method. Autom. Constr. 2019, 105, 102840. [Google Scholar] [CrossRef]
  27. Dai, Z.Y.; Li, P.N.; Zhu, M.Q.; Zhu, H.H.; Liu, J.; Zhai, Y.X.; Fan, J. Dynamic prediction for attitude and position of shield machine in tunneling: A hybrid deep learning method considering dual attention. Adv. Eng. Inform. 2023, 57, 102032. [Google Scholar] [CrossRef]
  28. Chen, L.; Tian, Z.Y.; Zhou, S.H.; Gong, Q.M.; Di, H.G. Attitude deviation prediction of shield tunneling machine using Time-Aware LSTM networks. Transp. Geotech. 2024, 45, 101195. [Google Scholar] [CrossRef]
  29. Fu, Y.B.; Chen, L.; Xiong, H.; Chen, X.S.; Lu, A.D.; Zeng, Y.; Wang, B.L. Data-driven real-time prediction for attitude and position of super-large diameter shield using a hybrid deep learning approach. Undergr. Space 2024, 15, 275–297. [Google Scholar] [CrossRef]
  30. Xing, J.H.; Lu, J.; Zhang, K.B.; Chen, X.G. ADT: Person re-identification based on efficient attention mechanism and single-channel dual-channel fusion with transformer features aggregation. Expert Syst. Appl. 2025, 261, 125489. [Google Scholar] [CrossRef]
  31. Chen, Z.H.; Shamsabadi, E.A.; Jiang, S.; Shen, L.M.; Dias-da-Costa, D. An average pooling designed Transformer for robust crack segmentation. Autom. Constr. 2024, 162, 105367. [Google Scholar] [CrossRef]
  32. Zhang, L.M.; Li, Y.S.; Wang, L.L.; Wang, J.Q.; Luo, H. Physics-data driven multi-objective optimization for parallel control of TBM attitude. Adv. Eng. Inform. 2025, 65 Pt A, 103101. [Google Scholar] [CrossRef]
  33. Han, J.C.; Zeng, P. Residual BiLSTM based hybrid model for short-term load forecasting in buildings. J. Build. Eng. 2025, 99, 111593. [Google Scholar] [CrossRef]
  34. Kong, X.; Ling, X.; Tang, L.; Tang, W.; Zhang, Y. Random forest-based predictors for driving forces of earth pressure balance (EPB) shield tunnel boring machine (TBM). Tunn. Undergr. Space Technol. 2022, 122, 104373. [Google Scholar] [CrossRef]
  35. Zou, Z.; Gao, P.; Yao, C. City-level traffic flow prediction via LSTM networks. In Proceedings of the 2nd International Conference on Advances in Image Processing; ACM: Chengdu, China, 2018; pp. 149–153. [Google Scholar] [CrossRef]
  36. Gui, L.; Wang, F.; Zhang, W.C. Study on shield attitude prediction and deflection correction based on deep learning. J. Hebei Univ. Eng. (Nat. Sci. Ed.) 2024, 41, 82–89. [Google Scholar]
  37. Niño-Adan, I.; Landa-Torres, I.; Portillo, E.; Manjarres, D. Analysis and application of normalization methods with supervised feature weighting to improve K-means accuracy. In Advances in Intelligent Systems and Computing, Proceedings of the 14th International Conference on Soft Computing Models in Industrial and Environmental Applications (SOCO 2019); Springer: Seville, Spain, 2019; Volume 950, pp. 13–23. [Google Scholar] [CrossRef]
  38. Zhang, W.; Zhang, R.; Wu, C.; Goh, A.; Lacasse, S.; Liu, A. State-of-the-art review of soft computing applications in underground excavations. Geosci. Front. 2020, 11, 1095–1106. [Google Scholar] [CrossRef]
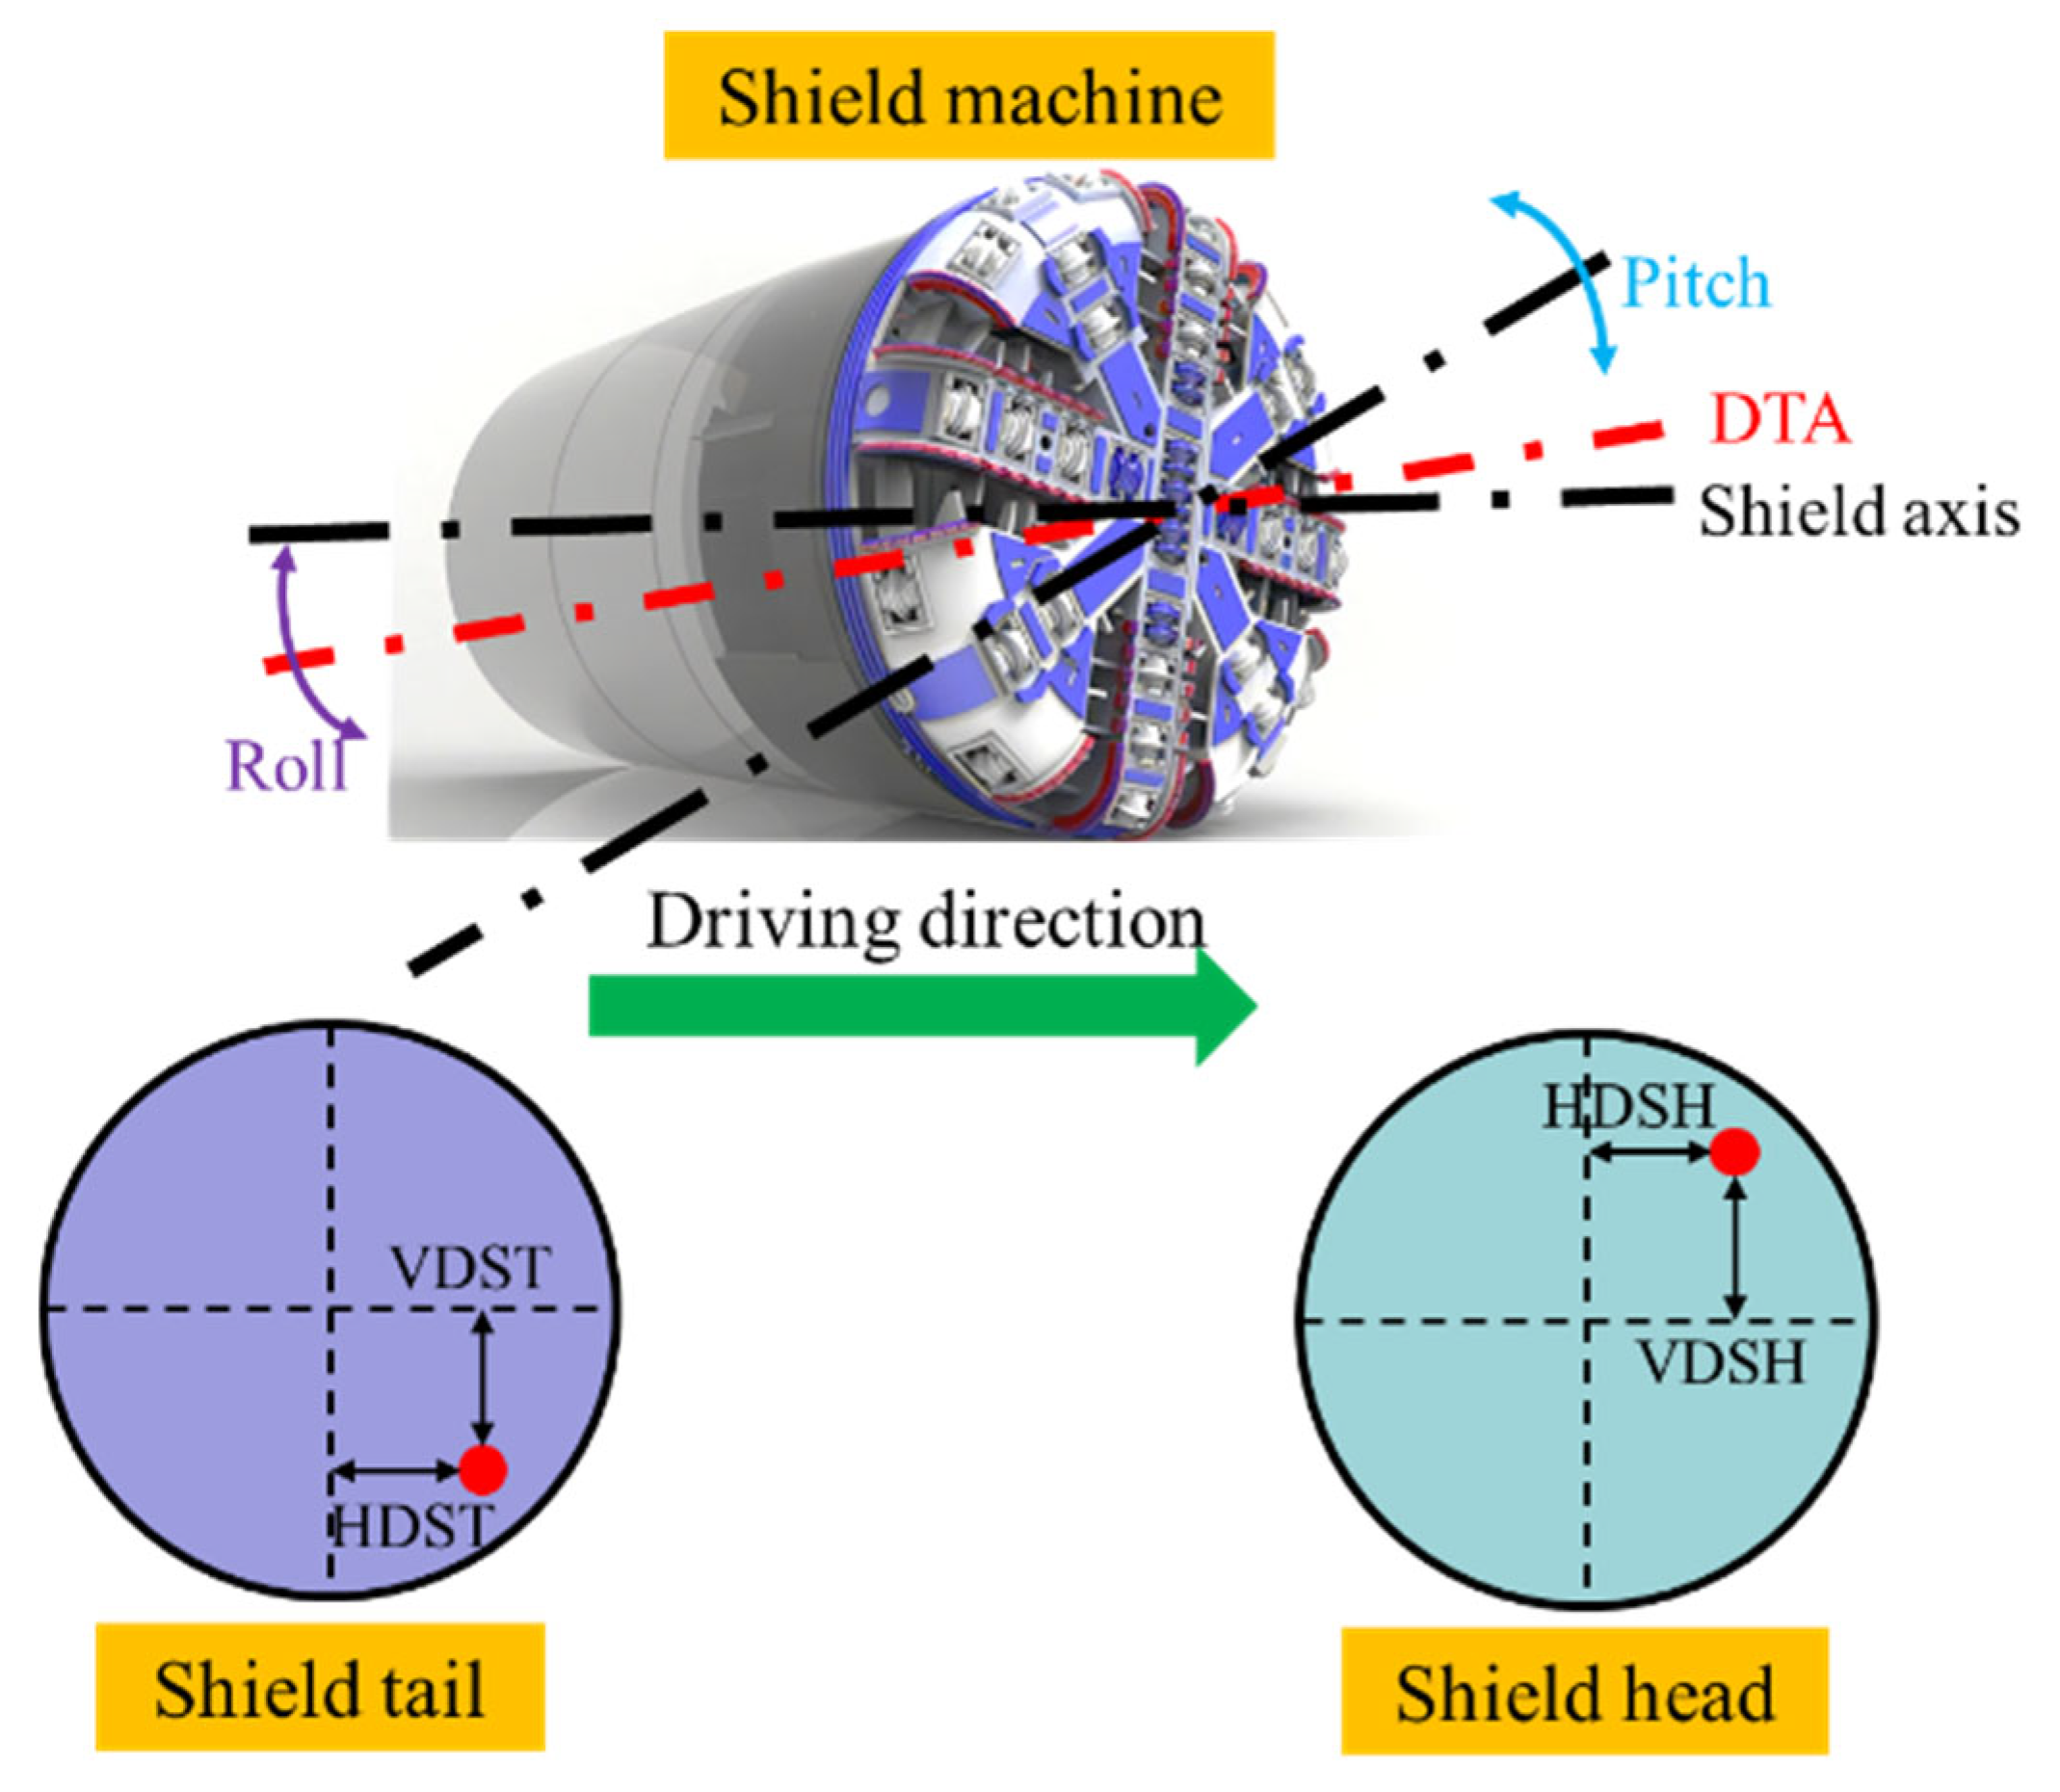
Figure 1. Schematic diagram of the attitude of the shield machine.
Sustainability 17 10604 g001
Figure 2. CCATB model architecture.
Sustainability 17 10604 g002
Figure 3. Calculation process of Channel-Domain Attention mechanism.
Sustainability 17 10604 g003
Figure 4. Transformer model architecture.
Sustainability 17 10604 g004
Figure 5. Calculation process of the BiLSTM model.
Sustainability 17 10604 g005
Figure 6. Decoder architecture of the Transformer-BiLSTM model.
Sustainability 17 10604 g006
Figure 7. Data division.
Sustainability 17 10604 g007
Figure 8. Calculation process of optimal hyperparameters.
Sustainability 17 10604 g008
Figure 9. Prediction flowchart.
Sustainability 17 10604 g009
Figure 10. Loss values for the CCATB model across the training, validation, and test sets.
Sustainability 17 10604 g010
Figure 11. Correspondence between prediction values and measurement for the five models in vertical deviation of the middle shield (a): RF; (b): LSTM-Attention; (c): LSTM; (d): CNN-BiLSTM; (e): CCATB.
Sustainability 17 10604 g011aSustainability 17 10604 g011b
Figure 12. Prediction curve (TB: Transformer-BiLSTM; CA: CNN-Attention).
Sustainability 17 10604 g012
Figure 13. Correspondence between prediction values and measurement for the five models in vertical deviation of the middle shield of different tunneling interval (a): RF; (b): LSTM-Attention; (c): LSTM; (d): CNN-BiLSTM; (e): CCATB.
Sustainability 17 10604 g013
Figure 14. Attitude variation curve of shield tail (a): vertical deviation; (b): horizontal deviation.
Sustainability 17 10604 g014
Figure 15. Attitude variation curve of shield front (a): vertical deviation; (b): horizontal deviation.
Sustainability 17 10604 g015
Figure 16. Correlation coefficient heat map, where A denotes articulated stroke 2; B denotes cohesion; C denotes articulated stroke 3; D denotes articulated stroke 4; E denotes thrust; F denotes cutterhead torque; G denotes soil chamber pressure; H denotes driving speed; I denotes penetration depth; J denotes cutterhead rotation speed; K denotes friction angle; L denotes grouting volume; M denotes articulated stroke 1; and N denotes shield attitude.
Sustainability 17 10604 g016
Table 1. Description of the input variables for the prediction model.
ParametersUnitMaxMinAverage
Cutter rotational speedr/min1.560.000.78
Driving speedmm/min96.000.0048.00
Penetration depthmm82.310.0041.155
Cutter torquekN·m9080.000.004540.00
ThrustkN14,400.000.007200.00
Grouting volumeL2.160.001.08
Chamber earth pressureMPa1.540.120.83
CohesionkPa6.701.744.22
Friction angle°36.5128.9732.74
Articulation stroke [Upper right]mm82.0029.0055.50
Articulation stroke [Lower right]mm95.0036.0065.50
Articulation stroke [upper left]mm96.0036.0066.00
Articulation stroke [lower left]mm85.0032.0058.50
Vertical deviations of the middle shield (absolute value)mm58.000.0029.00
Table 2. Optimal hyperparameters of models.
ModelsOptimal Hyperparameters
RFMaximum number of features = 4, Maximum depth = 5, The number of trees = 20,
The minimum number of samples required for a leaf node = 6
LSTMLSTM layers = 3, Number of LSTM units = 64, Batch size = 32, The number of iterations = 100,
Number of fully connected layers = 1, Dropout rate = 0.5, Learning rate = 0.0001,
Optimizer = Adam, Loss function = MSE, Activation function = ReLu
CNN-BiLSTMFilter size = 32, Kernel = 6, Number of convolution layers = 2; BiLSTM layer = 3,
Number of the BiLSTM units = 32, Each batch = 64, Iteration = 200, Max pooling = 2,
Dense = 1, Learning rate = 0.0001, Dropout rate = 0.5, Optimizer = Adam,
Loss function = MSE, Activation function = ReLu
LSTM-
Attention
Number of hidden LSTM layer units = 10, LSTM layers = 2, Batch size = 20, Iteration = 200,
Max pooling = 2, Learning rate = 0.01, Dense = 1, Dropout rate = 0.2,
Optimizer = Adam, Loss function = MSE, Activation function = ReLu
CCATBFilter size = 64, Kernel = 3, Number of convolution layers = 2; BiLSTM layer = 2,
Number of the BiLSTM units = 64, Embedding Dimension = 256, Hidden Layer Dimension = 256, Feed-Forward Network Dimension = 2048, Number of Attention Heads = 8,
Number of transformer Layers = 6, Each batch = 128, Iteration = 220, Max pooling = 4, Dense = 1, Dropout rate = 0.5, Optimizer = Adam, Loss function = MSE, Activation function = ReLu
Table 3. Prediction results of the models in comparison experiments.
ModelsMAERMSER2
RF3.3624.1070.765
LSTM3.3163.9610.781
CNN-BiLSTM1.5431.9590.946
LSTM-Attention2.0332.5780.907
CCATB0.6250.9390.988
Table 4. Prediction results of the models in ablation experiments.
ModelsMAERMSER2
Transformer1.9822.3340.915
Transformer-BiLSTM0.9641.5270.963
CNN-Attention2.4883.2590.855
CCATB0.6250.9390.988
Table 5. Parameters description.
ParametersTunnel Section 1Tunnel Section 2
Tunnel buried depth/m15.816.4
Maximum thrust/kN14,40015,230
Maximum torque/kN·m90809521
Stratigraphic conditions④4 gravelly sand and ⑤3 medium-coarse sand layers⑤3 medium-coarse sand layers
The frequency of tunneling parameters of shield machines/min11
Table 6. Prediction results of the models in another tunneling interval.
ModelsMAERMSER2
RF4.2684.8970.712
LSTM3.3893.9940.768
CNN-BiLSTM1.3681.8780.950
LSTM-Attention2.1542.6020.895
CCATB0.7450.9910.968
Disclaimer/Publisher’s Note: The statements, opinions and data contained in all publications are solely those of the individual author(s) and contributor(s) and not of MDPI and/or the editor(s). MDPI and/or the editor(s) disclaim responsibility for any injury to people or property resulting from any ideas, methods, instructions or products referred to in the content.