Article

ESG Policy Intensity and Green Innovation: The Moderating Roles of Organizational Slack and Managerial Environmental Awareness

College of Business and Economics, Sejong University, 209, Neungdong-ro, Gwangjin-gu, Seoul 05006, Republic of Korea
*
Author to whom correspondence should be addressed.
Sustainability 2025, 17(23), 10481; https://doi.org/10.3390/su172310481 (registering DOI)
Submission received: 17 October 2025 / Revised: 17 November 2025 / Accepted: 19 November 2025 / Published: 22 November 2025
(This article belongs to the Section Sustainable Management)

Abstract

While the link between Environmental, Social, and Governance principles and corporate outcomes is widely examined, a significant gap exists in understanding how the intensity of national ESG policies translates into firm-level green innovation, particularly within emerging economies. This study addresses several research gaps by asking: How does national ESG policy intensity affect corporate green innovation, and what key factors moderate this relationship? To answer these research questions, this study employs text-mining methods to construct refined ESG indices for both national ESG policy intensity and firm-level managerial environmental awareness. Analyzing a panel dataset of 2854 Chinese A-share listed firms from 2013 to 2023 using fixed-effects models, our findings reveal that higher ESG policy intensity is positively associated with increased green innovation. Moreover, we find that higher levels of organizational slack and greater managerial environmental awareness positively moderate this relationship. By integrating stakeholder theory with the resource-based view and upper echelons theory, this study provides a more nuanced model of the policy–innovation nexus, highlighting that the effectiveness of macro-level ESG policies is contingent on both a firm’s resource capacity and its leadership’s cognitive orientation.

1. Introduction

In recent years, there has been a growing interest in whether Environmental, Social, and Governance (ESG) policies influence a firm’s green innovation [1,2,3]. Unlike conventional environmental regulations that target single pollutants, ESG policies represent a systematic and forward-looking framework with a broader impact on corporate behavior [4]. This is particularly relevant in emerging economies like China, where severe environmental issues have accelerated the evolution of ESG practices [5]. Driven by global sustainability trends and national strategic goals such as “ecological civilization” and “dual carbon” targets, ESG has shifted from a voluntary corporate social responsibility (CSR) initiative to a critical benchmark for national development and corporate green innovation [6,7].
Consequently, academic attention has increasingly focused on the link between ESG policies and green innovation in emerging economies [8]. The Porter Hypothesis suggests that well-designed environmental regulations can stimulate “innovation offsets,” leading to a win-win outcome of improved environmental and economic performance [9,10,11]. In contrast to advanced economies with mature market-based incentives, emerging economies often rely on robust state intervention and command-and-control regulations to promote corporate green innovation [12,13].
Although current studies offer insightful perspectives, several research gaps remain. First, previous research has rarely explored the direct effect of ESG policy intensity on corporate green innovation [7]. Most studies rely on broad ESG rating indices or narrow proxies like pollution fees, which may not adequately capture the nuanced strength and impact of overarching national policies [14]. Second, little attention has been given to the contingency factors that moderate the relationship between ESG policy intensity and green innovation. Specifically, firm-level resource conditions and management’s cognitive orientation toward ESG may significantly influence green innovation outcomes, yet empirical verification of these moderators remains scarce [14]. Third, only a few studies have examined how ESG policies stimulate green innovation within the distinctive institutional context of emerging economies [15].
To address these gaps, this study empirically examines the impact of ESG policy intensity on green innovation in China. Using a text mining approach, we construct a novel index for ESG policy intensity from government work reports and a measure for managerial awareness from corporate annual reports. Our analysis of Chinese A-share listed firms from 2013 to 2023 reveals that higher ESG policy intensity is positively associated with green innovation. Furthermore, this relationship is strengthened by both organizational slack (a resource-level factor) and managerial awareness of sustainability (a cognitive-level factor).
This study offers several contributions. First, we advance the ESG and public policy literature by quantifying ESG policy intensity and empirically validating its positive impact on green innovation, moving beyond conventional proxies. Second, by integrating slack resource theory and upper echelons theory, we identify and test two crucial moderators—organizational slack and managerial awareness—providing a more nuanced understanding of the boundary conditions of this relationship. Our use of text mining to measure managerial awareness is also a methodological innovation. Finally, our findings provide timely evidence on the effectiveness of state-led ESG policy transitions in emerging economies, offering valuable insights for policymakers and corporate managers.
The remainder of this paper is structured as follows. Section 2 reviews the literature and develops our hypotheses. Section 3 outlines the research methodology, including data collection and variable measurement. Section 4 presents the empirical results. Section 5 discusses the findings and their theoretical implications. Finally, Section 6 and Section 7 conclude with practical implications, limitations, and directions for future research.

2. Literature Review and Hypothesis Development

The relationship between environmental policy and corporate innovation has been a central theme in management and policy studies, largely framed by the Porter Hypothesis, which posits that well-designed environmental regulations can trigger “innovation offsets” that enhance competitiveness [16]. However, empirical evidence on this hypothesis remains mixed across different national contexts. While some studies in both developed and emerging economies find a positive link between regulatory stringency and innovation [10,15], others report neutral or even negative effects, citing increased compliance costs that crowd out R&D investment [17]. For instance, research in other emerging markets like India and Brazil has also yielded inconclusive results, highlighting the critical role of country-specific institutional factors and firm-level characteristics [18,19]. This ambiguity suggests that the relationship is not straightforward and is highly contingent on contextual factors.
Prior studies in emerging economies document context-dependent links between environmental/ESG policy and firm green innovation: some report positive effects, whereas others find neutral or even negative outcomes when enforcement, financial depth, industrial structure, and firm heterogeneity differ. This cross-country variation highlights the role of institutional quality and policy consistency in shaping the policy–innovation nexus. For illustration, cross-country BRICS evidence shows that policy stringency and green innovation jointly improve environmental outcomes, while country-specific evidence from India indicates that policy deployment and green innovations are positively associated with sustainable growth [18,19].
Organizational slack represents deployable resources that allow firms to absorb short-term compliance costs and to experiment with long-horizon, uncertain projects. Evidence shows that moderate slack facilitates exploratory R&D, equipment upgrades, and process redesign, thereby enabling firms to convert external policy signals into measurable patenting and process improvements. We therefore treat Slack as a key contingency that can amplify the translation of ESG policy intensity into green innovation.
Building on upper-echelons and attention-based views, managerial environmental awareness (MEA) shapes how managers interpret policy signals and allocate budgets and attention. ESG-aware managers are more likely to treat policy as a strategic opportunity rather than a pure compliance burden, prioritizing green projects in budgeting, staffing, and communication; low awareness, in contrast, tends to yield a minimal-compliance response. MEA thus acts as a cognitive amplifier/filter that determines whether external policy pressure becomes substantive technological and managerial innovation.
This study has several academic contributions. First, instead of firm-level ESG ratings, we construct a national-level ESG policy intensity index (ESGP) via text mining to directly capture policy signal intensity. Second, we place resources (Slack) and cognition (MEA) in a single framework and test their moderating roles in the policy–innovation relationship. Third, we provide evidence from an emerging-economy setting and explicitly discuss how enforcement capacity, disclosure rules, and market structure delimit external validity, offering context-sensitive implications for policy and practice.
A growing body of literature has shifted focus to the comprehensive framework of ESG, moving beyond single-issue environmental regulations. These studies often find a positive correlation between firms’ ESG performance (typically measured by third-party ratings) and innovation outcomes [7,8]. However, two critical gaps persist. First, the literature has paid little attention to the intensity of the overarching national ESG policy itself, often relying on firm-level performance scores as a proxy for external pressure. The direct impact of the policy signal’s strength remains underexplored. Second, there is a need for a more integrated theoretical framework to explain when and why firms respond to these policies. While stakeholder theory offers a powerful lens to understand the external pressures driving ESG adoption [20], it does not fully account for a firm’s internal capacity and willingness to respond.

2.1. ESG Policy and Green Innovation

In policy studies, there has long been discussion about whether government policies promote or hinder a firm’s green innovation. Advocates for strong policies argue that well-designed regulations do not hinder business development but instead incentivize businesses to innovate to offset regulatory costs, a concept known as “innovation offset” [16]. Particularly in emerging economies where corporate social responsibility policies are underdeveloped, government interventions are believed to promote a firm’s green innovation, as companies often innovate to comply with these policies. On the other hand, neoclassical economists argue that such government policies or interventions increase costs for firms, which can, in turn, hinder innovation.
In this paper, we argue that a higher intensity of ESG policies has a positive impact on a firm’s green innovation. We claim that as the intensity of these policies increases, firms are more likely to engage in green innovation as they adapt to comply with regulatory requirements. Based on stakeholder theory, firms should not only create value for shareholders but also consider the interests and demands of various groups affected by or influencing their operations, such as investors, customers, employees, suppliers, governments, communities, and the environment [20]. In the current global trend toward sustainable development, ESG performance has become a central aspect of corporate management, and it increasingly shapes firms’ relationships with these multi-dimensional stakeholders.
Government-regulated ESG disclosure policies leverage the green pressures and demands of external stakeholders to encourage corporate green innovation [21]. Moreover, the promotion of ESG policies encourages green innovation in firms. As responsible investment becomes more prominent, institutional investors, green funds, and rating agencies are increasingly using corporate ESG performance as a standard for investment decisions and risk assessments. Firms with poor ESG performance may face higher financing costs, reduced valuations, or divestment risks, while firms with excellent ESG performance can attract “green capital,” lower financing costs, and gain access to broader financing channels. These external resources are crucial for supporting corporate green innovation [21,22]. To meet the environmental performance requirements of investors, firms are more likely to pursue green innovation, which in turn improves their ESG ratings and market appeal.
While ESG promotion has shifted beyond relying solely on mandatory institutionalized regulations, governments remain significant stakeholders and system planners. Globally, governments are integrating ESG concepts into relevant policies to guide businesses toward sustainable transformation. These measures include establishing green finance standards, requiring environmental information disclosures, and developing industrial green transition plans [21]. The systematic and comprehensive nature of ESG policy frameworks, which account for environmental, social, and governance aspects, provides businesses with a clearer, more stable direction for development. This reduces the risks associated with long-term, high-cost green renewal activities. Disclosure requirements in policies, such as China’s 2018 Green Investment Guidelines, also provide external oversight, minimizing the likelihood of firms engaging in opportunistic behavior.
In an era of high information transparency, environmental and social misconduct by firms can quickly be exposed, damaging their reputation and even leading to the loss of their “operating license” [23,24]. ESG information disclosure is becoming increasingly standardized, making corporate behavior and innovation outcomes more susceptible to external oversight and evaluation. To maintain legitimacy and a good reputation in society, firms have greater incentives to engage in substantive green innovation rather than superficial “greenwashing” [21].
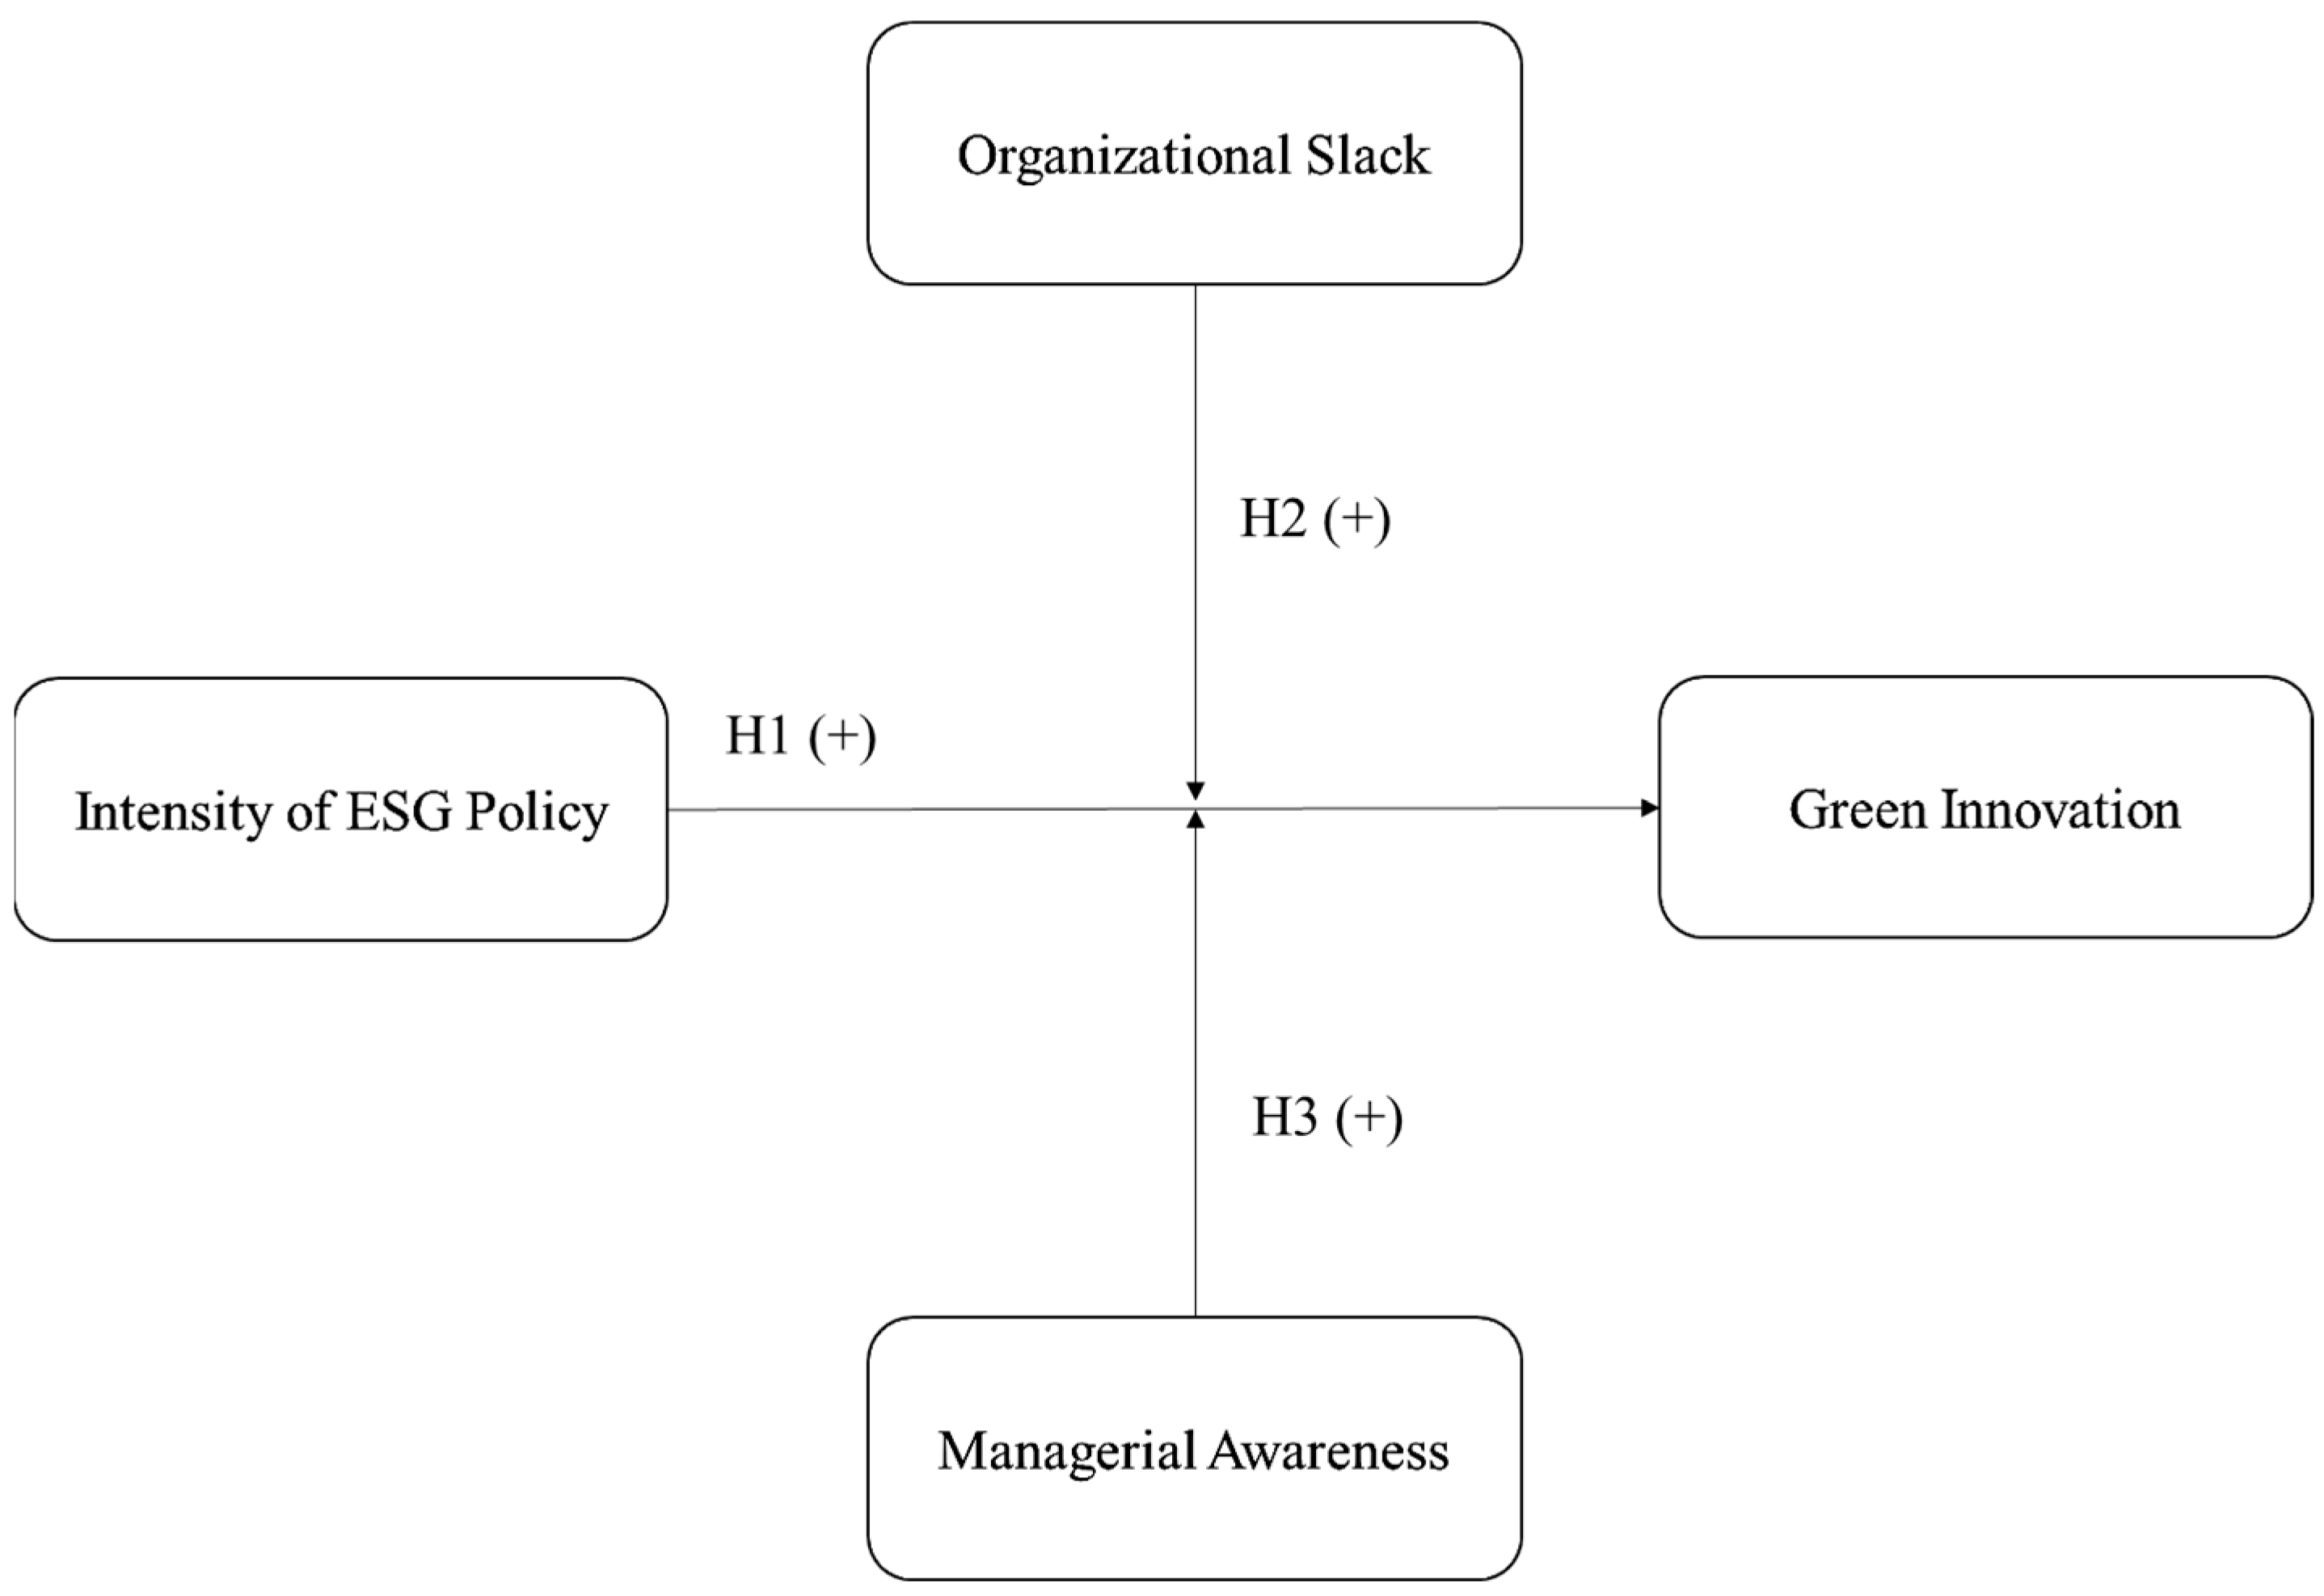
As comprehensive institutional arrangements that integrate pressures from multiple stakeholders, ESG policies possess signal-transmitting and integrative characteristics that disrupt firms’ existing operational inertia. When faced with multiple “pressure-opportunity” scenarios from capital markets, consumers, supply chains, employees, and governments, firms will proactively allocate more resources to green technology R&D and process improvements to meet stakeholder expectations and establish new competitive advantages. With these considerations, we propose the following hypothesis. Figure 1 shows the research model of our study.
H1. 
ESG policy intensity is positively associated with a firm’s green innovation, meaning that as the intensity of ESG policies increases, the firm’s green innovation performance improves.

2.2. The Moderating Role of Organizational Slack

In this paper, based on slack resource theory, we argue that a firm’s organizational slack positively moderates the relationship between ESG policy intensity and green innovation. Organizational slack refers to the excess resources a company holds beyond what is necessary for its daily operations [25]. Organizational slack is considered a critical “lubricant” and “buffer” among all available resources [26]. While these resources may seem redundant at first glance, they serve as an important protective mechanism that enables a company to withstand uncertainties in both internal and external environments, thus providing flexibility for strategic exploration and adjustment.
Green innovation activities are inherently resource-intensive, often requiring significant initial investments, uncertain technological pathways, long return-on-investment cycles, and a high probability of failure [27]. Therefore, whether and how a company engages in green innovation must first consider whether its resources can sustain such endeavors. It is in this context that organizational slack plays a moderating role in the impact of ESG policies on green innovation.
Organizational slack resources provide the necessary support and risk buffers for green innovation driven by ESG policies. When firms face ESG policy pressures, those with abundant slack resources can absorb the high costs and potential risks associated with green R&D without jeopardizing the survival of their core business. These firms are better positioned to allocate financial, human, and material resources toward long-term, foundational green technology innovation projects, enabling them to more effectively respond to policy demands and seize transformation opportunities. In contrast, resource-constrained firms may only be able to afford low-cost, compliance-driven solutions, limiting their ability to engage in substantial, cutting-edge green innovation [28]. Thus, organizational slack enhances a firm’s ability to transform ESG policy pressures into high-investment, high-risk green innovation activities.
Moreover, organizational slack enhances managers’ willingness and strategic flexibility in responding to ESG policies and pursuing innovation. When managers have ample slack, they gain greater strategic flexibility, allowing them to focus on long-term development opportunities rather than being overly concerned with short-term survival issues [29]. As a result, managers are more likely to view ESG initiatives as opportunities for industrial transformation and competitive advantage, rather than burdensome compliance tasks. This shift in perception encourages managers to pursue more radical green innovation activities that align with ESG policy objectives. Organizational slack reduces short-term pressures, allowing managers to perceive ESG policies as strategic opportunities, thereby strengthening the incentive effect of these policies on corporate innovation.
Taken together, organizational slack serves as a contextual factor that influences whether ESG policy pressures can effectively translate into green innovation outcomes. Firms with abundant slack resources are more likely to activate and amplify the innovation-driving potential of ESG policies. Based on these considerations, we propose the following hypothesis:
H2. 
Organizational slack positively moderates the relationship between ESG policy and green innovation.

2.3. The Moderating Role of Managerial Awareness

In this paper, we argue that managerial environmental awareness positively moderates the relationship between ESG policy and green innovation. Building on Upper Echelons Theory (UET), as proposed by Hambrick and Mason (1984) [30], we contend that top management’s awareness and cognition of ESG policies positively influence a firm’s green innovation. Upper Echelons Theory has long suggested that the characteristics, mindset, and cognitive frames of top management teams (TMT) play a significant role in shaping a firm’s performance and strategic decisions [30].
Managerial awareness refers to managers’ attention to, understanding of, and emphasis on integrating ESG-related activities into corporate strategic decisions. External factors, such as new ESG policies, do not automatically translate into corporate strategies. These external signals need to be examined, understood, and evaluated by senior managers before they can influence decisions. This is a subjective process [31]. Managers perceive the world in a particular way, and their perspectives guide the organization’s direction. In this context, the manager’s awareness of ESG policy plays a critical role in driving green innovation.
We argue that managerial awareness of sustainability influences how firms comply with ESG policies and drive green innovation. For instance, a manager’s qualitative evaluation of an ESG policy is influenced by their environmental awareness. Managers with a strong environmental awareness tend to have a greater degree of cognitive complexity and can envision long-term opportunities [32]. They may view ESG policies as opportunities to meet customer needs, enhance the firm’s reputation, reduce compliance risks, and attract long-term investment. These managers are proactive, seeing ESG compliance not as a burden but as a way to shape the firm’s green brand, open new markets, and gain a first-mover advantage. On the other hand, managers with low environmental awareness may view ESG policies as an external “burden” that adds costs without clear benefits, often resulting in minimal compliance or avoidance.
Furthermore, managers’ awareness of sustainability influences their “commitment” to driving green innovation. Due to the inherent uncertainty and complexity of green innovation, it often faces internal resistance and competes for limited resources within the organization. Managers with strong environmental awareness can become “champions” for green innovation, actively securing budgets, assigning talent, and communicating the importance of green innovation throughout the organization. In contrast, managers who lack environmental awareness may lack the intrinsic motivation to push for such change, especially when faced with policy pressures.
Prior studies also highlight the role of formal environmental management systems as a concrete manifestation of firms’ internal “practice” conditions. Certifications such as ISO 14001 [33] signal that a firm has established standardized procedures for monitoring, controlling, and improving its environmental performance, which can lower the marginal cost of responding to new ESG policy requirements and facilitate the implementation of green innovation projects.
Thus, managerial ESG awareness acts as an “amplifier” or a “filter” that determines how effectively external ESG policy signals resonate within the organization. A strong policy signal reaches a manager who is highly sensitive to environmental issues, amplifying the impact of that signal and leading to more substantive green innovation. Therefore, we propose the following hypothesis, and Figure 1 presents the research model of this study.
H3. 
Managerial awareness positively moderates the relationship between ESG policy and a firm’s green innovation.

3. Research Design

3.1. Data Collection

China is widely regarded as an emerging market economy according to established international classifications. The International Monetary Fund (IMF) groups China within its “emerging market and developing economies” [34], while the World Bank classifies China as an “upper-middle-income” country rather than an advanced economy [35]. In addition, major global index providers such as MSCI and FTSE Russell consistently include China in their Emerging Markets index families, where China accounts for one of the largest constituent weights [36]. These widely recognized classifications support treating China as a representative emerging market context, providing an appropriate setting for examining how regulatory intensity influences firms’ green innovation responses.
Our study focuses on A-share listed firms on the Shanghai and Shenzhen stock exchanges from 2013 to 2023. This period was chosen as it marks a significant intensification of China’s “ecological civilization” policies, providing a suitable quasi-natural experimental setting. The data were compiled from multiple authoritative sources. Corporate financial and governance data were obtained from the Guotai An (CSMAR) and WIND databases. Data for our dependent variable, corporate green innovation, were sourced from the China Research Data Service Platform (CNRDS), which identifies green patents based on the WIPO Green List.
The initial sample was subjected to a rigorous screening process to ensure data quality and comparability: (1) firms in the financial and real estate industries were excluded due to their unique financial structures; (2) firms designated as “ST” or “*ST” (indicating financial distress) were removed; (3) firms with IPOs within the sample period were omitted to avoid distortions from initial market fluctuations; and (4) observations with missing data for key variables were dropped. This process resulted in a final unbalanced panel dataset comprising 21,896 firm-year observations from 2854 firms.

3.2. Variables

3.2.1. Dependent Variable

Green Innovation (GI). Following established literature [37,38], we measure green innovation by the number of green patent applications filed by a firm in a given year. The data are sourced from CNRDS, which classifies patents as “green” according to the WIPO’s International Patent Classification Green List. To mitigate skewness, we use the natural logarithm of (1 + the number of green patent applications).

3.2.2. Independent Variable

ESG Policy Intensity (ESGP). To capture the annual strength of national-level ESG policy, we constructed an index using text-mining analysis of China’s annual Government Work Reports from 2013 to 2023. As the most authoritative policy document, this report signals the central government’s strategic priorities. The construction process involved three steps: First, we developed a comprehensive ESG keyword dictionary covering environmental (e.g., “ecological civilization,” “carbon neutrality”), social (e.g., “social responsibility,” “work safety”), and governance (e.g., “corporate governance,” “marketization”) dimensions. Second, using Stata/MP 18 (StataCorp LLC, College Station, TX, USA), we calculated the frequency of these keywords in each year’s report. Finally, to ensure comparability across years, we normalized this frequency by dividing it by the total word count of the report, creating a standardized annual ESG policy intensity index.

3.2.3. Moderating Variables

Organizational slack is measured as the ratio of “Current Assets minus Current Liabilities” to “Total Assets,” based on data from firms’ annual reports. This ratio captures readily deployable resources after meeting short-term obligations and is standard in the slack-resource literature. To limit the influence of outliers, the measure is winsorized at the 1st and 99th percentiles. We expect Slack to strengthen the translation of policy pressure into green innovation by providing discretionary resources for R&D and adoption.
Managerial Environmental Awareness is constructed from content analysis of the MD&A section in annual reports. We create a sustainability keyword list (e.g., “environmental protection”, “green”, “low-carbon”, “emission reduction”, “energy saving”, “carbon neutrality”, including close Chinese synonyms), tokenize the text, remove stop words, harmonize word forms, and exclude boilerplate elements such as tables and signature pages. MEA equals the share (percentage) of sustainability terms relative to total MD&A words, so higher values indicate stronger managerial attention to environmental issues. A manual audit conducted on a randomly selected subsample provides evidence of the measure’s accuracy and coverage, with additional validation procedures detailed in Section 3.2.5.

3.2.4. Control Variables

We include a set of control variables known to influence corporate innovation [39]. Firm Size (Size) is the natural logarithm of total assets. Firm Age (Age) is the natural logarithm of the years since establishment. Leverage (Lev) is total liabilities divided by total assets. Profitability (ROA) is net profit divided by the average total assets. R&D Intensity (RD) is R&D expenditure divided by operating revenue. State-Ownership (SOE) is a dummy variable equal to 1 for state-owned enterprises and 0 otherwise. Board Size (Board) is the natural logarithm of the number of board members.

3.2.5. Construct Validity and Text-Mining Approach

We validate ESGP and MEA through proportional normalization by document length, stop-word removal, and stemming, and we manually audit a random subsample (n = 100 firm-years). Results are robust to alternative dictionaries and to excluding rare tokens (Table 1).

3.3. Estimation Methodology

The estimation model used in this study is as follows.
G I i t = α + β 1 S l a c k i t + β 2 M E A i , t 1 + β 3 E S G P t 1 × S l a c k i t + β 4 E S G P t 1 × M E A i , t 1 + γ X i t + μ i + λ t + ε i t
This model examines the determinants of corporate green innovation for firm i in year t. The dependent variable G I i t measures the level of green innovation, captured by the number of green patent applications. The coefficient β 1 reflects the direct effect of organizational slack, which represents a firm’s available discretionary resources that can support innovation activities. The lagged managerial environmental awareness, M E A i , t 1 , captures the capacity of management to recognize and prioritize environmental issues, and its direct effect on green innovation is given by β 2 .
To assess how environmental regulatory pressure moderates these relationships, we include two interaction terms. The coefficient β 3 identifies whether firms with greater organizational slack adjust their green innovation activities differently in response to changes in ESG policy intensity. Likewise, the coefficient β 4 on the interaction term E S G P t 1 × M E A i , t 1 evaluates whether firms with higher managerial environmental awareness respond more strongly to regulatory pressure. The vector X i t includes standard firm-level control variables, while μ i and λ t denote firm and year fixed effects, respectively, accounting for unobserved heterogeneity across firms and time. The error term ε i t captures residual unexplained variation.
Because ESG policy intensity ( E S G P ) is constructed as a national-level index derived annually from the central Government’s Work Report, it takes the same value for all firms within a given year. Consequently, when year fixed effects ( λ t ) are included, the main effect of ESGP becomes perfectly collinear with the year dummies and cannot be separately identified. Therefore, in specifications that include year fixed effects, we focus on the interaction terms E S G P t 1 × S l a c k i t   a n d   E S G P t 1 × M E A i , t 1 , which allow us to capture how heterogeneous firms adjust their green innovation activities in response to changes in national ESG policy intensity.
Because ESG policy intensity (ESGP) is constructed as a national-level annual index based on the central Government Work Report, it varies only across years and not across firms. In the baseline linear specification, we therefore include firm fixed effects but exclude year fixed effects, which allows us to estimate both the main effect of ESGP and its interactions with Slack and MEA. Including year fixed effects in these linear models would make the ESGP main effect perfectly collinear with the year dummies and thus not separately identifiable. For this reason, any specification that includes year fixed effects focuses solely on the interaction terms. As a robustness check, Section 4.3 reports a Poisson pseudo-maximum likelihood (PPML) model that absorbs both firm and year fixed effects and examines the interaction terms while acknowledging that the ESGP main effect cannot be identified under this specification.
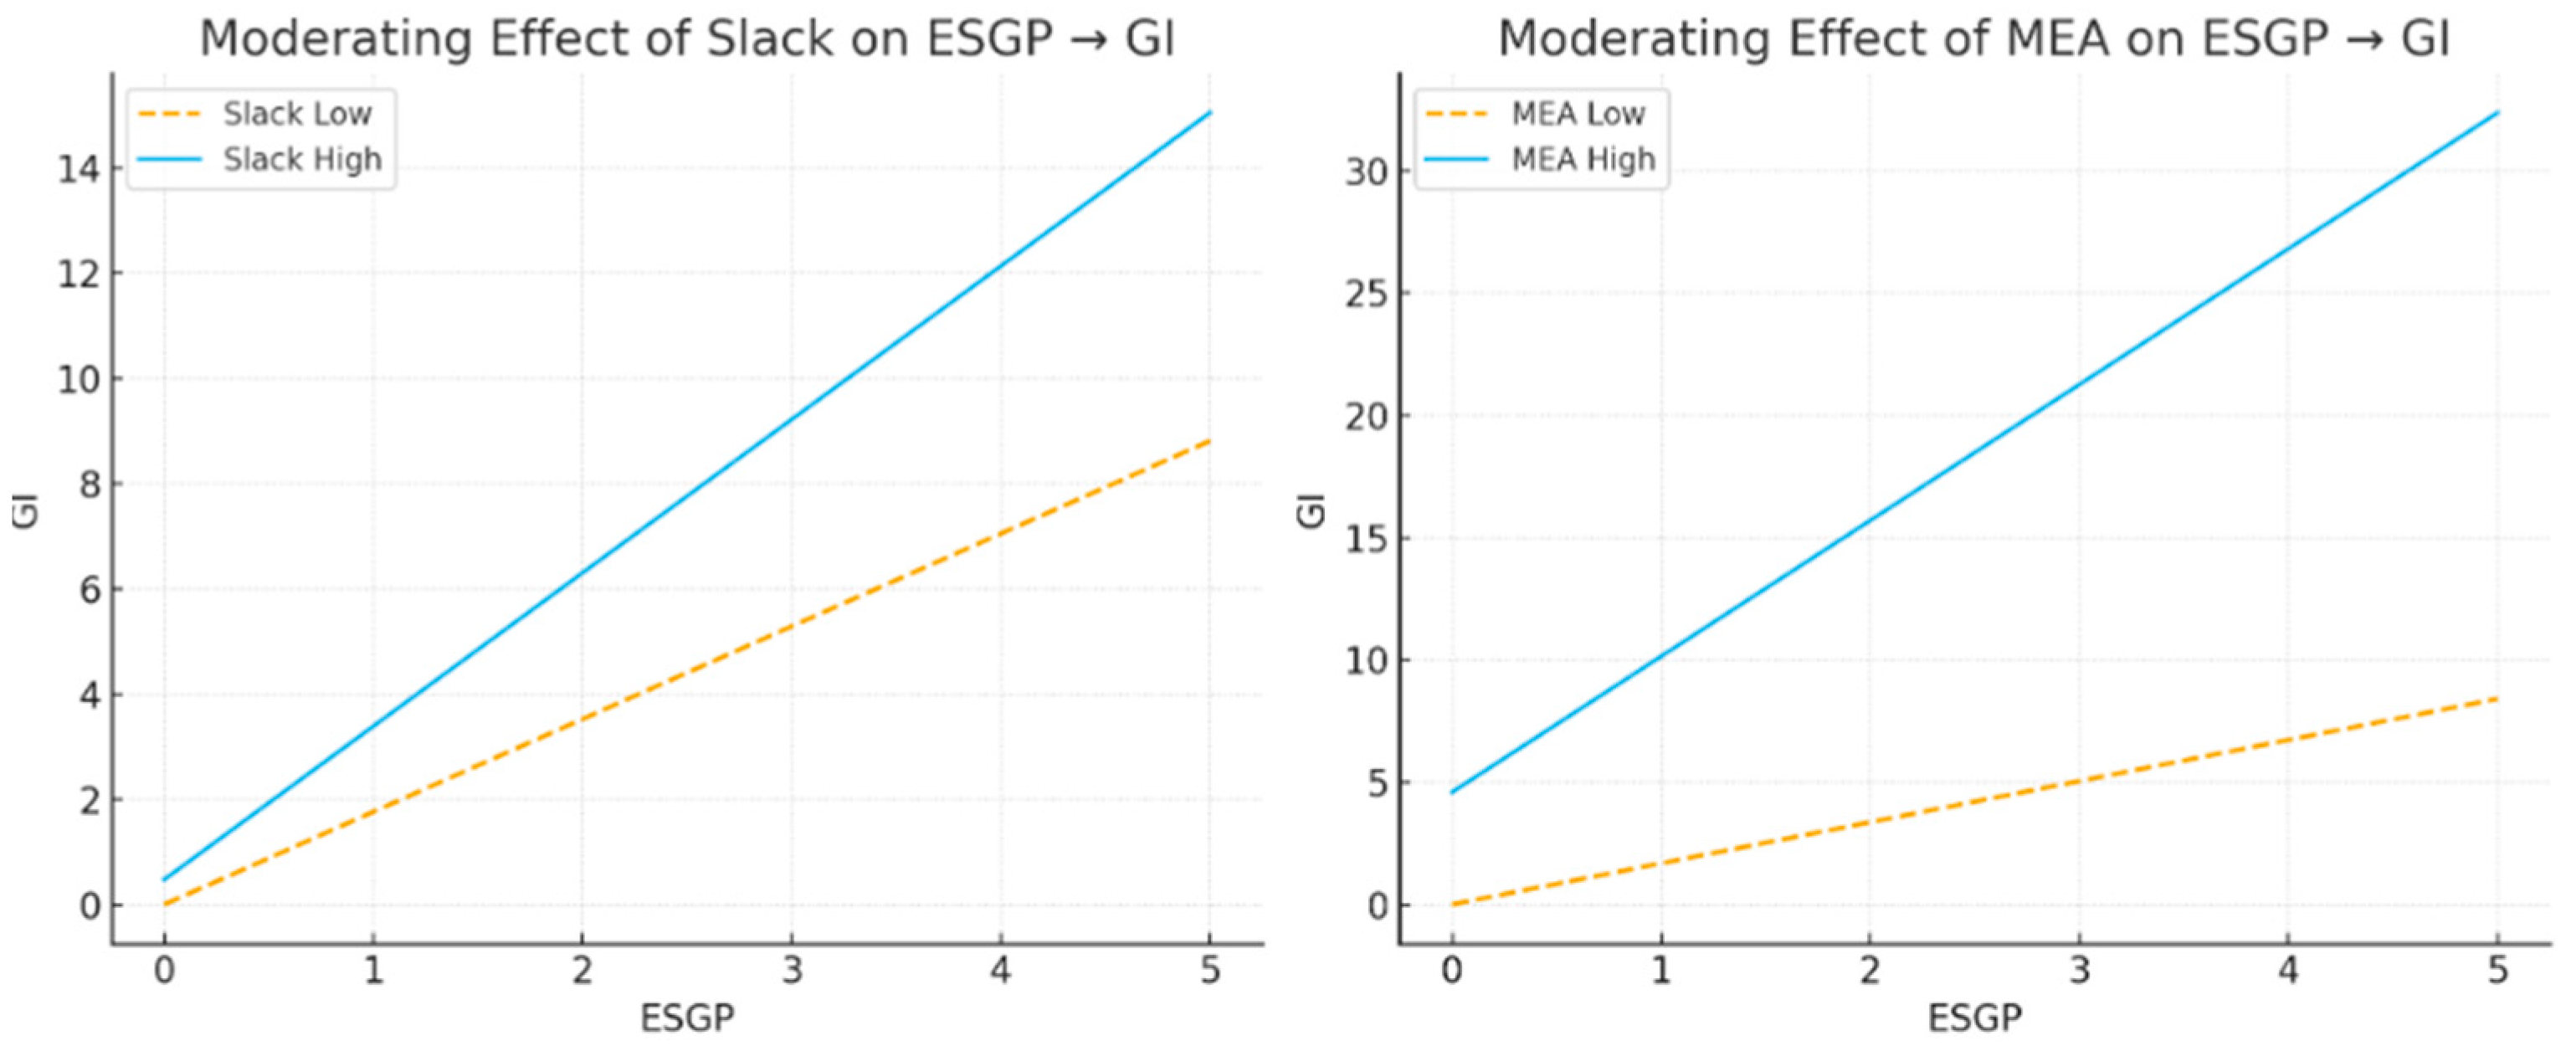
Before creating interaction terms, the continuous variables (ESGP, Slack, and MEA) are mean-centered to facilitate interpretation. In the marginal-effects figures, the “high” and “low” levels are defined as one standard deviation above and below the mean, respectively. All baseline linear regressions include firm fixed effects to control for time-invariant firm heterogeneity, with standard errors clustered at the firm level.
We do not include year fixed effects in the baseline linear models because ESG policy intensity (ESGP) is constructed as a national-level annual index that varies only across years but not across firms. Including year dummies would make the ESGP main effect perfectly collinear with the year fixed effects, and it would therefore be impossible to identify the main effect separately. To address robustness to common temporal shocks, Section 4.3 further estimates a Poisson pseudo-maximum likelihood (PPML) model that absorbs both firm and year fixed effects and focuses on the interaction terms as an additional robustness check.

4. Results

4.1. Descriptive Statistics and Correlation Analysis

Table 2 shows the descriptive statistics of all the primary study variables, including the number of observations N, Mean, std. Dev, Min, Max. Sample data were 21,896 obs. from 2854 firms for the years 2013–2023. Table 3 shows the correlation matrix between the variables we mainly use.

4.2. Hypotheses Testing Results

Before conducting hypothesis testing, we first performed a variance inflation factor (VIF) test on the data to check for multicollinearity issues. As shown in the table, the VIF values for all variables are far below the acceptable level of 10 [40], indicating that our research model does not exhibit multicollinearity issues.
Table 4 reports the hypothesis testing results from the baseline firm fixed-effects regressions without year dummies. This specification allows us to estimate both the main effect of ESG policy intensity (ESGP) and its interactions with organizational Slack and managerial environmental awareness (MEA). Because ESGP is constructed as a national-level annual index that takes the same value for all firms each year, including year fixed effects in these linear models would make the ESGP main effect perfectly collinear with the year dummies and therefore not separately identifiable. We therefore present the baseline estimates without year fixed effects so that the coefficient on ESGP in Model (1) can be interpreted as the average response of green innovation to changes in national ESG policy intensity, while Models (3) and (5) add the interaction terms ESGP × Slack and ESGP × MEA to test H2 and H3. In Section 4.3, we further estimate a PPML model with firm and year fixed effects.
The coefficient of the main independent variable, ESGP, in Model 1 is 1.854. Given that the standard deviation of ESGP is 0.015 (from Table 2), this result suggests that a one-standard-deviation increase in ESG policy intensity is associated with an increase of approximately 0.0278 (1.854 × 0.015) in the log of green patent applications. This translates to an approximate 2.8% increase (e^(0.0278) − 1) in a firm’s green patent count, holding all other variables constant. Similarly, the significant interaction terms indicate that in firms with higher organizational slack or greater managerial environmental awareness, the impact of policy intensification on green innovation is even more pronounced. These results highlight that while ESG policy serves as a catalyst, its real-world impact is economically meaningful and amplified by firm-level conditions.
Beyond the point estimate, we also examine the statistical uncertainty and standardized effect size. Based on the standard error of 0.512 reported in Model (1), the 95% confidence interval for the ESGP coefficient ranges from 0.85 to 2.86. This implies that a one-standard-deviation increase in ESGP (0.015) increases the log of green patent applications by approximately 0.013–0.043, which corresponds to about a 1.3–4.4% rise in the number of green patents. Using the standard deviation of the dependent variable GI (1.108) as a scaling factor, the standardized effect (β_std) of a one-standard-deviation change in ESGP is around 0.025, with a 95% confidence interval of roughly 0.012–0.039. Taken together, these estimates indicate a small-to-moderate but economically meaningful policy effect (Figure 2).

4.3. Robustness Test

To validate the reliability of our baseline findings, we conducted a series of robustness checks, including heterogeneity analysis as well as alternative model specifications and variable measurements.
First, we performed a heterogeneity test with respect to ownership structure. Owing to differing policy response mechanisms between state-owned enterprises (SOEs) and non-SOEs, we excluded SOE observations and re-estimated the model using only non-SOE samples. As reported in Table 5, the coefficient of ESGP remains positive and statistically significant across all model specifications, again supporting H1. In Model (3), the interaction term ESGP × Slack is positive and significant, confirming H2. In Model (5), the coefficient on ESGP × MEA is also significantly positive, supporting H3. These results suggest that our core conclusions are robust and continue to hold even for non-state-owned enterprises, which often face distinct institutional pressures and resource constraints.
Second, we conducted additional robustness tests summarized in Table 6. To better address potential reverse causality, we lagged all explanatory and moderating variables by one year and re-estimated the models; the main coefficients of interest remained stable in sign and significance. We then examined model sensitivity by changing and augmenting the set of control variables, and our results did not materially change. Furthermore, we reconfirmed our estimation strategy by performing a Hausman test comparing fixed-effects and random-effects estimators. The test strongly rejects the null hypothesis (Chi-square = 15.67, p = 0.003), confirming the appropriateness of the firm fixed-effects specification. Finally, we re-estimated the models using alternative functional forms, such as logarithmic transformations for skewed continuous variables, and obtained qualitatively similar results. Overall, across these alternative specifications reported in Table 4, Table 5 and Table 6, the coefficients of ESGP and its interaction terms with Slack and MEA remain positive and statistically significant, with magnitudes comparable to the baseline estimates, indicating that our main findings are robust within the class of linear fixed-effects models.
Finally, we further assess robustness by estimating a Poisson pseudo-maximum likelihood (PPML) model with firm and year fixed effects and standard errors two-way clustered by firm and year. The results are reported in Table 7. In this specification, the main effects of Slack and MEA remain positive, and managerial environmental awareness is statistically significant at the 5% level. However, the interaction terms ESGP × Slack and ESGP × MEA become negative, and only the latter is marginally significant at the 10% level. This pattern suggests that the high-dimensional PPML estimator is sensitive to the sparse and highly skewed distribution of green patent counts as well as to the limited time-series variation in ESGP, so the moderating effects are less stable under this alternative functional form. We therefore treat the PPML results as a conservative sensitivity check rather than as our primary evidence, and we continue to base our main conclusions on the linear fixed-effects models with ln(1 + GI) as the dependent variable.

5. Discussion

This study explored whether the intensity of ESG policies influences a firm’s green innovation using a sample of Chinese listed firms from 2013 to 2023. Our results indicate that the intensity of ESG policies is positively associated with a firm’s green innovation. We also found that organizational slack and managerial awareness positively moderate this relationship.
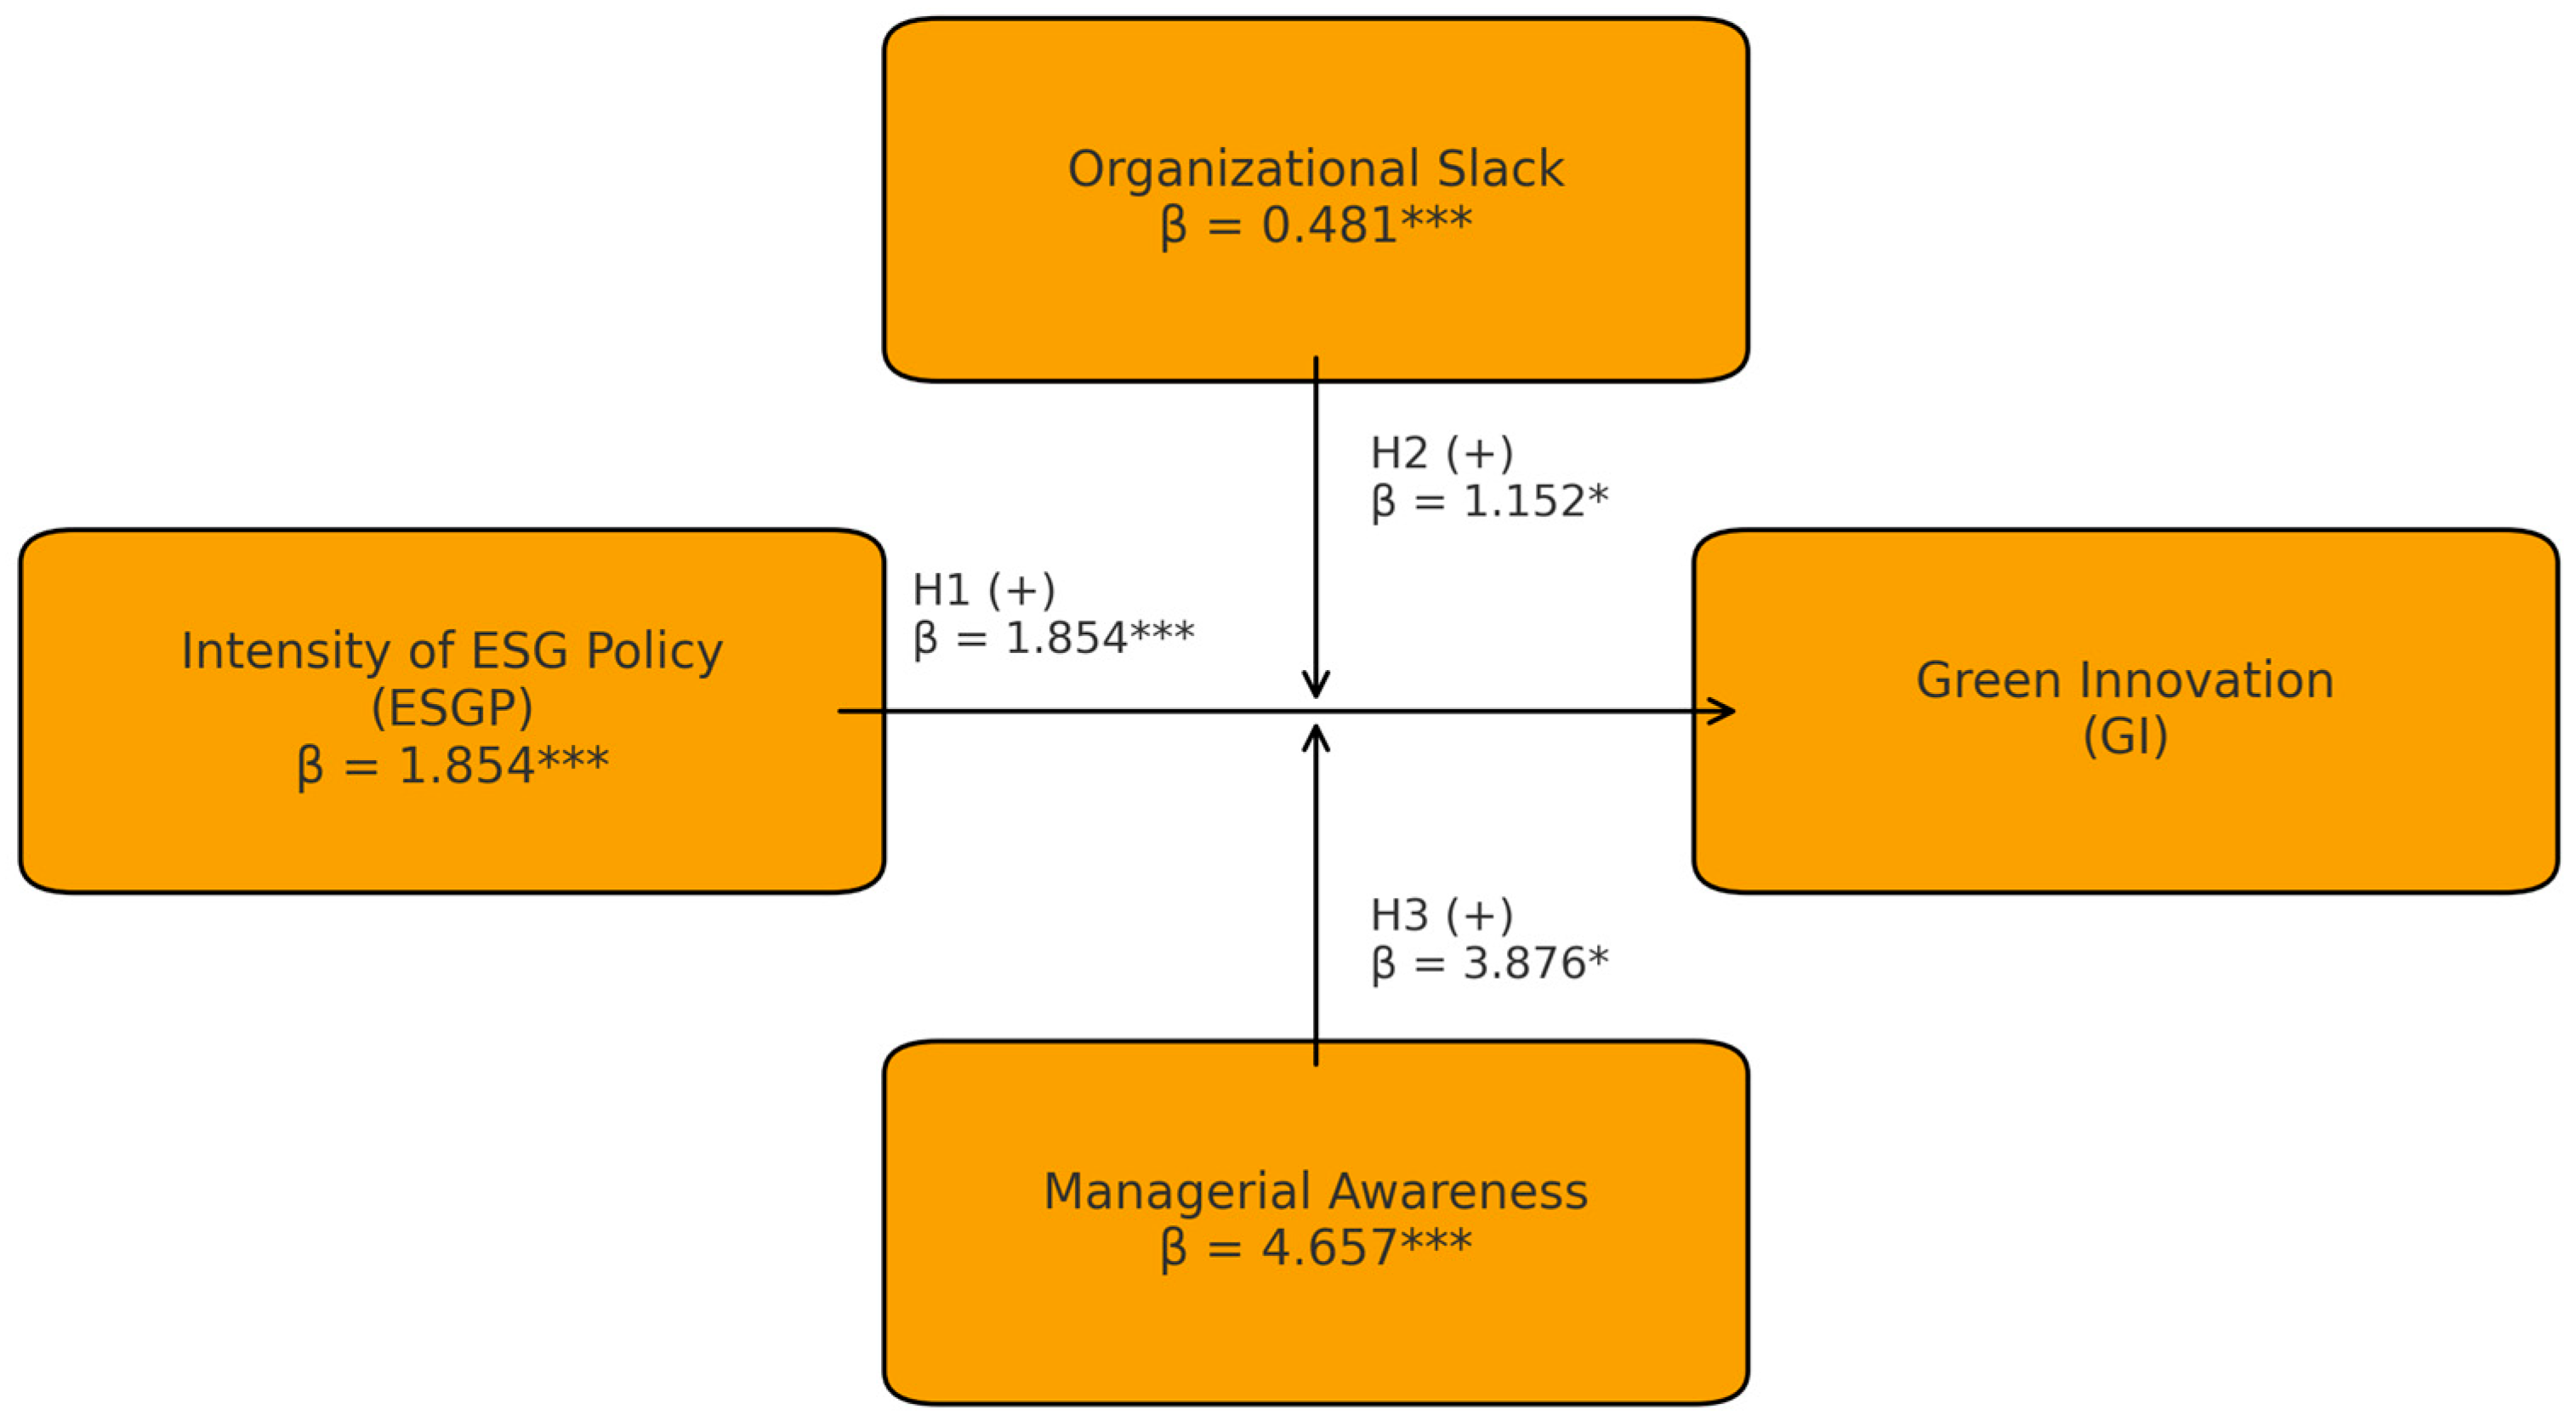
Taken together, this study empirically investigates the relationship between ESG policy intensity and corporate green innovation, with particular attention to the moderating roles of organizational slack and managerial environmental awareness. Figure 3 presents a visual summary of our theoretical framework and the empirically supported paths. In Figure 3, each path is labeled with the estimated coefficients from the baseline firm fixed-effects regressions reported in Table 4, along with the conventional significance indicators (* p < 0.1, ** p < 0.05, *** p < 0.01). This presentation enables the figure to summarize not only the hypothesized relationships (H1–H3) but also the effect sizes and statistical significance of ESG policy intensity and its interactions with organizational slack and managerial environmental awareness on green innovation.

6. Conclusions

6.1. Theoretical Implications

Our study provides several important contributions to the literature. First, this study contributes to policy studies and ESG research by providing empirical evidence of the relationship between ESG policy intensity and green innovation. Based on stakeholder theory and policy study rationales, our findings suggest that a higher intensity of ESG policy is positively associated with a firm’s green innovation, providing strong empirical support for this link within the context of an emerging economy like China. Most previous studies related to ESG have focused on ESG scores or indices and their impact on green innovation. However, the intensity of ESG policies and their effects on green innovation have rarely been explored. To the best of our knowledge, only Yan et al. (2024) explored the relationship [41]. The measurement of ESG policy intensity, through refined techniques such as text mining, overcomes this research gap and offers empirical insights into how ESG policy intensity drives green innovation.
Our findings indicate that stronger ESG policies lead to better green innovation performance. In other words, when governments express a strong commitment to ESG policies, firms respond by improving their green innovation. This result aligns with our hypotheses and previous research. According to policy studies, when the intensity of government policies increases, their enforcement and coercive power are strengthened, leading businesses to more actively fulfill their environmental responsibilities. As governments provide clearer policy direction and expectations, firms are more likely to adopt innovative technologies and environmentally friendly management strategies.
This aligns with the Porter hypothesis and stakeholder theory, which argue that strong regulations can enhance a firm’s competitiveness [42]. In other words, “the greater the ESG policy intensity, the greater the green innovation.” Unlike most previous studies, this research fills a gap by empirically testing the impact of ESG policy intensity on green innovation using refined measures. This constitutes a significant academic contribution to ESG research.
Second, our study contributes to both ESG research and management studies by empirically testing the moderating role of organizational slack and managerial awareness. We investigate which variables moderate the relationship between ESG policy intensity and green innovation—something that has been largely overlooked in prior research. By integrating slack resource theory and Upper Echelons Theory, we show that these two moderating variables strengthen the relationship between ESG policy intensity and green innovation.
Our findings align with prior research on innovation. We found that organizational slack encourages green innovation. Previous studies have shown that firms with slack resources are more likely to experiment with innovative ideas and adopt new technologies, especially those requiring higher investments [43]. Organizational slack provides the flexibility necessary for firms to engage in green technology and strategies that may otherwise be unaffordable [44]. In this sense, our findings suggest that organizational slack does not just enable firms to undertake expensive and risky green innovation initiatives; it also plays a crucial role in helping firms meet the challenges posed by ESG policies [45].
As such, organizational slack enables firms to better comply with ESG policies and take on the risks required for green innovation. By providing a buffer against the uncertainty and resource constraints typically associated with green innovation, slack resources allow firms to invest in long-term, transformative projects that align with ESG objectives. Our results imply that firms with abundant organizational slack can absorb the costs and risks associated with green R&D, helping them meet the expectations set by ESG policies while maintaining operational stability. As a result, organizational slack facilitates the smooth integration of ESG goals into business strategies, ultimately facilitating green innovation.
Additionally, our findings show that management’s understanding of its responsibility toward ESG also strengthens the relationship between ESG policy intensity and green innovation. Through text mining, we extracted insights from CEO messages on CSR, ESG, and sustainability. Our results show that managerial awareness and cognition positively moderate the relationship. This aligns with Upper Echelons Theory, which asserts that the characteristics, experiences, and mindset of top management teams (TMT) influence organizational strategies and performance.
Our results suggest that when CEOs have a high commitment toward ESG policies, firms are more likely to pursue green innovation, as their strategic decisions align with environmental responsibility. When top management actively engages with ESG issues, firms tend to adopt more innovative, environmentally friendly strategies, thus promoting green innovation. The results also present a significant contribution by integrating ESG policy intensity and management theory to explore the mechanisms that enhance green innovation. Our refined methodology, including the use of text mining to capture CEO awareness, represents a novel approach in ESG research, where such methods are rarely applied.
Finally, our study contributes to the literature by answering whether ESG policies are effective in emerging economies. In policy studies, there has been an ongoing debate regarding the effectiveness of strong regulatory policies versus market-based incentives in emerging economies [10], where ESG and CSR policies are still in the nascent stages. Some argue that in such economies, government interventions and strong policies are more efficient at driving green innovation [17,46,47]. In contrast, neoclassical economists argue that such policies increase corporate costs, hindering innovation [48,49,50].
Our findings suggest that high ESG policy standards positively influence green innovation performance in emerging economies. Specifically, in these economies, government intervention remains a significant driver of green innovation. This is consistent with the principle that government policies in emerging economies provide important incentives for firms to innovate, especially since these countries often face resource limitations and slower technological development. Strong government policies offer a crucial stimulus for firms to adopt green technologies and strategies. Our results confirm that government intervention plays a vital role in driving green innovation in these economies [17], aligning with extant research, which emphasizes the importance of government policy in fostering green innovation. While our findings are most applicable to economies with similar regulatory and institutional characteristics, future research could explore whether the observed effects generalize to other contexts. Nevertheless, our study offers valuable insights into the role of ESG policy intensity in emerging economies and contributes to a deeper understanding of how ESG policies shape green innovation.

6.2. Practical Implications

While rooted in the Chinese context, the findings of this study offer potentially valuable insights for policymakers and corporate managers in other emerging economies facing similar sustainability transitions. Governments and regulatory bodies should steadfastly promote and optimize the ESG policy framework. Our study affirms the central role of comprehensive ESG policies in driving the green transition of the real economy. Governments should maintain policy consistency and stability to send clear, long-term green development signals to the market. Further enhancements could include refining ESG disclosure standards to improve policy transparency and enforcement. They should also shift from a “one-size-fits-all” approach to “precision policymaking.” Our moderation results are a crucial reminder that policy effectiveness is highly heterogeneous across firms. This calls for policy design that goes beyond universality to address firms’ specific circumstances. For instance, for SMEs or firms in specific sectors that have strong innovative intent but lack resources, the government could establish specialized green innovation funds, offer R&D tax incentives, and build industry–university–research collaboration platforms to help them overcome resource barriers, thus ensuring policy is both inclusive and equitable. In terms of external validity, the findings of this study are most applicable in contexts that resemble China in terms of policy enforcement, ESG disclosure practices, and a government-driven regulatory environment. In contrast, countries that differ significantly in institutional characteristics—such as the level of rule of law, financial market development, corporate governance structures, or market competition—may experience weaker or stronger effects than those documented in this study. These institutional variations can either attenuate or amplify the relationship between ESG policy intensity and green innovation. Future research would therefore benefit from comparative analyses across diverse institutional settings to more fully assess the generalizability of our results.
Focus on “policy communication” and “cognitive guidance.” Managerial cognition is a critical link in policy implementation. Therefore, the government’s role should extend beyond issuing documents. It should actively communicate the strategic value and business opportunities of ESG to the corporate world through high-level forums, official media campaigns, and collaborations with industry associations and business schools. This can help shift managerial mindsets from a cost-based “passive compliance” perspective to a value-creation “proactive leadership” one.
For corporate managers and boards of directors, view ESG as a strategic opportunity, not a compliance burden. This study suggests that proactively responding to ESG policies can be a viable path toward generating long-term competitive advantages, turning regulatory pressure into a strategic opportunity. Firms should deeply embed the ESG philosophy into their corporate governance, strategic planning, and daily operations, using external pressure as a catalyst for internal transformation. Proactively build and manage “organizational slack” as a strategic resource. Boards and executive teams should move beyond the traditional view of slack as mere “inefficiency” and instead consciously cultivate a moderate buffer of financial and human resources. This “strategic redundancy” serves not only as a shock absorber against risks but also as a vital power source that enables the firm to undertake long-term, high-risk innovative exploration in an uncertain environment.
Vigorously enhance the environmental awareness and strategic vision of the top management team. Corporations should make sustainability literacy and environmental awareness a key criterion in the selection, appointment, and evaluation of their senior executives. Firms can systematically elevate the cognitive level of their decision-makers by appointing independent directors with environmental expertise, organizing strategic workshops on sustainability, and linking executive compensation to sustainability performance. Ultimately, it is the vision and determination of its leaders that will decide whether a firm can thrive in the great tide of green transformation.
7. Limitations and Future Research Direction

While this study offers meaningful contributions, it also has several limitations that provide avenues for future research. First, the generalizability of our findings is constrained by using publicly listed A-share firms in China as our sample. These firms are typically larger, more established, and more closely monitored by regulators, and therefore may respond to ESG policies differently from smaller or unlisted firms. Moreover, China’s institutional, regulatory, and capital market environment has unique characteristics that may not be representative of other emerging economies. To strengthen cross-national validity, future studies could broaden the sample by including SMEs and firms from other emerging markets—such as India, Brazil, or Southeast Asian economies—to examine whether the observed relationships hold under different institutional conditions. Such comparative analyses would help validate the external applicability of our model and deepen understanding of the ESG–green innovation linkage across diverse contexts.
Secondly, our methodology of using text frequency analysis to measure managerial environmental awareness also has inherent limitations. Although the text-based indicator derived from word frequency in MD&A documents provides a scalable and relatively objective proxy, it cannot fully capture the depth of managers’ actual intentions, interpretations, or strategic commitment to environmental issues. Word-frequency metrics may be influenced by stylistic conventions, disclosure requirements, or communication strategies, which introduce potential bias and raise concerns regarding construct validity. This approach cannot clearly distinguish genuine managerial commitment from superficial “greenwashing.” To address these concerns, future research could enhance construct validity by triangulating this measure with qualitative evidence, such as managerial interviews, or by adopting more advanced Natural Language Processing (NLP) techniques—such as sentiment analysis, contextual embeddings, or topic modeling—to more accurately capture managerial cognition and environmental orientation.
Third, potential endogeneity concerns may still remain. We have taken several steps—such as lagging all explanatory variables and employing a fixed-effects model—to mitigate time-invariant unobserved heterogeneity. However, reverse causality cannot be completely ruled out. For example, highly innovative firms may lobby for or influence the development of stricter ESG policies. Future research could address this limitation more rigorously by using instrumental variable (IV) techniques or identifying quasi-natural experiments that provide more exogenous variation in ESG policy intensity.
Fourth, the moderating roles of resource availability and managerial cognition were examined independently in this study. However, these factors may in fact be interdependent. For example, abundant organizational slack may give managers the “luxury” to pursue long-term environmental initiatives. Conversely, managers with strong environmental awareness may be better able to secure and accumulate slack resources for green projects. It is therefore possible that these two factors interact with or influence each other. Investigating such potential interactions or mediation effects would be a valuable direction for future research.
Fifth, although our conceptual framework highlights the importance of concrete environmental management practices, we are unable to incorporate a direct measure of such practices into our empirical models. Specifically, we do not have a consistent firm–year panel of environmental management system (EMS) certifications, such as ISO 14001, for our sample of listed firms over 2013–2023. This data limitation prevents us from directly testing whether the presence of formal EMS practices strengthens the impact of ESG policy intensity on green innovation (for example, through an ESGP × ISO 14001 interaction term). Future research could extend our framework by assembling firm-level ISO 14001 data and examining how EMS adoption interacts with ESG policy signals to shape green innovation outcomes.
Finally, although our theoretical framework suggests that organizational slack and managerial environmental awareness may jointly influence the effectiveness of ESG policies, our empirical model incorporates only two-way interaction terms (ESGP × Slack and ESGP × MEA). We do not estimate higher-order moderation structures such as Slack × MEA or the three-way interaction ESGP × Slack × MEA, primarily to avoid overcomplicating the model and intensifying multicollinearity concerns. Consequently, the potential complementarities and feedback mechanisms between resource availability and managerial cognition are not fully captured in this study. Future research could explicitly model these more complex interaction effects and examine whether the impact of ESG policy intensity on green innovation is further amplified when both slack resources and managerial environmental awareness are simultaneously high.

Author Contributions

Conceptualization, E.G. and E.T.L.; Methodology, E.G. and E.T.L.; Formal analysis, E.G.; Data curation, E.G.; Writing—original draft, E.G.; Writing—review & editing, E.T.L.; Supervision, E.T.L. All authors have read and agreed to the published version of the manuscript.

Funding

This research received no external funding.

Institutional Review Board Statement

Not applicable.

Informed Consent Statement

Not applicable.

Data Availability Statement

The original data presented in the study are openly available at: https://doi.org/10.6084/m9.figshare.30675728.v1.

Conflicts of Interest

The authors declare no conflict of interest.

References

  1. Niccolò, N.; Battisti, E.; Papa, A.; Miglietta, N. Shareholder value and dividend policy: The role of ESG strategies. In Proceedings of the IEEE International Conference on Technology Management, Operations and Decisions (ICTMOD), Marrakech, Morocco, 24–27 November 2020; pp. 1–5. [Google Scholar] [CrossRef]
  2. Mukhtar, B.; Shad, M.K.; Ali, K.; Woon, L.F.; Waqas, A. Systematic literature review and retrospective bibliometric analysis on ESG research. Int. J. Prod. Perform. Manag. 2025, 74, 1365–1399. [Google Scholar] [CrossRef]
  3. Wang, Z.; Tian, X. From greenwashing to sustainability: The mediating effect of green innovation in the agribusiness sector on financial performance. Agriculture 2025, 15, 1316. [Google Scholar] [CrossRef]
  4. Maalouf, E. Achieving corporate environmental responsibility through emerging sustainability laws. Asia Pac. J. Environ. Law 2024, 27, 64–99. [Google Scholar] [CrossRef]
  5. Wafa, O.B.; Smail, M.; Smail, K. Exploring the digital shift in ESG investing: A mixed-methods study of financial tools and policy barriers in MENA. In Proceedings of the 16th International Conference on Logistics and Supply Chain Management (LOGISTIQUA 2025), Casablanca, Morocco, 28–30 May 2025; IEEE: Piscataway, NJ, USA, 2025; pp. 1–8. [Google Scholar] [CrossRef]
  6. Chai, Z.; Zhu, X.; Sun, Y.; Chen, X. Evaluating pollution reduction and carbon mitigation in China’s zero-waste cities. Sustainability 2025, 17, 3215. [Google Scholar] [CrossRef]
  7. Pan, Y.; Wang, H.; Liu, Z. Corporate ESG performance, ownership structure, and export intensity: Evidence from Chinese listed companies. Int. J. Financ. Econ. 2025, 1–15. [Google Scholar] [CrossRef]
  8. Lee, S.; Min, S. The influence of ESG management on organizational performance in the hotel industry. In Proceedings of the IEEE/ACIS International Conference on Software Engineering Research, Management and Applications (SERA), Las Vegas, NV, USA, 29–31 May 2025; IEEE: Piscataway, NJ, USA, 2025; pp. 513–516. [Google Scholar] [CrossRef]
  9. Chen, M.J.; Zhou, J.Y. Research on the comprehensive effect of the Porter hypothesis of environmental protection tax regulation in China. Environ. Sci. Eur. 2025, 37, 28. [Google Scholar] [CrossRef]
  10. Lee, E. Environmental regulation and financial performance in China: An integrated view of the Porter hypothesis and institutional theory. Sustainability 2020, 12, 10183. [Google Scholar] [CrossRef]
  11. Guo, M.; Wang, H.; Kuai, Y. Environmental regulation and green innovation: Evidence from heavily polluting firms in China. Financ. Res. Lett. 2023, 53, 103624. [Google Scholar] [CrossRef]
  12. Liao, Z.; Xiao, L. Government Environmental Regulation, Media Attention, and Corporate Green Innovation. Int. Rev. Econ. Financ. 2025, 97, 103751. [Google Scholar] [CrossRef]
  13. Du, Y.; Wang, H. Green innovation sustainability: How green market orientation and absorptive capacity matter? Sustainability 2022, 14, 8192. [Google Scholar] [CrossRef]
  14. Bergek, A.; Berggren, C. The impact of environmental policy instruments on innovation: A review of energy and automotive industry studies. Ecol. Econ. 2014, 106, 112–123. [Google Scholar] [CrossRef]
  15. Zhang, W.; Zhu, B.; Li, Y.; Yan, D. Revisiting the Porter hypothesis: A multi-country meta-analysis of the relationship between environmental regulation and green innovation. Humanit. Soc. Sci. Commun. 2024, 11, 232. [Google Scholar] [CrossRef]
  16. Porter, M.E.; van der Linde, C. Toward a new conception of the environment–competitiveness relationship. J. Econ. Perspect. 1995, 9, 97–118. [Google Scholar] [CrossRef]
  17. Chen, J.; Zhu, D.; Ding, S.; Qu, J. Government environmental concerns and corporate green innovation: Evidence from heavy-polluting enterprises in China. Bus. Strategy Environ. 2024, 33, 1920–1936. [Google Scholar] [CrossRef]
  18. Udeagha, M.C.; Muchapondwa, E. Achieving green environment in Brazil, Russia, India, China, and South Africa economies: Do composite risk index, green innovation, and environmental policy stringency matter? Sustain. Dev. 2023, 31, 3468–3489. [Google Scholar] [CrossRef]
  19. Manigandan, P.; Alam, M.S.; Murshed, M.; Ozturk, I.; Altuntas, S.; Alam, M.M. Promoting sustainable economic growth through natural resources management, green innovations, environmental policy deployment, and financial development: Fresh evidence from India. Resour. Policy 2024, 90, 104681. [Google Scholar] [CrossRef]
  20. Parmar, B.L.; Freeman, R.E.; Harrison, J.S.; Wicks, A.C.; Purnell, L.; de Colle, S. Stakeholder theory: The state of the art. Acad. Manag. Ann. 2010, 4, 403–445. [Google Scholar] [CrossRef]
  21. He, L.; Wang, M. Environmental regulation and green innovation of polluting firms in China. PLoS ONE 2023, 18, e0281303. [Google Scholar] [CrossRef] [PubMed]
  22. Hu, D.; Huang, Y.; Zhong, C. Does environmental information disclosure affect the sustainable development of enterprises: The role of green innovation. Sustainability 2021, 13, 11064. [Google Scholar] [CrossRef]
  23. Cho, C.H.; Patten, D.M. The role of environmental disclosures as tools of legitimacy: A research note. Account. Organ. Soc. 2007, 32, 639–647. [Google Scholar] [CrossRef]
  24. Vringer, K.; Carabain, C.L. Measuring the legitimacy of energy transition policy in the Netherlands. Energy Policy 2020, 138, 111229. [Google Scholar] [CrossRef]
  25. Cyert, R.M.; March, J.G. A Behavioral Theory of the Firm; Wiley-Blackwell: Oxford, UK, 1963. [Google Scholar]
  26. Bourgeois, L.J. On the measurement of organizational slack. Acad. Manag. Rev. 1981, 6, 29–39. [Google Scholar] [CrossRef]
  27. George, G. Slack resources and the performance of privately held firms. Acad. Manag. J. 2005, 48, 661–676. [Google Scholar] [CrossRef]
  28. Nohria, N.; Gulati, R. Is slack good or bad for innovation? Acad. Manag. J. 1996, 39, 1245–1264. [Google Scholar] [CrossRef]
  29. Tan, J.; Peng, M.W. Organizational slack and firm performance during economic transitions: Two studies from an emerging economy. Strateg. Manag. J. 2003, 24, 1249–1263. [Google Scholar] [CrossRef]
  30. Hambrick, D.C.; Mason, P.A. Upper echelons: The organization as a reflection of its top managers. Acad. Manag. Rev. 1984, 9, 193–206. [Google Scholar] [CrossRef]
  31. Hambrick, D.C. Upper echelons theory: An update. Acad. Manag. Rev. 2007, 32, 334–343. [Google Scholar] [CrossRef]
  32. Moore, M.; Wade, B. Bookstart: A qualitative evaluation. Educ. Rev. 2003, 55, 3–13. [Google Scholar] [CrossRef]
  33. ISO 14001:2015; Environmental Management Systems—Requirements with Guidance for Use. International Organization for Standardization: Geneva, Switzerland, 2015.
  34. International Monetary Fund. World Economic Outlook, October 2025: A New Global Economic Landscape Slowly Takes Shape. 2025. Available online: https://www.imf.org/-/media/files/publications/weo/2025/october/english/ch1.pdf (accessed on 20 September 2025).
  35. World Bank. China Overview: Development News, Research, Data. 2024. Available online: https://www.worldbank.org/en/country/china/overview (accessed on 20 September 2025).
  36. MSCI. MSCI Emerging Markets Index (USD), Index Fact Sheet. 2025. Available online: https://www.msci.com/documents/10199/104d36a3-5509-4dcf-95f4-e45efc9f2912 (accessed on 20 September 2025).
  37. Yue, Q.; Lan, H. Can a technology innovation strategy really enhance corporate competence? An empirical analysis based on a comparison between domestic and foreign companies in the Chinese high-tech industry. In Proceedings of the Seventh Wuhan International Conference on E-Business 2008, Wuhan, China, 31 May–1 June 2008; pp. 3046–3054. [Google Scholar]
  38. Du, K.; Cheng, Y.; Yao, X. Environmental regulation, green technology innovation, and industrial structure upgrading: The road to the green transformation of Chinese cities. Energy Econ. 2021, 98, 105247. [Google Scholar] [CrossRef]
  39. Xie, Z.; Wang, J.; Zhao, G. Impact of Green Innovation on Firm Value: Evidence from Listed Companies in China’s Heavy Pollution Industries. Front. Energy Res. 2022, 9, 806926. [Google Scholar] [CrossRef]
  40. Hair, J.F.; Black, W.C.; Babin, B.J.; Anderson, R.E. Multivariate Data Analysis, 7th ed.; Pearson: Upper Saddle River, NJ, USA, 2010. [Google Scholar]
  41. Yan, Z.; Yu, Y.; Du, K.; Zhang, N. How Does Environmental Regulation Promote Green Technology Innovation? Evidence from China’s Total Emission Control Policy. Ecol. Econ. 2024, 219, 108137. [Google Scholar] [CrossRef]
  42. Peng, B.; Tu, Y.; Wei, G. Can environmental regulations promote corporate environmental responsibility? Evidence from the moderated mediating effect model and an empirical study in China. Sustainability 2018, 10, 641. [Google Scholar] [CrossRef]
  43. Cabral, J.J.; Francis, B.B.; Kumar, M.V.S. The impact of managerial job security on corporate entrepreneurship: Evidence from corporate venture capital programs. Strateg. Entrep. J. 2021, 15, 28–48. [Google Scholar] [CrossRef]
  44. Jiao, J.; Liu, C.; Xu, Y.; Hao, Z. Effects of strategic flexibility and organizational slack on the relationship between green operational practices adoption and firm performance. Corp. Soc. Responsib. Environ. Manag. 2022, 29, 561–577. [Google Scholar] [CrossRef]
  45. Tang, J.; Li, S. Can public participation promote regional green innovation?—Threshold effect of environmental regulation analysis. Heliyon 2022, 8, e11157. [Google Scholar] [CrossRef]
  46. Mey, F.; Kallies, A.; Wiseman, J.; Watson, M. Legitimizing Energy Transitions through Community Participation: Germany and Australia at a Crossroad. Globalizations 2023, 20, 1344–1362. [Google Scholar] [CrossRef]
  47. Lyu, C.; Xie, Z.; Li, Z. Market supervision, innovation offsets and energy efficiency: Evidence from environmental pollution liability insurance in China. Energy Policy 2022, 171, 113267. [Google Scholar] [CrossRef]
  48. Prasad, K.; Kumar, S.; Devji, S.; Lim, W.M.; Prabhu, N.; Moodbidri, S. Corporate social responsibility and cost of capital: The moderating role of policy intervention. Res. Int. Bus. Financ. 2022, 60, 101620. [Google Scholar] [CrossRef]
  49. Brännlund, R.; Lundgren, T. Environmental policy without costs? A review of the Porter hypothesis. Int. Rev. Environ. Resour. Econ. 2009, 3, 75–117. [Google Scholar] [CrossRef]
  50. Rubashkina, Y.; Galeotti, M.; Verdolini, E. Environmental regulation and competitiveness: Empirical evidence on the Porter hypothesis from European manufacturing sectors. Energy Policy 2015, 83, 288–300. [Google Scholar] [CrossRef]
Figure 1. Research Model. Note: “+” indicates a hypothesized positive relationship.
Sustainability 17 10481 g001
Figure 2. The Moderating Effect of Organizational Slack and Managerial Awareness.
Sustainability 17 10481 g002
Figure 3. Summary of theoretical framework. (+) indicates a hypothesized positive effect. * p < 0.1, *** p < 0.01.
Sustainability 17 10481 g003
Table 1. Definitions and Measurement.
Variable TypeVariable NameSymbolMeasurement Method
Dependent VariablesCorporate Green InnovationGILn (1 + annual number of green patent applications)
Independent VariableESG policy intensityESGPAnnual ESG Word Frequency Index Constructed Based on Text Analysis of the Government Work Report
Moderating VariablesOrganizational SlackSlack(Current Assets − Current Liabilities)/Total Assets
Managerial Environmental AwarenessMEAAnnual environmental word frequency index constructed based on MD&A text analysis of annual reports
Control VariablesFirm SizeSizeLn (Total Assets)
AgeAgeLn (firm age)
Leverage ratioLevTotal Liabilities/Total Assets
ProfitabilityROANet Profit/Average Balance of Total Assets
R&D Investment IntensityRDR&D Investment/Revenue
Nature of EquitySOEDummy variable, SOE takes 1, otherwise 0
Board SizeBoardLn (number of board members)
Fixed effectFirm, YearControl firm and year
Table 2. Descriptive Statistics.
VariableNMeanStandard DeviationMinimum ValueMaximum Value
GI21,8960.6541.1080.0004.890
ESGP21,8960.0210.0150.0050.048
Slack21,8960.1280.195−0.4510.782
MEA21,8960.0070.0130.0000.089
Size21,89622.671.3519.8926.43
Age21,8962.850.511.614.02
Lev21,8960.4430.2010.0890.954
ROA21,8960.0410.058−0.1520.231
RD21,8960.0390.0450.0000.255
SOE21,8960.3620.4810.0001.000
Board21,8962.180.251.612.83
Table 3. Correlation.
Variable(1)(2)(3)(4)(5)(6)(7)(8)(9)(10)(11)
(1) GI1
(2) ESGP0.137 ***1
(3) Slack0.098 ***0.0121
(4) MEA0.184 ***0.076 ***0.045 **1
(5) Size0.215 ***0.038−0.095 ***0.155 ***1
(6) Age00.005−0.0200.040 **0.110 ***1
(7) Lev−0.040 **−0.008−0.240 ***−0.055 ***0.270 ***0.090 ***1
(8) ROA0.100 ***0.0250.300 ***0.070 ***−0.090 ***−0.075 ***−0.400 ***1
(9) RD0.426 ***0.112 ***0.060 ***0.198 ***0.160 ***0.01500.080 ***1
(10) SOE0.085 ***0.030.080 ***0.110 ***0.210 ***0.140 ***0.170 ***0.0180.050 ***1
(11) Board0.150 ***0.0250.070 ***0.130 ***0.380 ***0.120 ***0.150 ***0.030.120 ***0.180 ***1
Note: *** p < 0.01, ** p < 0.05.
Table 4. Regression Results for Hypotheses Testing.
(1)(2)(3)(4)(5)
VariableGIGIGIGIGI
ESGP1.854 ***1.839 ***1.761 ***1.798 ***1.682 ***
−0.512−0.511−0.508−0.499−0.495
Slack 0.481 ***0.475 ***
−0.133−0.132
ESGP × Slack 1.152
(0.589) *
MEA 4.657 ***4.591 ***
−0.624−0.621
ESGP × MEA 3.876 *
−1.455
Control Variables
Size0.188 ***0.191 ***0.192 ***0.179 ***0.180 ***
−0.025−0.025−0.025−0.024−0.024
Age0.0210.0220.0220.0190.019
−0.018−0.018−0.018−0.018−0.018
Lev−0.114 **−0.125 ***−0.126 ***−0.111 **−0.112 **
−0.046−0.045−0.045−0.046−0.046
ROA0.531 ***0.499 ***0.496 ***0.515 ***0.511 ***
−0.102−0.1−0.1−0.101−0.101
RD2.985 ***2.981 ***2.979 ***2.899 ***2.895 ***
−0.155−0.155−0.155−0.153−0.153
SOE0.065 **0.061 **0.060 *0.054 *0.052 *
−0.031−0.031−0.031−0.03−0.03
Board0.095 ***0.092 ***0.091 ***0.088 ***0.087 ***
−0.028−0.028−0.028−0.027−0.027
Constant Term−3.541 ***−3.612 ***−3.625 ***−3.401 ***−3.418 ***
−0.488−0.487−0.487−0.479−0.479
Firm fixed effectsYesYesYesYesYes
Year fixed effectsNoNoNoNoNo
N21,89621,89621,89621,89621,896
R-squared0.2850.2890.2910.2980.301
Note: Robust standard errors in parentheses. *** p < 0.01, ** p < 0.05, * p < 0.1.
Table 5. Heterogeneity Test.
(1)(2)(3)(4)(5)
VariableGIGIGIGIGI
ESGP2.011 ***1.980 ***1.950 ***1.990 ***1.920 ***
−0.602−0.6−0.595−0.598−0.59
Slack 0.503 ***0.498 ***
−0.151−0.15
ESGP × Slack 1.324 *
−0.698
MEA 4.882 ***4.820 ***
−0.715−0.71
ESGP × MEA 4.106 *
−1.688
Control Variables
Size0.195 ***0.198 ***0.199 ***0.190 ***0.191 ***
−0.026−0.026−0.026−0.025−0.025
Age0.0230.0240.0240.0210.021
−0.019−0.019−0.019−0.019−0.019
Lev−0.120 **−0.130 ***−0.131 ***−0.115 **−0.116 **
−0.048−0.047−0.047−0.048−0.048
ROA0.540 ***0.505 ***0.502 ***0.520 ***0.518 ***
−0.105−0.103−0.103−0.104−0.104
RD3.000 ***2.990 ***2.985 ***2.905 ***2.900 ***
−0.158−0.158−0.158−0.156−0.156
Board0.098 ***0.095 ***0.094 ***0.090 ***0.089 ***
−0.029−0.029−0.029−0.028−0.028
Constant Term−3.600 ***−3.680 ***−3.690 ***−3.450 ***−3.465 ***
−0.5−0.498−0.498−0.49−0.49
Firm fixed effectsYesYesYesYesYes
Year fixed effectsNoNoNoNoNo
N13,96813,96813,96813,96813,968
R-squared0.3050.3090.3150.320.325
Note: *** p < 0.01, ** p < 0.05, * p < 0.1.
Table 6. Robustness Test Results.
(1)(2)(3)(4)(5)
VariableGIGIGIGIGI
ESGP1.621 ***1.405 ***1.750 ***0.150 ***1.800 ***
−0.533−0.411−0.52−0.02−0.51
Slack0.455 ***0.358 ***0.480 ***0.050 ***0.420 ***
−0.135−0.11−0.14−0.01−0.125
ESGP × Slack1.103 *0.988 *1.150 *0.080 *1.200 *
−0.601−0.485−0.58−0.04−0.56
MEA4.498 ***3.987 ***4.200 ***0.300 ***4.100 ***
−0.636−0.543−0.62−0.03−0.61
ESGP × MEA3.754 *3.112 *3.800 ***0.250 *3.900 ***
−1.492−1.231−1.4−0.1−1.35
Control VariablesYesYesYesYesYes
Size0.191 ***0.188 ***0.190 ***0.020 ***0.185 ***
−0.025−0.025−0.025−0.003−0.024
Age0.0220.0210.0210.0020.02
−0.018−0.018−0.018−0.002−0.018
Lev−0.125 ***−0.114 **−0.120 ***−0.010 **−0.118 **
−0.045−0.046−0.045−0.005−0.046
ROA0.499 ***0.531 ***0.510 ***0.040 ***0.505 ***
−0.1−0.102−0.101−0.01−0.1
RD2.981 ***2.985 ***2.900 ***0.280 ***2.920 ***
−0.155−0.155−0.153−0.015−0.154
Board0.092 ***0.095 ***0.090 ***0.008 ***0.088 ***
−0.028−0.028−0.028−0.003−0.027
Constant Term−3.612 ***−3.541 ***−3.500 ***−0.300 ***−3.480 ***
−0.487−0.488−0.48−0.03−0.479
Firm fixed effectsYesYesYesYesYes
Year fixed effectsNoNoNoNoNo
N19,04221,89621,89621,89621,896
R−squared0.2810.2680.2850.250.29
Note: *** p < 0.01, ** p < 0.05, * p < 0.1.
Table 7. Poisson pseudo-maximum likelihood estimates with firm and year fixed effects.
(1)
VARIABLESPPML: firm and year FE
Slack0.878
(0.637)
MEA96.353 **
(42.862)
c.ESGP × c.Slack−95.858
(76.895)
c.ESGP × c.MEA−10,180.575 *
(5444.362)
Size0.364 ***
(0.120)
Age−0.268
(0.742)
Lev−0.253
(0.560)
ROA0.059
(0.483)
RD2.721 *
(1.479)
Board0.182
(0.196)
o.SOE-
Constant−4.772
(3.365)
Observations14,066
Note: Robust standard errors in parentheses. *** p < 0.01, ** p < 0.05, * p < 0.1.
Disclaimer/Publisher’s Note: The statements, opinions and data contained in all publications are solely those of the individual author(s) and contributor(s) and not of MDPI and/or the editor(s). MDPI and/or the editor(s) disclaim responsibility for any injury to people or property resulting from any ideas, methods, instructions or products referred to in the content.