1. Introduction
With the development of urbanization worldwide, the urban population increased by nearly 20% in the 20th century [
1]. From 2012 to 2023, China’s urban population increased by 30%, and the urbanization rate reached 60% [
2]. With the rapid development of urbanization in China, there are many problems such as dense urban population, tight urban space, road traffic congestion, excessive acoustic and air pollution. Expanding urban underground space, three-dimensional comprehensive development and building an underground transportation network have become solutions to alleviate urban space tension and traffic congestion caused by rapid urbanization [
3].
In recent years, the Transit-Oriented Development (TOD) model with “Rail transit + Business + Residence” as the core has accelerated the sustainable development of China’s infrastructure and real estate, and built an urban functional ecosystem. It has become an important advanced path to deal with the above urban problems [
4].
As of December 2024, the cumulative number of passengers sent by Zhengzhou Railway in China has reached 10.962 million, and the cumulative number of China–Europe Railway Express (Zhengzhou) has exceeded 10,000, ranking tenth in China in terms of operating mileage. Zhengzhou subway rail transit has the highest daily passenger volume of 3.5781 million passengers, with an average daily passenger volume of more than 2 million people; it is 450 km long and has 13 lines. According to
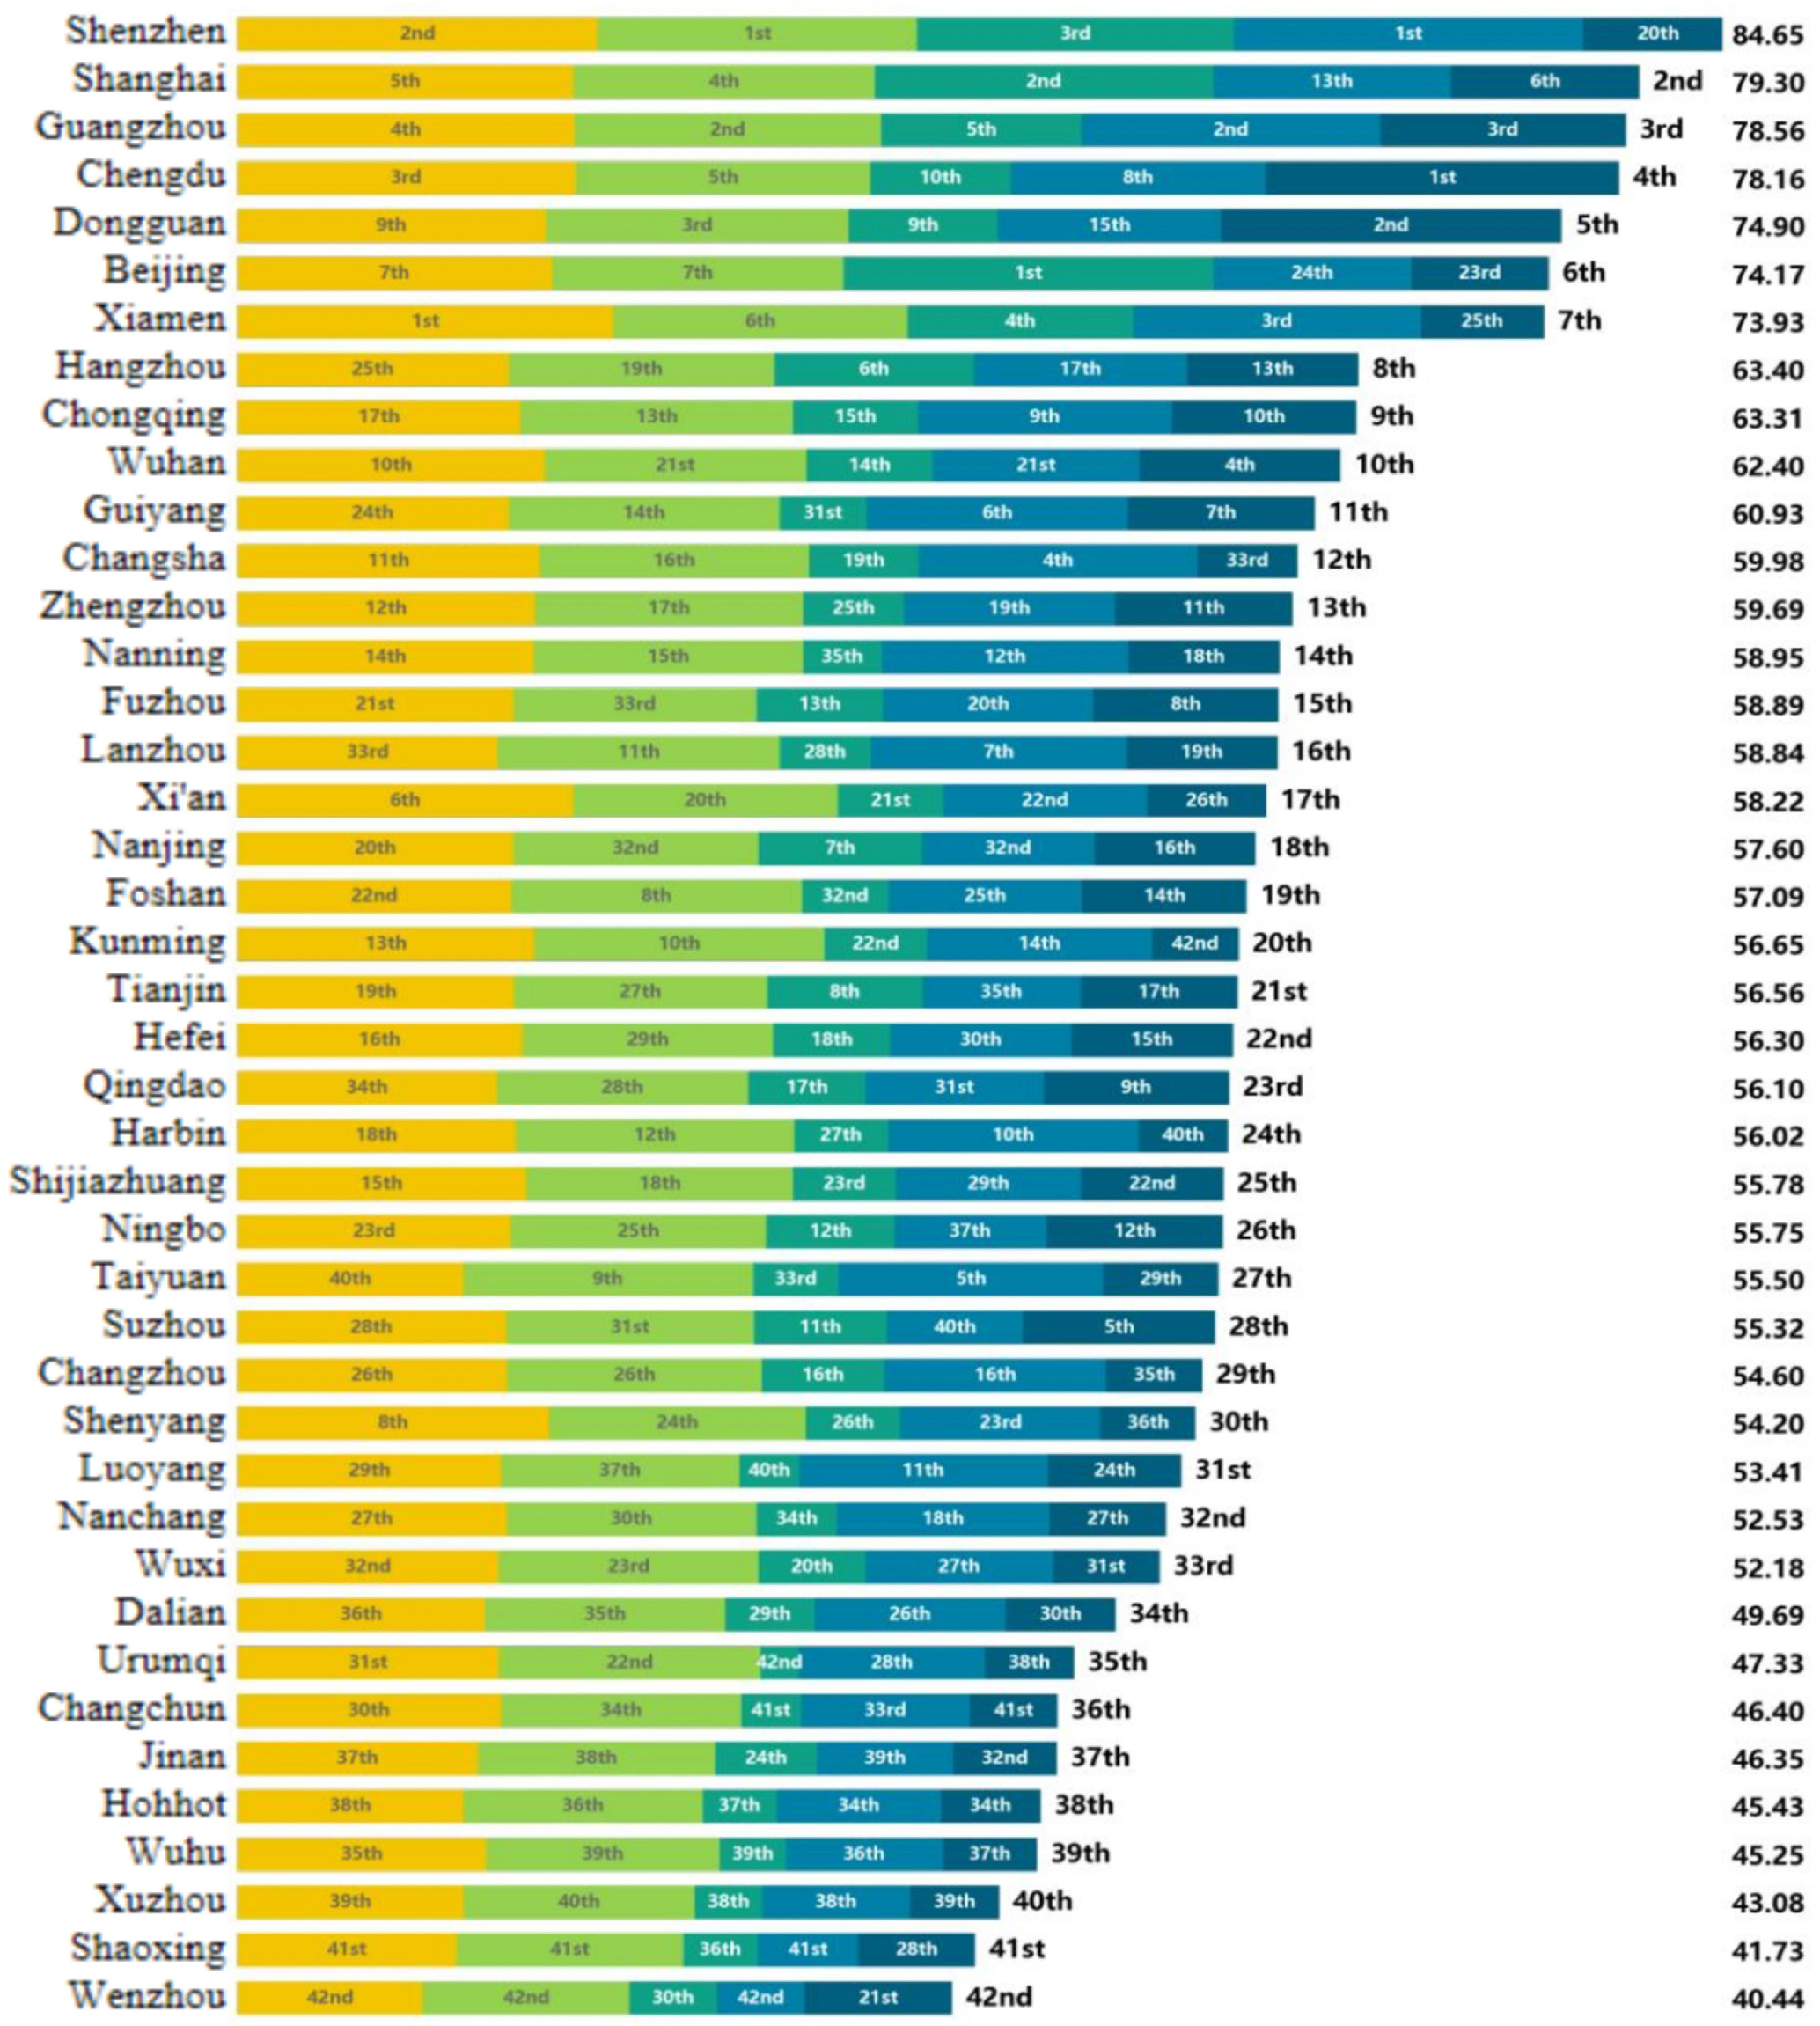
Figure 1, Zhengzhou is ranked 13th in the comprehensive evaluation of TOD magnetic index of Chinese cities (the future TOD potential of the city) in 2023.
However, in the TOD model, its underground space development still faces many specific problems. First of all, underground commercial corridors and residential supporting areas (such as underground garages, equipment layers) in hot and humid and sub-hot and humid areas are prone to high humidity, which may induce sick building syndrome [
5] and increase the risk of respiratory diseases, arthritis and other diseases [
6]; on the other hand, TOD underground space is characterized by strong closure and high functional density due to the need to connect with the site and connect commercial and residential functions. The underground space has a variety of shops such as drinks, fast food, lottery tickets, small goods and so on. In particular, the underground space with the characteristics of Chinese people’s consumption is mainly based on the dining area, which brings the contradiction of catering load demand (such as queuing, equipment acoustic), and the operation of kitchen equipment, the interaction of diners, etc., and the operation of rail escalators, large-scale flow of people. Superimposed influence interferes with the normal use and operation of underground space. In addition, the close layout of the subway line and the underground commercial and upper living space in the TOD project makes the vibration generated by the rail transit operation easily transmitted to the underground consumption area and living space, affecting the normal communication and consumption experience of people in the commercial scene, and interfering with residents’ sleep and daily activities [
7].
With the rapid development of social economy and the steady improvement of living standards, people’s requirements for the comfort of the building environment are becoming more and more stringent. The earliest comfort research was carried out and the most concerned was the thermal environment. The main influencing factors of human thermal comfort include indoor air temperature, indoor relative humidity, air velocity, radiation heat transfer between the human body and the surrounding envelope, and people’s clothing and activity intensity [
8]. In 1970, Danish professor P.O. Fanger obtained the human thermal comfort balance equation and the experimental regression formula of PMV in the artificial climate chamber [
9]. In 1976, the U.S. Transportation Department gave RWI (Relative Warmth Index) and HDR (Heat Deficit Rate) two evaluation indicators to evaluate the thermal comfort of the human body in transition activities [
10]. The HIS (Heat Stress Index) proposed by Belding and Hatch of the University of Pittsburgh and the WCI (Wind Chill Index) proposed by Siple and Passel [
11,
12] are used to evaluate the high temperature thermal environment and cold climate, respectively. Dear and Brager, Auliciems [
13], Nicol and Humphreys [
14,
15] improved the limitations of the PMV model prediction and established a thermal adaptation model. If the environment changes, such as the increase in air temperature brings discomfort to people, they tend to make actions that tend to restore comfort [
16,
17].
The study of acoustic comfort is mainly to control the acoustic in the indoor environment, and the study of acoustic environment focuses on the listener’s Sensation and evaluation of the overall acoustic environment. Schafer divides the acoustic sources in the environment into three types: tone acoustic, foreground acoustic and sign acoustic [
18]. In the study of the acoustic environment of urban open public space, Yu and Kang divided independent acoustic sources into three types: natural acoustic, artificial acoustic and mechanical acoustic [
19]. Hatfield studied the influence of the appearance of different independent acoustic sources or combined acoustic sources on the user’s acoustic environment evaluation in open and closed environmental spaces through laboratory research [
20]. Miedema’s research on acoustic environmental assessment shows that the user’s gender, age, education level, occupation, etc., are the influencing factors of acoustic environmental assessment, so as to analyze the impact on acoustic Sensation [
21]; Kang and Zhang also found that the evaluation of acousticscape was influenced by the social factor of age in the study of the characteristics of acousticscape in urban open public space [
22]. At the same time, the size of the space affects the length of the reverberation time, and the long reverberation time will also bring the acoustic annoyance. Kang found in the study that the appropriate reverberation time can improve people’s comfort evaluation of street music [
23].
Many scholars have studied the influence of vibration on human comfort. Koczwara analyzed the influence of test point location and multiple vibration sources on human-perceived vibration comfort [
24,
25]. Li Wang et al. carried out numerical simulation and field test data verification on the transmission of underground train vibration to multi-storey buildings [
26]. Yasunao Matsumoto established an evaluation model for the Sensation threshold of transient vibration in buildings [
27]. Waddington et al. have established the deterministic response relationship of vibration annoyance response caused by railway and building activities in a residential environment [
28].
At the same time, the human body’s subjective Sensation of the environment is the result of the interaction of multiple physical fields. The multi-factor comprehensive evaluation research methods such as fuzzy mathematics, principal component analysis and artificial neural network technology have certain applications [
29,
30,
31]. Some scholars have studied the effects of temperature and acoustic on indoor physical environment Sensation and work performance [
32,
33,
34]. Fanger et al. studied whether color and acoustic affect the preferred ambient temperature. Studies have shown that color and acoustic have no significant effect on thermal comfort [
35]. Nagano and Horikoshi explored the quantitative relationship between thermal and acoustic factors and environmental Sensation. The results show that acoustic has a significant effect on thermal, acoustic comfort and quietness, and temperature has a significant effect on acoustic and quietness [
36,
37].
In addition, Eduardo L. Krüger investigated the indoor environment of the classroom, and the data measured from the three different environments of thermal environment, light environment and acoustic environment showed that there was a strong interdependence between the environmental comfort, and proposed to consider the indoor environment comfort as a whole [
38]. L. T. Wong et al. investigated the indoor air quality of 293 households from different office environments in Hong Kong, including four aspects: thermal comfort, indoor air quality, acoustic level and illumination level. The multivariate regression model was used to calculate the acceptable comprehensive indoor air quality, and the importance of the four aspects on the acceptability of comprehensive indoor air quality was given. From the most important to the least important are indoor thermal environment, air quality, acoustic level and illumination level [
39]. Bin Cao conducted a field survey of public buildings in Beijing and Shanghai. He believes that many factors should be considered in studying the quality of indoor environment and evaluating human comfort. In addition, the study used the least square method to fit the prediction evaluation model of overall satisfaction [
40]. Based on the quasi-field investigation of the influence of heat, acoustic and light on the indoor environment comfort in the office environment, Li Huang obtained the satisfaction interval of each single environment [
41].
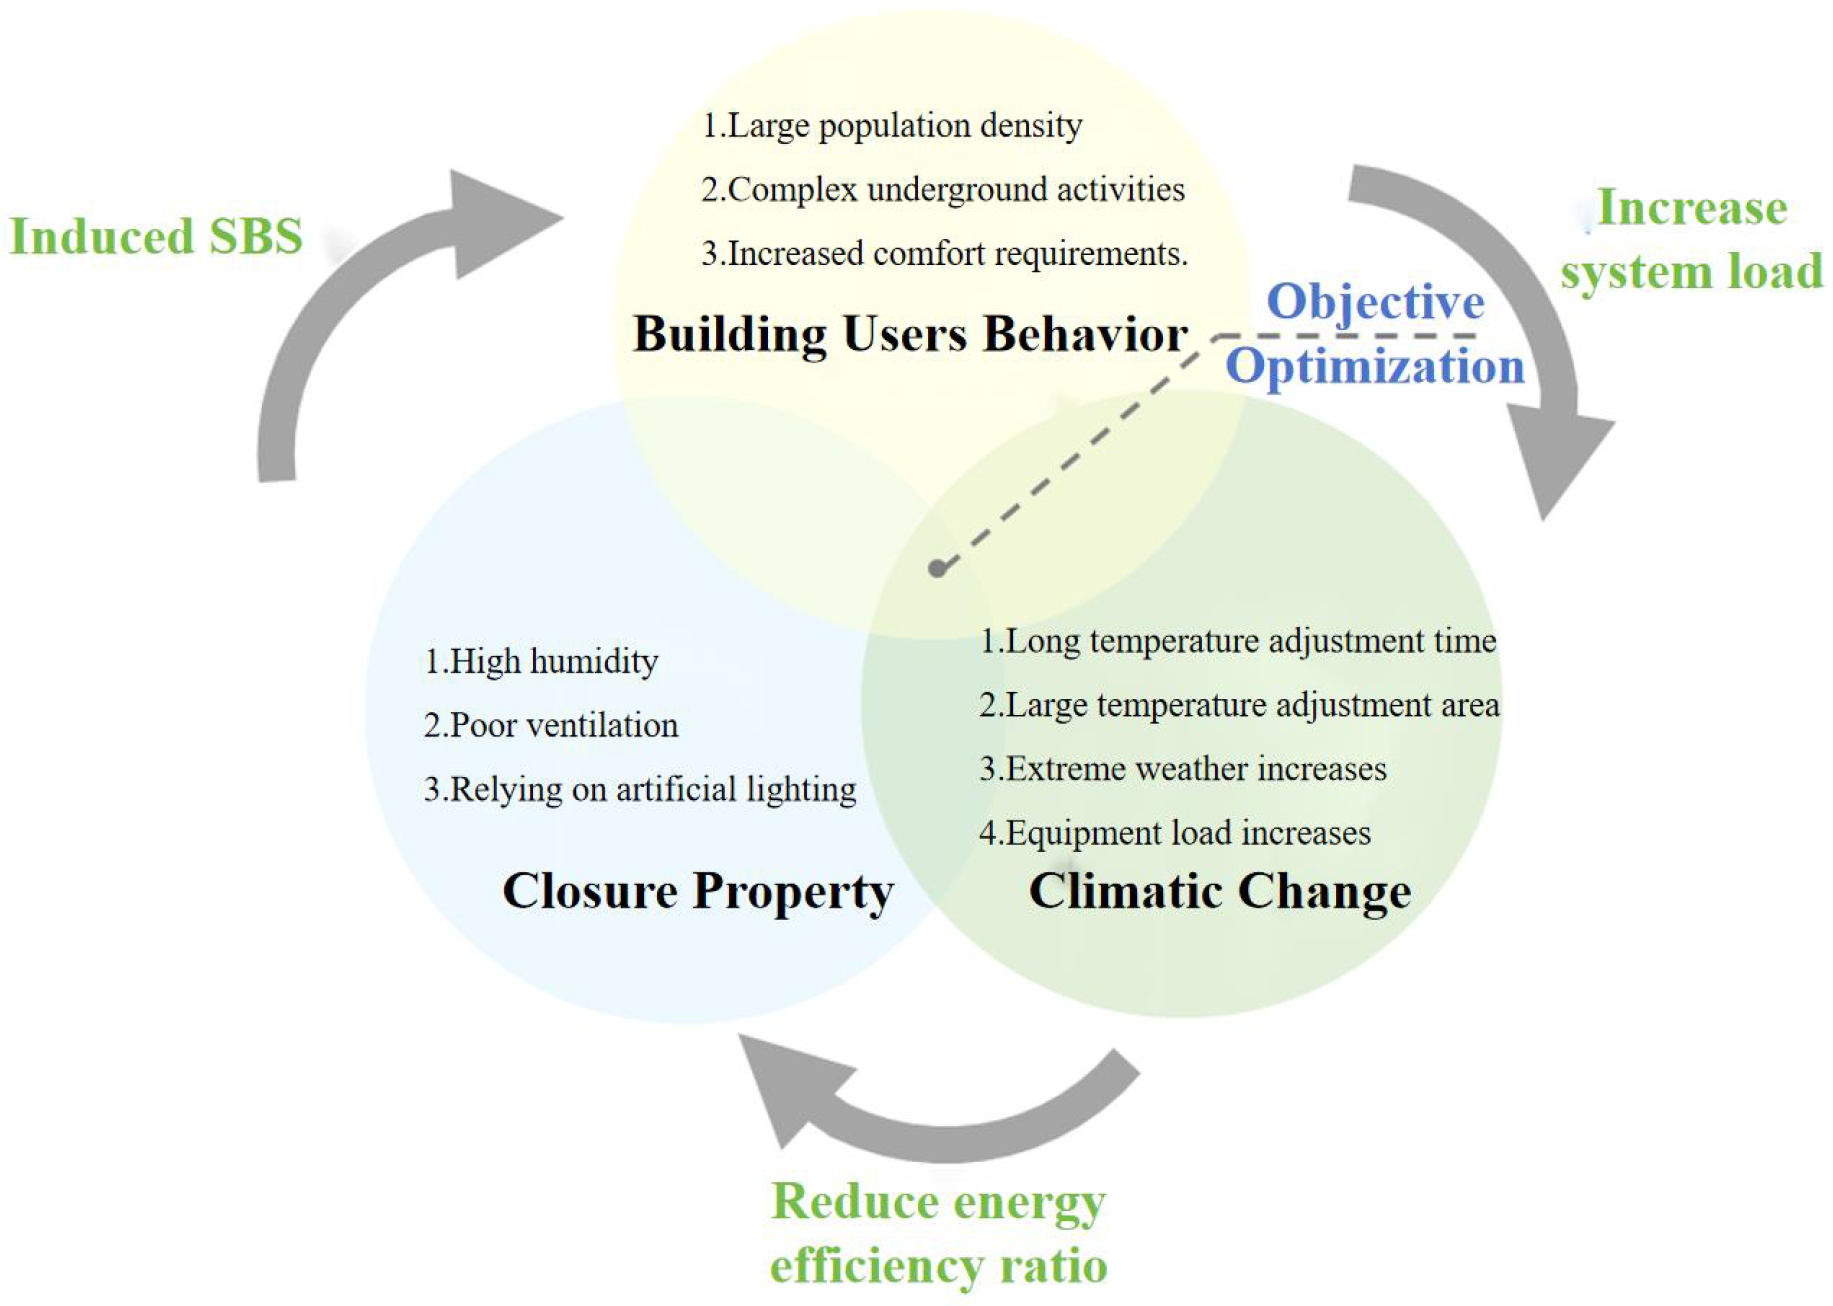
In recent years, the relationship between the key points of multi-physics research in underground space is shown in
Figure 2.
In summary, the existing research results mainly focus on the optimization of single environmental objectives and the optimization of thermoacoustic environmental objectives, and lack of targeted research on the underground space with strong closure and lack of natural lighting under the condition of population density doubling and shop operation. Therefore, this study takes the typical TOD underground space (Zhengzhou Erqi subway station) during the Spring Festival travel period as the research object, explores the variation law and interaction mechanism of the multi-physical field environment of the underground space, and establishes the comprehensive comfort evaluation model of the underground space during the Spring Festival travel period in northern China to guide the operation management and system maintenance of special operation periods such as the Spring Festival travel period.
2. Experimental Design and Basic Information
According to the “China’s Domestic Tourism Development Annual Report 2024” issued by the China Tourism Research Institute, the number of domestic tourists in China in 2024 was 5.615 billion, and the number of tourists in the third quarter was up to 1.512 billion [
42]. The experiment was carried out in a subway station in Zhengzhou in late January 2025 (Spring Festival). Spring Festival is an important traditional festival in China. During the Spring Festival, Zhengzhou, as an important transportation hub in China, undertakes high intensity and continuous flow of people. The public building environment in Zhengzhou presents multi-dimensional extreme characteristics. In this environment, the anxiety level and stress response of personnel will change. People’s tolerance and perception of environmental stimuli (such as noise, sultry, crowding, vibration, etc.) will be very different from those in a relaxed state. It provides a unique scene for studying the comprehensive comfort of multi-functional underground space of underground rail transit under TOD mode.
Zhengzhou has a temperate continental monsoon climate. The average pressure in January is 1.013 × 10⁵ Pa, the average maximum temperature is 6 °C, the lowest at night is −3 °C, and the average temperature difference between day and night is 9–12 °C. Zhengzhou has the characteristics of high pressure, low temperature and dryness, and rain and snow weather in winter, which poses a certain challenge to the pressure balance, heat and moisture coupling regulation and extreme climate of underground space under TOD mode.
The TOD underground space is a highly integrated rail transit operation and composite functional activity and has a ‘layered partition’ layout and ‘tidal’ operating characteristics (morning and evening peaks, rail transit operation periods). The three physical fields of heat, acoustic and vibration show significant spatial and temporal distribution differences, resulting in a superimposed effect on human comfort and spatial function. Therefore, the environmental parameters and subjective environmental Sensation of multi-physical fields are recorded, and the comprehensive comfort evaluation model of multi-physical fields in underground space is established.
2.1. Building Information and Experimental Processes
The transfer station of Zhengzhou Metro Line 1 and Line 3 is selected as the field research site. The subway station is a typical underground TOD complex in the central region. It has three underground layers. The total area of the L-shaped space layout of the ticket layer (underground layer) is about 9000 m2. There are eight exits, two mall entrances and two ticket gates, all of which have two-way pedestrian passages. In the interior space, there are many shops such as a milk tea shop, lottery shop, bakery, fast food shop and so on. There are breakfast shops outside the ticket checking. There are multiple self-service equipment vending machines in the upper right corner of the space.
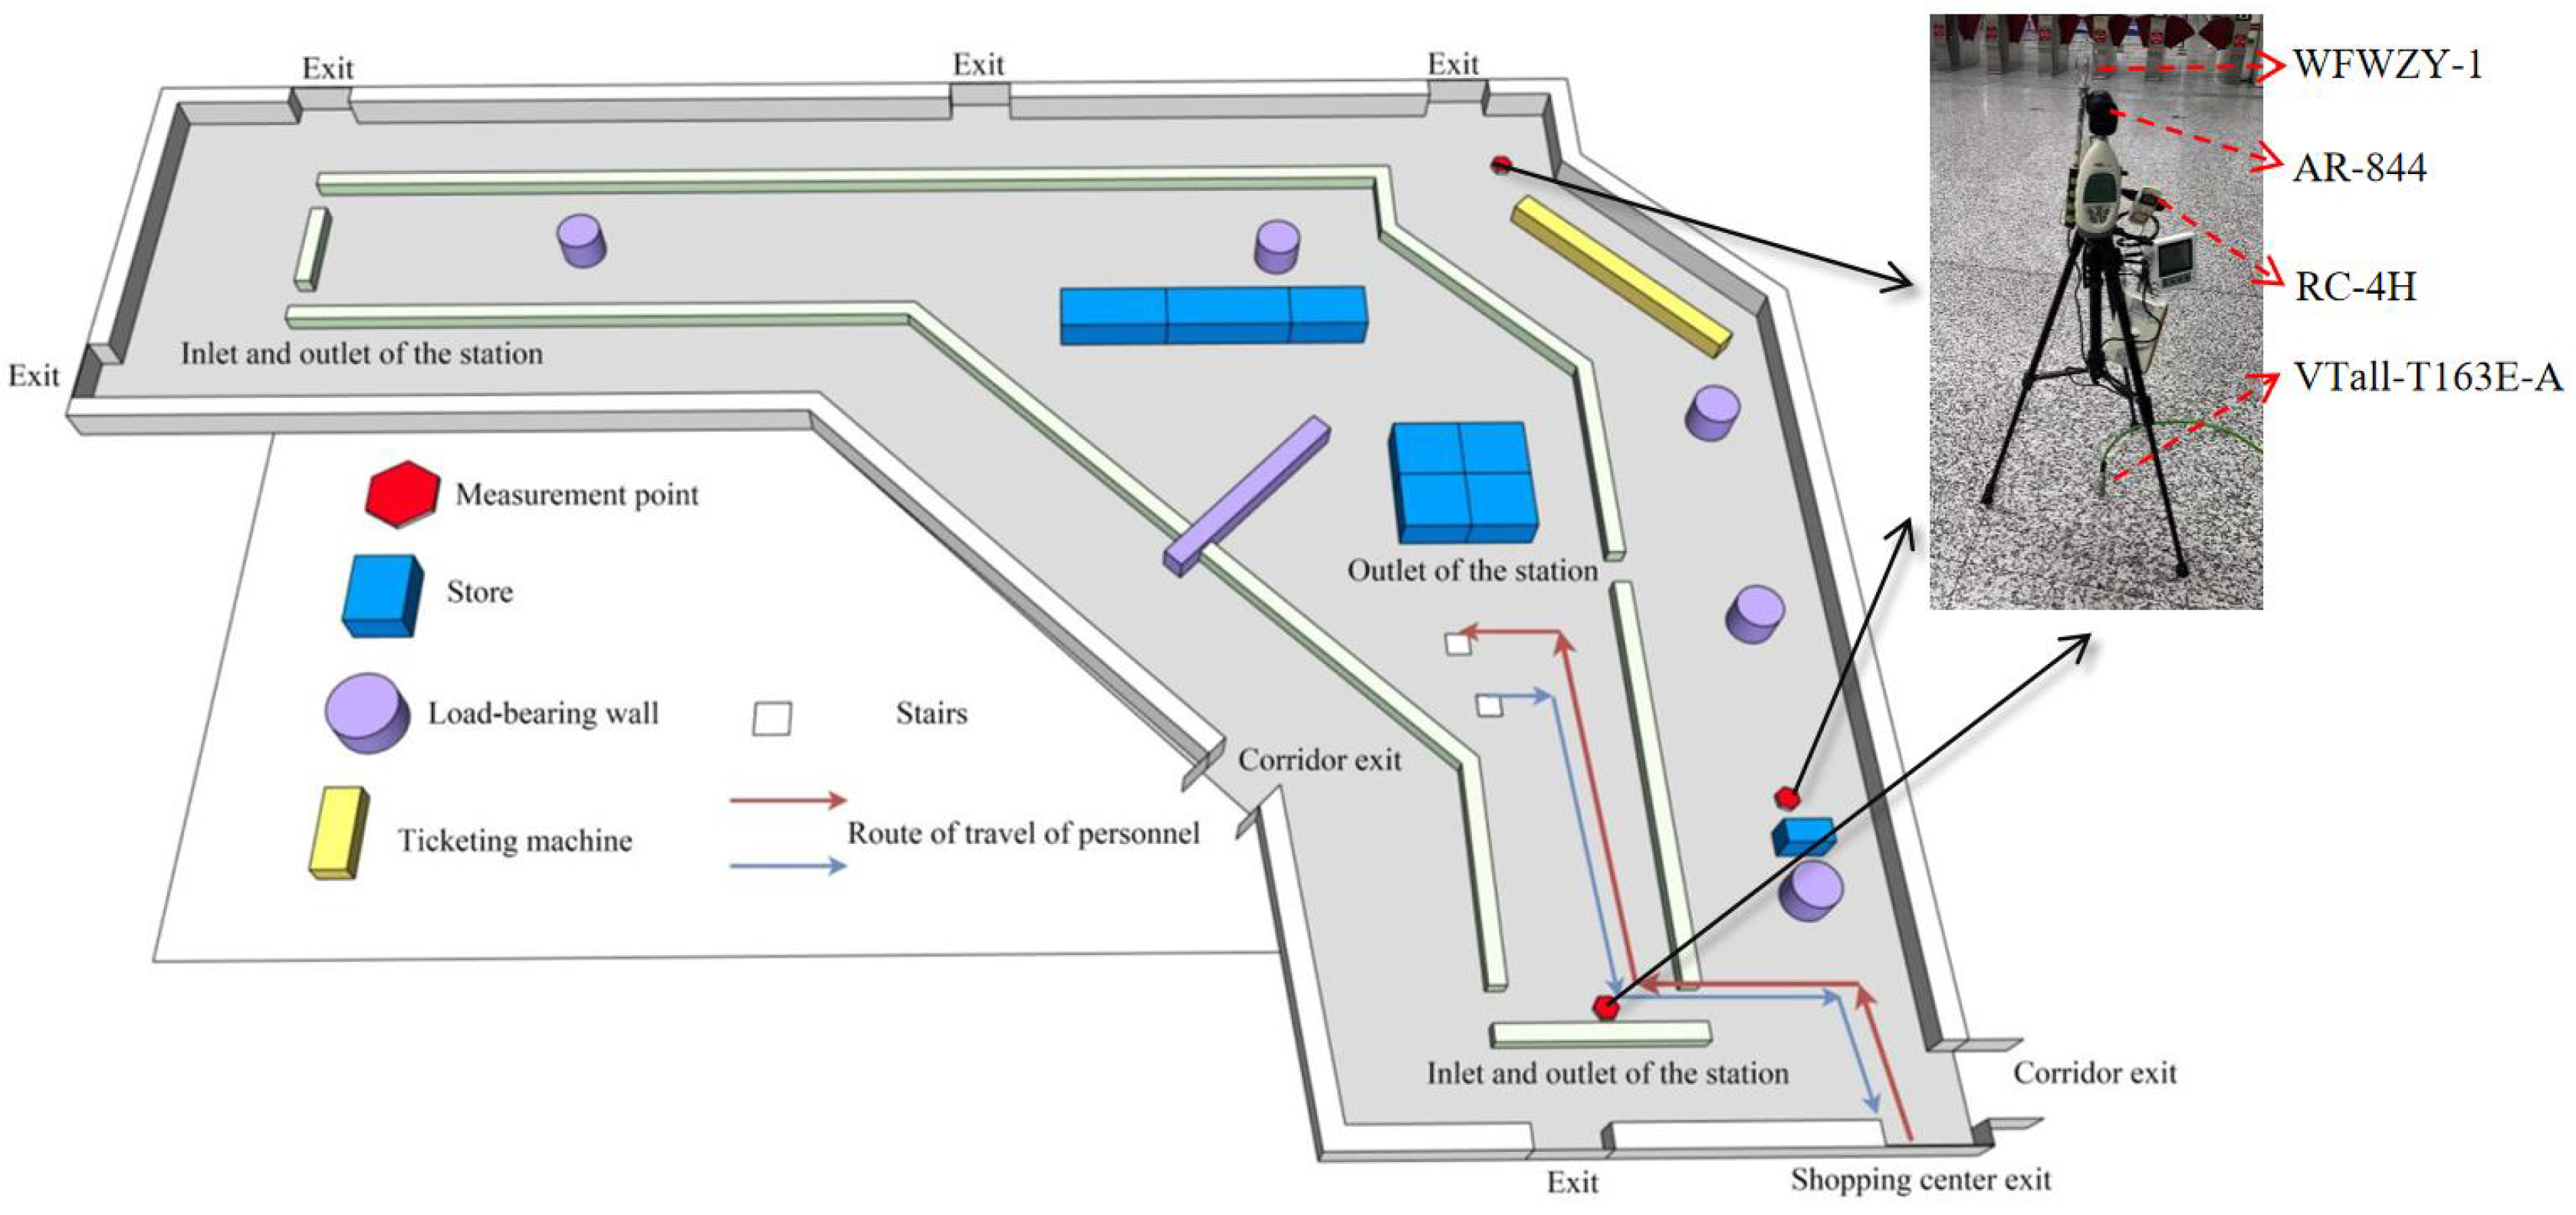
Nearly 80% of the flow of people in the field monitoring space is concentrated in the lower right corner of the mall, and a small part is in the upper right of the self-service ticket machine and the exit. According to the density of the flow of people in the measured site, the personnel route is simplified, as shown in
Figure 3, and a total of three measuring points are arranged for data collection.
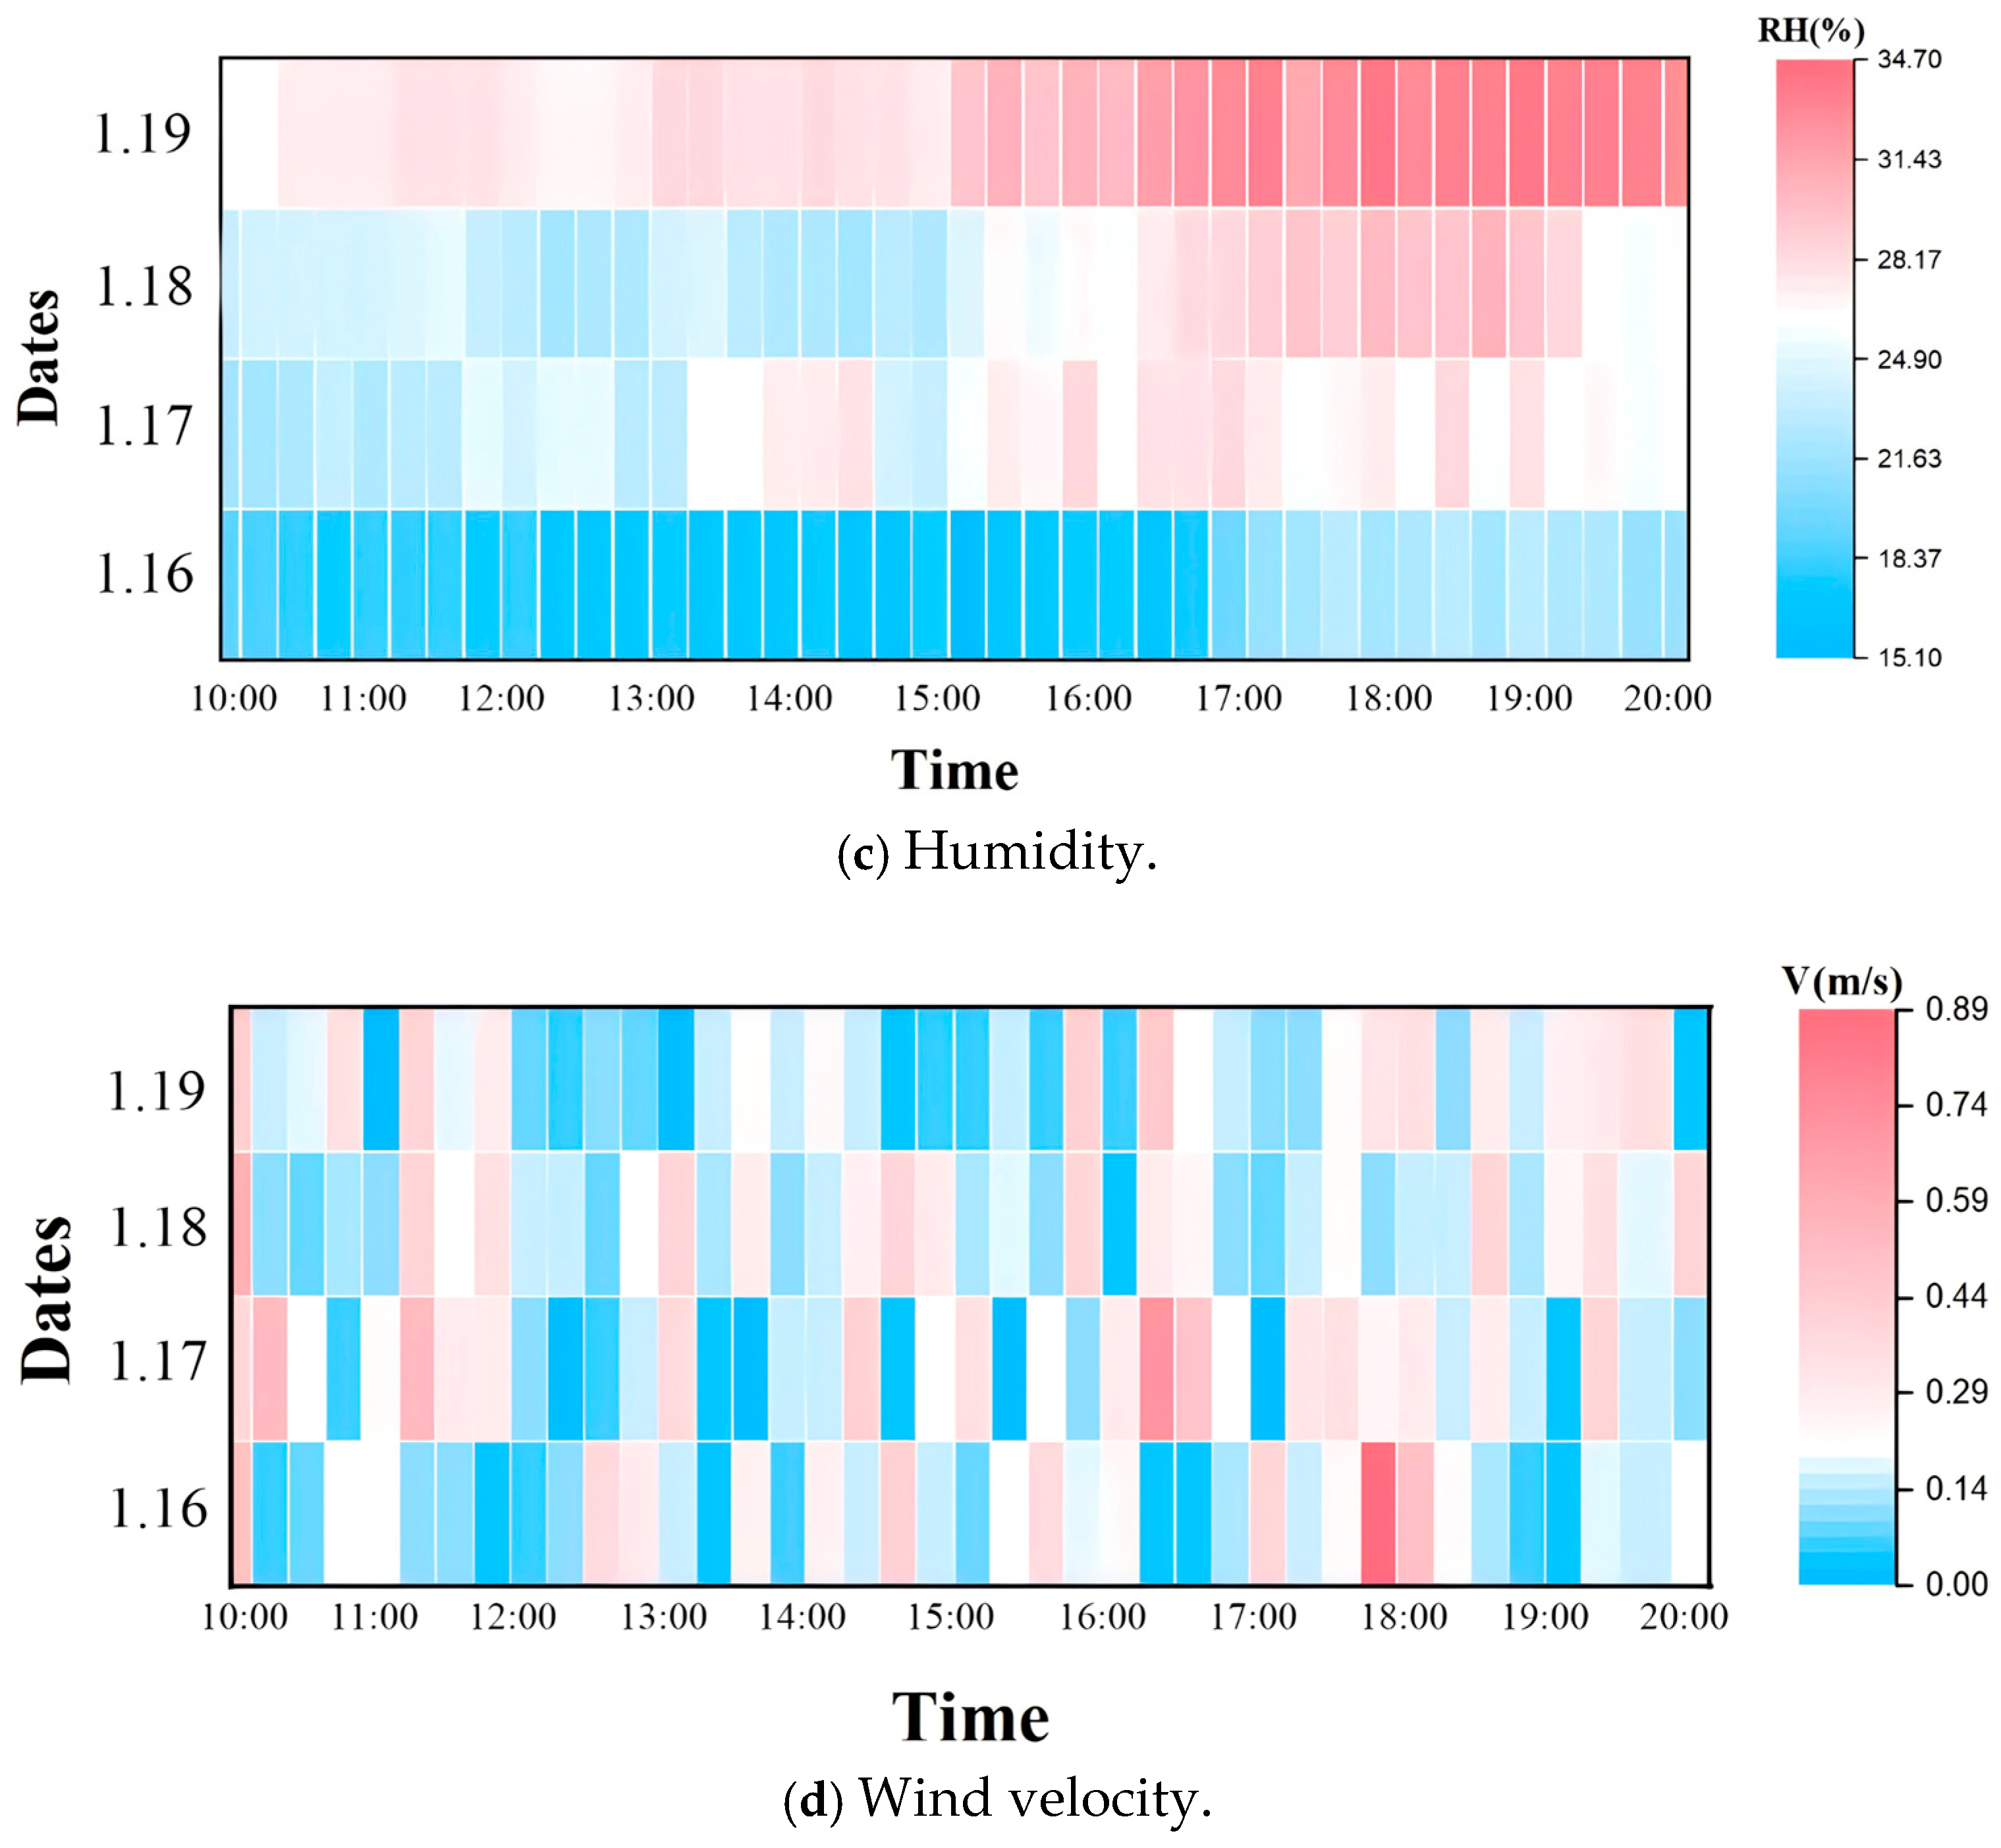
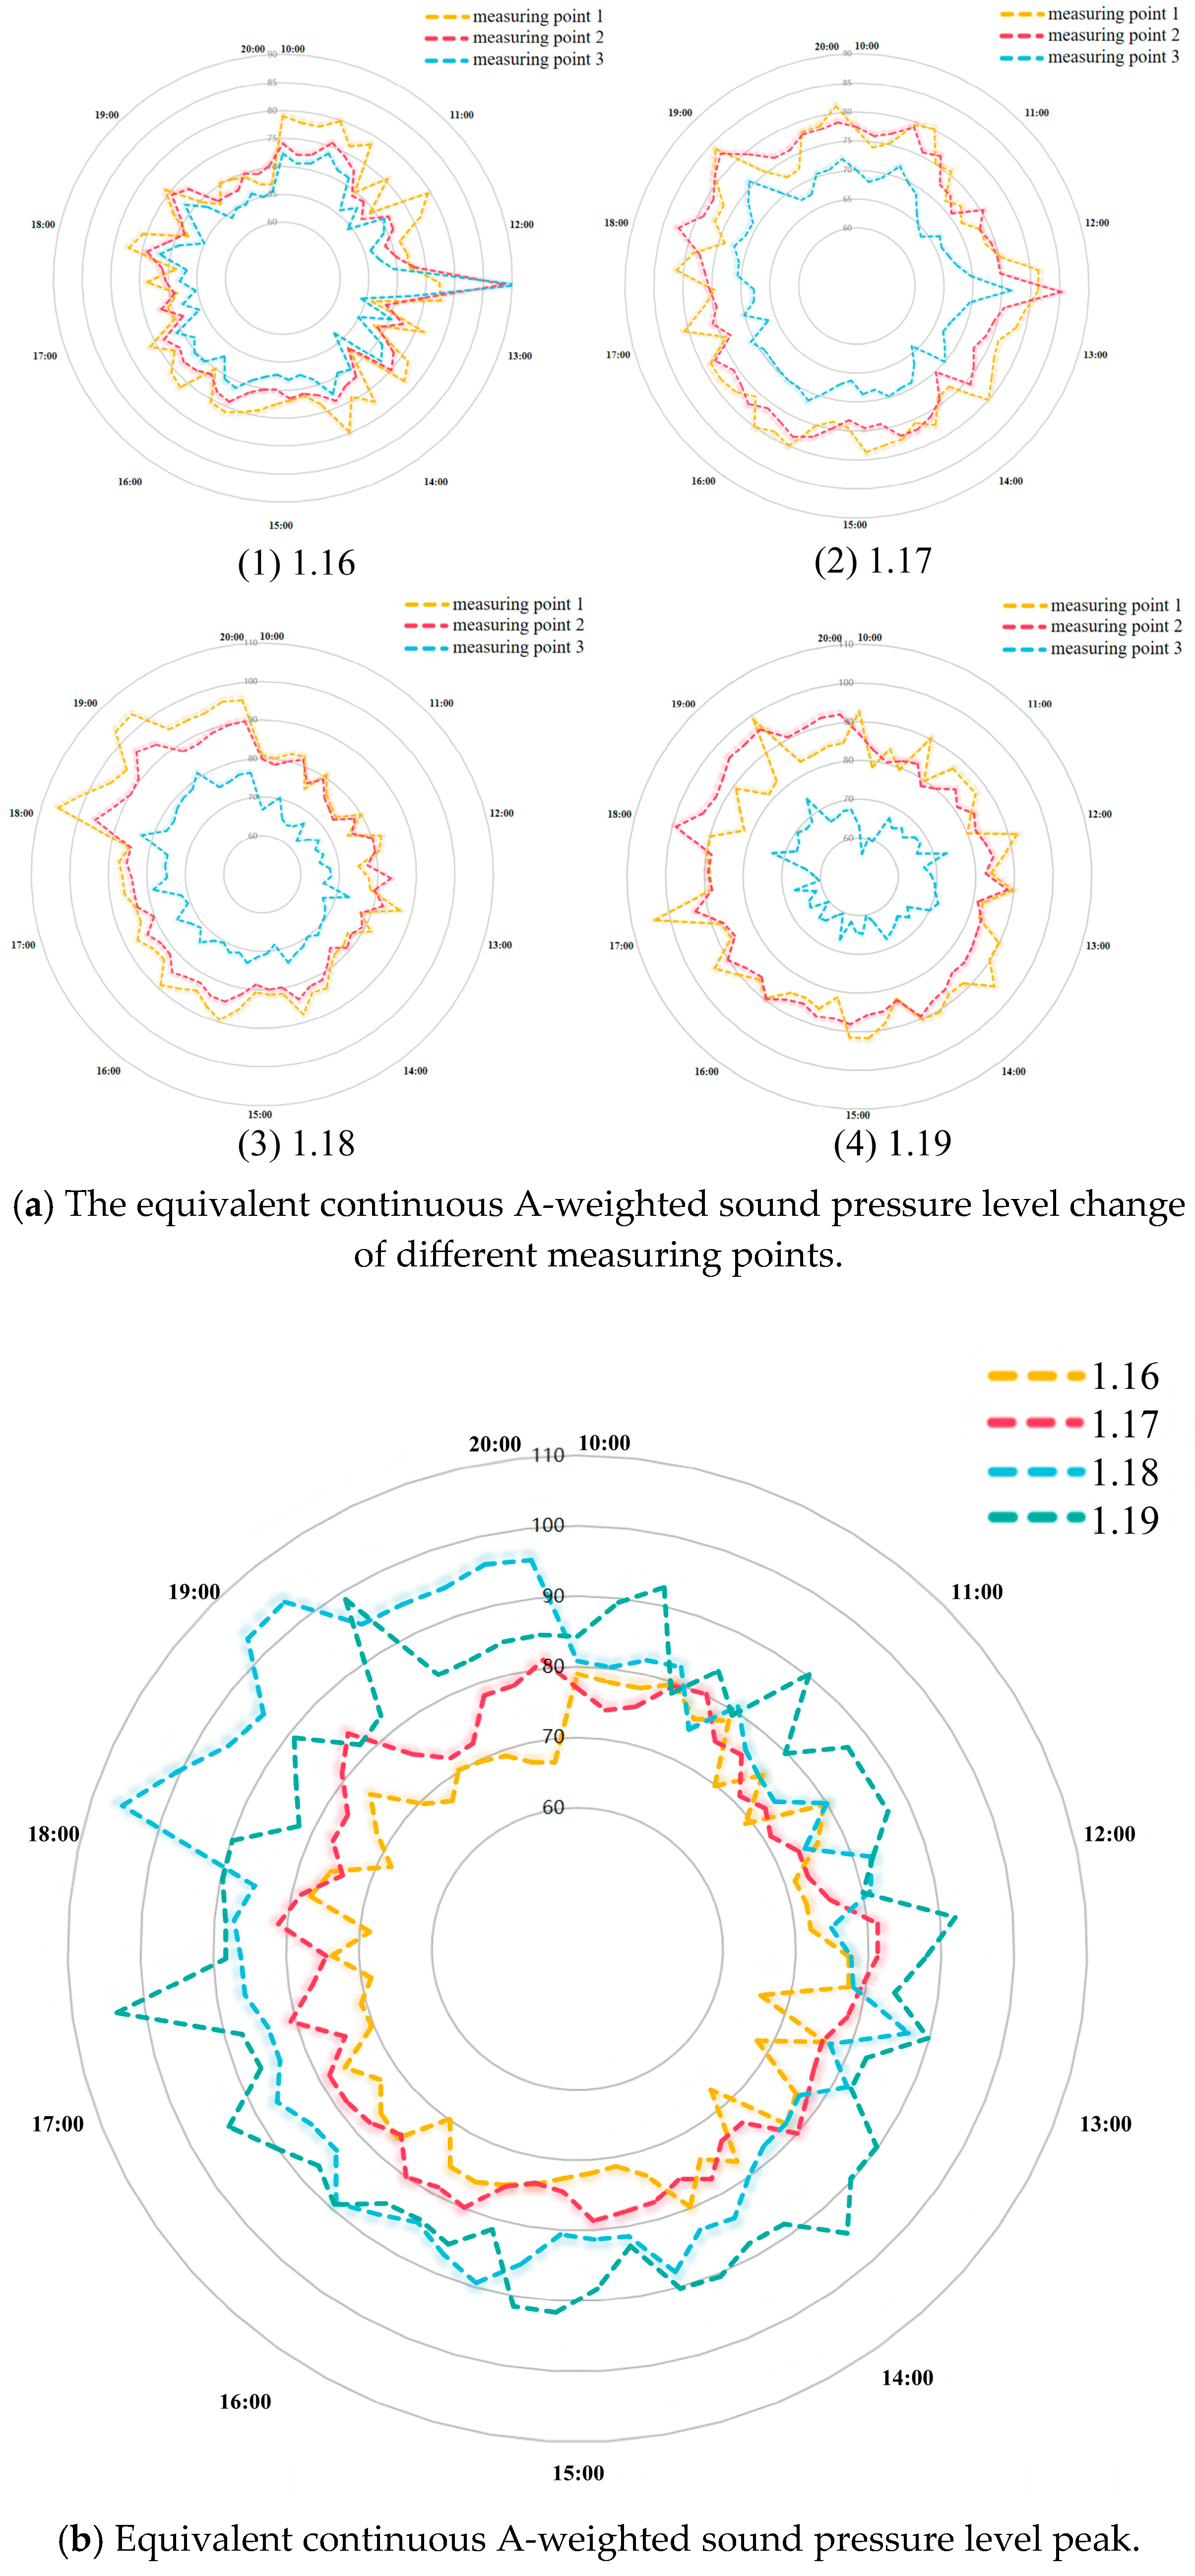
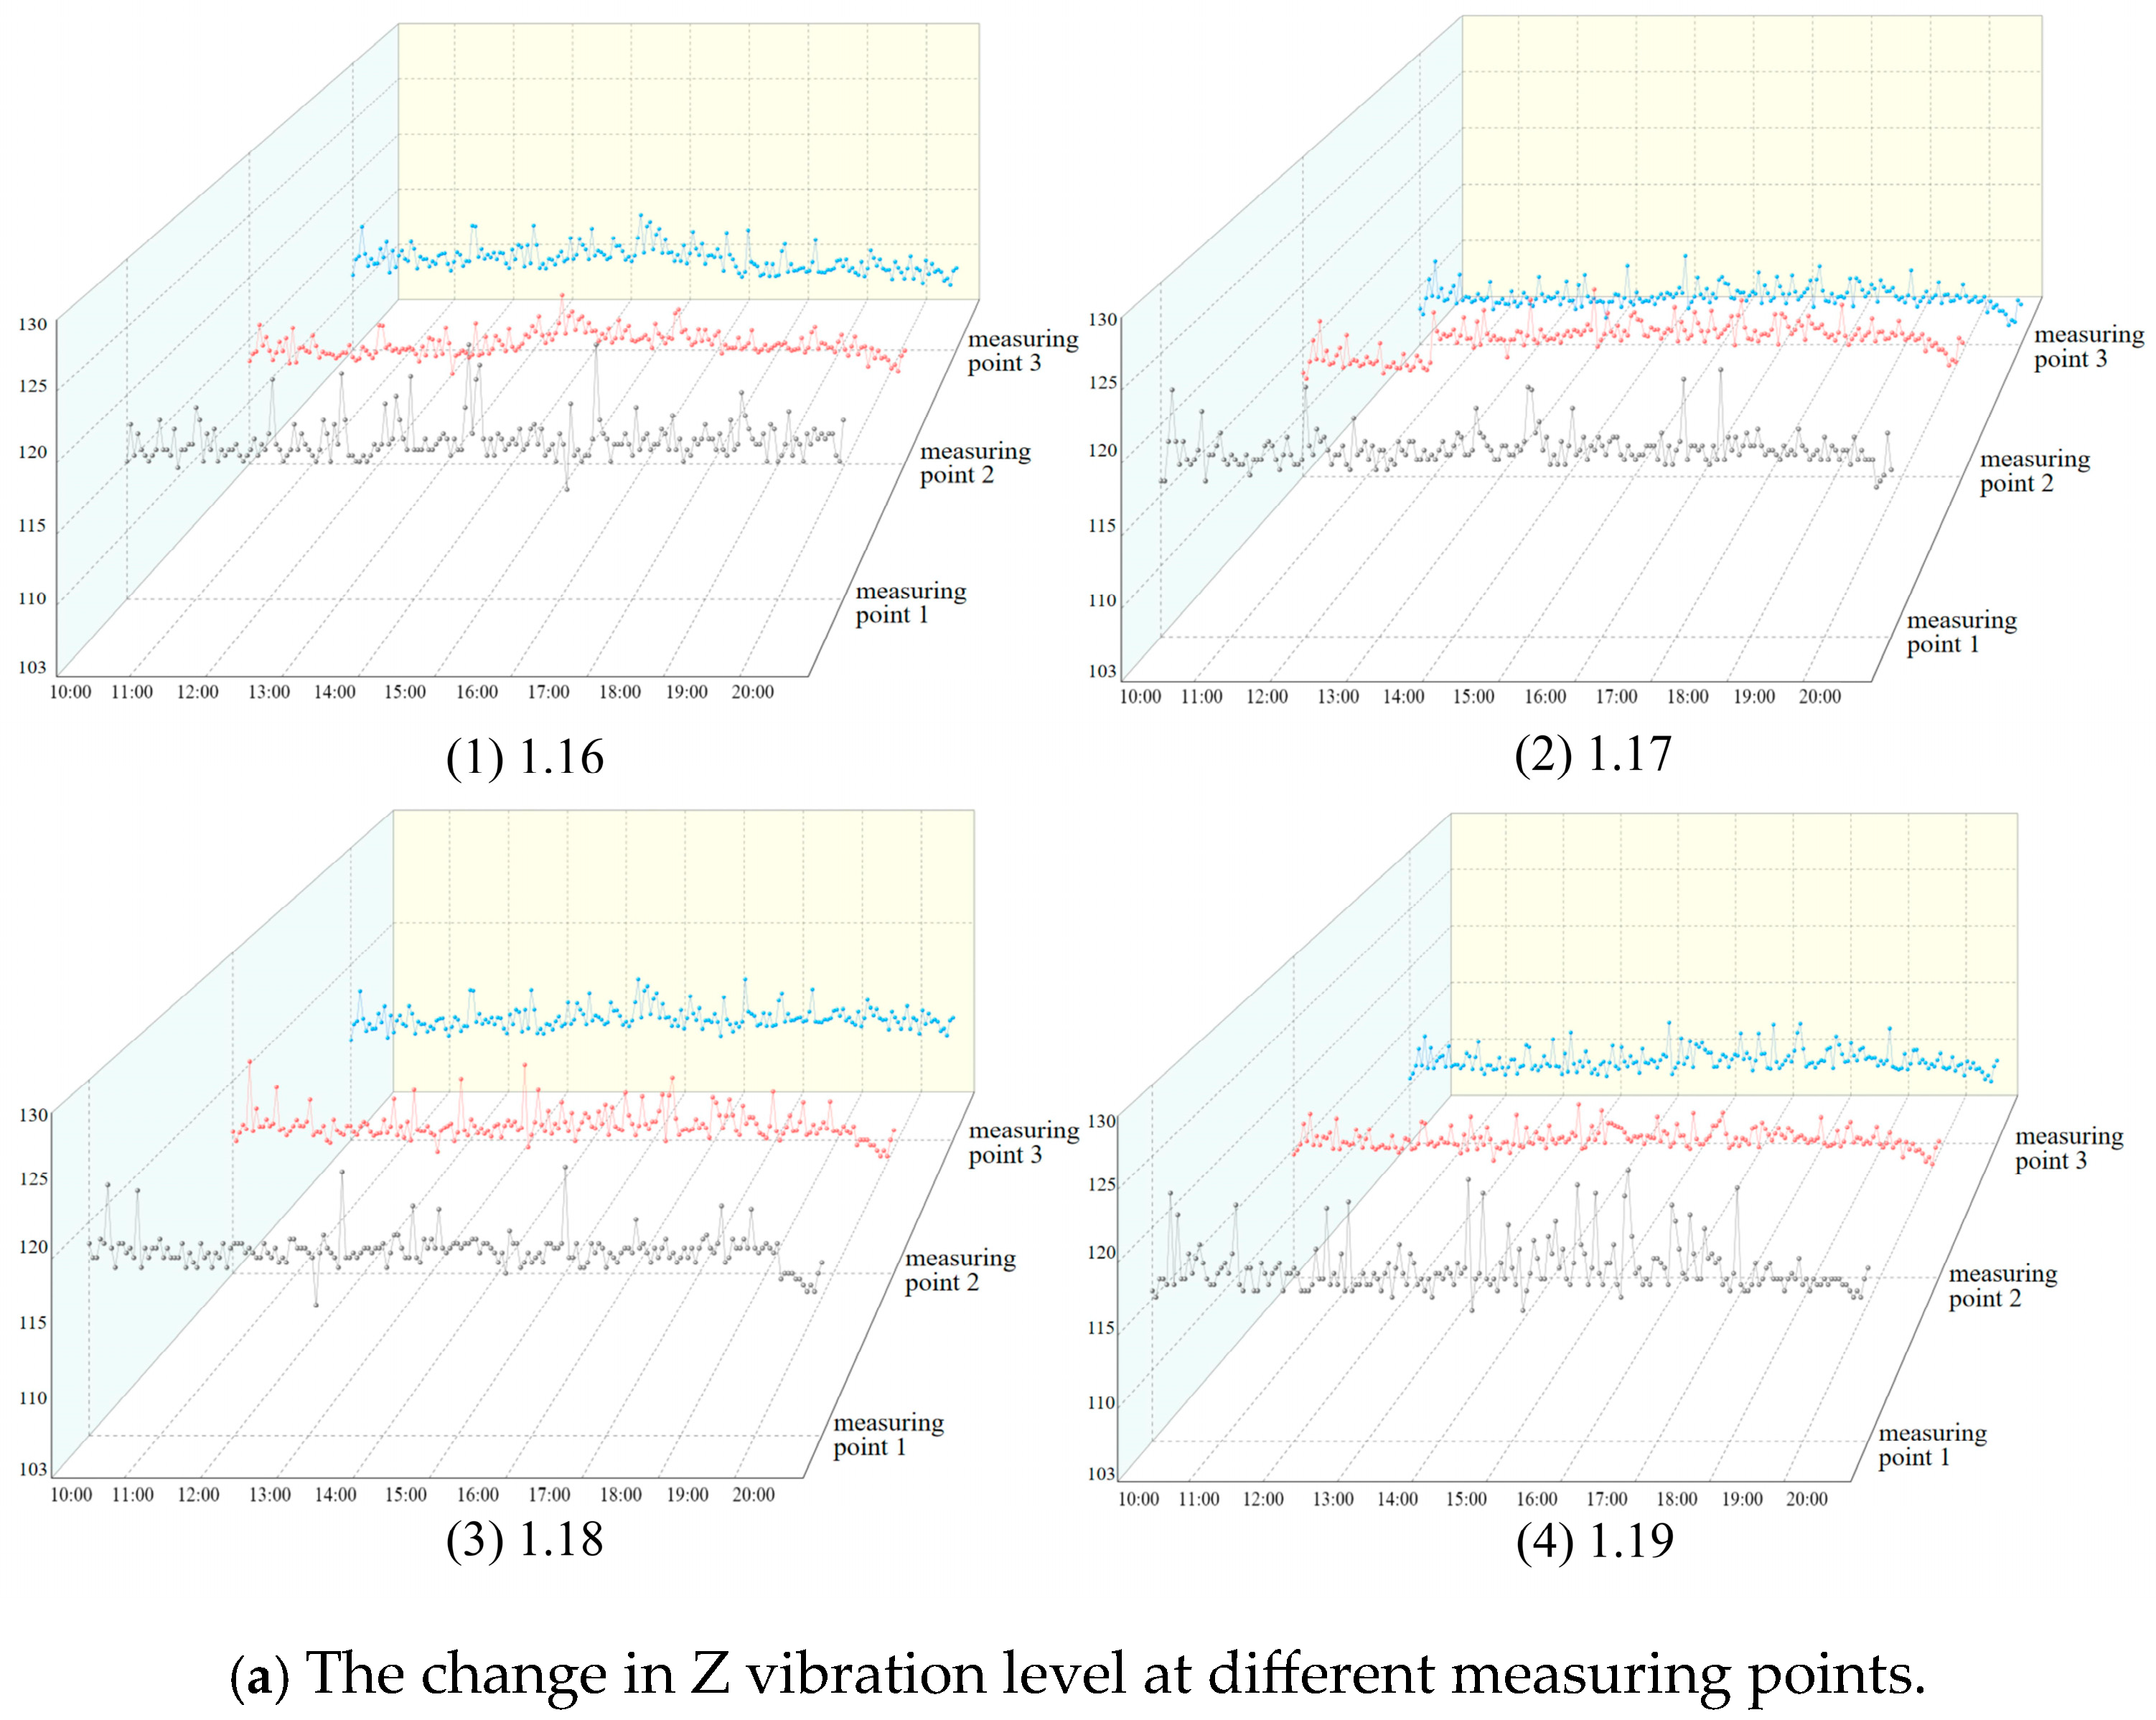
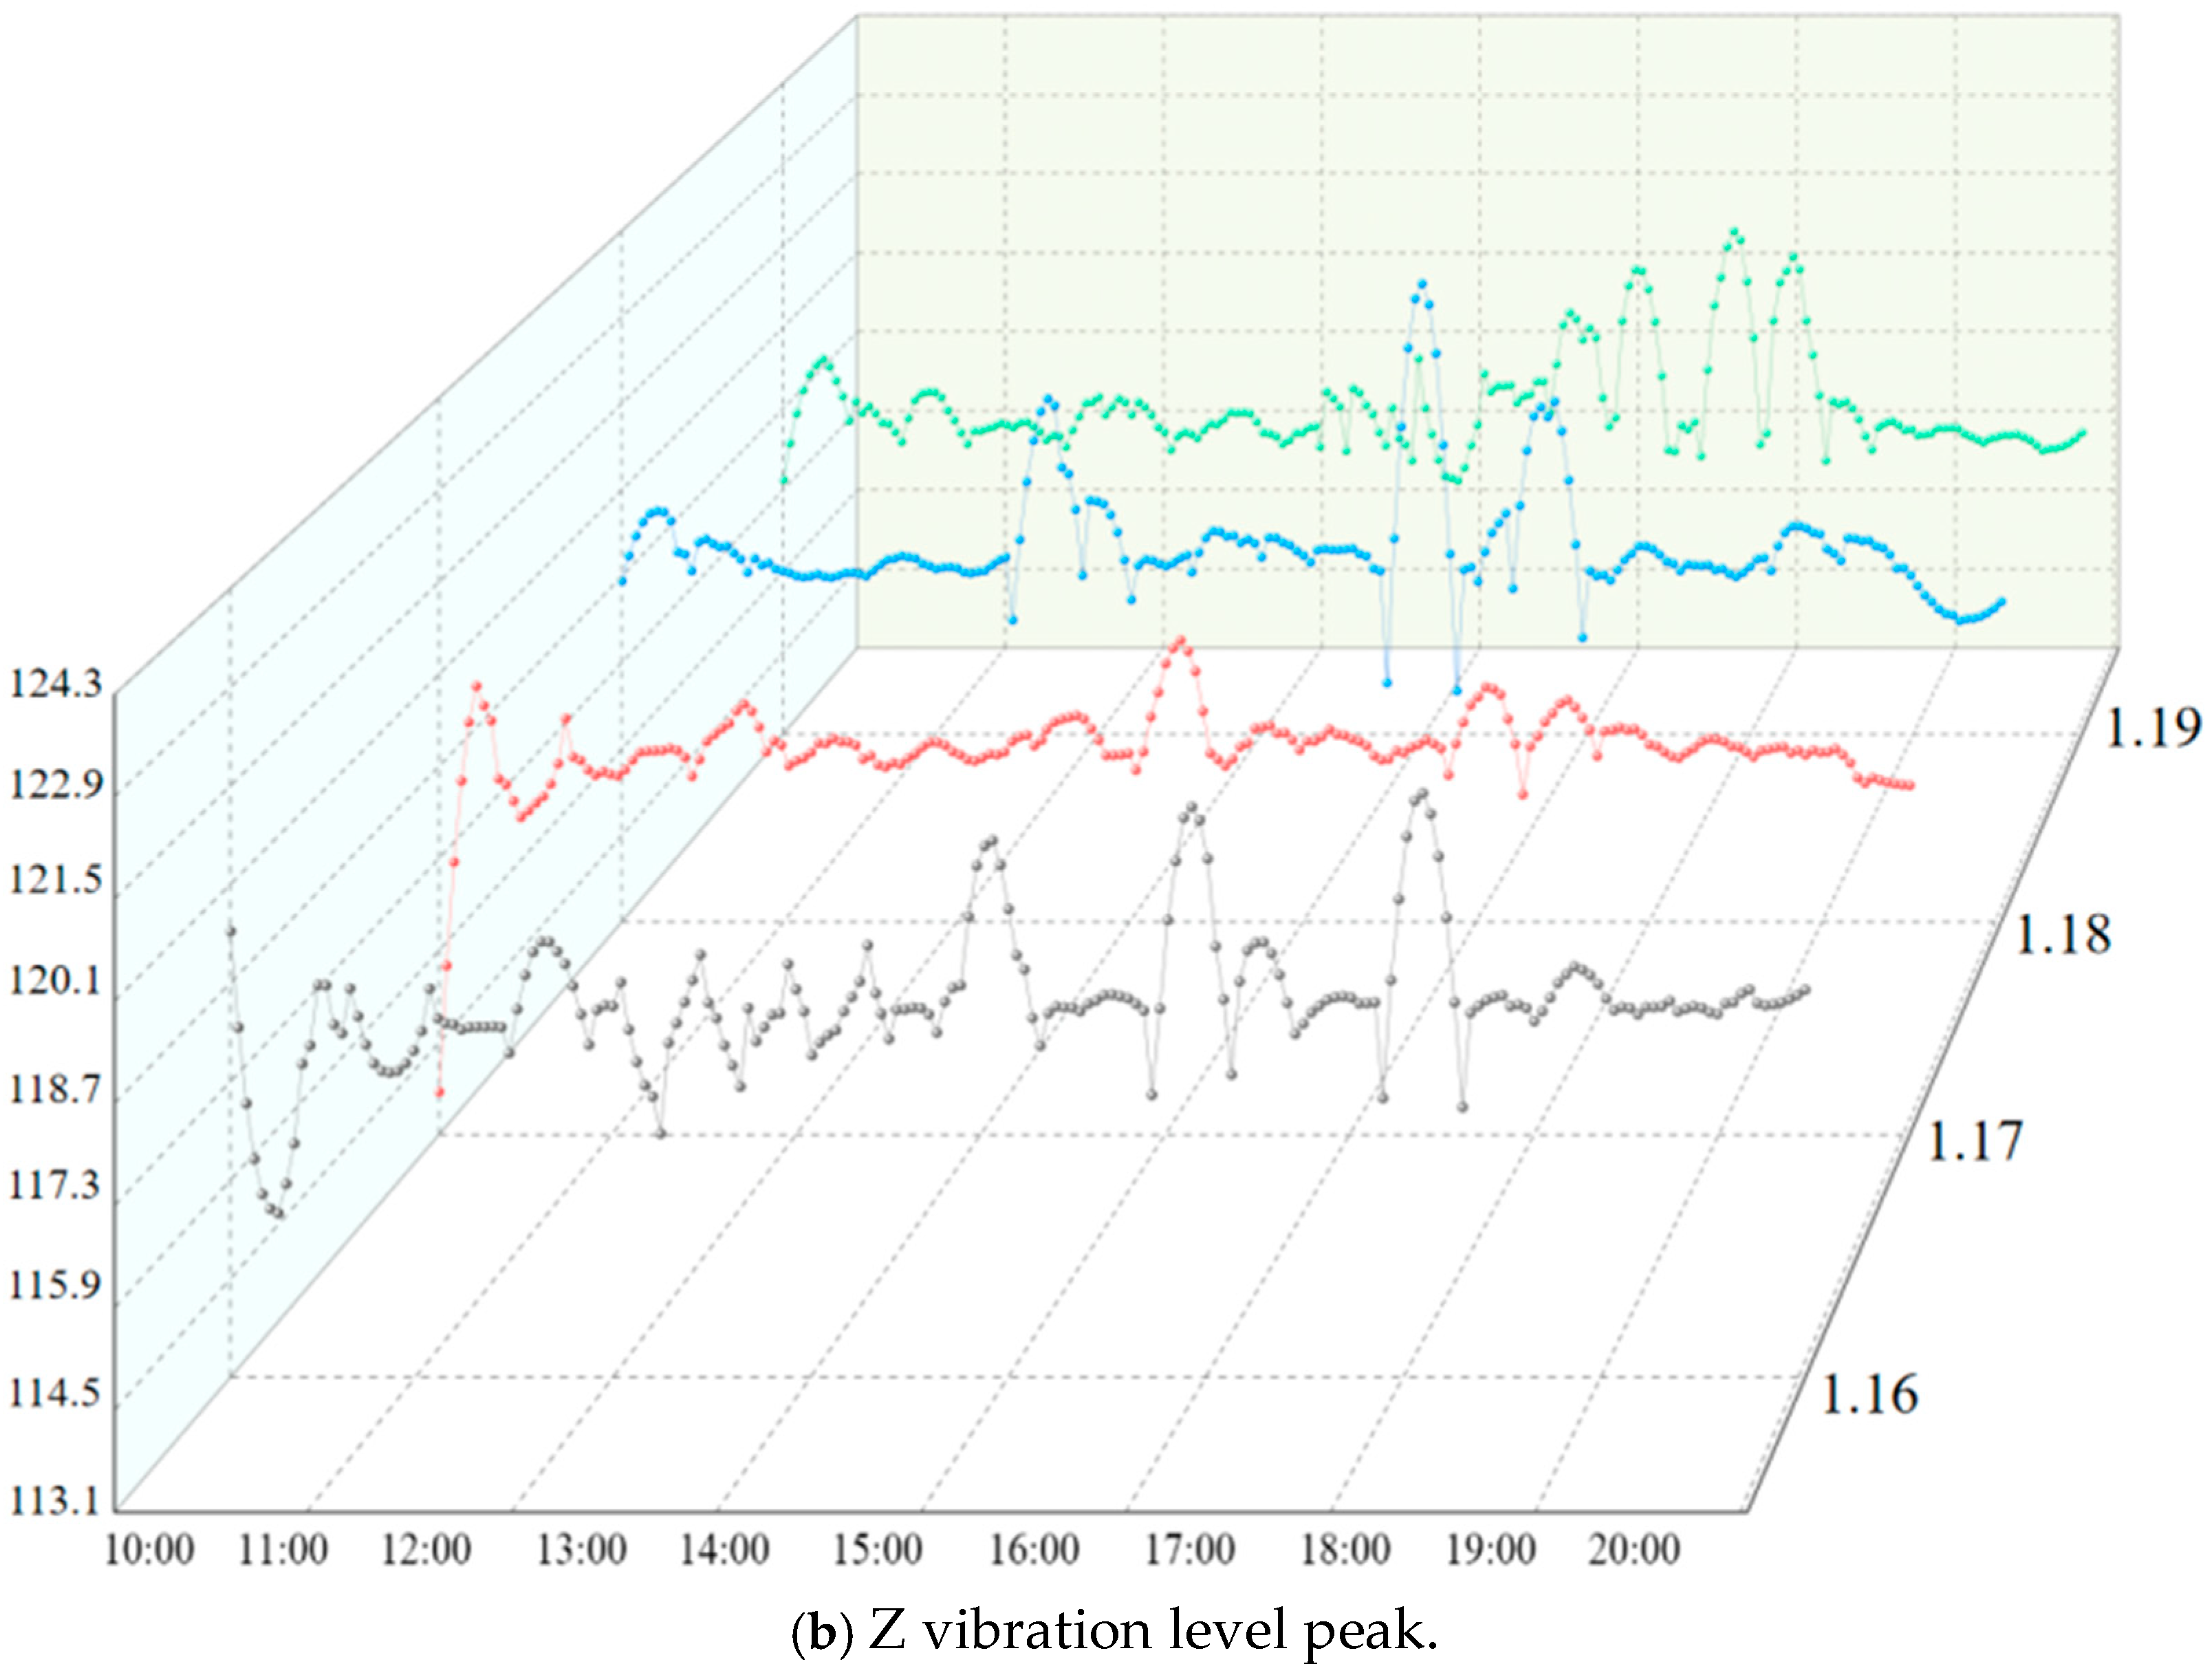
The instrument was placed at 9:00 on the day of the experiment and a 30 min pre-experiment was conducted to test whether the collected data were reliable. Data collection started at 10:00 on time and continued until 20:00. Then the collected data is summarized, the instrument is recovered and the site is cleaned. The study carried out a four-day continuous monitoring from 10:00 to 20:00 on 16–19 January 2025 (1.16–1.17 was a working day; 1.18–1.19 is the rest day). During the experiment, the average outdoor temperature was −0.5 °C.
2.2. Subject Information
The selection of sample size needs to take into account the reliability, representativeness and scientificity of the experimental results on the basis of meeting the experimental cost requirements. Li and Liu studied the influence of dynamic thermal environment step change process on human Thermal Sensation Voting, and designed 16 subjects for data collection [
43]. Wu et al. studied the influence of thermal and acoustic environment interaction on urban parks, and collected 262 questionnaires in summer and 201 in winter [
44]. Ren et al. studied the relationship between human EEG in thermal and acoustic environment and indoor office space comfort, and designed 19 participants (11 males and 8 females) for the experiment [
45].
Prior to the initiation of the formal research, to enhance the scientific rigor and rationality of the questionnaire design, the research team distributed 200 targeted pre-survey questionnaires to the activity groups in the underground spaces and TOD spaces focused on in this study, and ultimately achieved the effective recovery of all questionnaires. The data show that more than 80% of the respondents are mainly young activity groups and commuters. Passenger representatives and staff aged 22–31 are the two most typical groups on the site.
PMV confirms that human perception of the thermal environment is directly related to physiological characteristics such as metabolic rate and body surface area, and BMI is a key indicator to reflect these characteristics. The comfort of TOD underground space is affected by multiple physical fields such as heat, acoustic and vibration. BMI may regulate the subjective perception of these physical fields. Therefore, we incorporate the relevant content into the general thermal climate index for analysis.
In order to reduce the influence of individual differences such as age, physique, living habits and climate adaptability on the experimental results, this study adopts the ‘occupation-gender’ two-factor grouping design, which is divided into passenger group (3 males and 3 females) and staff group (6 males and 4 females). A total of 16 people participated in the questionnaire survey, and their basic background information such as gender, age and BMI were shown in
Table 1. Participants in the questionnaire survey were designed to be six people per day, including two passenger groups (one male and one female) and four staff groups (two male and two female). Each participant completed a questionnaire every 30 min during 10:00–20: 00, and each participant completed 20 questionnaires every day, and each participant participated in the questionnaire survey for at least one day on the working day and the rest day. In the actual survey, due to the limitation of the work arrangement of some personnel in the peak period of the experimental site, there was a lack of questionnaire collection, and the effective questionnaire of the staff group was 236. The passenger group added an additional male subject to supplement the sample during the peak period of the rest day, with 177 valid questionnaires. The final valid questionnaires were 413.
Each participant did not have a claustrophobic tendency in the underground space and no hearing/vestibular dysfunction. Before the experiment, the relevant personnel provided participants with a detailed description of the experimental process and the content of the questionnaire. Participants were asked to complete the questionnaire based on their true feelings. The experimenter ensures the confidentiality of the participants’ basic information and is only used for research purposes to ensure the authenticity and reliability of the participants’ answers. This experiment fully considered the health of the participants. If the participants reported any discomfort, the experiment would be interrupted immediately. The questionnaire survey is in
Appendix A.
2.3. Measurements
Measurements include indoor multi-physical field environment measurements and questionnaire surveys of participants. The data include the ambient temperature (T °C), relative humidity (RH %), and wind velocity (V m/s) of the thermal environment; the equivalent continuous A-weighted sound pressure level (LAeq dB) of the acoustic pressure environment; the Z vibration level (Z-VL dB) of the vibration environment. All measuring instruments are in accordance with the ISO-7726 standard and calibrated before the experiment. The sampling interval of environmental parameters is 1 min.
Table 2 is the instrument information.
A total of three sampling points were set up near the height of 1.5 m in the experimental site.
The questionnaire includes comfortable voting, feeling voting and evaluation voting. Comfort voting and sensory voting adopt a seven-point system; the evaluation vote is measured on a five-point scale.
4. Discussion
4.1. Correlation Analysis
Correlation analysis was used to study the linear relationship between heat, acoustic, vibration in winter and temperature, humidity, equivalent continuous A-weighted sound pressure level, Z vibration level and so on. Pearson coefficient was used to measure the strength of the linear relationship between the two variables [
51]. When the correlation coefficient (r
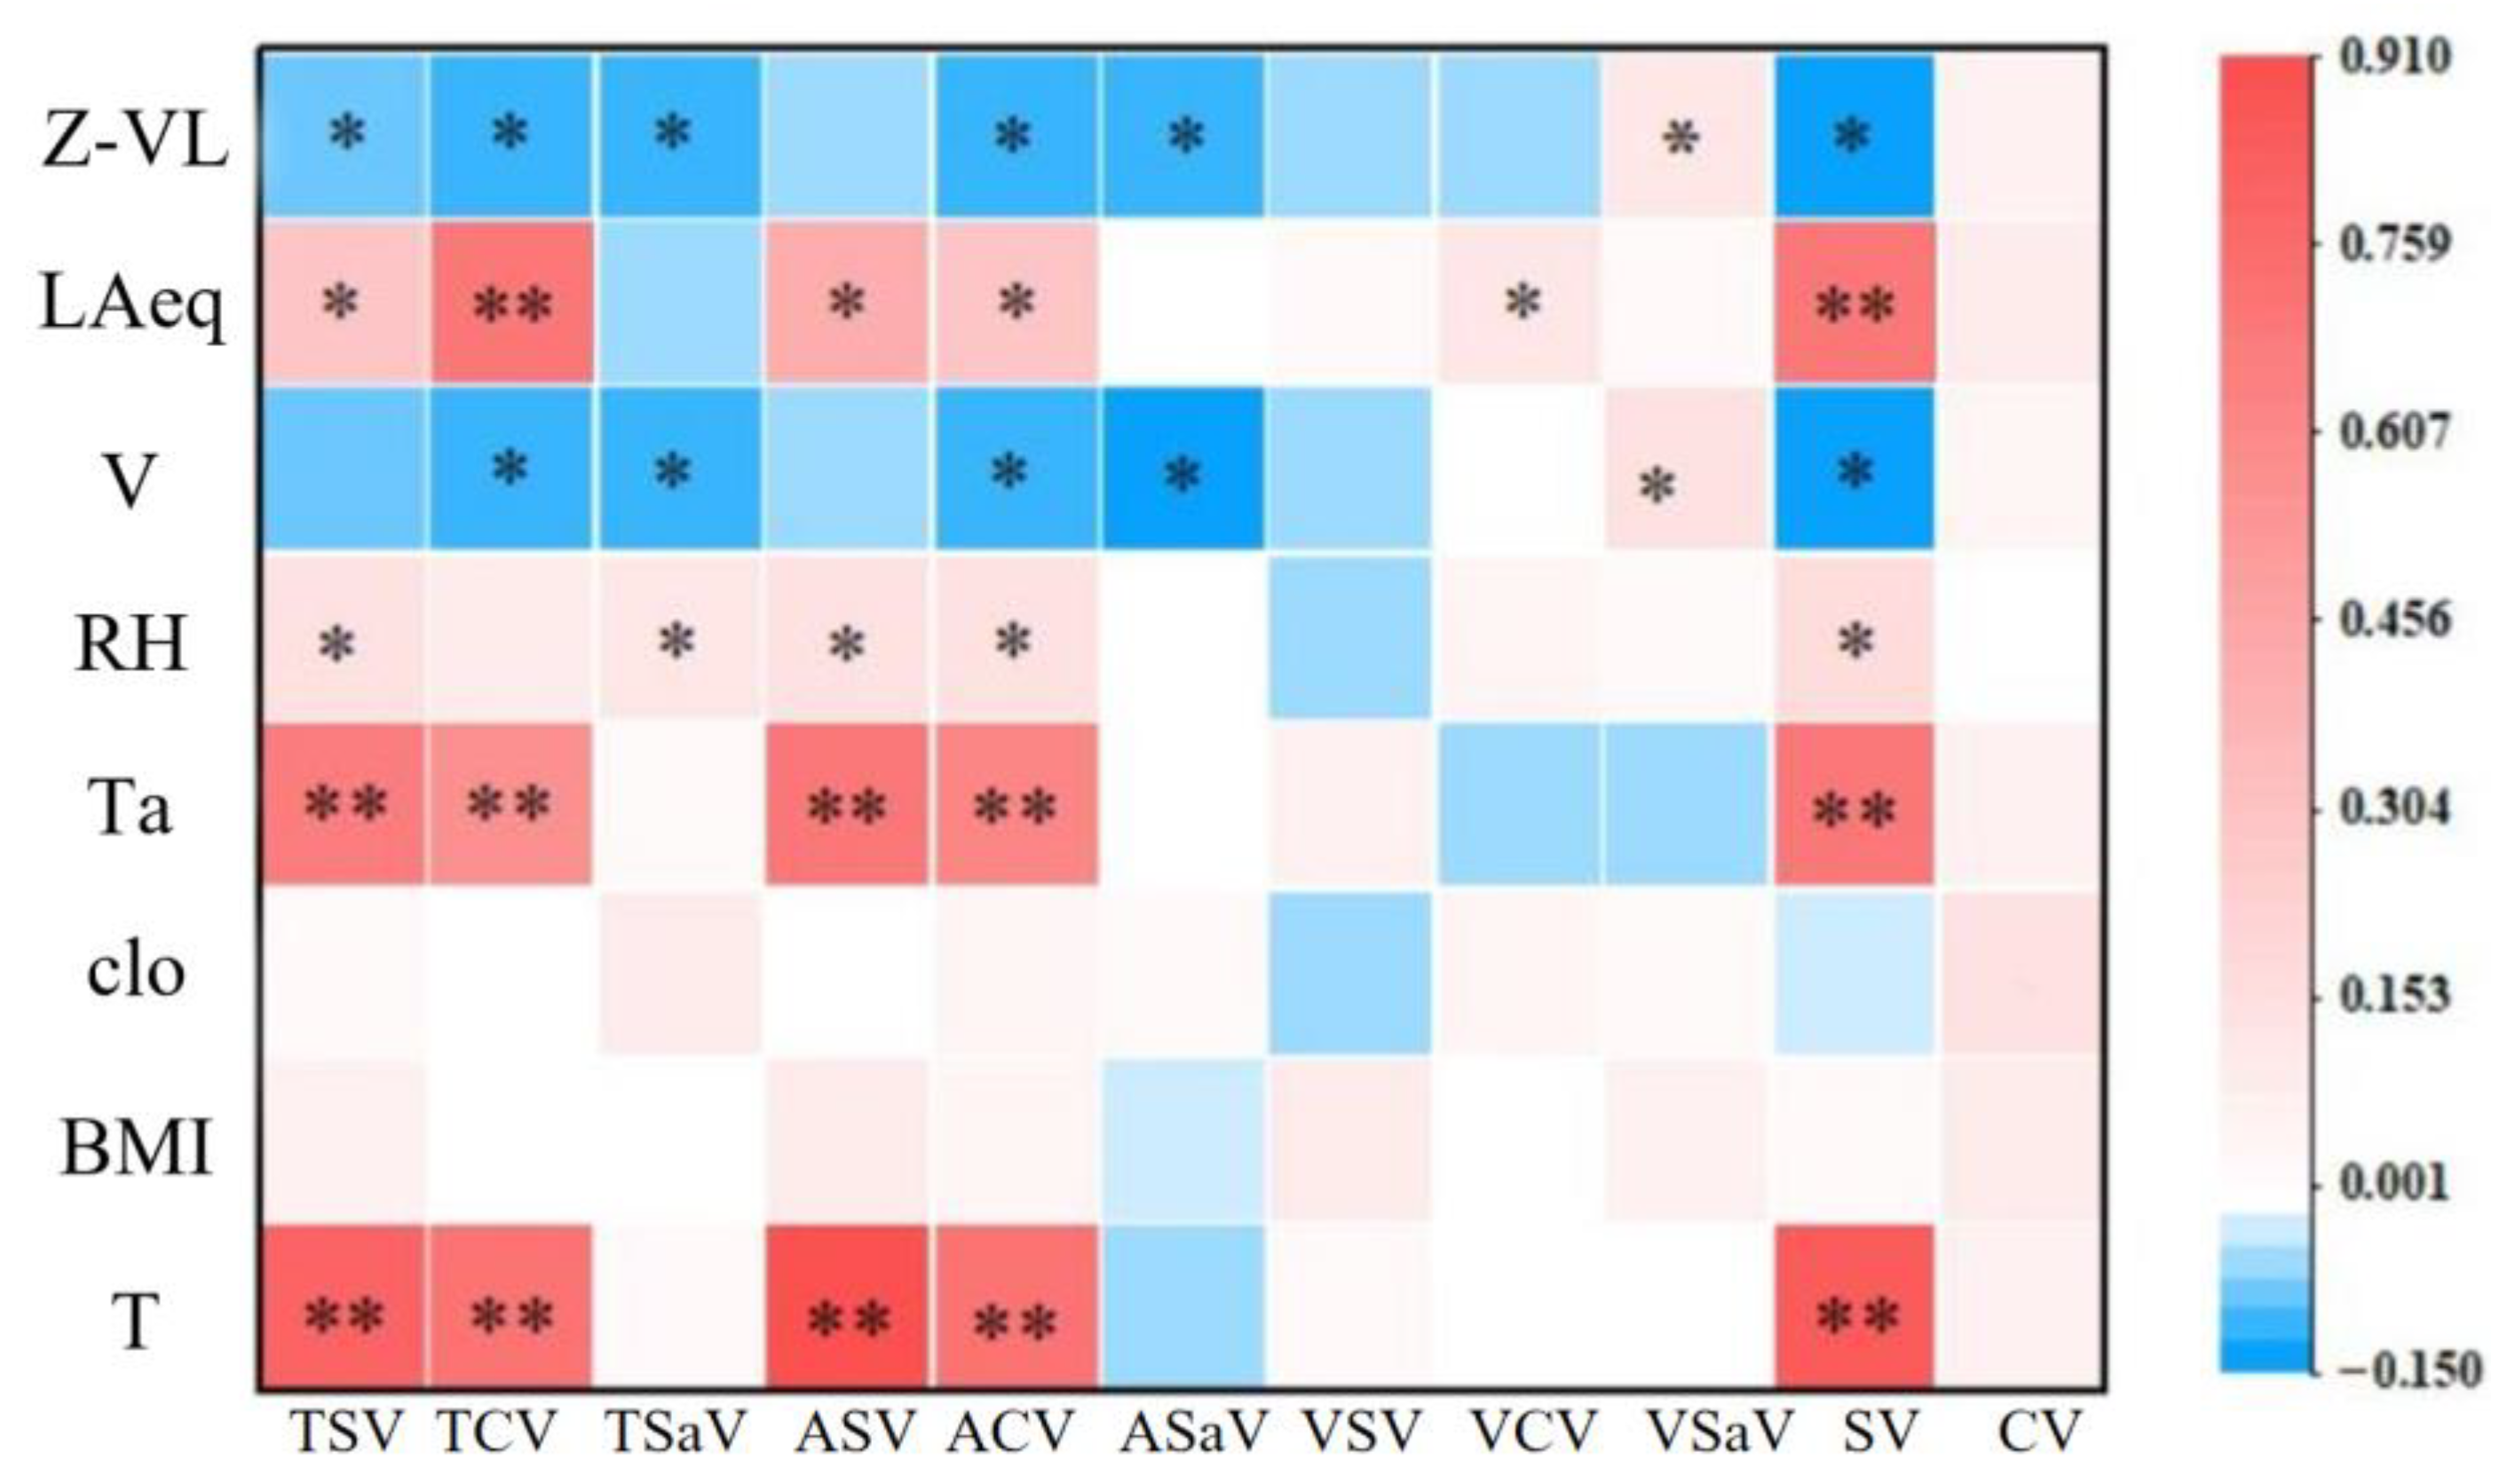
s) > ±0.60, it is proved that there is a strong positive correlation or negative correlation. Calculate the correlation coefficient between the various influencing factors, as shown in
Figure 7.
The results show that LAeq has a relatively strong positive correlation with multiple subjective evaluation indicators (such as TSV, ASV, SV, etc.), which indicates that there is a synergistic correlation between acoustic level and human activities, environmental stimuli and other factors. When the acoustic is enhanced, the corresponding subjective Sensation variables tend to increase simultaneously. Air temperature, Ta, also shows a significant positive correlation with multiple subjective evaluation indicators, which is consistent with the interaction between temperature and humidity, RH, affecting human Thermal Sensation Voting. However, the correlation between Z-VL and most subjective evaluation indexes is weak and less affected by the others. The driving effect of vibration on human subjective feelings is not as direct as that of acoustic and thermal environment.
There is a significant correlation between various subjective evaluation indicators, and the environmental Sensation of one dimension will affect the Sensation of other dimensions. In the existing research of multi-physical fields on human comfort, acoustic has a significant effect on thermal comfort, temperature has a significant effect on acoustic, and the influence weight of ambient temperature is greater than that of acoustic [
32,
33,
34,
36,
37]. Fanger’s research shows that 40 dB and 85 dB acoustic have no significant effect on thermal comfort [
35]. L. T. Wong believes that indoor thermal environment is more important than acoustic in indoor environment regulation.
However, in this study, LAeq, as the acoustic environment data, has the strongest correlation with Thermal Sensation Voting. In the TOD underground space, the influence of acoustic on the subjective Sensation of human thermal environment is greater than that of ambient temperature. As the vibration environment data, Z-VL has a certain negative correlation with the thermal environment and the acoustic environment Sensation vote, but the correlation with the vibration environment itself is not obvious, indicating that the vibration has an indirect adjustment effect on the thermal and Acoustic Sensation Voting, but it is difficult to directly affect the subjective feeling of vibration. In addition, the largest correlation of subjective Sensation of vibration in the figure is LAeq, which further proves that there is a strong coupling effect between acoustic environment and Vibration Sensation Voting, and acoustic stimulation may change the subjective Sensation of vibration.
4.2. Single Physical Field Sensation Evaluation Model
4.2.1. Thermal Sensation Voting
According to the relevant characteristics shown in the correlation analysis, the universal thermal climate index (UTCI) [
52] was calculated to establish the thermal comfort evaluation model.
Developed by the International Society of Biometeorology (ISB), UTCI integrates multiple meteorological variables such as temperature, relative humidity, wind velocity and average radiation temperature, as well as individual physiological characteristics such as age, gender, height, weight, clothing insulation and metabolic rate to simulate the human body’s comprehensive thermal stress response to the outdoor environment. UTCI has ten different thermal stress levels throughout the year, as shown in
Table 3. This paper mainly involves five comfort levels of comfort–thermal discomfort.
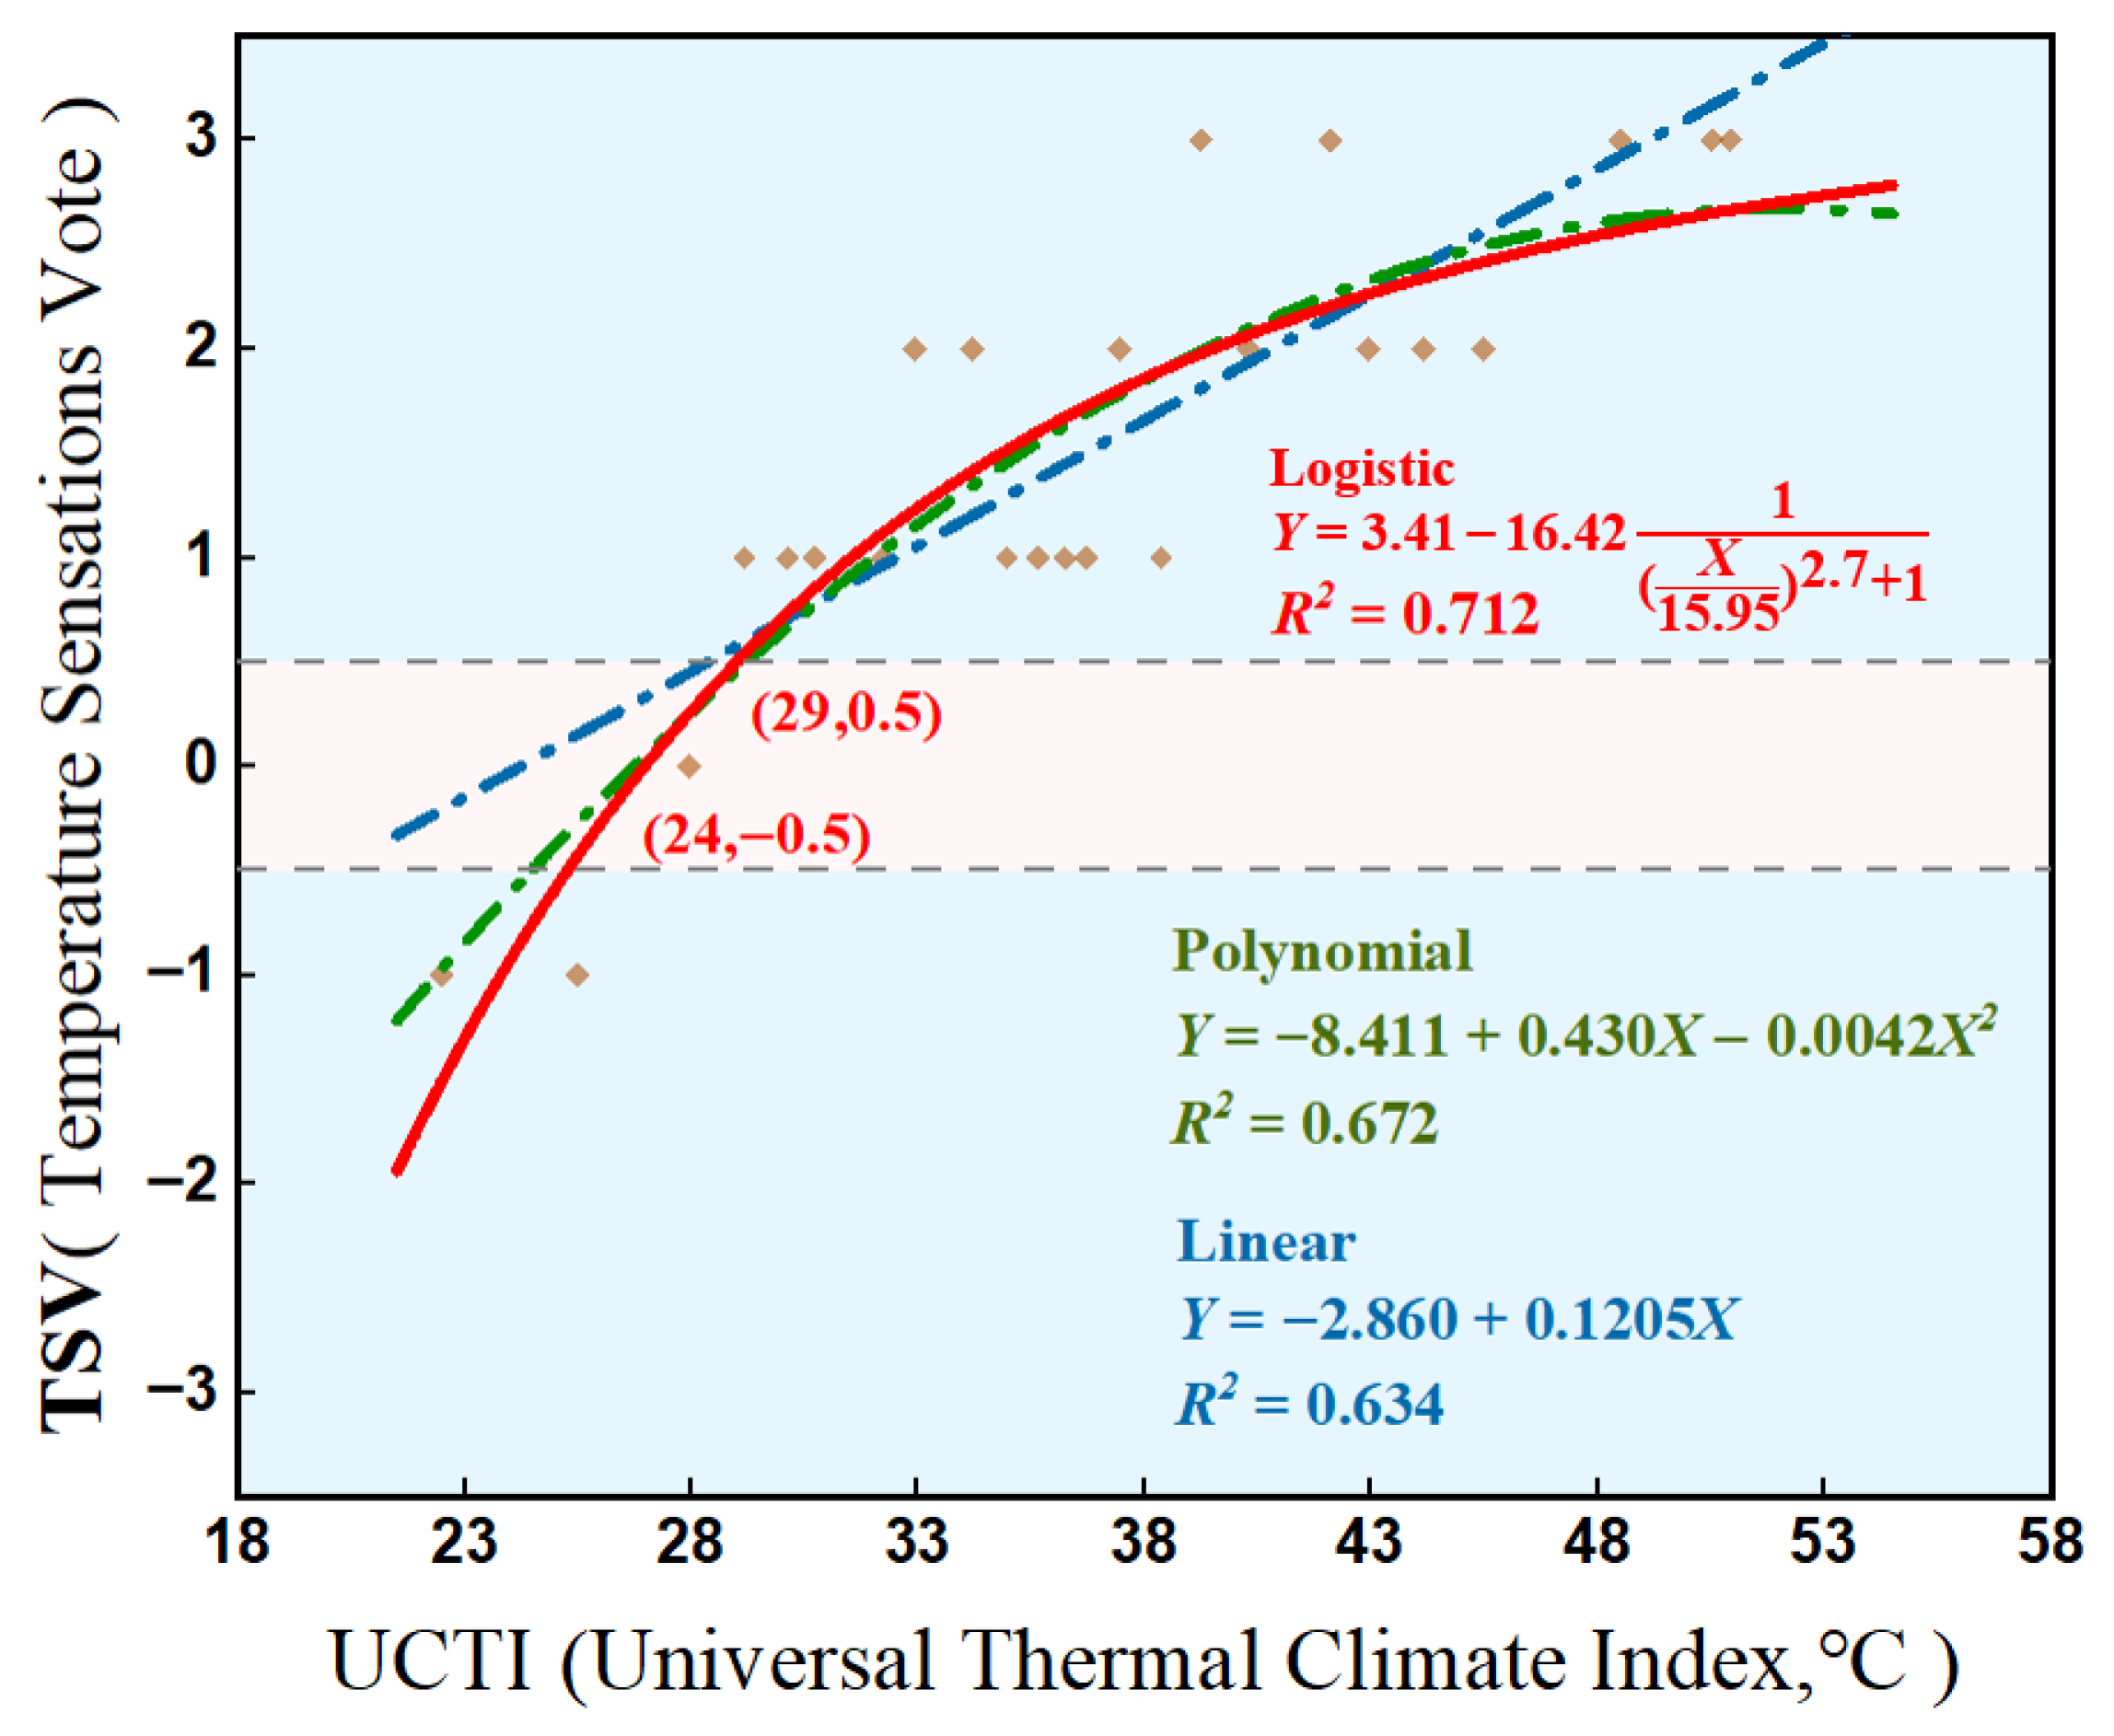
In order to predict the Thermal Sensation Voting (TSV) in the extreme operation mode of TOD underground space in winter, linear, quadratic polynomial and Logistic fitting analysis are carried out with UCTI as the dependent variable, as shown in
Figure 8. Among them, the Logistic regression model has the highest R
2 = 0.712, and the predictive TSV model has a good performance. The TSV value of underground space increases with the increase in UCTI.
ASHRAE 55-2023 defines the comfort zone as an area that satisfies the thermal unacceptable percentage of − 0.5 < PMV < 0.5 and 20% in most practical situations [
47]. If the range of −0.5 < TSV < 0.5 specified in ASHRAE 55-2023 is adopted, the comfortable UTCI area of underground space is 24–29 °C. In particular, the UCTI range of the comfort zone judged by the ASHRAE 55-2023 standard is quite different from the UCTI comfort range specified by the ISB. The minimum UCTI value of the latter is 15 °C lower than the minimum value of ASHRAE 55, and the maximum value is 3 °C lower than ASHRAE 55. It can be seen that people in public underground space have more stringent requirements for thermal environment and lower tolerance.
4.2.2. Acoustic Sensation Voting
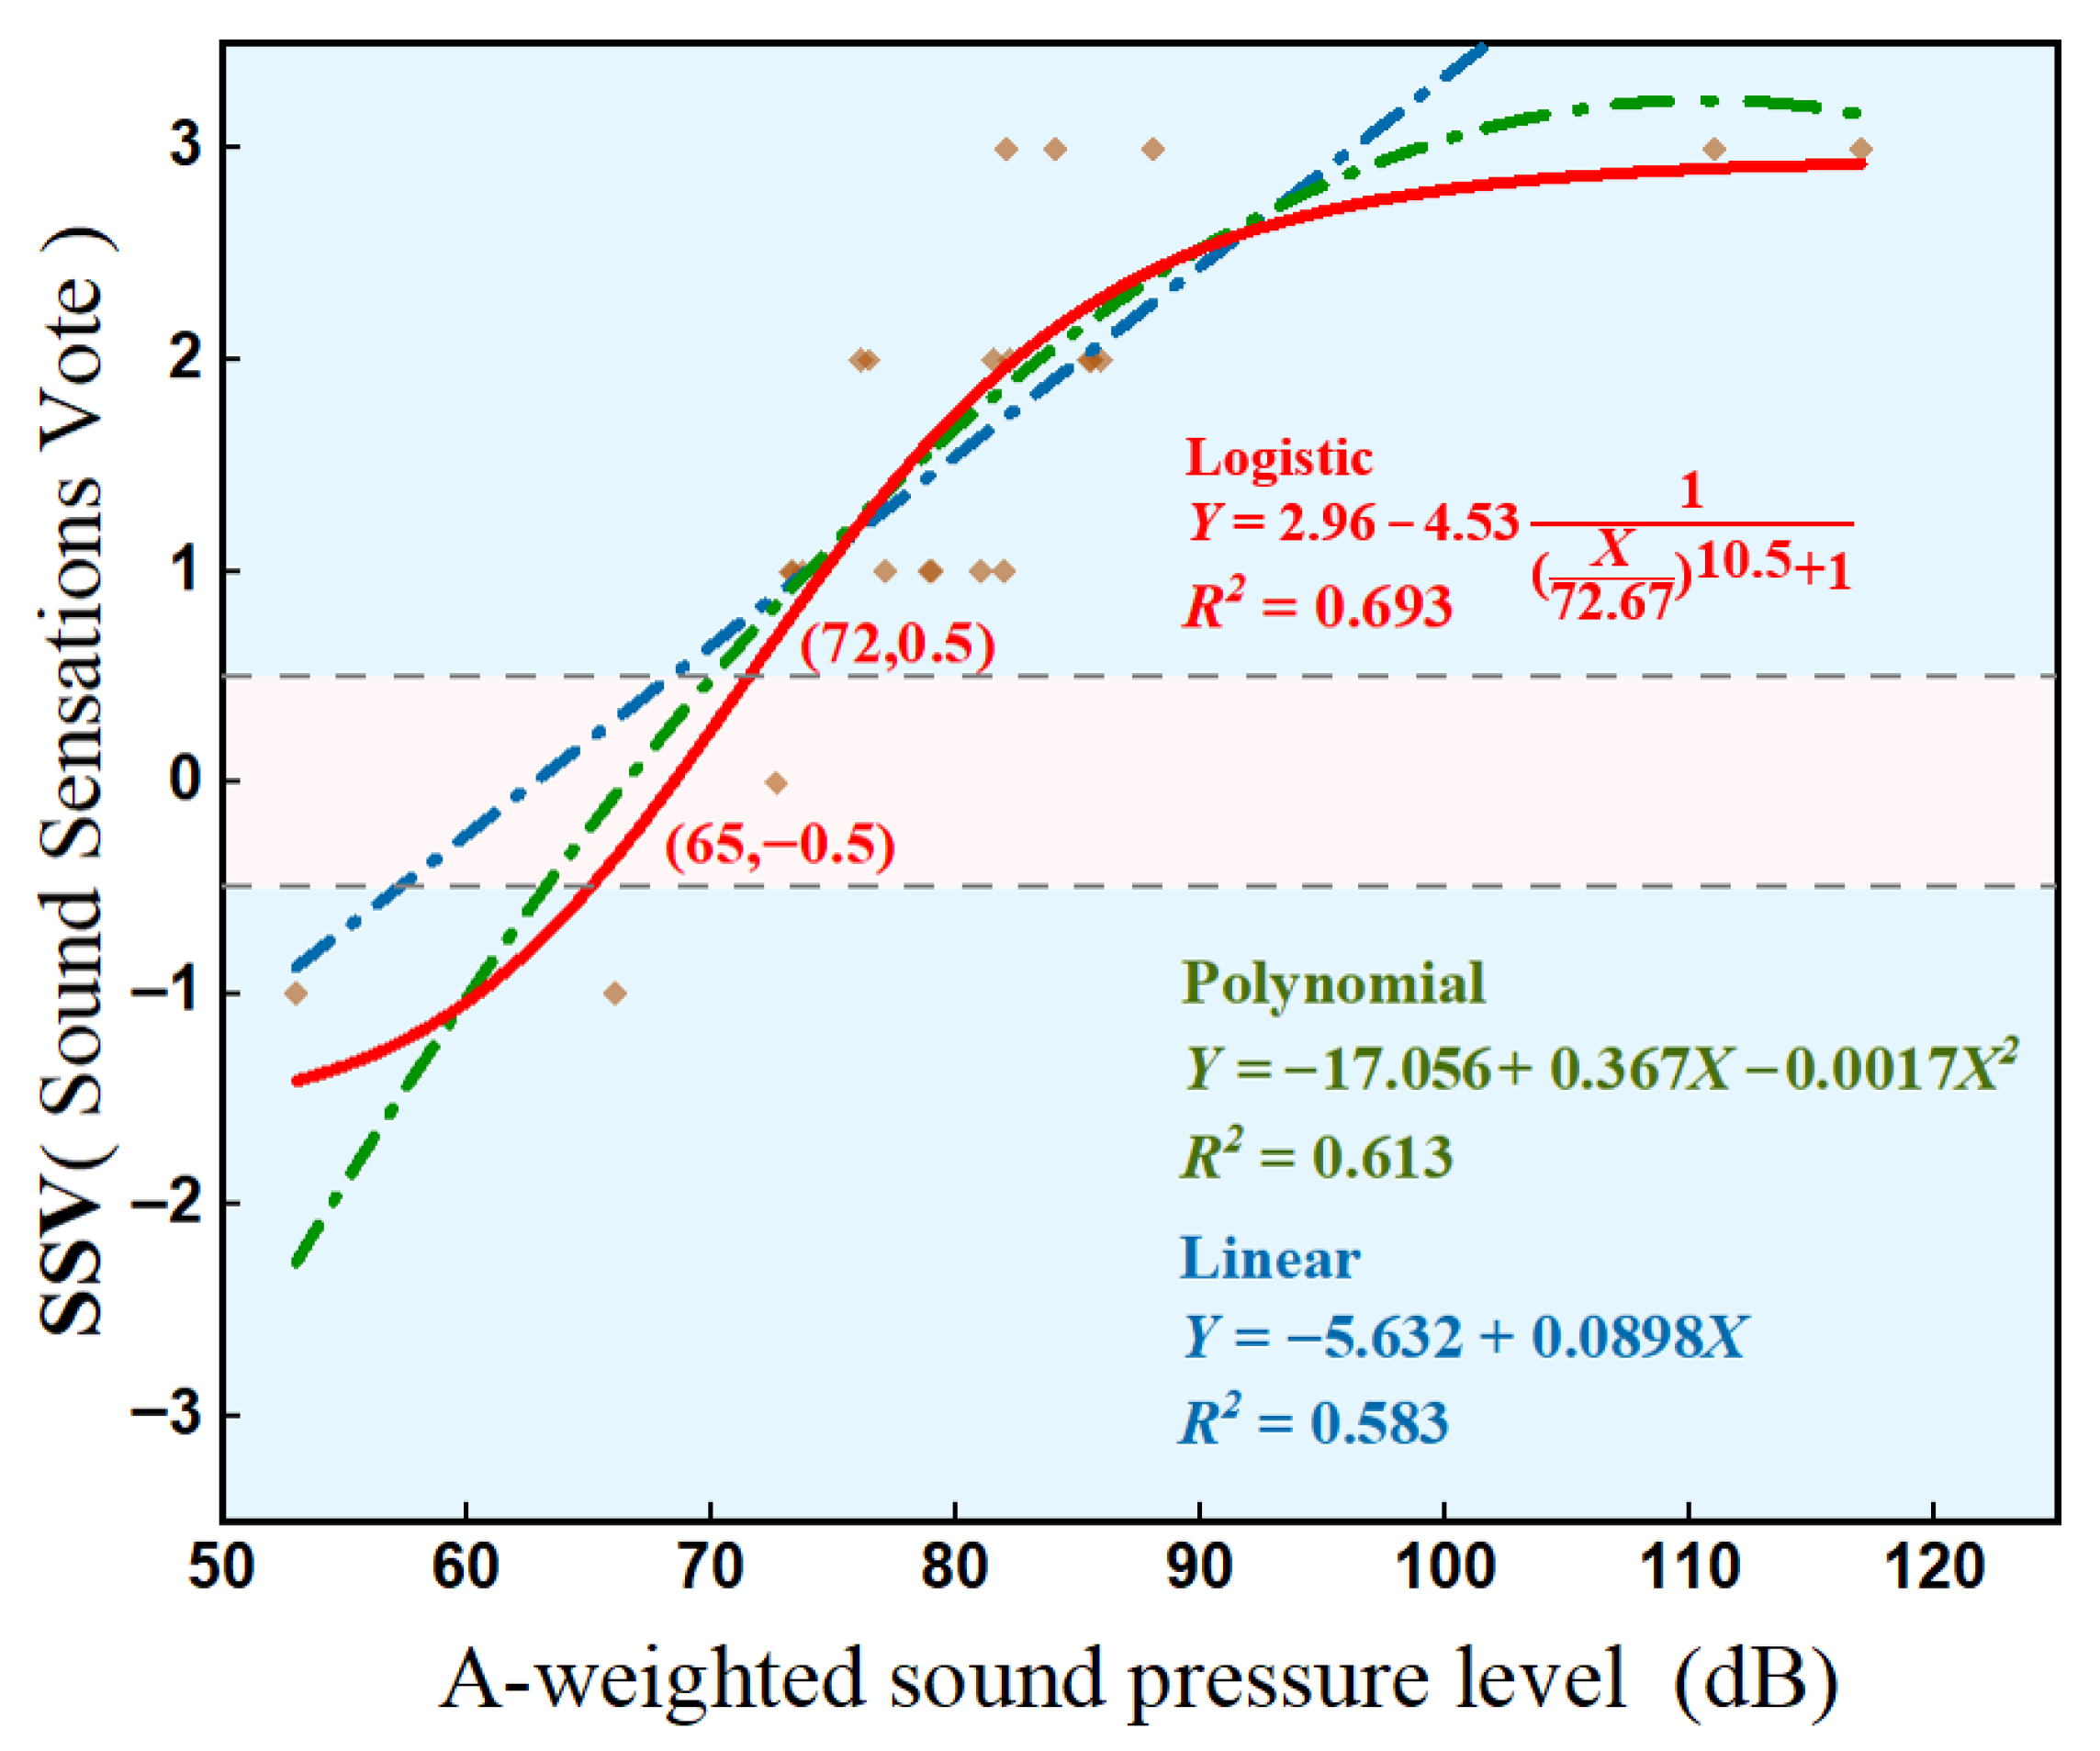
Figure 9 is the fitting result of the corresponding Acoustic Sensation Voting (ASV) value. The LAeq’s variation in ASV was analyzed by linear, quadratic polynomial and Logistic models. When the acoustic pressure level is at a low level, the ASV is mostly negative; as the acoustic pressure level rises to the range of 65–90 dB, the ASV quickly changes from negative to positive, indicating that the increase in acoustic level makes the subjective feeling change from ‘quiet’ to ‘moderate’. When the acoustic pressure level exceeds 90 dB, the growth of ASV slows down and gradually tends to saturation (close to 3), which means that when the acoustic intensity continues to rise, the ASV gradually tends to be noisy and finally reaches the upper limit. In the range of −0.5 < ASV < 0.5, the comfort equivalent continuous A acoustic level area of underground space is 65–72 dB.
In the process of establishing the ASV evaluation model, the R2 of the Logistic regression model is 0.693, and the goodness of fit is the highest. The curve shape is highly consistent with the actual trend of ‘rapid change first and then saturation’, which can most accurately describe the nonlinear law of ASV from ‘quiet’ to ‘moderate’ and then to ‘noisy’. The linear regression has the lowest goodness of fit, which can only reflect the overall trend of ASV rising with the increase in acoustic pressure level, and cannot reflect the nonlinear characteristics.
4.2.3. Vibration Sensation Voting
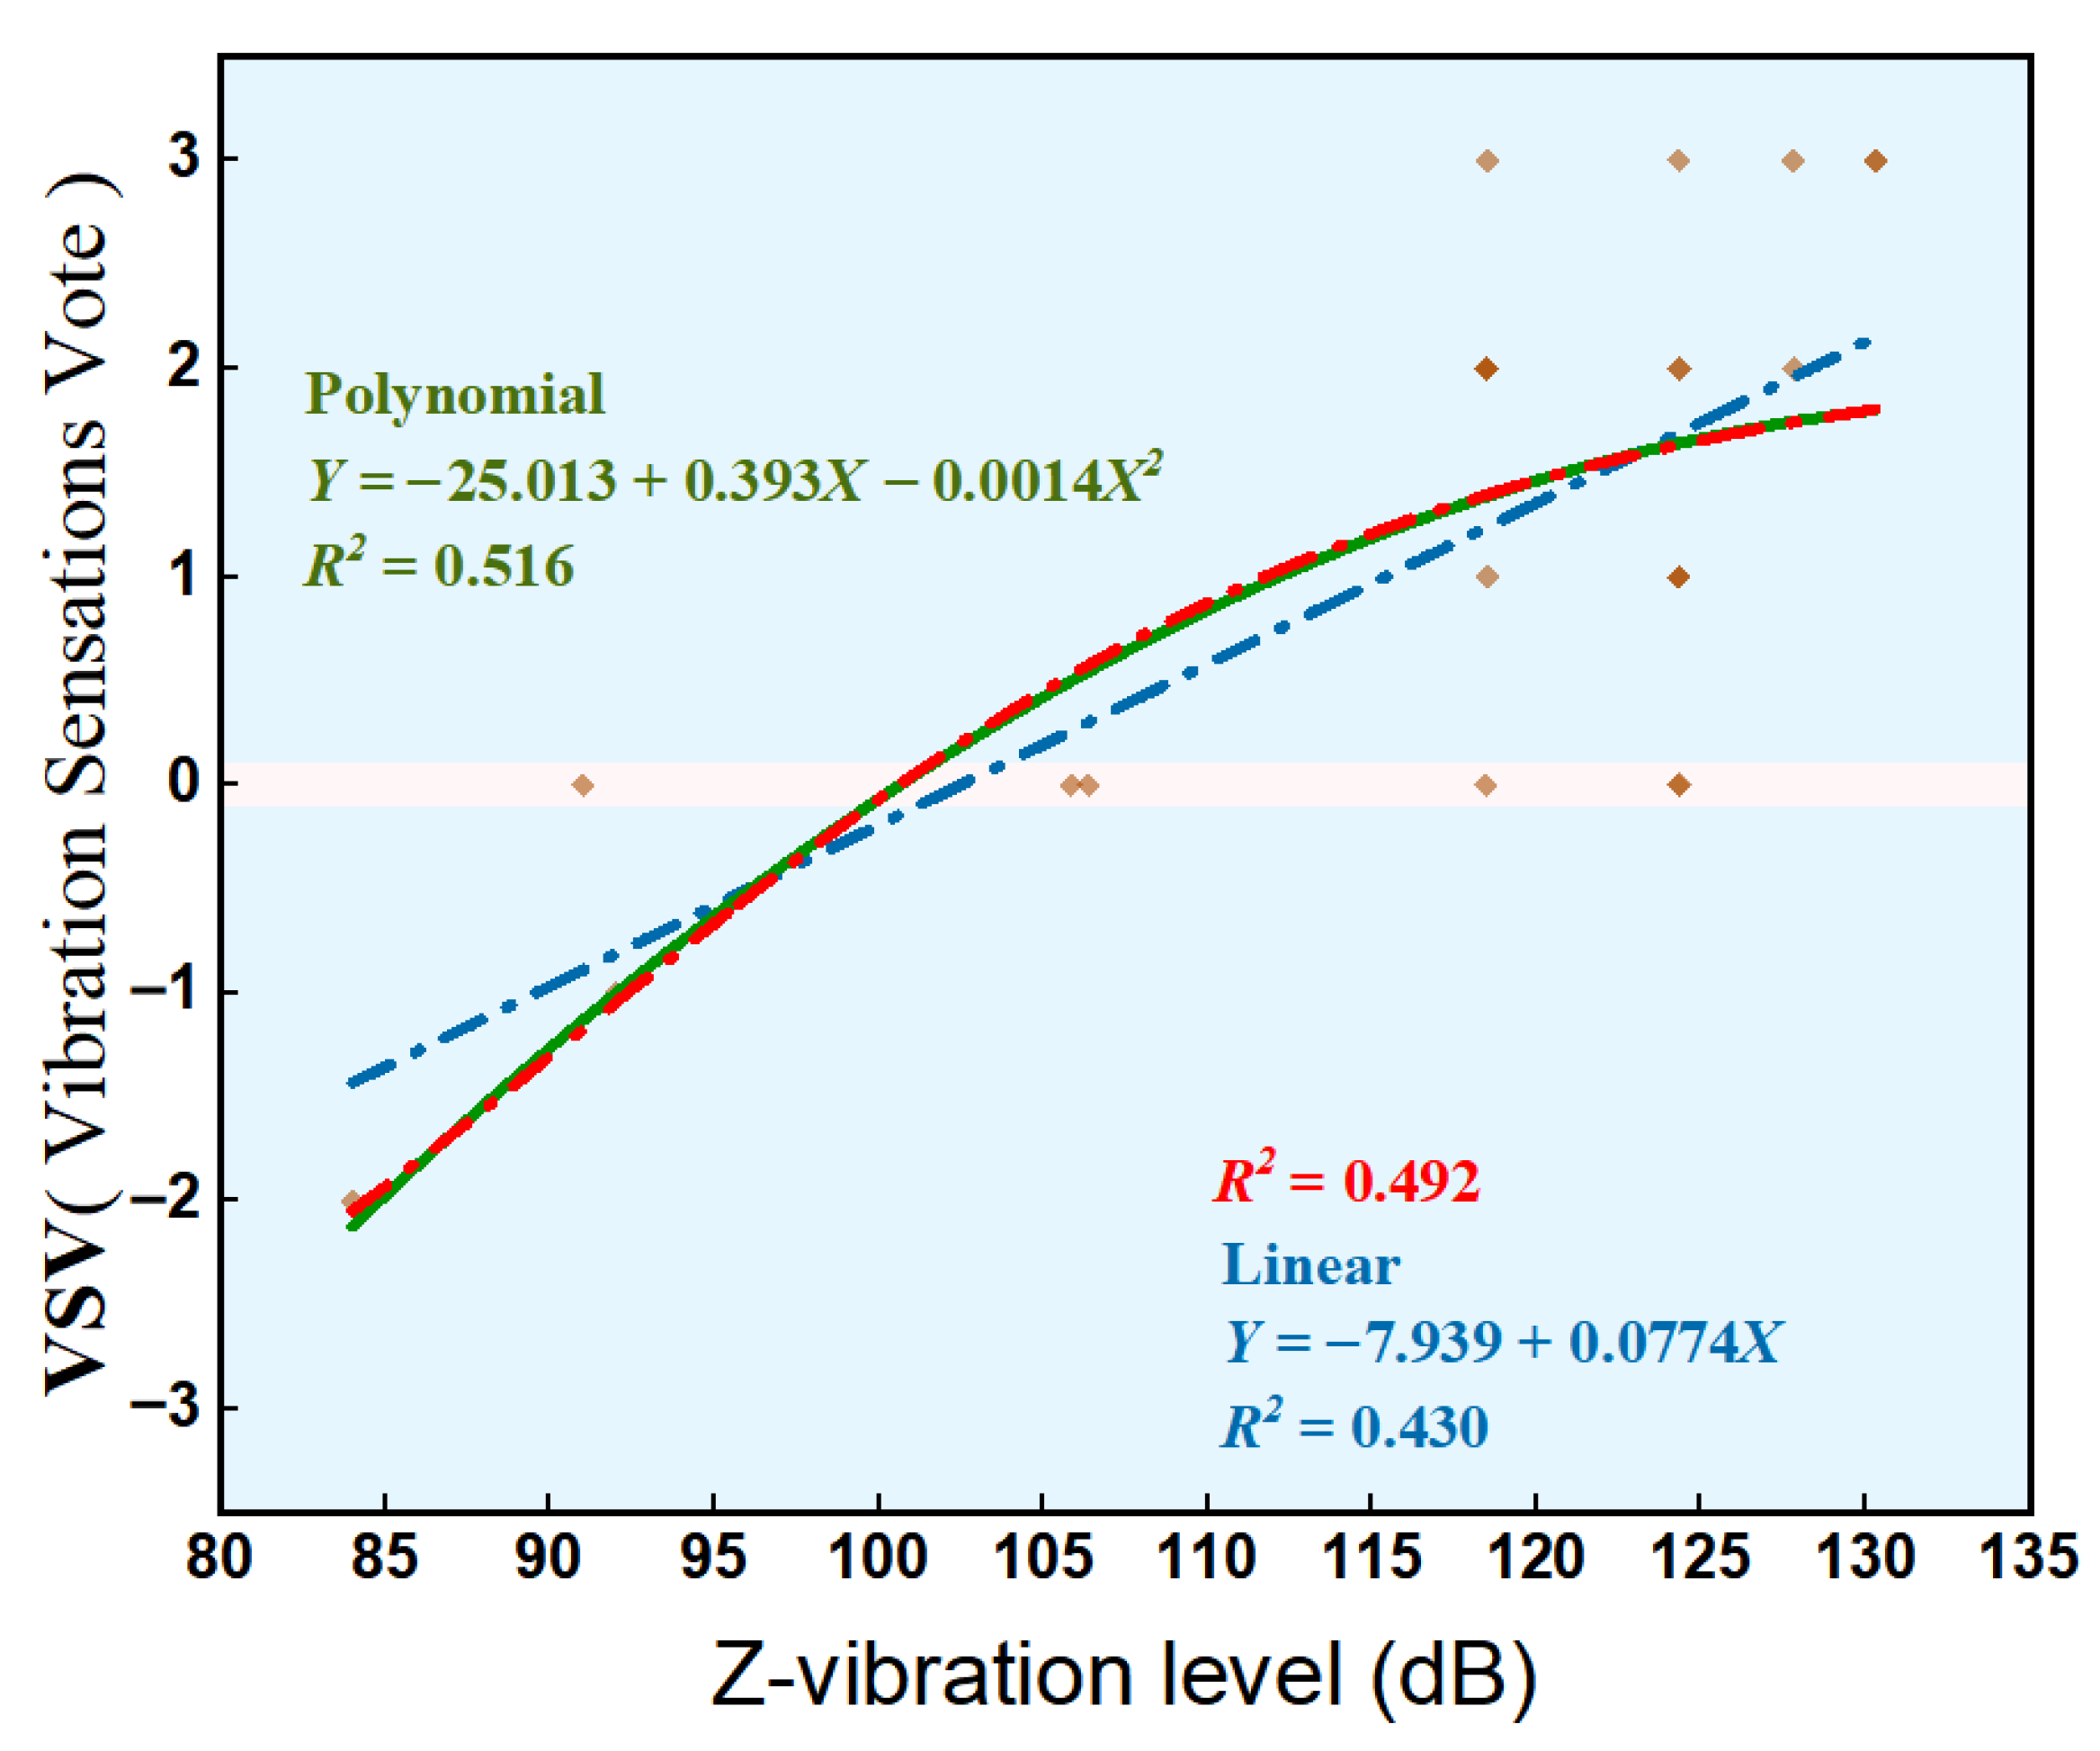
Figure 10 is the fitting result of the corresponding vibration sense voting value. From the scatter distribution and fitting curve, it can be seen that the Vibration Sensation Voting (VSV) is nonlinearly correlated with the Z-direction vibration level. When the vibration level is at a low level (80–96 dB), the VSV is mostly negative, reflecting that the vibration intensity Sensation is not obvious. As the vibration level rises to the range of (96–120 dB), the VSV quickly changes from negative to positive, indicating that the increase in vibration level makes the subjective feeling change from ‘light vibration feeling’ to ‘strong vibration feeling’. When the vibration level exceeds 120 dB, the growth of VSV slows down, which means that when the vibration intensity continues to rise, the vibration level is unbearable.
The difference between VSV and TSV, ASV is that the best-fitting effect is the quadratic polynomial regression model, with R2 = 0.516; the comfort range of vibration is different from that of thermal environment and acoustic environment. When the vibration does not exist, the comfort is the highest, so it should be less than the medium vibration sense, that is, VSV < 0, Z-VL < 97.5 dB.
The coincidence degree of polynomial and Logistic curves is high, and the fitting degree of VSV is low, which may be related to the fact that the correlation between vibration level and VSV is not obvious in correlation analysis, VSV is obviously affected by other physical environment factors, and the subjective feeling of participants on vibration is not clear and inaccurate.
4.2.4. Comprehensive Sensation Voting Model
This study examines how the thermal, acoustic and vibration environments in TOD underground spaces affect human comfort. We first performed regression analysis for each physical field. The best-fitting models are shown in
Table 4.
Based on the linear regression model, the comprehensive sensory voting model is constructed. The influence weight of thermal environment on comprehensive sensory is the largest (0.487), followed by acoustic environment (0.281), and the influence of vibration environment is relatively small (−0.046). The comprehensive sensory voting model is calculated according to the linear regression model.
R2 = 0.571.
4.3. Comprehensive Sensation Voting Index
4.3.1. AHP Hierarchical Analysis
The comprehensive evaluation of multiple factors includes multiple indicators. These indicators explain several aspects of the evaluated things. The evaluation method should make a holistic judgment on the evaluated things, and then use a total indicator to explain the level of the evaluated things. The comprehensive comfort evaluation of indoor environment in underground space includes heat, acoustic, vibration and other aspects to evaluate the feeling of indoor environment. The subjective reaction of the human body is transformed into a quantitative index, and the quantitative results reflect the role and importance of multiple factors in the whole comprehensive evaluation system. Analytic Hierarchy Process (AHP) is a multi-criteria decision-making method combining qualitative and quantitative analysis, which can be used to construct comprehensive evaluation weights [
53]. The function evaluation method in the theory of value engineering: the pairwise comparison method and AHP use different proportions in the comparison results, and use the distribution method (that is, the total weight is 100%). The importance weight distribution method of the pairwise comparison method is more intuitive and easier to grasp [
54].
Because the multi-factor index involved in the evaluation process of human comprehensive comfort is highly professional, the subjective weighting method can avoid the conclusion that the determined weight value is contrary to its actual importance due to complete dependence on data, in order to avoid the problem of information loss in a single weighting method. Therefore, this study uses AHP, Analytic Hierarchy Process, to determine the weight of heat, acoustic and vibration, and combines normalized environmental parameters and subjective perception data to construct a comprehensive comfort evaluation index.
The AHP is a decision-making method that decomposes the elements that are always related to decision-making into levels such as goals, criteria and solutions, and conducts qualitative and quantitative analysis on this basis. Through the hierarchical decomposition of the target layer (comprehensive comfort) → criterion layer (thermal/acoustic/vibration environment) → index layer (UCTI, LAeq, Z-V), the fuzzy overall comfort evaluation is transformed into a quantifiable operational index system, which is highly compatible with the multi-physical field coupling characteristics of underground space. The significance coefficients of comprehensive comfort feeling, thermal feeling, acoustic feeling and vibration feeling are calculated, as shown in
Table 5.
Table 5 significance analysis of thermal Sensation, acoustic Sensation and vibration Sensation on comprehensive comfort evaluation.
Through significance analysis, it can be seen that UCTI and LAeq have significant differences in comprehensive comfort, and Z-VL has no significant difference in comprehensive comfort evaluation.
Based on the research objectives, the comprehensive comfort is taken as the goal layer (A), and the thermal environment (B1), acoustic environment (B2) and vibration environment (B3) are taken as the criterion layer. Its sub-indicators include ambient temperature (C1), relative humidity (C2), wind velocity (C3), equivalent acoustic level LAeq (C4) and Z vibration level Z-VL (C5), forming a hierarchical model.
According to the correlation analysis data, the Saaty 1–9 scale method is used to establish the judgment matrix (A–B):
Similarly, the judgment matrix (B1–C) is established.
In order to avoid dimensional differences, the range method is used to standardize the measured parameters.
Among them, temperature, humidity, LAeq and BMI are two-way indicators (ideal values are 16 °C, 40%, 80 dB and 20 kg/m
2), and wind velocity and Z-VL are negative indicators. Using the geometric average method, the results are shown in
Table 6.
In the comprehensive comfort Sensation model, the weight distribution formula is
4.3.2. Entropy Weight Method
In order to reduce the dependence of AHP, Analytic Hierarchy Process, on subjective attitude, it is not driven by objective data, and now the entropy weight method (EWM) is added for correction.
Calculate the proportion of indicators.
Calculate information entropy.
Annotation: When p{i} = 0, definition p{i}/ln p{i} = 0.
Calculate the difference coefficient.
In the formula, m is the total number of indicators.
The coefficient of variation of B1, B2 and B3 were calculated to be 0.364, 0.512 and 0.102, respectively. According to the linear weighting formula
The results of linear weighting are compared with the weight synthesis in
Table 7.
The revised weight distribution formula is
After correction, the thermal environment parameters are basically unchanged; the acoustic environment parameters are significantly reduced; vibration environment parameters increased significantly. The thermal environment has the largest weight in the comprehensive sensory voting index, and the acoustic has the largest weight in the single index. By introducing objective data (EWM), the dominance of acoustic decreases from 35.8% to 34.4%. The mixed weight of vibration level (15.33%) is significantly higher than that of pure AHP (7.5%), reflecting the real contribution of vibration effect in experimental data. The weight of thermal environment and acoustic environment is fine-tuned. The weight of thermal environment of AHP is close to that of entropy weight method, and remains stable after mixing. The mixed weight system optimizes the interpretability of the model through the ‘subjective and objective balance’. The comprehensive sensory voting index can dynamically capture the implicit law of the experimental data and form an effective complement to the AHP weight.
4.4. Accuracy Verification
The comprehensive sensory voting model and the comprehensive sensory voting index are compared and analyzed, as shown in
Table 8.
When predicting a single physical field, the prediction ability of the Logistic model and the polynomial quadratic regression model is better than the AHP–entropy weight method model. When predicting the comprehensive sensory voting under the coupling of multiple physical fields, the prediction ability of the AHP–EWM model is 42.6% higher than the linear fitting single physical field.
The single model is completely dependent on being data-driven, but the low correlation of vibration perception makes it difficult for the regression model to capture the real impact. The AHP–entropy weight method excludes insignificant factors through significance analysis (vibration p = 0.448), and combines the entropy weight method to objectively correct the weight to avoid the model being misled by low-quality data. The trend of single model weight (heat 0.487 > acoustic 0.281) is consistent with that of AHP results (heat 51.2% ≈ acoustic 33.8%). AHP can obviously judge the physical factor that has the greatest influence on the comprehensive sensory voting–acoustic.
4.5. Contributions and Limitation
The research reveals the nonlinear coupling mechanism between the thermal, acoustic and vibration multi-physical fields of TOD underground space and human comfort during the special period of Spring Festival. It constructs a comprehensive comfort evaluation model by AHP entropy weight method. The research method combining field measurement and questionnaire surveys is used to cover different periods such as working days and rest days, which provides reliable data support for analyzing the spatial and temporal differences between multi-physical field environment and human comfort perception. It provides a basis for targeted environmental regulation and operation management of TOD underground space.
However, this study focused mainly on the winter travel period, and the participant sample was relatively narrow. Future research should include middle-aged and elderly populations, as well as vulnerable groups such as pregnant women and individuals with chronic diseases. Larger samples across age groups are also needed. In addition, incorporating physiological data, such as heart rate, blood pressure, and electroencephalogram (EEG) measurements, could further enhance the accuracy of the comfort evaluation model.
5. Conclusions
The time of the study is representative of Chinese holidays, weekends and working days during the Spring Festival. Field monitoring and passenger perception questionnaire survey were conducted in the underground space of a TOD project in Zhengzhou, a cold region of China. This paper explores the impact of special underground space at the intersection of rail transit and commercial buildings on human comfort. The main conclusions are summarized as follows.
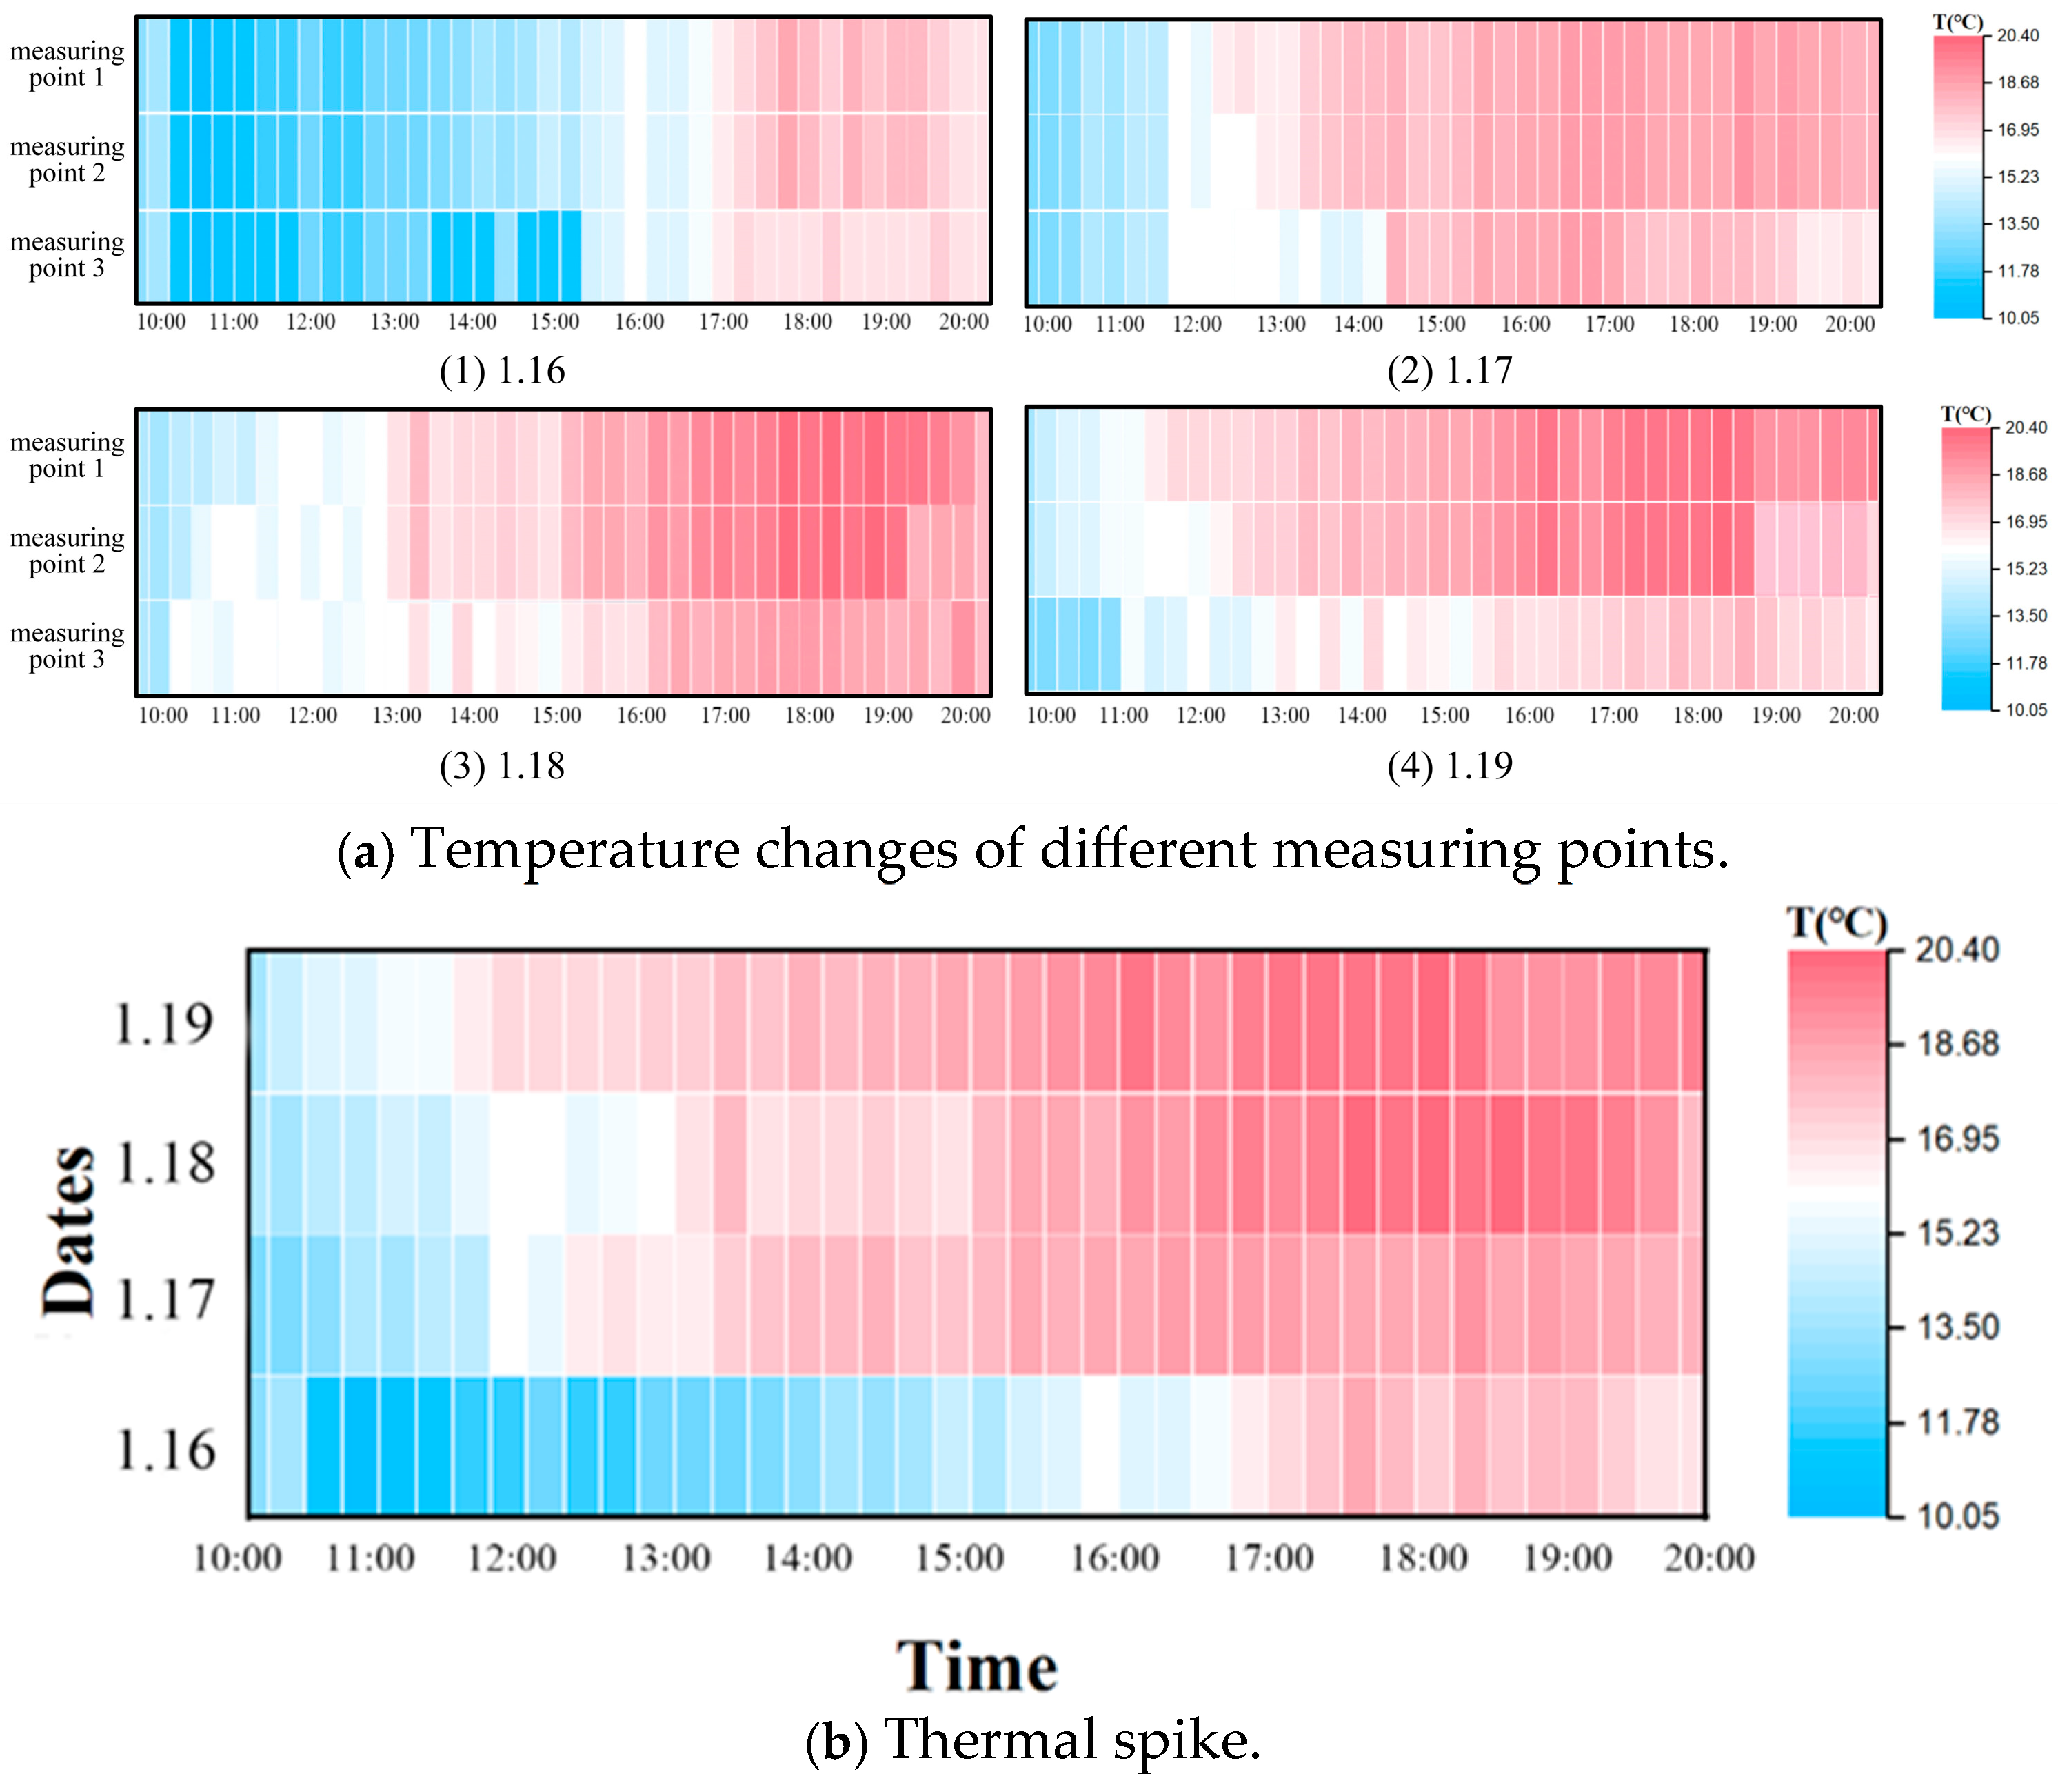
1. The thermal, acoustic and vibration environment of TOD underground space did not meet the specification limits of ISO 16813: 2024 during the winter Spring Festival. The different density and distribution of people in underground space are the decisive factors for the spatial and temporal differences in multi-physical fields in underground space. The average temperature on the rest day (17.4–18.7 °C) was higher than that on the working day (15.8–16.5 °C). The LAeq is less than 80 dB on the working day, and the LAeq on the rest day has a high intensity noise of 90–100 dB for a long time. The vibration level does not change periodically, showing the characteristics of changing with the density of personnel flow. The maximum temperature of 24.4 °C, the maximum LAeq of 108.4 dB and the maximum vibration level of 124.3 dB appeared in the peak of Sunday night.
2. In the underground space represented by the subway, different subjective perception dimensions are interrelated and there are complex interaction mechanisms. In correlation analysis, LAeq shows the strongest positive correlation with thermal, acoustic and vibration perception, and its correlation is greater than that of temperature and vibration level. LAeq has a significant impact on the subjective evaluation of thermal, acoustic and vibration perception; there is a significant positive correlation between temperature and thermal and acoustic perception. The vibration level has a weak correlation with its own vibration perception, but has a certain negative correlation with thermal and acoustic perception.
3. The scatter distribution and fitting curve of the single physical field model show that the comfort feeling vote of heat, acoustic and vibration is nonlinearly correlated with the environmental data. By comparing the superposition of single physical field model and the comprehensive comfort evaluation of AHP–entropy weight method, the single physical field model R2 = 0.571, and the error accumulation leads to low accuracy. It is easy to be interfered by low quality data of a certain physical field. The accuracy of the measured data verification of the AHP–entropy weight method model is 73.6%. Through the calculation of subjective and objective weights, it avoids being misled by extreme or abnormal data.
4. In the TOD underground space with large flow of people and dense population in the cold area in winter, the thermal environment is the physical field that has the greatest impact on the comprehensive comfort of the human body. However, in a single index, the contribution weight of noise to the prediction model of human comfort is 34.4% greater than that of temperature, 29.37%, which is the primary factor affecting the comprehensive comfort of human body.
