Article

An Innovative Holistic Framework for Drought Analysis: Integrating Temporal and Spatial Perspectives for Improved Drought Risk Assessment

by
Ahmad Abu Arra
1,2,*,
Mehmet Emin Birpınar
1,
Şükrü Ayhan Gazioğlu
1 and
Eyüp Şişman
1,*
1
Department of Civil Engineering, Yildiz Technical University, Istanbul 34220, Türkiye
2
Department of Civil and Architectural Engineering, An-Najah National University, Nablus P.O. Box 7, Palestine
*
Authors to whom correspondence should be addressed.
Sustainability 2025, 17(22), 10264; https://doi.org/10.3390/su172210264
Submission received: 27 September 2025 / Revised: 12 November 2025 / Accepted: 14 November 2025 / Published: 17 November 2025

Abstract

The existing literature has studied and addressed the limitations of traditional drought evaluation methods, which often depend on one station without considering the spatiotemporal integration, resulting in an incomplete drought assessment. Given these limitations, this research proposes a new approach using the Specific Period (SP) and Precipitation Index (PI) concepts and aims to provide new perspectives for drought analysis. The methodology focuses on integrating all stations within the study area, allowing for a more comprehensive understanding of the evolution and characteristics of drought at each month. The Standardized Precipitation Index (SPI) at Konya Endorheic Basin (KEB) is used in this research to define drought events at multiple time scales, both for the SPI and Run theories. The main objective is to develop an innovative holistic framework for drought evaluation. The results demonstrate that the new approach improves the accuracy and consistency of drought detection compared to traditional methods. The results showed that drought durations ranged from 23 to 29 months for SPI-12 in regions such as Cihanbeyli, Ereğli, and Seydisehir. In contrast, regions such as Aksaray and Konya Havalimanı emerged as the least affected, with positive PI values between +0.14 and +0.19, compared to negative values of −0.71 to −0.83 in Seydisehir, Ereğli, and Cihanbeyli, indicating spatial variations in drought evolution within the KEB. This research provides a more comprehensive framework for monitoring drought in semi-arid regions, supporting water resource management policies and climate change adaptation and mitigation plans.

1. Introduction

Global warming, resulting from greenhouse gas emissions, and climate change, along with their related natural disasters, have become more frequent in recent years [1,2]. Climate change-based disasters, such as drought, affect various sectors [3,4]. Droughts have different definitions, but in simple terms, they occur with significant declines in rainfall, which is essential for the hydrological cycle in all climates worldwide [5,6]. Rainfall is critical for evaluating the impacts of climate change [7,8]. On the other hand, it also negatively affects different sectors, such as the economy [9], agriculture [10,11], and industry [12]. The reduction in rainfall due to drought affects water availability, affecting both demand and supply [13]. Additionally, droughts are among the most destructive natural disasters [14,15]. Droughts cause significant damage locally and globally [16,17,18].
According to the literature, droughts are categorized into different types. Meteorological drought, which is related to a significant reduction in rainfall below the average value, is considered the simplest type of drought [19,20]. The second type is hydrological drought, characterized by lower water levels in both surface and groundwater, which in turn affect the water supply and related activities [21,22]. The third type is the agricultural drought, related to insufficient soil moisture that does not meet the needs of crops, resulting in reduced agricultural productivity and threatening food security. The last type is the socioeconomic drought [22], and it is an increased water demand with a lower supply due to the impacts of previous types of droughts, and its calculation is more complex compared to other types [23].
Different and various drought indices exist in the literature; each has specific inputs and concepts, and some of them use the standardization process, such as the Standardized Precipitation Index (SPI) [24], the Actual Precipitation Index (API) [25], and Standardized Precipitation Evapotranspiration Index (SPEI) [26]. Their inputs can include rainfall, soil moisture, and so on. Among all drought indices, considering the citations for each index, the SPI is one of the most widely accepted indices worldwide, and according to the World Meteorological Organization [27], its popularity comes from its dependence on rainfall, which is the first record that can be found in any meteorological organization. It is used across different applications, regions, purposes, and climates [28,29]. For the Konya Endorheic Basin, a semi-arid region, rainfall variability is the major driver for drought in comparison to other parameters, such as evapotranspiration. This can be attributed to the area’s climate.
The calculation of the drought index is the first step in evaluating drought, followed by the assessment of drought characteristics, including duration, severity, and intensity. Duration is calculated based on the drought event definition, and then the severity and intensity are calculated. Severity is calculated as the summation of deficits in relevant variables (under a specific threshold) for precipitation, as per the SPI [30]. Intensity can be defined as the average deficit over drought duration [19,31]. Spatial analysis of droughts includes examining the geographical distribution of the drought indices (for example, SPI) and their associated characteristics (duration and intensity). Spatial analysis is typically performed using interpolation techniques such as Inverse Distance Weighting (IDW) and Spline, which estimate the targeted values at unsampled locations using observed data [32,33,34].
In recent years, increasing attention has been given to spatiotemporal drought methods [35]. Multivariate copula-based frameworks [36,37,38] and machine learning–assisted drought monitoring approaches [39,40] have demonstrated significant potential in capturing the interdependence and regional behavior of drought clusters. Nevertheless, these methods often require extensive high-resolution datasets and complex calibration processes, introducing additional sources of uncertainty that the present study aims to avoid through the simpler yet robust frameworks.
In order to conduct the spatial drought evaluation and produce maps of drought characteristics, a specific value must be assigned to each station. According to the literature and various studies, these maps are typically generated using the average value of drought characteristics and the overall frequency of drought events. For example, studies such as Song et al. [41], Erkol et al. [42], Wei et al. [43], li et al. [44], Wang et al. [45], Zhang et al. [46], and Mateus et al. [47] have employed average values to represent drought characteristics in their spatial assessments. These methods offer new perspectives and a comprehensive view of drought analysis, but they cannot fully capture the complexity of drought conditions. Therefore, there is a need for a more accurate and comprehensive assessment that takes into account specific drought events.
After a careful review of the existing literature, various limitations and shortcomings have been identified in the use of traditional drought methods, and one of these shortcomings is treating the entire basin as a single area without considering the drought conditions and characteristics at each station. These methods may lead to an incomplete assessment of drought and a lack of integration over spatiotemporal dynamics. A more precise and thorough drought evaluation is necessary for vulnerable semi-arid regions, such as the Konya Endorheic Basin (KEB) in Türkiye, to ensure the effective implementation of mitigation and adaptation strategies. The main purpose of this research is to present a novel method based on two concepts: the Specific Period (SP) and Precipitation Index (PI), providing a more accurate and integrated assessment of drought. This study aims to propose an innovative and holistic drought evaluation method using SP and PI concepts, improve spatiotemporal drought analysis, and enhance drought monitoring and assessment in all climates, especially in semi-arid regions, where drought impacts are more pronounced.
The key research questions guiding this study are:
  • How can the SP and PI concepts enhance the reliability and precision of drought evaluation?
  • How does the proposed methodology contribute to critical drought events?
  • What are the spatiotemporal drought characteristics in the KEB, considering both traditional and newly proposed methodologies?
  • What is the difference between holistic and traditional methodologies in terms of drought characteristics?

2. Study Area and Data

Considering different points regarding climate, the importance of the study, and other considerations, the KEB has been selected as an application in this research. KEB has a semi-arid climate and is located in the central part of Türkiye (Figure 1). KEB has a significant importance in Türkiye, particularly in agricultural sector activities. Dogan et al. [48] indicated that the KEB is the breadbasket of Türkiye because of its large agricultural activities. Nonetheless, due to its semi-arid climate and huge farming activities, KEB has major challenges with water supply [49]. While Karapınar station, located within the basin (Figure 1) and its surroundings, experiences semi-arid climate conditions, the southern regions have a Mediterranean climate. On the other hand, the northern regions have a continental climate [50]. As a semi-arid region, the KEB’s precipitation is limited and irregular. This pattern has a significant impact on its surface and groundwater resources. The basin has faced frequent drought events [50,51]. Understanding and evaluating drought characteristics based on novel approaches, rather than relying solely on classical and traditional methods, provides a more holistic and comprehensive result.
All available stations within the study area that have been operational for a long time (more than 30 years) were selected, totaling 10 stations, as shown in Figure 1. Table 1 summarizes data from meteorological stations located in the KEB, Türkiye, displaying rainfall statistics for the available stations, which are distributed geographically by latitude and longitude. The table includes information about each station’s code, name, geographic coordinates, average annual rainfall, standard deviation, and recorded maximum monthly rainfall. The data indicate that the Seydişehir station recorded the highest average annual rainfall of 734.57 mm and the highest monthly rainfall of 487.4 mm, indicating that it is one of the wettest areas within the study scope. In contrast, the Karapınar station recorded the lowest average annual rainfall of 289.94 mm and the lowest maximum monthly rainfall of 109.2 mm, making it one of the driest areas with a semi-arid climate. In general, KEB has a semi-arid climate. A significant variation in values can be observed between stations, reflecting the climatic diversity within the KEB, which is important when analyzing drought or managing water resources in the region.

3. Materials and Methods

This section includes the SPI, drought events, definitions, classifications, characteristics, and spatial interpolation technique.

3.1. Standardized Precipitation Index (SPI)

The Standardized Precipitation Index (SPI), one of the most widely used drought indices, was developed by McKee et al. [24]. It depends on probability analysis of precipitation data over different timescales, including short, medium, and long periods. The first and critical step in SPI calculation is selecting and determining the suitable and proper probability distribution function (PDF) for the precipitation data and each timescale. The PDF can be Gamma, Normal, or any function. The PDF selection process includes conducting goodness-of-fit tests, such as the Chi-Square and Kolmogorov–Smirnov tests [52]. A normal function with a mean of 0 and a standard deviation of 1 is used to standardize the probabilities obtained from the monthly precipitation data probabilistically. Şen and Şişman [53] provided more explanations and details on the standardization process, which is sometimes conflated with statistical and probabilistic approaches. In this research, goodness-of-fit tests were conducted, and consequently, the Gamma PDF was found to be the most suitable one and was used [24]. The Gamma function is defined as:
g x = 1 β α T ( α ) X α 1 e x β ,   f o r   x > 0
where α and β are the shape and scale parameters, respectively, x is the precipitation. T( α ) is the Gamma function. The shape and scale parameters can be calculated using the approximation of Thom:
α = 1 4 A ( 1 + 1 + 4 A 3 )
and
β = X ¯ α
with
A = ln X ¯ l n ( X ) n
where X ¯ is the average precipitation; n is the number of data; X is the precipitation at a current period.

3.2. Drought Events Definition and Drought Classification

After calculating the drought index, the next step in characterizing drought is selecting the definition of drought events. The drought characteristics can be calculated based on this definition and the index. There are different definitions of drought events in the literature; however, the most widely used and accepted ones are the Run theory, proposed by Yevjevich [54], and the SPI theory, proposed by McKee et al. [24]. According to Yevjevich [54], a drought event begins when the drought index drops below zero and concludes when it climbs back above zero. Second, McKee et al. [24] used −1 thresholds rather than zero thresholds to characterize drought occurrences (start) in identification. The Run and SPI theories differ significantly in how drought characteristics are calculated. Abu Arra and Şişman [30] demonstrate that the SPI theory yields more extreme drought intensities, whereas the Run theory typically produces more extreme duration values. Subsequently, both SPI and Run theories are applied in this research. Also, Abu Arra and Şişman [30] derived the Intensity-Drought-Frequency (IDF) drought curves using both theories. Table 2 presents the seven categories of drought, categorized by probability function and standard deviation.

3.3. Classical Drought Characteristics

Based on the above section, the drought characteristics include duration (D), severity (S), and intensity (I). The SPI theory defines drought duration as the total number of months when the drought index (DI) is less than −1 until it returns to a positive value. The Run theory defines drought duration as the time period during which the DI is less than 0 and until it returns to 0. D is one of the primary characteristics and parameters used in this study. The drought index’s total throughout the drought duration is the second parameter (severity). The drought intensity can also be calculated by dividing the severity by the duration of the drought. The drought duration and index values for each drought theory (Run and SPI) are displayed in Figure 2.
Drought characteristics used in this study, with their equations [19,24], are as follows:
Drought duration (D) is defined as
DSPI = Number of months between DI1st month < −1 and DI until any month returns positive.
DRun = Number of months between DI1st month < 0 and DI until any month returns positive.
Drought severity: Summation of DI values throughout D.
D r o u g h t   i n t e n s i t y = D r o u g h t   s e v e r i t y D r o u g h t   d u r a t i o n
Traditional methods calculate the drought characteristics for each station alone; for example, the drought events, duration, severity, and intensity are calculated for each station, and the average of all drought durations is taken, followed by the spatial interpolation technique to draw the drought maps. Also, the drought characteristics and evolution at each month cannot be calculated using traditional methods. This station-based methodology results in incomplete understanding and evaluations that may not fully capture the overall evolution of droughts. Once each station’s characteristics are computed separately, the arithmetic mean is often used to estimate the drought maps for drought indices and characteristics, as can be seen in various articles [45,55,56,57,58,59,60]. This simple arithmetic mean-based approach does not consider the spatial interrelationships between stations, the monthly effect, and the drought evolution at a specific month.

3.4. Inverse Distance Weighting (IDW) Method

Various interpolation techniques exist in the literature, and the Inverse Distance Weighting (IDW) method is one of the most widely used. IDW is used in various applications, including hydrology, land use, and drought, to estimate values at unsampled (non-measured) locations using measured stations or grid data. According to Philip and Watson [32], points closer to the target location have a significantly greater impact on the estimated value than those farther away. Based on Abu Arra et al. [61], IDW is more accurate and can give more realistic spatial results than other drought mapping methods. In this research, the IDW is employed for both traditional analysis and the newly proposed concepts in spatial drought analysis.

4. Methodology and Basic Concepts

This section presents the main concepts, definitions, and framework of the proposed drought characteristics, based on a specific period rather than the classical evaluation of drought characteristics. The first subsection is the basic concepts, including event selection, different time classes, and the desired specific period. The second subsection is the dynamic drought characteristics. The final subsection is innovative maps.

4.1. Basic Concepts and Desired Specific Period (SP)

The main concept in this research is the selection of drought events, which plays a key role in the proposed dynamic drought characteristics. These drought events can be the most extreme (critical) based on the historical data or any other drought event that aligns with the research’s objectives. The concept of critical drought has been discussed in various articles in the literature, but it still requires further research and discussion. In this research, any critical drought event can be selected. The proposed methodology can be applied to any drought event, and the selection process is flexible, making it a powerful tool for various analysis purposes. For each selected drought event for the SP, the corresponding SPI values, drought duration, severity, and intensity are extracted, and accordingly, the drought maps are produced.
Determining the drought event and the SP is an intertwined process that depends on several factors. SP is a time window selected for further analysis of drought characteristics, and the traditional and newly proposed characteristics can be calculated over this SP. The selection of SP depends on several factors, including the length and quality of data, historical drought events, the spatial distribution of the stations, and the purpose of the analysis. The length of the SP is flexible, and it can vary according to the nature of the drought event or design requirements. For example, a dam design depends on the hydrological cycle, which can be 12 months. After defining the SP, the drought characteristics can be calculated at each month, each season, and so on, to follow and study the drought evolution over the SP. In this research, the selection is based on seasonality. A key aspect of this methodology is that the SP is selected by considering the combined behavior of all available stations in the region rather than focusing on individual station data alone.

4.2. Dynamic Drought Characteristics-Integrated Evaluation

Several key drought characteristics are calculated after determining the SP (Equation (8)), and this is applied to each drought event definition. First of all, D is estimated using two definitions of drought event: the SPI theory (Equation (9)) and the Run theory (Equation (10)). Once the drought duration is determined for each segment, the corresponding drought severity and intensity (Equation (11)) is calculated. Based on these values, precipitation severity (PS) (Equation (12)) and intensity (PI) (Equation (13)) are introduced and can be used in different applications. PS and PI are defined as the cumulative sum of SPI values within each segment and are divided by the segment’s duration (DS) accordingly. This process is applied for each temporal segment until the SP duration.
By incorporating various definitions of drought events and accounting for both dry and wet periods, the methodology offers a comprehensive assessment of hydrometeorological extremes. Finally, innovative drought maps are developed based on the calculated drought characteristics, offering a powerful tool for monitoring, planning, and sustainable water resource management.
D S I = d i ,   w h e r e   d i D ,   d 1 < d 2 < d n < S P .
DSPI_New = Number of months between DI1st month < −1 and DI until any month returns positive. (within the DSi)
DRun_New = Number of months between DI1st month < 0 and DI until any month returns positive. (within the DSi)
D r o u g h t   i n t e n s i t y = D r o u g h t   s e v e r i t y D S P I / R u n _ N e w
Precipitation Severity (PS) = Cumulative sum of SPI values within DS.
Precipitation   Intensity   ( PI ) = P S D S

4.3. Innovative Maps

The proposed innovative drought maps differ from traditional ones that focus on drought in a specific month or by taking the simple arithmetic mean over the entire time period. In comparison to the traditional ones, the new maps offer a cumulative and comprehensive analysis of drought conditions over a long period. The key feature of these maps is their ability to track the evolution of drought over time. They focus not only on the severity of drought at a specific point, but also analyze how drought began, peaked, subsided, or persisted. This provides a dynamic picture that illustrates the relationship between different climate events and time, helping us understand the “sequence” of drought rather than just a single “snapshot.” These maps also show the frequency and accumulation of drought within the same region over several years, helping researchers distinguish between regions that experience frequent droughts and those that rarely experience them. This information is crucial for developing strategies for water resource management, agricultural planning, and climate disaster preparedness.
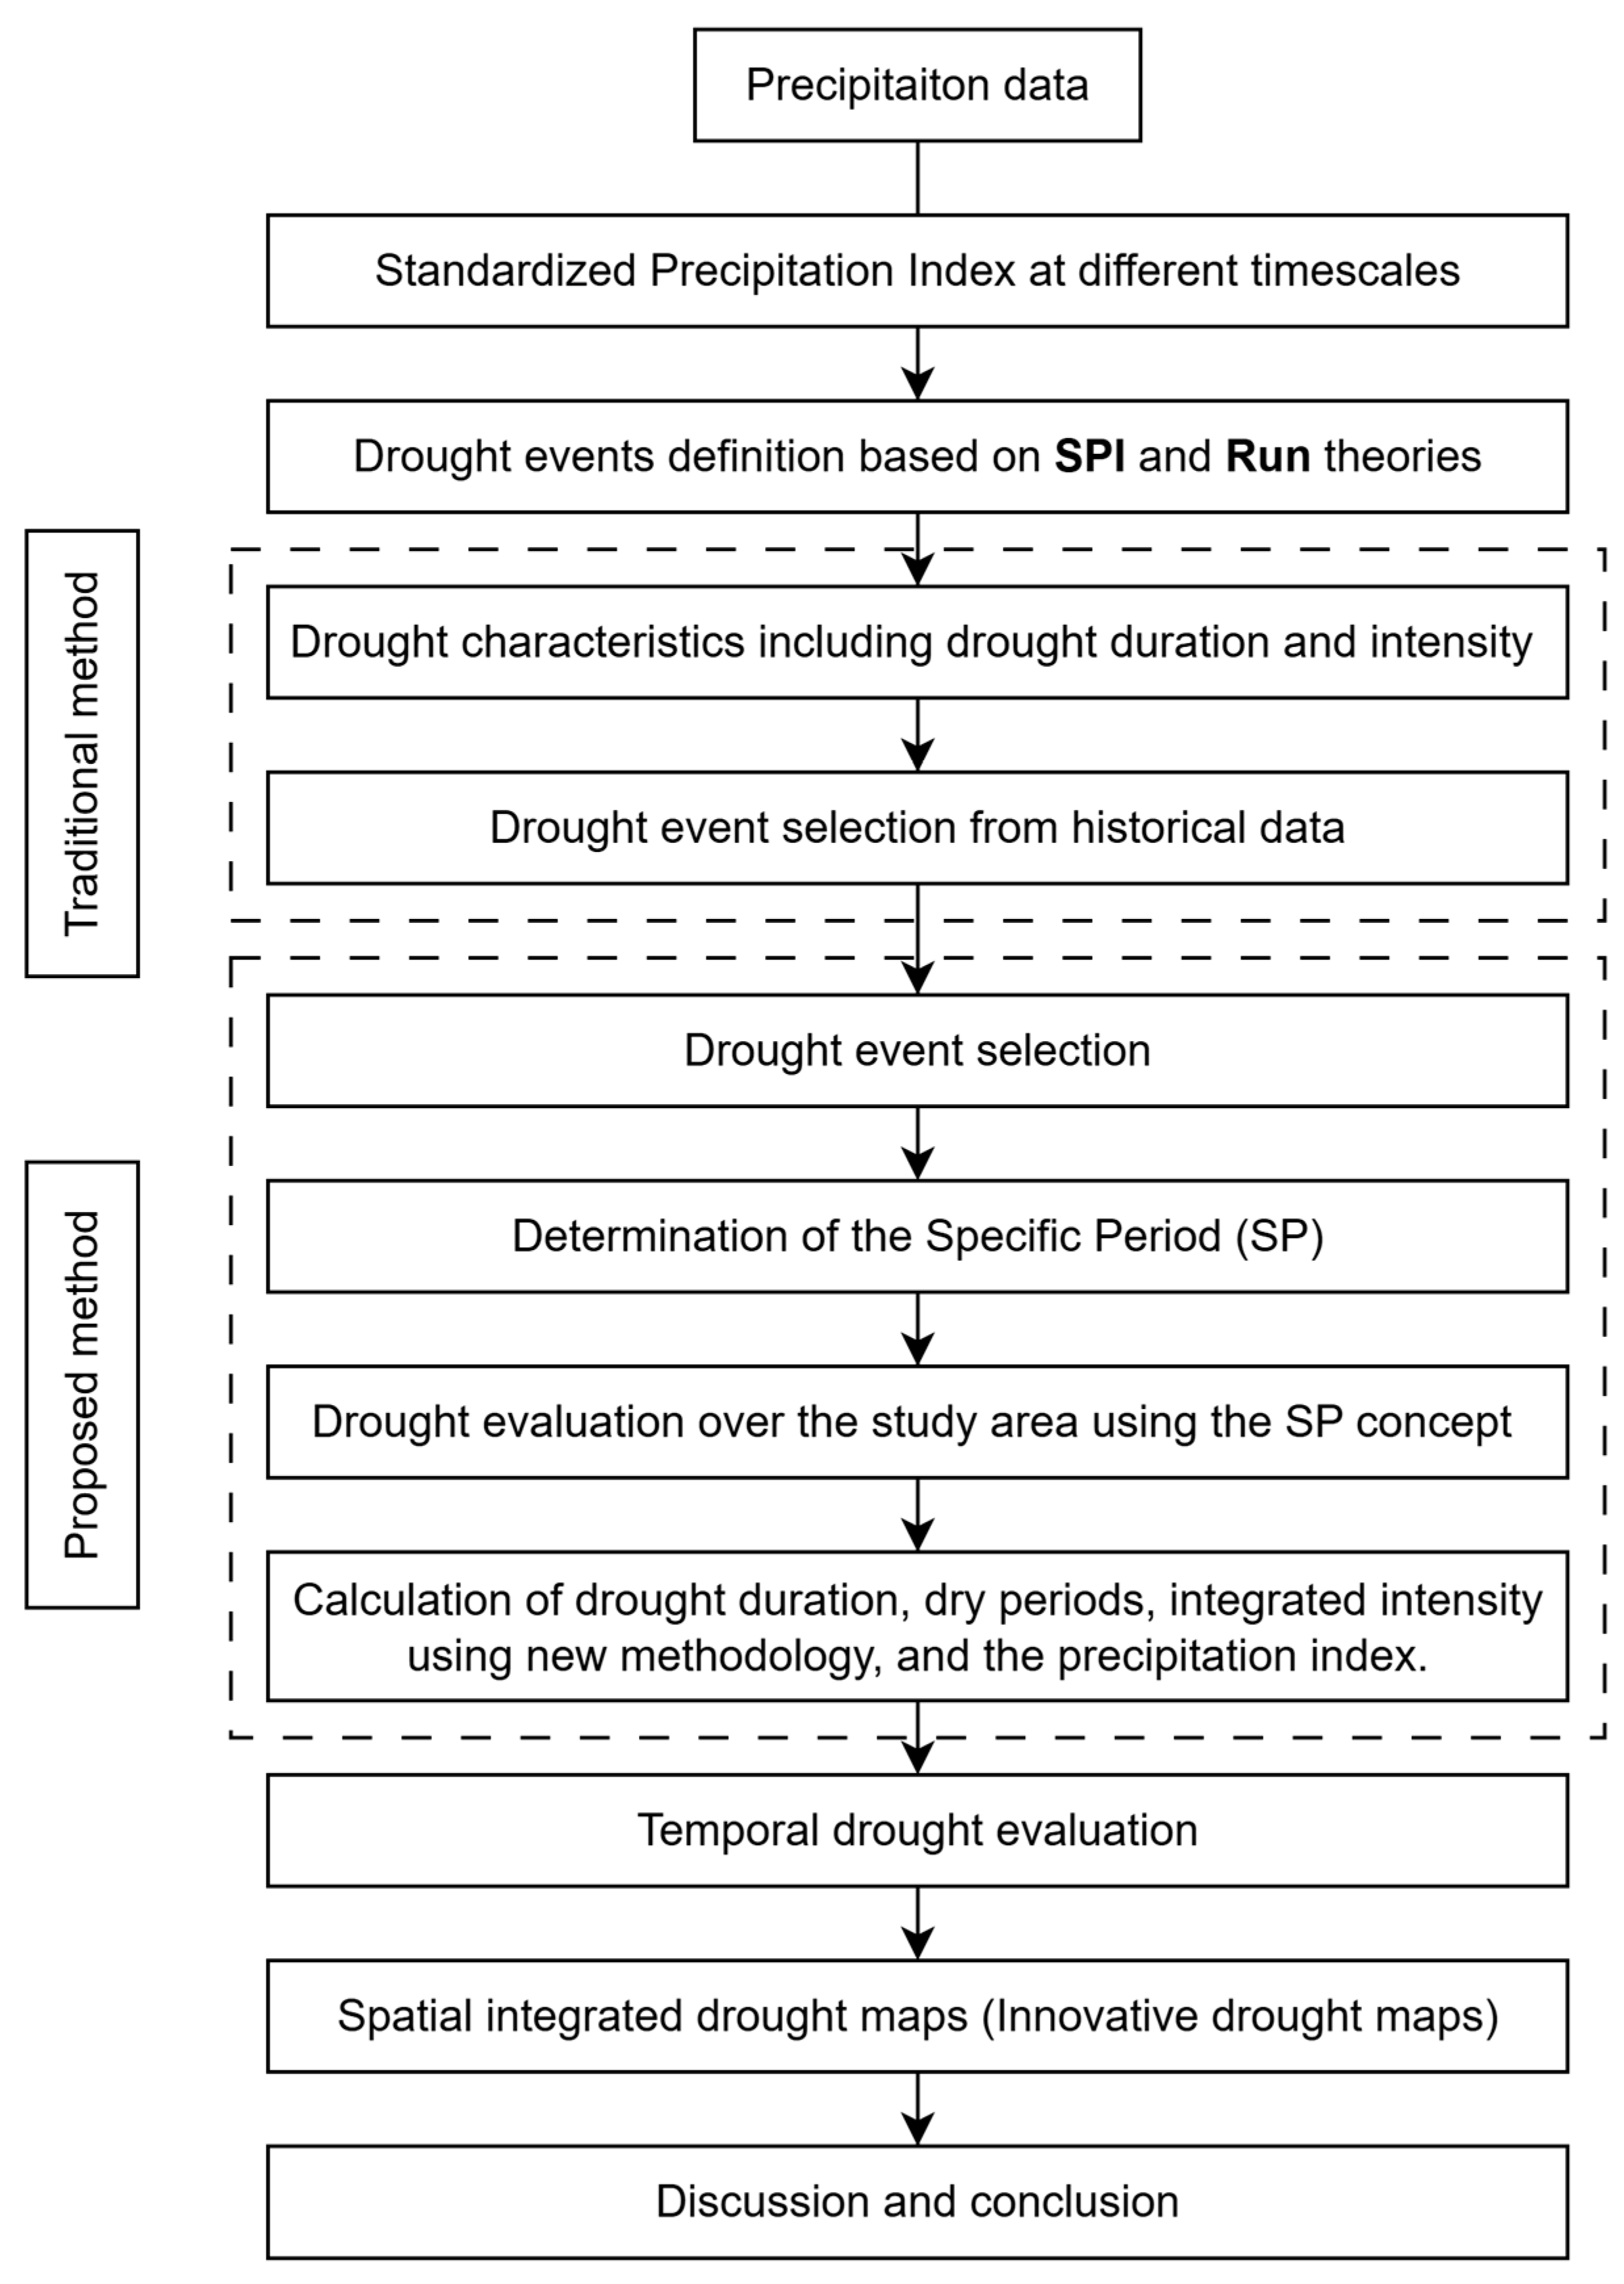
Figure 3 shows the methodological flowchart of the proposed method.

5. Results

The results obtained within the new concepts of this research are presented in this section for the Konya Closed Basin, along with SPI time series, drought characteristics, and innovative maps. The results from different methods are comparatively evaluated, revealing the basin’s temporal and spatial diversity of droughts more clearly. Two drought events and two SPs were selected for analysis in this study. The first is based on SPI-6, and the second on SPI-12.

5.1. First Drought Event Using SPI-6

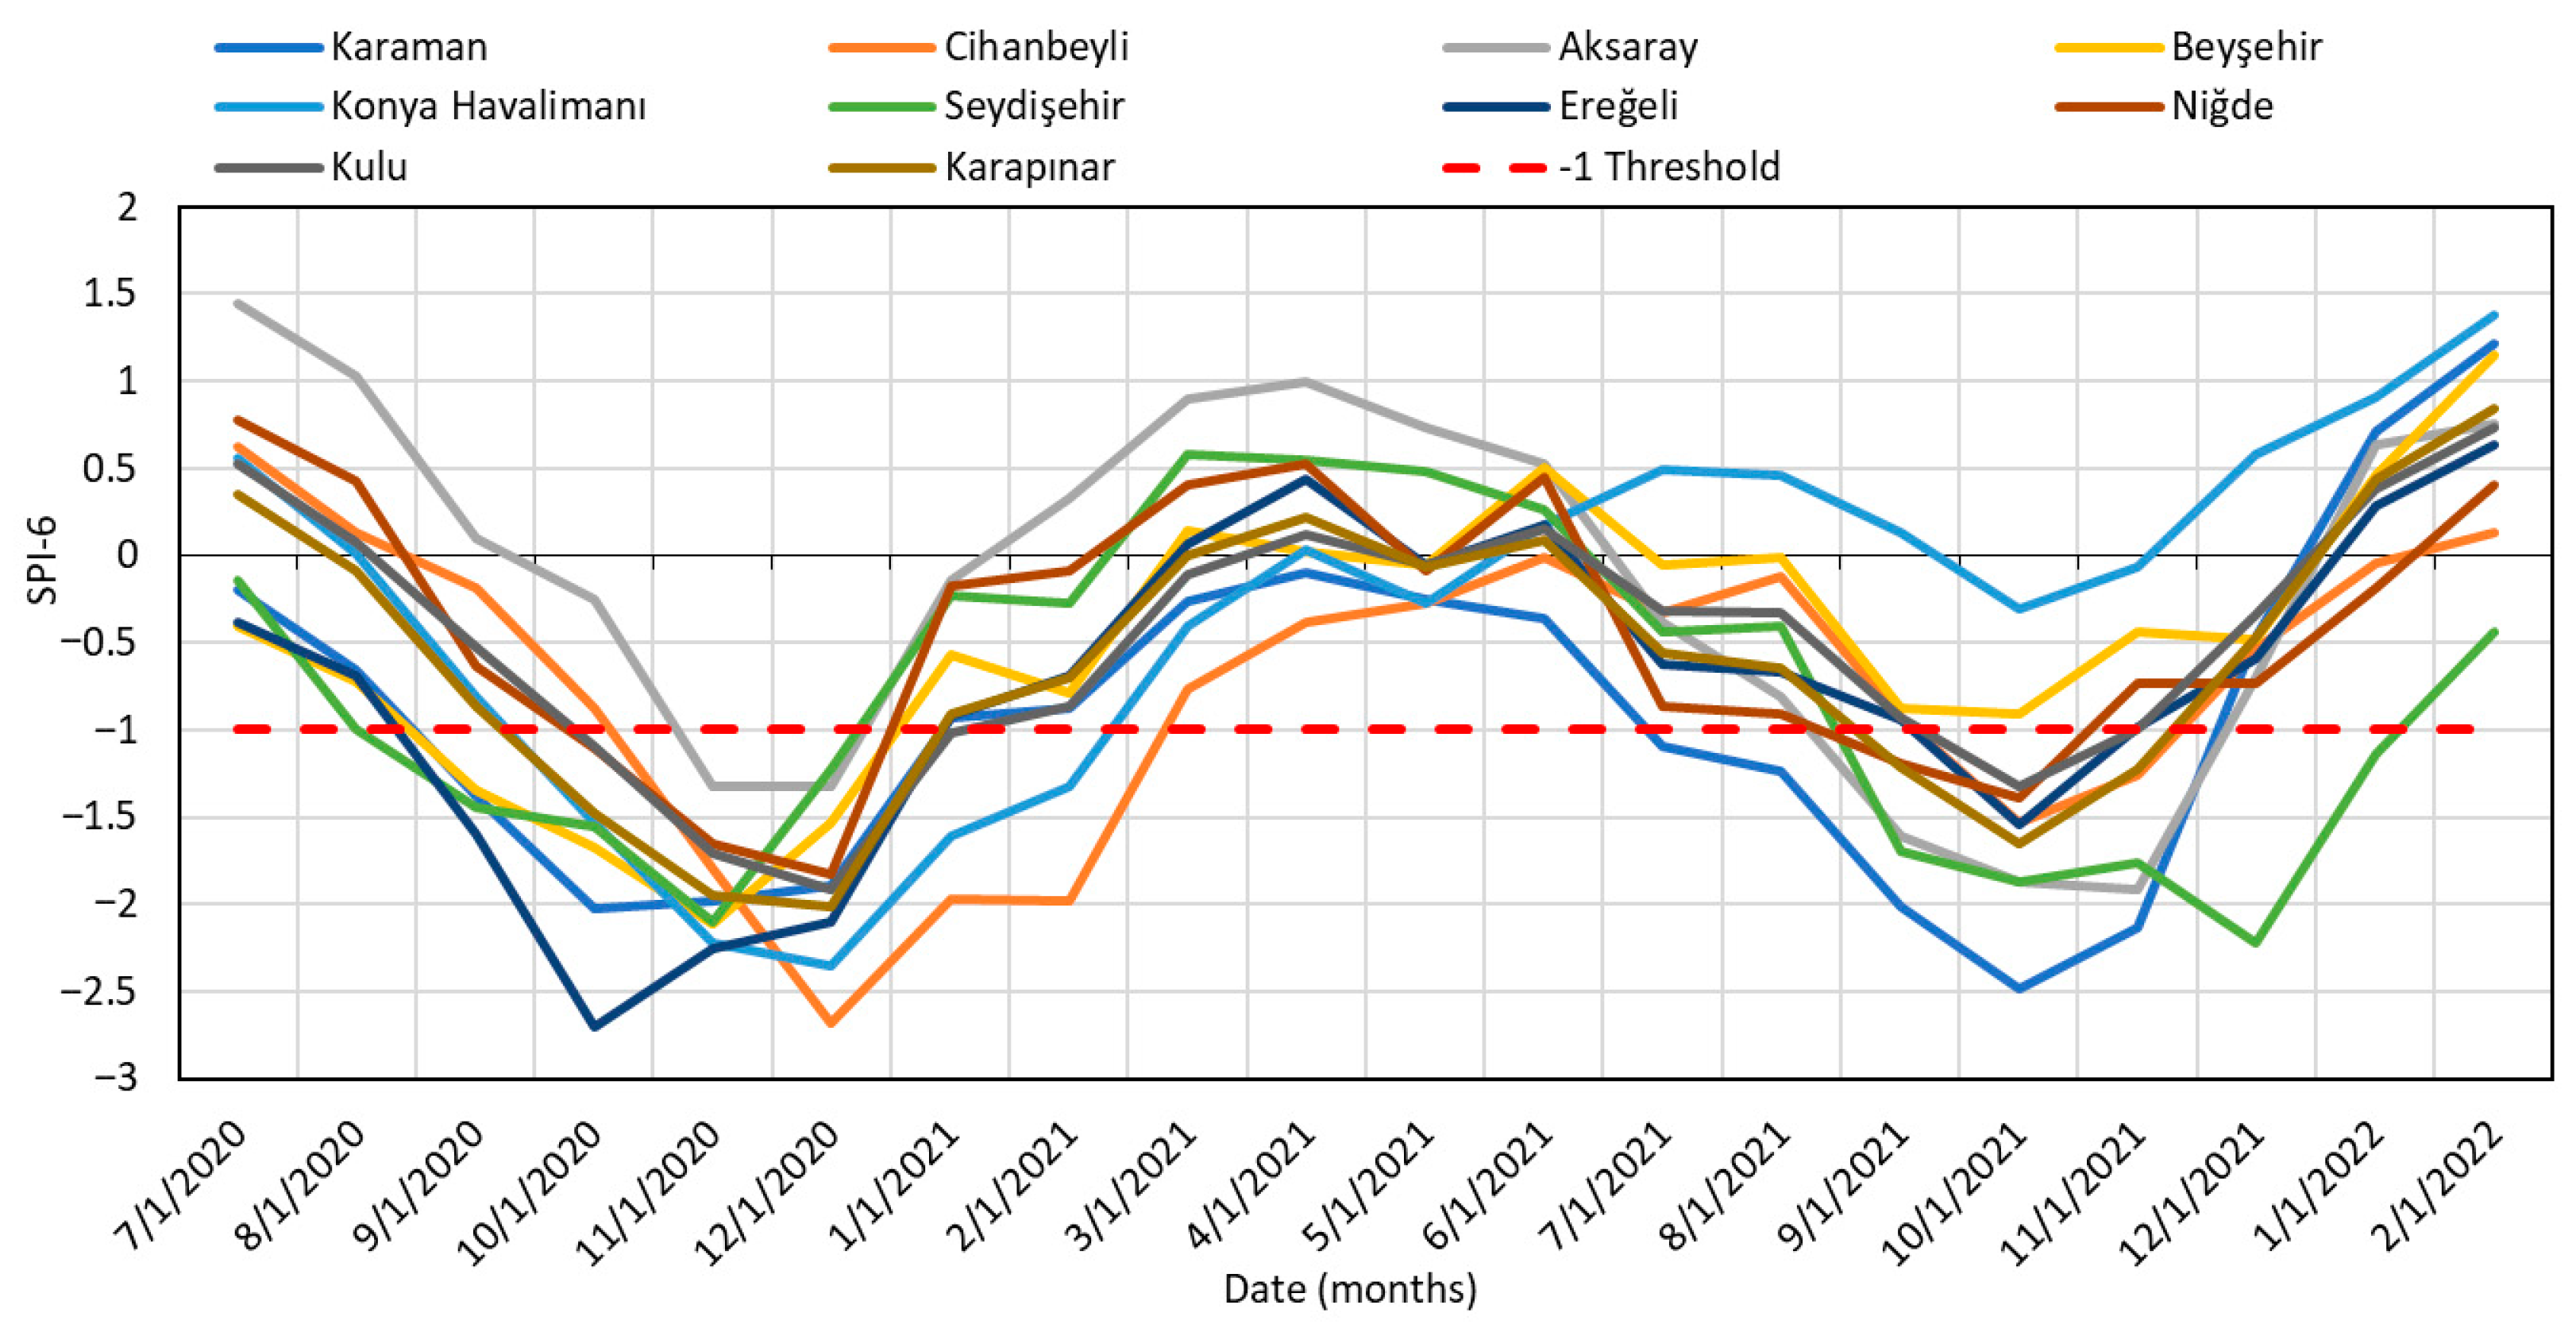
According to the SPI drought event definition, a drought event that began in September 2020 at Karaman, Beyşehir, Seydişehir, and Ereğli stations and their immediate surroundings, and continued uninterrupted for sixteen months in and around Karaman, was examined as the first drought event on a six-month timescale. In this context, the drought dynamics of the basin were examined in both temporal and spatial dimensions. This first drought event is one of the most critical drought events of recent years for the KEB on the relevant time scale. First, the temporal characteristics of the drought event are identified by examining the SPI-6 index time series for the period from July 2020 to February 2022.

5.1.1. Temporal Drought Evaluation

The SPI-6 drought index time series in the KEB is shown in Figure 4 and covers the period from July 2020 to February 2022. The drought trends at meteorological stations are clearly visible. Figure 4 clearly shows the start and end times of drought events, as well as the changes in drought index values on a monthly, seasonal, and annual scale. According to the Run theory, precipitation deficiencies became evident across the vast majority of the basin starting in September 2020, and the drought intensified rapidly, particularly at the Karaman, Cihanbeyli, Beyşehir, Konya Havalimanı, Seydişehir, Ereğli, and Karapınar stations. The SPI-6 values of these stations decreased rapidly until December 2020, falling below the critical threshold of −1.0 in SPI theory. In some regions, the SPI dropped below −2.0, indicating the emergence of severe drought conditions (Figure 4). After December 2020, a significant decrease in drought severity was observed in the basin as precipitation began to increase. Particularly in the spring of 2021, SPI-6 values increased at many stations between April and May, and the drought impact eased.
In conclusion, the SPI-6 time series graphs indicate that the drought event, which began in the fall of 2020, remained intense until the spring of 2021. It experienced a temporary improvement with increased precipitation in the summer, but the condition intensified again in the fall and then faded away during winter. However, differences in the spatial distribution of drought trends clearly demonstrate that assessments based on specific stations or periods are insufficient and that drought events must be examined in terms of both temporal and spatial integrity.
Using different tables and maps, the next four sections comprehensively examine the drought characteristics calculated based on the SPI-6 analysis results for the first selected drought event in March, June, September, and December 2021. Unlike traditional methods, the new framework proposed in this research assesses drought characteristics not only at individual stations and specific periods, but also spatially and temporally, through comparative analyses based on different definitions of drought events.

5.1.2. Drought Evaluation in March

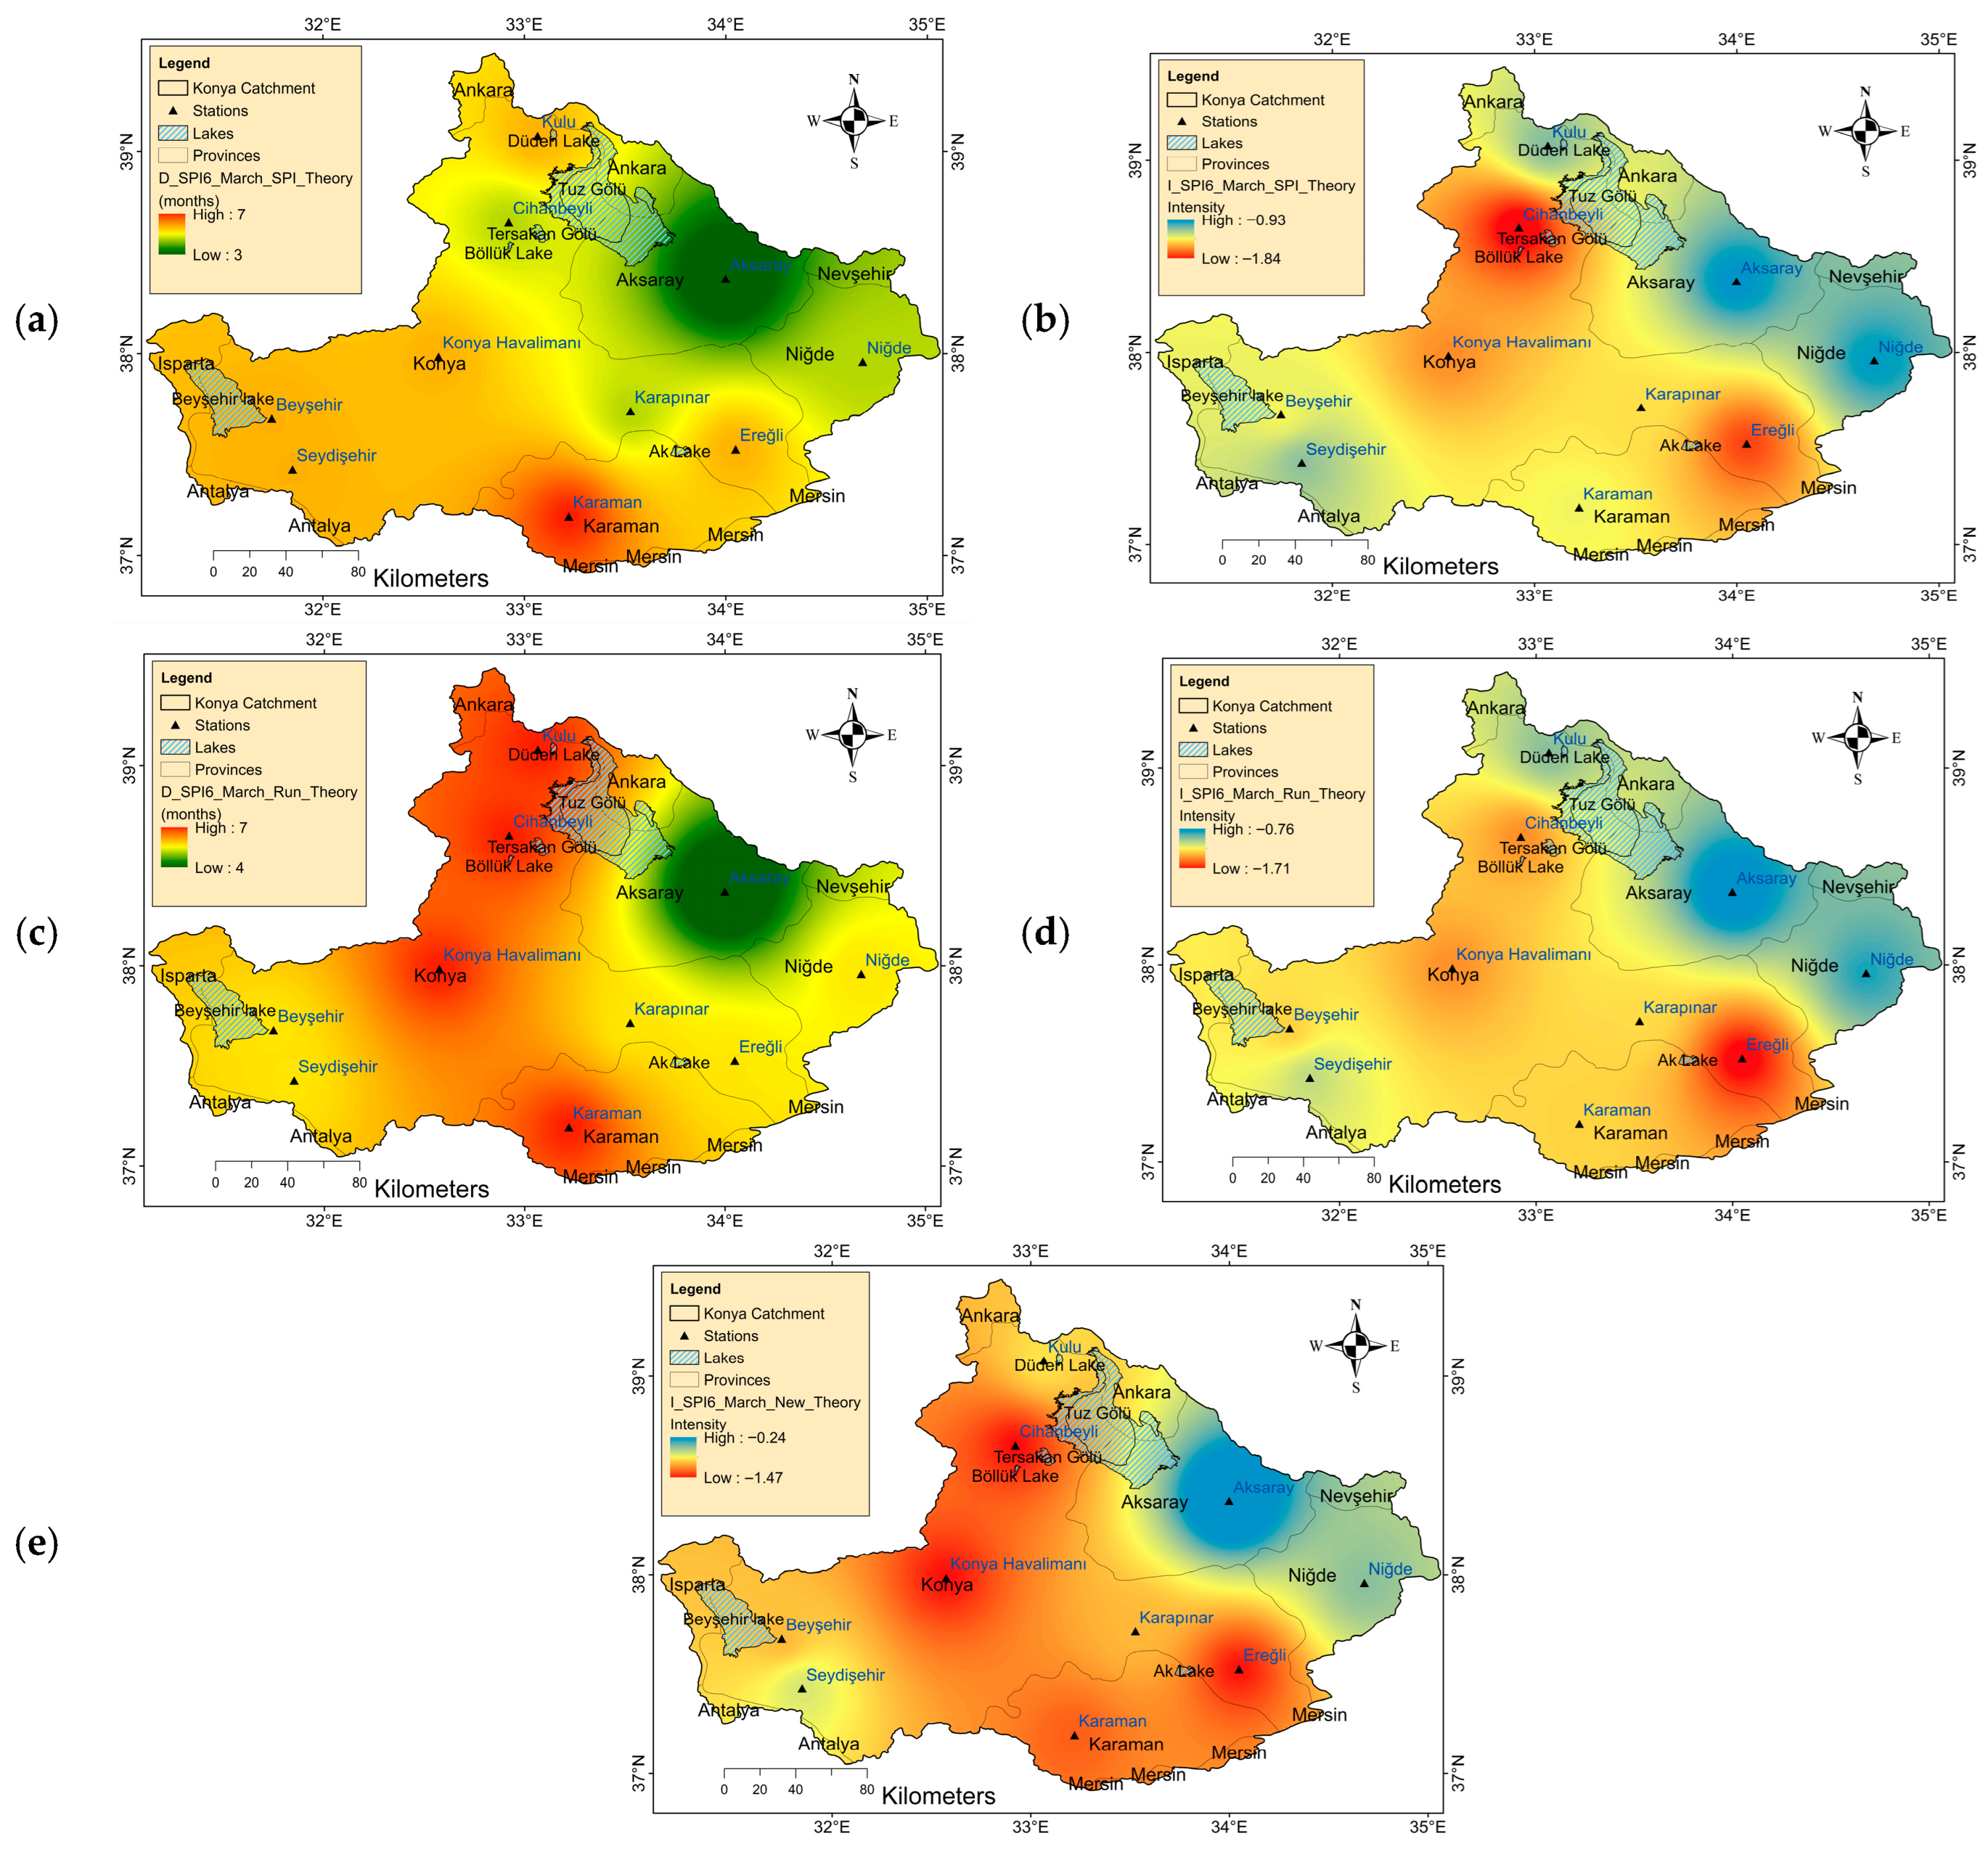
Table 3 summarizes drought characteristics, and Figure 5 shows the innovative drought maps for March-based analysis. Additionally, the spatial implications of methodological differences yield striking findings not previously reported in the literature regarding drought conditions. First, analyses conducted according to the SPI drought event definition indicate that a drought event lasting up to seven months, with a magnitude of −1.33, was experienced in March 2021 in Karaman and its immediate surroundings in the south. Furthermore, the duration of this drought event, which affected Ereğli in the immediate east, Beyşehir and Seydişehir in the west, Konya Havalimanı and its surroundings in the center, and Kulu and its surroundings in the north, was felt throughout much of the basin and was determined to be six months. An examination of the distribution of drought intensity for this event, as shown in Figure 5b,d, reveals significant regional differences. Furthermore, the drought duration along the line extending from north to south, from Cihanbeyli to Karapınar, and eastward to Niğde was approximately five months; however, drought intensity varied spatially. Along this line, intensity values decreased from −1.84 to −1.41 from north to south, decreasing to −0.97 as they approached Niğde in the east (Figure 5; Table 3).
In the evaluations based on the Run theory definition, no differences were observed with the SPI theory results regarding drought duration and intensity at the Karaman, Beyşehir, Seydişehir, and Ereğli stations. In contrast, drought durations increased by one month in Karapınar, Kulu, Niğde, Konya Havalimanı, and Aksaray; however, differences in average drought intensities were observed at −0.09, −0.09, −0.06, −0.11, and −0.17, respectively (Table 3, Figure 5d). In Cihanbeyli, drought duration increased from five to seven months, while average drought severity decreased from −1.84 to −1.47. During the study period from September 2020 to March 2021, according to the Run theory results, drought durations across most of the basin varied between four and seven months, depending on the time and location (Figure 5c). During this period, it was determined that, in addition to regional drought conditions, wet events occurred within 0 to 3 months in some parts of the basin (Figure 5c).
When the precipitation intensity map presented in Figure 5e is examined, it is seen that the drought intensity and precipitation intensity values are similar at the stations and close to each other in their immediate surroundings at Karaman, Cihanbeyli, Konya Havalimanı, and Kulu stations, where the drought duration is seven months. In Aksaray, where the drought duration is four months and the wet period is three months, the average drought severity between September 2020 and March 2021 decreased to −0.24, as seen in Figure 5d. For example, drought intensity decreased from −1.71 to −1.46 in Ereğli, from −1.34 to −1.13 in Beyşehir, from −1.32 to −1.13 in Karapınar, from −1.14 to −0.89 in Seydişehir, and from −0.91 to −0.73 in Niğde (Table 3 and Figure 5e).

5.1.3. Drought Evaluation in June

By June, drought durations at the Karaman and Cihanbeyli stations increased from seven to ten months and five to eight months, respectively, according to the SPI theory (Table 4). At the other stations, drought conditions remained unchanged compared to March during the specific period assessment, due to the wet month of April, followed by wet months in May and June, and/or the failure of drought conditions to recur according to the SPI theory (Figure 5a,b). Therefore, drought duration, severity, and intensity remained unchanged at these eight stations between September 2020 and June 2021. However, the situation differs in the assessments based on the Run theory (Figure 6c,d). As drought durations increased, seasonal influences extended these periods, increasing drought risks; however, there was a slight decrease in drought intensity. For example, in Ereğli, where the highest drought severity was observed, the value decreased from −1.71 in March to −1.48 in June (Table 4). The increases in drought duration and intensity reveal a persistent drought trend, particularly in Karaman in the south and Cihanbeyli and its surrounding areas in the north (Figure 5). Conversely, at other stations, particularly in the east-west and inland areas, a period of partial weakening of drought effects was observed during the transition from March to June, as indicated by a comparison of Figure 5, Table 3 and Table 4. When these seasonal changes in drought duration and severity at station levels are considered together with Table 3 and Table 4, and Figure 5b,d and Figure 6b,d, it is clearly revealed that drought conditions have become more widespread in terms of duration throughout the basin but have partially eased in terms of intensity.
Comparing the P_Index values given in Table 3 and Table 4, it is observed that the P_Index values increased from March to June at many stations, indicating a tendency towards easing drought intensity. For example, in Aksaray, the P_Index increased from −0.24 in March to 0.06 in June. Similarly, it increased from −1.13 to −0.74 in Beyşehir, from −0.73 to −0.42 in Niğde, from −1.03 to −0.70 in Kulu, and from −1.13 to −0.77 in Karapınar (Figure 6e). This highlights the stabilizing effect of seasonal wet periods on drought, demonstrating that traditional approaches focusing solely on duration or severity can provide an incomplete picture, and that the proposed new approach offers a much more comprehensive perspective on drought assessments.

5.1.4. Drought Evaluation in September

By September, it can be said that differences in the regional distribution of drought in the KEB became apparent. According to the SPI theory, drought impacts increased significantly in Karaman and Cihanbeyli from June to September (Table 5 and Figure 7). However, due to summer rainfall conditions close to long-term averages across much of the basin, no significant change was observed in September drought conditions within the SP compared to June (Table 5 and Figure 7).
A re-evaluation of drought characteristics according to the Run theory revealed significant differences in September compared to June and the drought durations predicted by SPI theory (Table 5 and Figure 7c,d). According to SPI theory, drought duration, which typically ranges from 4 to 7 months across most of the basin, has increased to ten months or more when the Run theory is used as a reference. While the drought duration within the SP at Konya Havalimanı remained unchanged at eight months from June to September, it appears that drought durations extended by an average of three months at the remaining stations in the basin (Table 5 and Figure 7c).
When the drought characteristics for June and September presented in Table 4 and Table 5 are evaluated together with the Precipitation Intensity (P_Index) map presented in Figure 7e, it is observed that drought durations are extended by three months in September at all stations across the basin except Konya Havalimanı, according to the Run theory. However, when the P_Index values of the same stations are examined, a general decreasing trend is evident. For example, the P_Index decreased from −1.09 to −0.77 in Cihanbeyli; similar decreases also occurred in Beyşehir, Ereğli, Kulu, and Karapınar (Figure 7e and Table 5). Therefore, the Precipitation Intensity indicator, taking into account the effect of wet periods, demonstrates that drought assessments should consider drought duration, intensity, and wetness severity, along with spatial and temporal variations.
While drought durations generally increased in September, decreases in P_Index values indicate that drought intensity in many basin regions has partially eased compared to June. This demonstrates that duration or intensity indicators alone are insufficient for drought analyses; more comprehensive indicators that consider both dry and wet periods together (such as the P_Index) are critical.

5.1.5. Drought Evaluation in December

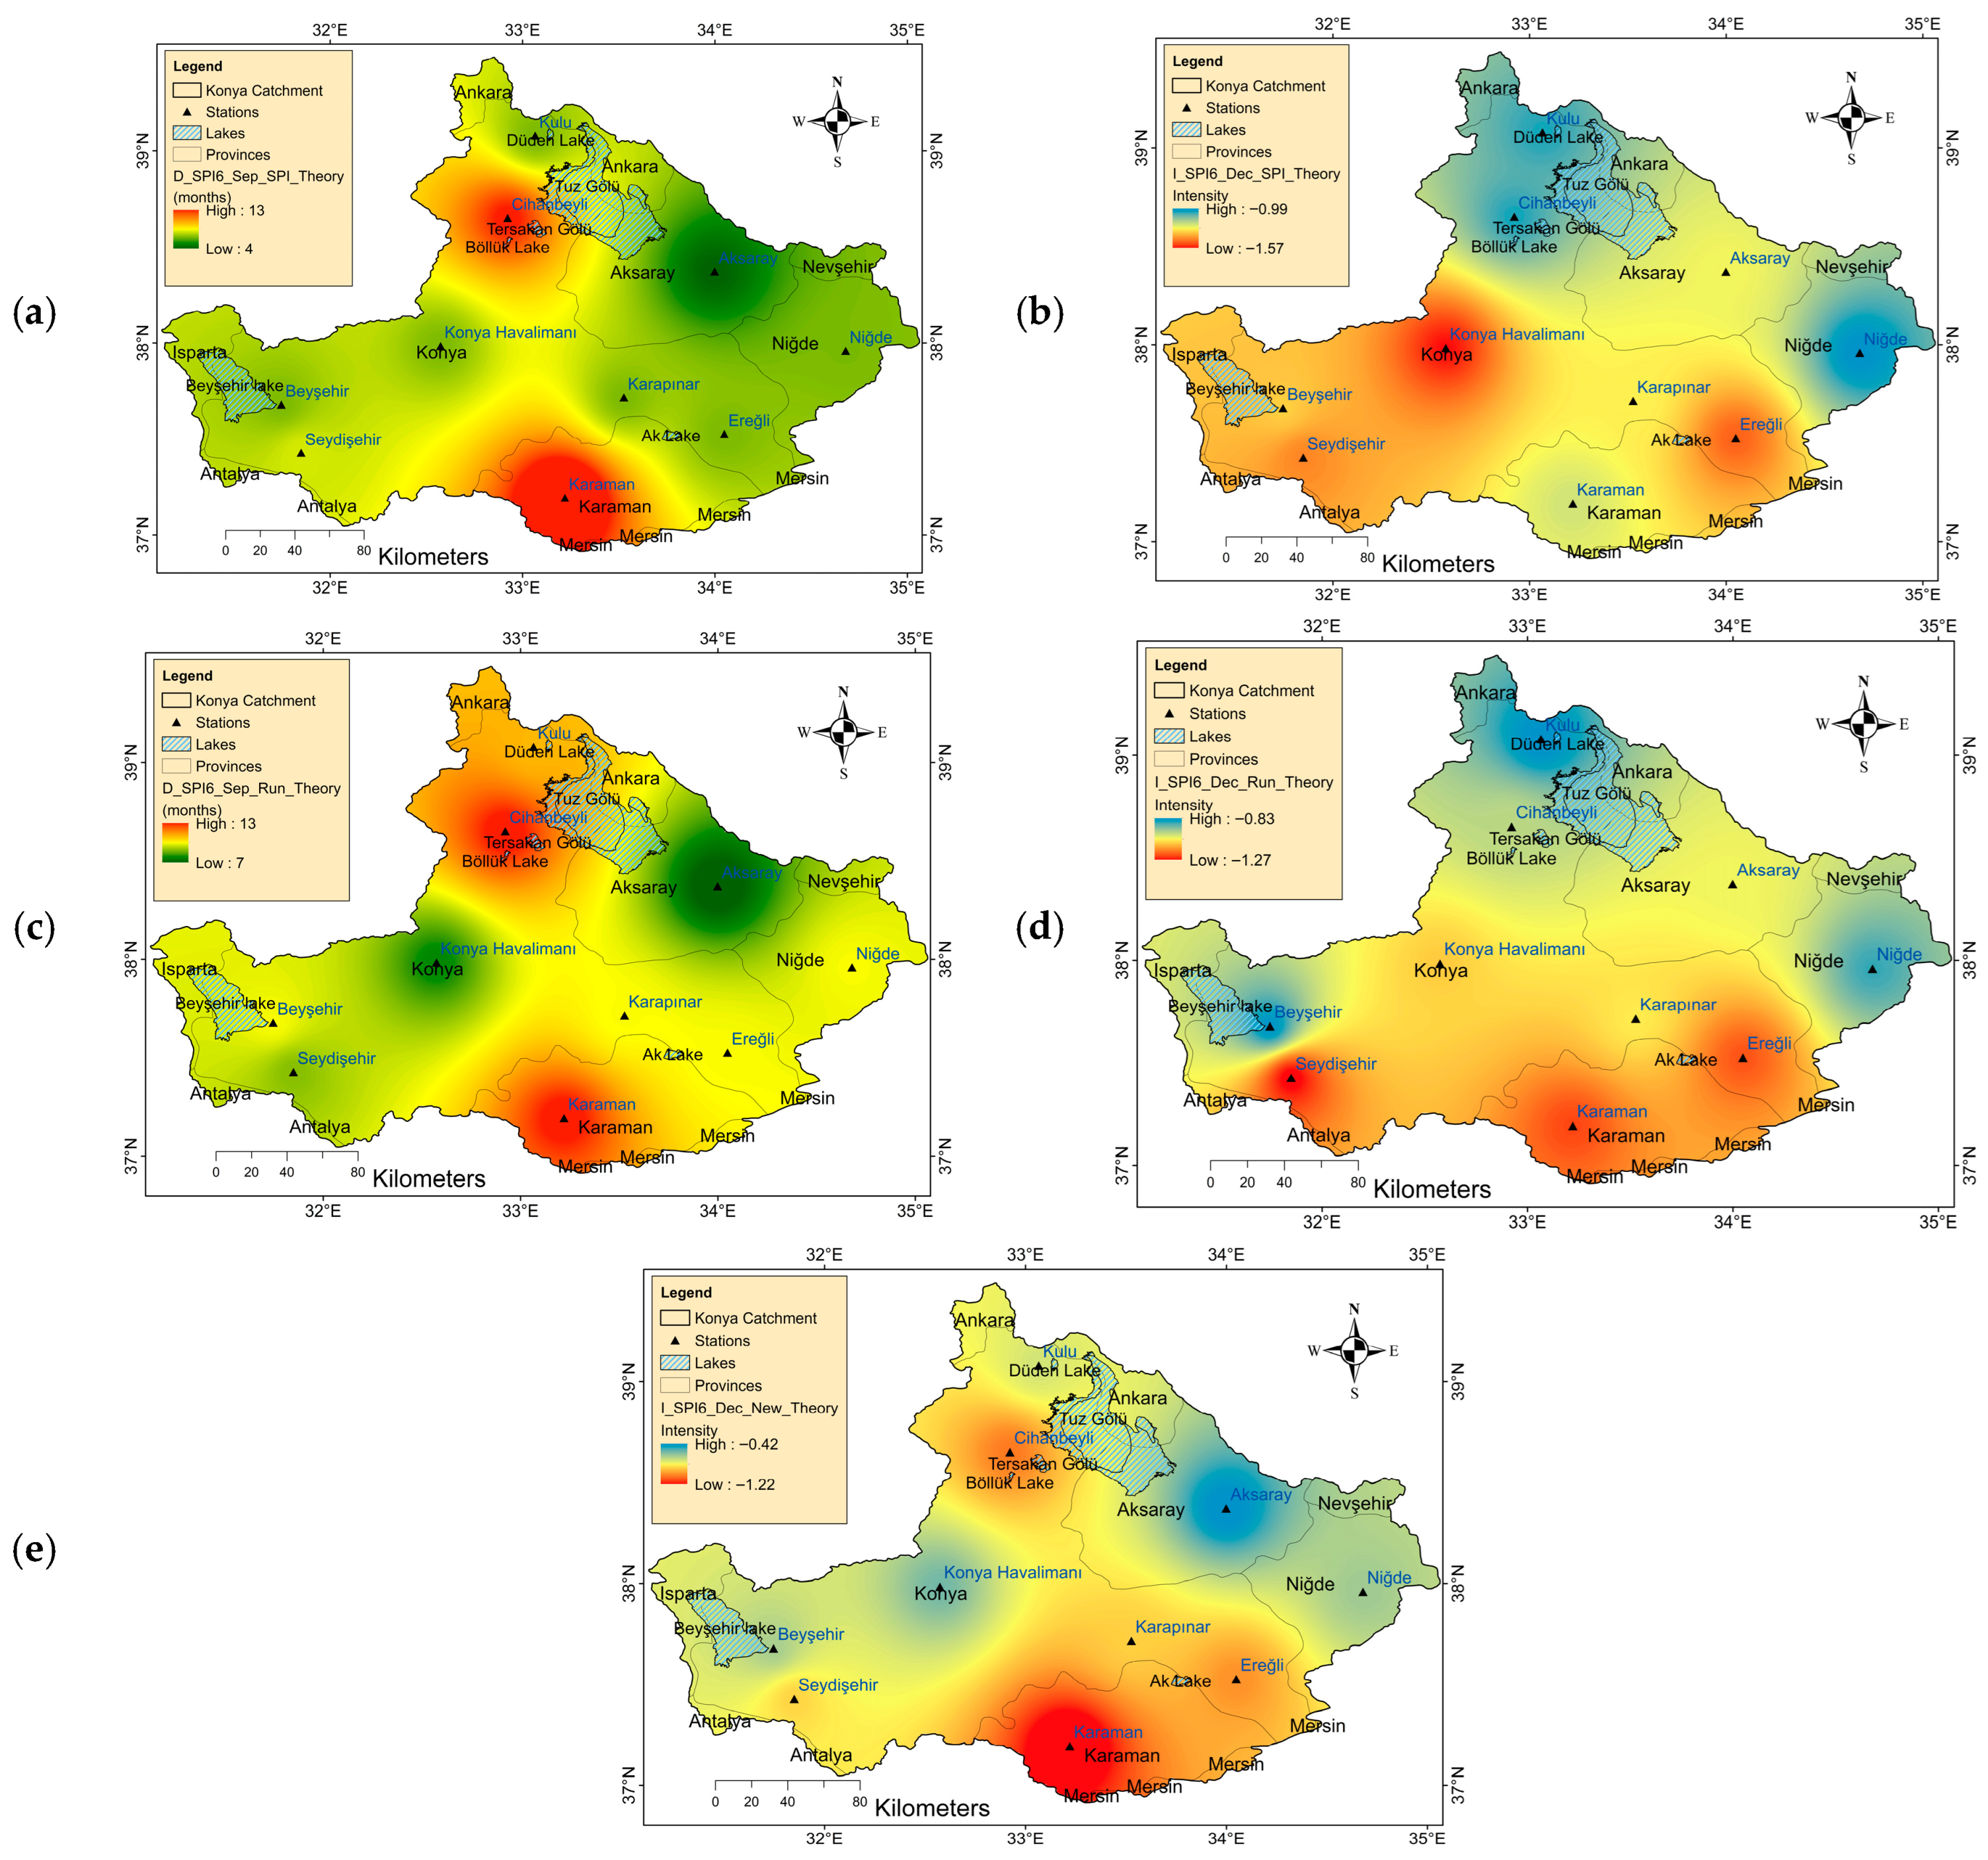
December 2021 assessments indicate that drought has reached critical levels across the basin, both in terms of duration and spatial extent. According to SPI theory results, drought durations around Karaman and Cihanbeyli extended by three months, reaching 16 and 14 months, respectively. As a result, the drought in these regions became almost uninterrupted and continuous (Table 6 and Figure 8a,b). Intensity values also reached −1.22 (Karaman) and −1.04 (Cihanbeyli), indicating that the drought impact continued to increase. During this period, drought durations across the basin also extended by three months, except for Beyşehir and Konya Havalimanı. Analyses revealed that the drought duration was seven months in Aksaray, ten months in Seydişehir, and nine months in Ereğli, Niğde, as well as in Kulu and Karapınar. The maps (Figure 8) clearly illustrate the differences in spatial distribution. Drought duration and intensity maps based on SPI theory show a high drought impact, particularly in Karaman and the surrounding area, while maps based on Run theory present a picture of a drought of longer duration but relatively lower severity (Table 6, Figure 8c,d). When evaluated together with dry and wet periods, the Precipitation Intensity (P_Index) map (Figure 8e) reveals that drought has become the dominant condition, particularly around Karaman and Cihanbeyli.
Assessments conducted in March, June, September, and December 2021 revealed significant regional differences, with Aksaray and its surrounding areas being the least affected by the drought during this period. SPI-based analyses revealed prolonged and severe drought conditions outside Aksaray, Beyşehir, Konya Havalimanı, and surrounding areas. Run theory-based assessments revealed that drought durations were longer throughout the basin, but the intensity partially decreased due to wet periods. Analyses from March to September 2021, in particular, revealed the impact of wet periods across the basin; a decrease in average drought intensity was observed, and even areas with predominant wet conditions outside of critical drought events were identified.

5.2. Second Drought Event Using SPI-12

5.2.1. Temporal Drought Evaluation

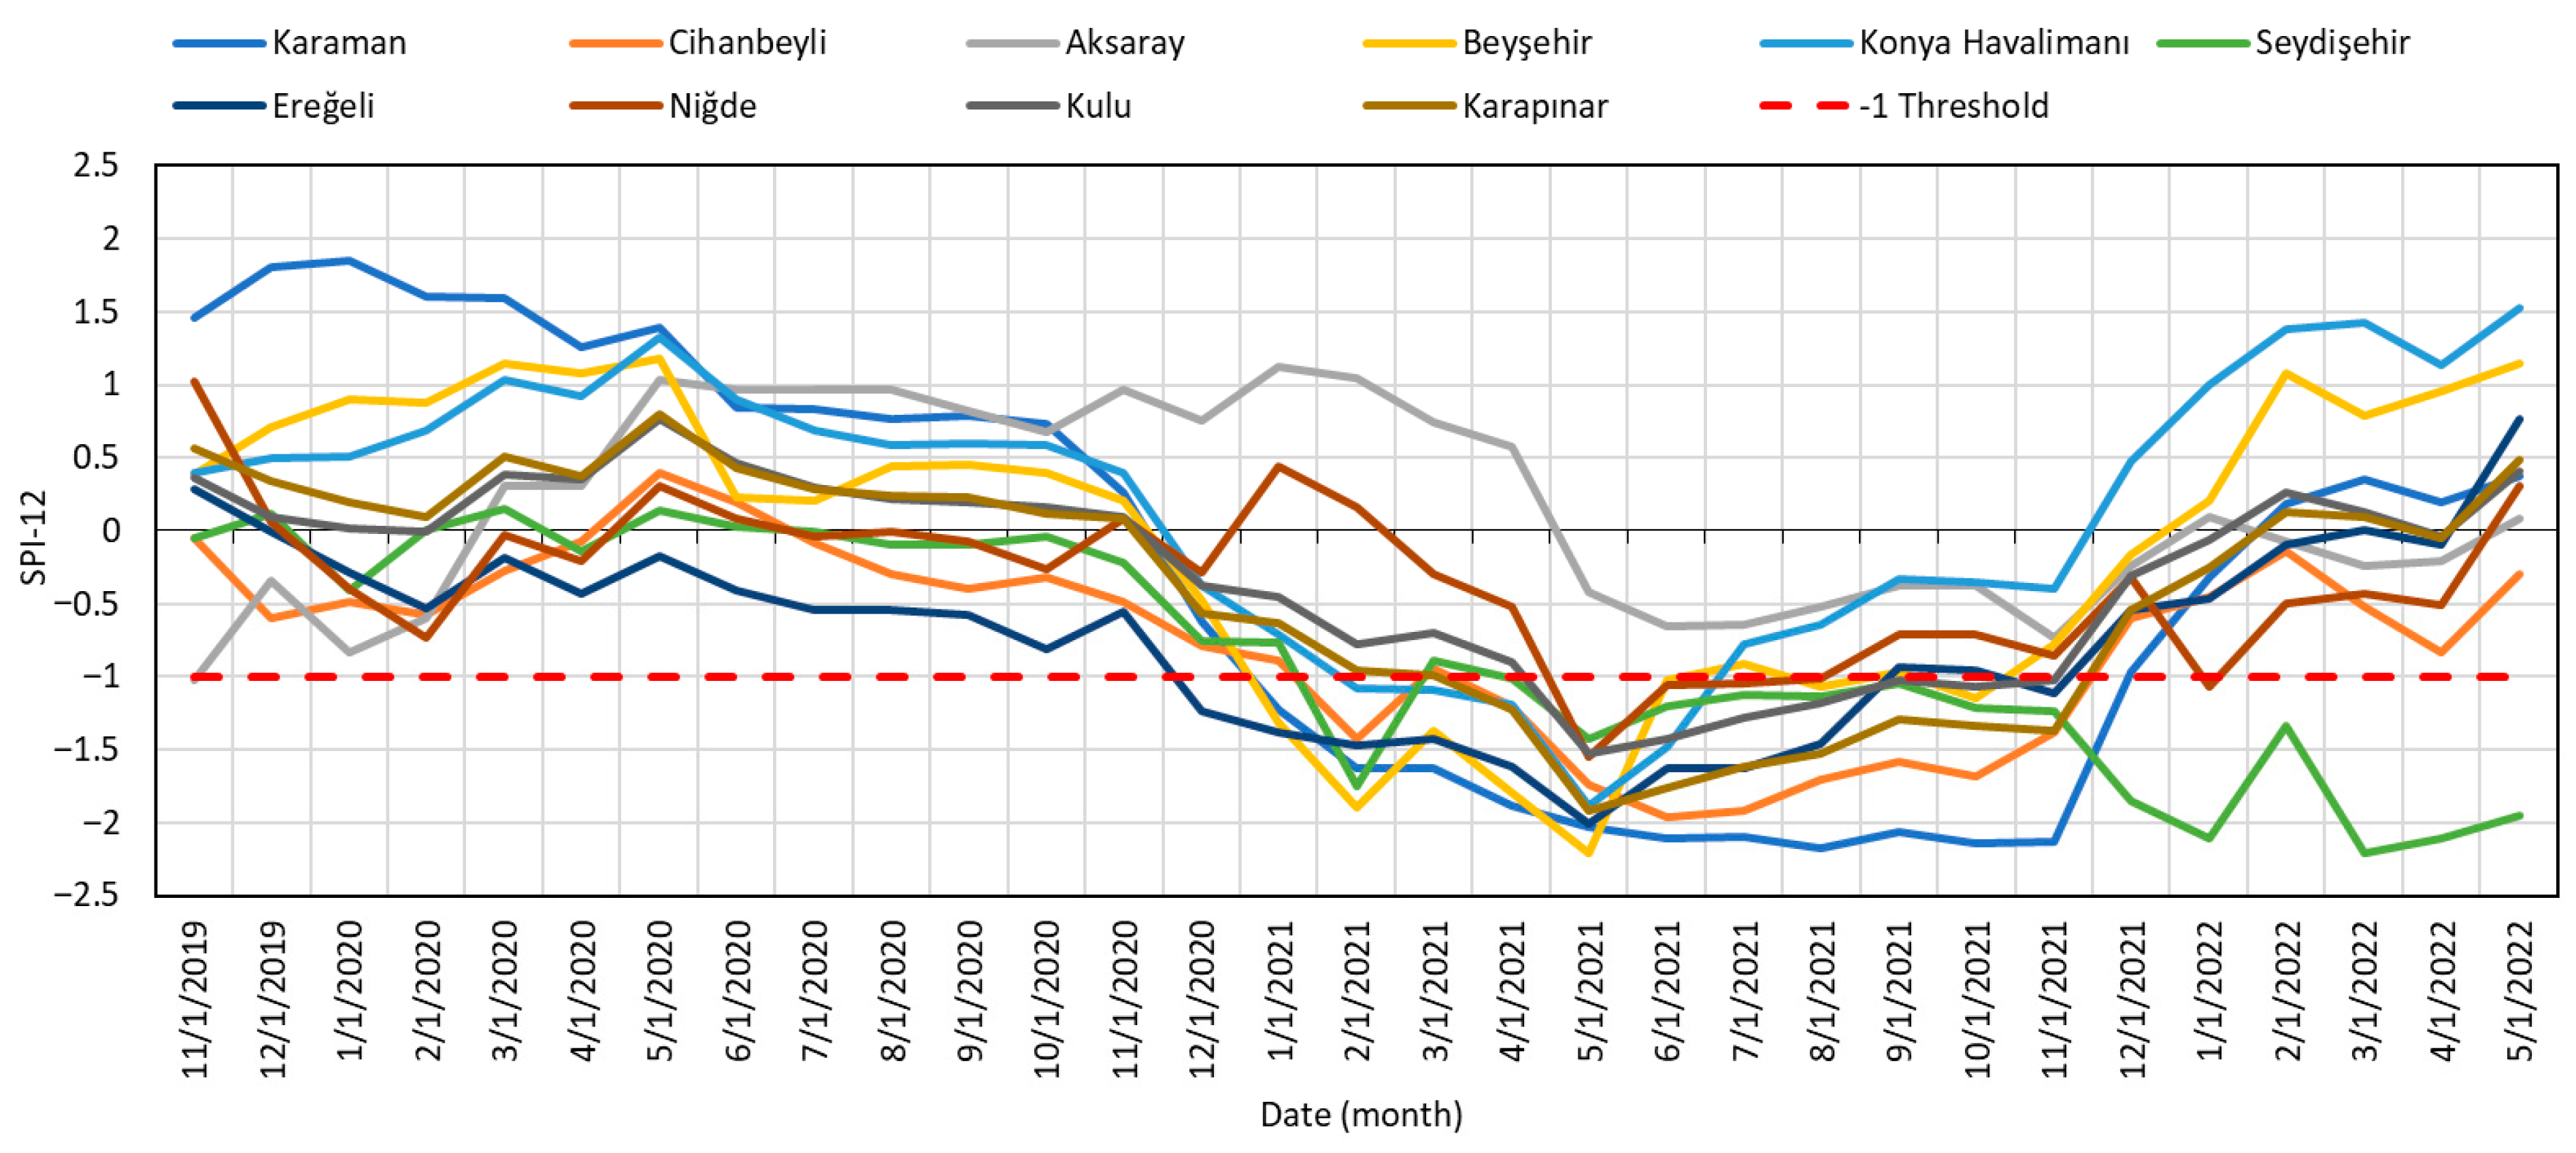
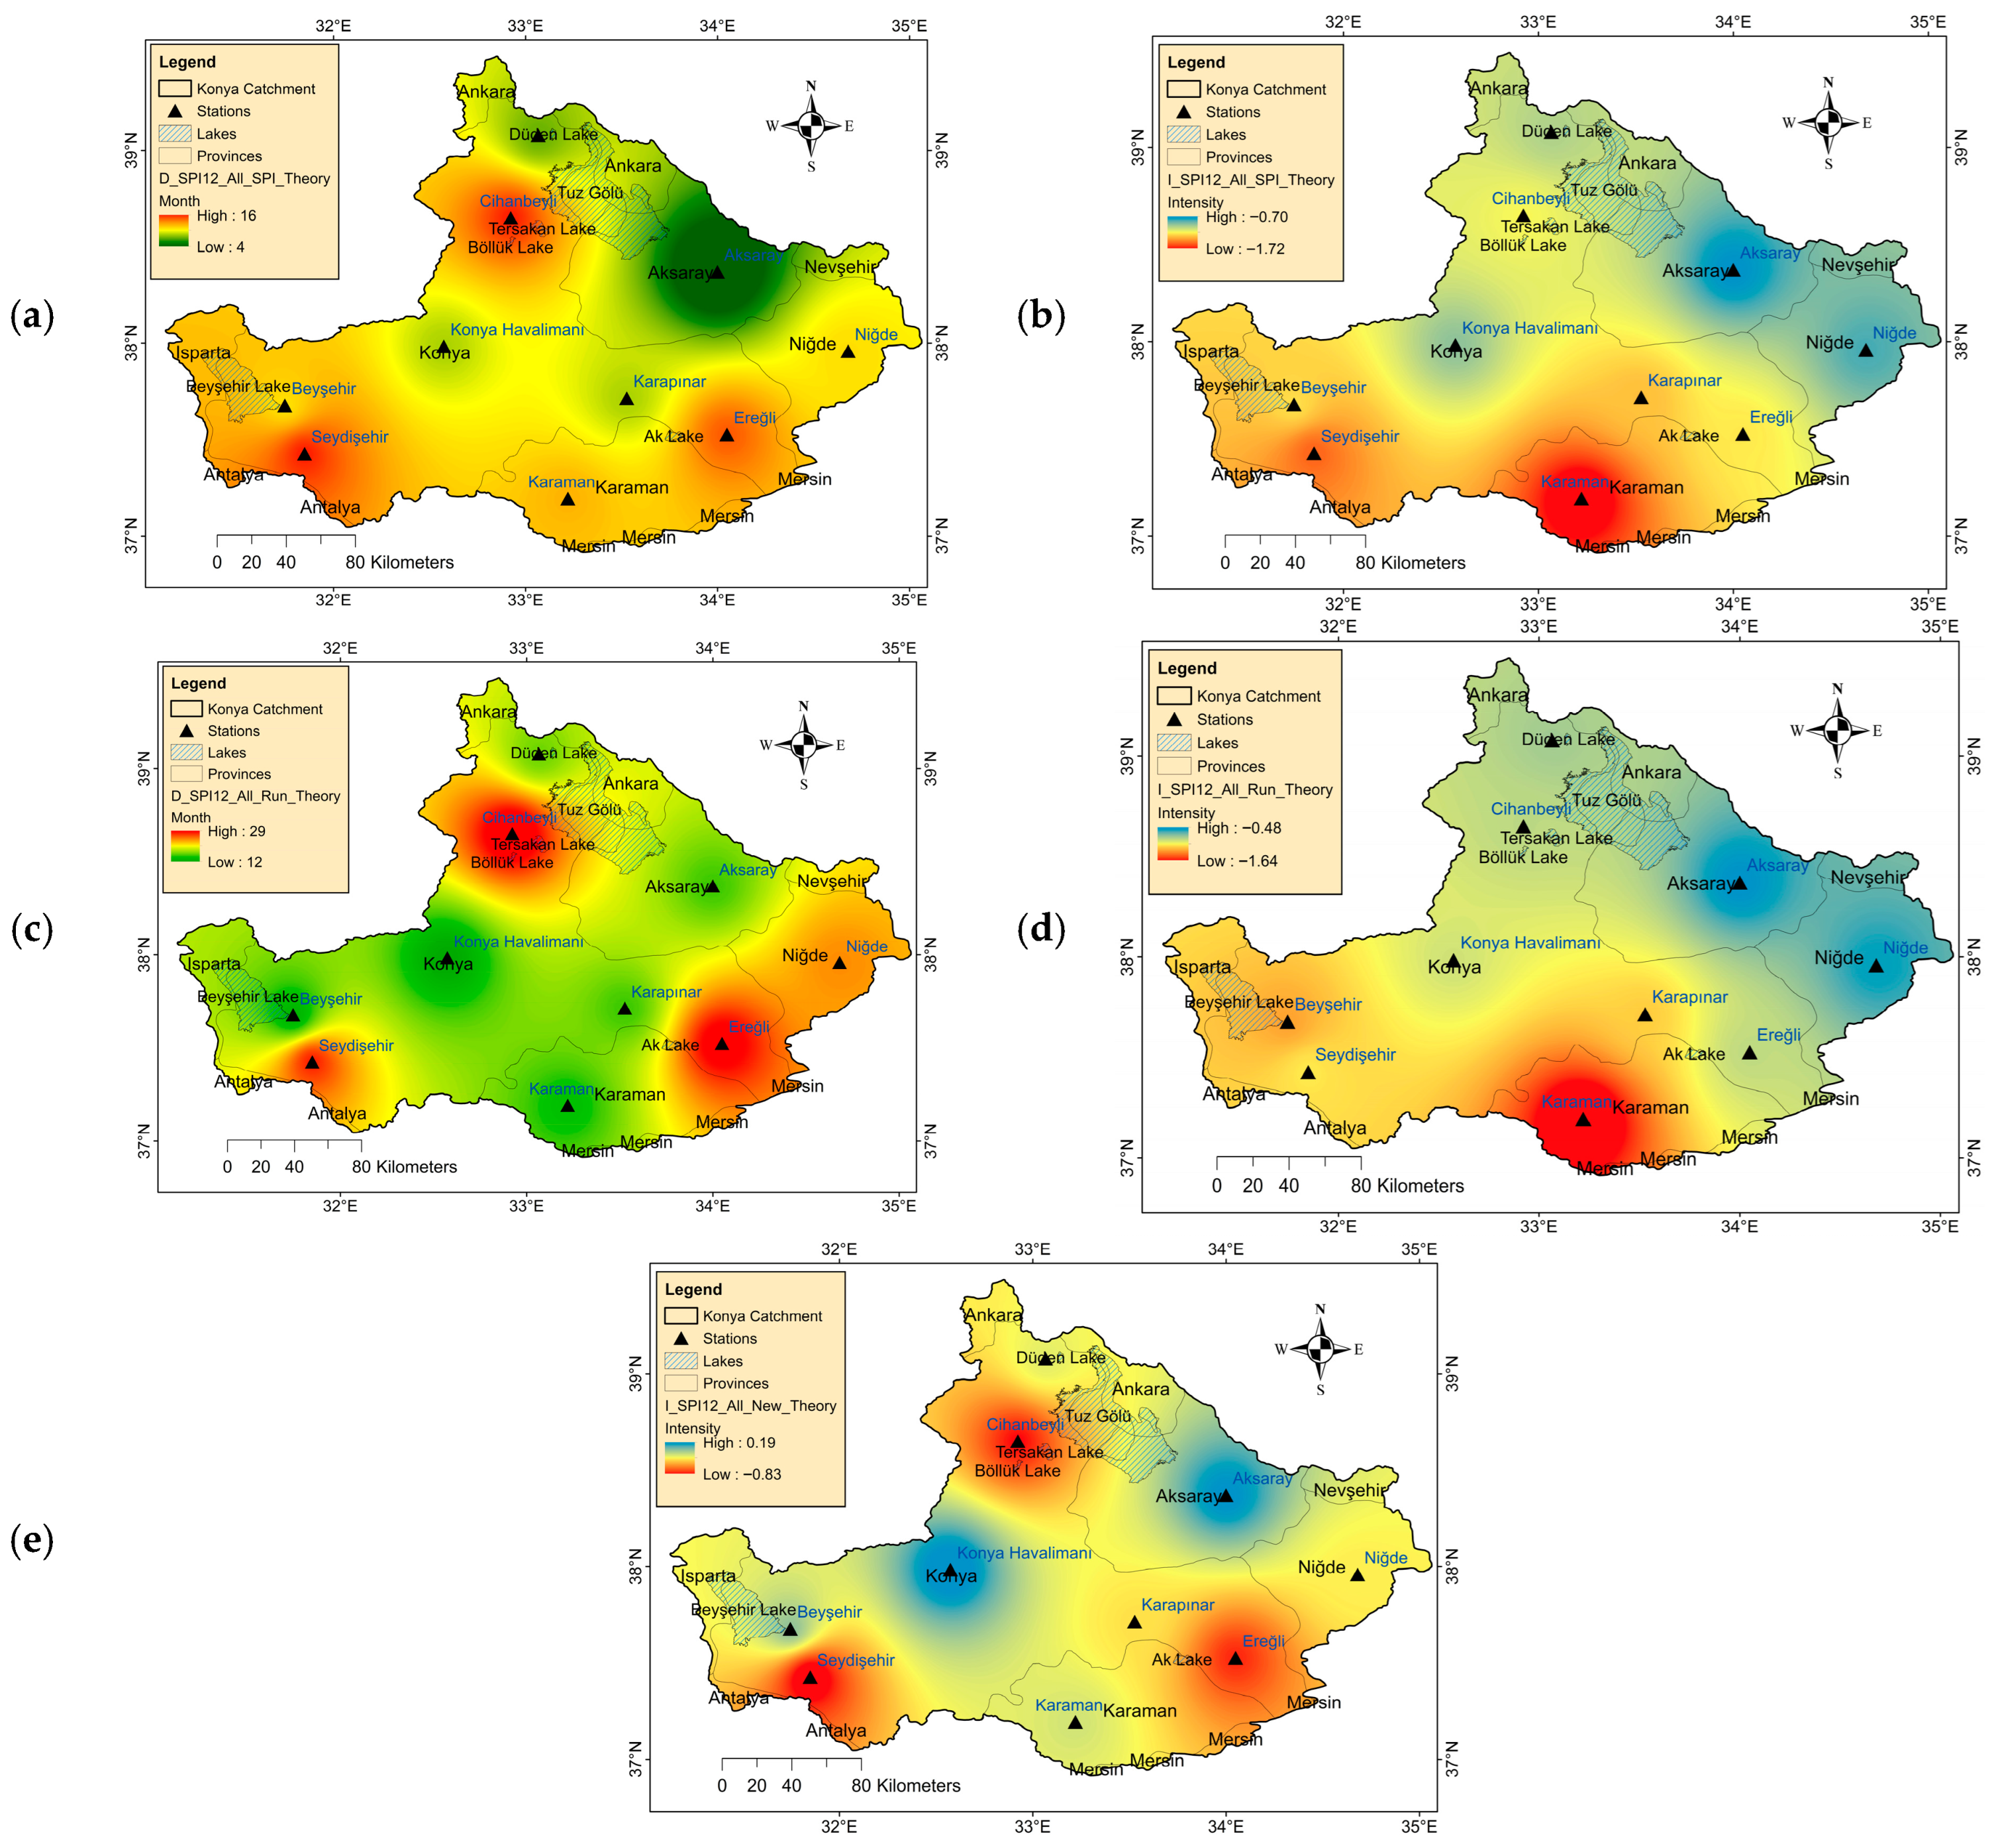
This research section examines the critical drought event selected for evaluation on a twelve-month time scale. As can be seen from the SPI-12 time series graphs in Figure 9, a small portion of the KEB experienced a prolonged drought that began in November 2019 and extended into May 2022. This event is a notable example of understanding the basin’s hydroclimatic characteristics and drought dynamics. According to the Run theory, the drought began to show its first signs in late 2019 around the Cihanbeyli and Aksaray stations. Its effects gradually intensified towards the end of 2020 and became evident throughout the basin at the beginning of 2021. Shortly thereafter, by March 2021, drought conditions intensified throughout the basin, except in Aksaray, and their effects reached their highest levels across the basin, including Aksaray, by May 2022. The drought effect continued with minor changes throughout the basin during the summer and autumn months, and towards the end of December 2021, with the influence of winter precipitation, the drought effect began to diminish across the region. This drought event is worth examining not only for its duration but also for its spatial extent, as it represents one of the most critical hydroclimatic processes for the basin in recent years.

5.2.2. Drought Evaluation in March

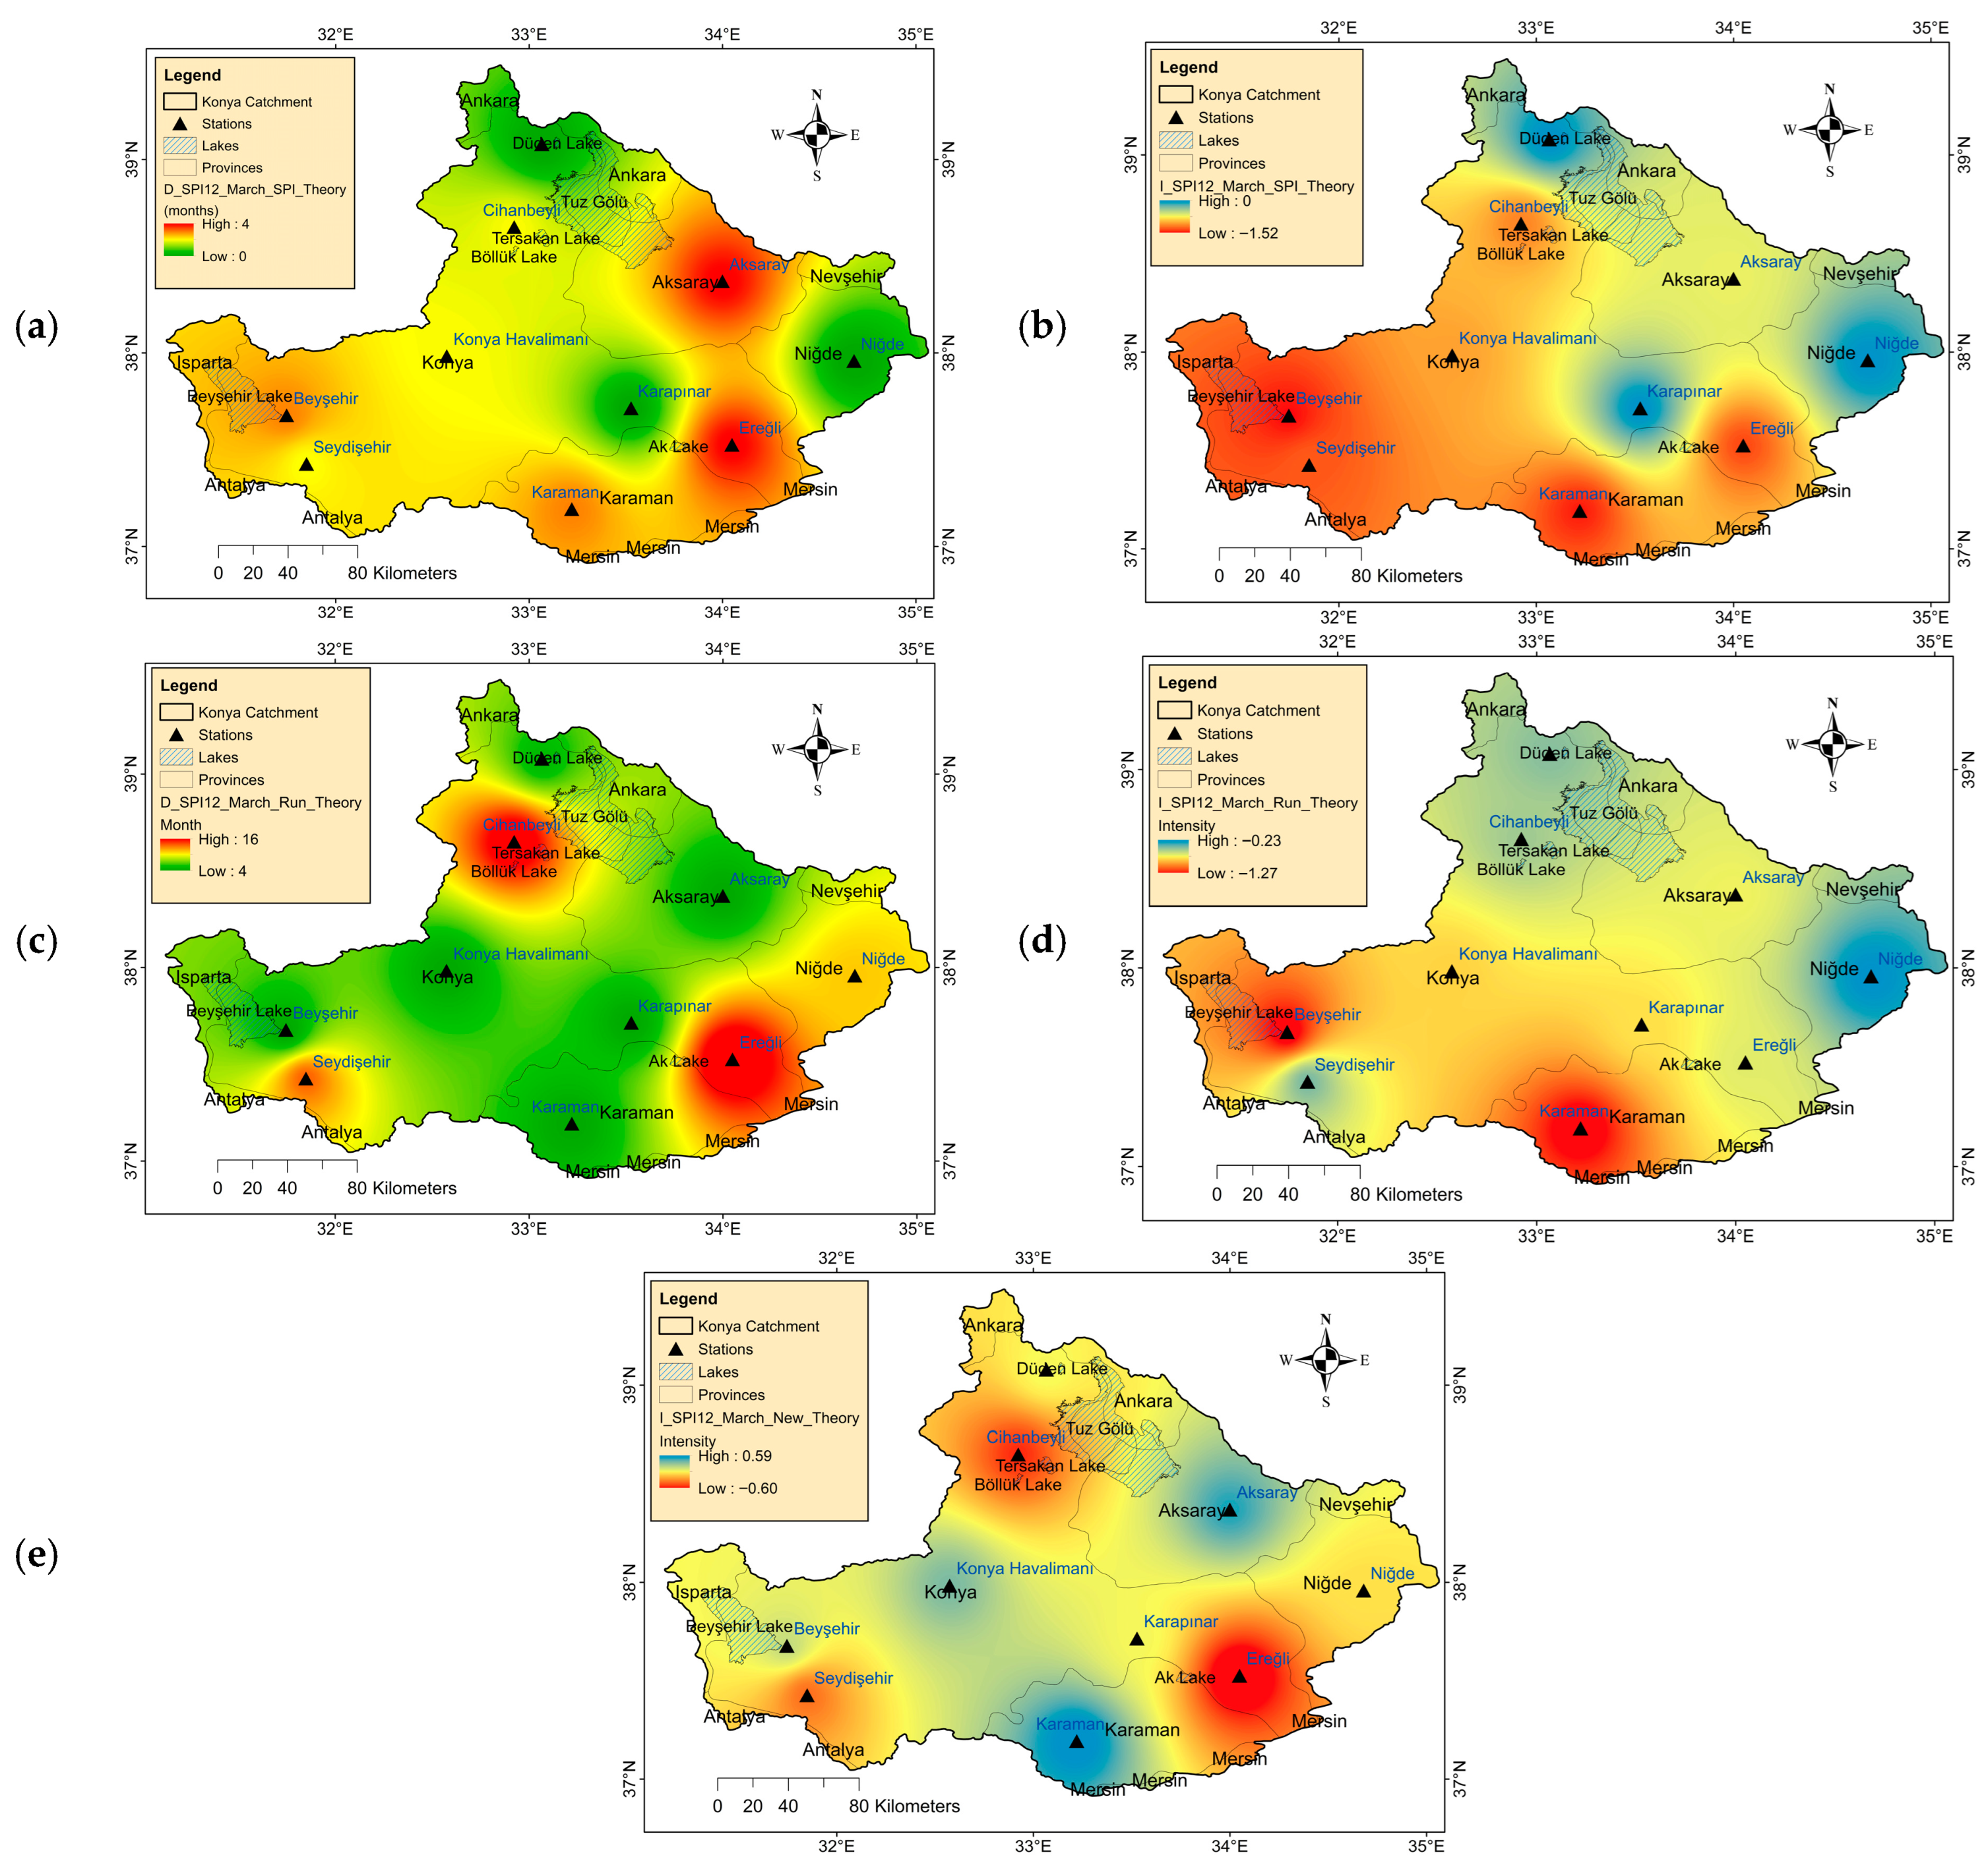
The distribution and drought characteristics are evaluated in this section, referencing the SPI and Run theory. Precipitation index assessments, which consider dry and wet conditions together within the same SP timeframe within a more holistic framework, are also included. When Table 7 and Figure 10 below are evaluated together, according to the SPI-12 results, the regions where drought was most severe in the basin in March 2021 were Beyşehir, Karaman, Ereğli, and Seydişehir stations, located in the west and south of the basin, according to SPI theory (Figure 10a,b). However, assessments made according to the Run theory show differences in drought characteristics from place to place (Figure 10c,d). Considering the drought duration, it is observed that Ereğli, located in the southeast of the basin, experienced 16 months of drought, Cihanbeyli in the north experienced 15 months, Seydişehir in the southwest experienced 12 months, and Niğde in the east experienced 10 months (Table 7). However, except for a 5-month drought period in Kulu, the dry period across most of the basin was 4 months.
On the other hand, when we evaluate the drought for the SP covering the period from November 2019 to March 2021, no drought is detected in Niğde, Kulu, and Karapınar when drought characteristics are examined according to the SPI. For example, in Cihanbeyli, the drought duration (drought severity), determined as only two months (−1.19) according to the SPI, increased to 15 months (−0.51) according to the Run theory (Table 7).
According to the P_Index indicator, which also considers wet periods, the drought duration, as per the Run theory, was under five months across most of the basin (Table 7 and Figure 10e). As of March 2021, no wet conditions were observed within the SP in Karaman, Aksaray, Beyşehir, Konya Havalimanı, Kulu, and Karapınar. While no drought can be detected at the Niğde station and its surrounding area according to the SPI theory, according to the Run theory, a ten-month drought of magnitude −0.23 was experienced. The P_Index value of −0.01 obtained for Niğde suggests that arid and wet conditions balance each other within the SP in this region. The P_Index values calculated for the Seydişehir, Cihanbeyli, and Ereğli stations, where drought is most intense and drought durations range from 12 to 16 months according to the Run theory, are also noteworthy. This indicator indicates that drought within the SP is most severe in Ereğli and its surrounding areas, followed by Cihanbeyli and Seydşehir.

5.2.3. Drought Evaluation in June

Drought events, which began to manifest significantly throughout the KEB at the end of 2020 and the beginning of 2021, intensified in some places in March 2021, gradually increasing in intensity by June 2021, and their spatial characteristics continued to change depending on the drought characteristics. Within the SP, drought began to significantly impact the basin in terms of both duration and intensity. However, in some regions, such as Aksaray, Karaman, and the Konya Havalimanı area, the presence of wetlands partially mitigated the drought. When the SPI theory, Run theory, and Precipitation Index results are evaluated together (Table 8 and Figure 11), it is understood that the drought is particularly severe in the southern and western parts of the basin, in Ereğli, Seydişehir, and their immediate surroundings, and in Cihanbeyli in the north and Niğde and their surrounding areas in the east.
According to the results of the SPI theory analysis, drought durations vary among stations, ranging from 2 to 7 months (Figure 11a). The longest droughts were observed, respectively, in Ereğli (7 months), Karaman (6 months), and at the Cihanbeyli, Konya Havalimanı, and Seydişehir stations (5 months). Except for the Aksaray station (−0.70), drought intensity ranges from −1.26 (Seydişehir) to −1.75 (Karaman). Karapınar (−1.63), Beyşehir (−1.60), and Ereğli (−1.54) stations also stand out in terms of drought intensity and conditions (Figure 11b). According to the Run theory, drought periods have significantly extended throughout the basin. In particular, drought conditions lasted 19 months in Ereğli, 18 months in Cihanbeyli, 15 months in Seydişehir, and 13 months in Niğde (Figure 11c). However, drought intensities calculated according to the Run theory remained generally lower. For example, drought intensity values reached −1.15 in Karapınar, −0.77 in Kulu, −0.42 in Niğde, −0.83 in Ereğli, −0.59 in Seydişehir, and −0.70 in Cihanbeyli (Figure 11d).
The P_Index values calculated for Ereğli, Cihanbeyli, and Seydişehir indicate that the impact of wet periods remains limited in these regions under prolonged drought conditions, and drought has become the dominant factor (Figure 11e).

5.2.4. Drought Evaluation in September

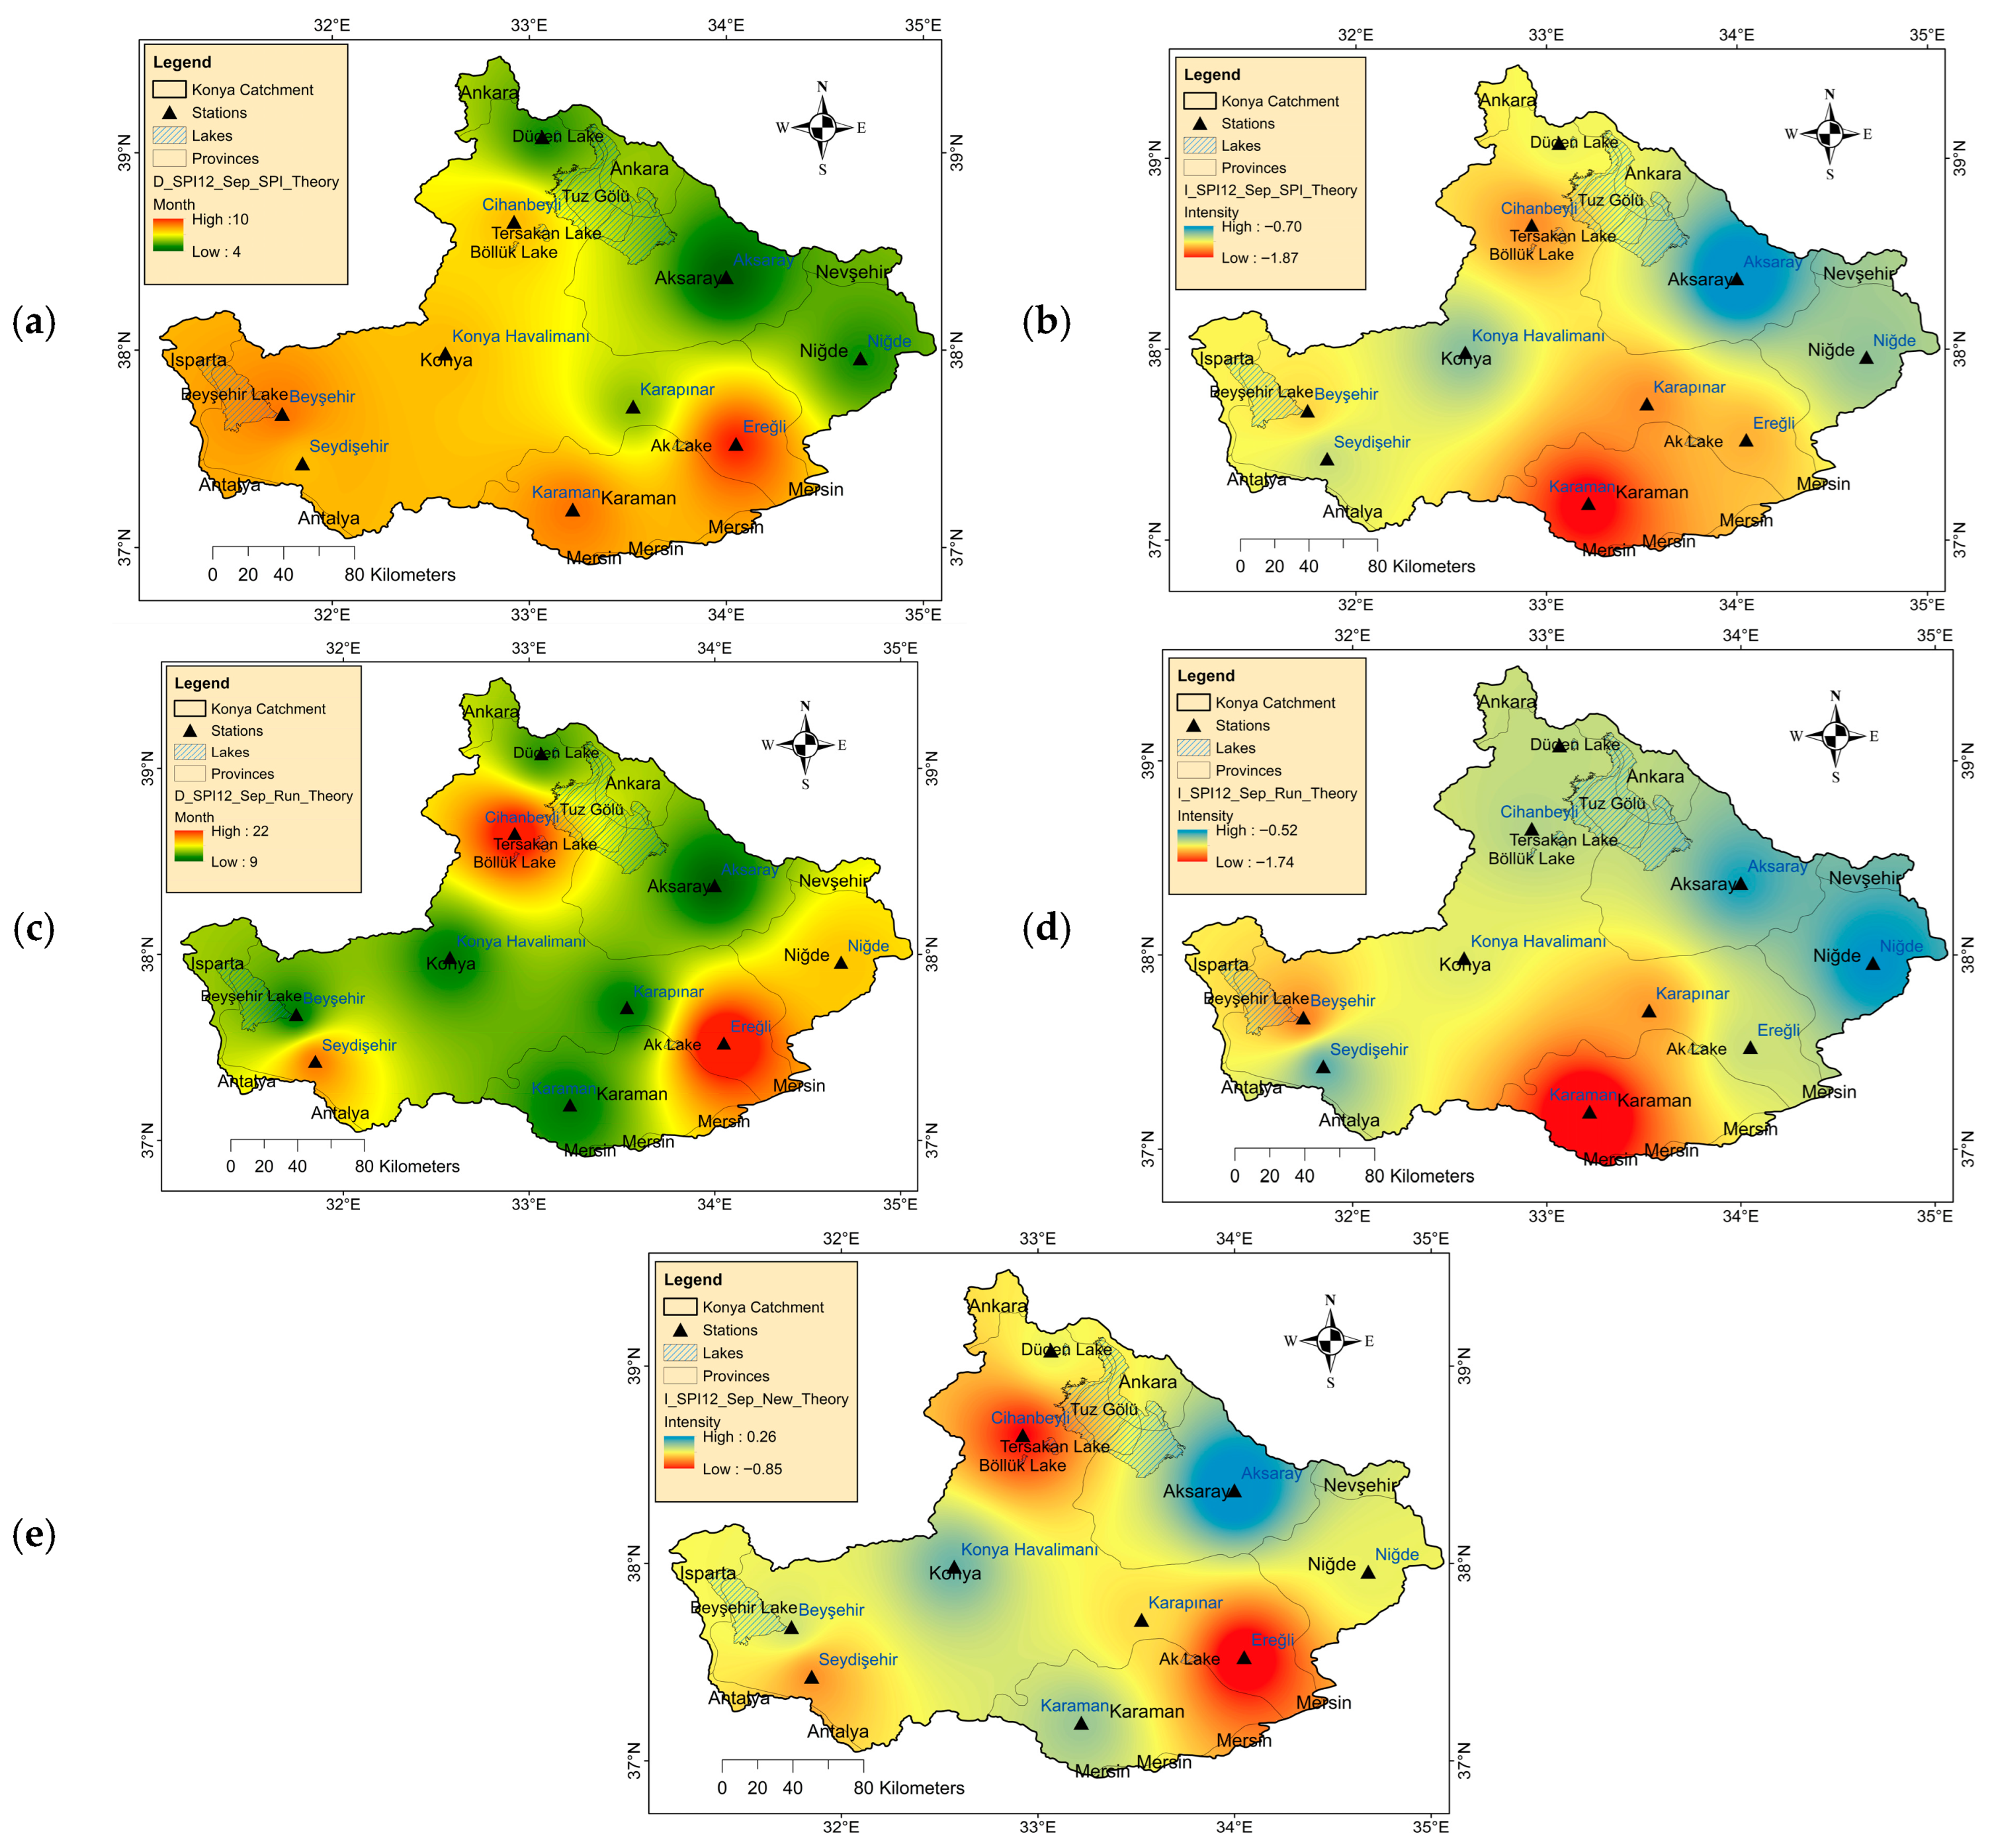
According to SPI theory, analyses indicate that drought durations varied between 4 and 10 months across stations during the approximately 23-month period that elapsed by September (Figure 12a,b and Table 9). The longest drought durations were calculated in Ereğli (10 months), Karaman and Beyşehir (9 months), and Konya Havalimanı, Cihanbeyli, and Seydişehir (8 months) (Table 9). The highest drought intensity values were observed at Karaman (−1.87), Karapınar and Cihanbeyli (−1.56), Ereğli (−1.48), and Beyşehir (−1.39), respectively, as presented in Figure 12b. In contrast, the drought was lowest in Aksaray during this period, with a drought duration of four months and a drought severity of only −0.70. According to the Run theory, drought durations have increased significantly compared to SPI. Particularly noteworthy are the drought conditions, which lasted 22 months in Ereğli, 21 months in Cihanbeyli, 18 months in Seydişehir, and 16 months in Niğde (Figure 12c).
Precipitation Index values provide a more holistic assessment of the impact of wet periods. The P_Index values calculated for September indicate that the impact of wet periods was limited, particularly at Ereğli (−0.85), Cihanbeyli (−0.75), and Seydişehir (−0.51) stations, and that drought persisted (Figure 12e). In contrast, the impact of wet conditions was relatively more pronounced at the Aksaray (0.26), Konya Havalimanı (−0.02), Karaman (−0.10), Beyşehir (−0.21), Niğde (−0.26), Kulu (−0.27), and Karapınar (−0.36) stations, clearly revealing regional differences as seen in Figure 12e. Consequently, the September assessment reveals that the drought event, which persisted into March and June, reached maturity this month, with spatial differences becoming more pronounced, and reached critical levels in the basin, particularly in Ereğli and its surrounding areas, in terms of both duration and intensity.

5.2.5. Drought Evaluation in December

The drought experienced throughout much of the basin throughout 2021 reached a significant breaking point in December. As clearly seen in the time series presented in Figure 9, the impact of drought began to decrease across the basin with the onset of winter precipitation after November 2021.
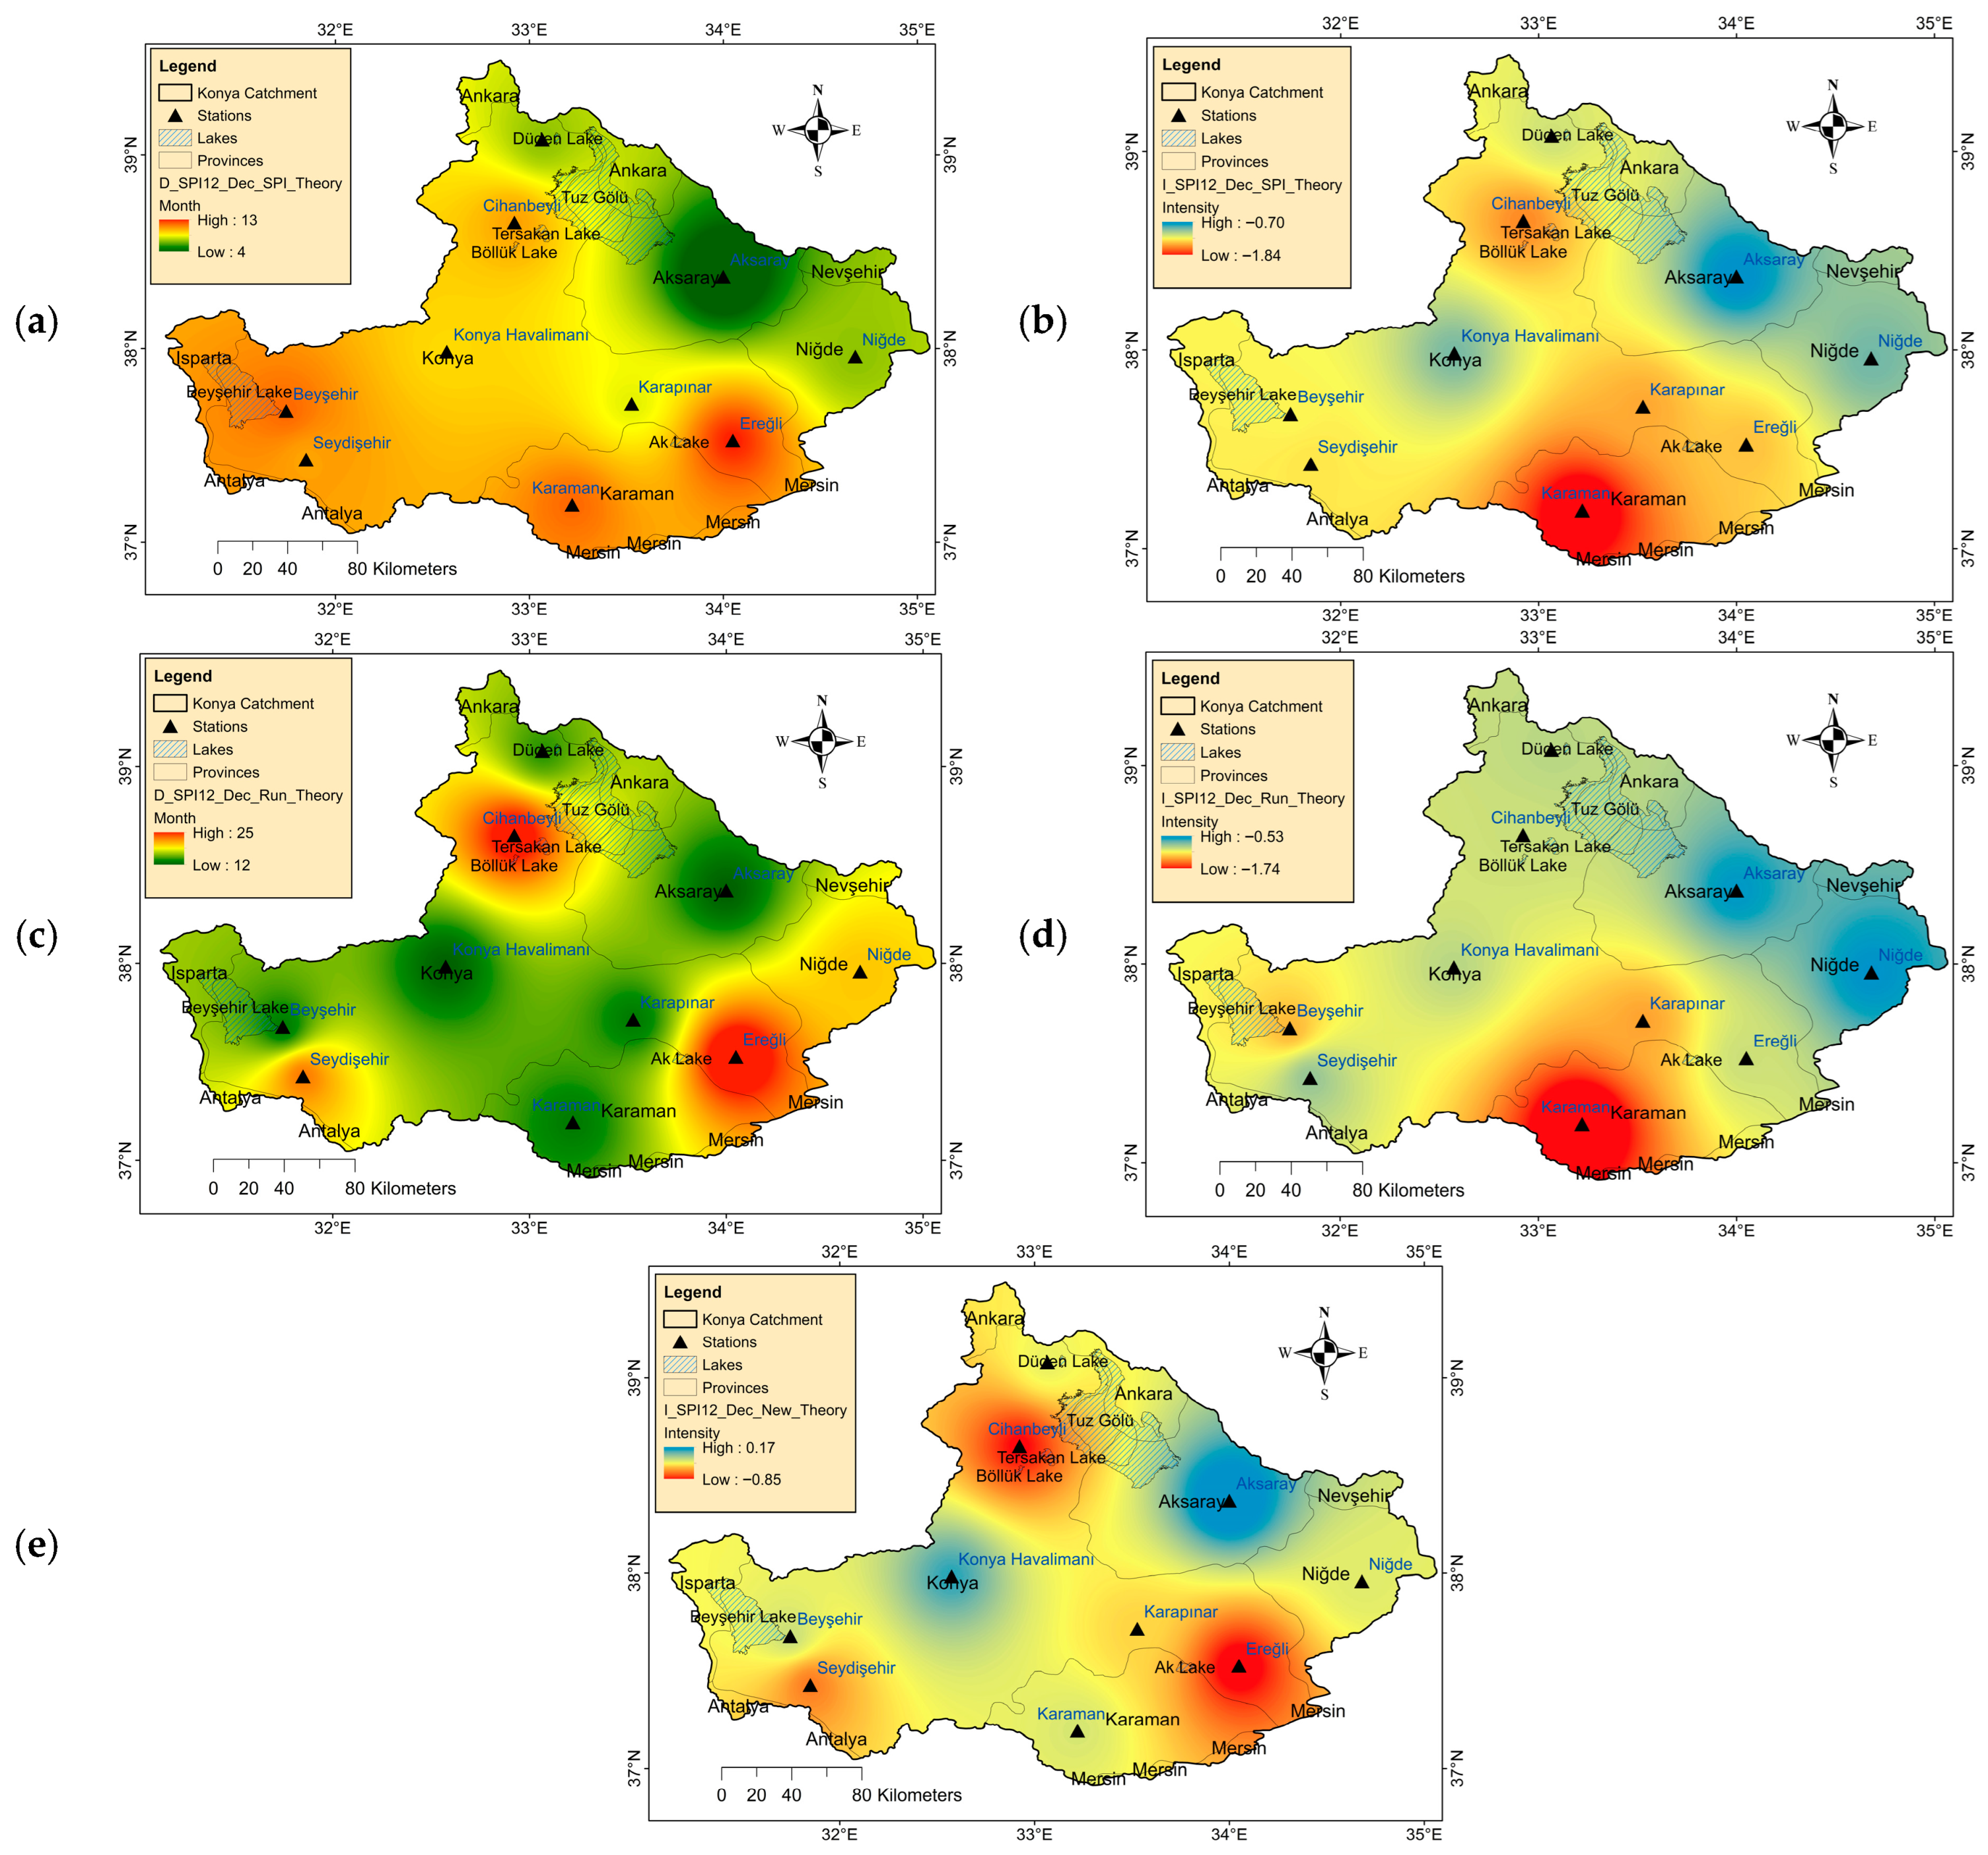
According to SPI analyses, the drought durations calculated for December in Table 10 range from 4 to 13 months. Compared to September, there was no change except at the Aksaray station, where the drought duration remained unchanged at four months. This suggests that, despite the December rainfall, the drought intensity increased, particularly in the western and southern parts of the basin, and persisted until the end of the year. Due to the severe drought conditions experienced throughout the basin in October and November, drought intensity values increased in December compared to September at all stations except Aksaray and Seydişehir.
According to the Run theory, drought durations are generally calculated to be considerably longer than those in the SPI, ranging from 12 to 25 months. Prolonged drought conditions have been identified in the basin, lasting 25 months in Ereğli, 24 months in Cihanbeyli, and 21 months in Seydişehir (Figure 13c). Compared to September, drought durations appear to have extended by three months at all stations except Konya Havalimanı. However, drought intensity values remained much lower than those in the SPI. Furthermore, compared to September, according to the Run theory, drought intensity values across the basin remain unchanged or show only minor variations, except in Beyşehir and Seydişehir (Figure 13d). These findings once again demonstrate that the Run theory reflects droughts with prolonged duration but relatively low intensity.
PI results clearly demonstrate that drought pressure remains strong at the Ereğli, Cihanbeyli, and Seydişehir stations. At all other stations, particularly Aksaray, Konya Havalimanı, Karaman, Beyşehir, Kulu, and Karapınar, drought conditions have deepened across the basin compared to September. However, an examination of P_Index values clearly demonstrates that drought conditions have begun to recover, partially due to the December rainfall, and that this has played a role in limiting the increase in drought severity across the basin in regions other than Ereğli, Cihanbeyli, and Seydişehir (Figure 13e). Overall, the December assessment indicates that prolonged drought conditions remain strongly prevalent at Ereğli, Cihanbeyli, and Seydişehir stations in the basin, while a partial recovery is observed in many regions with the onset of winter rainfall.

5.2.6. Drought Evaluation at SP

This prolonged drought, which began in winter 2019 and continued until the start of summer 2022, affected the KEB with varying intensity and duration. According to Run Theory, drought durations reached exceptionally long periods of 23–29 months at stations such as Cihanbeyli, Ereğli, Seydişehir, and Niğde (Table 11 and Figure 14c,d), while SPI Theory, Run Theory, and P_Index results revealed that Aksaray was the relatively least affected region (Table 11 and Figure 14). As seen in Figure 14e, the strong contrasts in P_Index values (e.g., −0.71 to −0.83 in Seydişehir, Ereğli, and Cihanbeyli, versus +0.14 to +0.19 in Aksaray and Konya Havalimanı) indicate significant spatial differences at certain distances within the basin. This demonstrates the critical importance of considering spatial heterogeneity and different drought indices in monitoring and management. A gradual recovery from the effects of drought was observed with the 2022 winter and spring precipitation. Still, the hydrological and ecological pressures created by these long-term drought events revealed the region’s vulnerability to drought. Spatial analyses revealed drought was more severe in the west and south of the basin and relatively milder in the east.

6. Discussion

6.1. Advantages of the Proposed Methodology

The primary advantage of the proposed methodology is its ability to redefine how drought is studied and analyzed from a dynamic, multidimensional perspective. By dividing the selected period into different segments, it becomes possible to track drought development cumulatively and sequentially, providing a clearer understanding of how the event evolved from its beginning to its peak and end. Adopting the SP concept also gives the researcher and policymakers extensive flexibility in choosing the most appropriate time period according to the nature and objectives of the study. Furthermore, this methodology represents a qualitative shift from station-based analysis to regional integrated analysis, reflecting a more realistic picture of drought conditions than traditional approaches that provide fragmented analysis.
The introduction of new indicators, such as precipitation intensity and severity, represents added value, enabling a more accurate characterization of the relationship between precipitation and drought characteristics, which are not typically available in conventional models. As a result, the new methodology supports decision-making by providing rich information on the spatial and temporal variability of drought, which positively impacts adaptation and planning strategies.

6.2. Comparison Between Traditional and Newly Proposed Methodology

Compared to traditional methods, the proposed methodology clearly represents a fundamental shift in how drought data are processed. Traditional methods typically focus on characterizing drought characteristics statically at a specific time and use only the average values over the study period, whereas the proposed methodology dynamically recalculates these characteristics over progressively shorter timescales, providing a more comprehensive view of changes. Traditional methods also tend to use station-by-station data, while the new methodology prioritizes integrated regional analysis, providing more comprehensive and representative results of the climatic and hydrological situation.
Furthermore, traditional methods often rely on limited indices and characteristics, such as the SPI, whereas the new methodology introduces additional dimensions by incorporating new indices that capture the evolution of precipitation and drought over time. Therefore, the proposed methodology can be considered a shift from static, partial analysis to dynamic, integrated analysis, making it more compatible with the requirements of modern studies related to climate change and water resources management.

6.3. Practical Implications

The innovative drought maps provide a valuable tool for stakeholders to enhance their preparedness for drought. These maps enable water managers to track changes in drought conditions over specific periods, allowing them to improve water resource management and prioritize distribution and use, particularly during critical periods. These maps enable farmers to understand the cumulative drought situation in their areas, helping them adjust their irrigation and agricultural practices, as well as planting timing, based on predicted drought indicators. These maps also contribute to enhancing communication about drought risks through a clear and easy-to-understand visual presentation of climate conditions, supporting collective decision-making and improving local communities’ response to climate crises.

6.4. Recommendations for Future Research

Although the proposed methodology is effective in developing innovative drought maps, considering both dry and wet periods, expanding our understanding of the drought characteristics, and providing an accurate cumulative and evolutionary view of drought conditions over desirable specific time periods, several aspects could be developed in future research to enhance the accuracy and effectiveness of this approach.
First, it is recommended that the application be expanded to include different drought indices to verify the flexibility and generalizability of the methodology across different drought indices. Second, it would be beneficial to develop automated computational tools or models that contribute to map production and analysis, with the potential to use artificial intelligence or machine learning techniques to analyze complex patterns and predict future droughts. This point aligns with previous studies in the literature, such as those by Taylan [20], Lahnik et al. [62], Radaelli et al. [63], and Ghazi et al. [64]. Third, socioeconomic dimensions could be incorporated into the analysis, helping to link drought impacts to vital sectors such as agriculture [65,66,67] and water management [68,69,70,71], thereby enhancing the maps’ practical value in decision-making.

7. Conclusions

Considering the importance of spatial drought analysis and the increasing effects of drought, there is a need to improve and propose new methods to enhance our understanding of drought. In this research, utilizing the newly proposed concepts of PI and SP, drought and its characteristics, including the duration, severity, and intensity, can be analyzed and monitored in a more effective and innovative, holistic framework. It is worth noting that SPI and Run theories were employed in defining drought events. Instead of taking the average value of each drought characteristic, the evolution of drought at each month can be monitored. As a result of this research, the innovative map contributes to all drought-related sectors, including water management and agriculture.

Author Contributions

Conceptualization, A.A.A. and E.Ş.; methodology, A.A.A. and E.Ş.; validation, M.E.B., Ş.A.G. and E.Ş.; formal analysis, A.A.A. and E.Ş.; investigation, A.A.A. and E.Ş.; resources, M.E.B., Ş.A.G., and E.Ş.; data curation, A.A.A. and E.Ş.; writing—original draft preparation, A.A.A. and E.Ş.; writing—review and editing, M.E.B., Ş.A.G. and E.Ş.; visualization, A.A.A. and E.Ş.; supervision, E.Ş.; project administration, E.Ş.; funding acquisition, E.Ş. All authors have read and agreed to the published version of the manuscript.

Funding

This research was funded by the Scientific Research Projects (BAP) Coordination Unit of Yildiz Technical University (Project ID: 6483, Project code: FBA-2024-6483).

Institutional Review Board Statement

Not applicable.

Informed Consent Statement

Not applicable.

Data Availability Statement

All data that support this study’s findings are available from the corresponding author upon reasonable request.

Acknowledgments

We would like to thank the Scientific Research Projects (BAP) Coordination Unit of Yildiz Technical University (Project ID: 6483, Project code: FBA-2024-6483) for the support of the project. We would also like to thank the experts for sharing their wisdom with us during this research.

Conflicts of Interest

The authors declare no conflicts of interest.

References

  1. Dabanli, I.; Şişman, E.; Güçlü, Y.S.; Birpınar, M.E.; Şen, Z. Climate change impacts on sea surface temperature (SST) trend around Turkey seashores. Acta Geophys. 2021, 69, 295–305. [Google Scholar] [CrossRef]
  2. Tiwari, A.K.; Kumar, A.; Singh, A.K.; Singh, T.N.; Suozzi, E.; Matta, G.; Russo, S.L. (Eds.) Water Scarcity, Contamination and Management; Elsevier: Amsterdam, The Netherlands, 2022. [Google Scholar]
  3. Oyounalsoud, M.S.; Abdallah, M.; Yilmaz, A.G.; Siddique, M.; Atabay, S. A new meteorological drought index based on fuzzy logic: Development and comparative assessment with conventional drought indices. J. Hydrol. 2023, 619, 129306. [Google Scholar] [CrossRef]
  4. IPCC. Summary for policymakers. In Climate Change 2023: Synthesis Report. Contribution of Working Groups I, II and III to the Sixth Assessment Report of the Intergovernmental Panel on Climate Change; Core Writing Team, Lee, H., Romero, J., Eds.; IPCC: Geneva, Switzerland, 2023; pp. 1–34. [Google Scholar] [CrossRef]
  5. Abu Arra, A.; Alashan, S.; Şişman, E. A new framework for innovative trend analysis: Integrating extreme precipitation indices, standardization, enhanced visualization, and novel classification approaches (ITA-NF). Nat. Hazards 2025, 121, 13543–13575. [Google Scholar] [CrossRef]
  6. Şen, Z. Water structures and climate change impact: A review. Water Resour. Manag. 2020, 34, 4197–4216. [Google Scholar] [CrossRef]
  7. Şen, Z.; Şişman, E.; Dabanli, I. Wet and dry spell feature charts for practical uses. Nat. Hazards 2020, 104, 1975–1986. [Google Scholar] [CrossRef]
  8. Arra, A.A.; Alashan, S.; Şişman, E. Trends of meteorological and hydrological droughts and associated parameters using innovative approaches. J. Hydrol. 2024, 640, 131661. [Google Scholar] [CrossRef]
  9. Shahpari, G.; Sadeghi, H.; Ashena, M.; García-León, D. Drought effects on the Iranian economy: A computable general equilibrium approach. Environ. Dev. Sustain. 2022, 24, 4110–4127. [Google Scholar] [CrossRef]
  10. Chengot, R.; Knox, J.W.; Holman, I.P. Evaluating the feasibility of water sharing as a drought risk management tool for irrigated agriculture. Sustainability 2021, 13, 1456. [Google Scholar] [CrossRef]
  11. Hussain, A.; Jadoon, K.Z.; Rahman, K.U.; Shang, S.; Shahid, M.; Ejaz, N.; Khan, H. Analyzing the impact of drought on agriculture: Evidence from Pakistan using standardized precipitation evapotranspiration index. Nat. Hazards 2023, 115, 389–408. [Google Scholar] [CrossRef]
  12. Sadhwani, K.; Eldho, T.I. Assessing the Effect of Future Climate Change on Drought Characteristics and Propagation from Meteorological to Hydrological Droughts—A Comparison of Three Indices. Water Resour. Manag. 2024, 38, 441–462. [Google Scholar] [CrossRef]
  13. Afan, H.A.; Almawla, A.S.; Al-Hadeethi, B.; Khaleel, F.; AbdUlameer, A.H.; Khan, M.M.H.; Ma’arof, M.I.N.; Kamel, A.H. LSTM model integrated remote sensing data for drought prediction: A study on climate change impacts on water availability in the arid region. Water 2024, 16, 2799. [Google Scholar] [CrossRef]
  14. Hussain, M.A.; Shuai, Z.; Moawwez, M.A.; Umar, T.; Iqbal, M.R.; Kamran, M.; Muneer, M. A Review of Spatial Variations of Multiple Natural Hazards and Risk Management Strategies in Pakistan. Water 2023, 15, 407. [Google Scholar] [CrossRef]
  15. Kesgin, E.; Yaldız, S.G.; Güçlü, Y.S. Spatiotemporal variability and trends of droughts in the Mediterranean coastal region of Türkiye. Int. J. Climatol. 2024, 44, 1036–1057. [Google Scholar] [CrossRef]
  16. Ghazi, B.; Salehi, H.; Przybylak, R.; Pospieszyńska, A. Assessment of drought conditions under climate change scenarios in Central Europe (Poland) using the standardized precipitation index (SPI). Clim. Serv. 2025, 39, 100591. [Google Scholar] [CrossRef]
  17. Nikraftar, Z.; Mostafaie, A.; Sadegh, M.; Afkueieh, J.H.; Pradhan, B. Multi-type assessment of global droughts and teleconnections. Weather. Clim. Extrem. 2021, 34, 100402. [Google Scholar] [CrossRef]
  18. Korkmaz, M.; Kuriqi, A. Regional climate change and drought dynamics in Tunceli, Turkey: Insights from drought indices. Water Conserv. Sci. Eng. 2024, 9, 49. [Google Scholar] [CrossRef]
  19. Mishra, A.K.; Singh, V.P. A review of drought concepts. J. Hydrol. 2010, 391, 202–216. [Google Scholar] [CrossRef]
  20. Taylan, E.D. An approach for future droughts in Northwest Türkiye: SPI and LSTM methods. Sustainability 2024, 16, 6905. [Google Scholar] [CrossRef]
  21. Abu Arra, A.; Alashan, S.; Şişman, E. Advancing innovative trend analysis for drought trends: Incorporating drought classification frequencies for comprehensive insights. Nat. Hazards 2025, 121, 9195–9219. [Google Scholar] [CrossRef]
  22. Taylan, E.D. Enhanced hydrological drought prediction in the Gediz Basin: Integrating meteorological drought via hybrid wavelet-machine learning-random oversampling models using. J. Water Clim. Change 2024, 15, 4790–4816. [Google Scholar] [CrossRef]
  23. Wilhite, D.A. Drought as a Natural Hazard: Concepts and Definitions. In Drought: A Global Assessment; Routledge: London, UK, 2000; pp. 3–18. [Google Scholar]
  24. McKee, T.B.; Doesken, N.J.; Kleist, J. The relationship of drought frequency and duration to time scales. In Proceedings of the 8th Conference on Applied Climatology, Anaheim, CA, USA, 17–22 January 1993; Volume 17, pp. 179–183. [Google Scholar]
  25. Şen, Z.; Almazroui, M. Actual precipitation index (API) for drought classification. Earth Syst. Environ. 2021, 5, 59–70. [Google Scholar] [CrossRef]
  26. Vicente-Serrano, S.M.; Beguería, S.; López-Moreno, J.I. A multiscalar drought index sensitive to global warming: The standardized precipitation evapotranspiration index. J. Clim. 2010, 23, 1696–1718. [Google Scholar] [CrossRef]
  27. WMO. World Meteorological Organization (2012) Standardized Precipitation Index User Guide; Svoboda, M., Hayes, M., Wood, D., Eds.; WMO: Geneva, Switzerland, 2012. [Google Scholar]
  28. Bruno, G.; Avanzi, F.; Alfieri, L.; Libertino, A.; Gabellani, S.; Duethmann, D. Hydrological model skills change with drought severity; insights from multi-variable evaluation. J. Hydrol. 2024, 634, 131023. [Google Scholar] [CrossRef]
  29. Abu Arra, A.; Şişman, E. Innovative drought classification matrix and acceptable time period for temporal drought evaluation. Water Resour. Manag. 2024, 38, 2811–2833. [Google Scholar] [CrossRef]
  30. Abu Arra, A.; Şişman, E. Characteristics of hydrological and meteorological drought based on intensity-duration-frequency (IDF) curves. Water 2023, 15, 3142. [Google Scholar] [CrossRef]
  31. Abu Arra, A.; Birpınar, M.E.; Gazioğlu, Ş.A.; Şişman, E. Critical drought characteristics: A new concept based on dynamic time period scenarios. Atmosphere 2024, 15, 768. [Google Scholar] [CrossRef]
  32. Philip, G.M.; Watson, D.F. A Precise Method for Determining Contoured Surfaces. Aust. Pet. Explor. Assoc. J. 1982, 22, 205–212. [Google Scholar] [CrossRef]
  33. Watson, D.F.; Philip, G.M. A Refinement of Inverse Distance Weighted Interpolation. Geoprocessing 1985, 2, 315–327. [Google Scholar]
  34. Abu Arra, A.; Şişman, E. A comprehensive analysis and comparison of SPI and SPEI for spatiotemporal drought evaluation. Environ. Monit. Assess. 2024, 196, 980. [Google Scholar] [CrossRef]
  35. Lu, J.; Jia, L.; Menenti, M.; Zheng, C.; Hu, G.; Ji, D. The impacts of drought on water availability: Spatial and temporal analysis in the Belt and Road region (2001–2020). Int. J. Digit. Earth 2025, 18, 2449706. [Google Scholar] [CrossRef]
  36. Shaw, B.; Chithra, N.R. Copula-based multivariate analysis of hydro-meteorological drought. Theor. Appl. Climatol. 2023, 153, 475–493. [Google Scholar] [CrossRef]
  37. Pontes Filho, J.D.; Souza Filho, F.D.A.; Martins, E.S.P.R.; Studart, T.M.D.C. Copula-based multivariate frequency analysis of the 2012–2018 drought in Northeast Brazil. Water 2020, 12, 834. [Google Scholar] [CrossRef]
  38. Ballarin, A.S.; Barros, G.L.; Cabrera, M.C.; Wendland, E.C. A copula-based drought assessment framework considering global simulation models. J. Hydrol. Reg. Stud. 2021, 38, 100970. [Google Scholar] [CrossRef]
  39. Sundararajan, K.; Garg, L.; Srinivasan, K.; Bashir, A.K.; Kaliappan, J.; Ganapathy, G.P.; Selvaraj, S.K.; Meena, T. A contemporary review on drought modeling using machine learning approaches. Comput. Model. Eng. Sci. 2021, 128, 447–487. [Google Scholar] [CrossRef]
  40. Prodhan, F.A.; Zhang, J.; Hasan, S.S.; Sharma, T.P.P.; Mohana, H.P. A review of machine learning methods for drought hazard monitoring and forecasting: Current research trends, challenges, and future research directions. Environ. Model. Softw. 2022, 149, 105327. [Google Scholar] [CrossRef]
  41. Song, X.; Chen, H.; Chen, T.; Huang, Q.; Deng, S.; Yang, N. Spatial and temporal variations of spring drought in Southwest China and its possible teleconnection with the global climate events. J. Hydrol. Reg. Stud. 2024, 51, 101655. [Google Scholar] [CrossRef]
  42. Erkol, Z.I.; Yesilyurt, S.N.; Dalkilic, H.Y. Impacts of climate change on spatial drought distribution in the Mediterranean Basin (Turkey): Different climate models and downscaling methods. Theor. Appl. Climatol. 2024, 155, 4065–4087. [Google Scholar] [CrossRef]
  43. Wei, W.; Yan, P.; Zhou, L.; Zhang, H.; Xie, B.; Zhou, J. A comprehensive drought index based on spatial principal component analysis and its application in northern China. Environ. Monit. Assess. 2024, 196, 193. [Google Scholar] [CrossRef]
  44. Li, Y.; Wang, X.; Wang, F.; Feng, K.; Li, H.; Han, Y.; Chen, S. Temporal and Spatial Characteristics of Agricultural Drought Based on the TVDI in Henan Province, China. Water 2024, 16, 1010. [Google Scholar] [CrossRef]
  45. Wang, R.; Zhang, X.; Guo, E.; Cong, L.; Wang, Y. Characteristics of the Spatial and Temporal Distribution of Drought in Northeast China, 1961–2020. Water 2024, 16, 234. [Google Scholar] [CrossRef]
  46. Zhang, B.; Chen, Y.; Chen, X.; Gao, L.; Liu, M. Spatial-Temporal Variations of Drought-Flood Abrupt Alternation Events in Southeast China. Water 2024, 16, 498. [Google Scholar] [CrossRef]
  47. Mateus, N.P.; Marengo, J.A.; Cunha, A.P.; Diogo, A.M.; António, J.F. Spatial–temporal characterization of droughts in Angola. Int. J. Climatol. 2024, 44, 370–392. [Google Scholar] [CrossRef]
  48. Dogan, S.; Berktay, A.; Singh, V.P. Comparison of multi-monthly rainfall-based drought severity indices, with application to semi-arid Konya closed basin, Turkey. J. Hydrol. 2012, 470, 255–268. [Google Scholar] [CrossRef]
  49. Yilmaz, M. Drought analysis of Konya closed basin with the use of tmpa satellite-based precipitation data. J. Fac. Eng. Archit. Gazi Univ. 2017, 32, 541–549. [Google Scholar]
  50. Koycegız, C.; Buyukyıldız, M. Determination of change point and trend analysis of annual temperature data in Konya Closed Basin (Turkey). Niğde Ömer Halisdemir Üniversitesi Mühendislik Bilim. Derg. 2020, 9, 393–404. [Google Scholar]
  51. Koycegiz, C.; Buyukyildiz, M. Applications of innovative polygon trend analysis (IPTA) and trend polygon star concept (TPSC) methods for the variability of precipitation in Konya Closed Basin (Turkey). Theor. Appl. Climatol. 2024, 155, 2641–2656. [Google Scholar] [CrossRef]
  52. Stephens, M.A. Use of the Kolmogorov–Smirnov, Cramer–Von Mises and related statistics without extensive tables. J. R. Stat. Soc. Ser. B: Stat. Methodol. 1970, 32, 115–122. [Google Scholar] [CrossRef]
  53. Şen, Z.; Şişman, E. Probabilistic standardization index adjustment for standardized precipitation index (SPI). Theor. Appl. Climatol. 2024, 155, 2747–2756. [Google Scholar] [CrossRef]
  54. Yevjevich, V.M. Objective Approach to Definitions and Investigations of Continental Hydrologic Droughts. Ph.D. Thesis, Colorado State University, Fort Collins, CO, USA, 1967. [Google Scholar]
  55. Ochieng, P.; Nyandega, I.; Wambua, B. Spatial-temporal analysis of historical and projected drought events ovesr Isiolo County, Kenya. Theor. Appl. Climatol. 2022, 148, 531–550. [Google Scholar] [CrossRef]
  56. Mohammadi, G.M.; Sharafi, S.; Hosseini-Moghari, S.M.; Helali, J.; Asadi Oskouei, E. Temporal evolution and spatial variation of meteorological drought characteristics in Iran’s diverse climates over the past half century. Theor. Appl. Climatol. 2024, 155, 5151–5168. [Google Scholar] [CrossRef]
  57. Choudhary, V.; Punia, M.; Bhattacharyya, S. Assessing the spatial characteristics of drought hazard in the state of Rajasthan. Nat. Hazards 2025, 121, 1325–1352. [Google Scholar] [CrossRef]
  58. Ankrah, J. Spatial and temporal characteristics of meteorological drought and wetness incidences: A comparative analysis in Ghana, West Africa, and mainland Portugal, Southwestern Europe. Nat. Hazards 2025, 121, 14321–14353. [Google Scholar] [CrossRef]
  59. Xu, J.; Li, X.; Xue, J.; Dou, X.; Wu, W.; Wu, G.; Zhao, Q. Spatial-temporal characteristics of meteorological drought and its relationship with circulation indices over Songhua River Basin, China. J. Water Clim. Change 2024, 15, 2792–2808. [Google Scholar] [CrossRef]
  60. Kheyruri, Y.; Nikaein, E.; Sharafati, A. Spatial monitoring of meteorological drought characteristics based on the NASA Power precipitation product over various regions of Iran. Environ. Sci. Pollut. Res. 2023, 30, 43619–43640. [Google Scholar] [CrossRef]
  61. Abu Arra, A.; Şişman, E.; Birpınar, M.E. What is the best spatial interpolation technique for evaluating droughts? Intercont. Geoinf. Days 2023, 6, 278–281. [Google Scholar]
  62. Lahnik, O.; Tramblay, Y.; Hanich, L.; Andersson, J.C.; Lguensat, R.; Isberg, K.; Ben Ahmed, A.; Dahn, J.; Sultan, B. Future water resources and droughts in the Atlas Mountains of Morocco under a high-emission climate scenario. J. Hydrol. Reg. Stud. 2025, 59, 102371. [Google Scholar] [CrossRef]
  63. Redaelli, A.; Bonomi, T.; Sartirana, D.; Sinatra, G.; Rotiroti, M.; Zanotti, C. The dual role of irrigation in the groundwater budget under baseline conditions versus the 2022 drought: Lessons for future climate adaptation. J. Hydrol. 2025, 658, 133211. [Google Scholar] [CrossRef]
  64. Ghazi, B.; Dutt, S.; Torabi Haghighi, A. Projection of future meteorological droughts in Lake Urmia Basin, Iran. Water 2023, 15, 1558. [Google Scholar] [CrossRef]
  65. Tefera, M.L.; Seddaiu, G.; Carletti, A.; Awada, H. Rainfall variability and drought in West Africa: Challenges and implications for rainfed agriculture. Theor. Appl. Climatol. 2025, 156, 41. [Google Scholar] [CrossRef]
  66. Ali, T.; Rehman, S.U.; Ali, S.; Mahmood, K.; Obregon, S.A.; Iglesias, R.C.; Khurshaid, T.; Ashraf, I. Smart agriculture: Utilizing machine learning and deep learning for drought stress identification in crops. Sci. Rep. 2024, 14, 30062. [Google Scholar] [CrossRef]
  67. Al-Kilani, M.R.; Al-Bakri, J.; Rahbeh, M.; Abdelal, Q.; Yalew, S.; Mul, M. Assessment of meteorological drought impacts on rainfed agriculture using remote sensing–derived biomass productivity. Environ. Monit. Assess. 2024, 196, 879. [Google Scholar] [CrossRef]
  68. Aktürk, G.; Çıtakoğlu, H.; Demir, V.; Beden, N. Meteorological drought analysis and regional frequency analysis in the Kızılırmak Basin: Creating a framework for sustainable water resources management. Water 2024, 16, 2124. [Google Scholar] [CrossRef]
  69. Thanh, P.N.; Le Van, T.; Minh, T.T.; Ngoc, T.H.; Lohpaisankrit, W.; Pham, Q.B.; Gagnon, A.S.; Deb, P.; Pham, N.T.; Anh, D.T.; et al. Adapting to climate-change-induced drought stress to improve water management in Southeast Vietnam. Sustainability 2023, 15, 9021. [Google Scholar] [CrossRef]
  70. Abu Arra, A.; Şişman, E. New insights into meteorological and hydrological drought modeling: A comparative analysis of parametric and Non-Parametric distributions. Atmosphere 2025, 16, 846. [Google Scholar] [CrossRef]
  71. Ercan, C.; Arra, A.A.; Şişman, E. Investigation of precipitation and temperature trends using classical and innovative approaches with corresponding frequencies in Antalya Basin, Türkiye. Phys. Chem. Earth Parts A/B/C 2025, 139, 103958. [Google Scholar] [CrossRef]
Figure 1. Location map of KEB and observational station, and Digital Elevation Model (DEM) over the KEB (General Directorate of Meteorology).
Sustainability 17 10264 g001
Figure 2. Drought duration based on SPI theory (D_SPI, blue line) and Run theory (D_Run, red line) [30].
Sustainability 17 10264 g002
Figure 3. Methodological flowchart.
Sustainability 17 10264 g003
Figure 4. Time series of SPI-6 values for all meteorological stations in the KEB for a specific drought event.
Sustainability 17 10264 g004
Figure 5. Spatial drought evaluation of SPI-6 for specific drought event (#1) in March: (a) D based on SPI theory, (b) I based on SPI theory, (c) D based on Run theory, (d) I based on Run theory, and (e) PI.
Sustainability 17 10264 g005
Figure 6. Spatial drought evaluation of SPI-6 for specific drought event (#1) in June: (a) D based on SPI theory, (b) I based on SPI theory, (c) D based on Run theory, (d) I based on Run theory, and (e) PI.
Sustainability 17 10264 g006
Figure 7. Spatial drought evaluation of SPI-6 for specific drought event (#1) in September: (a) D based on SPI theory, (b) I based on SPI theory, (c) D based on Run theory, (d) I based on Run theory, and (e) PI.
Sustainability 17 10264 g007
Figure 8. Spatial drought evaluation of SPI-6 for specific drought event (#1) in December: (a) D based on SPI theory, (b) I based on SPI theory, (c) D based on Run theory, (d) I based on Run theory, and (e) PI.
Sustainability 17 10264 g008
Figure 9. Time series of SPI-12 values for all meteorological stations located within the KEB for a specific drought event.
Sustainability 17 10264 g009
Figure 10. Spatial drought evaluation of SPI-12 for specific drought event (#2) in March: (a) D based on SPI theory, (b) I based on SPI theory, (c) D based on Run theory, (d) I based on Run theory, and (e) PI.
Sustainability 17 10264 g010
Figure 11. Spatial drought evaluation of SPI-12 for specific drought event (#2) in June: (a) D based on SPI theory, (b) I based on SPI theory, (c) D based on Run theory, (d) I based on Run theory, and (e) PI.
Sustainability 17 10264 g011
Figure 12. Spatial drought evaluation of SPI-12 for specific drought event (#2) in September: (a) D based on SPI theory, (b) I based on SPI theory, (c) D based on Run theory, (d) I based on Run theory, and (e) PI.
Sustainability 17 10264 g012
Figure 13. Spatial drought evaluation of SPI-12 for specific drought event (#2) in December: (a) D based on SPI theory, (b) I based on SPI theory, (c) D based on Run theory, (d) I based on Run theory, and (e) PI.
Sustainability 17 10264 g013
Figure 14. Spatial drought evaluation of SPI-12 for specific drought event (#2) in the last month in the SP: (a) D based on SPI theory, (b) I based on SPI theory, (c) D based on Run theory, (d) I based on Run theory, and (e) PI.
Sustainability 17 10264 g014
Table 1. Statistical information about the meteorological stations and precipitation series in the KEB, Türkiye.
#Station CodeStation NameLat. (N°)Long. (E°)Annual Average
Total Precipitation (mm)
Standard
Deviation (mm)
Max Monthly
Precipitation (mm)
117191Cihanbeyli38.6532.92323.5823.03153.7
217192Aksaray38.3733.99345.6623.76119.0
317242Beyşehir37.6731.74491.6137.24231.2
417244Konya Havalimanı37.9832.5328.1323.57124.0
517246Karaman37.1933.22332.0124.48144.1
617248Ereğli37.5234.04304.7421.40119.5
717250Niğde37.9534.67333.6422.81118.0
817754Kulu39.0733.06392.5825.99143.4
917898Seydişehir37.4231.84734.5762.74487.4
1017902Karapınar37.7133.52289.9420.46109.2
Table 2. Drought classifications based on SPI theory [24].
Drought Index_DI (SPI)Drought ClassificationProbability (%)
2.0   DIExtreme wet (EW)2.3%
1.5     DI   < 2.0Severe wet (SW)4.4%
1.0     DI   < 1.5Moderate wet (MW)9.2%
1.0     DI   < 1.0Normal (N)68.2%
1.5     DI   <   −1.0Moderate drought (MD)9.2%
2.0     DI   < −1.5Severe drought (SD)4.4%
2.0   > DIExtreme drought (ED)2.3%
Table 3. Drought characteristics, including D and I, based on SPI theory and the Run theory, along with the proposed PI, for meteorological stations within the KEB for SPI-6 in March.
Station CodeStation NameD (SPI)I (SPI)D (Run)I (Run)P_Index
17246Karaman7−1.337−1.33−1.33
17191Cihanbeyli5−1.847−1.47−1.47
17192Aksaray3−0.934−0.76−0.24
17242Beyşehir6−1.346−1.34−1.13
17244Konya Havalimani6−1.577−1.46−1.46
17898Seydişehir6−1.146−1.14−0.89
17248Ereğli6−1.716−1.71−1.46
17250Niğde5−0.976−0.91−0.73
17754Kulu6−1.127−1.03−1.03
17902Karapinar5−1.416−1.32−1.13
Table 4. Drought characteristics, including D and I, based on SPI theory and the Run theory, along with the proposed PI, for meteorological stations within the KEB for SPI-6 in June.
Station CodeStation NameD (SPI)I (SPI)D (Run)I (Run)P_Index
17246Karaman10−1.0110−1.01−1.01
17191Cihanbeyli8−1.2310−1.09−1.09
17192Aksaray3−0.934−0.760.06
17242Beyşehir6−1.347−1.16−0.74
17244Konya Havalimani6−1.578−1.31−1.03
17898Seydişehir6−1.146−1.14−0.50
17248Ereğli6−1.717−1.48−0.97
17250Niğde5−0.977−0.80−0.42
17754Kulu6−1.128−0.91−0.70
17902Karapinar5−1.417−1.14−0.77
Table 5. Drought characteristics, including D and I, based on SPI theory and the Run theory, along with the proposed PI, for meteorological stations within the KEB for SPI-6 in September.
Station CodeStation NameD (SPI)I (SPI)D (Run)I (Run)P_Index
17246Karaman13−1.1113−1.11−1.11
17191Cihanbeyli11−1.0213−0.95−0.77
17192Aksaray4−0.707−0.83−0.14
17242Beyşehir6−1.3410−0.90−0.52
17244Konya Havalimani6−1.578−1.31−0.58
17898Seydişehir7−0.989−1.04−0.47
17248Ereğli6−1.7110−1.26−0.74
17250Niğde6−0.8110−0.85−0.45
17754Kulu6−1.1211−0.81−0.54
17902Karapinar6−1.1810−1.04−0.63
Table 6. Drought characteristics, including D and I, based on SPI theory and the Run theory, along with the proposed PI, for meteorological stations within the KEB for SPI-6 in December.
Station CodeStation NameD (SPI)I (SPI)D (Run)I (Run)P_Index
17246Karaman16−1.2216−1.22−1.22
17191Cihanbeyli14−1.0416−0.98−0.98
17192Aksaray7−1.2710−1.03−0.42
17242Beyşehir6−1.3413−0.84−0.64
17244Konya Havalimani6−1.5710−1.09−0.56
17898Seydişehir10−1.4412−1.27−0.84
17248Ereğli9−1.4913−1.21−0.94
17250Niğde9−0.9913−0.88−0.63
17754Kulu9−1.0414−0.83−0.71
17902Karapinar9−1.2913−1.06−0.84
Table 7. Drought characteristics, including D and I, based on SPI theory and the Run theory, along with the proposed PI, for meteorological stations within the KEB for SPI-12 in March.
Station CodeStation NameD (SPI)I (SPI)D (Run)I (Run)P_Index
17246Karaman3−1.494−1.280.59
17191Cihanbeyli2−1.1915−0.51−0.42
17192Aksaray4−0.704−0.700.46
17242Beyşehir3−1.524−1.260.19
17244Konya Havalimani2−1.094−0.820.35
17898Seydişehir2−1.3212−0.44−0.28
17248Ereğli4−1.3816−0.66−0.60
17250Niğde00.0010−0.23−0.01
17754Kulu00.005−0.460.06
17902Karapinar00.004−0.780.07
Table 8. Drought characteristics, including D and I, based on SPI theory and the Run theory, along with the proposed PI, for meteorological stations within the KEB for SPI-12 in June.
Station CodeStation NameD (SPI)I (SPI)D (Run)I (Run)P_Index
17246Karaman6−1.757−1.590.20
17191Cihanbeyli5−1.4518−0.70−0.60
17192Aksaray4−0.706−0.640.37
17242Beyşehir6−1.607−1.44−0.09
17244Konya Havalimani5−1.347−1.120.07
17898Seydişehir5−1.2615−0.59−0.42
17248Ereğli7−1.5419−0.83−0.78
17250Niğde2−1.3113−0.42−0.17
17754Kulu2−1.488−0.77−0.14
17902Karapinar3−1.637−1.15−0.19
Table 9. Drought characteristics, including D and I, based on SPI theory and the Run theory, along with the proposed PI, for meteorological stations within the KEB for SPI-12 in September.
Station CodeStation NameD (SPI)I (SPI)D (Run)I (Run)P_Index
17246Karaman9−1.8710−1.74−0.10
17191Cihanbeyli8−1.5621−0.85−0.75
17192Aksaray4−0.709−0.600.26
17242Beyşehir9−1.3910−1.30−0.21
17244Konya Havalimani8−1.0610−0.96−0.02
17898Seydişehir8−1.2018−0.68−0.51
17248Ereğli10−1.4822−0.90−0.85
17250Niğde5−1.0816−0.52−0.26
17754Kulu5−1.2911−0.88−0.27
17902Karapinar6−1.5610−1.25−0.36
Table 10. Drought characteristics, including D and I, based on SPI theory and the Run theory, along with the proposed PI, for meteorological stations within the KEB for SPI-12 in December.
Station CodeStation NameD (SPI)I (SPI)D (Run)I (Run)P_Index
17246Karaman12−1.8413−1.74−0.29
17191Cihanbeyli11−1.4724−0.89−0.80
17192Aksaray4−0.7012−0.560.17
17242Beyşehir12−1.2213−1.16−0.27
17244Konya Havalimani10−0.9212−0.86−0.03
17898Seydişehir11−1.2621−0.78−0.62
17248Ereğli13−1.3425−0.90−0.85
17250Niğde8−0.9119−0.53−0.31
17754Kulu8−1.1014−0.86−0.33
17902Karapinar9−1.4013−1.21−0.44
Table 11. Drought characteristics, including D and I, based on SPI theory and the Run theory, along with the proposed PI, for meteorological stations within the KEB for SPI-12 in the last month over the SP.
Station CodeStation NameD (SPI)I (SPI)D (Run)I (Run)P_Index
17246Karaman13−1.7214−1.64−0.22
17191Cihanbeyli16−1.1529−0.82−0.75
17192Aksaray4−0.7015−0.480.14
17242Beyşehir12−1.2213−1.16−0.09
17244Konya Havalimani10−0.9212−0.860.19
17898Seydişehir16−1.4726−1.01−0.83
17248Ereğli15−1.2028−0.82−0.71
17250Niğde12−0.8223−0.55−0.33
17754Kulu9−0.9916−0.76−0.26
17902Karapinar10−1.2815−1.07−0.36
Disclaimer/Publisher’s Note: The statements, opinions and data contained in all publications are solely those of the individual author(s) and contributor(s) and not of MDPI and/or the editor(s). MDPI and/or the editor(s) disclaim responsibility for any injury to people or property resulting from any ideas, methods, instructions or products referred to in the content.