Article

Assessment of Municipal Solid Waste Low-Carbon Treatment: A Case Study of Beijing

Beijing Academy of Social Sciences, 33 North Fourth Ring Middle Road, Chaoyang District, Beijing 100101, China
Sustainability 2025, 17(22), 10265; https://doi.org/10.3390/su172210265
Submission received: 30 September 2025 / Revised: 6 November 2025 / Accepted: 13 November 2025 / Published: 17 November 2025
(This article belongs to the Section Environmental Sustainability and Applications)

Abstract

The municipal solid waste recycling industry has become a rapidly growing emerging industry. Its carbon emissions account for 1/10 of the urban carbon emissions, which cannot be ignored. It is highly important for cities to achieve the goals of peak carbon and carbon neutrality and to strive for space for economic and social development. Taking Beijing as an example, using the life cycle analysis method, this paper systematically combines the historical changes in the characteristic structure of municipal solid waste. On this basis, the amount and structural characteristics of carbon emissions and their evolution are calculated, the achievements of municipal solid waste treatment in Beijing are comprehensively evaluated, and the space for further emission reduction in the future is estimated. The following conclusions are drawn: (1). Since the implementation of waste classification treatment, carbon emissions in Beijing have decreased by 22.9%. (2). Carbon emissions from plastic and paper waste from municipal solid waste have become the main source of carbon emissions from waste treatment. (3). There is still more than 2.6 × 10⁶ t of carbon emission reduction space for municipal solid waste treatment in Beijing in the future. On the basis of the calculation results, several suggestions are proposed.

1. Introduction

China has developed ambitious plans for carbon peak and carbon neutrality goals. In September 2020, China proposed at the 75th United Nations General Assembly that China would strive to achieve carbon neutrality by 2060 [1]. How to change the mode of development and achieve sustainable economic development under low-carbon conditions has become an important issue facing Chinese cities. With the promotion of ecological civilization construction, the municipal solid waste recycling industry has become a rapidly growing emerging industry. The carbon emissions of this industry cannot be ignored. Taking Beijing as an example, in 2024, Beijing’s waste clearance and transportation volume reached 7.94 × 10⁶ t [2], ranking first in the country. The average carbon emission from the complete decomposition or combustion of municipal solid waste per ton is approximately 0.5 t. Therefore, it can be estimated that the annual carbon dioxide emissions from the combustion and decomposition of municipal solid waste in Beijing exceed 5 × 10⁶ t, which is more than 1/10 of the total carbon emissions. If we improve the reduction, recycling and reuse level of municipal solid waste in the production, transportation, recycling and final treatment of municipal solid waste, it will greatly promote the sustainable development of the urban economy under the goal of carbon neutrality in the city.
Beijing’s municipal solid waste recycling has always been at the forefront of the country. After waste classification, municipal waste production decreased by 21.13% compared with that before waste classification. After the implementation of household waste classification, the amount of kitchen waste reached 6.11 × 10³ t/d, accounting for 21.78% of the total amount of kitchen waste; the amount of recyclables separated out was 4.02 × 10³ t/d, accounting for 35% of the total amount of recyclables; and the amount of other waste entering terminal care was reduced to 1.5 × 10⁴ t/d, which was 35% lower than before [3]. Since 2021, all the harmless treatment of municipal solid waste has been achieved in Beijing. Since then, the amount of sanitary landfill treatment has decreased annually, whereas the amount of incineration power generation and biological fermentation treatment has increased rapidly. The amount of sanitary landfilling decreased rapidly by 28.30%. However, owing to the rapid growth and large base of municipal solid waste in Beijing, the amount of waste is still large, especially for municipal solid waste with high recycling value, such as plastic and paper, which has caused a large waste of resources and economy. In addition, compared with the world’s advanced level, there is still room to improve the level of waste treatment in Beijing, which is reflected in the insufficient design of source reduction, the improvement of the waste classification level of residents, the low dehydration efficiency of terminal treatment, the low calorific value of combustion, and the low economic benefits of recycling valuable waste such as electronic waste.
However, many challenges still exist for Beijing to take the lead in achieving the goal of carbon neutrality. In terms of industrial structure, the added value of Beijing’s tertiary industry accounted for 83.8% of GDP in 2024, making further adjustment more difficult. From the perspective of the energy structure, the proportion of clean energy use in Beijing has been very high. The proportion of clean energy consumption in 2020 exceeded 96%, and the space for energy structure adjustment was very limited. In addition, Beijing has a high population density and a small soil area; therefore, there is little room to improve its carbon sink capacity. Therefore, to achieve the goal of carbon neutrality as scheduled, Beijing needs to broaden its horizons and tap into the potential for emission reduction in many ways. Optimizing the method of municipal solid waste treatment and reducing the potential carbon emissions caused by waste treatment are important strategies for achieving the goal of urban carbon neutralization.
Research on carbon emissions from municipal solid waste focuses mainly on the classification of municipal solid waste and the calculation of greenhouse gas emissions from food waste, metal, paper, etc. [4]. research on the greenhouse gas emissions of municipal solid waste in the collection, transportation, treatment and other links [5]; and studies on carbon emissions caused by a certain treatment method of municipal solid waste [6,7,8]. Owing to different treatment processes and management modes, greenhouse gas emissions from municipal solid waste treatment differ considerably [9]. Through waste classification and composting, Trihadiningrum (2015) conducted a field survey and reported that 100 households in Indonesia can reduce urban municipal solid waste by 67.92% [10]. Thyberg (2015) established a framework for municipal solid waste management and applied it to food management to reduce food waste and food waste generation [11]. Alajmi (2016) [12] used the environmental Kuznets curve (EKC) to analyze the relationship between Saudi Arabia’s economic growth and waste production and concluded that Saudi Arabia’s waste production did not conform to the EKC assumption. In accordance with the 2030 Saudi Arabia development program held by the national assembly in May 2016, waste management will be strengthened, and the peak of the EKC will appear earlier. Istrate et al. (2023) analyzed the impact of waste recycling on carbon emissions from waste treatment in Madrid [13]. In general, studies on the carbon emission effect of municipal solid waste recycling under the dual carbon goal are rare.
The main research methods for determining carbon emissions include the IPCC recommended method, life cycle assessment (LCA) and the Clean Development Mechanism (CDM) [14]. Mohareb and others compared four different carbon emission calculation models of municipal solid waste, namely, the IPCC 1996, IPCC 2006, the waste reduction model (WARM) of the U.S. Environmental Protection Agency and the Canadian Climate Cities Alliance (FCM-PCP), and reported that the carbon emission results calculated by the four methods were essentially consistent when landfill waste was relatively stable. J. Bogner et al. used the recommended method of the IPCC1996 guidelines to study the annual CH4 emissions and CH4 recycling of landfill sites around the world from 1980 to 1996. The results revealed that the CH4 recovery rate in the United States and some developed countries increased annually, whereas CH4 emissions decreased annually [15]. Zhao et al. (2010) calculated and compared the carbon emissions generated by three different treatment methods of municipal solid waste using the empirical formula recommended by the IPCC 2006 guidelines [8]. Li et al. (2024) Also calculated the change characteristics and influencing factors of carbon emissions in Yunnan Province of China using the IPCC method [16]. The calculation method of direct carbon emissions is often used in existing research. However, the carbon cycle of municipal solid waste is complex. For example, although waste recycling increases direct carbon emissions, it generally reduces carbon emissions because initial production is avoided. Therefore, it is necessary to construct a more complex and reasonable model to make the research results more realistic.
In this study, Beijing is taken as a case study; first, a statistical analysis of the production, structure, and treatment methods of municipal solid waste in Beijing is conducted. On this basis, using the life cycle method, the carbon emission potential of urban municipal solid waste is calculated, after which the carbon reduction effect under different treatment methods is determined. Finally, the sensitive points of carbon emissions are analyzed, providing targeted suggestions for future emission reduction. In this study, first, quantitative methods such as life cycle assessment and the IPCC household waste carbon emission standard model are used to calculate the carbon emission status and emission reduction potential of the entire process of household waste recycling. On the basis of literature analysis, research interviews, and quantitative analysis, this paper systematically addresses the difficulties and problems faced by Beijing in achieving low-carbon recycling of household waste through structural analysis and provides targeted countermeasures. The reduction potential of major types of waste in Beijing, such as waste paper, plastic products, kitchen waste, plant ash, construction waste, glass, and metal, should be thoroughly analyzed, and their carbon emission reduction potential should be calculated. The potential for recycling and utilization of recyclable waste in household waste, as well as its carbon reduction potential, should be analyzed. The carbon emission reduction potential of final treatment systems such as landfills, incineration power generation, and biodegradation should be analyzed. Finally, the “dual carbon” prospect of Beijing’s municipal solid waste recycling is identified, and various paths to achieve this prospect are identified. The objectives of this study are: (1) to calculate the current situation of carbon emissions from waste treatment in Beijing; (2) analyze the carbon emission reduction potential of waste treatment in Beijing; (3) give the specific path to realize the carbon emission reduction potential According to the calculation results.
The subsequent sections of this article are arranged as follows: Section 2 discusses the methods and data sources, Section 3 analyzes the calculation results, Section 4 compares and discusses existing research, and Section 5 presents conclusions and corresponding policy recommendations and provides further research directions. The innovations of this article include (1) combining the “dual carbon” goal with the Beijing urban household waste recycling industry, quantitatively studying the carbon effect of the urban household waste recycling industry, reanalyzing and reunderstanding the environmental impact of the recycling industry, and testing the green development of the recycling industry; (2) optimizing the carbon emission reduction potential measurement model of typical urban circular industries and forming a measurement model for evaluating the carbon effect and emission reduction potential of urban circular industries through the calculation of the carbon emission reduction potential of Beijing’s garbage industry; this has universal theoretical significance for the evaluation of urban carbon neutrality; and (3) by providing decision-making suggestions for the carbon neutrality action of the city through quantitative analysis of the current situation and potential of carbon emissions combined with the actual situation of Beijing’s municipal solid waste recycling industry, the difficulties and problems in realizing the emission reduction potential of Beijing’s municipal solid waste recycling industry are identified, and practical and feasible countermeasures are proposed to provide solid support for Beijing’s carbon neutrality action.

2. Methods and Data

2.1. Data Sources

The data used in this study, including the carbon emissions of different waste components, such as kitchen waste, plastic, paper and other wastes, during the process of various treatment methods, are from the Gabi database. The amounts of municipal solid waste produced, transported and disposed of by various treatment methods in Beijing are from the Beijing Statistical Yearbook (2005–2023). The composition data of municipal solid waste in Beijing are from the literature, and individual years are fitted by linear extrapolation.

2.2. Methods

In this study, the life cycle assessment method was used to evaluate the carbon emission reduction effect and potential of municipal solid waste in Beijing. First, the waste treatment process in Beijing is selected to determine the scope of the life cycle assessment. A life cycle inventory of municipal solid waste treatment in Beijing is established by using statistical data of municipal solid waste production and classified treatment in Beijing, as well as data and literature on the structure of municipal solid waste. Through the inventory calculation, the carbon emission characteristics and historical change characteristics of the whole life cycle of municipal solid waste treatment in Beijing are obtained by selecting the recipe 2016 characterization and normalization methods, and the carbon emission characteristics of different treatment methods and different types of waste are calculated. On this basis, the carbon emission reduction potential of municipal solid waste treatment is calculated by setting scenarios.
Life cycle assessment (LCA) is a process for evaluating the environmental load related to the whole life cycle of products, processes or activities, from raw material collection to product production, transportation, sales, use, reuse, maintenance and final disposal [17]. It first identifies and quantifies the energy and material consumption and environmental release throughout the life cycle, then evaluates the impact of these consumption and release processes on the environment, and finally, it identifies and evaluates the opportunities to reduce these impacts [18]. The life cycle assessment process is usually divided into four steps: defining objectives and determining the scope, inventory analysis, impact assessment and improvement assessment. This method can comprehensively quantify and evaluate the resource consumption, ecological pressure and human health impact of specific substances throughout the whole life cycle of production and utilization and further analyze the impact of changes in different raw materials or products on the ecological environment [19]. Compared with other ecological impact assessment methods that directly evaluate the production, it can more completely evaluate the overall ecological impact of a specific product or process.
Through characteristic transformation, the impact of different types of environmental load factors is analyzed and quantified. The characterization factor is used to convert the results in the life cycle list into measurable units for specific environmental impacts, such as the impact of various substances on climate change, which are converted into carbon dioxide equivalents. Finally, the quantitative indicators of various ecological and environmental impacts are obtained for comparison and analysis. Finally, to obtain the overall environmental impact, the characterization results of the life cycle should be weighted. Weighting assigns each weight coefficient based on value selection to different impact type index results and then merges the weighted results.

2.2.1. LCA Goal and Scope Definition

The flow process of municipal solid waste is shown in Figure 1 and is divided into residential buildings, waste bins, closed waste stations, transfer stations, landfills and other stages. Waste recycling runs through every stage: In the residential stage, through the classification of residents, high-value waste is recycled by waste buyers; at the waste station, the waste collector recycles some valuable waste; the sanitation workers classify and screen the waste again at the closed waste station and waste transfer station; and the remaining waste is used for incineration power generation or landfill.
There are four main treatment methods for municipal solid waste that eventually enters the treatment process: untreated open stacking, sanitary landfill, incineration power generation and biological fermentation. Regardless of which method is adopted, waste is eventually decomposed into carbon dioxide and other inorganic substances in the long term. Since the research object of this study is the final waste treatment, the research boundary range is the “cradle-to-grave” mode, that is, from waste generation to various treatment methods and, finally, to the complete decomposition of domestic waste. Owing to the availability of data, the impact of transportation, treatment equipment and infrastructure construction on carbon emissions is not considered temporarily. The mixed municipal solid waste is selected as the benchmark, and the functional unit of the study is determined to be 1000 kg of unclassified municipal solid waste. For the electricity, biogas and other byproducts generated in the process of treatment, the carbon emissions saved by their production are included in the result as the negative value of the carbon emissions of waste treatment, that is, the reduction of carbon emissions in waste treatment. In terms of the cutoff method, because this study is aimed at the recycling of waste, the assessment scope is set not to undertake any earlier carbon emission allocation.

2.2.2. Life Cycle Inventory

Gabi 9.0 ts software is used to link various methods of municipal solid waste treatment, including no treatment, sanitary landfill, and municipal solid waste treatment processes, to form the life cycle list of this study. The life cycle carbon emission data of these treatment methods are from the Gabi database, whereas the amount of municipal solid waste treated by the various methods is from the Beijing Statistical Yearbook.
Through quantitative analysis of the quality and consistency of the data in all the processing links (Table 1), we can see that the relevant data technology and time are highly representative. Owing to the relative lack of statistical data in this region, the representativeness is low. In terms of the consistency test, the quality error of each link’s quality output is controlled within 0.5%, which passes the test.
By summing the data in the Beijing life cycle inventory, we can obtain the structural characteristics and changes in Beijing’s municipal solid waste production and treatment capacity. The relevant analysis is given in Section 3.

2.2.3. Life Cycle Impact Assessment

Through characteristic transformation, the impact of different types of environmental load factors is analyzed and quantified. The characterization factor is used to convert the results in the life cycle list into measurable units for specific environmental impacts, such as the carbon emission reduction impact of various substances, which are converted into carbon dioxide equivalents. The calculation formula is:
C E = i = 1 n E F i   Q i
where CE is the total equivalent emission of carbon dioxide, in kg CO2 equiv as the unit, EFi is the emission factor, that is, the carbon emission of type i waste in the whole process of treatment per unit mass, Qi is the physical quantity, here refers to the treatment capacity of type i waste.
This study mainly analyzes the reduction degree of environmental impact in various fields in the process of reproduction and recycling of paper, plastics, glass, textiles, metals and other wastes, as well as the quantitative conclusion of resource conservation. The treatment capacity of relevant types of waste is obtained through the Beijing Statistical Yearbook and existing literature, and the emission factor is obtained by searching the carbon emission value of corresponding treatment technology through Gabi 9.0 database.

2.2.4. Analysis of the Carbon Emission Reduction Potential of Municipal Solid Waste in Beijing

On the basis of the life cycle analysis data, the carbon emissions under the existing waste treatment mode in Beijing are compared with those under the untreated condition, and the effect of carbon emission reduction in municipal solid waste in Beijing is calculated. On this basis, the ideal carbon emission reduction values of paper, plastic and other recyclable wastes under comprehensive recycling conditions are determined and compared with existing carbon emission data, after which the potential and value of further carbon emission reduction for municipal solid waste treatment in Beijing are determined, and the corresponding methods and paths are analyzed to ensure the realization of carbon emission reduction targets and sustainable economic development in Beijing.

3. Analysis Results

3.1. Overview of Municipal Solid Waste Generation and Removal in Beijing

Municipal solid waste in Beijing rapidly increased (Figure 2), from 4.96 × 10⁶ t in 2004 to 1.01 × 10⁷ t in 2019, rapidly decreased to 7.98 × 10⁶ t in 2020 after the implementation of waste classification, and then slowly decreased.
From the perspective of the composition of municipal solid waste (Figure 3), kitchen waste accounted for almost half of the municipal solid waste, reaching 65.98% at the peak in 2010, which decreased to 50% before waste classification and to less than half after waste classification. With the improvement of the urban environment, the proportion of lime soil decreased rapidly, from 19% in 2024 to 0.23% in 2022. Moreover, with increasing express delivery and takeout as well as increasing office waste, the prevalence of packaging waste, such as paper and plastic, increased sharply, from 7.55% and 11.26% in 2004 to 24.99% and 23.43% in 2022, respectively. The proportion of recyclables in municipal solid waste has increased as a whole.
Beijing’s waste treatment capacity has increased rapidly, and the treatment rate has been above 99% since 2012 (Figure 4). After 2020, with the decline in waste production, 100% treatment will be achieved. From the perspective of treatment methods, the landfill volume has decreased annually since 2008, especially in recent years. The goal of zero landfilling in Beijing is expected to be achieved by 2025. The proportion of incineration power generation has increased annually, and the level of waste recycling has been rising. The quantity of biological fermentation began to decline with decreasing waste production.

3.2. Characteristics and Changes in Carbon Emissions from Municipal Solid Waste Treatment in Beijing

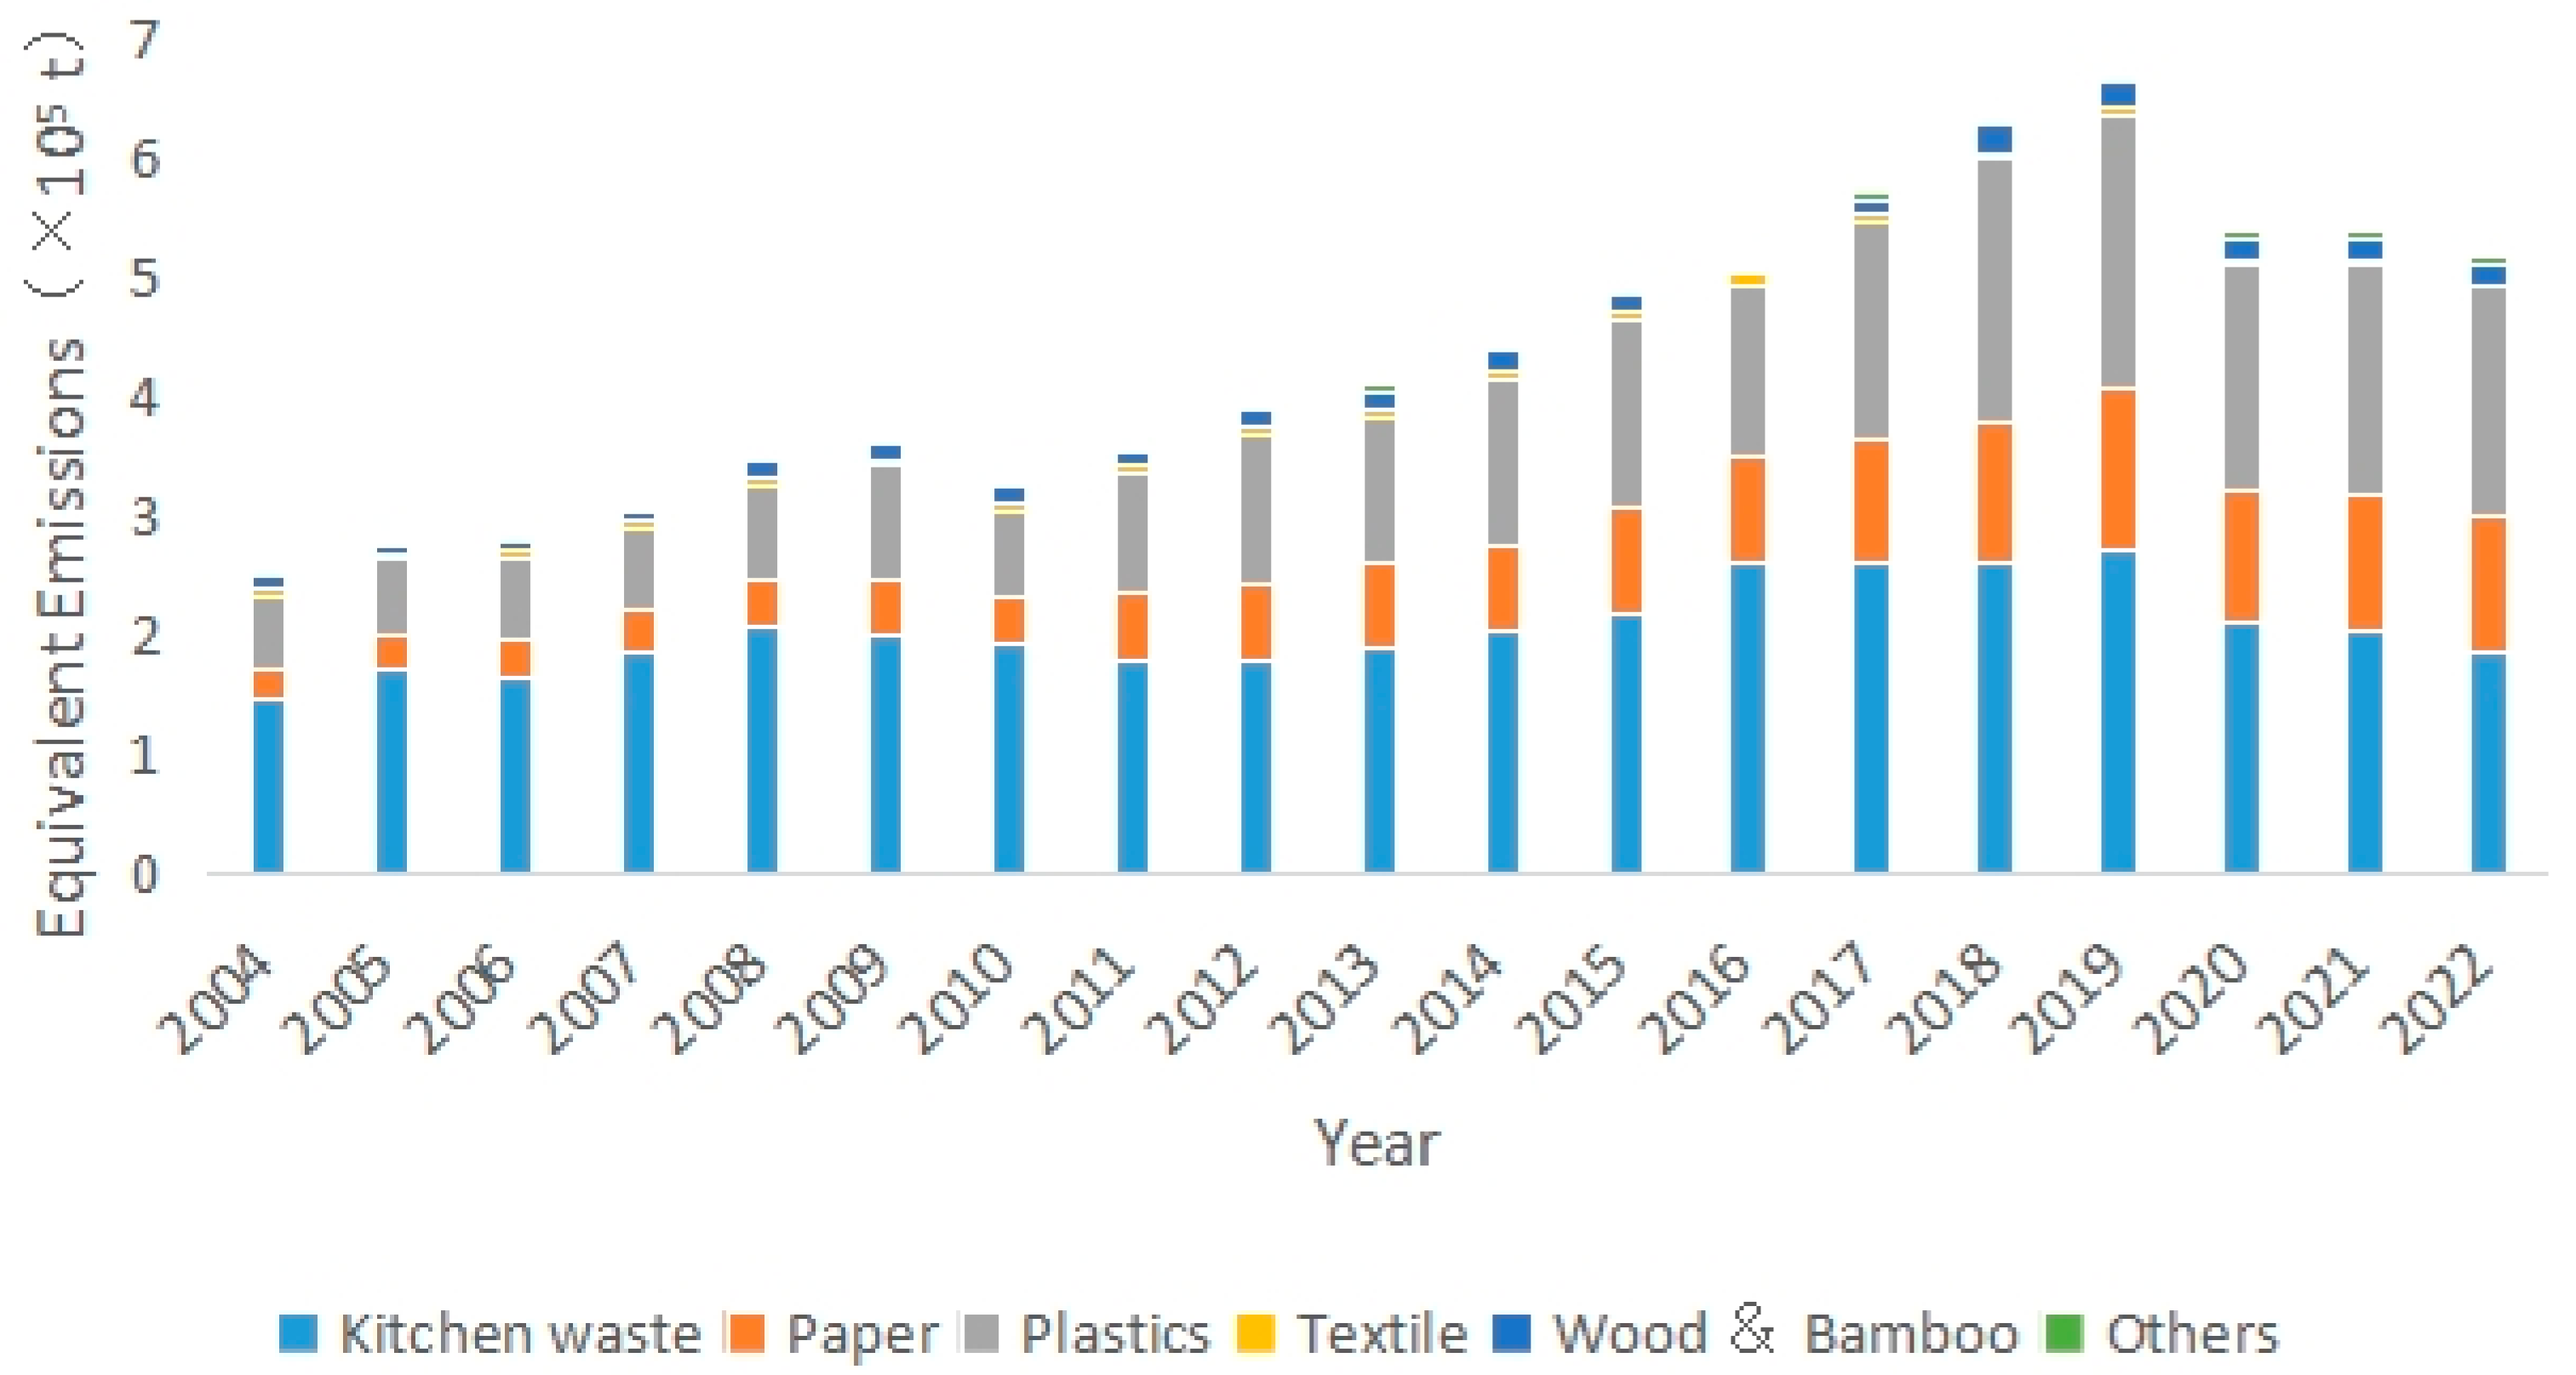
According to the calculation results of carbon dioxide production (Figure 5), the change in carbon emissions from municipal solid waste in Beijing is essentially the same as its production. It first experienced rapid growth and peaked in 2019 before waste classification, with carbon emissions reaching 6.7 × 10⁶ t, which is equivalent to 2.6 times that in 2004. With the subsequent reduction in waste generation after waste classification and the improvement in treatment technology, carbon emissions also gradually decreased. In 2022, the carbon emissions of municipal solid waste in Beijing decreased to 5.1 × 10⁶ t, which was 22.9% lower than the peak. In terms of classification, the proportion of untreated waste is very small, and the amount of carbon dioxide produced by it is also small and quickly returns to zero. After rising in the first few years, carbon dioxide emissions from sanitary landfills also declined rapidly with the decline of landfills. However, the carbon emissions from incineration power generation showed rapid growth. Carbon emissions from the biological fermentation process first increased rapidly but then decreased with decreasing waste production.
Compared with the weight composition of waste, the carbon emissions from plastic waste in the treatment process is much greater and is increasing rapidly. In 2022, the carbon emissions from the treatment of plastic waste in Beijing reached 190,000 tons, which was three times that of 2004, accounting for more than 1/3 of the carbon emissions from municipal solid waste, and became the main type of carbon emissions from municipal solid waste (Figure 6). Similarly, the carbon emissions from paper also increased rapidly. In 2022, the carbon emissions from paper waste reached 1.1 × 10⁵ t, which was five times that of 2004 and more than 1/5 of the total carbon emissions from municipal solid waste. Both plastics and paper have high carbon emissions per unit weight. With the rapid development of e-commerce, plastics and paper as packaging have increased significantly and have become the main sources of carbon emissions from municipal solid waste, accounting for more than 50% of the total emissions. In contrast, carbon emissions from kitchen waste and bamboo and wood waste remained stable.

3.3. Achievements and Future Potential of Carbon Emission Reduction in Municipal Solid Waste Treatment in Beijing

Through incineration power generation, biological fermentation and other methods, Beijing has largely reduced carbon emissions from municipal solid waste. In 2022, Beijing reduced the equivalent carbon dioxide emissions by 1.6 × 10⁶ t, which is equivalent to 31.5% of the existing carbon emissions, through waste incineration and biological fermentation. Over the years, the transformation of municipal solid waste removal and treatment technology in Beijing has achieved obvious results. In the future, if the complete recycling of plastics and paper in municipal solid waste can be realized, according to the calculation results, the carbon emissions will be reduced to less than half of the existing amount, and the carbon emissions will be reduced by more than 2.6 × 10⁶ t, accounting for approximately 2% of the total carbon emissions in Beijing. Therefore, the carbon emission reduction in municipal solid waste in Beijing still has potential. If it can be fully exploited, it will provide substantial space for the economic development of Beijing. In the future, we should start with express packaging, office paper and other aspects; reduce the generation of high-carbon-emission waste, such as plastic paper from the source; strengthen waste classification and sorting; and maximize the recycling of plastic paper to increase the carbon emission reduction potential of municipal solid waste as much as possible.

4. Discussion

Compared with the research of Li, Zhang, Liu (2022) [20] on Beijing’s direct carbon emissions from 2006 to 2019, which is based on the IPCC recommended algorithm, the equivalent carbon dioxide emissions obtained in this study are generally close, which confirms the rationality of this study. However, the carbon emissions obtained in this study are usually slightly greater even when transportation carbon emissions are not considered, which is precisely because this study considers the whole life cycle of the municipal solid waste treatment process, including direct and indirect carbon emissions. Research by Wang, Zhao (2017) [21] on Beijing from 2005 to 2014 is also partially consistent with this study and suggested that the carbon emission reduction effect of incineration power generation is better, which is similar to some of the results of this study. Liu, Hao, Liu (2022) reported that Beijing’s carbon emissions before 2019 were also slightly lower than those reported in this study [22]. Owing to the use of different research methods, this study revealed that carbon emissions decreased in approximately 2015. In contrast to the results of this paper, this may be because the traditional classification and statistical methods did not consider the life cycle carbon emissions of municipal solid waste, especially paper and plastic treatment. Pan et al. (2010) [23] and Li (2021) [24] suggested that incineration power generation was the way to reduce carbon emissions through the classification of greenhouse gas types. Li (2021) [24] further determined the optimal proportion of sanitary landfilling, biological fermentation and incineration power generation on the basis of the actual situation in Beijing. With the progress of technology, Beijing has proposed a further “zero landfill” policy. Therefore, on the basis of the latest situation, this paper provides corresponding carbon emission reduction predictions.

5. Conclusions and Prospects

On the basis of a comprehensive review of the historical evolution and composition characteristics of carbon emissions from municipal solid waste treatment in Beijing, in this study, the structural characteristics and variation characteristics of carbon emissions from the final treatment of municipal solid waste in Beijing were calculated by using the life cycle method, the carbon emission reduction results achieved in the treatment of municipal solid waste in Beijing were evaluated, and the potential for further emission reduction in Beijing through scenario simulation was calculated. The following conclusions were reached.
  • Since the implementation of waste classification treatment in Beijing, carbon emissions from waste treatment have decreased significantly. Carbon emissions from municipal solid waste treatment in 2022 decreased by 22.9% compared with the peak in 2019. Incineration power generation has become the main source of municipal solid waste carbon treatment instead of landfilling.
  • The production of plastic and paper waste from municipal solid waste has increased rapidly. Their carbon emissions have become the main component of carbon emissions from waste treatment, accounting for more than 1/3 and 1/5 of all carbon emissions from municipal solid waste treatment, respectively. They are the main source of carbon emissions growth and the main space for future emission reduction.
  • In the future, more than 2.6 × 10⁶ t of carbon emission reduction space for municipal solid waste treatment in Beijing will still exist. If it can be used, it will provide valuable carbon space for the economic and social development of Beijing.
On the basis of the above research, this study proposes the following suggestions for reducing the carbon emissions of municipal solid waste treatment in Beijing.
  • Reduction is the basis for reducing carbon emissions from municipal solid waste. Beijing should start from the source of waste generation; develop a waste recycling responsibility system centered on the producer responsibility system; and gradually promote the whole-process management of production, circulation, consumption and terminal treatment, with reduction as the goal. Enterprises should be actively encouraged to implement the “trade in” of durable consumer goods, improve the durability of products and reduce the generation of large amounts of waste. The supply side reform of express delivery, takeout and logistics enterprises should be strengthened; the design and use of complete recyclable packaging should be encouraged; and the recycling of logistics packaging should be realized and the generation of packaging waste should be reduced in a variety of ways, such as valuable recycling and integral recycling. Enterprises and institutions should be guided to work in a low-carbon way, and the consumption of office supplies such as paper should be reduced. The production, marketing and processing of agricultural products should be the focus; product pretreatment should be performed better; “clean vegetables into the city” and “CD-ROM action” should be promoted; the provisioning of disposable tableware should be reduced; and urban kitchen waste should be reduced.
  • A high level of classified recycling is necessary for recycling and end treatment. We should improve resident awareness of waste classification, develop waste classification behavior, improve waste classification laws and regulations, improve the efficiency of waste classification and recycling, and reduce the total amount of waste. The incentive mechanism of waste recycling enterprises should be reformed. Waste terminal treatment enterprises should aim at realizing the reuse of waste resources; waste recycling enterprises should be encouraged to use app reservation recycling, door-to-door recycling and other methods; and resident waste and recycling processes should be optimized in detail. Through the mobile app terminal, with offline outlets as the carrier, online orders, trading, and offline door-to-door acquisition services should be formed. An incentive mechanism for waste classification and recycling should be established, enthusiasm for joining the ranks of waste classification and recycling through the point system or other material rewards should be improved, and the public should consciously implement waste classification in a correct manner. The introduction of intelligent equipment, such as intelligent trash cans, intelligent induction broadcasting systems, “bag breakers” and automatic sorting stations, will reduce the difficulty of resident waste delivery. Mandatory measures and punishment measures for waste classification should be formulated; supervision by means of video surveillance, resident reporting should be strengthened; and appropriately punish those who find littering without waste classification [25]. Waste sorting should start from a young age. The education department should strengthen cooperation with the environmental sanitation department, formulate different garbage classification procedures for students in different school-age groups, and carry out publicity and education.
  • Transportation management is important for reducing municipal solid waste carbon. To improve the intermediate transportation efficiency of waste, it is necessary to invest funds, equip appropriate sanitation workers, replace closed waste transport vehicles, reasonably plan the planning and site selection of waste transfer stations, strengthen the environmental sanitation treatment of waste transfer stations, and improve the transfer efficiency of urban municipal solid waste [26]. The classified recycling, airtight stations, transfer stations and transportation routes of municipal solid waste should be scientifically planned, and a multifunctional municipal solid waste removal and transportation system should be established. The development and use of new energy transportation equipment should be promoted, and the carbon emissions of transportation equipment should be effectively reduced. Mixed transportation of classified waste and unclassified waste should be prohibited.
  • Waste final treatment is the largest direct carbon emission link in the process of municipal solid waste recycling. The carbon emission intensity of the final treatment has been reduced from the perspective of reasonable planning, comprehensive treatment and improvement of the treatment process. Moreover, improving the energy output of the final treatment and increasing the substitution of traditional energy indirectly reduce carbon emissions; thus, the energy production efficiency of the final waste treatment should also be optimized.
The proportion of final treatment methods of municipal solid waste, such as incineration power generation, sanitary landfill and biological fermentation should be optimized; the goal of zero landfill of primary waste should be accelerated; and the emission of greenhouse gases such as methane and carbon dioxide should be minimized. The efficiency of incineration power generation and biogas production can be improved by fermentation, and carbon emissions can be replaced through the production of energy. The construction of municipal solid waste comprehensive treatment parks should be accelerated. An overall plan to establish a comprehensive base for waste incineration, sanitary landfill, composting, processing and utilization of renewable resources, and harmless treatment of hazardous waste should be made to improve the efficiency of waste terminal treatment. Waste terminal treatment equipment should be improved, special equipment such as kitchen waste pretreatment and low calorific value waste incineration that is more suitable for classified waste treatment should be introduced, the pertinence of waste treatment equipment should be enhanced, the efficiency of waste classification treatment should be improved, and new treatment processes such as waste pyrolysis and plasma treatment should be explored.
Through the life cycle analysis method, this paper comprehensively analyzes the carbon emissions of municipal solid waste treatment in Beijing and, on this basis, proposes policy suggestions for further emission reduction in the future, which has strong reference significance for the measurement and further reduction in carbon emissions from urban waste treatment. Owing to the problem of data acquisition, this paper does not calculate the carbon emissions of equipment in the process of waste transportation and treatment. In addition, owing to space limitations, the economic costs and benefits of reducing the carbon emissions of municipal solid waste cannot be estimated. These problems will be the direction of further research.

Funding

This research was conducted with support the Youth fund of Beijing Academy of Social Sciences “Study on Ecological and Economic Benefits of Municipal Solid Waste Recycling in Beijing”. Grant No. KY2024D0236.

Institutional Review Board Statement

Not applicable.

Informed Consent Statement

Not applicable.

Data Availability Statement

No new datasets were generated; all data are from publicly available sources.

Conflicts of Interest

The author declares no conflict of interest.

References

  1. Xi, J. Speech at the General Debate of the 75th Session of the United Nations General Assembly. Website of the Ministry of Foreign Affairs of the People’s Republic of China. Available online: https://www.fmprc.gov.cn/web/gjhdq_676201/gjhdqzz_681964/sgwyh_682446/zyjh_682456/202009/t20200922_9385420.shtml (accessed on 2 September 2025).
  2. Beijing Municipal Bureau of Statistics. Beijing Statistical Yearbook. Website of Beijing Municipal Bureau of Statistics. 2020. Available online: https://nj.tjj.beijing.gov.cn/nj/main/2020-tjnj/zk/e/indexce.htm (accessed on 11 February 2025).
  3. Sun, J. “Report Card” on Beijing’s Household Waste Classification. Environ. Econ. 2021, 291, 8–9. [Google Scholar]
  4. Centil, E.; Christensen, T.H.; Aoustin, E. Greenhouse Gas Accounting and Waste Management. Waste Manag. Res. 2009, 27, 696–706. [Google Scholar]
  5. Zhao, W.; van der Voet, E.; Zhang, Y.; Huppes, G. Life Cycle Assessment of Municipal Solid Waste Management with Regard to Greenhouse Gas Emissions: Case Study of Tianjin, China. Sci. Total Environ. 2009, 407, 1517–1526. [Google Scholar] [CrossRef]
  6. Ma, Z.; Gao, Q. Guidelines for Calculating Greenhouse Gas Emissions from Waste Disposal; Science Press: Beijing, China, 2011. [Google Scholar]
  7. Yang, W.; Li, J.; Dai, B. A Study on Caculation Method of Carbon Emission in Power Generation with MSW Incineration. Energy Conserv. 2011, 7, 61–63. [Google Scholar]
  8. Zhao, L.; Chen, D.; Liu, G.; Luan, J.; Christensen, T. Two Calculation Methods for Green House Gas Emissions from Municipal Solid Waste Thermo-chemial Conversion. Acta Sci. Circum. 2010, 30, 1634–1641. [Google Scholar]
  9. Lou, B.; Cai, C. Analysis of Waste Disposal under Clean Development Mechanism. J. South China Univ. Technol. 2006, 34, 100–104. [Google Scholar]
  10. Trihadiningrum, Y.; Laksono, J.; Dhokhikah, Y.; Moesriati, A.; Radita, D.R.; Sunaryo, S. Community Activities in Residential Solid Waste Reduction in Tenggilis Mejoyo District, Surabaya City, Indonesia. J. Mater. Cycles Waste Manag. 2015, 19, 526–535. [Google Scholar] [CrossRef]
  11. Thyberg, K.L.; Tonjes, D.J. A Management Framework for Municipal Solid Waste Systems and Its Application to Food Waste Prevention. Systems 2015, 3, 133–151. [Google Scholar] [CrossRef]
  12. Alajmi, G. The Relationship between Economic Growth and Municipal Solid Waste & Testing the EKC Hypothesis: Analysis for Saudi Arabia. J. Int. Bus. Res. Mark. 2016, 1, 20–25. [Google Scholar] [CrossRef]
  13. Istrate, I.-R.; Galvez-Martos, J.L.; Vázquez, D.; Guillén-Gosálbez, G.; Dufour, J. Prospective analysis of the optimal capacity, economics and carbon footprint of energy recovery from municipal solid waste incineration. Resour. Conserv. Recycl. 2023, 193, 106943. [Google Scholar] [CrossRef]
  14. Fukushima, Y.; Liu, P.; Tsai, J.; Lee, C.; Tseng, T. Preliminary Investigation of Greenhouse Gas Emissions from the Environmental Sector in Taiwan. J. Air Waste Manag. Assoc. 2008, 58, 85–94. [Google Scholar] [CrossRef]
  15. Bogner, J.; Matthews, E. Global Methane Emissions from Landfills: New Methodology and Annual Estimates 1980–1996. Glob. Biogeochem. Cycles 2003, 17, 1065. [Google Scholar] [CrossRef]
  16. Li, B.; Li, D.; Hu, J.; Zhu, X.; Wang, H.; Jeon, C.H.; Kim, G.M.; Zeng, Y. Carbon emission of municipal solid waste under different classification methods in the context of carbon neutrality: A case study of Yunnan Province, China. Fuel 2024, 372, 8. [Google Scholar] [CrossRef]
  17. ISO 14040; Environmental Management-Life Cycle Assessment-Principles and Framework. ISO: Geneva, Switzerland, 2006.
  18. Garcia-Sanchez, M.; Guereca, L. Environmental and Social Life Cycle Assessment of Urban Water Systems: The Case of Mexico City. Sci. Total Environ. 2019, 693, 133464. [Google Scholar] [CrossRef] [PubMed]
  19. Santoyo-Castelazo, E.; Azapagic, A. Sustainability Assessment of Energy Systems: Integrating Environmental, Economic and Social Aspects. J. Clean Prod. 2014, 80, 119–138. [Google Scholar] [CrossRef]
  20. Li, Y.; Zhang, S.; Liu, C. Research on Greenhouse Gas Emission Characteristics and Emission Mitigation Potential of Municipal Solid Waste Treatment in Beijing. Sustainability 2022, 14, 8398. [Google Scholar] [CrossRef]
  21. Wang, A.; Zhao, T. Greenhouse Gas Emission Characteristics of Municipal Waste Management in Beijing. Environ. Monit. China 2017, 33, 68–75. [Google Scholar] [CrossRef]
  22. Liu, C.; Hao, X.; Liu, F. Greenhouse Gas Emission Characteristics and Emission Reduction Strategies of Municipal Solid Waste Treatment in Beijing. J. Environ. Eng. Technol. 2022, 12, 1041–1048. [Google Scholar]
  23. Pan, L.; Ye, H.; Huang, S.; Li, G.X.; Zhang, H.Y. Greenhouse Gas Emission from Municipal Solid Waste Treatment in Beijing. Environ. Sci. Technol. 2010, 33, 116–124. [Google Scholar]
  24. Li, Y.; Wu, X.; Sun, C.; Geng, Z.; Zhang, Q. Optimization of Beijing Municipal Solid Waste Treatment Model Based on Low- Carbon Development. Resour. Sci. 2021, 43, 1574–1588. [Google Scholar] [CrossRef]
  25. Dong, L. Countermeasures on Existing Problems of Beijing Garbage Classification. Recycl. Resour. Circ. Econ. 2021, 14, 19–21. [Google Scholar]
  26. Cui, T.; Wang, L. Evaluation the Efficiency of Municipal Solid Waste Management and Its Influencing Factors. J. Price Theory Pract. 2017, 10, 138–141. [Google Scholar]
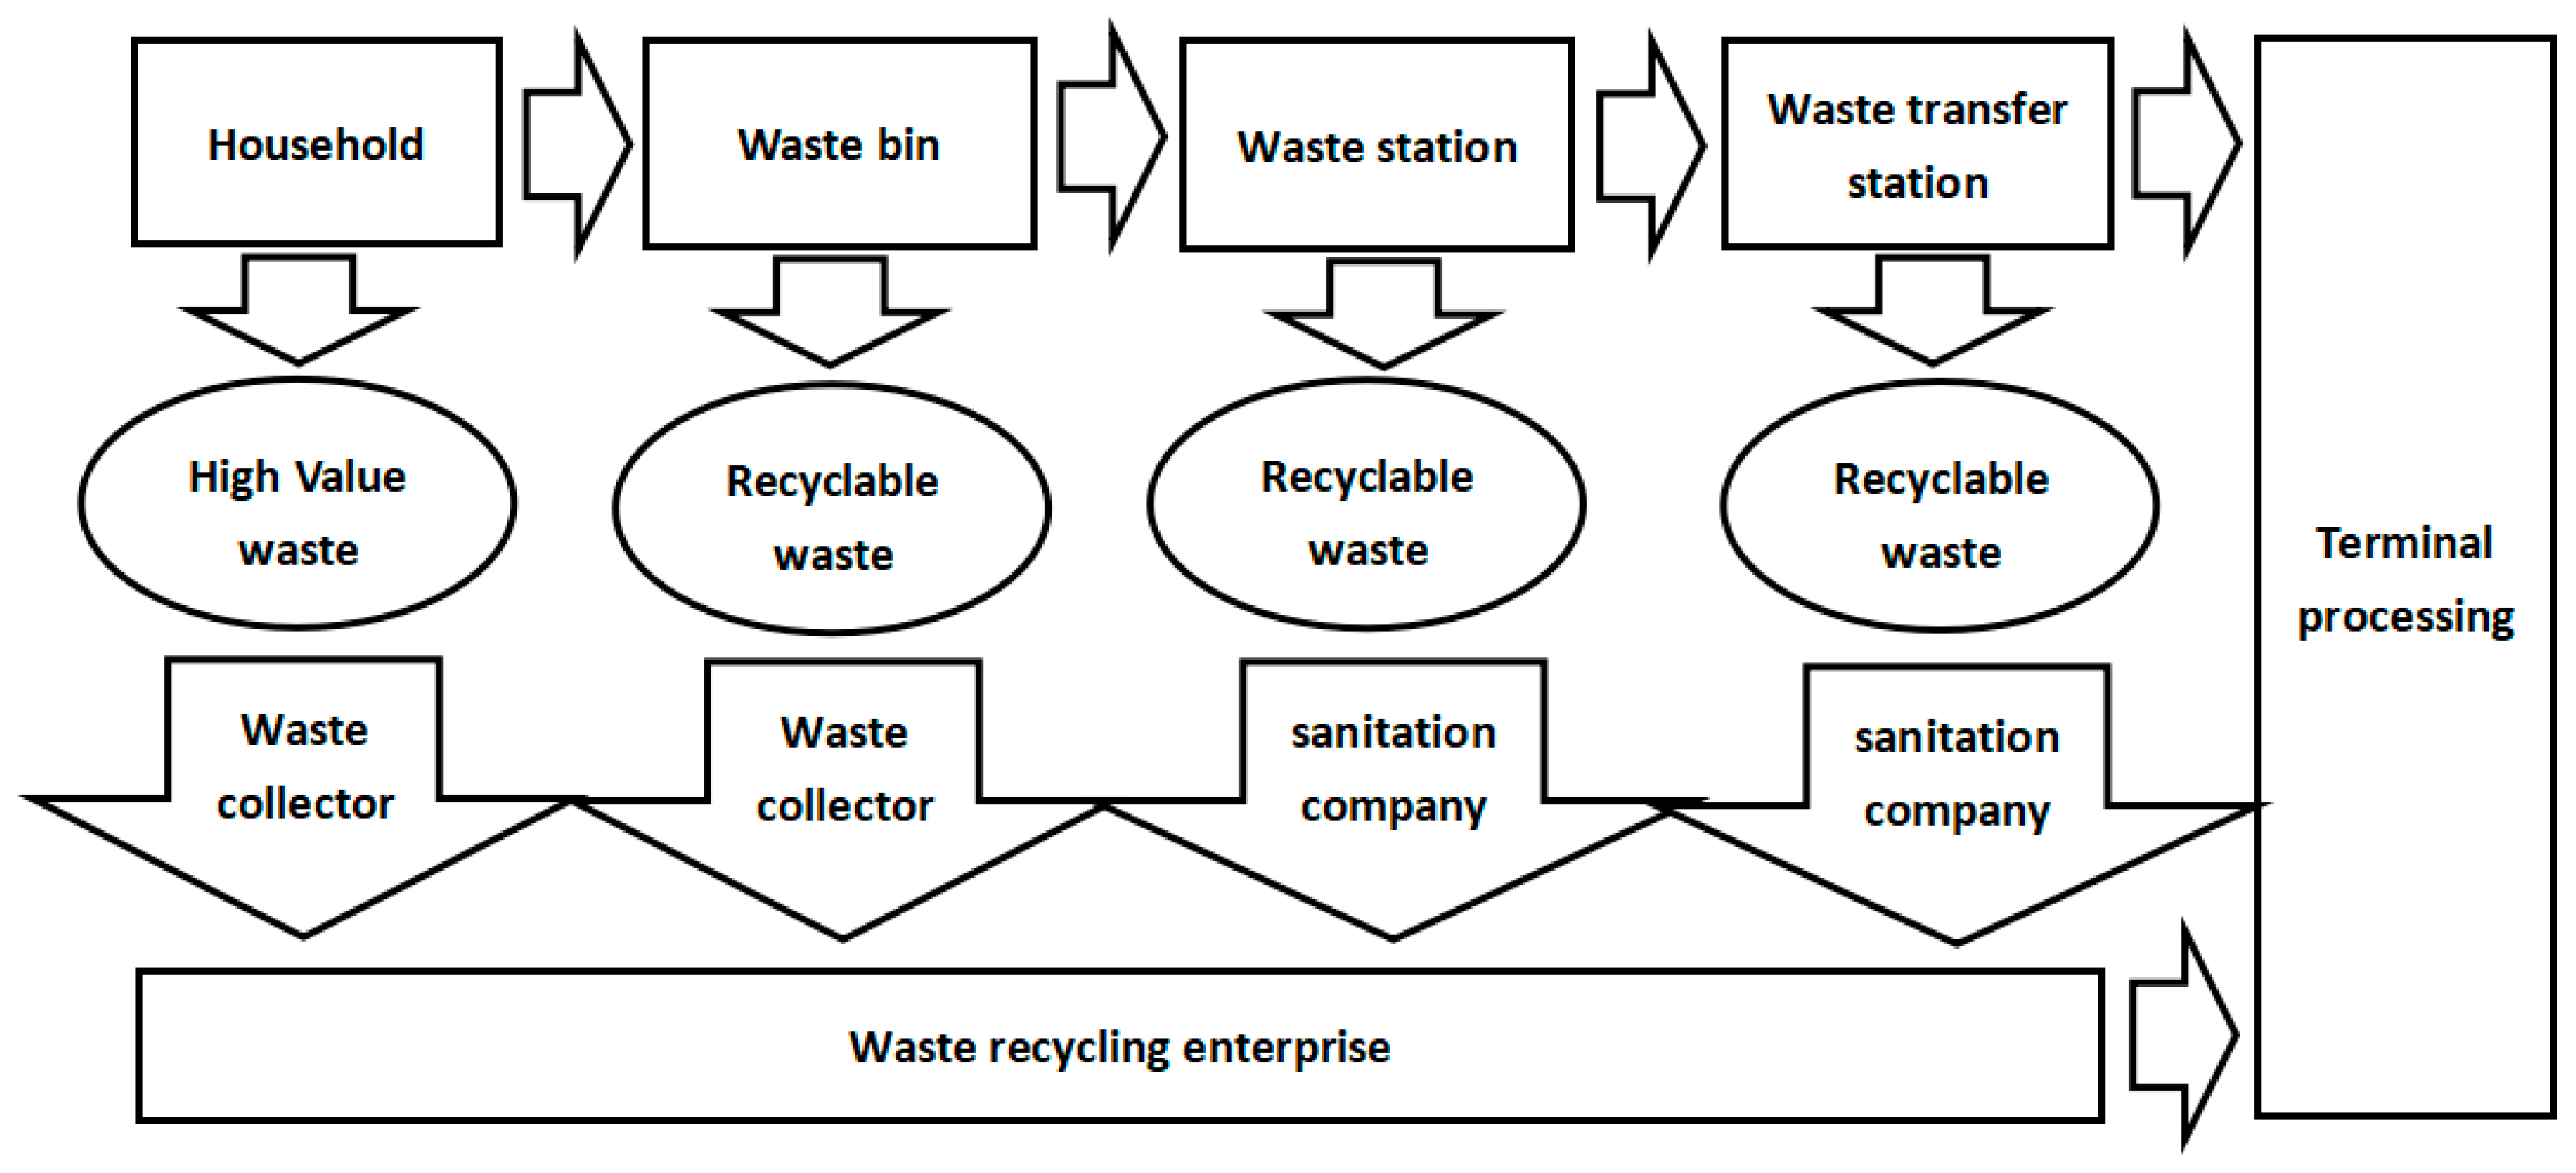
Figure 1. Scope definition of life cycle assessment of Beijing municipal solid waste treatment.
Sustainability 17 10265 g001
Figure 2. Municipal solid waste generation in Beijing over time (2004–2022).
Sustainability 17 10265 g002
Figure 3. Composition evolution of household solid waste in Beijing.
Sustainability 17 10265 g003
Figure 4. Changes in municipal solid waste treatment methods in Beijing.
Sustainability 17 10265 g004
Figure 5. Carbon emissions from various municipal solid waste treatment methods in Beijing.
Sustainability 17 10265 g005
Figure 6. Carbon emissions from various components of municipal solid waste in Beijing.
Sustainability 17 10265 g006
Table 1. Data quality assessment of Beijing municipal solid waste treatment life cycle Inventory.
Unit: %Completely RepresentativePartly RepresentativeNot Representative
Technique10000
Location8.3391.670
Time10000
Disclaimer/Publisher’s Note: The statements, opinions and data contained in all publications are solely those of the individual author(s) and contributor(s) and not of MDPI and/or the editor(s). MDPI and/or the editor(s) disclaim responsibility for any injury to people or property resulting from any ideas, methods, instructions or products referred to in the content.